A SYSTEMATIC INVESTIGATION INTO β-PHASE TI-ALLOYS ...
95
A SYSTEMATIC INVESTIGATION INTO β-PHASE TI-ALLOYS FOR BIOMEDICAL APPLICATIONS L Melmoth MPhil 2018
-
Upload
khangminh22 -
Category
Documents
-
view
4 -
download
0
Transcript of A SYSTEMATIC INVESTIGATION INTO β-PHASE TI-ALLOYS ...

A SYSTEMATIC INVESTIGATION INTO
β-PHASE TI-ALLOYS
FOR BIOMEDICAL APPLICATIONS
L Melmoth
MPhil 2018

A SYSTEMATIC INVESTIGATION INTO
β-PHASE TI-ALLOYS
FOR BIOMEDICAL APPLICATIONS
By
LUCIE MELMOTH
A THESIS SUBMITTED IN PARTIAL FULFILMENT OF THE REQUIREMENTS
OF MANCHESTER METROPOLITAN UNIVERSITY FOR THE DEGREE OF MASTER OF PHILOSOPHY
Faculty of Science and Engineering
School of Engineering
Manchester Metropolitan University
June, 2018
i
Acknowledgements
I would first like to acknowledge my Director of Studies, Dr Lisa Simmons and the
other members of my supervisory team, Prof Peter Kelly, Dr Marina Ratova and Dr
Araida Hidalgo-Bastida of the Faculty of Science and Engineering at Manchester
Metropolitan University. I am especially grateful for their constant guidance and
encouragement.
I would also like to thank Dr Gary Miller, Miss Hayley Andrews and all other
members of the technical support team at Manchester Metropolitan University, I
am gratefully indebted for their help and support throughout my degree.
Furthermore, I would like to thank all of the postgraduate research students at
Manchester Metropolitan University for their friendship and assistance. Special
acknowledgements to Claire Mur’Tala, Sam Capp and Elisa Serra for their valuable
support throughout my time at Manchester Metropolitan University.
Finally, I must express my very profound gratitude to my parents, Robin and Ann
Melmoth, and to my partner, Carl Mcgovern, for providing me with unfailing
support and continuous encouragement throughout my studies and through the
process of researching and writing this thesis. This accomplishment would not have
been possible without them.
Thank you.
ii
Abstract
Total hip replacement procedures are becoming increasingly common and often
necessary due to injury in young patients. The materials currently utilised have a
relatively short lifespan in comparison with the growing life expectancy of the
population; this inherently results in the requirement of revision surgery continuing
to rise. It is therefore imperative to develop a more suitable material, with greater
durability and biological tolerance to reduce the number of complex, disruptive,
and ultimately costly revision procedures.
Currently, Ti-6Al-4V monopolises the metallic implant market; it has more desirable
mechanical properties, including a relatively low elastic modulus (≈ 115GPa) and
superior specific strength when compared to the cobalt-chromium and stainless
steel alloys. However, in comparison to bone (≈ 30GPa) the elastic modulus is still
too high. This leads to the bone remodelling, as a result of a changing stress/strain
imposed, known as stress shielding; which could eventually lead to implant failure.
In addition, efforts must be made to eliminate elements that have been associated
with adverse reactions from the implant material. Recently, β-phase titanium alloys
have shown promise; they have lower elastic modulus, more comparable to that of
bone, than alloys in the α-β phase (such as Ti-6Al-4V) and the majority of alloying
elements (such as tantalum and niobium) are currently believed to be non-toxic and
highly biocompatible.
Ultimately, the chosen biomaterial and implant design should possess all of the
following attributes: excellent biocompatibility, high corrosion and wear resistance,
suitable mechanical properties and osseo-integration.
This thesis details a systematic approach, employed to develop and test a range of
binary, titanium alloys, with alloying elements, niobium and molybdenum. The
alloys were prepared via magnetron sputtering, before characterization and testing
using techniques such as: X-ray diffraction; scanning electron microscopy; and
energy dispersive X-ray spectroscopy. The alloys biocompatibility was also assessed
using human mesenchymal stem cells, with alamarBlue® assay and scanning
electron microscopy. The results obtained in this thesis using human mesenchymal

iii
stem cells, with alamarBlue® assay and scanning electron microscopy, suggested
very little or no toxicity in binary Ti-Mo alloys with Mo content less than 25 at% and
no toxicity in binary Ti-Nb alloys; therefore all the alloys investigated in this thesis
show promise for biomedical applications with the exception of Ti-50Mo. The
research completed in this thesis also suggests that this method of fabrication and
analysis is a time, and cost efficient method that gives an initial indication of the
most suitable alloy systems; it is important to note that the method proposed
would not be employed to manufacture any part of the hip implant, its sole use is at
the initial stage of alloy development.

iv
Contents
Acknowledgements ................................................................................................................... i
Abstract ..................................................................................................................................... ii
List of Tables ............................................................................................................................ vi
List of Figures .......................................................................................................................... vii
List of Abbreviations ................................................................................................................ ix
1. Introduction ...................................................................................................................... 1
1.1 Structure of the Hip Joint and Total Hip Replacement............................................. 3
1.1.1 The Human Hip Joint ........................................................................................ 3
1.1.2 Total Hip Replacement Geometry .................................................................... 3
1.1.3 Revision Surgery and its Causes ....................................................................... 4
1.2 Implant Design and Contributing Factors ................................................................. 5
1.2.1 Biocompatibility ................................................................................................ 5
1.2.1.1 Cell Culture ................................................................................................... 7
1.2.1.2 alamarBlue® assay ........................................................................................ 7
1.2.1.3 Other Biological Techniques ......................................................................... 8
1.2.1.4 NIH 3T3s ........................................................................................................ 8
1.2.1.5 Stem Cells and Human Mesenchymal Stem Cells ........................................ 9
1.2.2 Mechanical Properties .................................................................................... 10
1.2.3 Osseo-Integration ........................................................................................... 12
1.2.4 Implant Geometry and Shape......................................................................... 13
1.3 Titanium and its Alloys............................................................................................ 15
1.3.1 Alloying Elements ........................................................................................... 16
1.3.1.1 Niobium, Nb ................................................................................................ 17
1.3.1.2 Molybdenum, Mo ....................................................................................... 20
1.3.1.3 Tantalum, Ta ............................................................................................... 22
1.3.1.4 Zirconium, Zr ............................................................................................... 24
1.4 Research Aims and Objectives ................................................................................ 25
2. Vacuums and Magnetron Sputtering ............................................................................. 26
2.1 Vacuum Systems ..................................................................................................... 26
2.2 Magnetron Sputter Deposition System .................................................................. 26
3. Characterisation Techniques .......................................................................................... 32
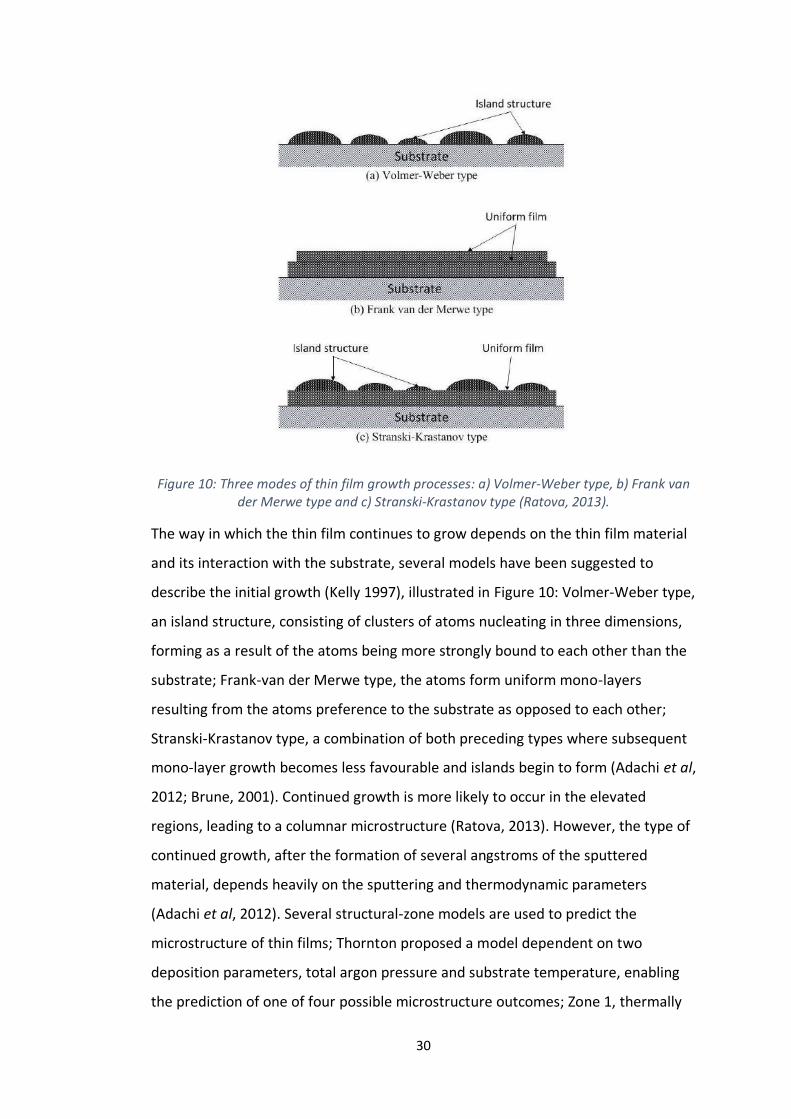
3.1 Scanning Electron Microscopy ................................................................................ 32
3.2 Energy Dispersive X-Ray Spectroscopy ................................................................... 33
v
3.3 X-Ray Diffraction ..................................................................................................... 33
3.3.1 Pawley Refinement ......................................................................................... 37
4. Fabrication and Analysis of Binary Ti-alloys ................................................................... 39
4.1 Alloy Preparation using Magnetron Sputtering...................................................... 39
4.2 Characterisation of Samples ................................................................................... 42
4.2.1 SEM ................................................................................................................. 42
4.2.1.1 Methodology .............................................................................................. 42
4.2.1.2 Results ......................................................................................................... 42
4.2.2 EDX .................................................................................................................. 45
4.2.2.1 Methodology .............................................................................................. 45
4.2.2.2 Results ......................................................................................................... 45
4.2.3 XRD.................................................................................................................. 46
4.2.3.1 Methodology .............................................................................................. 46
4.2.3.2 Results ......................................................................................................... 46
4.2.3.3 Pawley Refinement ..................................................................................... 46
4.3 Biocompatibility Studies ......................................................................................... 49
4.3.1 NIH 3T3s .......................................................................................................... 49
4.3.1.1 Culture of NIH 3T3s ..................................................................................... 49
4.3.1.2 alamarBlue® assay ...................................................................................... 49
4.3.1.3 Results ......................................................................................................... 50
4.3.1.4 Discussion ................................................................................................... 50
4.3.2 hMSCs ............................................................................................................. 51
4.3.2.1 Culture of hMSCs ........................................................................................ 51
4.3.2.2 alamarBlue® assay ...................................................................................... 51
4.3.2.3 Methodology for Statistical Analysis .......................................................... 51
4.3.2.4 SEM Sample Preparation ............................................................................ 52
4.3.2.5 Results ......................................................................................................... 52
4.4 Discussion ............................................................................................................... 57
5. Conclusion....................................................................................................................... 62
5.1 Future Work ............................................................................................................ 62
Appendix A .............................................................................................................................. 64
Appendix B .............................................................................................................................. 70
References .............................................................................................................................. 73

vi
List of Tables
Table 1: Alternative deposition techniques ........................................................................... 27
Table 2: Sample IDs, current supplied to the target, as a percentage, and the respective
values for atomic percent. ...................................................................................................... 41
Table 3: Surface area roughness values for the six binary Ti-alloys. ...................................... 43
Table 4: Film thickness determined using SEM. ..................................................................... 44
Table 5: EDX quantitative results............................................................................................ 45
Table 6: Unit cell parameter results for the Pawley refinement of six binary Ti-alloys. Errors
shown in parenthesis. ............................................................................................................. 47

vii
List of Figures
Figure 1: A range of hip prosthesis, comprising of different materials and designs (Gavrilov,
no date)..................................................................................................................................... 1
Figure 2: Anatomy of the human hip joint (Q. Chen and Thouas, 2015) ................................. 3
Figure 3: Schematic diagram of artificial hip joint (Liu et al., 2004) ......................................... 4
Figure 4: Stress–strain curve for Ti6Al4V at room temperature. Adapted from Anjum et al
(Anjum et al., 2015) ................................................................................................................ 11
Figure 5: Nb-Ti binary alloy phase diagram (Murray, 1987)................................................... 17
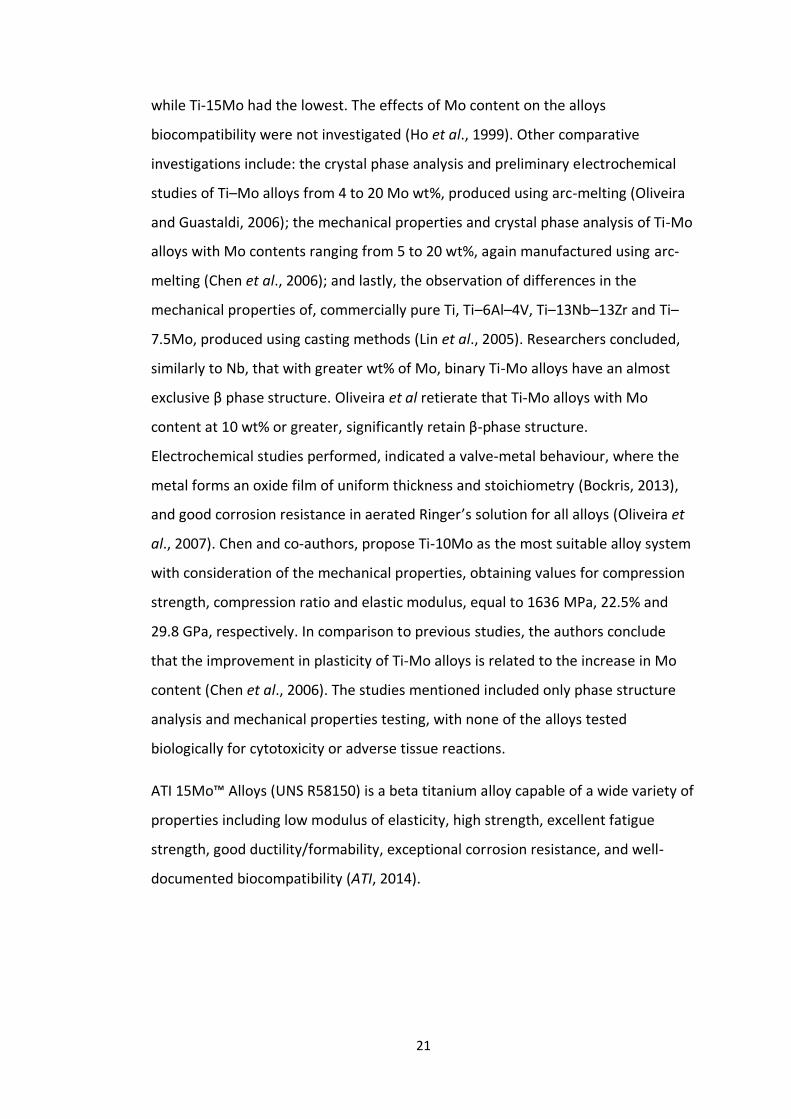
Figure 6: Mo-Ti binary alloy phase diagram (Murray, 1987). ................................................. 20
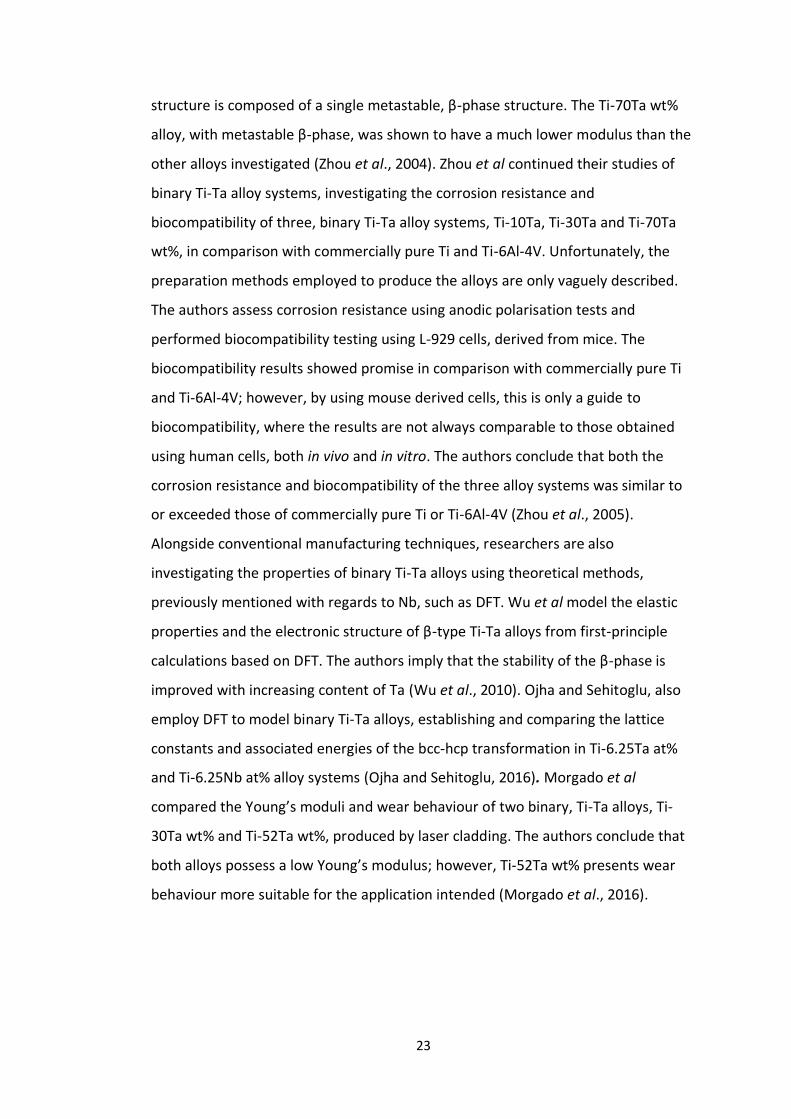
Figure 7: Ta-Ti binary alloy phase diagram (Murray, 1987). .................................................. 22
Figure 8: Ti-Zr binary alloy phase diagram (Murray, 1987). ................................................... 24
Figure 9: Schematic image of three different planar magnetron configurations with the
magnetic field lines indicated. a) balanced magnetron, b) unbalanced type I, and c)
unbalanced type II. ................................................................................................................. 28
Figure 10: Three modes of thin film growth processes: a) Volmer-Weber type, b) Frank van
der Merwe type and c) Stranski-Krastanov type (Ratova, 2013). .......................................... 30
Figure 11: Schematic illustration of SEM. ............................................................................... 32
Figure 12: Schematic illustrating the area from which characteristic X-rays emanate.
(Hafner, no date) .................................................................................................................... 33
Figure 13: Schematic of XRD apparatus (PANalytical, 2014). ................................................. 35
Figure 14: Schematic illustration of Bragg’s reflection........................................................... 36
Figure 15: Illustration of the relationship of a unit cell to the entire crystal lattice. Credit:
CK-12 Foundation - Christopher Auyeung; License: CC BY-NC 3.0. ........................................ 37
Figure 16: Photograph of the Large Area Rig at Manchester Metropolitan University. ........ 40
Figure 17: Photographs of the various substrates, attached to the substrate holder using
kapton tape, before (left) and after (right) deposition. ......................................................... 40
Figure 18: SEM micrographs of Ti-50Nb, Ti-25Nb, Ti-15Nb, Ti-50Mo, Ti-25Mo and Ti-15Mo
................................................................................................................................................ 42
Figure 19: SEM micrographs of fractured Ti-50Nb, Ti-25Nb, Ti-15Nb, Ti-50Mo, Ti-25Mo and
Ti-15Mo ................................................................................................................................... 43
Figure 20: Diffraction patterns of binary Ti-alloys. ................................................................. 46
Figure 21: Results obtained using alamarBlue® assay estimating the number of viable 3T3
cells on two binary Ti-alloy systems and a media control; readings were taken after
24hours. Data from one replicate. ......................................................................................... 50
Figure 22: Results obtained using alamarBlue® assay estimating the number of viable
hMSCs on six binary Ti-alloy systems and a media control; readings were taken at three
time points. a) Results displayed to enable the comparison of the six binary Ti-alloy
systems, b) Results displayed to enable the comparison of the three time points. Data from
three replicates. ...................................................................................................................... 53
Figure 23: SEM micrographs of hMSCs on Ti-50Nb and Ti-50Mo after 1, 3 and 7 days of
growth..................................................................................................................................... 54
Figure 24: SEM micrographs of hMSCs on Ti-25Nb and Ti-25Mo after 1 and 3 days of
growth..................................................................................................................................... 55
viii
Figure 25: SEM micrographs of hMSCs on Ti-15Nb and Ti-15Mo after 1, 3 and 7 days of
growth..................................................................................................................................... 55
Figure 26: High-magnification SEM micrographs of hMSCs on various Ti-alloys. a) hMSC
mitosis on Ti-25Nb, b) morphology of a single cell on Ti-15Mo, c) nucleus of a hMSC on Ti-
15Nb and d) early stages of apoptosis of a hMSC on Ti-15Nb. .............................................. 56
Figure 27: Observed and calculated profiles for the Pawley refinement of Ti-50Nb.The final
agreement factors were Rp = 5.712%, Rwp = 7.565% and χ2 = 2.233. The second graph is
the difference plot. ................................................................................................................. 64
Figure 28: Observed and calculated profiles for the Pawley refinement of Ti-25Nb.The final
agreement factors were Rp = 7.463%, Rwp = 7.757% and χ2 = 1.099. The second graph is the
difference plot. ....................................................................................................................... 65
Figure 29: Observed and calculated profiles for the Pawley refinement of Ti-15Nb.The final
agreement factors were Rp = 7.305%, Rwp = 8.081% and χ2 = 0.940. The second graph is the
difference plot. ....................................................................................................................... 66
Figure 30: Observed and calculated profiles for the Pawley refinement of Ti-50Mo.The final
agreement factors were Rp = 7.079%, Rwp = 9.159% and χ2 = 2.597. The second graph is the
difference plot. ....................................................................................................................... 67
Figure 31: Observed and calculated profiles for the Pawley refinement of Ti-25Mo.The final
agreement factors were Rp = 7.566%, Rwp = 8.808% and χ2 = 1.260. The second graph is the
difference plot. ....................................................................................................................... 68
Figure 32: Observed and calculated profiles for the Pawley refinement of Ti-15Mo.The final
agreement factors were Rp = 8.151%, Rwp = 9.316% and χ2 = 0.990. The second graph is the
difference plot. ....................................................................................................................... 69
Figure 33: Schematic of the four stages of a Rotary Vane Pump (Egerton, 2005) ................. 70
Figure 34: Schematic of a Diffusion Pump.............................................................................. 71
ix
List of Abbreviations
AC Alternating Current
bcc Body-Centered Cubic
CVD Chemical Vapor Deposition
DC Direct Current
DFT Density Functional Theory
DMEM Dulbecco’s Modified Eagle’s Medium
EDX Energy Dispersive X-Ray Spectroscopy
GOF Goodness of Fit
HAp Hydroxyapatite
hcp Hexagonal Close Packed
hMSC Human Mesenchymal Stem Cell
MSCBM Mesenchymal Stem Cell Basal Medium
PBS Phosphate Buffered Saline
PVD Physical Vapor Deposition
QCM-D Quartz Crystal Microbalance with Dissipation Technique
SEM Scanning Electron Microscopy
SLM Selective Laser Melting
THA Total Hip Arthroplasty
XPS X-Ray Photoelectron Spectroscopy
XRD X-Ray Diffraction

1
1. Introduction
Total hip replacement procedures are essential to reduce pain and increase
mobility in patients with conditions such as osteoarthritis, rheumatoid arthritis,
post-traumatic arthritis, and childhood hip disease. Furthermore, owing to the
populations increasing lifespan, the necessity for total hip replacement procedures
is growing and resulting from the prosthesis’ relatively short lifespan, on average
about 15 years, the demand for revision surgery is also rising. The current market
growth rate for reconstruction of failed hard tissue remains at around 25%, with 70-
80% of biomedical implants being made of metallic materials and the remainder
comprising of predominantly ceramic and polymeric materials (Li et al., 2014).
Figure 1: A range of hip prosthesis, comprising of different materials and designs (Gavrilov, no date).
Metallic implants are largely made from one of the following: stainless steels;
titanium and its alloy; or cobalt-chromium alloys. Titanium, Ti, has a number of
desirable qualities such as high corrosion resistance, adequate mechanical
properties, and excellent biocompatibility. These attributes can be further
enhanced by the act of alloying Ti with various elements. Currently, Ti-6Al-4V
monopolises the metallic implant market; however, it’s relatively high Young’s
modulus, ≈ 115 GPa, in comparison with cortical bone, ≈ 30 GPa (Kopova et al.,
2016), results in a mismatch in elasticity at the bone-metal interface; frequently

2
causing an effect known as stress shielding. Stress shielding is a phenomenon that
causes reabsorption of the natural bone, due to the difference in stiffness between
the implant material and natural bone, leading to the implant loosening (Rack and
Qazi, 2006). The longevity of metallic prosthesis, in the body’s environment, is
affected considerably by the likelihood that the material will corrode and wear. The
human body is a hostile environment and can therefore lead to the corrosion of
metals, releasing metal debris, and consequently a biological response (Asri, 2017).
Metal wear, of greatest significance with metal-on-metal implants, causes the
release of debris and non-compatible metallic ions into the body, generating
consequences such as: allergic and toxic reactions; inflammation; pain; implant
loosening; and may ultimately lead to implant failure (Long and Rack, 1998). It has
been established that metal debris and metallic ions can have an impact, both
locally and systemically, within the body (Hallab and Jacobs, 2017). Efforts have
since been made to reduce the toxicity of Ti-alloys, through the trailing of
alternative alloying elements, for example, vanadium, V, was replaced with
niobium, Nb, and iron, Fe, generating Ti-6Al-7Nb and Ti-5Al-2.5Fe (Semlitsch, 1987).
Whilst these alloys have an improved biocompatibility, their Young’s modulus,
equal to 105 GPa and 110 GPa, respectively, was still relatively high in comparison
to bone, around 30 GPa, although slightly more preferable to Ti-6Al-4V. As
discussed in section 1.2.2, a relatively high Young’s modulus leads to the stress
shielding effect (Long and Rack, 1998). More recently, β-type Ti-alloys appear to
have more promising properties than their predecessors, with some researchers
suggesting Young’s modulus values as low as 35 GPa, similar to that of bone. (Li et
al., 2014). A considerable effort has been focused on reducing the stiffness of the
materials used and consequently the stress shielding effect; concurrently, some
researchers have concentrated on other aspects of the implant such as geometry,
shape, porosity, and coatings of the femoral stem to resolve the inherent problems,
whilst being cautious not to create others (Geetha et al., 2009).
This review will investigate the associated clinical problems that lead to revision
surgery of a total hip replacement before summarizing the ongoing research to
overcome these obstacles. The review will cover: the biological and mechanical
3
properties of the materials currently used; implant design and shape; and a detailed
look at the alloys and alloying elements used, particularly Ti and its alloys.
1.1 Structure of the Hip Joint and Total Hip Replacement
1.1.1 The Human Hip Joint
In human anatomy, the hip joint is the largest weight bearing joint, consisting of a
synovial ball and socket arrangement (Arthritis Research UK, 2011). The rounded
head of the femur joins to the acetabulum of the pelvis. Articular cartilage covers
both the acetabulum and the head of the femur; the cartilage is thicker at places
more susceptible to load. The primary function of the hip joint is to load bear; as a
result, the joint incorporates several factors to increase stability. The head of the
femur is almost entirely encompassed by the deep structure of the acetabulum,
primarily to reduce dislocation. An increased depth of the acetabulum, due to a
fibrocartilaginous collar, named the acetabular labrum, further improves the
stability. Surrounding ligaments also contribute, creating a strong, thickened joint
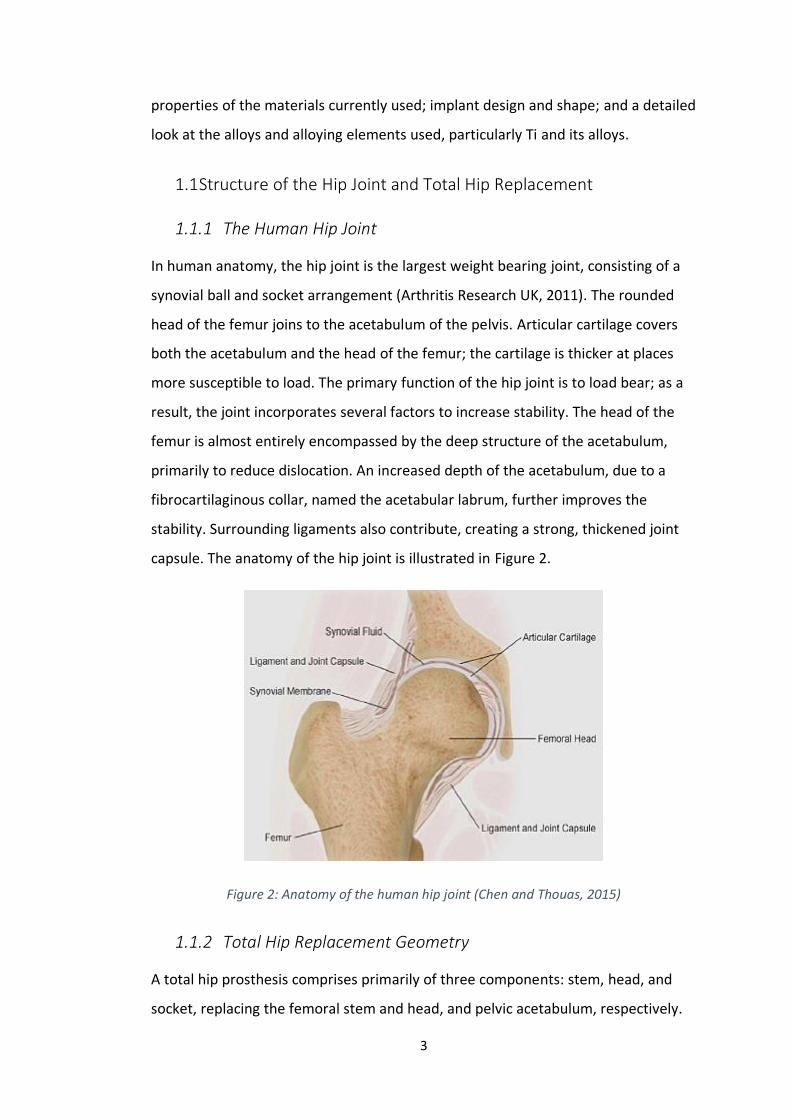
capsule. The anatomy of the hip joint is illustrated in Figure 2.
Figure 2: Anatomy of the human hip joint (Chen and Thouas, 2015)
1.1.2 Total Hip Replacement Geometry
A total hip prosthesis comprises primarily of three components: stem, head, and
socket, replacing the femoral stem and head, and pelvic acetabulum, respectively.

4
Various combinations of materials are used for the different components, including,
metallic alloys (head, stem and socket), polyethylene (lining of the socket) and
ceramics (head and socket) (Chen and Thouas, 2015); a possible arrangement is
depicted in Figure 3.
Figure 3: Schematic diagram of artificial hip joint (Liu et al., 2004)
1.1.3 Revision Surgery and its Causes
Total hip replacement procedures are becoming increasingly common, mainly due
to conditions such as osteoarthritis and osteoporosis, but also as a result of trauma
(Bourn, 2003). According to the National Joint Registry, the NHS performed 87,773
hip procedures in 2016 (14th Annual Report, 2017). In the first instance, a primary
total hip replacement procedure is performed, where the arthritic or damaged joint
is replaced with an artificial implant. However, over time the implant can fail,
introducing the necessity for further procedures, commonly referred to as revision
procedures or revision surgery (Arthritis Research UK, 2011). The clinical indications
that contribute to implant failure and subsequent revision surgery include: aseptic
loosening, the failure of a bond forming between the implant and natural bone,
either initially or over time and without infection; pain, although sometimes a sole
factor pain usually occurs alongside another indication; lysis, the loss of bone;
adverse reactions to particulate debris, with metal-on-metal bearings having the
highest incidence; and infection. Between 2009 and 2015, of the 57,162 single-
stage revision procedures performed, 46% were attributed to aseptic loosening,

5
22% to pain, 14% to lysis, 12% to adverse soft tissue reactions to particulate debris,
and 4% to infection (13th Annual Report, 2016). Unfortunately, the success rate of
revision surgery is relatively low (Bozic et al, 2015; Geetha et al., 2009).
The National Joint Registry’s 14th Annual Report states that, from the 890,681
recorded hip replacements over 13 years, the probability of revision after a primary
hip replacement is 6.8% at 13 years, across all patients. The probability of revision
increases for patients aged less than 55 years at the time of implantation, for
female patients the probability is 13.5% at 13 years, and for male patients the
probability is 10% at 13 years. Very low revision rates are seen for patients over the
age of 75 at the time of implantation; their hip implant remaining unrevised across
their remaining lifetime (14th Annual Report, 2017). There are several factors
contributing to the rising number of primary and revision hip replacement
procedures, these include the increasing longevity of the population and the
lifespan of the materials used. Revision and re-revision surgery is particularly
complex due to complications encountered during removal alongside the initial
requirement for revision.
1.2 Implant Design and Contributing Factors
This section will focus on the properties an implant must possess to succeed within
its role; alongside reviewing the variety of ways that researchers and clinicians have
developed new ideas, techniques and materials.
1.2.1 Biocompatibility
Biocompatibility was first defined as a non-living material’s compatibility with the
body, thus causing no unnecessary harm to the patient (Long and Rack, 1998);
granting this continues to be the primary definition, it is now apparent that not only
should the material reside harmoniously in the body, it should also be appropriate
for the application intended (Park and Lakes, 2010; Williams, 2008).
Hip prosthesis, like any foreign object in the body, may stimulate an auto-immune
response, reducing the likelihood of the implants success (Ridzwan et al., 2007).
Correspondingly, to excel in its role, an implant material must cooperate fully with
6
the human body’s normal functions, without causing any inflammatory or allergic
reactions. There is continuing clinical concern regarding the release of chemically
active metal ions, which bind to proteins and remain in a solution form and then
disseminate systemically into surrounding tissues, bloodstream, and remote organs.
Some historical research has suggested that V causes adverse tissue reactions and
aluminium, Al, has been associated with potential neurological disorders (Bondy,
2010; Crapper McLachlan, 1989; Silva et al., 2004). However, the quantity of
metallic ions released from a hip implant may depend upon factors such as, alloy
composition, design and production techniques, the individual’s lifespan, usage,
and specific loading. Hallab and Jacobs state the relevance of the quantity of
metallic ions with regards to toxicity and its effect on the body. They suggest that
the levels of metals released from implant degradation are unlikely to be
excessively high and that the association of metal release from orthopaedic
implants with any associated toxicity is conjectural since cause and effect have not
been established, yet (Hallab and Jacobs, 2017).
Researchers have speculated that a variety of elements, such as Ti, zirconium, Zr,
tantalum, Ta, platinum, Pt, Nb, silver, Ag, gold, Au, molybdenum, Mo, Al, and Fe are
biocompatible, produce no adverse tissue reactions, and are not cytotoxic (Geetha
et al., 2001; Liang et al., 2016). Although the results found in these studies may
support the evidence of a biocompatible nature of such elements, it should not be
hypothesised that the same result would be observed for all variables. Li et al
compared the cytotoxicity of several elements using a human osteosarcoma cell
line, SaOS2, and found some contrasting results when comparing bulk and powder
forms of the same element. Other variables including: the environment, be it
temperature, pH level, oxygen level or surrounding fluid; the type of molecule; and
the length of exposure time, may also have a bearing on cytotoxicity and
biocompatibility (Sullivan et al, 2006). In conclusion, predicting how a specific alloy
composition will behave within its role as a hip implant, based on its elemental
components, is challenging without extensive in vivo testing. At present, initial in
vitro testing of implant materials is the most reliable method of reducing the
likelihood of an implant material causing a reaction within the human body.
7
Researchers use many different cell lines, dependent on the position and desired
use of the implant, to perform this testing. The following sub-sections detail cell
culture techniques, the assays used, and some common cell lines.
1.2.1.1 Cell Culture
Cell culture, or tissue culture, is the technique of growing cells outside of the body.
The cells, placed either in tubes, dishes or flasks, spontaneously proliferate in the
presence of artificial media, containing the necessary nutrients, and desirable
conditions, such as 37°C and 5% carbon dioxide, to form a monolayer or
suspension. Depending on the cell type, the ideal surface coverage is said to be 80-
90% confluence. Once at 100% confluence, contact inhibition alters the cells gene
expression, cell shape, activity, and cell surface markers (Harrison and Rae, 1997).
At this stage, the cells are subcultured by transferring them to a new vessel, or
passaged by liberation, using an enzyme, trypsin-EDTA, enabling their continued
growth and encouraging larger cell numbers. Unfortunately, amid cell culture there
is a risk of genetic or epigenetic alteration; if the mutation grants the cell a small
advantage in growth rate there is a possibility the abnormal, culture-adapted cell,
could overgrow the rest of the culture and as a consequence, represents the culture
en masse. This inevitably produces cells with different properties to those found in
vivo, described as artefacts of cell culture (Slack, 2012). As a result of this
phenomenon, the number of passages should be kept to a minimum to ensure
reliable experimental results.
1.2.1.2 alamarBlue® assay
alamarBlue® is the trademark name for resazurin, used for the analysis of cell
proliferation and viability. Cell viability refers to the measure of cells that are living
and capable of developing and reproducing, thus making them suitable for use in
experiments. The technique consists of exposing cells to the weakly fluorescent
blue dye, resazurin. Upon entering the viable cells, the non-toxic, permeable dye is
continuously reduced to resorufin (pink in colour and highly fluorescent). The
evident change in colour is easily measurable by colourimetric or fluorometric
8
reading, generating a quantitative measure of proliferation and viability (Al-Nasiry
et al., 2007), that is directly proportional to cell number.
1.2.1.3 Other Biological Techniques
The formation of bone comprises a complex set of events, beginning with the
recruitment and proliferation of osteoprogenitors, a cell type with the capacity to
form bone, followed by cell differentiation, osteoid formation and finally
mineralisation (Ogura et al., 2004). When human mesenchymal stem cells, hMSCs,
are cultured in vitro, using osteogenic media, culture media such as DMEM or
MSCBM supplemented with 10% fetal bovine serum, 1% penicillin/streptomycin,
200 µM ascorbic acid, and 0.1 µM dexamethasone, and 10 mM b-
glycerophosphate, the described stages usually occur within 28days (Li et al., 2017).
Alizarin Red S Staining assay can be used to quantify the extent of osteogenic
differentiation, through the bonding of Alizarin Red S and calcium, deposited during
mineralisation, producing a bright red stain (Birmingham et al., 2012).
1.2.1.4 NIH 3T3s
In the early 1960’s, Howard Green and George Todaro isolated, from a mouse
embryo, fibroblast cells. The cells grown in Petri dishes were passaged every three
days irrespective of confluence. Green and Todaro named the series of cells as a
reference to this rigorous three day strategy, 3T3, 3T6 and 3T12, where ‘3T’ stood
for the three day transfer and the final digit described the number of cells plated to
the nearest one hundred thousand. The 3T3 cells displayed an established cell line,
proliferating in a single monolayer, whilst never reaching confluence. The cells
plated as 3T6 and 3T12 proliferated unpredictably with a visual resemblance to
tumours (Todaro and Green, 1963).
More recently, for biomaterial research purposes, NIH 3T3 cells have been
predominantly used to assess cell adhesion. Other testing such as cytotoxicity and
adverse tissue reactions would not provide valid data for the application of
biomaterials in humans. Giannini et al utilised NIH 3T3 cell’s fibroblast nature, to
investigate a material’s potential to reduce cell adhesion and proliferation of
specific cell types. The aim of the study was to overcome or delay the
9
uncontrollable proliferation of fibroblast cells, due to evidence that this behaviour
causes a fibrous encapsulation of the implant, ultimately leading to implant failure
(Giannini et al., 2014). Lord et al also employed NIH 3T3 cells for cell adhesion
purposes, to investigate the potential of the quartz crystal microbalance with
dissipation technique, QCM-D, to identify the spreading and initial adhesion of cells
in contact with biocompatible surfaces pre-coated with proteins (Lord et al., 2006).
1.2.1.5 Stem Cells and Human Mesenchymal Stem Cells
Stem cells form the foundation of every organ and tissue in the body. They have
two distinguishing features in comparison to other cell types; the capability to self-
renew, producing more cells like them, and the ability to differentiate toward two
or more mature cell types, defined as multipotent (Karp, 2014). Multipotent cells,
such as hMSCs, are a limited type of pluripotent cell (Zhang et al., 2011), where
pluripotent cells have the capacity to form any of the cell types found in the normal
body (Slack, 2012).
Isolation of stem cells is possible from tissues that differ in both development, i.e.
fetal or adult, and in anatomy. hMSCs, are a form of adult stem cell; predominantly
isolated from bone marrow, whilst also found in other tissues including adipose,
amniotic fluid and membrane, peripheral blood, and skeletal muscle (Ullah et al.,
2015); they have applications in tissue engineering and regenerative medicine
(Quiroz et al., 2008). Bone marrow-derived hMSCs, accepted as the standard for
comparison with hMSCs taken from other sources, require an invasive procedure
for isolation (Zhang et al., 2011). Studies have shown that cell culture duration and
an increasing number of passages impacts on hMSC morphology, viability and their
ability to differentiate declines as the cells begin to senesce (Eggenhofer et al.,
2014; X. Wei et al., 2013). Sawyer et al utilised hMSC’s capacity to differentiate into
osteoblasts to mimic the in vivo environment, stimulating a specific cellular
response such as bone regeneration (Sawyer et al., 2007).
10
1.2.2 Mechanical Properties
The mechanical properties of most importance are an adequate mechanical
strength, needed to tolerate the mechanical loading caused by the human body,
and a suitable Young’s modulus, needed to reduce the phenomenon known as
stress shielding (Lopes et al., 2015). As the name suggests, stress shielding is the
shielding of the bone from the load by the implant material, caused by the
difference in mechanical properties resulting in a lack of even distribution of force.
Bone has a natural ability to develop a structure most suited to accommodate the
forces acting upon it. According to Wolff’s Law, areas of bone experiencing
decreased levels of load or stress will respond by decreasing bone mass; bone will
remodel with the changing stress or strain imposed on it (Wang, 2003). This
observation is known as bone reabsorption (Park and Lakes, 2010). Yan et al
showed a correlation between bone loss around the implant and the value of the
Young’s modulus of the implant (Yan et al., 2011). The more similar the elastic
properties of the implant material to bone, the more evenly distributed throughout
the new assembly the loads applied would be. The even distribution of the loads
applied means the bone would be subjected to stresses within normal levels,
encouraging the bone to behave more normally and decreasing the occurrence of
bone reabsorption and ultimately the stress shielding effect.
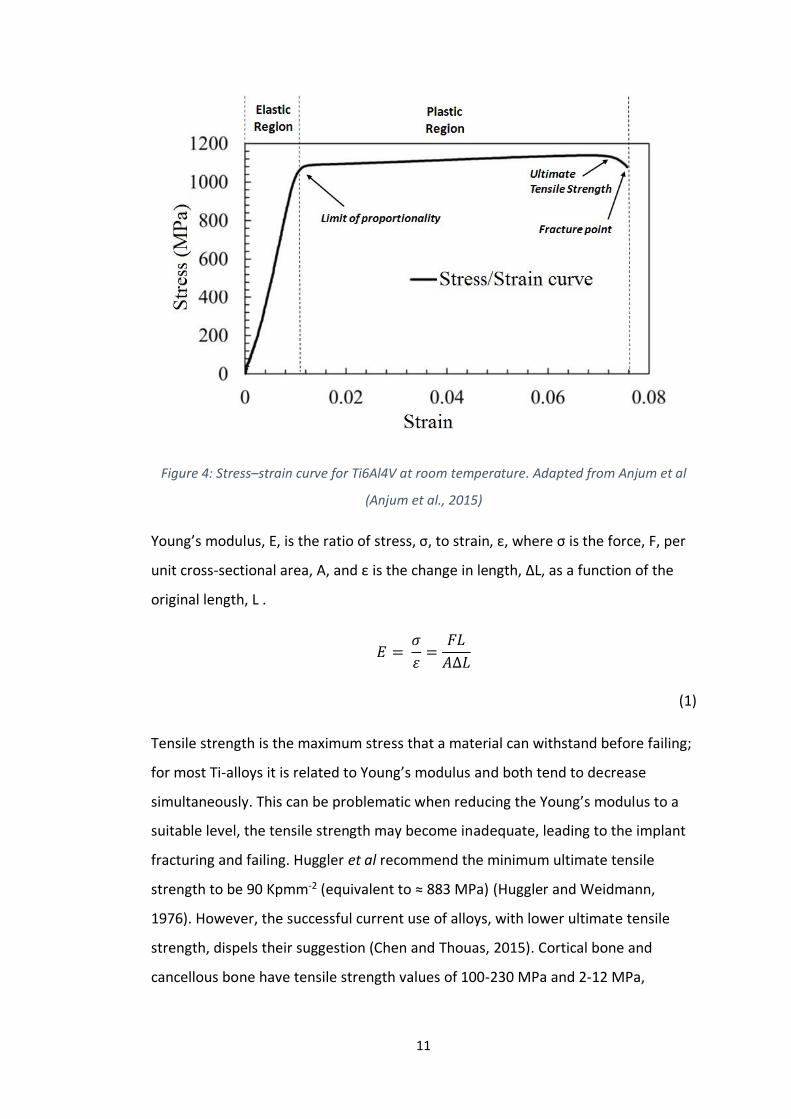
The Young’s modulus of a material is a measure of the materials stiffness within the
elastic region of deformation. A stress-strain curve for Ti-6Al-4V at room
temperature is depicted in Figure 4; the significant change in the graphs curve
illustrates the limit of proportionality, at which point the material undergoes
permanent deformation.
11
Figure 4: Stress–strain curve for Ti6Al4V at room temperature. Adapted from Anjum et al
(Anjum et al., 2015)
Young’s modulus, E, is the ratio of stress, σ, to strain, ε, where σ is the force, F, per
unit cross-sectional area, A, and ε is the change in length, ΔL, as a function of the
original length, L .
𝐸 = 𝜎
𝜀=
𝐹𝐿
𝐴∆𝐿
(1)
Tensile strength is the maximum stress that a material can withstand before failing;
for most Ti-alloys it is related to Young’s modulus and both tend to decrease
simultaneously. This can be problematic when reducing the Young’s modulus to a
suitable level, the tensile strength may become inadequate, leading to the implant
fracturing and failing. Huggler et al recommend the minimum ultimate tensile
strength to be 90 Kpmm-2 (equivalent to ≈ 883 MPa) (Huggler and Weidmann,
1976). However, the successful current use of alloys, with lower ultimate tensile
strength, dispels their suggestion (Chen and Thouas, 2015). Cortical bone and
cancellous bone have tensile strength values of 100-230 MPa and 2-12 MPa,
12
respectively, in contrast to the alloy, Ti-6Al-4V, which has a relatively high tensile
strength of 860 MPa (Hermawan et al., 2011; Kokubo et al., 2003).
Design and development of implant materials must also take into consideration
fatigue strength, where initially sheer stress causes the nucleation of a micro-slip
within a grain. This occurrence is commonly irreversible due to the formation of an
initial micro-crack which inherently oxidises; under further repeated tensile loading
the micro-crack grows to a critical size crack; the problem is no longer a surface
phenomenon. Once the crack is of the macro scale it grows rapidly, finally resulting
in complete failure. Surface imperfections, corrosion, and wear all increase the
likelihood of a slip nucleating. α-β Ti-alloys have higher fatigue strength than 316L
stainless steels, and comparable fatigue strength to cobalt-chromium alloys.
However, the uniformity within the micro-structure of β Ti-alloys results in less
satisfactory fatigue strength when comparing to α-β Ti-alloys; Chen et al discuss
possible solutions (Chen and Thouas, 2015). Ti-alloy phases will be further discussed
in section 1.3. Ti’s lower modulus and superior specific strength (strength/density)
when compared to stainless steels and cobalt-chromium alloys has presented it as a
suitable base for an alloy system to be developed.
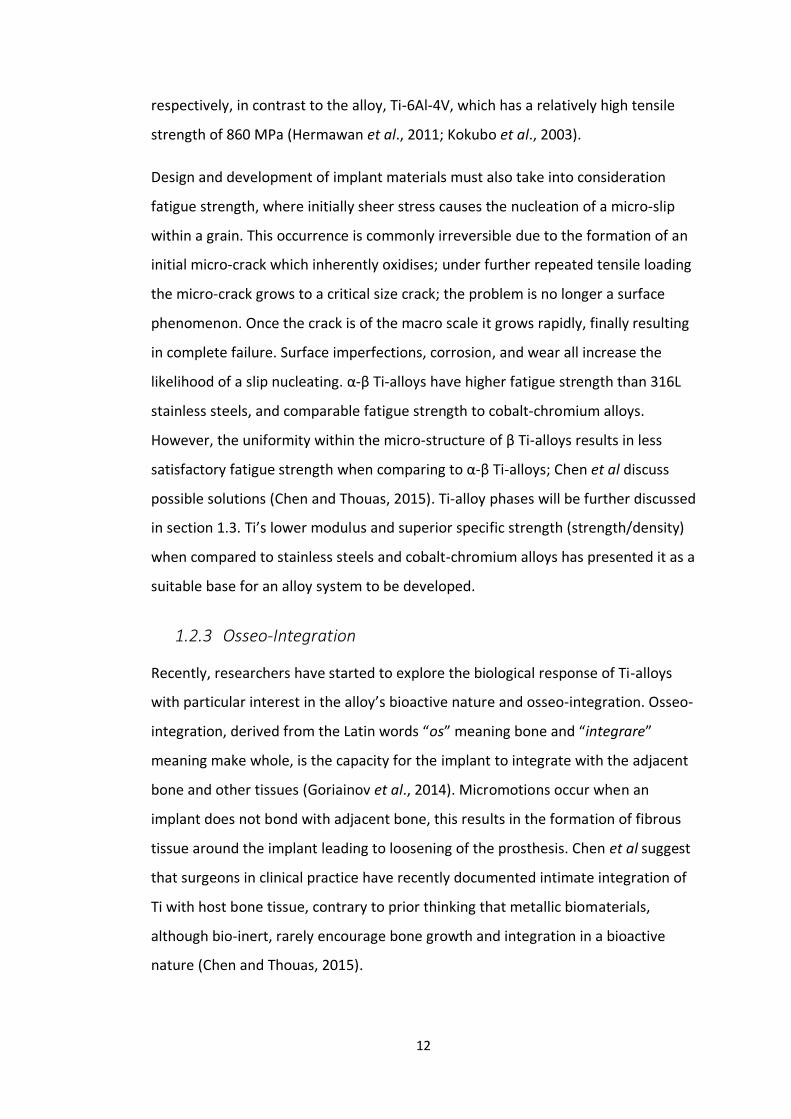
1.2.3 Osseo-Integration
Recently, researchers have started to explore the biological response of Ti-alloys
with particular interest in the alloy’s bioactive nature and osseo-integration. Osseo-
integration, derived from the Latin words “os” meaning bone and “integrare”
meaning make whole, is the capacity for the implant to integrate with the adjacent
bone and other tissues (Goriainov et al., 2014). Micromotions occur when an
implant does not bond with adjacent bone, this results in the formation of fibrous
tissue around the implant leading to loosening of the prosthesis. Chen et al suggest
that surgeons in clinical practice have recently documented intimate integration of
Ti with host bone tissue, contrary to prior thinking that metallic biomaterials,
although bio-inert, rarely encourage bone growth and integration in a bioactive
nature (Chen and Thouas, 2015).
13
Chen et al also suggests that without prior coating, a carbonated hydroxyapatite
layer forms on the surface, before the collagen fibres of the host bone adhere to
the carbonated apatite layer (Chen and Thouas, 2015). Researchers have attempted
to accelerate this process by the adoption of various surface treatments and
coatings, such as hydroxyapatite, employed to improve the alloys ability to form a
strong bond with the living bone (Satoh et al., 2013). Hydroxyapatite, a calcium
phosphate, with chemical formula [Ca10(PO4)6(OH)2, HAp] (Oliveira et al., 2016;
Heimann, 2006), belongs to the mineral family known as biological apatites. It
naturally occurs as the predominant inorganic component in mammalian teeth and
bones (Wei et al., 2016). HAp has a bioactive nature, as a direct result of its
chemical composition, containing ions commonly found in the physiological
environment (such as Ca2+, K+, Mg2+, Na+, etc.) (Wang, 2003). A bioactive material is
one that encourages a biological response at the tissue/material interface, which
results in a bond between the material and the tissue (Cao and Hench, 1996).
Mohseni et al have compiled both qualitative and quantitative data for a number of
different HAp coating techniques: plasma spray depositing, hot isostatic pressing,
thermal spray, dip coating, pulsed laser deposition, electrophoretic deposition, sol-
gel, ion beam assisted deposition, and sputtering. Their findings conclude that the
best adhesion of HAp coating on Ti-6Al-4V substrate is obtained by the sputtering
technique with an adhesion strength of 80 MPa; pulsed laser deposition at 1000
laser pulses had the lowest bonding strength with adhesion strength < 10 MPa
(Mohseni et al., 2014).
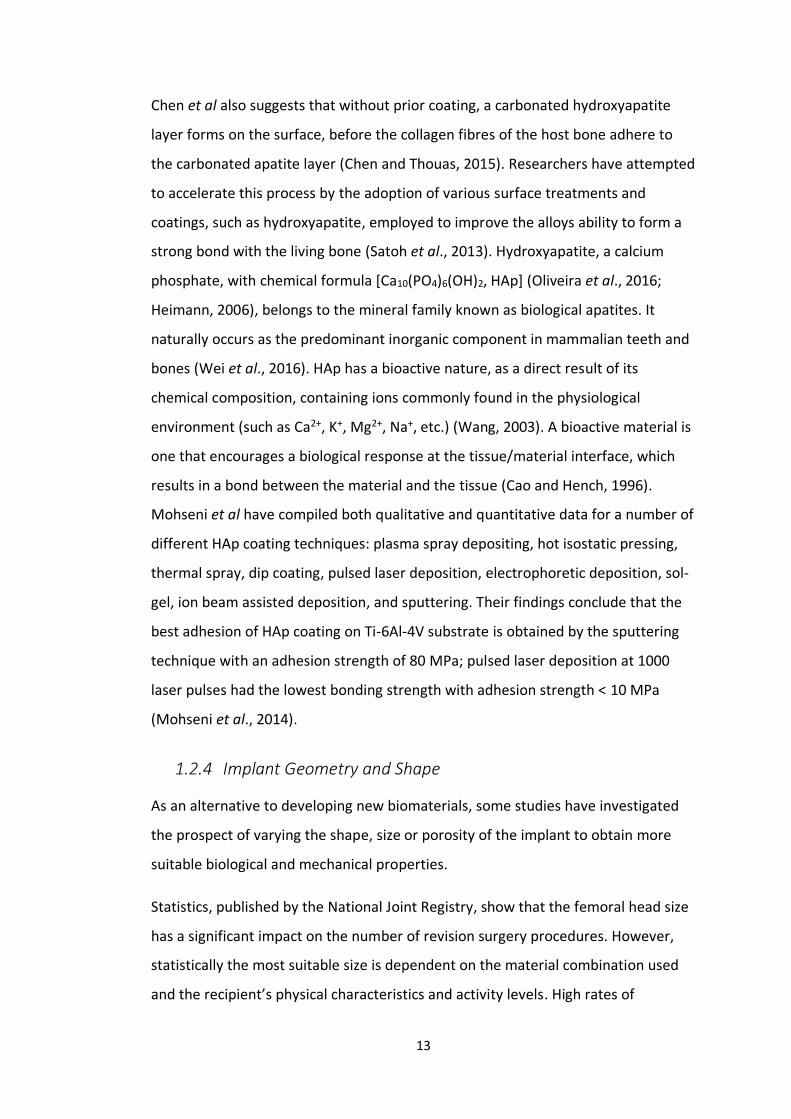
1.2.4 Implant Geometry and Shape
As an alternative to developing new biomaterials, some studies have investigated
the prospect of varying the shape, size or porosity of the implant to obtain more
suitable biological and mechanical properties.
Statistics, published by the National Joint Registry, show that the femoral head size
has a significant impact on the number of revision surgery procedures. However,
statistically the most suitable size is dependent on the material combination used
and the recipient’s physical characteristics and activity levels. High rates of
14
dislocation, leading to revision surgery, have been noted in cases involving small
femoral head size for the majority of material combinations (Ng et al, 2011).
However, for metal on metal implants, a larger head size, which has been noted to
reduce the number of dislocations, also increases the contact area between the cup
and ball, leading to higher revision rates caused by adverse reactions to particulate
wear debris (13th Annual Report, 2016; 15th Annual Report, 2018). This occurrence
can be described as a greater volumetric wear but may be counterintuitive because
the pressure per unit area would be reduced for a larger contact area; the
lubrication and sealing of the joint may also contribute to the amount of wear, the
production of particulate debris and its diffusion into the rest of the human body.
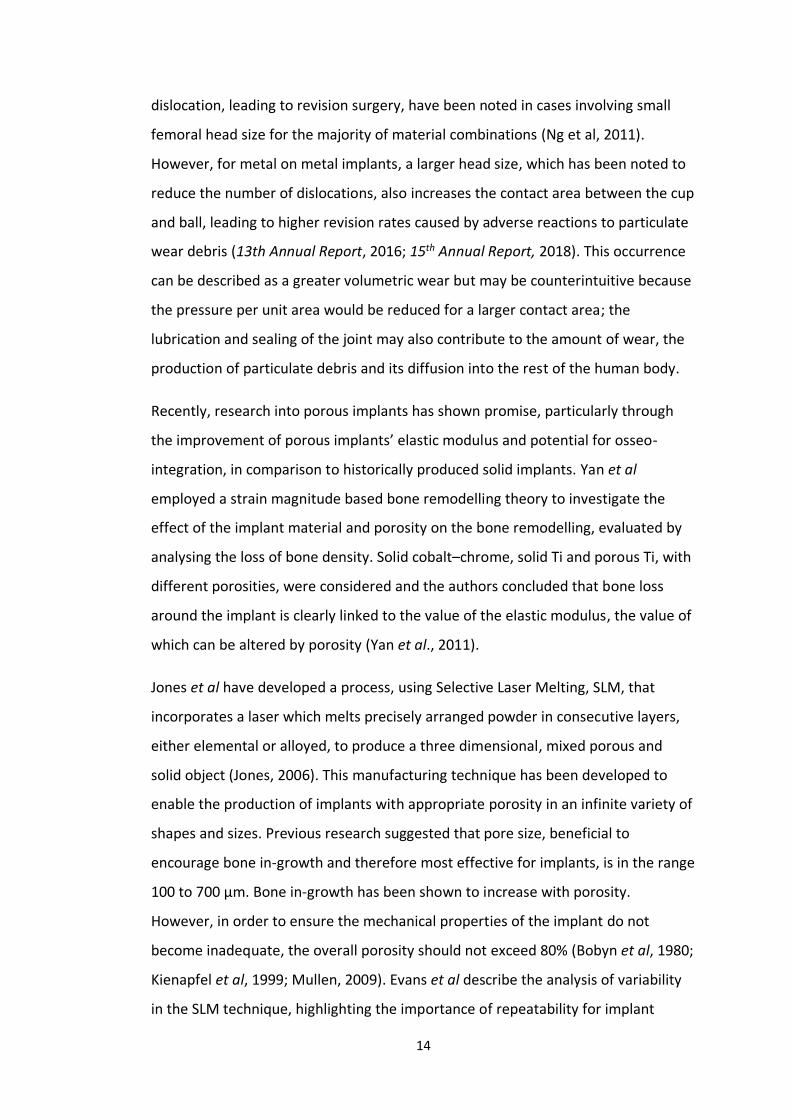
Recently, research into porous implants has shown promise, particularly through
the improvement of porous implants’ elastic modulus and potential for osseo-
integration, in comparison to historically produced solid implants. Yan et al
employed a strain magnitude based bone remodelling theory to investigate the
effect of the implant material and porosity on the bone remodelling, evaluated by
analysing the loss of bone density. Solid cobalt–chrome, solid Ti and porous Ti, with
different porosities, were considered and the authors concluded that bone loss
around the implant is clearly linked to the value of the elastic modulus, the value of
which can be altered by porosity (Yan et al., 2011).
Jones et al have developed a process, using Selective Laser Melting, SLM, that
incorporates a laser which melts precisely arranged powder in consecutive layers,
either elemental or alloyed, to produce a three dimensional, mixed porous and
solid object (Jones, 2006). This manufacturing technique has been developed to
enable the production of implants with appropriate porosity in an infinite variety of
shapes and sizes. Previous research suggested that pore size, beneficial to
encourage bone in-growth and therefore most effective for implants, is in the range
100 to 700 μm. Bone in-growth has been shown to increase with porosity.
However, in order to ensure the mechanical properties of the implant do not
become inadequate, the overall porosity should not exceed 80% (Bobyn et al, 1980;
Kienapfel et al, 1999; Mullen, 2009). Evans et al describe the analysis of variability
in the SLM technique, highlighting the importance of repeatability for implant
15
success. Previous techniques, such as plasma spraying and sintering, were not able
to provide the same level of consistent accuracy required for mass production, to
ensure the implant performs as its porous design intends (Evans, 2017). Simoneau
et al have also used an SLM technique to manufacture a porous stem and dense
stem replica to determine an optimum porosity by exploring the relationship
between the bone ingrowth requirements and the manufacturing technology
limitations. The limitations to the manufacturing method resulted in around a 10%
porosity increase than predicted in the porous stem. The authors concluded that
there is a better match between porous implant stiffness, with that of bone, while
still providing adequate mechanical properties at the porosity investigated. They
propose that future work will be devoted to the biomechanical in-vitro testing of
artificial femurs implanted with both the porous and dense stems, to evaluate the
reduction of stress shielding (Simoneau et al., 2017).
It is reasonable to conclude that many factors including material, shape and size, all
have an impact on whether an implant will be successful. The alloy-system used to
manufacture porous implants is still of importance and biocompatibility of the
materials must be carefully considered in order to tackle the inherent problems
with metallic wear debris. However; porous implants appear to offer advantages,
including reduction in the stress-shielding effect, and efficient use of material and
subsequently reduced implant weight.
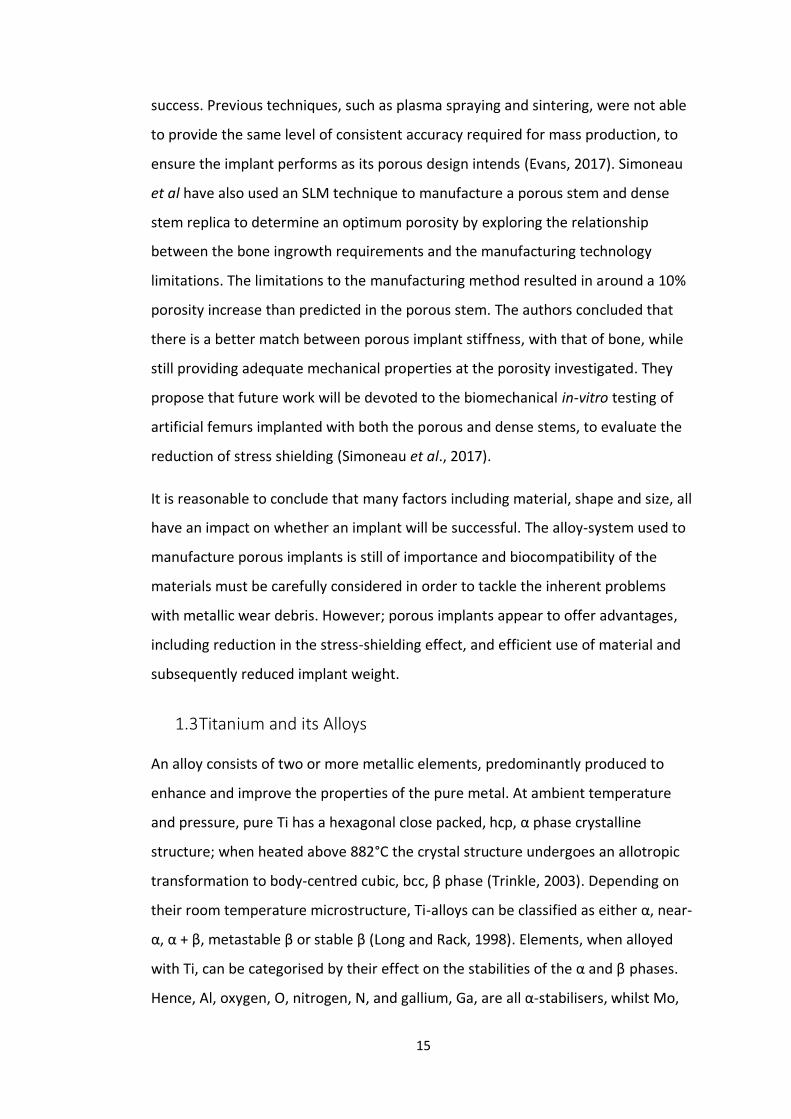
1.3 Titanium and its Alloys
An alloy consists of two or more metallic elements, predominantly produced to
enhance and improve the properties of the pure metal. At ambient temperature
and pressure, pure Ti has a hexagonal close packed, hcp, α phase crystalline
structure; when heated above 882°C the crystal structure undergoes an allotropic
transformation to body-centred cubic, bcc, β phase (Trinkle, 2003). Depending on
their room temperature microstructure, Ti-alloys can be classified as either α, near-
α, α + β, metastable β or stable β (Long and Rack, 1998). Elements, when alloyed
with Ti, can be categorised by their effect on the stabilities of the α and β phases.
Hence, Al, oxygen, O, nitrogen, N, and gallium, Ga, are all α-stabilisers, whilst Mo,
16
Nb, V, tungsten, W, and Ta are all β-stabilisers; Zr, tin, Sn, and silicon, Si, are
considered neutral elements. V, Nb, Ta, and Mo are isomorphic to β-Ti and form a
substitutional solid solution (Baker, 1992; Kolli and Devaraj, 2018).
Currently, Ti-6Al-4V is the most commonly used Ti-alloy system in total hip
arthroplasty, THA. Its α-β phase structure contributes to its high Young’s modulus
of ≈ 115 GPa and tensile strength of 860 MPa in comparison with cortical bone and
cancellous bone, 7-30 GPa, 100-230 MPa and 0.05-0.5 GPa, 2-12 MPa, respectively
(Hermawan et al., 2011; Kokubo et al., 2003). More recently, β-phase Ti-alloys have
been shown to have more comparable Young’s modulus and improved
biocompatibility. Liang et al have recently developed a new β-phase Ti alloy system,
Ti-31Nb-6Zr-5Mo, with a low Young’s modulus of 44 GPa, whilst still maintaining a
respectable tensile strength over 700 MPa (Liang et al., 2016). Matsumoto and co-
authors report that the Ti-alloy system, Ti-35Nb-4Sn has the lowest elastic modulus
of 42 GPa (Matsumoto et al., 2005). Other β-Ti alloy systems, partially researched
include Ti-25Nb-6.25Zr and Ti-25Nb with calculated Young’s moduli of ≈ 50 GPa and
≈ 80 GPa, respectively (Karre et al., 2015), six alloy stoichiometries, in the Ti–Nb–Zr
alloy system, with the lowest Young’s modulus ≈ 38.8 GPa (You and Song, 2012) and
Ti-35Nb-4Sn-6Mo-9Zr with Young’s modulus ≈ 65 GPa (Dai et al., 2013). The
aforementioned studies present some rationale behind the chosen alloying
elements, but lack justification of the number of elements chosen and the ratio of
alloy compositions used.
1.3.1 Alloying Elements
In recent years, the majority of research has focused on the mechanical and
biological properties of binary, ternary and quaternary β-phase Ti-alloys. A wide
variety of alloying elements and compositions has been investigated, however,
there is yet to be a systematic review of the function that alloying elements have.
The most commonly chosen alloying elements, Nb, Mo, Ta, and Zr, will be reviewed
with respect to the rationale for their use.
17
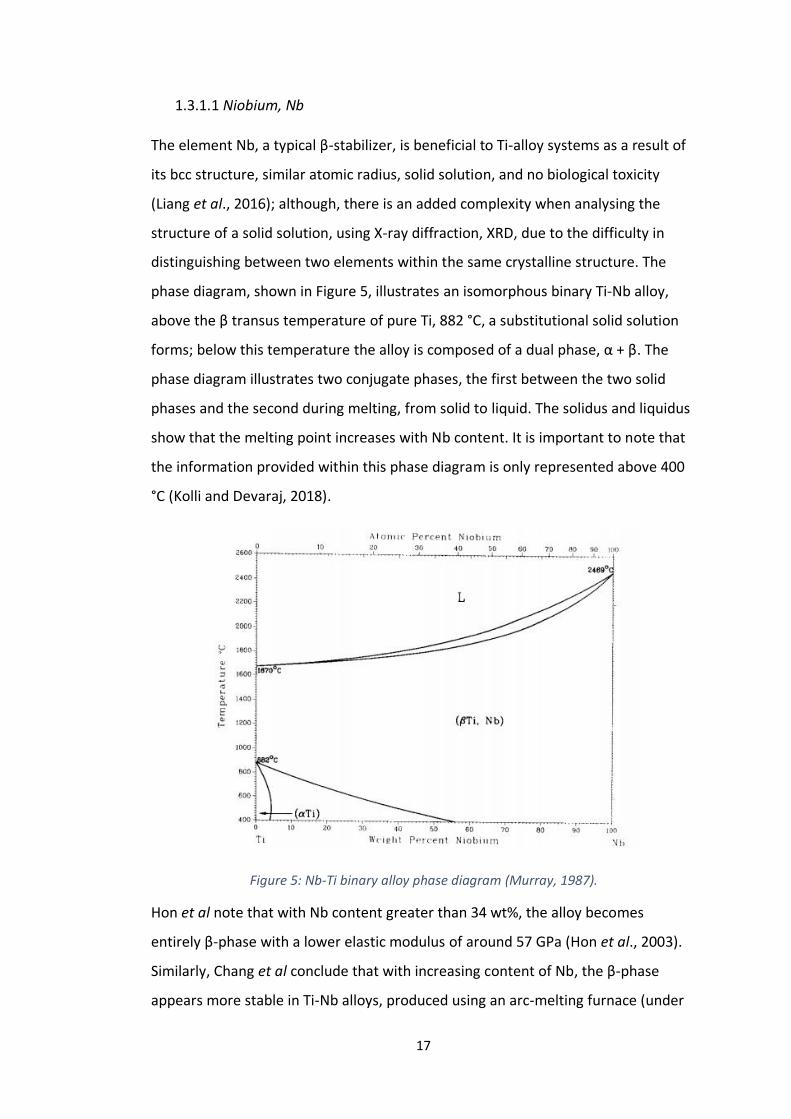
1.3.1.1 Niobium, Nb
The element Nb, a typical β-stabilizer, is beneficial to Ti-alloy systems as a result of
its bcc structure, similar atomic radius, solid solution, and no biological toxicity
(Liang et al., 2016); although, there is an added complexity when analysing the
structure of a solid solution, using X-ray diffraction, XRD, due to the difficulty in
distinguishing between two elements within the same crystalline structure. The
phase diagram, shown in Figure 5, illustrates an isomorphous binary Ti-Nb alloy,
above the β transus temperature of pure Ti, 882 °C, a substitutional solid solution
forms; below this temperature the alloy is composed of a dual phase, α + β. The
phase diagram illustrates two conjugate phases, the first between the two solid
phases and the second during melting, from solid to liquid. The solidus and liquidus
show that the melting point increases with Nb content. It is important to note that
the information provided within this phase diagram is only represented above 400
°C (Kolli and Devaraj, 2018).
Figure 5: Nb-Ti binary alloy phase diagram (Murray, 1987).
Hon et al note that with Nb content greater than 34 wt%, the alloy becomes
entirely β-phase with a lower elastic modulus of around 57 GPa (Hon et al., 2003).
Similarly, Chang et al conclude that with increasing content of Nb, the β-phase
appears more stable in Ti-Nb alloys, produced using an arc-melting furnace (under
18
argon atmosphere), before both cold rolling and various solution treatments at
various temperatures. The Young’s modulus was also shown to be dependent on
Nb content, decreasing with increased wt% of Nb; the Ti–30Nb alloys attained
values in the range of 45 – 67 GPa. Seemingly, there is a correlation between the
alloys Nb content, the structural transformation from α to β phase and the
decreasing value of Young’s modulus (Chang et al., 2016). The observations within
the aforementioned studies are in agreement with the phase diagram in Figure 5,
although the quantity of Nb content required to produce a stable βTi phase differs
significantly. Alternatively, to bulk manufacturing methods, Achache et al describe
the successful production of Ti-Nb coatings by magnetron sputtering. Deposition
occurred, with varying Nb content from 3% to 34%, on glass substrates, with
sputtering parameters: argon flow rate; total pressure; and run duration, equal to
50 sccm, 0.43 Pa, and 90 min, respectively. The authors conclude that the alloy’s
microstructure is closely related to the Nb content and confirm that at 34 wt% Nb
the structure is fully composed of β-phase. Suggested by omission, the deposited
film, with adequate Nb content, has a β-phase crystal structure without the
requirement of any heat treatment (Achache et al., 2015); contrary to powder
metallurgy techniques that require high temperatures to form a uniform crystal
structure. Achache et al have continued their research of Ti alloy systems
(deposited by magnetron sputtering), focusing on the quaternary Ti alloy, Ti–23Nb–
0.7Ta–2Zr–1.2O at%; chosen due to its “super” properties such as very high
strength, low Young’s modulus and “superelasticity” at room temperature (Saito et
al., 2003). The authors conclude that the mechanical properties and phase
structure are affected during the sputtering process by the argon flow (working
pressure) and negative bias voltage (Achache et al., 2016). Other methods of
production include; mechanical alloying of powders before spark sintering (Sharma
et al., 2016), metal injection moulding using elemental powders (Zhao et al., 2015)
and casting methods (Bönisch et al., 2015); although effective these methods are
time-consuming and costly. Alternatively, some researchers have resorted to
theoretical investigations, such as first-principles Density Functional Theory, DFT,
(Liang et al., 2016) and d-electron alloy design method (Karre et al., 2015), to
predict the mechanical properties of various alloy compositions. Although these

19
methods are effective at predicting numerous properties, the unpredictable nature
of biocompatibility, especially when varying elemental composition, would need to
be further explored experimentally.
20
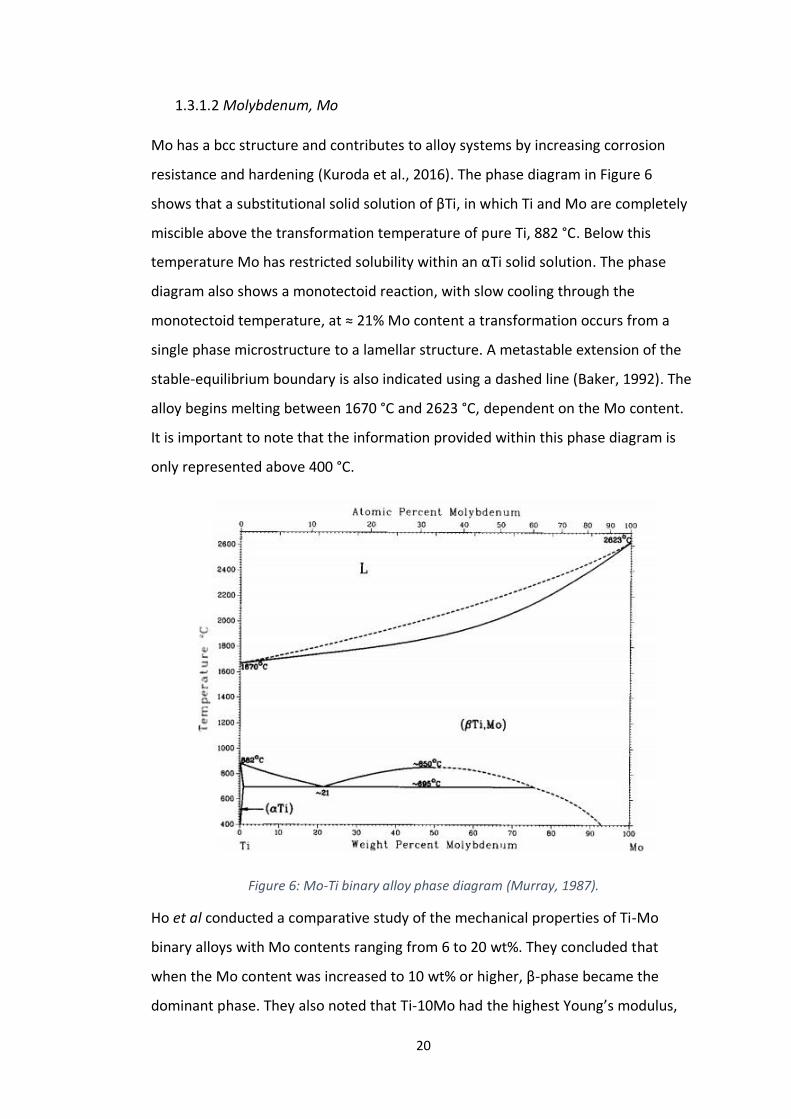
1.3.1.2 Molybdenum, Mo
Mo has a bcc structure and contributes to alloy systems by increasing corrosion
resistance and hardening (Kuroda et al., 2016). The phase diagram in Figure 6
shows that a substitutional solid solution of βTi, in which Ti and Mo are completely
miscible above the transformation temperature of pure Ti, 882 °C. Below this
temperature Mo has restricted solubility within an αTi solid solution. The phase
diagram also shows a monotectoid reaction, with slow cooling through the
monotectoid temperature, at ≈ 21% Mo content a transformation occurs from a
single phase microstructure to a lamellar structure. A metastable extension of the
stable-equilibrium boundary is also indicated using a dashed line (Baker, 1992). The
alloy begins melting between 1670 °C and 2623 °C, dependent on the Mo content.
It is important to note that the information provided within this phase diagram is
only represented above 400 °C.
Figure 6: Mo-Ti binary alloy phase diagram (Murray, 1987).
Ho et al conducted a comparative study of the mechanical properties of Ti-Mo
binary alloys with Mo contents ranging from 6 to 20 wt%. They concluded that
when the Mo content was increased to 10 wt% or higher, β-phase became the
dominant phase. They also noted that Ti-10Mo had the highest Young’s modulus,
21
while Ti-15Mo had the lowest. The effects of Mo content on the alloys
biocompatibility were not investigated (Ho et al., 1999). Other comparative
investigations include: the crystal phase analysis and preliminary electrochemical
studies of Ti–Mo alloys from 4 to 20 Mo wt%, produced using arc-melting (Oliveira
and Guastaldi, 2006); the mechanical properties and crystal phase analysis of Ti-Mo
alloys with Mo contents ranging from 5 to 20 wt%, again manufactured using arc-
melting (Chen et al., 2006); and lastly, the observation of differences in the
mechanical properties of, commercially pure Ti, Ti–6Al–4V, Ti–13Nb–13Zr and Ti–
7.5Mo, produced using casting methods (Lin et al., 2005). Researchers concluded,
similarly to Nb, that with greater wt% of Mo, binary Ti-Mo alloys have an almost
exclusive β phase structure. Oliveira et al retierate that Ti-Mo alloys with Mo
content at 10 wt% or greater, significantly retain β-phase structure.
Electrochemical studies performed, indicated a valve-metal behaviour, where the
metal forms an oxide film of uniform thickness and stoichiometry (Bockris, 2013),
and good corrosion resistance in aerated Ringer’s solution for all alloys (Oliveira et
al., 2007). Chen and co-authors, propose Ti-10Mo as the most suitable alloy system
with consideration of the mechanical properties, obtaining values for compression
strength, compression ratio and elastic modulus, equal to 1636 MPa, 22.5% and
29.8 GPa, respectively. In comparison to previous studies, the authors conclude
that the improvement in plasticity of Ti-Mo alloys is related to the increase in Mo
content (Chen et al., 2006). The studies mentioned included only phase structure
analysis and mechanical properties testing, with none of the alloys tested
biologically for cytotoxicity or adverse tissue reactions.
ATI 15Mo™ Alloys (UNS R58150) is a beta titanium alloy capable of a wide variety of
properties including low modulus of elasticity, high strength, excellent fatigue
strength, good ductility/formability, exceptional corrosion resistance, and well-
documented biocompatibility (ATI, 2014).

22
1.3.1.3 Tantalum, Ta
It is well known that Ta possesses a body-centred cubic, bcc, crystal structure; its
high corrosion resistance and excellent biocompatibility, like Ti, have also been of
interest to many researchers. The phase diagram, shown in Figure 7, illustrates a
substitutional solid solution of βTi, in which Ti and Ta are completely miscible above
the transformation temperature of pure Ti, 882 °C. The alloy begins melting
between a significant temperature range, 1670 °C and 3020 °C, dependent on the
Ta content. The solidus and liquidus show that the melting point increases with Ta
content. The conjugate phase between the two solid phases is metastable and
dependent on the cooling rate, illustrated on Figure 7 by a dashed line (Baker,
1992). It is important to note that the information provided within this phase
diagram is only represented above 400 °C.
Figure 7: Ta-Ti binary alloy phase diagram (Murray, 1987).
Zhou et al investigated the sensitivity of Ta content on binary Ti-Ta alloys. Ti-Ta
alloys with Ta contents varied from 10 to 80 wt% were prepared using a tri-arc
furnace, under argon atmosphere, before rolling at an unspecified temperature and
solution treating at 1223 K. The authors conclude that with Ta content below 20%
the alloy exhibits a hcp, α-phase structure and at Ta contents above 60% the alloys
23
structure is composed of a single metastable, β-phase structure. The Ti-70Ta wt%
alloy, with metastable β-phase, was shown to have a much lower modulus than the
other alloys investigated (Zhou et al., 2004). Zhou et al continued their studies of
binary Ti-Ta alloy systems, investigating the corrosion resistance and
biocompatibility of three, binary Ti-Ta alloy systems, Ti-10Ta, Ti-30Ta and Ti-70Ta
wt%, in comparison with commercially pure Ti and Ti-6Al-4V. Unfortunately, the
preparation methods employed to produce the alloys are only vaguely described.
The authors assess corrosion resistance using anodic polarisation tests and
performed biocompatibility testing using L-929 cells, derived from mice. The
biocompatibility results showed promise in comparison with commercially pure Ti
and Ti-6Al-4V; however, by using mouse derived cells, this is only a guide to
biocompatibility, where the results are not always comparable to those obtained
using human cells, both in vivo and in vitro. The authors conclude that both the
corrosion resistance and biocompatibility of the three alloy systems was similar to
or exceeded those of commercially pure Ti or Ti-6Al-4V (Zhou et al., 2005).
Alongside conventional manufacturing techniques, researchers are also
investigating the properties of binary Ti-Ta alloys using theoretical methods,
previously mentioned with regards to Nb, such as DFT. Wu et al model the elastic
properties and the electronic structure of β-type Ti-Ta alloys from first-principle
calculations based on DFT. The authors imply that the stability of the β-phase is
improved with increasing content of Ta (Wu et al., 2010). Ojha and Sehitoglu, also
employ DFT to model binary Ti-Ta alloys, establishing and comparing the lattice
constants and associated energies of the bcc-hcp transformation in Ti-6.25Ta at%
and Ti-6.25Nb at% alloy systems (Ojha and Sehitoglu, 2016). Morgado et al
compared the Young’s moduli and wear behaviour of two binary, Ti-Ta alloys, Ti-
30Ta wt% and Ti-52Ta wt%, produced by laser cladding. The authors conclude that
both alloys possess a low Young’s modulus; however, Ti-52Ta wt% presents wear
behaviour more suitable for the application intended (Morgado et al., 2016).

24
1.3.1.4 Zirconium, Zr
As previously mentioned, Zr is classified as a neutral element with regards to phase
stability. It has a hcp structure, like Ti, meaning Ti-Zr binary alloys possess an α-
phase structure, at temperatures below ≈ 605 °C, and consequently a relatively high
Young’s modulus. The phase transformations are shown in Figure 8. Interestingly,
its addition to Ti-alloys can influence the β-phase, decreasing the β-transus
temperature, when in the presence of another β-stabiliser (Correa et al., 2015;
Kuroda et al., 2016; Murray, 1987).
Figure 8: Ti-Zr binary alloy phase diagram (Murray, 1987).
Zr has also been shown to improve the corrosion resistance of Ti-alloys when
compared to pure Ti (Han et al., 2014); although in contradiction, Oliveira et al
suggest through the observation of transpassivation at potentials smaller than 8 V,
that the addition of Zr in the Ti-50Zr at% alloy encouraged pitting corrosion
(Oliveira and Guastaldi, 2006). Where transpassivation is the phenomenon that a
metal starts to corrode at an increasing rate relative to the increase in electrode
potential (Song, 2005).
25
1.4 Research Aims and Objectives
The research aim of this work was: to develop and demonstrate a systematic
approach that enables the primary determination of some of the intrinsic
properties that a biomaterial must possess. The research aim will be achieved by
developing and evaluating the structural, mechanical and biological properties of β
phase binary Ti-alloys (Ti100-X -XNb, Ti100-X -XMo, where X = 15, 25, 50 at%) produced
by magnetron sputter deposition.
26
2. Vacuums and Magnetron Sputtering
Included in this section is: an overview of vacuum systems and a summary of
chemical vapour deposition, CVD, and physical vapour deposition, PVD, techniques
with particular reference to magnetron sputter deposition.
2.1 Vacuum Systems
The general term ‘vacuum’ covers a range of pressures, subdivided into categories
from atmospheric pressure to ultra-high vacuum:
Atmospheric pressure: 1 x 10⁵ Pa
Low vacuum: 1 x 10⁵ – 1 x 10³ Pa
Medium vacuum: 1 x 10³ – 1 x 10⁻¹ Pa
High vacuum: 1 x 10⁻¹ – 1 x 10⁻⁷ Pa
Ultra-high vacuum: 1 x 10⁻⁷ – 1 x 10⁻¹⁰ Pa
High vacuums are achieved by first using a roughing pump to evacuate the chamber
from atmospheric pressure to ≈ 1 x 10⁻¹ Pa. A secondary pump is then required to
increase the vacuum to the desired pressure. The time taken to achieve the
required level of vacuum can vary depending on the variables such as the vacuum
apparatus used, the volume of the evacuation chamber and the extent of
outgassing. Outgassing is the slow deterioration of the vacuum due to the release
of adsorbed gasses from the interior surfaces of the vacuum system. Factors such
as adsorption, diffusion and permeation contribute to outgassing (Chambers, 2005).
2.2 Magnetron Sputter Deposition System
Magnetron sputtering, performed in a controlled argon atmosphere, is a PVD
technique widely used in industries such as automotive, construction, electronic
and aerospace, to manufacture thin films and produce a variety of different
coatings. PVD is a general description given to a variety of surface engineering,
vacuum deposition processes, where the material goes from a solid phase to a
27
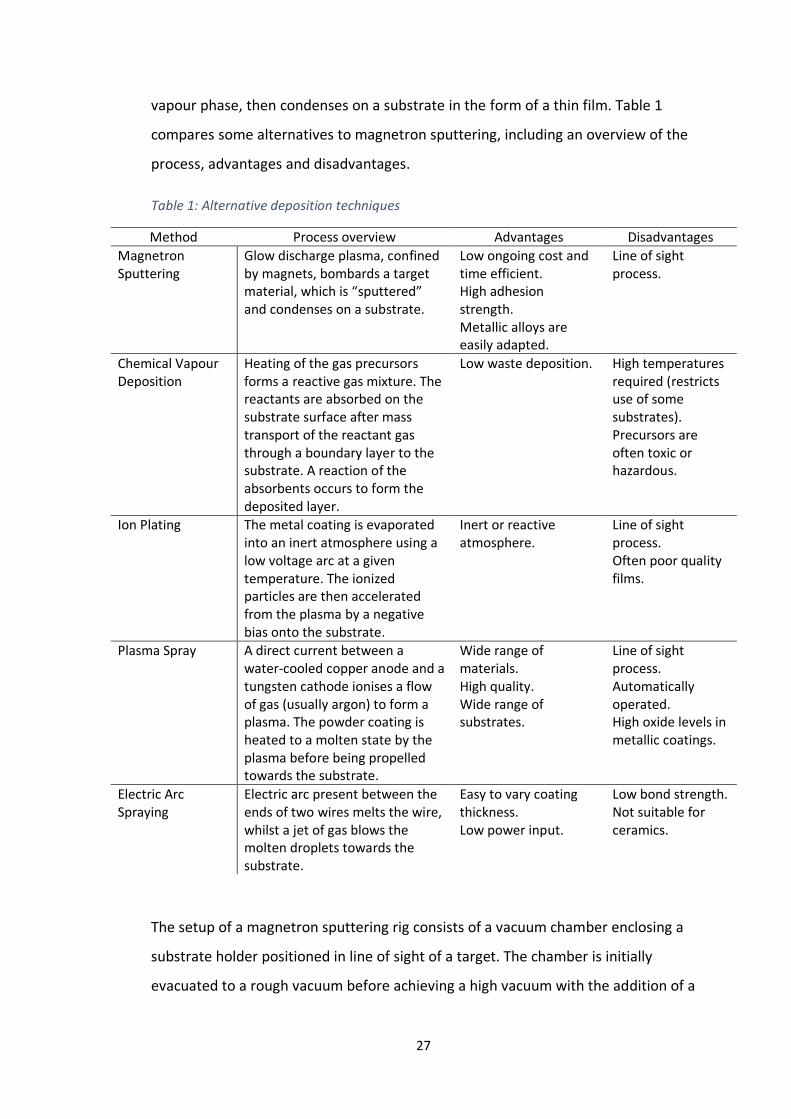
vapour phase, then condenses on a substrate in the form of a thin film. Table 1
compares some alternatives to magnetron sputtering, including an overview of the
process, advantages and disadvantages.
Table 1: Alternative deposition techniques
Method Process overview Advantages Disadvantages
Magnetron Sputtering
Glow discharge plasma, confined by magnets, bombards a target material, which is “sputtered” and condenses on a substrate.
Low ongoing cost and time efficient. High adhesion strength. Metallic alloys are easily adapted.
Line of sight process.
Chemical Vapour Deposition
Heating of the gas precursors forms a reactive gas mixture. The reactants are absorbed on the substrate surface after mass transport of the reactant gas through a boundary layer to the substrate. A reaction of the absorbents occurs to form the deposited layer.
Low waste deposition. High temperatures required (restricts use of some substrates). Precursors are often toxic or hazardous.
Ion Plating The metal coating is evaporated into an inert atmosphere using a low voltage arc at a given temperature. The ionized particles are then accelerated from the plasma by a negative bias onto the substrate.
Inert or reactive atmosphere.
Line of sight process. Often poor quality films.
Plasma Spray A direct current between a water-cooled copper anode and a tungsten cathode ionises a flow of gas (usually argon) to form a plasma. The powder coating is heated to a molten state by the plasma before being propelled towards the substrate.
Wide range of materials. High quality. Wide range of substrates.
Line of sight process. Automatically operated. High oxide levels in metallic coatings.
Electric Arc Spraying
Electric arc present between the ends of two wires melts the wire, whilst a jet of gas blows the molten droplets towards the substrate.
Easy to vary coating thickness. Low power input.
Low bond strength. Not suitable for ceramics.
The setup of a magnetron sputtering rig consists of a vacuum chamber enclosing a
substrate holder positioned in line of sight of a target. The chamber is initially
evacuated to a rough vacuum before achieving a high vacuum with the addition of a

28
secondary pump (a description of the vacuum pumps and gauges typically used can
be found in Appendix B). A sputtering gas, commonly argon, is introduced into the
chamber. A high potential difference, between two electrodes, is used to
accelerate free electrons, which collide and ionise the sputtering gas, initiating
plasma. Plasma is a partially ionised gas, containing ions, electrons and neutrals,
which is created at reduced pressures via an applied electric field. In PVD processes,
the type of plasma used is termed a ‘glow discharge’, because of the characteristic
light given off by the target material and the process gases used. In the basic
sputtering process, a target (or cathode) plate is bombarded by energetic ions
generated in a glow discharge plasma in front of the target. The bombardment of
ions causes the removal of target atoms known as “sputtering”; these atoms may
then condense on a substrate as a thin film. Secondary electrons are also emitted
from the target surface as a result of the ion bombardment. These electrons help to
maintain the plasma.
Figure 9: Schematic image of three different planar magnetron configurations with the magnetic field lines indicated. a) balanced magnetron, b) unbalanced type I, and c)
unbalanced type II.
Magnetrons make use of the fact that a magnetic field parallel to the target can
constrain a secondary electron motion to the vicinity of the target. The magnets are
arranged in such a way that one pole is positioned at the central axis of the target
with a second pole formed by a ring around the outer edge of the target. This
increases the probability that an ionising electron-atom collision may occur. Higher
sputtering rates are achieved by the increased ion bombardment of the target. The
strength of the magnets is varied in different configurations to further confine the
29
plasma, Figure 9 illustrates three configurations; type II is the configuration
generally used.
Through the introduction of a reactive gas, the magnetron sputtering process
enables the production of either thin films of a pure alloy or as a compound film
such as a nitride, oxide or carbide. The use of two or more magnetron sources, or
blending metallic powders together, enables the deposition of alloy films.
The magnetron discharge can be driven by either direct current, DC, pulsed DC,
alternating current, AC, or radio frequency, RF. When using pulsed DC, the applied
voltage is periodically switched between negative, pulse-on, and positive, pulse-off.
The periodic voltage reversals are designed to reduce arcing during sputtering and
provide a stable deposition process. During the pulse on period, positive ions
sputter the target material and during the pulse off period, an electron current is
drawn at the target that dissipates any charge build-up before an arc event can
occur.
The growth of thin films, produced using magnetron sputtering, begins by
nucleation, the first atoms arrive randomly at the substrate and establish a
permanent residence; these atoms are said to be condensing (Ohring, 1991).
30
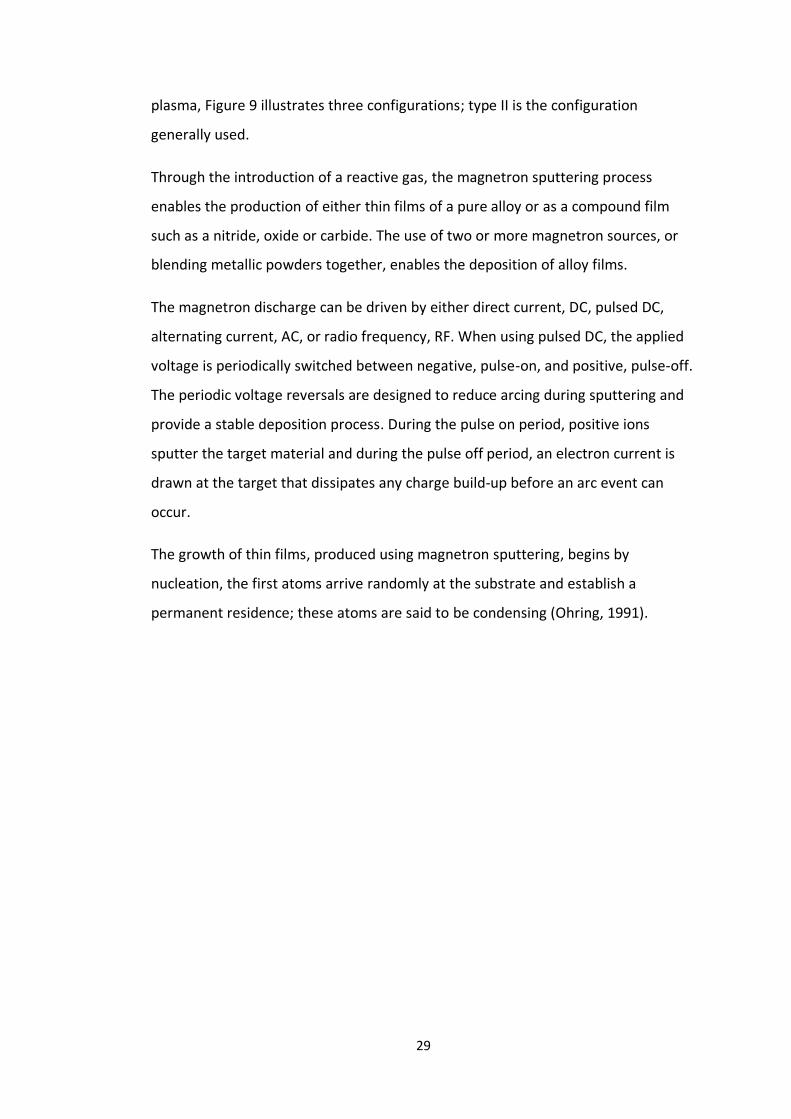
Figure 10: Three modes of thin film growth processes: a) Volmer-Weber type, b) Frank van der Merwe type and c) Stranski-Krastanov type (Ratova, 2013).
The way in which the thin film continues to grow depends on the thin film material
and its interaction with the substrate, several models have been suggested to
describe the initial growth (Kelly 1997), illustrated in Figure 10: Volmer-Weber type,
an island structure, consisting of clusters of atoms nucleating in three dimensions,
forming as a result of the atoms being more strongly bound to each other than the
substrate; Frank-van der Merwe type, the atoms form uniform mono-layers
resulting from the atoms preference to the substrate as opposed to each other;
Stranski-Krastanov type, a combination of both preceding types where subsequent
mono-layer growth becomes less favourable and islands begin to form (Adachi et al,
2012; Brune, 2001). Continued growth is more likely to occur in the elevated
regions, leading to a columnar microstructure (Ratova, 2013). However, the type of
continued growth, after the formation of several angstroms of the sputtered
material, depends heavily on the sputtering and thermodynamic parameters
(Adachi et al, 2012). Several structural-zone models are used to predict the
microstructure of thin films; Thornton proposed a model dependent on two
deposition parameters, total argon pressure and substrate temperature, enabling
the prediction of one of four possible microstructure outcomes; Zone 1, thermally

31
unstable, fine-textured, fibrous grains due to low diffusion of surface atoms, Zone
2, densification of the film and growth of the grain sizes, Zone 3, well defined
crystals of the sputtered material, and Zone T, dense crystalline structure with small
grains (Thornton, 1974).
32
3. Characterisation Techniques
3.1 Scanning Electron Microscopy
Scanning electron microscopy, SEM, is a non-invasive technique that produces an
image of a sample. Within a vacuum, electrons emanating from an electron gun are
accelerated, through a high potential difference, and directed using an
arrangement of magnetic lenses, towards a sample. The incident electrons cause
the emission of k-shell, low-energy electrons (secondary electrons) from the sample
atoms prior to the high-energy electrons scattering (backscattered electrons).
Multiple detectors recognise the emerging electrons by their energy. The secondary
electron detector consists of an anode, with a positive bias applied to collect the
emerging electrons. As the beam progressively scans over the sample, the varying
anode current, due to the differing number of electrons collected, is converted into
an image of the sample’s surface (Freedman, 2012). Figure 11 illustrates a typical
SEM arrangement.
Figure 11: Schematic illustration of SEM.
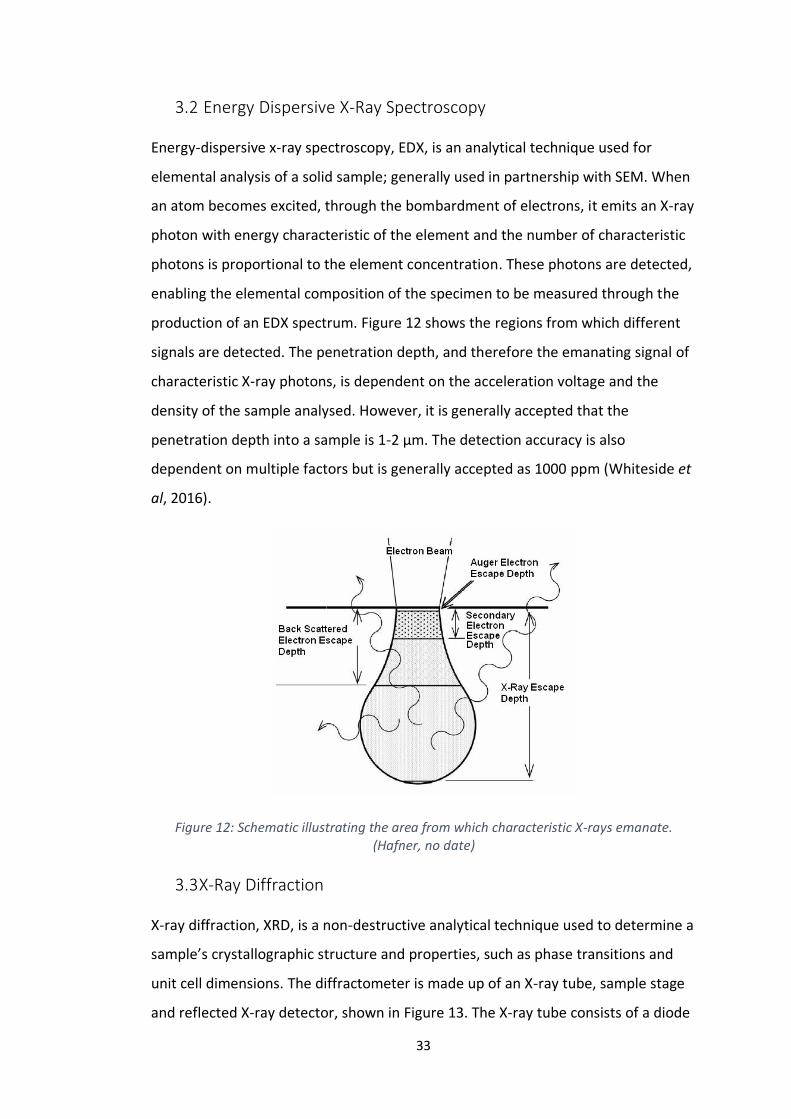
33
3.2 Energy Dispersive X-Ray Spectroscopy
Energy-dispersive x-ray spectroscopy, EDX, is an analytical technique used for
elemental analysis of a solid sample; generally used in partnership with SEM. When
an atom becomes excited, through the bombardment of electrons, it emits an X-ray
photon with energy characteristic of the element and the number of characteristic
photons is proportional to the element concentration. These photons are detected,
enabling the elemental composition of the specimen to be measured through the
production of an EDX spectrum. Figure 12 shows the regions from which different
signals are detected. The penetration depth, and therefore the emanating signal of
characteristic X-ray photons, is dependent on the acceleration voltage and the
density of the sample analysed. However, it is generally accepted that the
penetration depth into a sample is 1-2 µm. The detection accuracy is also
dependent on multiple factors but is generally accepted as 1000 ppm (Whiteside et
al, 2016).
Figure 12: Schematic illustrating the area from which characteristic X-rays emanate. (Hafner, no date)
3.3 X-Ray Diffraction
X-ray diffraction, XRD, is a non-destructive analytical technique used to determine a
sample’s crystallographic structure and properties, such as phase transitions and
unit cell dimensions. The diffractometer is made up of an X-ray tube, sample stage
and reflected X-ray detector, shown in Figure 13. The X-ray tube consists of a diode
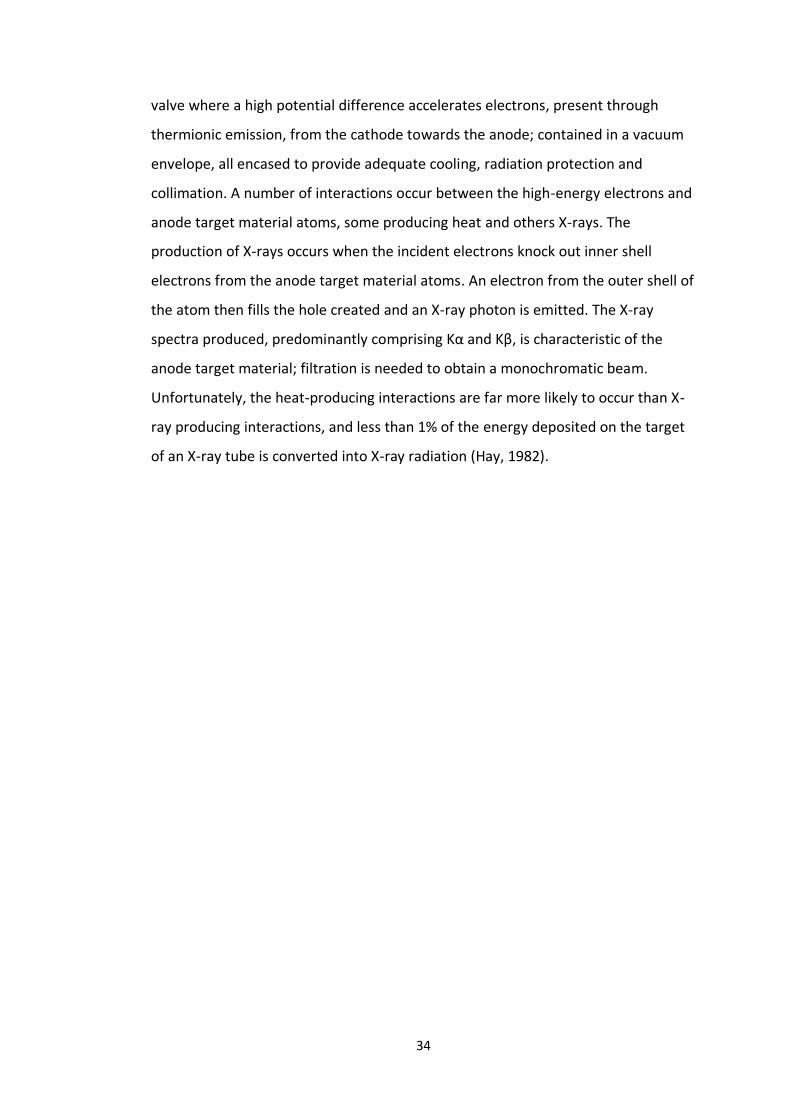
34
valve where a high potential difference accelerates electrons, present through
thermionic emission, from the cathode towards the anode; contained in a vacuum
envelope, all encased to provide adequate cooling, radiation protection and
collimation. A number of interactions occur between the high-energy electrons and
anode target material atoms, some producing heat and others X-rays. The
production of X-rays occurs when the incident electrons knock out inner shell
electrons from the anode target material atoms. An electron from the outer shell of
the atom then fills the hole created and an X-ray photon is emitted. The X-ray
spectra produced, predominantly comprising Kα and Kβ, is characteristic of the
anode target material; filtration is needed to obtain a monochromatic beam.
Unfortunately, the heat-producing interactions are far more likely to occur than X-
ray producing interactions, and less than 1% of the energy deposited on the target
of an X-ray tube is converted into X-ray radiation (Hay, 1982).
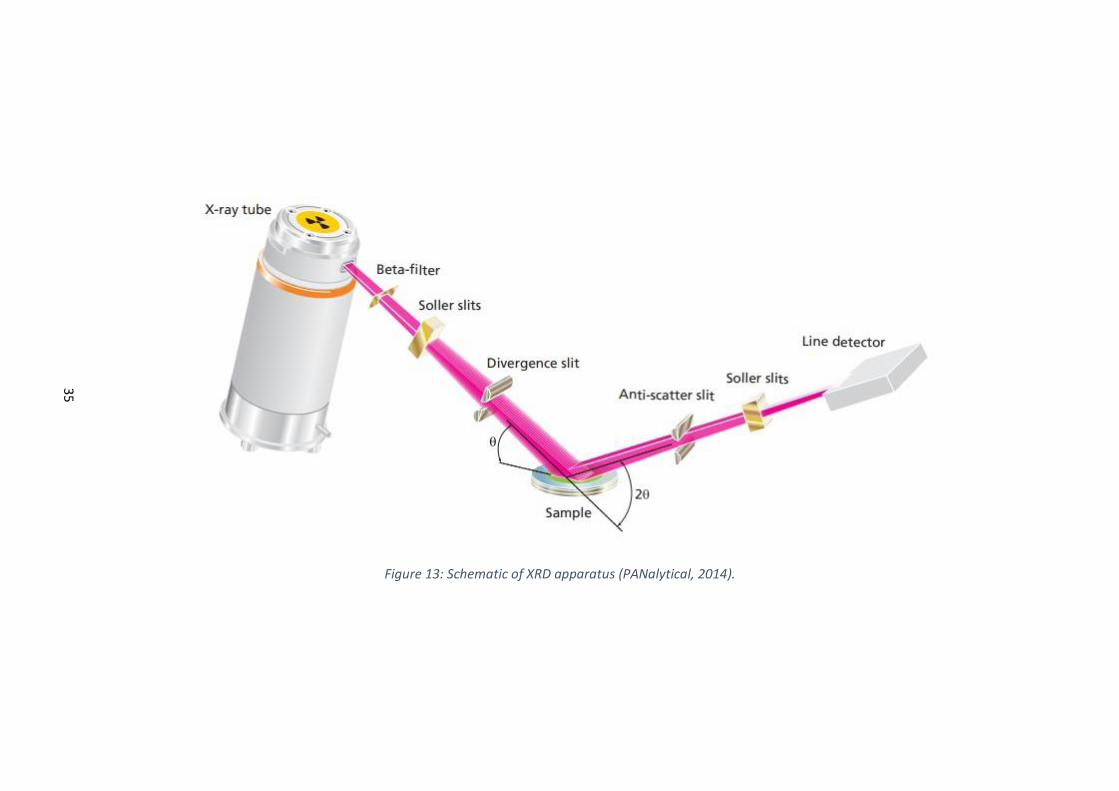
35
Figure 13: Schematic of XRD apparatus (PANalytical, 2014).

36
X-rays emanating from the X-ray tube, reflect off the sample before being detected,
processed and displayed as a diffraction pattern of count rate against angle 2θ.
Figure 14: Schematic illustration of Bragg’s reflection.
X-rays have a wavelength comparable to the lattice spacing; consequently, when
the geometry of the incident X-rays striking the crystal structure of the sample
satisfies the Bragg equation, see Figure 14, constructive interference occurs. Bragg’s
Law relates an integer number, n, of wavelengths of incident electromagnetic
radiation, λ, the diffraction angle, θ, and the lattice spacing of the crystalline
sample, d.
𝑛𝜆 = 2𝑑𝑠𝑖𝑛𝜃
(2)
Equation 2 gives the relation between the angle and the lattice spacing for a fixed
wavelength of X-rays; the lattice spacing is characteristic of the material, enabling
the identification of the sample material.
In an amorphous sample the atoms are arranged randomly so no peaks are
observed. In a crystalline sample the atoms are arranged uniformly in a repetitive
manner; therefore, the above conditions are satisfied. The crystal lattice represents
a repetition of the unit cell, where the unit cell is the smallest group of repeating
atoms required to maintain the three-dimensional pattern of the entire crystal,
illustrated in Figure 15.
37
Figure 15: Illustration of the relationship of a unit cell to the entire crystal lattice. Credit: CK-12 Foundation - Christopher Auyeung; License: CC BY-NC 3.0.
In crystallography, Miller indices form a notation system for the crystal lattice
planes. A given set of planes with indices, h, k, l, cut the x-axis of the unit cell in h
sections, the y-axis in k sections and the z-axis in l sections. The syntax (hkl)
represents the interception of the plane; a zero indicates that the planes are
parallel to the corresponding axis. In a truly random sample, where the orientation
of each grain in a crystalline sample is unrelated to that of its neighbour, the
incident X-rays can diffract from each plane equally. However, in reality preferred
orientation occurs, where the forming process of the crystalline material influences
the arrangement of the crystal structure (Kelly, 1997). Thin films produced using
magnetron sputtering are more susceptible to preferred orientation.
3.3.1 Pawley Refinement
Performing a refinement on diffraction data consists of refining an approximate
model of the crystal structure, so that the diffraction data calculated using the
model structure, resembles the measured data. A Pawley refinement, devised by
Pawley in 1981 is one method of refining diffraction data (Structure Determination
from Powder Diffraction Data, 2006); it enables the determination of reliable cell
parameters whilst classifying intensity as a free parameter. A Pawley refinement
provides values for comparison including Rprofile, Rp, Rweigthed profile, Rwp,
Rexpected, Rexp and Chi square, χ2. Rp is the residual difference between observed
and calculated plots and Rwp uses a weighting function to place more emphasis on
38
good fit between high intensity data points, such as intense peaks, and less
emphasis on low intensity data points, such as background. χ2, sometimes
described as goodness of fit, GOF, is the weighted sum of the squares, of the
difference between calculated and observed diffraction patterns.
χ2 =Rwp
2
Rexp2
(3)

39
4. Fabrication and Analysis of Binary Ti-alloys
The project proposes a fast and economic method for preparing and testing various
metallic alloys, as a primary step to gather preliminary information about the alloys
suitability for the intended application.
Included in this section is: a description of the alloy systems chosen and the reasons
thereof, details of the parameters used during magnetron sputtering, results from
the experimental techniques used to analyse the alloys, such as SEM, EDX, XRD and
alamarBlue® assay, and finally a comparative discussion of the results.
4.1 Alloy Preparation using Magnetron Sputtering
The literature reviewed indicated Mo, Nb and Ta, alongside Ti, as suitable hip
prosthesis material alloying elements; Zr was eliminated due to its lack of impact on
the β-phase of binary Ti-alloys, as discussed in section 1.3.1.4. In order to validate
the methods of fabrication and analysis, Mo, more specifically Ti-15Mo, was
selected to enable comparison with the standard ATI 15Mo™ (UNS R58150). Nb’s
more competitive price, in comparison to Ta, and similarly desirable properties,
resulted in it being chosen for this project. Due to the limited time scale of this
project, three alloy ratios were chosen, 15, 25 and 50, at%, with Ti as the balance, in
order to give a broad indication of how the properties may change with alloy
composition variation.
Magnetron sputtering, described in section 2.2, was used to produce thin film
samples of six binary Ti-alloys, chosen as a result of their favourable properties
described in the literature, with a view to testing both their Young’s modulus and
cytotoxic effect; 50 at% of Nb, Ti-50Nb, 25 at% of Nb, Ti-25Nb, 15 at% of Nb, Ti-
15Nb, 50 at% of Mo, Ti-50Mo, 25 at% of Mo, Ti-25Mo and 15 at% of Mo, Ti-15Mo
at%, with Ti as the balance for all the alloys. The large area rig, incorporating two,
300mm x 100mm, planar unbalanced type II magnetrons, attached on top of the
chamber, facing a rotating substrate holder, was chosen for deposition, shown in
Figure 16 (Ratova et al., 2017b).

40
Figure 16: Photograph of the Large Area Rig at Manchester Metropolitan University.
A Ti target was bolted to one magnetron and either Nb or Mo to the other. Glass
microscope slides, 10mm round glass cover slips and silicon wafer substrates were
attached to the substrate holder using kapton tape, shown in Figure 17. A DC power
supply, dual channel Pinnacle Plus, operating at frequency – 100kHz and Duty –
60% was utilised.
Figure 17: Photographs of the various substrates, attached to the substrate holder using kapton tape, before (left) and after (right) deposition.
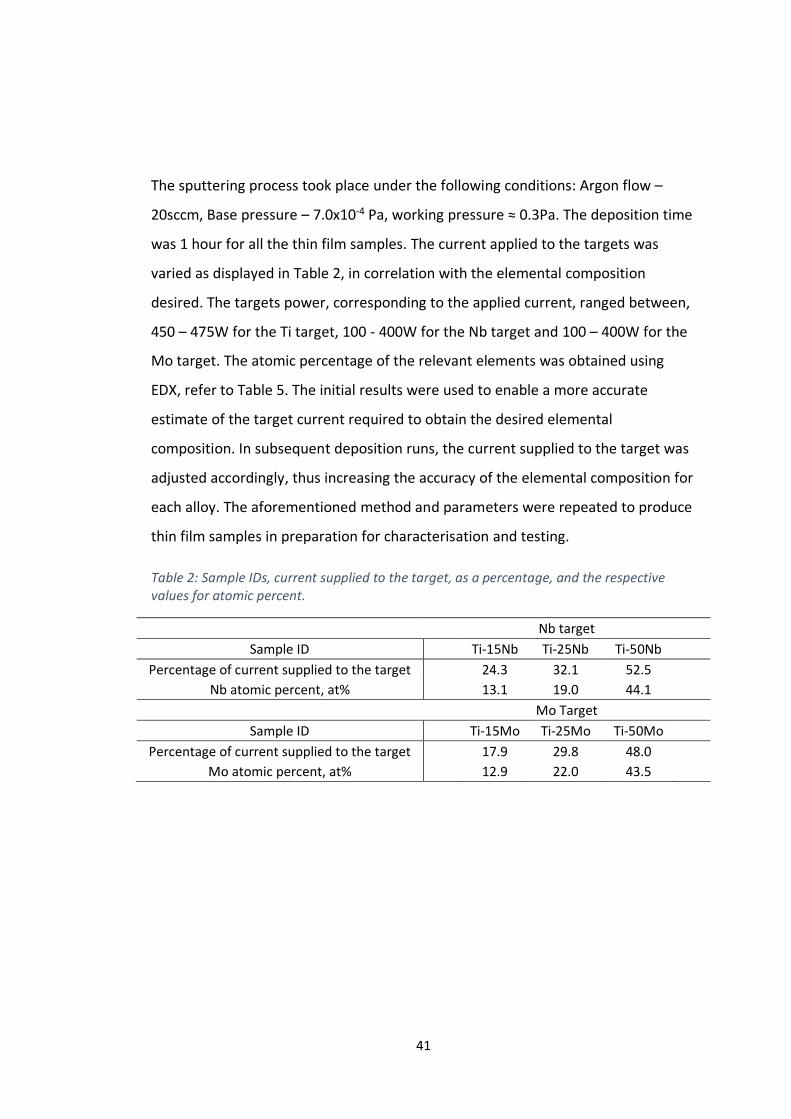
41
The sputtering process took place under the following conditions: Argon flow –
20sccm, Base pressure – 7.0x10⁻⁴ Pa, working pressure ≈ 0.3Pa. The deposition time
was 1 hour for all the thin film samples. The current applied to the targets was
varied as displayed in Table 2, in correlation with the elemental composition
desired. The targets power, corresponding to the applied current, ranged between,
450 – 475W for the Ti target, 100 - 400W for the Nb target and 100 – 400W for the
Mo target. The atomic percentage of the relevant elements was obtained using
EDX, refer to Table 5. The initial results were used to enable a more accurate
estimate of the target current required to obtain the desired elemental
composition. In subsequent deposition runs, the current supplied to the target was
adjusted accordingly, thus increasing the accuracy of the elemental composition for
each alloy. The aforementioned method and parameters were repeated to produce
thin film samples in preparation for characterisation and testing.
Table 2: Sample IDs, current supplied to the target, as a percentage, and the respective values for atomic percent.
Nb target
Sample ID Ti-15Nb Ti-25Nb Ti-50Nb
Percentage of current supplied to the target 24.3 32.1 52.5
Nb atomic percent, at% 13.1 19.0 44.1
Mo Target
Sample ID Ti-15Mo Ti-25Mo Ti-50Mo
Percentage of current supplied to the target 17.9 29.8 48.0
Mo atomic percent, at% 12.9 22.0 43.5
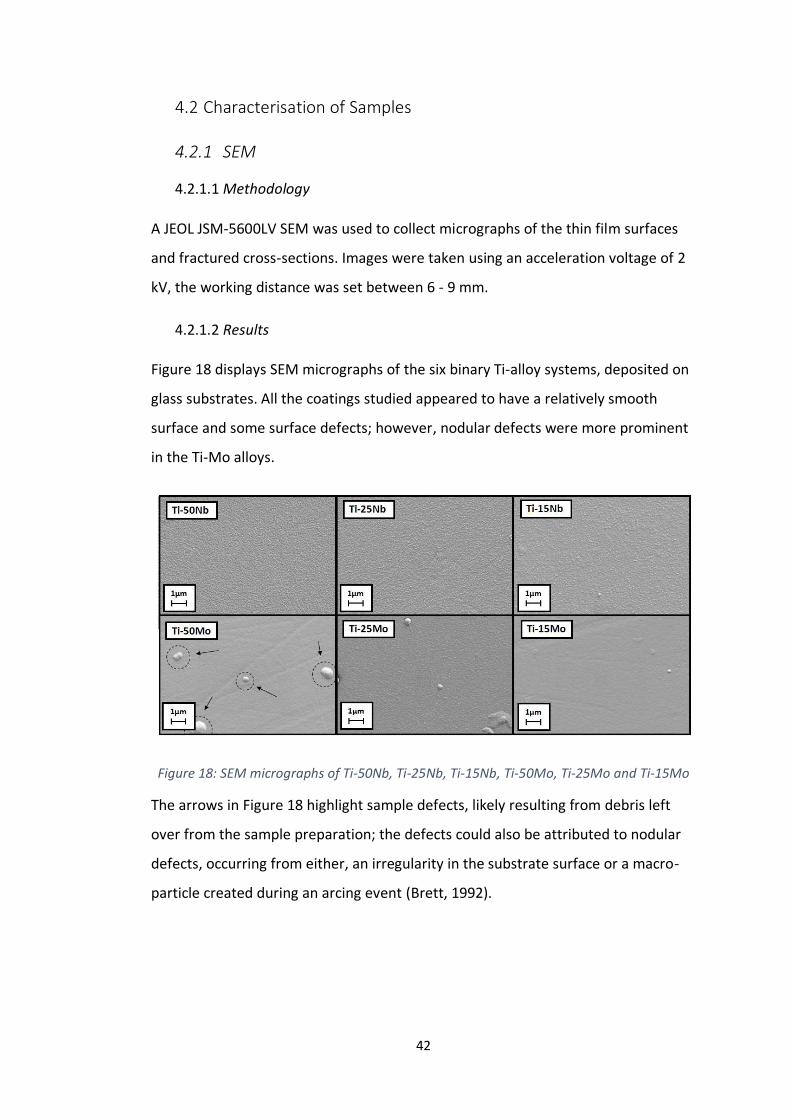
42
4.2 Characterisation of Samples
4.2.1 SEM
4.2.1.1 Methodology
A JEOL JSM-5600LV SEM was used to collect micrographs of the thin film surfaces
and fractured cross-sections. Images were taken using an acceleration voltage of 2
kV, the working distance was set between 6 - 9 mm.
4.2.1.2 Results
Figure 18 displays SEM micrographs of the six binary Ti-alloy systems, deposited on
glass substrates. All the coatings studied appeared to have a relatively smooth
surface and some surface defects; however, nodular defects were more prominent
in the Ti-Mo alloys.
Figure 18: SEM micrographs of Ti-50Nb, Ti-25Nb, Ti-15Nb, Ti-50Mo, Ti-25Mo and Ti-15Mo
The arrows in Figure 18 highlight sample defects, likely resulting from debris left
over from the sample preparation; the defects could also be attributed to nodular
defects, occurring from either, an irregularity in the substrate surface or a macro-
particle created during an arcing event (Brett, 1992).
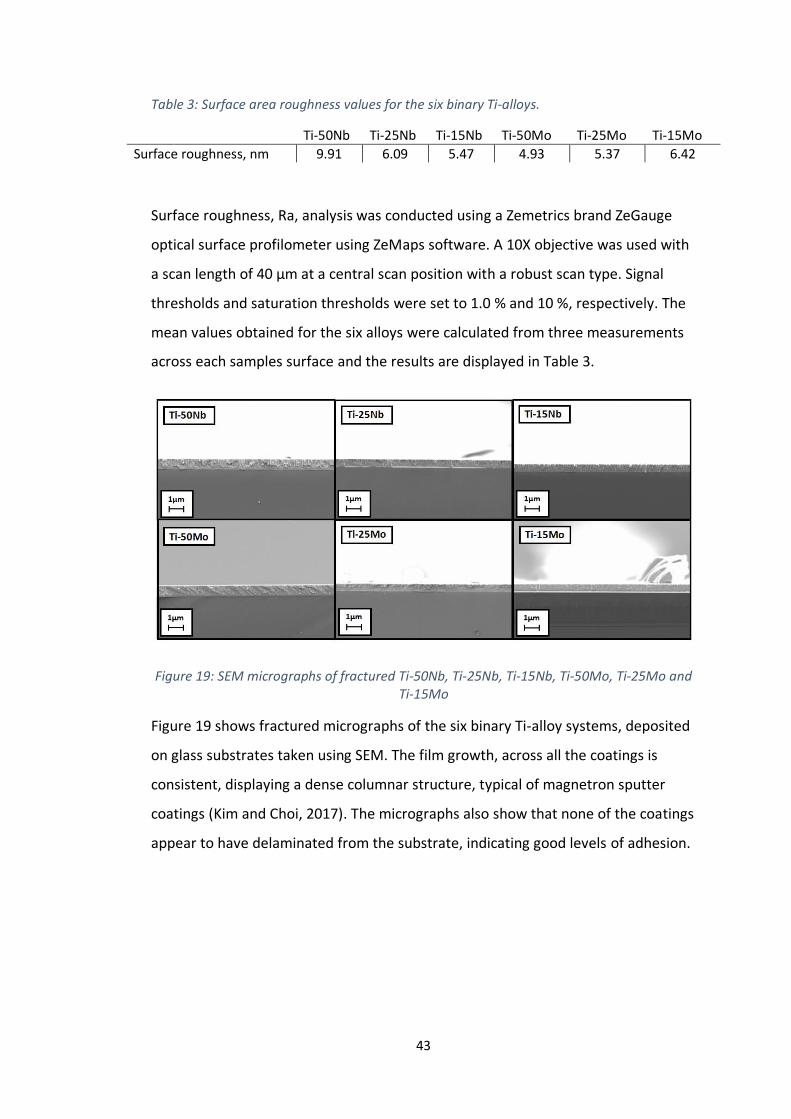
43
Table 3: Surface area roughness values for the six binary Ti-alloys.
Ti-50Nb Ti-25Nb Ti-15Nb Ti-50Mo Ti-25Mo Ti-15Mo
Surface roughness, nm 9.91 6.09 5.47 4.93 5.37 6.42
Surface roughness, Ra, analysis was conducted using a Zemetrics brand ZeGauge
optical surface profilometer using ZeMaps software. A 10X objective was used with
a scan length of 40 µm at a central scan position with a robust scan type. Signal
thresholds and saturation thresholds were set to 1.0 % and 10 %, respectively. The
mean values obtained for the six alloys were calculated from three measurements
across each samples surface and the results are displayed in Table 3.
Figure 19: SEM micrographs of fractured Ti-50Nb, Ti-25Nb, Ti-15Nb, Ti-50Mo, Ti-25Mo and Ti-15Mo
Figure 19 shows fractured micrographs of the six binary Ti-alloy systems, deposited
on glass substrates taken using SEM. The film growth, across all the coatings is
consistent, displaying a dense columnar structure, typical of magnetron sputter
coatings (Kim and Choi, 2017). The micrographs also show that none of the coatings
appear to have delaminated from the substrate, indicating good levels of adhesion.

44
The images enabled the determination of the film thickness for each Ti-alloy,
presented in Table 4. The variations in film thickness, across the alloys, results from
the difference in power used whilst maintaining a constant run time. This variation
in film thickness could be eradicated in subsequent deposition runs by adjusting the
run time.
Table 4: Film thickness determined using SEM.
Ti-50Nb Ti-25Nb Ti-15Nb Ti-50Mo Ti-25Mo Ti-15Mo
Film Thickness, nm 721 521 563 732 533 527
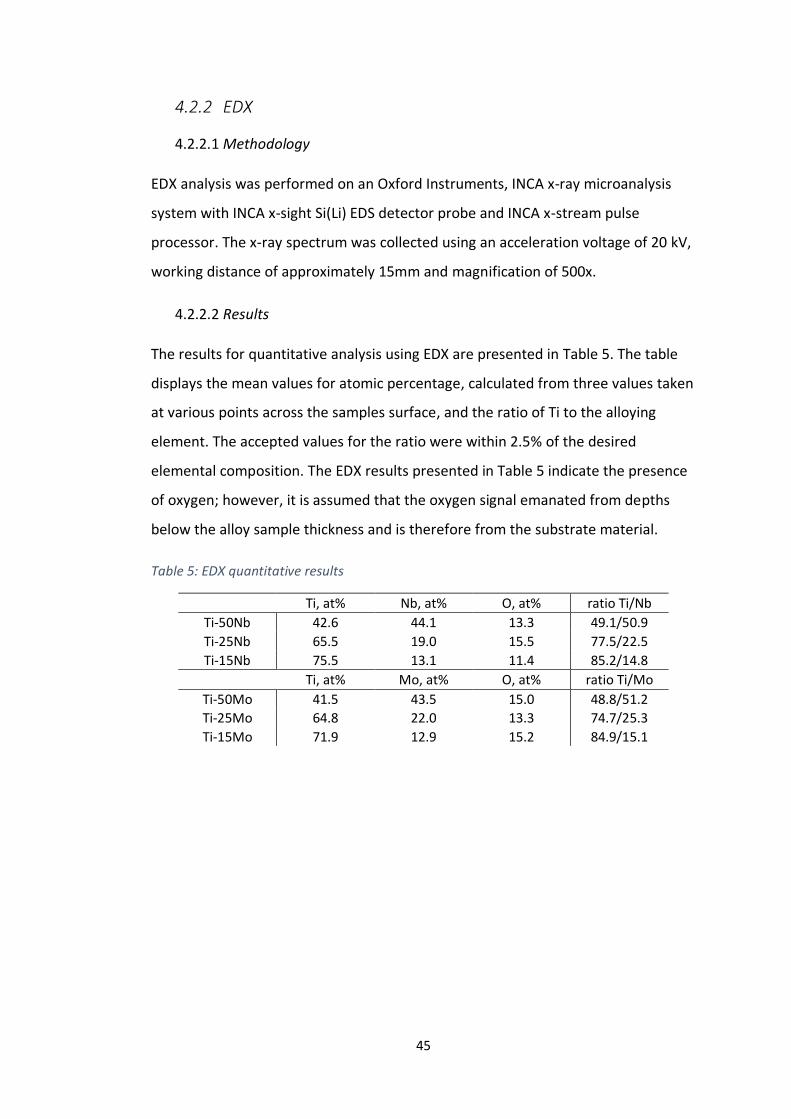
45
4.2.2 EDX
4.2.2.1 Methodology
EDX analysis was performed on an Oxford Instruments, INCA x-ray microanalysis
system with INCA x-sight Si(Li) EDS detector probe and INCA x-stream pulse
processor. The x-ray spectrum was collected using an acceleration voltage of 20 kV,
working distance of approximately 15mm and magnification of 500x.
4.2.2.2 Results
The results for quantitative analysis using EDX are presented in Table 5. The table
displays the mean values for atomic percentage, calculated from three values taken
at various points across the samples surface, and the ratio of Ti to the alloying
element. The accepted values for the ratio were within 2.5% of the desired
elemental composition. The EDX results presented in Table 5 indicate the presence
of oxygen; however, it is assumed that the oxygen signal emanated from depths
below the alloy sample thickness and is therefore from the substrate material.
Table 5: EDX quantitative results
Ti, at% Nb, at% O, at% ratio Ti/Nb
Ti-50Nb 42.6 44.1 13.3 49.1/50.9
Ti-25Nb 65.5 19.0 15.5 77.5/22.5
Ti-15Nb 75.5 13.1 11.4 85.2/14.8
Ti, at% Mo, at% O, at% ratio Ti/Mo
Ti-50Mo 41.5 43.5 15.0 48.8/51.2
Ti-25Mo 64.8 22.0 13.3 74.7/25.3
Ti-15Mo 71.9 12.9 15.2 84.9/15.1

46
4.2.3 XRD
4.2.3.1 Methodology
XRD data was obtained using a PANalytical X’Pert Powder diffractometer (Cu-Kα
radiation, 40 kV voltage, 30 mA current, 0.06 ° step size and 2.64 s step time).
4.2.3.2 Results
The diffraction patterns for the six binary Ti-alloy systems, Ti-50Nb, Ti-25Nb, Ti-
15Nb, Ti-50Mo, Ti-25Mo and Ti-15Mo are presented in Figure 20 and Figures 27 to
32, Appendix A. The main βTi peaks are indicated on Figure 20, although, as a result
of an additional element into the βTi crystal lattice and therefore difference in
atomic radius, an effect on the unit cell parameters is noticeable as the diffraction
peaks have shifted from the standard βTi positions.
Figure 20: Diffraction patterns of binary Ti-alloys.
4.2.3.3 Pawley Refinement
Malvern Panalytical’s Highscore Plus (version 4.6a) was used for all XRD analysis. A
Pawley refinement was performed on the diffraction patterns for all six alloy
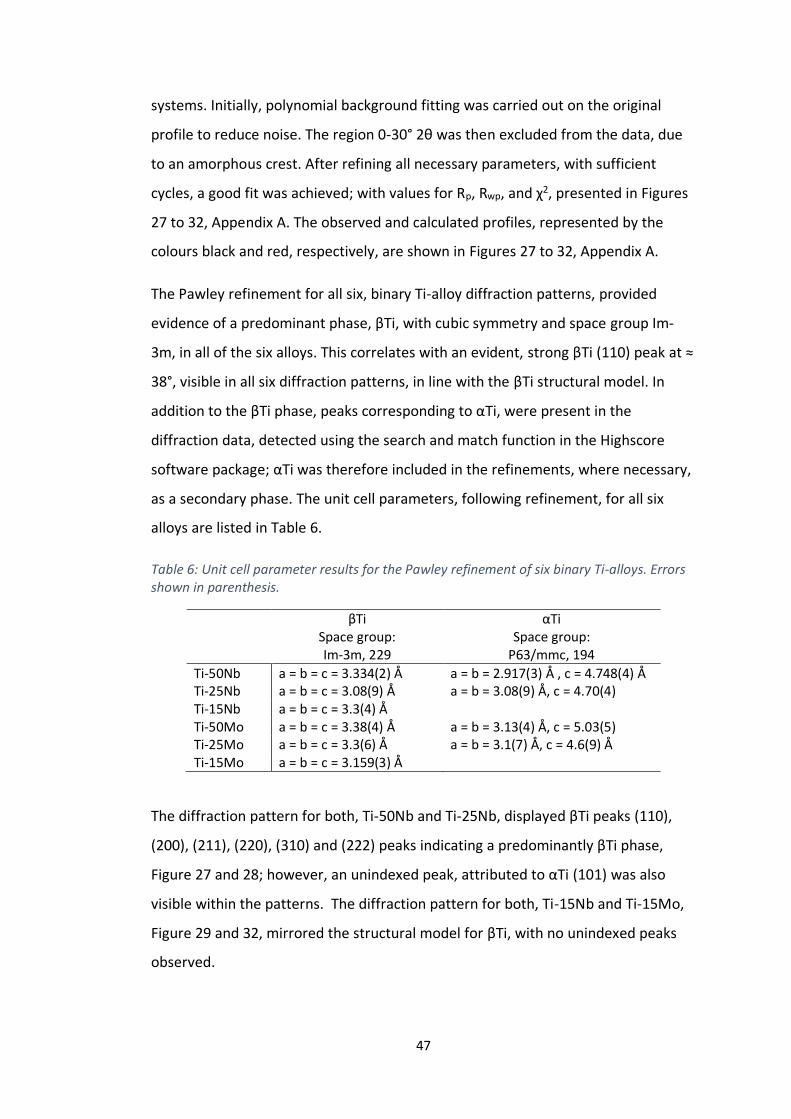
47
systems. Initially, polynomial background fitting was carried out on the original
profile to reduce noise. The region 0-30° 2θ was then excluded from the data, due
to an amorphous crest. After refining all necessary parameters, with sufficient
cycles, a good fit was achieved; with values for Rp, Rwp, and χ2, presented in Figures
27 to 32, Appendix A. The observed and calculated profiles, represented by the
colours black and red, respectively, are shown in Figures 27 to 32, Appendix A.
The Pawley refinement for all six, binary Ti-alloy diffraction patterns, provided
evidence of a predominant phase, βTi, with cubic symmetry and space group Im-
3m, in all of the six alloys. This correlates with an evident, strong βTi (110) peak at ≈
38°, visible in all six diffraction patterns, in line with the βTi structural model. In
addition to the βTi phase, peaks corresponding to αTi, were present in the
diffraction data, detected using the search and match function in the Highscore
software package; αTi was therefore included in the refinements, where necessary,
as a secondary phase. The unit cell parameters, following refinement, for all six
alloys are listed in Table 6.
Table 6: Unit cell parameter results for the Pawley refinement of six binary Ti-alloys. Errors shown in parenthesis.
βTi
Space group: Im-3m, 229
αTi Space group:
P63/mmc, 194
Ti-50Nb a = b = c = 3.334(2) Å a = b = 2.917(3) Å , c = 4.748(4) Å Ti-25Nb a = b = c = 3.08(9) Å a = b = 3.08(9) Å, c = 4.70(4) Ti-15Nb a = b = c = 3.3(4) Å Ti-50Mo a = b = c = 3.38(4) Å a = b = 3.13(4) Å, c = 5.03(5) Ti-25Mo a = b = c = 3.3(6) Å a = b = 3.1(7) Å, c = 4.6(9) Å Ti-15Mo a = b = c = 3.159(3) Å
The diffraction pattern for both, Ti-50Nb and Ti-25Nb, displayed βTi peaks (110),
(200), (211), (220), (310) and (222) peaks indicating a predominantly βTi phase,
Figure 27 and 28; however, an unindexed peak, attributed to αTi (101) was also
visible within the patterns. The diffraction pattern for both, Ti-15Nb and Ti-15Mo,
Figure 29 and 32, mirrored the structural model for βTi, with no unindexed peaks
observed.

48
The binary Ti-alloy, Ti-15Mo, Figure 32, matched the structural model of the βTi
phase, with all peaks present. However, with increasing Mo content, the Ti-25Mo
alloy and increasingly so with the Ti-50Mo alloy, the αTi phase appeared more
prominent, Figure 30 and Figure 31.

49
4.3 Biocompatibility Studies
4.3.1 NIH 3T3s
An evaluation experiment was designed and undertaken using NIH 3T3 cells to
establish the suitability of alamarBlue® when testing metallic thin films; taking
particular interest in the elements Ti, Nb and Mo.
4.3.1.1 Culture of NIH 3T3s
The 3T3 cells, were cultured using DMEM, supplemented with 1% penicillin-
streptomycin, 10% fetal bovine serum and 1% l-glutamine (Lonza, Germany), in T75
Flasks (Thermo Fisher Scientific, USA).
4.3.1.2 alamarBlue® assay
The experiment was conducted using two alloy systems, Ti-50Nb and Ti-50Mo, with
media only as a control; the 3T3 cells were seeded at a density of 5000 cells per
well (48 well plates; Thermo Fisher Scientific, USA). The plates were then incubated
at 37°C and 5% CO2 for 24 hours. After 24 hours culturing, alamarBlue® solution
(Thermo Fisher Scientific, USA) was added to each well before incubation for 90
minutes. 100μl medium samples were transferred, in triplicate, into a 96-well plate
(Thermo Fisher Scientific, USA), then the fluorescence measured, using a Synergy
HT plate reader, with fluorescence excitation wavelength of 530nm and
fluorescence emission at 590nm.
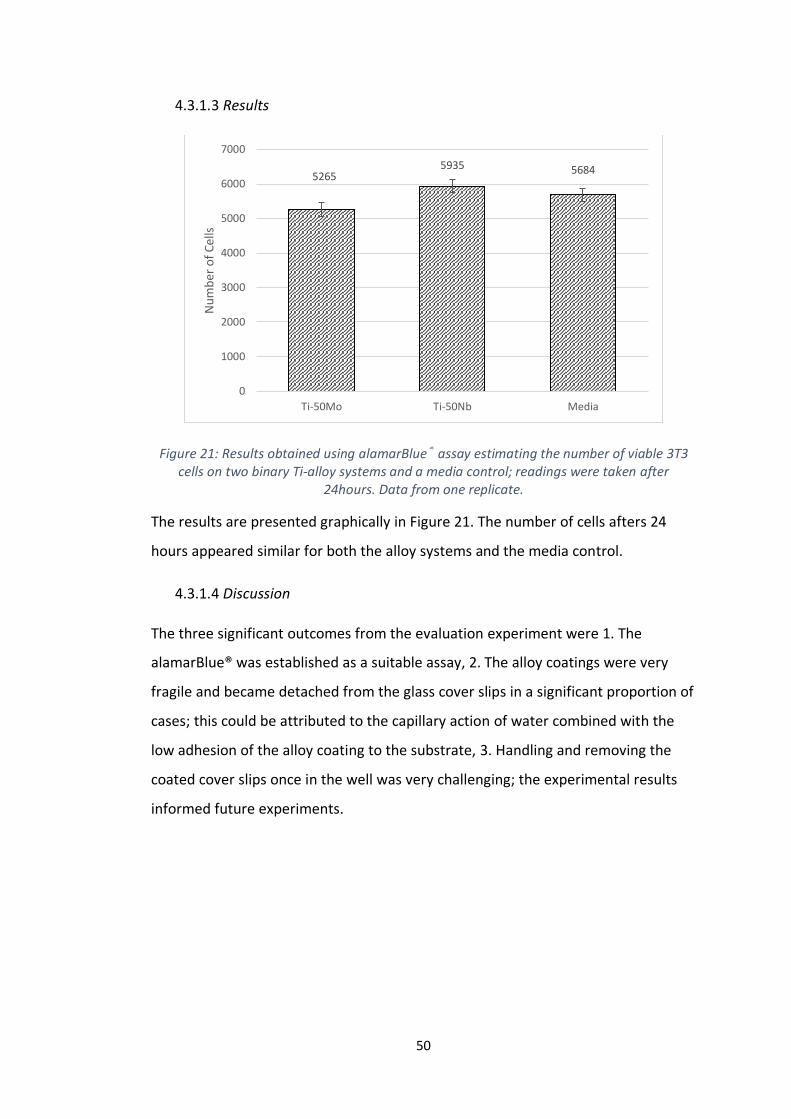
50
4.3.1.3 Results
Figure 21: Results obtained using alamarBlue® assay estimating the number of viable 3T3 cells on two binary Ti-alloy systems and a media control; readings were taken after
24hours. Data from one replicate.
The results are presented graphically in Figure 21. The number of cells afters 24
hours appeared similar for both the alloy systems and the media control.
4.3.1.4 Discussion
The three significant outcomes from the evaluation experiment were 1. The
alamarBlue® was established as a suitable assay, 2. The alloy coatings were very
fragile and became detached from the glass cover slips in a significant proportion of
cases; this could be attributed to the capillary action of water combined with the
low adhesion of the alloy coating to the substrate, 3. Handling and removing the
coated cover slips once in the well was very challenging; the experimental results
informed future experiments.
52655935 5684
0
1000
2000
3000
4000
5000
6000
7000
Ti-50Mo Ti-50Nb Media
Nu
mb
er o
f C
ells

51
4.3.2 hMSCs
The experiment consisted of two parts, the alamarBlue® assay, to access the cell
metabolic activity in the presence of the sample, and SEM analysis, to visualise the
quality of the cells grown. To prevent loss of the detached coating it was necessary
to perform the experiment without changing the media, ensuring the cells were
exposed to a pre-ordained sample size. This decision was the preferred option to
ensure the validity of the results; although, cell proliferation with time would
diminish due to limited nutrients.
4.3.2.1 Culture of hMSCs
hMSCs (Lonza, Germany), were resurrected from liquid nitrogen storage, then
cultured using mesenchymal stem cell basal medium, MSCBM, supplemented with
10% mesenchymal stem cell growth supplement, 2% l-glutamine and 1% GA-1000
(Lonza, Germany), in T75 flasks (Thermo Fisher Scientific, USA). All the cells in this
study were used at passage 4.
4.3.2.2 alamarBlue® assay
The alloy samples were placed in wells before the addition of cells at a seeding
density of 5000 cells per well (48 well plates; Thermo Fisher Scientific, USA). To
ensure the cells remained in contact with the sample, 70μL of cell suspension,
containing the desired seeding density, was carefully placed on top of the samples,
and then incubated for 30 minutes before the remaining media was added. Samples
underwent culture for 7 days; after 1, 3 and 7 days, 10% alamarBlue® solution
(Thermo Fisher Scientific, USA) was added to each well before incubation for 90
minutes. 100μl medium samples were transferred, in triplicate, into a 96-well plate
(Thermo Fisher Scientific, USA), then the fluorescence measured, using a Synergy
HT plate reader, with fluorescence excitation wavelength of 530nm and
fluorescence emission at 590nm.
4.3.2.3 Methodology for Statistical Analysis
The data collected, calculated using alamarBlue® fluorescence, for the number of
cells per time point and Ti-alloy composition, was statically analysed using IBM SPSS

52
statistics software (version 24); the statistical significance was defined as p < 0.05.
All experiments were repeated at least three times. The data was first tested for
normality using the Kolmogorov-Smirnov test (Ennos, 2012). A two-way ANOVA test
was selected to carry out further statistical analysis (Ennos, 2012). Finally, the Post
hoc tests, Tukey and Dunnett’s, were used to compare the significance, in the
number of cells, between groups, between time points, and to compare all the
groups against the control, respectively (Ennos, 2012).
4.3.2.4 SEM Sample Preparation
SEM investigation was performed to further assess the hMSCs proliferation and
morphology. The samples for SEM analysis were placed in wells (6 well plates;
Thermo Fisher Scientific, USA), with a seeding density of 5000 cells per well. The
difficulty in handling the samples was overcome through the use of larger wells,
enabling better access and the removal of samples without causing damage. Alike
the method adopted for the alamarBlue® samples, 70 μL of cell suspension was
added and the samples incubated for 30 minutes before the remaining media was
added. The hMSCs were cultured on top of the six binary alloys for 1 , 3 and 7 days.
Following culture, the cells were fixed with 3% glutaraldehyde solution in
phosphate buffered saline, PBS (Thermo Fisher Scientific, USA), for 24 hours. The
cells were then washed with PBS and an ethanol gradient (20%, 40%, 60%, 80% and
2 × 100% ethanol) to dehydrate the cells. The samples were placed in a desiccator
overnight. Finally, the samples were coated with Au, using a Polaron sputter coating
system prior to SEM analysis. A JEOL JSM-5600LV SEM was used to collect
micrographs of hMSCs cultured on the six binary Ti-alloys.
4.3.2.5 Results
The kolmogorov-Smirnov test produced the result p > 0.05, therefore the
distribution was not significantly different from the normal distribution, enabling
data analysis using parametric tests.
The two-way ANOVA showed that the number of cells increased significantly with
both the time point (F = 69.9) and the type of alloy (F = 3.016), however there was
not a significant interaction between the time point and the type of alloy. The
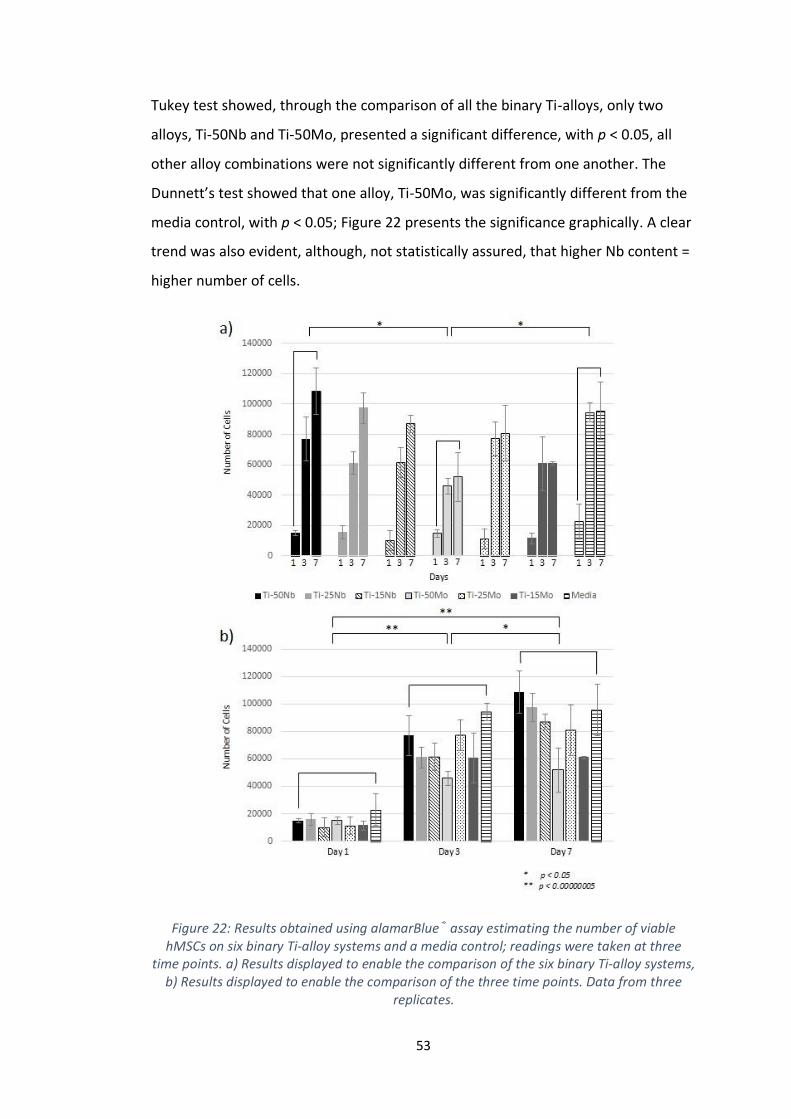
53
Tukey test showed, through the comparison of all the binary Ti-alloys, only two
alloys, Ti-50Nb and Ti-50Mo, presented a significant difference, with p < 0.05, all
other alloy combinations were not significantly different from one another. The
Dunnett’s test showed that one alloy, Ti-50Mo, was significantly different from the
media control, with p < 0.05; Figure 22 presents the significance graphically. A clear
trend was also evident, although, not statistically assured, that higher Nb content =
higher number of cells.
Figure 22: Results obtained using alamarBlue® assay estimating the number of viable hMSCs on six binary Ti-alloy systems and a media control; readings were taken at three
time points. a) Results displayed to enable the comparison of the six binary Ti-alloy systems, b) Results displayed to enable the comparison of the three time points. Data from three
replicates.
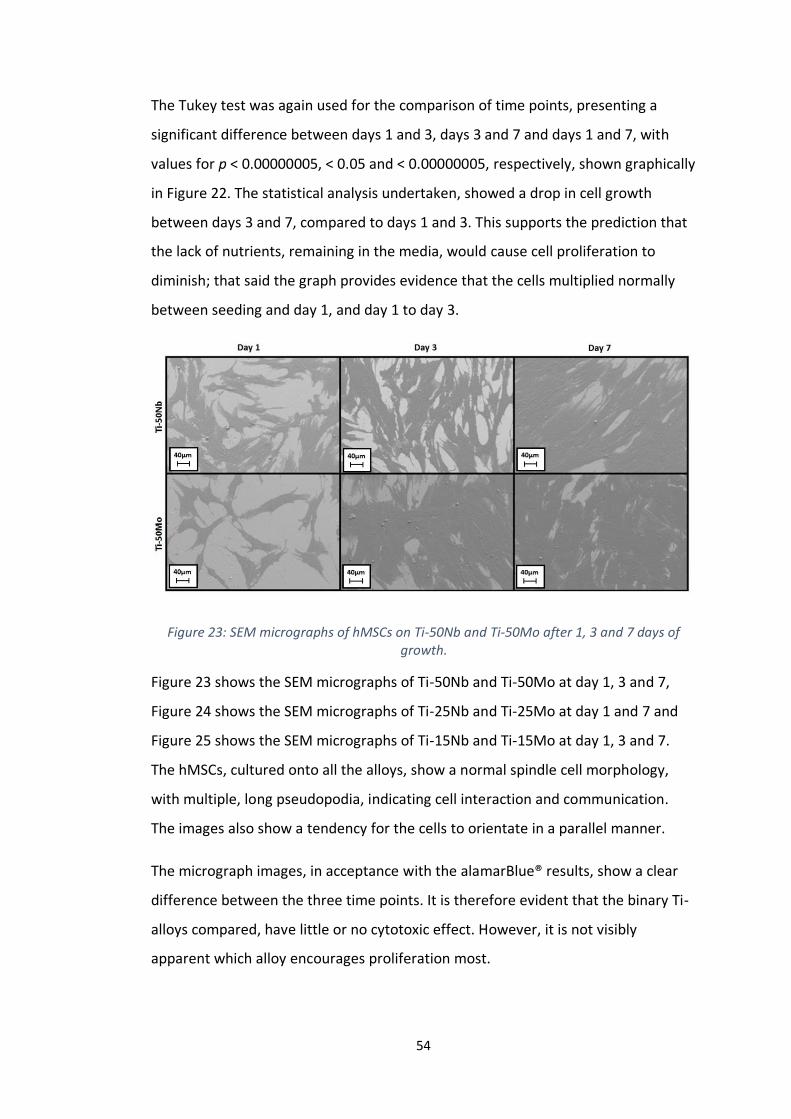
54
The Tukey test was again used for the comparison of time points, presenting a
significant difference between days 1 and 3, days 3 and 7 and days 1 and 7, with
values for p < 0.00000005, < 0.05 and < 0.00000005, respectively, shown graphically
in Figure 22. The statistical analysis undertaken, showed a drop in cell growth
between days 3 and 7, compared to days 1 and 3. This supports the prediction that
the lack of nutrients, remaining in the media, would cause cell proliferation to
diminish; that said the graph provides evidence that the cells multiplied normally
between seeding and day 1, and day 1 to day 3.
Figure 23: SEM micrographs of hMSCs on Ti-50Nb and Ti-50Mo after 1, 3 and 7 days of growth.
Figure 23 shows the SEM micrographs of Ti-50Nb and Ti-50Mo at day 1, 3 and 7,
Figure 24 shows the SEM micrographs of Ti-25Nb and Ti-25Mo at day 1 and 7 and
Figure 25 shows the SEM micrographs of Ti-15Nb and Ti-15Mo at day 1, 3 and 7.
The hMSCs, cultured onto all the alloys, show a normal spindle cell morphology,
with multiple, long pseudopodia, indicating cell interaction and communication.
The images also show a tendency for the cells to orientate in a parallel manner.
The micrograph images, in acceptance with the alamarBlue® results, show a clear
difference between the three time points. It is therefore evident that the binary Ti-
alloys compared, have little or no cytotoxic effect. However, it is not visibly
apparent which alloy encourages proliferation most.

55
Figure 24: SEM micrographs of hMSCs on Ti-25Nb and Ti-25Mo after 1 and 3 days of growth.
Figure 25: SEM micrographs of hMSCs on Ti-15Nb and Ti-15Mo after 1, 3 and 7 days of growth.

56
Figure 26: High-magnification SEM micrographs of hMSCs on various Ti-alloys. a) hMSC mitosis on Ti-25Nb, b) morphology of a single cell on Ti-15Mo, c) nucleus of a hMSC on Ti-
15Nb and d) early stages of apoptosis of a hMSC on Ti-15Nb.
Figure 26 displays SEM micrographs of individual hMSCs. Figure 26 a) shows the
formation of the cleavage furrow, represented by the dashed line, this provides
evidence that the cell was undergoing mitosis. Mitosis consist of four stages,
prophase, metaphase, anaphase and telophase; the cell presented in Figure 26 a)
shows the telophase stage of the process, shortly before the two daughter cells
divide completely. Figure 26 b) shows a single hMSC with multiple pseudopodia,
highlighted by arrows. The arrow and highlighted area in Figure 26 c) shows the
cell’s clearly defined nucleus. In Figure 26 d) the cell morphology is beginning to
resemble that of an early apoptotic cell, the circled region indicates an apoptotic
body (Elmore, 2007). To determine if this is the case, further in vitro studies would
need to be performed; this would give an indication of the number of cells
undergoing morphological changes towards cell death versus the number of viable
cells. It is also important to consider the cells dependence on sufficient nutrients
and the possible effect of the lack of nutrients in this study, discussed earlier in this
section.

57
4.4 Discussion
Thin film samples deposited using magnetron sputtering, commonly exhibit
preferred orientation, indicated by variations in the relative intensity of the
diffraction peaks or even the absence of certain peaks from the diffraction pattern
(Kelly, 1997; Lee and Lee, 1996). A Pawley refinement reliably refines cell
parameters but classifies intensity as a free parameter. The XRD diffraction patterns
and subsequent Pawley refinements conducted in this thesis, see Figures 27 - 32,
Appendix A, showed that all six alloys have a predominantly β-phase structure;
identifiable by the strong peak at ≈ 38° in all the XRD diffraction patterns. The
Pawley refinement also suggested the introduction of a two phase structure at the
two higher alloying concentrations, 25 at% and 50 at%, in both the binary Ti-alloy
systems investigated. Further investigations into the possible presence of
transitional phases such as the non-compact hexagonal ω, hexagonal α’ and
orthorhombic α”, would be beneficial but are beyond the remit of this thesis
(Bönisch et al, 2013; Hickman, 1969; Kolli, 2018; Liu, 2018; Trinkle, 2003). At lower
concentrations, the alloy was likely to be a substitutional solid solution, where an
atom of one element, was substituted randomly by an atom of a different element,
resulting in one crystal phase, in this case βTi. However, at higher concentrations, it
appears likely that the structure became saturated and the difference in atomic size
resulted in stress occurring within the crystal lattice, this induced stress then
caused a re-ordering of the structure and ultimately, the introduction of a
secondary phase. Magnetron sputtering is a nonthermal equilibrium technique
(Adachi, 2012), where the atoms arriving at the substrate deliver a relatively large
amount of energy to the film’s surface, through atom bombardment, which is
sufficient to form the βTi phase. This energy rapidly dissipates resulting in
extremely fast cooling and the freezing of the crystal structure; as a consequence
higher atom packing, in substitutional solid solutions, is possible compared with
equilibrium techniques (Liu et al, 2018; Musil and Bell, 1996). In support of this
theory, Bates and Arnell found high levels of solid solubility when investigating the
microstructure of three binary Al-alloy systems (Bates and Arnell, 1997). Liu et al
prepared Ti-17 alloy films by magnetron sputtering and established that with a

58
substrate temperature of 125 °C, considerably lower than the β-transus
temperature for pure Ti, 882 °C, the structure was entirely metastable β-phase. By
altering the substrate temperature a dual phase system was established; the
increase in substrate temperature transfers energy to the once immobile atoms
enabling them to diffuse through the thin film. Lui et al also describe the phase
structure as metastable β-phase, due to the non-thermal preparation technique
and the instability of the structure if subjected to thermal or mechanical processing
(Liu et al, 2018). The thin film alloys prepared in this thesis would also be classified
as having metastable β-phase structures (Kolli, 2018).
Researchers have investigated the relationship between microstructure and
mechanical properties of thin films deposited by magnetron sputtering,
incorporating nano-indentation methods to calculate the Young’s modulus. Many
studies have shown that β-phase Ti-alloys have a low Young’s modulus in
comparison to α, near-α and α + β Ti-alloys (Niinomi et al., 2012). Unfortunately, for
this thesis the nano-indentation equipment required for testing was not available,
although, the literature suggests that the binary Ti-alloys investigated would have a
relatively low Young’s modulus because of their evident β-phase, bcc structure.
Marker et al used DFT to predict the Young’s modulus for five binary Ti-alloy
systems, Ti-X (X = Mo, Nb, Ta, Zr, Sn), with bcc lattice structure. The authors
calculated values of Young’s modulus for Ti-50Nb, Ti-25Nb, Ti-13Nb, Ti-50Mo, Ti-
25Mo and Ti-13Mo wt%, equal to 86 ± 10 GPa, 63 ± 13 GPa, 31 GPa, 138 ± 19 GPa,
84 ± 15 GPa and 65 GPa, respectively (Marker et al., 2018). Kim et al investigated
the surface morphologies, surface roughness, electrical, and nano-mechanical
properties of binary Ti-alloy thin films, annealed at various temperatures (Kim and
Choi, 2017). Achache et al investigated the effect of deposition pressure and
negative bias voltage on the morphology, microstructure, texture, mechanical
properties and super-elastic effect of thin films, Ti-Nb-Zr-Ta, deposited using
magnetron sputtering. Cui et al studied the mechanical and tribological properties
of Ti-doped diamond-like carbon films, deposited on Si substrates at room
temperature by magnetron sputtering (Cui et al., 2012). The literature provides
evidence that nano-indentation would be a suitable technique for the
59
determination of the Young’s modulus; however it should be considered that thin
films may exhibit different and incomparable elastic behaviour from that of bulk
materials as a result of the effects of the structure, surface and substrate (Shi et al.,
1997).
The EDX results suggest the presence of oxygen in the alloys; however, it should be
noted that the EDX spectrum produced also suggested the presence of silicon. The
signal recorded originates from penetration depths of around 1-2 μm. The thin films
produced in this thesis were of thickness < 1 μm, so it is reasonable to assume that
a considerable proportion of the X-ray spectrum observed emanated from the
substrate material (Whiteside et al, 2016).
Exposure of Ti, and its alloys, to air results in the formation of a thin oxide layer
(Milosev et al., 2000). The oxide layer, of a few nanometres, is responsible for the
material’s bio-inert and corrosion resistant behaviour (Beutner et al., 2010).
Research has focused on the formation of an increased oxide layer to act as a
barrier layer between the body fluids and the base alloy (Browne and Gregson
1994; Sing Ng et al., 2005; Masahashi et al., 2012). Satoh et al proposed a plasma-
oxidation technique, as an alternative to thermal or anodic oxidation methods, for
Ti–6Al–4V, in order to suppress the elution of toxic alloying elements into the
human body, in the case of this study Al and V; whilst increasing the alloys
corrosion resistance. The investigations found that without treatment, the alloy
possessed an oxide layer in the single nanometres, and the post treatment oxide
layer was approximately 50nm. The authors conclude that the plasma process
yields an oxide layer with better barrier properties than that fabricated by the
thermal process (Satoh et al., 2013). This study and numerous others demonstrate
the importance of an oxide layer, which forms a barrier that reduces the likelihood
of metallic ions being released, especially when alloying elements that may cause
undesirable consequences are used. Further analytical studies, such as argon ion
etching prior to X-ray photoelectron spectroscopy, XPS, could be used to determine
the thickness of the oxide layer, alongside the distribution of alloying elements in
the oxide layer, for the samples produced in this thesis.

60
Recently, research has focused on the effect the oxide layer has on cell proliferation
and differentiation (Santiago-Medina et al., 2014; Chiang et al., 2009; Yang and
Huang, 2010), with some studies investigating whether the oxide layer could be
enhanced further to encourage cell proliferation and differentiation. Santiago-
Medina et al suggest that TiO2 is a bioactive factor but speculate whether a reaction
between the TiO2 and the culture medium may result in the release of oxygen and
therefore encourage osteoblast differentiation (Santiago-Medina et al., 2015).
Further investigations are necessary to determine whether this is the case, as TiO2
could behave differently within the human body.
The results obtained from the alamarBlue® assay using hMSCs showed a higher cell
number and therefore proliferation with increasing content of Nb, Figure 22; one
possible explanation for this is that the increase in surface roughness with
increasing Nb content supported cell growth, see Figure 18 and Table 3. However,
in contrast, many studies have shown a decrease in cell number with surface
roughness. Martin et al prepared samples for culture with MG63 cells, using grade
2, un-alloyed Ti (ASTM F67), with differing surface roughness values, the study
concluded that, although difficult to access, the surface roughness and topography
inhibited cell replication, displaying decreased cell number, and possibly cell
adhesion (Martin et al., 1995). Lincks et al studied the effect of surface roughness of
cpTi and Ti-6Al-4V on MG63 cells; a significant difference was not observed when
comparing the smooth surface and rough surface between each sample (Lincks et
al., 1998). Another study, performed on the effects of surface texture of Ti-6Al-4V
on the interaction with human osteo-sarcoma, cells, showed enhanced orientation
and attachment with higher surface roughness (Chen et al., 2007). Rosa and Beloti,
assessed the proliferation of human bone marrow cells, cultured onto commercially
pure Ti samples with different surface roughness values. They found that the cell
population doublings, and therefore proliferation, decreased with an increase in
surface roughness. Rosa and Beloti hypothesise that the degree of osteoblastic
differentiation may alter the cells preference with regard to surface roughness
(Rosa and Beloti, 2003). The surface roughness values obtained in this thesis are of
the nano-scale, in contrast, the results obtained in the literature are all of the
61
micro-scale; therefore, it is reasonable to assume that such minor variations in
surface roughness would not affect cell growth. More recently, Medda et al studied
the response of hMSCs to gold nano-patterned, Ti-40Nb alloys. The findings show
that the overall cell number, as well as cell confluence, on the nano-patterned
surface is lower compared to the non-patterned surface (Medda et al., 2014).
However, the surfaces produced, with nanoparticles of approximately 5nm and
average inter-particle distance of 68±13 nm, is not directly comparable with the
approximately uniform surfaces produced in this thesis. In addition, the various
techniques used to change the surface topography may also have an impact on the
surface composition; therefore, it cannot be clarified whether changes in surface
chemistry or roughness, or a combined effect of both, underlie the cell responses.
Eisenbarth et al studied the biocompatibility of β-stabilising elements. The authors
conclude that the viability of both cell types tested, murine calvaria osteoblast-like
cells and bovine aortic endothelial cells, were strongly affected by Mo, and
ultimately Mo should not be used, at least in large quantities, as a β-stabiliser. The
authors did not elaborate on the amount of Mo that constitutes a large quantity
(Eisenbarth et al., 2004). In agreement, the statistical analysis performed on the
results obtained from the alamarBlue® assay using hMSCs showed a significant
difference, p <0.05, between both the Ti-50Mo alloy and the Ti-50Nb alloy, and the
Ti-50Mo alloy and the media control, Figure 22. The SEM micrographs, Figure 23,
provide very little visual evidence of a reduced cell number, and the cells appear to
be at a similar confluence to that of all the other alloys; that being said a difference
in growth pattern is noticeable; the cells appear less elongated with no noticeable
growth orientation. This sporadic growth pattern could be due to the
environmental impact created by the discussed toxicity of Mo at high
concentrations. The cell morphology and growth, shown in Figures 23 - 25,
appeared consistent across all the other Ti-Mo and Ti-Nb alloys, suggesting very
little or no toxicity in binary Ti-Mo alloys with Mo content less than 25 at% and no
toxicity in binary Ti-Nb alloys.
62
5. Conclusion
The method proposed enabled the fabrication and characterisation of six binary Ti-
alloys. Following fabrication, it was possible to determine the alloys crystal phase
structure and elemental composition using XRD and EDX, respectively.
Biocompatibility studies using alamarBlue® with hMSCs were performed to assess
the alloys’ cytotoxicity. Further testing of the alloys Young’s modulus using nano-
indentation would have been advantageous in deciding the most suitable alloy
system from the six chosen; unfortunately, the nano-indentation equipment was
not available. Fundamentally, to perform as a suitable hip replacement material, an
alloy should possess both a low Young’s modulus and no cytotoxicity. The research
completed in this project shows that this method of fabrication and analysis is a
time and cost efficient method that enables the initial determination of these
essential properties.
5.1 Future Work
The method employed to fabricate and characterise the binary Ti-alloys is not
restricted to only binary Ti-alloys and could be applied to many different alloy
systems, including ternary and quaternary Ti-alloys; this would enable systematic
testing of a wide range of alloys, intended as implant materials, based on the
fundamental properties needed to succeed, a low Young’s Modulus and excellent
biocompatibility, before the initiation of further testing. Successively, reactive
magnetron sputtering could be used to produce oxide layers of various thicknesses
without jeopardising the alloys composition or properties. Other characterisation
techniques, such as XPS, post argon etching to determine the thickness of the oxide
layer and the concentration of the other alloying elements at the surface,
wettability studies (Ratova et al., 2017a), for an insight into the effect the surface’s
hydrophilic nature has on cellular response, and nano-indentation testing, to
experimentally determine the Young’s modulus of the alloys, providing a greater
understanding of the materials properties and the relationship it would have with
the body’s environment.
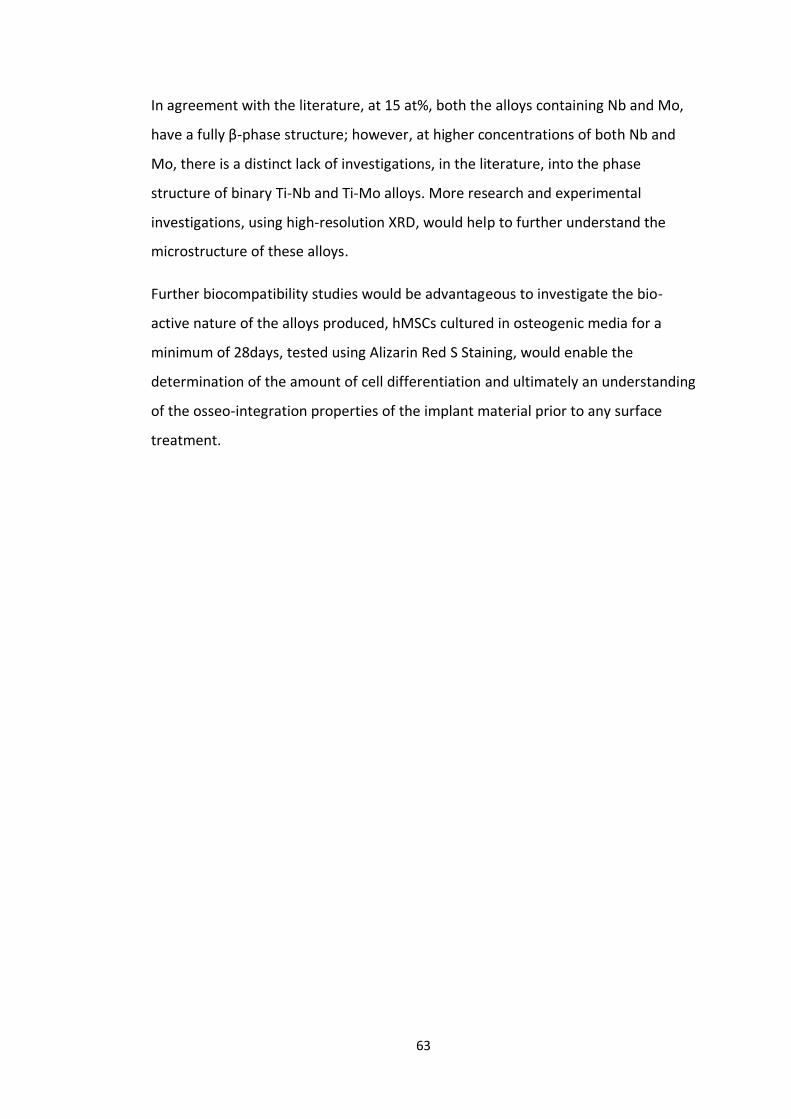
63
In agreement with the literature, at 15 at%, both the alloys containing Nb and Mo,
have a fully β-phase structure; however, at higher concentrations of both Nb and
Mo, there is a distinct lack of investigations, in the literature, into the phase
structure of binary Ti-Nb and Ti-Mo alloys. More research and experimental
investigations, using high-resolution XRD, would help to further understand the
microstructure of these alloys.
Further biocompatibility studies would be advantageous to investigate the bio-
active nature of the alloys produced, hMSCs cultured in osteogenic media for a
minimum of 28days, tested using Alizarin Red S Staining, would enable the
determination of the amount of cell differentiation and ultimately an understanding
of the osseo-integration properties of the implant material prior to any surface
treatment.

64
Appendix A
Figure 27: Observed and calculated profiles for the Pawley refinement of Ti-50Nb.The final agreement factors were Rp = 5.712%, Rwp = 7.565% and χ2 = 2.233. The second graph is the difference plot.
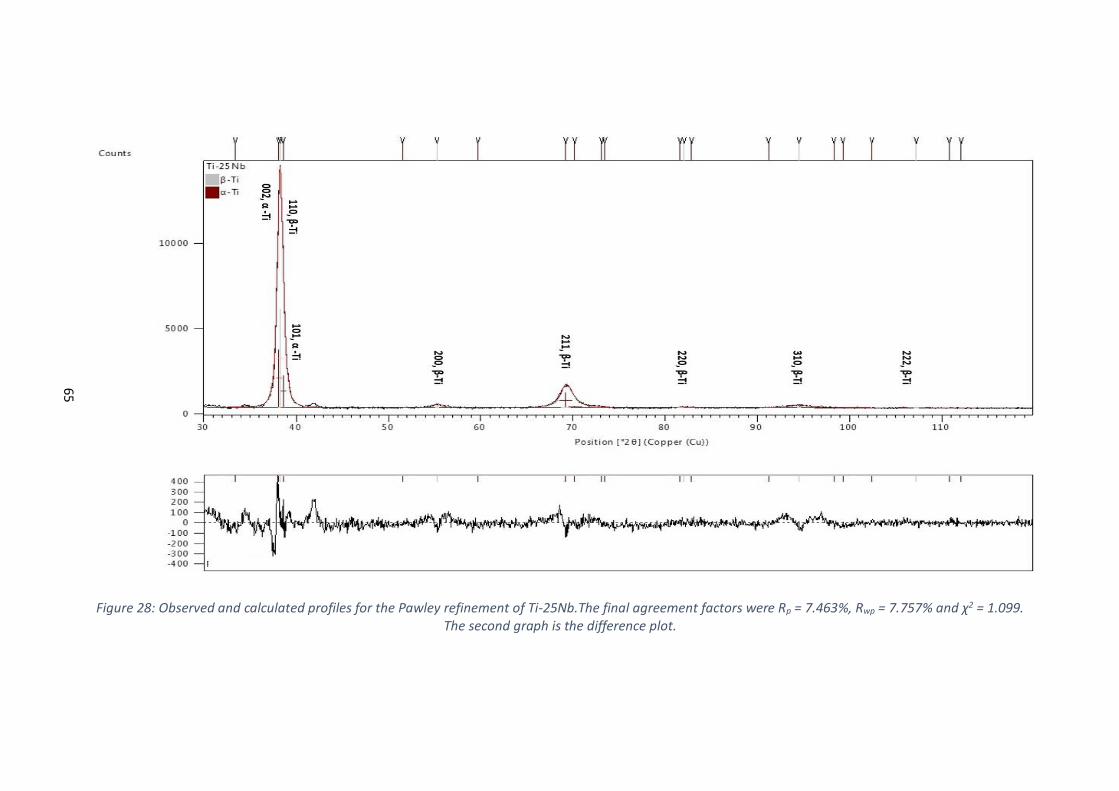
65
Figure 28: Observed and calculated profiles for the Pawley refinement of Ti-25Nb.The final agreement factors were Rp = 7.463%, Rwp = 7.757% and χ2 = 1.099. The second graph is the difference plot.
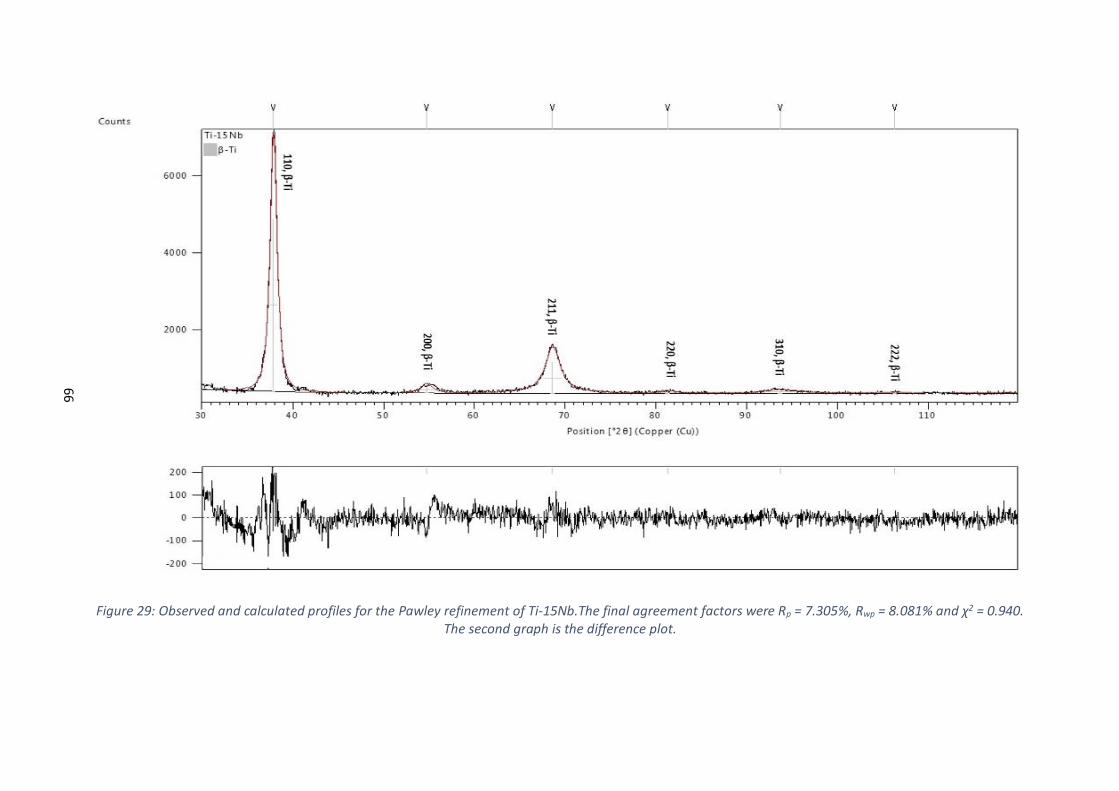
66
Figure 29: Observed and calculated profiles for the Pawley refinement of Ti-15Nb.The final agreement factors were Rp = 7.305%, Rwp = 8.081% and χ2 = 0.940. The second graph is the difference plot.

67
Figure 30: Observed and calculated profiles for the Pawley refinement of Ti-50Mo.The final agreement factors were Rp = 7.079%, Rwp = 9.159% and χ2 = 2.597. The second graph is the difference plot.
68
Figure 31: Observed and calculated profiles for the Pawley refinement of Ti-25Mo.The final agreement factors were Rp = 7.566%, Rwp = 8.808% and χ2 = 1.260. The second graph is the difference plot.
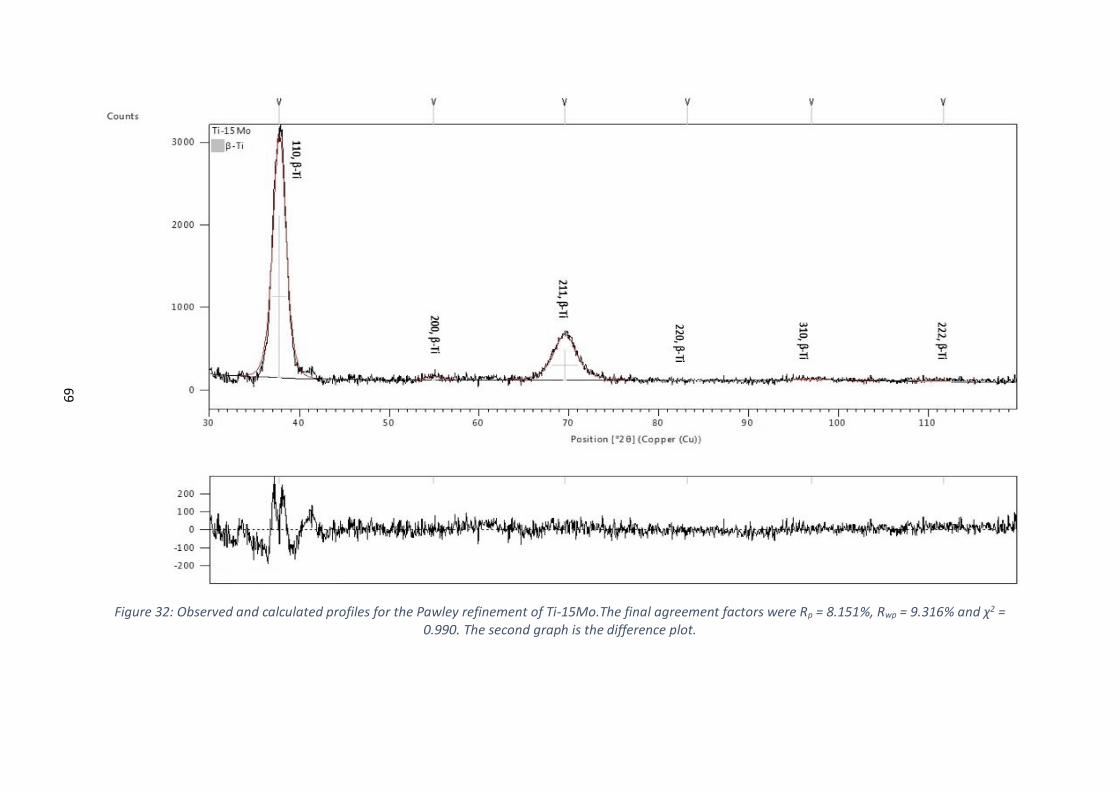
69
Figure 32: Observed and calculated profiles for the Pawley refinement of Ti-15Mo.The final agreement factors were Rp = 8.151%, Rwp = 9.316% and χ2 = 0.990. The second graph is the difference plot.
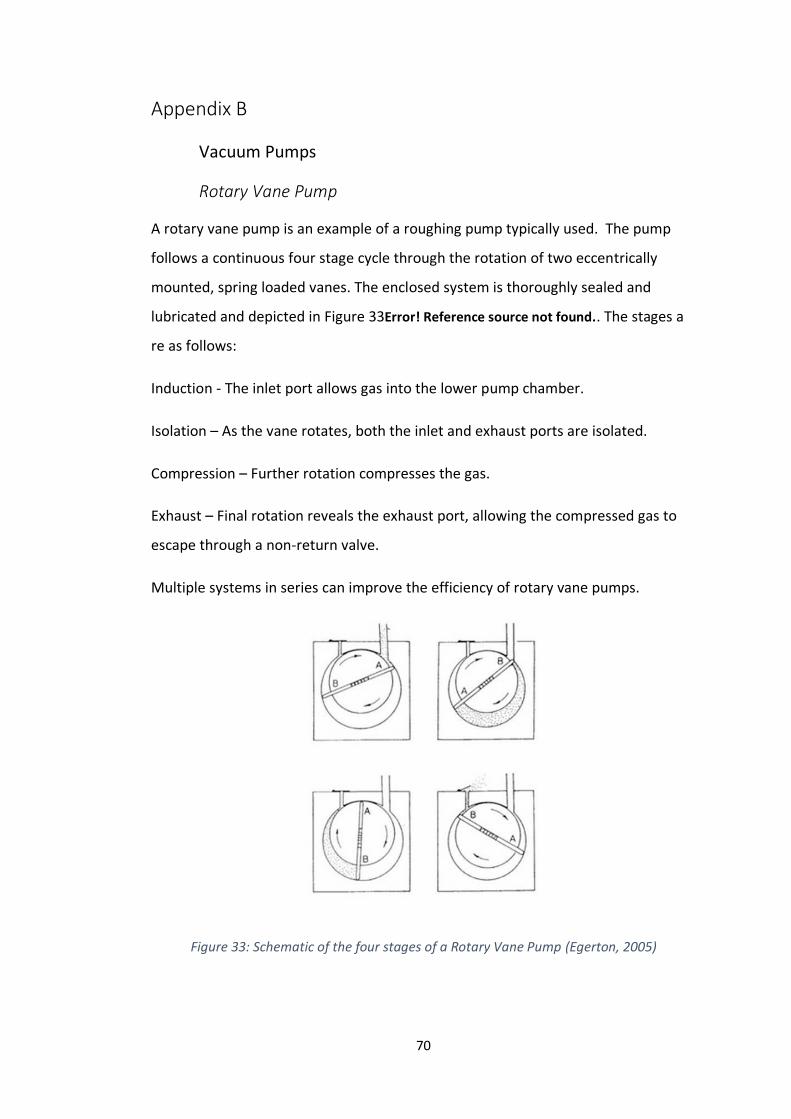
70
Appendix B
Vacuum Pumps
Rotary Vane Pump
A rotary vane pump is an example of a roughing pump typically used. The pump
follows a continuous four stage cycle through the rotation of two eccentrically
mounted, spring loaded vanes. The enclosed system is thoroughly sealed and
lubricated and depicted in Figure 33Error! Reference source not found.. The stages a
re as follows:
Induction - The inlet port allows gas into the lower pump chamber.
Isolation – As the vane rotates, both the inlet and exhaust ports are isolated.
Compression – Further rotation compresses the gas.
Exhaust – Final rotation reveals the exhaust port, allowing the compressed gas to
escape through a non-return valve.
Multiple systems in series can improve the efficiency of rotary vane pumps.
Figure 33: Schematic of the four stages of a Rotary Vane Pump (Egerton, 2005)

71
Diffusion Pump
A diffusion pump, illustrated in Figure 34, uses high speed jets of preheated vapour
which when condensed on its cooled internal sides reduces the pressure in a
chamber mounted above (Potts, 1987). In its simplest form there are no moving
parts. Diffusion pumps are capable of reaching high-vacuums of ≈ 1 x 10⁻⁶ Pa,
however must be used in conjunction with a roughing pump and backing pump to
avoid damage caused by exposure to atmospheric pressure.
Figure 34: Schematic of a Diffusion Pump
Vacuum Measurement
Pirani Gauge
A Pirani gauge is a thermal conductivity gauge that uses a metal filament to
measure the number of gas molecules present as they collide with it and exchange
thermal energy.
The Pirani gauge was developed by Marcello Pirani in 1906 (Chambers, 2005). It is a
thermal conductivity gauge that measures the number of molecules present by
interpreting the variance in thermal energy when the molecules collide with the
gauges metal filament. The thermal energy recognised has a direct effect on the
resistance in the circuit, which can be measured and displayed as a pressure value
72
based on the number molecules. The gauge can be used from atmospheric pressure
to ≈ 1 x 10⁻¹ Pa, however must be calibrated based on the specific gas in question
(Chambers, 2005).
Penning Gauge
The Penning Gauge, a type of cold-cathode ionisation gauge, was invented by Frans
Penning in 1963 (Chambers, 2005). A discharge is maintained between two
electrodes with a potential difference of 3kV. The electrons are forced into spiral
paths by an axial magnetic field resulting in an increase in the ionisation current and
sensitivity. The values obtained for ionisation current are converted into a pressure
value using a suitable control unit. The gauge typically has an operating range
between 1Pa and 1 x 10⁻⁷ Pa.
Baratron® Gauge
Baratron® is the trademark name for a capacitance manometer. The basic principle
consists of a reference vacuum separated from the chamber vacuum by a metallic
diaphragm; the displacement of the diaphragm, as a result of the difference in
pressure, is measured electrically using a fixed dual electrode arrangement; the
change in mutual capacitance, between the diaphragm and the electrode
arrangement, is converted to a pressure reading. The gauge measures true
pressure; therefore, it is not sensitive to the type of gas being measured. The most
sensitive instruments can measure pressures in the range 1Pa - 1 x 10⁻³ Pa
(Chambers, 2005).
73
References
13th Annual Report. (2016): National Joint Registry for England, Wales and Northern Ireland and the Isle of Man. 14th Annual Report. (2017): National Joint Registry for England, Wales and Northern Ireland and the Isle of Man. 15th Annual Report. (2018): National Joint Registry for England, Wales and Northern Ireland and the Isle of Man. Achache, S., S. Lamri, Arab Pour Yazdi, M., Billard, A., François, M. and Sanchette, F. (2015) 'Ni-free superelastic binary Ti–Nb coatings obtained by DC magnetron co-sputtering.' Surface & Coatings Technology, 275 pp. 283–288.
Achache, S., Lamri, S., Alhussein, A., Billard, A., François, M. and Sanchette, F. (2016) 'Gum Metal thin films obtained by magnetron sputtering of a Ti-Nb-Zr- Ta target.' Materials Science & Engineering A, 673 pp. 492–502.
Adachi, H., Hata, T., Matsushima, T., Motohiro, T. and Tominaga, K. (2012) Handbook of Sputter Deposition Technology. Elsevier, USA.
Al-Nasiry, S., Geusens, N., Hanssens, M., Luyten, C. and Pijnenborg, R. (2007) 'The use of Alamar Blue assay for quantitative analysis of viability, migration and invasion of choriocarcinoma cells.' Human Reproduction, 22(5) pp. 1304–1309.
Allegheny Technologies Incorporated, ATI. (2014) ‘ATI 15MoTM Titanium Alloy: Technical Data Sheet.’ Version 2.
Anjum, Z., Qayyum, F., Khushnood, S., Ahmed, S. and Shah, M. (2015) 'Prediction of non-propagating fretting fatigue cracks in Ti6Al4V sheet tested under pin-in-dovetail configuration: Experimentation and numerical simulation.' Materials and Design, 87 pp. 750–758.
Arthritis Research UK. (2011) ‘Hip pain’.
Asri, R. I. M., Harun, W. S. W., Samykano, M., Lah, N. A. C., Ghani, S. A . C., Tarlochan, F. and Raza, M. R. (2017) ‘Corrosion and surface modificationon biocompatible metals: A Review.’ Materials Science and Engineering C, 77 pp. 1261-1274.
74
Bönisch, M., Calin, M., Waitz, T., Panigrahi, A., Zehetbauer, M., Gebert, A., Skrotzki, W. and Eckert, J. (2013) ‘ Thermal stability and phase transformations of martensitic Ti-Nb alloys.’ Science and Technology of Advanced Materials, 14.
Baker, H. (1992) ‘Introduction to Alloy Phase Diagrams.’ ASM Handbook, 3 pp. 1.1-1.29 Bates, R.I. and Arnell, R.D. (1997) ‘Microstructure of novel corrosion-resistant coatings for
steel components by unbalanced magnetron sputtering.’ Surface and Coatings Technology,
89 pp. 204-212.
Beutner, R., Michael, J., Schwenzer, B. and Scharnweber, D. (2010) 'Biological nano-functionalization of titanium-based biomaterial surfaces: a flexible toolbox.' Journal of The Royal Society Interface, 7 pp. 93-105.
Birmingham, E., Niebur, G. L., McHugh, P. E., Shaw, G., Barry, F. P. and McNamara, L. M. (2012) 'Osteogenic differentiation of mesenchymal stem cells is regulated by osteocyte and osteblast cells in a simplified bone niche.' European Cells and Materials, 23 pp. 13-27.
Bobyn, J. D., Pilliar, R. M., Cameron, H. U. and Weatherly, G. C. (1980) ‘The optimum pore size for the fixation of porous surfaced metal implants by the ingrowth of bone.’ Clin Orthop Relat Res, 150 pp. 263-270.
Bockris, J. (2013) Comprehensive treatise of electrochemistry. Vol. 4. Electrochemical Materials Science. New York: Plenum Press.
Bondy, S. C. (2010) 'The neurotoxicity of environmental aluminum is still an issue.' Neurotoxicology, 31 pp. 575-581.
Bourn, J. (2003) Hip replacements: an update. London: National Audit Office.
Bozic, K. J., Kamath, A. F., Ong, K., Lau, E., Kurtz, S., Chan, V., Vail, T. P., Rubash, H. and Berry, D. J. (2015) ‘Comparative epidemiology of revision arthroplasty: failed THA poses greater clinical and economic burdens than failed TKA.’ Clinical Orthopaedics and Related Research, 473(6) pp. 2131–2138.
Brett, M. J., Tait, R. N., Dew, S. K., Kamasz, S. and Labun, A. H. (1992) ‘Nodular defect growth in thin films.’ Journal of Materials Science: Materials in Electronics, 3 pp. 64-70.
Browne , M. and Gregson , J. (1994) 'Surface modification of titanium alloy implants.' Biomaterials, 15(11) pp. 894-898.
75
Brune, H. (2001) ‘Growth modes.’ Encyclopedia of Materials: Science and Technology, pp. 3683–3693
Bönisch, M., Calin, M., Humbeeck, J. V., Skrotzki, W. and Eckert, J. (2015) 'Factors influencing the elastic moduli, reversible strains and hysteresis loops in martensitic Ti–Nb alloys.' Materials Science and Engineering C, 48 pp. 511-520.
Cao, W. and Hench, L. L. (1996) 'Bioactive Materials.' Ceramics International, 22 pp. 493-507.
Chambers, A. (2005) Modern vacuum physics. Betts, D. S. (ed.): Chapman & Hall.
Chang, L. L., Wang, Y. D. and Renc, Y. (2016) 'In-situ investigation of stress-induced martensitic transformation in Ti–Nb binary alloys with low Young's modulus.' Materials Science & Engineering A, 651 pp. 442–448.
Chen, J., Mwenifumbo, S., Langhammer, C., McGovern, J. P., Li, M., Beye, A. and Soboyejo, W. O. (2007) 'Cell/Surface Interactions and Adhesion on Ti-6Al-4V: Effects of Surface Texture.' Journal of Biomedical Materials Research, 82 pp. 360-373.
Chen, Q. and Thouas, G. A. (2015) 'Metallic implant biomaterials.' Materials Science and Engineering R, 87 pp. 1-57.
Chen, Y. Y., Xu, L. J., Liu, Z. G., Kong, F. T. and Chen, Z. Y. (2006) 'Microstructures and properties of titanium alloys Ti-Mo for dental use.' Transactions of Nonferrous Metals Society of China, 16 pp. 824-828.
Chiang, C., Chiou, S., Yang, W., Hsu, M., Yung, M., Tsai, M., Chen, L. and Huang, H. (2009) 'Formation of TiO2 nano-network on titanium surface increases the human cell growth.' Dental Materials, 25 pp. 1022–1029.
Correa, D. R. N., Vicente, F. B., Araujo, R. O., Lourenco, M. L., Kuroda, P. A. B., Buzalaf, M. A. R. and Grandini, C. R. (2015) 'Effect of the substitutional elements on the microstructure of the Ti-15Mo-Zr and Ti-15Zr-Mo systems alloys.' Journal of Materials Research and Technology, 4(2) pp. 180-185.
Crapper McLachlan, D.R., Lukiw, W.J. and Kruck, T.P.A. (1989) ‘New evidence for an active role aluminium in alzheimer’s disease.’ The canadian journal of neurological sciences, 16 pp. 490-497.
Cui, J., Qianga, L., Zhang, B., Linga, X., Yanga, T. and Zhang, J. (2012) 'Mechanical and tribological properties of Ti-DLC films with different Ti content by magnetron sputtering technique.' Applied Surface Science, 258 pp. 5025–5030.

76
Dai, S., Wang, Y., Chen, F., Yu, X. and Zhang, Y. (2013) 'Design of new biomedical titanium alloy based on d-electron alloy design theory and JMatPro software.' Trans. Nonferrous Met. Soc. China, 23 pp. 3027−3032.
Egerton, R. F. (2005) Physical Principles of Electron Microscopy: An Introduction to TEM, SEM, and AEM. Springer US.
Eggenhofer, E., Luk , F., Dahlke , M. H. and Hoogduijn , M. J. (2014) 'The life and fate of mesenchymal stem cells.' 5 p. 6.
Eisenbarth, E., Velten, D., Muller, M., Thull, R. and Breme, J. (2004) 'Biocompatibility of b-stabilizing elements of titanium alloys.' Biomaterials, 25 pp. 5705–5713.
Elmore, S. (2007) 'Apoptosis: A Review of Programmed Cell Death.' Toxicol Pathol., 35(4) pp. 495–516.
Ennos, R. (2012) Statistical and Data Handling Skills in Biology. 3rd edition ed.: Pearson Education Limited.
Evans, S., Jones, E., Fox, P. and Sutcliffe, C. (2017) ‘Analysis of variability in additive manufactured open cell porous structures.’ Proceedings of the Institution of Mechanical Engineers Parth-Journal of Engineering in Medicine, 231 (6) pp. 534-546.
Freedman, Y. (2012) University physics with modern physics. Whilton, N. (ed.) 13th ed.: Jim Smith.
Gavrilov, A. (no date) «Мotor Sichi» played half a million prostheses for hospitals. [Online] [Accessed on 6th November 2018] https://hyser.com.ua/economics/116958-motorovtsy-razygrali-polmilliona-na-protezy-dlya-bolnits/amp Geetha, M., Singh, A. K., Asokamani, R. and Gogia, A. K. (2009) 'Ti based biomaterials, the ultimate choice for orthopaedic implants - A review.' Progress in Materials Science, 54 pp. 397-425.
Geetha, M., Singh, A. K., Muraleedharan, K., Gogia, A. K. and Asokamani, R. (2001) 'Effect of thermomechanical processing on microstructure of aTi–13Nb–13Zr alloy.' Journal of Alloys and Compounds, 329 pp. 264-271.
Giannini, M., Giannaccini, M., Sibillano, T., Giannini, C., Liu, D., Wang, Z., Bau, A., Dente, L., Cuschieri, A. and Raffa, V. (2014) 'Sheets of Vertically Aligned BaTiO3 Nanotubes Reduce Cell Proliferation but Not Viability of NIH-3T3 Cells.' PLoS ONE, 9(12) pp. 1-18.

77
Goriainov, V., Cook, R., Latham, J. M., Dunlop, D. G. and Oreffo, R. O. C. (2014) 'Bone and metal: An orthopaedic perspective on osseointegration.' Acta Biomaterialia, 10 pp. 4043-4057.
Hafner, B. ‘Energy Dispersive Spectroscopy on the SEM: A Primer.’ Characterization Facility, University of Minnesota.
Hallab, N. J. and Jacobs, J. J. (2017) 7.8 Implant Debris: Clinical Data and Relevance. In: Comprehensive Biomaterials II, 2nd ed. Elsevier, pp.118–132.
Han, M. K., Hwang, M. J., Yang, M. S., Yang, H. S., Song, H. J. and Park, Y. J. (2014) 'Effect of zirconium content on the microstructure, physical properties and corrosion behavior of Ti alloys.' Materials Science and Engineering A, 616 pp. 268-274.
Harrison, M. A. and Rae, I. F. (1997) General techniques of cell culture. Handbooks in Practical Animal Cell Biology. Cambridge: Cambridge University Press.
Hay, G. A. (1982) Traditional x-ray imaging. . Scientific basis of medical imaging.
Heimann, R. B. (2006) 'Thermal spraying of biomaterials.' Surface & Coatings Technology, 201 pp. 2012–2019.
Hermawan, H., Ramdan, D. and Djuansjah, J. R. P. (2011) 'Metals for Biomedical Applications.' In Fazel, P. R. (ed.) Biomedical Engineering - From Theory to Applications. InTech.
Hickman, B. S. (1969) ‘The formation of omega phase in titanium and zirconium alloys: A review.’ Journal of Materials Science, 4(6) pp.554-563.
Ho, W. F., Ju, C. P. and Chern Lin, J. H. (1999) 'Structure and properties of cast binary Ti-Mo alloys.' Biomaterials, 20 pp. 2115-2122.
Hon, Y., Wang, J. and Pan, Y. (2003) 'Composition/phase structure and properties of Titanium-Niobium alloys.' Materials Transactions, 44(11) pp. 2384-2390.
Huggler, A. H. and Weidmann, E. (1976) 'Design Criteria of Total Hip Replacements Fixed with Bone Cement.' In Schaldach , M. and Hohmann , D. (eds.) Engineering in Medicine. Vol. Volume 2: Advances in Artificial Hip and Knee Joint Technology. Springer Berlin Heidelberg, pp. 361-373.
Jones, E., Sutcliffe, C., and Stamp, R. (2007) ‘Laser-produced porous surface.’ Patent no. EP1683593.
78
Karp, G. (2014) Cell Biology. Singapore: John Wiley & Sons.
Karre, R., Niranjan, M. K. and Dey, S. R. (2015) 'First principles theoretical investigations of low Young's modulus beta Ti–Nb and Ti–Nb–Zr alloys compositions for biomedical applications.' Materials Science and Engineering C, 50 pp. 54-58.
Kelly, P. J. (1997) Characterization studies of a closed-field unbalanced magnetron sputtering system. PhD. University of Salford.
Kienapfel, H., Sprey, C., Wilke, A. and Griss, P. (1999) ‘Implant fixation by bone ingrowth.’ J Arthroplasty, 14 pp. 355-368.
Kim, Y. and Choi, H. Y. (2017) 'Characterization of Ti/W, Ti/Cr, and Ti/Pt thin films−part I: Surface morphologies and nano-mechanical properties.' Sensors and Actuators A: Physical, 254 pp. 9–19.
Kolli, R. P. and Devaraj, A. (2018) ‘A review of metastable beta titanium alloys.’ Metals, 8(506).
Kokubo, T., Kim, H. and Kawashita, M. (2003) 'Novel bioactive materials with different mechanical properties.' Biomaterials, 24 pp. 2161–2175.
Kopova, I., Stráský, J., Harcuba, P., Landa, M., Janeček, M. and Bačákova, L. (2016) 'Newly developed Ti–Nb–Zr–Ta–Si–Fe biomedical beta titanium alloys with increased strength and enhanced biocompatibility.' Materials Science and Engineering C, 60 pp. 230–238.
Kuroda, P. A. B., Buzalaf, M. A. and Grandini, C. R. (2016) 'Effect of molybdenum on structure, microstructure and mechanical properties of biomedical Ti-20Zr-Mo alloys.' Materials Science and Engineering, 67 pp. 511-515.
Lee, Y. E. and Lee, J. B. (1996) Microstructural evolution and preferred orientation change of radio-frequency-magnetron sputtered ZnO thin films.’ Journal of Vacuum Science and Technology A, 14.
Li, S., Chow, T. and Chu, J. (2017) 'Engineering microdent structures of bone implant surfaces to enhance osteogenic activity in MSCs.' Biochemistry and Biophysics Reports, 9 pp. 100–105.
Li, Y., Yang, C., Zhao, H., Qu, S., Li, X. and Li, Y. (2014) 'New Developments of Ti-Based Alloys for Biomedical Applications.' Materials, 7 pp. 1709-1800.
79
Liang, S. X., Feng, X. J., Yin, L. X., Liu, X. Y., Ma, M. Z. and Liu, R. P. (2016) 'Development of a new beta Ti alloy with low modulus and favorable plasticity for implant material.' Materials Science and Engineering C, 61 pp. 338-343.
Lin, C. W., Ju, C. P. and Chern Lin, J. H. (2005) 'A comparison of the fatigue behavior of cast Ti–7.5Mo with c.p. titanium, Ti–6Al–4V and Ti–13Nb–13Zr alloys.' Biomaterials, 26 pp. 2899–2907.
Lincks, J., Boyan, B. D., Blanchard, C. R., Lohmann, C. H., Liu, Y., Cochran, D. L., Dean, D. D. and Schwartz, Z. (1998) 'Response of MG63 osteoblast-like cells to titanium and titanium alloy is dependent on surface roughness and composition.' Biomaterials, 19 p. 2219—2232.
Liu, X., Chu, P. K. and Ding, C. (2004) 'Surface modification of titanium, titanium alloys, and related materials for biomedical applications.' Materials Science and Engineering R, 47 pp. 49–121.
Liu, G., Yang, Y., Jin, N., Luo, X., Huang, B., Li, P. and Kou, Z. (2018) ‘The structural characterisations of Ti-17 alloy films prepared by magnetron sputtering.’ Applied Surface Science, 427 pp. 774-781.
Long, M. and Rack, H. J. (1998) 'Titanium alloys in total joint replacement—a materials science perspective.' Biomaterials, 19 pp. 1621-1639.
Lopes, E. S. N., Contieri, R. J., Button, S. T. and Caram, R. (2015) 'Femoral hip stem prosthesis made of graded elastic modulus metastable beta Ti alloy.' Materials and Design, 69 pp. 30-36.
Lord, M. S., Modin, C., Foss, M., Duch, M., Simmons, A., Pedersen, F. S., Milthorpe, B. K. and Besenbacher, F. (2006) 'Monitoring cell adhesion on tantalum and oxidised polystyrene using a quartz crystal microbalance with dissipation.' Biomaterials, 27(26) pp. 4529-4537.
Marker, C., Shang, S. L., Zhao, J. C. and Liu, Z. K. (2018). 'Effects of alloying elements on the elastic properties of bcc Ti-X alloys from first-principles calculations.' Computational Materials Science, 142 pp. 215–226.
Martin, J. Y., Schwartz, Z., Hummert, T. W., Schraub, D. M., Simpson, J., Lankford, J., Dean, D. D., Cochran, D. L. and Boyan, B. D. (1995) 'Effect of titanium surface roughness on proliferation, differentiation, and protein synthesis of human osteoblast-like cells (MG63).' Journal of Biomedical Materials Research, 29 pp. 389-401.
Masahashi, N., Mizukoshi, Y., Semboshi, S., Ohmura, K. and Hanada, S. (2012) 'Photo-induced properties of anodic oxide films on Ti6Al4V.' Thin Solid Films, 520 pp. 4956–4964.
80
Matsumoto, H., Watanabe, S. and Hanada, S. (2005) 'Beta TiNbSn Alloys with Low Young’s Modulus and High Strength.' Materials Transactions, 46(5) pp. 1070-1078.
Medda , R., Helth , A., Herre , P., Pohl , D., Rellinghaus , B., Perschmann , N., Neubauer , S., Kessler , H., Oswald , S., Eckert , J., Spatz , J. P., Gebert , A. and Cavalcanti-Adam , E. A. (2014) 'Investigation of early cell–surface interactions of human mesenchymal stem cells on nanopatterned b-type titanium–niobium alloy surfaces.' Interface Focus, 4(1).
Milosev, I., Metikos-Hukovic, M. and Strehblow, H. (2000) 'Passive film on orthopaedic TiAlV alloy formed in physiological solution investigated by X-ray photoelectron spectroscopy.' Biomaterials, 21(20) pp. 2103-2113.
Mohseni, E., Zalnezhad, E. and Bushroa, A. R. (2014) 'Comparative investigation on the adhesion of hydroxyapatite coating on Ti-6Al-4V implant: A review paper.' International Journal of Adhesion & Adhesives, 48 pp. 238-257.
Morgado, T. L. M., Navas, H. and Brites, R. (2016) 'Wear study of innovative Ti-Ta alloys.' Procedia S tructural Integrity, 2 pp. 1266-1276.
Mullen, L., Stamp, R. C., Brooks, W. K., Jones, E. and Sutcliffe, C. J. (2009) ‘Selective Laser Melting: A regular unit cell approach for the manufacture of porous, titanium, bone in-growth constructs, suitable for orthopedic applications.’ Journal of Biomedical Materials Research Part B: Applied Biomaterials, 89B(2) pp. 325-334.
Murray, J.L. (1987) ‘Phase diagrams of binary titanium alloys.’ ASM International, pp. 169-345.
Musil, J. and Bell, J. (1996) ‘Formation of high temperature phases in sputter deposited Ti-based films below 100°C.’ Journal of Vacuum Science and Technology, 14(4) pp. 2247-2250.
Ng, F. Y., Zhang, J. T., Chui, K. Y. and Yan, C. H. (2011) ‘A cadaveric study of posterior dislocation after total hip replacement-effects of head diameter and acetabular anteversion.’ International Orthopedics, 35 (3), pp. 325-329. Niinomi, M., Nakai, M. and Hieda, J. (2012) 'Development of new metallic alloys for biomedical applications.' Acta Biomaterialia, 8 pp. 3888–3903.
Ogura, N., Kawada, M., Change, W.-J., Zhang, Q., Lee, S.-Y., Kondoh, T. and Abiko, Y. (2004) 'Differentiation of the human mesenchymal stem cells derived from bone marrow and enhancement of cell attachment by fibronectin.' Journal of Oral Science, 46(4) pp. 207-213.
Ohring, H. (1991) ‘The materials science of thin films.’ Academic Press, London.

81
Ojha, A. and Sehitoglu, H. (2016) 'Critical stress for the bcc–hcp martensite nucleation in Ti–6.25at.%Ta and Ti–6.25at.%Nb alloys.' Computational Materials Science, 111 pp. 157-162.
Oliveira, I. R., Andrade, T. L., Araujo, K. C. M. L., Luz, A. P. and Pandolfelli, V. C. (2016) 'Hydroxyapatite synthesis and the benefits of its blend with calcium aluminate cement.' Ceramics International, 42 pp. 2542–2549.
Oliveira, N. and Guastaldi, A. (2006) 'Electrochemical studies on Ti-Mo alloys of interest to biomaterials.' Corrosão e Protecção de Materiais, 26(2)
Oliveira, N. T. C., Aleixo, G., Caram, R. and Guastaldi, A. C. (2007) 'Development of Ti–Mo alloys for biomedical applications: Microstructure and electrochemical characterization.' Materials Science and Engineering A, pp. 727–731.
PANalytical. (2014) X'Pert³ Powder.
Park, J. and Lakes, R. S. (2010) Biomaterials, an introduction. 3 ed.: Springer.
Potts, P. J. (1987) A handbook of silicate rock analysis. Blackie.
Quiroz, F. G., Posada Estefan, O. M., Gallego Pérez, D., Higuita Castro, N., Sarassa V elásquez, C. A., Hansford, D. J., Agudelo Florez, P. and López Rojas, L. E. (2008) 'Isolation of human bone marrow mesenchymal stem cells and evaluation of their osteogenic potential.' Revista Ingeniería Biomédica, 2 pp. 48-55.
Rack, H. J. and Qazi, J. I. (2006) 'Titanium alloys for biomedical applications.' Materials Science and Engineering C, 26 pp. 1269 – 1277.
Ratova, M. (2013) Enhanced properties of photocatalytic titania thin films via doping during magnetron sputter deposition. PhD. Manchester Metropolitan University.
Ratova, M., Klaysria, R., Praserthdam, P. and Kelly, P. J. (2017a) 'Pulsed DC magnetron sputtering deposition of crystalline photocatalytic titania coatings at elevated process pressures.' Materials Science in Semiconductor Processing, 71 pp. 188-196.
Ratova, M., Kelly, P. J., West, G. T., Tosheva, L. and Edge, M. (2017b) 'Reactive magnetron sputtering deposition of bismuth tungstate onto titania nanoparticles for enhancing visible light photocatalytic activity.' Applied Surface Science, 392 pp. 590–597.
Ridzwan, M. I. Z., Shuib, S., Hassan, A. Y., Shokri, A. A. and Mohamad Ibrahim, M. N. (2007) 'Problem of Stress Shielding and Improvement to the Hip Implant Designs: A Review.' Journal of Medical Sciences, 7 pp. 460-467.
82
Rosa, A. L. and Beloti, M. M. (2003) 'Effect of cpTi Surface Roughness on Human Bone Marrow Cell Attachment, Proliferation, and Differentiation.' Brazilian Dental Journal, 14(1) pp. 16-21.
Saito, T., Furuta, T., Hwang, J. H., Kuramoto, S., Nishino, K., Suzuki, N., Chen, R., Yamada, A., Ito, K., Seno, Y., Nonaka, T., Ikehata, H., Nagasako, N., Iwamoto, C., Ikuhara, Y. and Sakuma, T. (2003) 'Multifunctional Alloys Obtained via a Dislocation-Free Plastic Deformation Mechanism .' Science, 300 pp. 464-467.
Santiago-Medina, P., Sundaram, P. A. and Diffoot-Carlo, N. (2014) 'The Effects Of Micro Arc Oxidation Of Gamma Titanium Aluminide Surfaces On Osteoblast Adhesion And Differentiation.' Journal of Materials Science: Materials in Medicine, 25(6) pp. 1577–1587.
Santiago-Medina, P., Sundaram, P. A. and Diffoot-Carlo, N. (2015) 'Titanium Oxide: A Bioactive Factor in Osteoblast Differentiation.' International Journal of Dentistry,
Satoh, K., Ohtsu, N., Sato, S. and Wagatsuma, K. (2013) 'Surface modification of Ti–6Al–4V alloy using an oxygen glow-discharge plasma to suppress the elution of toxic elements into physiological environment.' Surface & Coatings Technology, 232 pp. 298–302.
Satoh, K., Komata, M., Mizuhira, M., Wagatsuma, K. and Ohtsu, N. (2013) 'Direct and Rapid Quantification of Calcium Phosphate Precipitate on Titanium by X-Ray Fluorescence Analysis Using Fundamental Parameter Method.' Materials Transactions, 54(5) pp. 817-824.
Sawyer, A. A., Hennessy, K. M. and Bellis, S. L. (2007) 'The effect of adsorbed serum proteins, RGD and proteoglycan-binding peptides on the adhesion of mesenchymal stem cells to hydroxyapatite.' Biomaterials, 28 pp. 383-392.
Semlitsch, M. (1987) 'Titanium alloys for hip joint replacements.' Clinical Materials, 2(1) pp. 1-13.
Sharma, B., Vajpai, S. K. and Ameyama, K. (2016) 'Microstructure and properties of beta Ti–Nb alloy prepared by powder metallurgy route using titanium hydride powder.' Journal of Alloys and Compounds, 656 pp. 978-986.
Shi, J. D., Wu, K. H. and Larkins, G. (1997) 'A Method for Measuring the Elastic Modulus of Thin Films.' Materials Characterization, 38 pp. 301-303.
Silva, H. M., Schneider, S. G. and Moura Neto, C. (2004) 'Study of nontoxic aluminum and vanadium-free titanium alloysfor biomedical applications.' Materials Science and Engineering C, 24 pp. 679-682.
83
Simoneau, C., Terriault, P., Jetté, B., Dumas, M. and Brailovski, V. (2017) 'Development of a porous metallic femoral stem: Design, manufacturing, simulation and mechanical testing.' Materials and Design, 114 pp. 546–556.
Sing Ng, B., Annergren, I., Soutar, A. M., Khor, K. A. and Jarfors, A. E. W. (2005) 'Characterisation of a duplex TiO 2 /CaP coating on Ti6Al4V for hard tissue replacement.' Biomaterials, 26(10) pp. 1087-1095.
Slack, J. (2012) Stem Cells: A Very Short Introduction. United States: Oxford University Press.
Song, G. (2005) 'Transpassivation of Fe–Cr–Ni stainless steels.' Corrosion Science, 47(8) pp. 1953–1987.
Structure Determination from Powder Diffraction Data. (2006) New York: Oxford University Press.
Sullivan, M., Galea, P. and Latif, S. (2006) ‘What is the appropriate oxygen tension for in vitro culture?’ MHR: Basic science of reproductive medicine. 12(11) p. 653.
Thornton, J. A. (1974) Journal of Vacuum Science & Technology , 11, pp. 666.
Todaro, G. J. and Green, H. (1963) 'Quantitative studies of the growth of mouse embryo cells in culture and their development into established lines.' J Cell Biol. 17(2) pp. 299-313.
Trinkle, D. R. (2003) A theoretical study of the HCP to Omega martensitic phase transition in Titanium. PhD. The Ohio State University.
Ullah, I., Subbarao, R. B. and Rho, G. J. (2015) 'Human mesenchymal stem cells- current trends and future propective.' Bioscience Reports, 35 pp. 1-18.
Wang, M. (2003) 'Developing bioactive composite materials for tissue replacement.' Biomaterials, 24 pp. 2133-2151.
Wei, Q., Wang, Y., Li, X., Yang, M., Chai, W., Wang, K. and Zhang, Y. (2016) 'Study the bonding mechanism of binders on hydroxyapatite surface and mechanical properties for 3DP fabrication bone scaffolds.' Journal of the mechanical behavior of biomedical materials, 57 pp. 190-200.
Wei, X., Yang , X., Han , Z. P., Qu, F. F., Shao , L. and Shi , Y. F. (2013) 'Mesenchymal stem cells: a new trend for cell therapy.' Acta Pharmacologica Sinica, 34 pp. 747-754.

84
Williams, D. F. (2008) 'On the mechanisms of biocompatibility.' Biomaterials, 29(20) pp. 2941-2953.
Whiteside, P. J. D., Chininis, J. A. and Hunt, K. A. (2016) ‘Techniques and Challenges for Characterizing Metal Thin Films with Applications in Photonics.’ Coatings, 6 (35).
Wu, C. Y., Xin, Y. H., Wang, X. F. and Lin, J. G. (2010) 'Effects of Ta content on the phase stability and elastic properties of beta Ti-Ta alloys from first-principles calculations.' Solid State Sciences, 12 pp. 2120-2124.
Yan, W., Berthe, J. and Wenc, C. (2011) 'Numerical investigation of the effect of porous titanium femoral prosthesis on bone remodeling.' Materials and Design, 32 pp. 1776–1782.
Yang, W. and Huang, H. (2010) 'Improving the biocompatibility of titanium surface through formation of a TiO2 nano-mesh layer.' Thin Solid Films, 518 pp. 7545–7550.
You, L. and Song, X. (2012) 'A study of low Young’s modulus Ti–Nb–Zr alloys using d electrons alloy theory.' Scripta Materialia, 67 pp. 57-60.
Zhang, Y., Khan , D., Delling , J. and Tobiasch , E. (2011) 'Mechanisms underlying the osteo- and adipo- differentiation of human mesenchymal stem cells.' The Scientific World Journal, p. 14.
Zhao, D., Chang, K., Ebel, T., Nie, H., Willumeit, R. and Pyczak, F. (2015) 'Sintering behavior and mechanical properties of a metal injection molded Ti–Nb binary alloy as biomaterial.' Journal of Alloys and Compounds, 640 pp. 393-400.
Zhou, Y. L., Niinomi, M. and Akahori, T. (2004) 'Effects of Ta content on Young’s modulus and tensile properties of binary Ti–Ta alloys for biomedical applications.' Materials Science and Engineering A, 371 pp. 283–290.
Zhou, Y. L., Niinomi, M., Akahori, T., Fukui, H. and Toda, H. (2005) 'Corrosion resistance and
biocompatibility of Ti–Ta alloys for biomedical applications.' Materials Science and
Engineering A, 398 pp. 28-36.