A Survey of ICT Competencies among Students in Teacher ...
270
Journal of Information Technology Education: Research Volume 12, 2013 Enhancing Learning Management Systems Utility for Blind Students: A Task-oriented, User- Centered, Multi-Method Evaluation Technique Rakesh Babu School of Information Studies, University of Wisconsin-Milwaukee, Milwaukee, WI, USA [email protected] Rahul Singh Bryan School of Business and Economics, The University of North Carolina at Greensboro, NC, USA [email protected] Executive Summary This paper presents a novel task-oriented, user-centered, multi-method evaluation (TUME) tech- nique and shows how it is useful in providing a more complete, practical and solution-oriented assessment of the accessibility and usability of Learning Management Systems (LMS) for blind and visually impaired (BVI) students. Novel components of TUME include a purposeful integra- tion of a multi-theoretic foundation and multiple methods to accurately identify users’ accessibil- ity and usability problems in Web interaction and identify design problems and solutions to en- sure technical feasibility of recommendations. The problems identified by TUME remain hidden from extant evaluation methods - therefore, these problems remain in Web-based applications. As a result, evaluation of Web-based applications remains confounded by users’ Web interaction challenges; their utility for specific user types remains unclear. Without appropriate evaluation of users’ problems and challenges in using Web-based applications, we cannot begin to solve these problems and challenges. This paper demonstrates how TUME can be used to identify the unique problems and challenges of specific user types in using Web-based applications and suggests po- tential solutions. The outcome is an accurate understanding of specific design elements that pre- sent roadblocks and challenges for the user in interacting with the Web-based application and feasible design modifications to potentially improve the utility of these applications for specific user types. We illustrate the application of TUME to test the utility of LMS for BVI students. We use a popular LMS and an on-line exam as a representative task. We present results from three assessments that are essential components of TUME. Assessment I uses verbal protocol analysis to identify where and why BVI participants face LMS interaction problems in completing an exam. Assessment II performs text analysis of accessibility and usability design standards to identify design er- rors in the LMS exam environment. As- Material published as part of this publication, either on-line or in print, is copyrighted by the Informing Science Institute. Permission to make digital or paper copy of part or all of these works for personal or classroom use is granted without fee provided that the copies are not made or distributed for profit or commercial advantage AND that copies 1) bear this notice in full and 2) give the full citation on the first page. It is per- missible to abstract these works so long as credit is given. To copy in all other cases or to republish or to post on a server or to redistribute to lists requires specific permission and payment of a fee. Contact [email protected] to request redistribution permission. Editor: Anthony Scime
-
Upload
khangminh22 -
Category
Documents
-
view
0 -
download
0
Transcript of A Survey of ICT Competencies among Students in Teacher ...
Journal of Information Technology Education: Research Volume 12, 2013
Enhancing Learning Management Systems Utility for Blind Students: A Task-oriented, User-
Centered, Multi-Method Evaluation Technique
Rakesh Babu School of Information Studies,
University of Wisconsin-Milwaukee, Milwaukee, WI, USA
Rahul Singh Bryan School of Business and Economics,
The University of North Carolina at Greensboro, NC, USA
Executive Summary This paper presents a novel task-oriented, user-centered, multi-method evaluation (TUME) tech-nique and shows how it is useful in providing a more complete, practical and solution-oriented assessment of the accessibility and usability of Learning Management Systems (LMS) for blind and visually impaired (BVI) students. Novel components of TUME include a purposeful integra-tion of a multi-theoretic foundation and multiple methods to accurately identify users’ accessibil-ity and usability problems in Web interaction and identify design problems and solutions to en-sure technical feasibility of recommendations. The problems identified by TUME remain hidden from extant evaluation methods - therefore, these problems remain in Web-based applications. As a result, evaluation of Web-based applications remains confounded by users’ Web interaction challenges; their utility for specific user types remains unclear. Without appropriate evaluation of users’ problems and challenges in using Web-based applications, we cannot begin to solve these problems and challenges. This paper demonstrates how TUME can be used to identify the unique problems and challenges of specific user types in using Web-based applications and suggests po-tential solutions. The outcome is an accurate understanding of specific design elements that pre-sent roadblocks and challenges for the user in interacting with the Web-based application and feasible design modifications to potentially improve the utility of these applications for specific user types.
We illustrate the application of TUME to test the utility of LMS for BVI students. We use a popular LMS and an on-line exam as a representative task. We present results from three assessments that are essential components of TUME. Assessment I uses verbal protocol analysis to identify where and why BVI participants face LMS interaction problems in completing an exam. Assessment II performs text analysis of accessibility and usability design standards to identify design er-rors in the LMS exam environment. As-
Material published as part of this publication, either on-line or in print, is copyrighted by the Informing Science Institute. Permission to make digital or paper copy of part or all of these works for personal or classroom use is granted without fee provided that the copies are not made or distributed for profit or commercial advantage AND that copies 1) bear this notice in full and 2) give the full citation on the first page. It is per-missible to abstract these works so long as credit is given. To copy in all other cases or to republish or to post on a server or to redistribute to lists requires specific permission and payment of a fee. Contact [email protected] to request redistribution permission.
Editor: Anthony Scime
Enhancing Learning Management Systems Utility for Blind Students
sessment III employs recursive abstraction analysis of Web developers’ comments to understand why these problems occur and how they may be addressed feasibly. Together, these assessments show how TUME can identify design errors and their consequent problems for BVI users, the source and nature of these problems, as well as potential remedies for these solutions.
TUME provides researchers in education, human-computer interaction, and related fields a novel technique to understand the unique accessibility and usability needs of BVI users. Educators and education technologists may use this technique to accurately evaluate LMS for BVI students. With further validation and generalization across more problems, findings can be used to develop design principles for accessible, usable, and useful LMS for BVI students. Such design principles provide the basis to improve the efficacy of existing accessibility and usability standards for Web applications. TUME leads to improved accessibility and usability evaluation for non-visual inter-action needed in mobile and ubiquitous computing environments and other multi-tasking situa-tions.
Keywords: Learning Management Systems, Accessibility, Usability, Blind and Visually Im-paired Students, Multi-Method Evaluation
Introduction Learning Management Systems (LMS) are integral to today’s education system (De Smet, Bour-gonjon, De Wever, Schellens, & Valcke, 2012). The adoption of LMS by academic institutions has grown significantly over the last ten years (Murray, Perez, Geist, & Hedrick, 2012; Pynoo, Devolder, Tondeur, van Braak, Duyck, & Duyck, 2011). More than 90% of American universities and colleges deliver academic programs using LMS (Arroway, Davenport, Xu, & Updegrove, 2010). A Sloan Consortium report “Going the Distance: Online Education in the United States, 2011” (http://sloanconsortium.org/publications/survey/going_distance_2011) found that over 6.1 million American students took an online course in Fall 2010. This represents a ten percent growth rate in 2010, which is the second lowest since 2002. The prevalence and wide adoption of LMS has appropriately motivated much research on its utility for students (Hamuy & Galaz, 2010; Lonn & Teasley, 2009; Van Raaij & Schepers, 2008). However, very scant research exam-ines whether blind and visually impaired (BVI) students can effectively use a LMS to derive de-sired learning outcomes (Babu, 2011). LMS often lack the accessibility and usability needed for non-visual interaction (NVI) (Armstrong, 2009), due to which completing e-learning tasks be-comes difficult or impossible for BVI students (Babu, Singh & Ganesh, 2010). This leads to an un-empowered BVI user who is discouraged and disengaged from the process – they just give up. While accessibility and usability have both technology and cognitive components (Babu, 2011), extant approaches are predominantly techno-centric. They directly translate Web content and con-trols into an audible format without paying adequate attention to critical elements of user cogni-tion in Web interaction tasks. There is a critical need to holistically evaluate LMS accessibility and usability and identify feasible design solutions to improve LMS utility for BVI students.
The purpose of this paper is to present a novel task-oriented, user-centered, multi-method evalua-tion (TUME) technique and demonstrate how it can be used to evaluate and improve the accessi-bility, usability, and utility of LMS for BVI students. Task-orientation is practical as it links LMS accessibility and usability to its utility as an e-learning tool. User-centeredness explains how ac-cessibility and usability problems create challenges in completing an e-learning task for users. The multi-method evaluation obtains and synthesizes multiple perspectives from multiple disci-plines to provide a complete evaluation of problems in LMS accessibility and usability and sug-gest solutions to alleviate these problems. Specifically, the TUME approach emphasizes detailed analyses of BVI students’ LMS interaction problems in completing an e-learning task, standards-based assessment of the e-learning task environment, and designer analyses of problems and po-tential solutions.
2
Babu & Singh
TUME is an innovative, multi-faceted approach to evaluating LMS. First, it purposefully inte-grates multiple methods and research from multiple disciplines for a more complete, practical, and solution-oriented evaluation of accessibility and usability. Traditional techno-centric ap-proaches, including automated testing and expert technical review, assess the compliance of inter-face elements with de-facto design standards such as Web Content Accessibility Guidelines (WCAG) and Web Usability Heuristics. They do not adequately consider critical elements of user cognition as users engage in tasks that involve Web interaction. User-centric approaches (e.g., Babu et al., 2010; Leuthold, Bargas-Avila, & Opwis, 2008; Theofanos & Redish, 2003) target effective usability without adequate attention to technical sources of problems in Web interaction. TUME considers both the technical and the user-centric cognitive perspectives to provide action-able design guidance to improve LMS utility. Second, it represents a paradigm shift towards a cognitive view of accessibility and usability evaluation. Existing approaches focus on the per-ceivability of web interface elements and not their perceived affordance – what the user believes they can do with them (Babu, 2011). Specifically, extant approaches assume that Web sites be-come accessible and usable when they comply with standards such as WCAG and are interoper-able with screen-reader software. TUME challenges this assumption by emphasizing the need to consider users’ perceived affordance of Web interface elements for effective task completion. Third, it employs verbal protocol analysis to obtain users’ revealed cognition, perceptions, and preferences while engaged in Web interaction tasks. Existing approaches are designed to obtain users’ stated preferences and perceptions that do not provide a complete view of Web interaction problems. TUME is equipped for a more complete assessment of accessibility and usability. Fourth, it vets the design knowledge obtained from user-centered assessment from the perspective of a Web developer. Existing design standards such as WCAG are sometimes perceived as com-plex, ambiguous, and technically infeasible (Clark, 2006). Consequently, developers and design-ers fail to implement these effectively. TUME generates technically feasible design solutions based on Web developer and designers’ perspectives.
The focus of this paper is to present and illustrate the application of the TUME technique to test the online exam environment of a popular LMS. We present the three qualitative assessment stud-ies that are essential parts of TUME evaluation. Assessment I employs verbal protocol analysis to identify where and how BVI participants face LMS interaction problems in completing the exam. Assessment II performs text analysis of Web Content Accessibility Guidelines (WCAG) and Web usability heuristics to identify design errors in the LMS exam environment. Assessment III em-ploys recursive abstraction of Web developers’ analyses to develop an understanding of why these problems occur and how they may be addressed feasibly. Results demonstrate the efficacy and feasibility of the TUME technique in providing more complete, practically-relevant, and so-lution-oriented assessment of LMS accessibility and usability for BVI e-learners. The outcome is a clear understanding of specific design elements that present roadblocks and challenges in com-pleting a LMS exam, and feasible design modifications to potentially improve LMS utility for BVI students.
While it is critical that Web sites and Web applications are designed for accessibility and usabil-ity, this must be achieved without undermining Web experiences and reducing Web functionality for any user group. This requires a Pareto-efficient approach that benefits one group without hurt-ing others. For example, consider BVI users’ inability to perceive graphical information. Elimi-nating all graphics from a Web page is impractical, as this could compromise usability for typical sighted users. However, effectively communicating information embedded in graphics through alternative non-visual formats is beneficial to BVI users without compromising any functionality. Effective communication means this alternative format enables the BVI users to perceive, under-stand, and use the information to achieve their goals. This multimodality has beneficial implica-tions for the elderly, the dyslexic and users with other disabilities. In fact, research demonstrates that technology designed for BVI accessibility and usability is more usable for typical sighted
3
Enhancing Learning Management Systems Utility for Blind Students
users (Jana, 2009). Innovative organizations make strategic investments to improve the usability of their products by partnering with the BVI as power users. Apple’s VoiceOver technology and NaturallySpeaking are prime examples of such well positioned strategic investments to develop accessibility and usability solutions for all. TUME specifically aims to improve Web accessibility and usability for BVI users, and at the same time improve the utility for all.
TUME provides researchers in education, human computer interaction, and related fields a novel technique to understand the unique accessibility and usability needs of BVI users. Educators and learning technologists may use TUME to accurately evaluate their e-learning LMS implementa-tions for BVI students. With further validation and generalization across more problems, the evaluations presented here can provide the basis to develop design principles to guide the devel-opment of accessible, usable, and useful LMS for BVI students. In addition, these design princi-ples can provide the basis to improve the efficacy of existing standards on Web accessibility and usability (e.g., WCAG) for the BVI users. It will lead to improved accessibility and usability evaluation for non-visual interaction (NVI), which is used by all users in mobile and ubiquitous environments (Brown & Kaaresoja, 2006; Lumsden & Brewster, 2003), as well as in multi-tasking situations (Christian, Kules, Shneiderman, &Youssef, 2000).
The remainder of the paper is organized as follows. We review existing literature to better under-stand current evaluation approaches and motivate the need to search for a new approach. We then explain the merits of our task-oriented, user-centered, multi-method evaluation approach. We next discuss our research design to test the efficacy and feasibility of this approach. Following this, we present our analysis. We then discuss the practical implications of our findings. We close with our conclusions and discuss directions of on-going and future research in this area.
Literature Review Here, we briefly review the literature on the evaluation of accessibility and usability and its im-plications on the utility of Web-based applications for users, to help orient the reader. We de-scribe accessibility and usability and provide a brief review of the literature on traditional acces-sibility and usability evaluation of Web-based applications.
Accessibility and Usability Accessibility and usability are two related but distinct concepts. Accessibility allows users access to system functionality (Goodhue, 1986). For users with disabilities, accessibility is treated as a technical construct that allows assistive technologies, such as screen-readers, the necessary access to interface elements (Leuthold et al., 2008). Usability refers to how well a system conforms to users' conceptualization of performing a task using it (Goodwin, 1987). It is a cognitive construct that depends on the task the user performs. A system that is not accessible is not usable; however, an accessible system does not guarantee usability (Di Blas, Paolini, & Speroni, 2004). Accessibil-ity problems prevent access to system features and functionality. Usability problems prevent the use of these features and functionality to meet objectives. Therefore, systems accessibility and usability are key to deriving the utility of a system.
Traditional Accessibility and Usability Evaluation Traditionally, the accessibility and usability of Web-based applications, including LMS, are evaluated using the Web Content Accessibility Guidelines (WCAG). WCAG is the de facto stan-dard on Web accessibility and usability for users with disabilities (Kelly, Sloan, Phipps, Petrie, & Hamilton, 2005). It comprises a set of design guidelines and success criteria principles estab-lished by the World Wide Web Consortium (W3C) Web Accessibility Initiative (WAI). WCAG guidelines-– perceivability, operability, understandability, and robustness—represent four Web
4
Babu & Singh
accessibility principles. WCAG success criteria are considered normative and include definitions, benefits, and examples. WCAG forms the basis for regulations and laws on equal access such as Section 508 of the U.S. Rehabilitation Act.
WCAG guidelines and success criteria also inform traditional standards-based evaluation meth-ods such as automated testing, expert technical review, and user testing. Automated testing uses accessibility checkers to identify interface elements that violate WCAG requirements. Better tools provide explanations of why the individual elements violate WCAG. Expert technical review uses experts to examine representative Web pages for WCAG compliance (Mankoff, Fait, & Tran, 2005). User testing asks representative users to perform tasks and respond to questions on acces-sibility and usability as defined by WCAG (Correani, Leporini, & Paternò, 2004).
Learning Management Systems Learning management systems (LMS) are also referred to as Virtual Learning Environments, Digital Learning Environments, Course Management Systems, and Electronic Learning Envi-ronments in the literature (De Smet et al., 2012). An LMS is a web-based application designed to support training, teaching, and learning on-line (McCormick, 2000). It allows students to accom-plish course activities such as reading course material, completing assignments, taking exams, conducting Internet research, participating in class discussions, and working on group projects on-line (Pituch & Lee, 2006; Sun, Tsai, Finger, Chen, & Yeh, 2008). LMSs have become an inte-gral part of today’s academe (Arroway et al., 2010).
Blind and Visually Impaired Students BVI students lack the sight necessary to see information presented on a computer screen. They cannot operate a mouse. They rely predominantly on text-to-speech software called screen-readers (SR) to interact with computers and the Internet (Lazar, Allen, Kleinman, & Malarkey, 2007). They use key commands (including keyboard shortcuts afforded by the operating system and specialized keystrokes afforded by the screen-reading technology) to operate the SR. The SR identifies and interprets text content on the computer screen and presents this aurally through a synthetic voice (Di Blas et al., 2004). Jaws, WindowEyes, VoiceOver and NVDA are commonly used SRs. JAWS (www.freedomscientific.com) is a market-leading, comprehensive SR for BVI individuals including users with blindness, low vision or other vision-related impairments.
BVI students represent an atypical population with special functional and learning needs. In this paper, we apply TUME to focus on the special e-learning needs of this atypical student popula-tion. An analysis of the literature indicates that Web interaction for BVI students has the follow-ing characteristics:
i. Information access is sequential (Lazar et al., 2007). At any given point, BVI users per-ceive only a snippet of the content and often lose contextual information.
ii. No rendition of graphics (Armstrong, 2009). BVI users cannot perceive or interpret in-formation communicated through images, color, and layout.
iii. Quick information scan is not possible (Di Blas et al., 2004). BVI users cannot locate goal-relevant information efficiently and easily by scanning information.
iv. Keyboard-based (Leuthold et al., 2008). BVI users cannot use functionality that requires mouse input.
v. Complex layouts create problems. When Web pages have a complex layout, screen-reader’s feedback becomes ambiguous (Lazar et al., 2007). Screen-readers also mispro-nounce many words (Theofanos & Redish, 2003) which create comprehension problems for the BVI user.
vi. Requires learning complex interface. BVI interaction requires memorizing hundreds of key commands (Theofanos & Redish, 2003). The wide range of screen-reader functional-
5

Enhancing Learning Management Systems Utility for Blind Students
ity makes it more difficult for BVI users to remember and use appropriate functions for effective Web interaction.
vii. Higher cognitive load. Cognitive resources must be split, trying to understand the brows-er, the screen reader, and content (Theofanos & Redish, 2003). This leads to greater cog-nitive burden for BVI users in Web interaction (Millar, 1994; Thinus-Blanc & Gaunet, 1997).
Students accomplish learning activities using LMSs and other Web-based tools such as e-libraries, and online encyclopedias (Alavi & Gallupe, 2003). Research shows that these Web-based tools lack the accessibility and usability needed (American Foundation for the Blind, 2008; Babu & Singh, 2009; Brophy & Craven, 2007). The problem is especially debilitating for BVI users (Leuthold et al., 2008). Poorly designed learning environments negatively impact their aca-demic outcomes. They require learning environments that are accessible, usable, and useful for e-learning.
While LMS are designed for typical sighted students, it is believed that BVI students too can maximize their educational outcomes through their effective use (Kim-Rupnow & Burgstahler, 2004). For all students, and particularly the BVI student, effective LMS use requires accessibility and usability (Babu & Singh, 2009). In fact, BVI students perceive LMS accessibility and usabil-ity as key to academic success in online education, yet this is often lacking in available LMSs (Babu, Singh, Iyer, & Midha, 2007). Our research tries to understand LMS accessibility and us-ability for BVI students so that they can maximize the educational benefits and academic out-comes from LMS use.
Existing standards-based evaluation approaches are necessary but not sufficient for an accurate assessment of Web accessibility and usability (Clark, 2006; Di Blas et al., 2004; Mankoff et al., 2005). They identify interface elements that prevent access to screen-readers and exhibit poor usability (Kelly et al., 2005; Moss, 2006). However, they are not able to explain the consequent problems for the BVI user in goal accomplishment. Experts believe WCAG does not accurately represent usability needs of the BVI user (Clark, 2006; Di Blas et al., 2004; Leuthold et al., 2008). For instance, the perceivability guideline recommends that the graphical interface should be modified to facilitate screen reader access (Leuthold et al., 2008). However, the effectiveness of the common implementation of this guideline is questionable. Content readability for the BVI is typically implemented through aural presentation of content that provides partial assessment of LMS accessibility or usability (Di Blas et al., 2004). A WCAG-based evaluation alone provides an incomplete account of accessibility and usability problems in Web design for the BVI user.
Prior research (Babu et al., 2010) demonstrates a novel, user-centered, and cognitive method to evaluate Web accessibility and usability using verbal protocol analysis (VPA) for assessment of Web-based application from the BVI users’ perspective, including where and how problems arise in completing an online tasks. Although this user-centric method develops information not avail-able through the techno-centric standards-based evaluation, it does not identify the source of the problem. Nor does it provide actionable guidance on potential solutions.
Evaluation techniques that do not provide feasible and actionable guidance on how to address users’ accessibility and usability problems have limited utility for generating design improve-ments. Evaluation methods that incorporate the perspectives of Web developers and designers can identify problems as well as solutions to potentially alleviate specific problems. Developers and designers have a more accurate understanding of the systems model (Norman, 1988). They can help trace the source of a BVI user’s Web interaction problem to a component of interface design. They can provide valuable insights leading to actionable guidance on improving accessibility and usability. Scalability of such problem-specific solutions is a challenge. A practically-relevant,
6
Babu & Singh
solution-oriented evaluation of Web accessibility and usability must consider perspectives of Web developers/ designers, BVI users, and WCAG.
A holistic LMS evaluation is critically needed to accurately understand accessibility and usability problems BVI students face in e-learning. It is important to note that while we study BVI stu-dents’ accessibility and usability problems, the consequent accessibility and usability improve-ments should be useful for all, including the sighted. Our research studies LMS accessibility and usability in the context of its utility as a learning platform. The research question addressed in this paper is: How can we effectively synthesize a user-oriented perspective with existing standards such as WCAG as well as the Web developers and designers’ assessment for a complete, practi-cally-relevant, solution-oriented evaluation of accessibility, usability and derivable utility of Learning Management Systems for Blind and Visually Impaired students?
The TUME Approach This paper presents a novel task-oriented, user-centered, multi-method evaluation (TUME) ap-proach for a holistic, practical, solution-oriented assessment of accessibility, usability, and utility of Web-based applications.
Task-Oriented The task-orientation helps examine the accessibility and usability of a Web-based application in terms of its utility. Web-based applications are designed to serve a purpose. For example, an LMS is designed to support e-learning tasks. On the other hand, Web interaction is goal-oriented; users visit a Web site to accomplish a task. For example, students interact with an LMS to complete their homework. A measure of the success of the Web-based application is how effectively users can complete the tasks it is designed to support. When accessibility and usability problems ham-per task accomplishment, the Web-based application fails to achieve its purpose. A more practical approach to accessibility and usability evaluation should contextually situate these problems in the purpose of the Web-based application. This will allow the examination and explanation of design errors beyond the identification of poorly designed interface elements, to their implica-tions for users’ ability to complete a task supported by the Web-based application. Contextually situating the evaluation in the task brings together accessibility and usability of a Web-based ap-plication to its utility. This has greater practical relevance in terms of the ability to develop solu-tions to enhance the utility of the application. Our approach provides contextually situated evalua-tions where a Web-based task is the unit of analysis, as opposed to interface elements on a web page. This allows us to identify accessibility and usability problems in Web-based applications as well as the consequent challenges in completing its supported tasks. This provides a more com-plete and contextually-situated understanding of the problem.
User-Centered Extant research on Web accessibility and usability for users with different abilities (e.g., the BVI, the elderly, etc.) is predominantly techno-centric in nature. It focuses on assistive-technology-website interaction, as opposed to user-website interaction (Babu, 2011). It assumes that people with different abilities are typical users in every other way, except they interact with Web-based applications using specific assistive technologies (Correani et al., 2004). Thus, in this approach, it follows that accessibility and usability are served when Web content interoperates with the myr-iad assistive technologies. It attributes Web interaction problems to interface elements that are inaccessible to the user’s assistive technology (Freire, Goularte, & Fortes, 2007). Technical ap-proaches may identify accessibility issues that are only part of the problem. They address this problem through improvements in interface design and assistive technology. They require users with different abilities to adapt their interaction strategies to the modified design (King, Thatcher,
7
Enhancing Learning Management Systems Utility for Blind Students
& Easton, 2005). In contrast, user-centered approaches focus on generating new design knowl-edge and design improvements from careful examination of users’ interaction challenges. They consider cognitive factors such as problem-solving, perception, memory, and learning in systems interaction (Katz-Haas, 1998). They place the user’s needs, preferences, and abilities at the core of interface design (Greenbaum & Kyng, 1991; Schuler & Namioka, 1993). This yields a more accurate assessment of systems usability in terms of user needs (Heim, 2007; Krug, 2005). We adopt a user-driven approach to study users’ challenges and roadblocks in Web interaction result-ing from accessibility and usability problems in the design of a Web-based application.
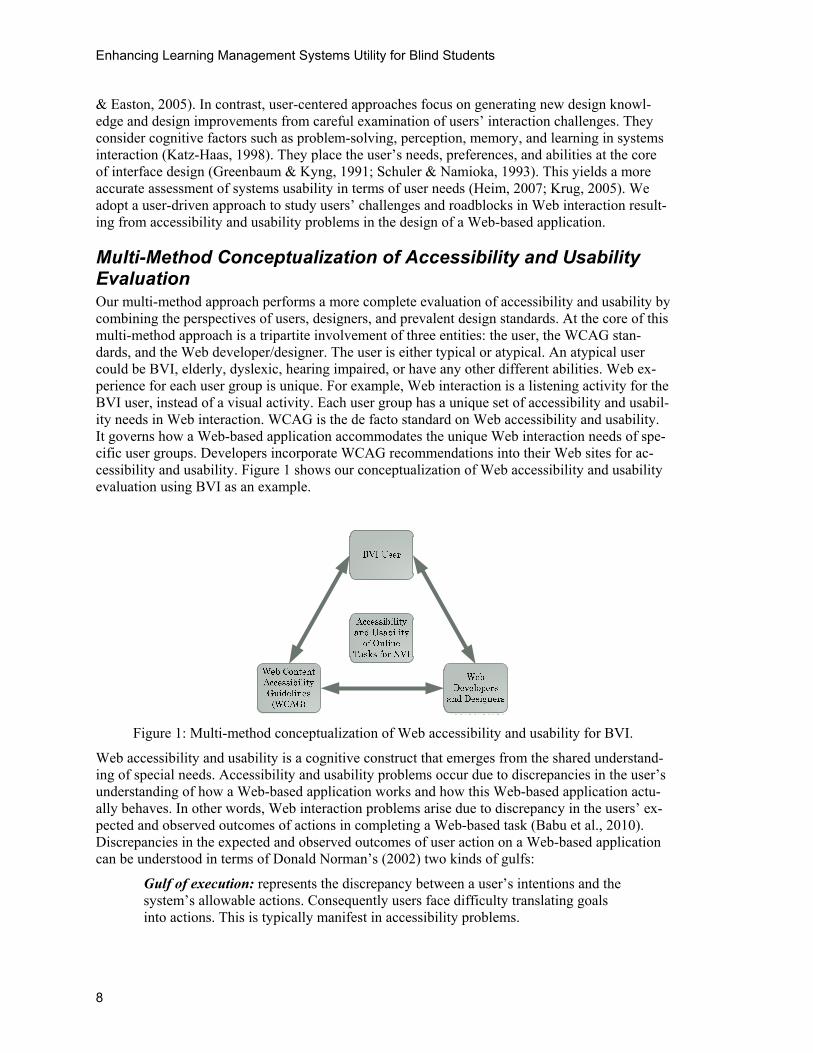
Multi-Method Conceptualization of Accessibility and Usability Evaluation Our multi-method approach performs a more complete evaluation of accessibility and usability by combining the perspectives of users, designers, and prevalent design standards. At the core of this multi-method approach is a tripartite involvement of three entities: the user, the WCAG stan-dards, and the Web developer/designer. The user is either typical or atypical. An atypical user could be BVI, elderly, dyslexic, hearing impaired, or have any other different abilities. Web ex-perience for each user group is unique. For example, Web interaction is a listening activity for the BVI user, instead of a visual activity. Each user group has a unique set of accessibility and usabil-ity needs in Web interaction. WCAG is the de facto standard on Web accessibility and usability. It governs how a Web-based application accommodates the unique Web interaction needs of spe-cific user groups. Developers incorporate WCAG recommendations into their Web sites for ac-cessibility and usability. Figure 1 shows our conceptualization of Web accessibility and usability evaluation using BVI as an example.
Figure 1: Multi-method conceptualization of Web accessibility and usability for BVI.
Web accessibility and usability is a cognitive construct that emerges from the shared understand-ing of special needs. Accessibility and usability problems occur due to discrepancies in the user’s understanding of how a Web-based application works and how this Web-based application actu-ally behaves. In other words, Web interaction problems arise due to discrepancy in the users’ ex-pected and observed outcomes of actions in completing a Web-based task (Babu et al., 2010). Discrepancies in the expected and observed outcomes of user action on a Web-based application can be understood in terms of Donald Norman’s (2002) two kinds of gulfs:
Gulf of execution: represents the discrepancy between a user’s intentions and the system’s allowable actions. Consequently users face difficulty translating goals into actions. This is typically manifest in accessibility problems.
8
Babu & Singh
Gulf of evaluation: represents the discrepancy between a system state and the user’s ability to perceive and understand that state directly with respect to expec-tations. It is large if feedback is difficult to perceive, difficult to understand, and is inconsistent with user’s expectation. This is typically manifested in usability problems.
We conceptualize Web accessibility and usability problems as users’ difficulties due to discrep-ancies between the expected and observed outcomes of their actions in completing a Web-based task. Using Norman (2002) as a theoretical foundation, we refer to difficulties resulting from gulf of evaluation as dissonance, and those resulting from gulf of execution as failure. Analyzing dis-sonance and failure from the perspective of accessibility and usability principles (e.g., WCAG) helps to understand their nature. Analysis from the perspective of developers and designers helps identify design problems and understand their nature. Together, these provide a more complete and utilitarian view of accessibility and usability of a Web-based application. We argue that our task-oriented, user-centered, multi-method approach is needed for an accurate, practically-relevant and solution-oriented evaluation of Web-based applications for specific user types not possible through current approaches. We present our method and research design to demonstrate the application of our novel evaluation approach.
Methodology and Research Design We applied our TUME approach to evaluate the accessibility, usability, and utility of a learning management system (LMS) for blind and visually impaired (BVI) students. LMSs allow students to complete e-learning tasks. BVI students comprise an atypical user population that interacts with LMSs by listening to its content read aloud by screen-reader assistive technology. We em-ployed TUME to test LMS accessibility and usability in terms of its utility as an effective learn-ing tool for this atypical user population. We performed a contextually situated evaluation where an e-learning task was the unit of analysis, instead of interface elements on an LMS page. This helped us identify accessibility and usability problems in LMS design, the consequent challenges for BVI students in completing e-learning tasks, as well as a more complete and contextually-situated understanding of the problem. Such understanding will guide future research to improve the functional and academic outcomes for BVI students in online education.
We used an online exam as a typical and common context of LMS use. The unit of analysis was an online task, which included a multiple-choice question, a multiple-answer question, and an essay-type question. It should be noted that these represent the three most common formats of presenting questions in online exams (Simon & Cutts, 2012), as well as in Web-based surveys, online job applications, and online college applications (Neumeier, 2005). In addition, they repre-sent the standard forms of information input for web forms. Therefore, while the context of the study was a particular LMS, the accessibility and usability problems identified here are conceiva-bly common to other forms of entering information on the web.
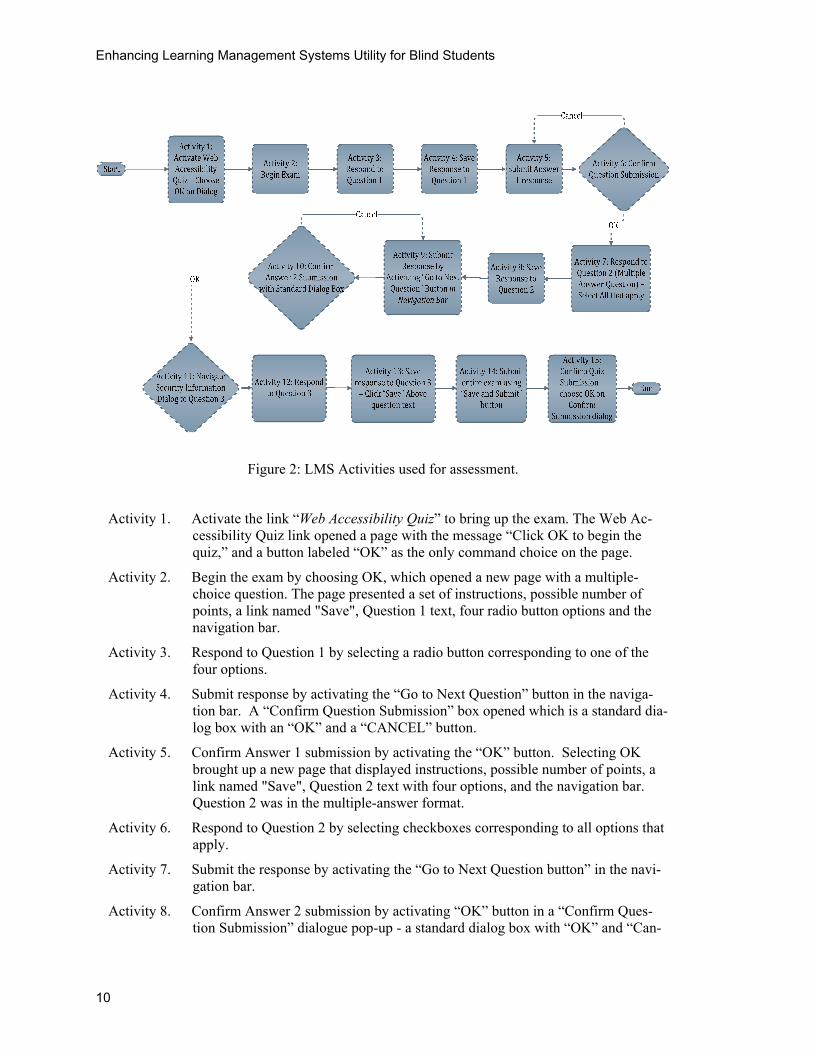
The online exam included 12 distinct activities spread over 6 pages of the LMS. Figure 2 shows the prescribed set of activities that comprise the workflow to complete the exam.
9
Enhancing Learning Management Systems Utility for Blind Students
Figure 2: LMS Activities used for assessment.
Activity 1. Activate the link “Web Accessibility Quiz” to bring up the exam. The Web Ac-cessibility Quiz link opened a page with the message “Click OK to begin the quiz,” and a button labeled “OK” as the only command choice on the page.
Activity 2. Begin the exam by choosing OK, which opened a new page with a multiple-choice question. The page presented a set of instructions, possible number of points, a link named "Save", Question 1 text, four radio button options and the navigation bar.
Activity 3. Respond to Question 1 by selecting a radio button corresponding to one of the four options.
Activity 4. Submit response by activating the “Go to Next Question” button in the naviga-tion bar. A “Confirm Question Submission” box opened which is a standard dia-log box with an “OK” and a “CANCEL” button.
Activity 5. Confirm Answer 1 submission by activating the “OK” button. Selecting OK brought up a new page that displayed instructions, possible number of points, a link named "Save", Question 2 text with four options, and the navigation bar. Question 2 was in the multiple-answer format.
Activity 6. Respond to Question 2 by selecting checkboxes corresponding to all options that apply.
Activity 7. Submit the response by activating the “Go to Next Question button” in the navi-gation bar.
Activity 8. Confirm Answer 2 submission by activating “OK” button in a “Confirm Ques-tion Submission” dialogue pop-up - a standard dialog box with “OK” and “Can-
10
Babu & Singh
cel” options. Choosing “OK” brought up a “Security Information” dialogue box. It contained a security warning message, a “Yes” button and a “No” button.
Activity 9. Get past the Security warning by choosing “Yes” and move to a new page. The new page includes five relevant components: (1) instructions on completing the exam; (2) possible number of points; (3) link "Save"; (4) question 3 text; (5) sev-eral text formatting controls; (6) input area; (7) additional controls leading to the navigation bar; (8) navigation bar with a “Save and Submit” button instead of the usual “Go to Next Question” button
Activity 10. Respond to Question 3 by locating the input area and typing in the answer.
Activity 11. Submit the entire exam by activating the “Save and Submit” button.
Activity 12. Confirm exam submission by choosing “OK” on the “Confirm Submission” dia-logue box. The last page loads that displays a message confirming submission and grade information.
The TUME application described in the following sections includes:
Method I: BVI student assessment using verbal protocol analysis;
Method II: WCAG assessment using textual analysis;
Method III: Web developer assessment using structured, open-ended interview.
Method I: BVI Student Assessment Using Verbal Protocol Analysis We used the think-aloud method of direct observation, also called concurrent verbal protocol analysis, to collect concurrent verbal reports of BVI students. Participants work on a task and concurrently verbalize whatever they are thinking (Ericsson & Simon, 1984; Todd & Benbasat, 1987). Concurrent verbal reports contain evidence of the information that participants process to perform a task (Ericsson & Simon, 1984). Ericsson and Simon (1993) found that concurrent ver-balizations are non-reactive and do not alter participants’ behavior in tasks. This technique is ef-fective for developing an in-depth understanding of human problem-solving (Newell & Simon, 1972) and is a feasible method to trace usability problems in e-learning tools (Cotton & Gresty, 2006).
Participants We recruited six BVI participants (Mean Age = 23 years) including five males and one female. While participants had typically used the Web for email and information gathering for over 5 years, none had used a LMS or taken an exam online. Three participants were high school seniors at the Texas School for the Blind and Visually Impaired (TSBVI), two high school seniors and a college freshman were affiliated with the Michigan Commission for the Blind Training Center (MCB/TC) at the time of the study. Technology instructors at both institutions, who train students in using screen-readers, computers and the Web, facilitated participant recruitment.
Material Materials for Method I assessment included instructions, a course designed for this study, and an online exam in the LMS. Participants log on to the LMS and visit the course. The “Announce-ments” section in the course directs participants to the Assignments section, which provides in-structions on completing the online exam called “Web Accessibility Quiz.”
11
Enhancing Learning Management Systems Utility for Blind Students
Procedure We conducted a familiarization session with participants to describe the study’s objective and explain the think-aloud technique and answered questions to ensure they understood the method-ology. Participants then took the LMS exam, which lasted for approximately 45 minutes. We re-corded and transcribed verbal protocols including participant verbalizations, conversation, and screen-reader audio.
We performed verbal protocol analysis on the transcripts and decomposed them into individual segments that represent single units of thought. We identified segments that represented a Web interaction challenge that hampered a participant’s ability to perform an activity effectively and labeled them Problems. Problems where the situation was not comprehensible to the participant due to inadequate system feedback were labeled Dissonance. We identified problems correspond-ing to a situation where things did not work for the participant – an action did not yield expected outcome. We labeled this category of problems as Failure.
Method II: WCAG Assessment Using Text Analysis Method II identified accessibility and usability problems using WCAG Success Criteria and Us-ability heuristics respectively. The objective of Method II was to interpret findings of Method I into design guidance.
Material Materials included Method I results, WCAG guidelines and success criteria, and usability princi-ples/heuristics applicable for BVI students. Specific web guidelines employed are Perceivability, Operability, Understandability, and Robustness. We also adopted usability principles/heuristics for BVI users (Nielsen, 1993); Principles of Good Design (Norman, 2002); and Golden Rules of Interface Design (Shneiderman & Plaisant, 2004).
Procedure We used WCAG guidelines and related usability criteria to determine the accessibility and usabil-ity character of a problem. We analyzed individual WCAG success criterion to understand prob-lems by retracing BVI participants’ LMS interaction paths and identified design elements used for the task. This provided a mapping between problematic LMS design elements and the acces-sibility criteria violated. We analyzed usability principles to explain problems, which provided a mapping between problematic LMS design elements and the usability criteria violated. Together, these helped explain BVI students’ accessibility and usability problems.
Method III: Web Developers Assessment of Online Exam Using Structured, Open-Ended Interview
Participants We recruited five Web developers, having a minimum of three years Web development experi-ence.
Material Materials included results from Method I assessment, task environment of the LMS exam, and an interview protocol informed by the results of Method I. Interview questions include:
1. Based on your understanding of the roadblock/challenge experienced by BVI partici-pants, what do you think is the problem source?
12
Babu & Singh
2. What are some possible solutions (e.g., design modifications) you believe can be fea-sibly implemented?
Procedure We conducted one-on-one interviews with Web developers where we explained the purpose of the research and presented the task environment and briefed them about BVI assessment and de-scribed each activity where participants faced a roadblock or a challenge. For consistency and accuracy, we described each scenario and asked participants to retrace the complete path of BVI participants, examine the task environment corresponding to each activity, explain the cause of the problem, and suggest possible solutions.
We analyzed the interview data using recursive abstraction. In recursive abstraction, qualitative evidence is distilled to obtain knowledge through a process of summarization without using codes (Crabtree & Miller, 1999). We divided each transcript into segments based on developers’ under-standing of the problems and their suggested solutions. We summarized and re-summarized in-formation directly relevant to the questions for each participant. These summaries included statements that attribute a problem experienced by BVI participants to interface elements of the online exam and statements that identify remedial measures to address problems in terms of fea-sible design modifications.
Synthesizing the results of the three assessments provides our approach the ability to generate a more holistic understanding of LMS accessibility and usability problems in terms of BVI stu-dents’ ability to complete online exams. We hope that the approach is extensible to other user groups of different abilities and other modes of LMS interaction for typical and atypical user groups.
Results and Discussion Developing a better understanding of BVI students’ unique accessibility and usability problems was the desired outcome of our TUME LMS evaluation. The BVI student assessment provided an in-depth, observational and experiential understanding of problems. The WCAG assessment ex-plained the accessibility and usability character of these problems. The Web developer assess-ment further clarified the nature of the design problem, and identified potential design solutions.
We grouped the results of our TUME LMS evaluation into multiple problem types. In the follow-ing, we discuss three primary problem types in LMS design: Inconsistent feedback; inaccessibil-ity of security pop-ups; and obscurity of input areas for answer entry. We explain these problem types in terms of specific assessments.
Inconsistent LMS Feedback for Link Activation The first significant problem in LMS design for screen-reader users is inconsistent system feed-back for link activation. We explain the nature of this problem using results from the three as-sessments
Results of BVI student assessment of LMS design A significant challenge for BVI students is confusion when navigating across different LMS pages. Very often, participants were not aware that their destination page had become available after they clicked on the related link on the source page. Therefore, they either kept waiting to interact with the new page or would interact assuming it was the previous page. This confusion, coupled with the resultant frustration, was frequently evident. We provide evidence of such con-fusion using verbal reports collected from two participants. Participant’s verbalizations are la-
13
Enhancing Learning Management Systems Utility for Blind Students
beled BVI #, screen-reader output as SR, and questions to participants as Q. We wish to remind the reader that BVI users operate the SR using key commands that include generic keyboard shortcuts afforded by the operating system and specialized keystrokes afforded by the screen-reading technology. The SR responds verbally with typing echo as well as with announcement of the text content at cursor focus.
SR: Link Web accessibility quiz BVI2: Ok, web accessibility quiz. I am going to hit enter on this. SR: Enter. Web accessibility quiz visited link. Frame. BVI2: Once again, I entered into the same problem. It didn’t tell me I have en-
tered into a new page. It didn’t say page has how many links. It just said frame. I don’t know what that means. But I clicked on a link. And I as-sume it worked.
These show the confusion and uncertainty in the mind of the BVI user due to difficulty in know-ing if link activation was successful and if a new page loaded. This confusion seems to stem from a discrepancy between observed and expected feedback for link activation. Actually, the expected feedback is indicative of a “cultural convention” in Web navigation for screen-reader users. Ac-cording to this convention, after successful link activation, a screen reader typically announces the percentage of the destination page content downloaded when a link is activated; and the page composition, such as “Page has x links, y images, z tables,” referring to specific interface objects in the destination page. A BVI user interprets the percentage value announcement as the progress of page download. Since BVI students cannot perceive visual cues, these announcements are crit-ical to detect a change of system state, such as an LMS page change. If any part of this an-nouncement is missing, the student remains in the “dark”. We observed multiple occurrences of such interruptions when participants tried to navigate LMS pages. Another example is presented below:
BVI2: I am going to go back to the bottom of the page with control end, and scroll up to complete the quiz.
SR: Click ok to begin the quiz. BVI2: Just click ok to begin the quiz. I am going to hit ok. SR: Ok link graphic. Ok. BVI2: Once again, I have no indication whatsoever from the speech program
that I am starting the page, updating the page. So frustrating. I have made note of that several times, so I am not going to continue doing this in each page. But it is somewhat frustrating. When you do click on a link, it is not saying you have arrived on a new page. It just doesn’t say any-thing at all.
In the above situation, the BVI student does not receive any feedback and cannot perceive the LMS’s state. Consequently, he loses precious exam time in dealing with the uncertainty and con-fusion.
Another example of the confusion and uncertainty under such situations is:
SR: Blank link web accessibility quiz. BVI4: Web accessibility quiz! I was looking for that. Enter on that. SR: Enter. Content frame updated. Content frame end blank. BVI4: What the heck! It's the contact, it's saying something about contact.
I don't know what it's like. Maybe I should go up some? SR: Link graphic cancel. BVI2: Oops!
14
Babu & Singh
SR: Click okay to begin colon web accessibility quiz. BVI4: Oh! SR: Blank heading level
In this case, the screen-reader announces the percentage consistent with the conventional an-nouncement for link activation and announces “Content frame updated”, consistent with the page composition announcement convention. The LMS generated feedback. However part of the feed-back was inconsistent and this created confusion in the mind of the participant. The student could not interpret part of the announcement regarding the new page and could not verify if the new LMS page had loaded. She could not determine the next course of action and got frustrated.
LMS interaction problems are indicative of a gulf between the user’s cognition of the LMS and its actual behavior. Confusion in navigation indicates a gulf between the expected and observed LMS behavior in link activation. BVI participants perceive the feedback as incomplete, ambigu-ous, and misleading. They spend extra time to verify their context and situation, which adversely impacts timely exam completion and their performance. According to the Action Model (Nor-man, 2002), this represents a gulf of evaluation as BVI students fail to interpret LMS feedback for their actions. Inconsistent feedback for link activation is a serious problem in LMS design that creates confusion and frustration for BVI students in navigation.
Result of WCAG assessment of LMS design Inconsistent LMS feedback for link activation violates three design principles on Web accessibil-ity and usability. These design principles include:
Page Title - principle of Web accessibility; Feedback - principle of Web usability; and Satisfaction - principle of Web usability.
Violation of the Page Title principle: This principle says that Web pages should have descriptive titles for BVI users to orient themselves for this content (http://www.w3.org/TR/UNDERSTANDING-WCAG20/navigation-mechanisms-title.html). BVI users perceive information by listening to screen-reader announcements. They fail to identify the page or find goal-relevant information when the Web page lacks a descriptive title. This hap-pened to our participants. They could not identify an exam page or understand its purpose from the screen-reader announcements. In our analysis, none of the exam pages had a descriptive title accessible to a screen-reader in violation of the Page Title principle for Web accessibility.
Violation of Feedback principle: This principle (Norman, 2002) highlights the need for “full and continuous” system feedback that informs users of the result of their actions on the system. Analysis shows the significant difficulties BVI participants faced in comprehending LMS feed-back for link activation. Screen-reader announcements were incomplete in describing LMS state changes after interaction in violation of Norman’s (2002) Feedback principle of Web usability.
Violation of Satisfaction principle: This principle (Nielsen, 1993) highlights the importance of user satisfaction with the system and its function. Our analysis demonstrated how BVI partici-pants were frustrated with the LMS for not responding appropriately after activating a link. The feedback from the screen-reader was often perceived as confusing, incomplete, and misleading and created disruption. Inconsistent LMS feedback for link activation problems represents a vio-lation of Nielsen’s (1993) Satisfaction principle of Web usability.
Thus, inconsistent feedback for link activation is both an accessibility and usability problem in LMS design.
15
Enhancing Learning Management Systems Utility for Blind Students
Results of Web developer assessment of LMS design Web developers’ assessment explains that the source of the inconsistent feedback for the link ac-tivation problem is the frame-based page structure in LMS design. This frame-based structure failed to generate the conventional screen-reader announcement that follows link activation. Analysis shows these frames were not assigned unique titles. Screen-reader announcements failed to communicate a context change effectively. These contribute to BVI students’ confusion. Web developers explained:
“Traditionally, a Web page update occurs through HTML. The Web site consists of content wrapped around something called an HTML body. Browsing to a new page means new content is loaded into the HTML body. In such a scenario, the screen reader announces 1%, 10%, 50% etc. However, in this particular case, the LMS loads new content through another means called frames. Frames basically divide the whole body into multiple parts, such as body 1, body 2, body 3, body 4, in that way. And what they do is, they only update body 3 which is relevant to you, and do not update body 1, body 2 and body 4. So, only part of the body is updated. Essentially, over here it means that page has changed and yet the page has not changed. The screen reader may not be capable enough to announce the frame data changes.”
Each LMS page consists of a set of frames, including a header frame and a content frame. The content frame in turn comprises a menu frame and a course content frame. Course Content frames are used for dynamic components of an online exam, such as questions, possible answers, input areas, and Menu frames are used for static content such as menu items. LMS pages change by loading new content in the course content frame without changing content of other frames. In this respect, frame-based sites are different in that a new page involves loading new content into the HTML body. This difference may not be apparent to users, but it does alter screen-reader re-sponses because the screen-reader does not perceive a change in the page. It may detect a change in the content of one frame and may not have information to announce the arrival of a new page. The screen-reader may announce “Content Frame Updated” – such announcements break conven-tion and may create confusion in the minds of BVI students while navigating exam pages.
Participants discussed feasible design modifications as potential solution for BVI students’ confu-sion such as the use of Accessible Rich Internet Application (ARIA) tags to improve the accessi-bility of dynamic Web content and advanced user interface controls that use Ajax, HTML and JavaScript. ARIA tags add attributes to identify features for user interaction, how they relate to each other, and their current state. ARIA describes new navigation techniques to mark regions and common Web structures, such as menus, primary content, secondary content, banner infor-mation, and other types of Web structures. For example, with ARIA, developers can identify re-gions of pages, allowing screen-reader users to easily move among regions, rather than having to press Tab many times. Since the LMS relies on the use of dynamic frames for organizing exam questions, the suggestion of WD1 has value. He explained:
“It is definitely possible to indicate that there are changes happening using ARIA – Accessible Rich Internet Applications. They have a whole bunch of tags, including tags specifically designed to inform the user about a change. It is possible to extend this to pages with frames, and provide some additional information about the new content.”
Being more specific about such design modifications, participant WD3 explained:
“For example, the body is divided into 4 frames-three frames are not updated; only 1 frame is updated with its content. Now, the screen reader will say 1 frame has
16
Babu & Singh
changed, and convey to the user “This area of the body has changed. “ Developers could even include frame names like “Main Content”, “Side Bar”, “Top Bar”, etc. Accordingly, the Screen Reader will read the frame name and tell the user exactly which one has changed.”
Developers attribute the inconsistency in LMS feedback to frame-based structures in LMS de-sign. Absence of descriptive titles in dynamic frames compounds the problem for BVI students. When they activate a link on the source LMS page, the only thing that changes is the course con-tent frame. This occasionally prompts the screen-reader to announce “Frame Four, Course Con-tent Updated”. However, because this announcement was (a) unconventional, (b) occasional, and (c) devoid of descriptive frame titles, it failed to effectively communicate to BVI students the identity of a newly loaded exam page, hence the confusion. Web developers also inform that the confusion problem can be potentially addressed through simple modifications in LMS design in-cluding unique and descriptive labels in the <<Title Attribute>> of each content frame and the use of ARIA tags to prompt the screen-reader to announce the descriptive label of the new frame loaded. From Web developers, we gather that with these design modifications, online exams could become more accessible and usable for BVI students. Moreover, these are very feasible and actionable design modifications.
Inaccessible Security Information Pop-Up A significant problem in LMS design for BVI users are inaccessible security dialogue boxes.
Results of BVI student assessment of LMS design A significant challenge for BVI students is their inability to access the security information pop-up and complete the online exam. Participants were unable to perceive, understand, or operate the dialogue box. We observed their failure to get past the security information dialogue box. This dialogue box appears immediately after a page with essay-type question loads and restricts the access screen-reader to itself – the user cannot navigate out of the dialog box. The only informa-tion participants hear is a “Yes” or “No” button. They could not understand the purpose of the dialogue nor decide what to do. Participants got trapped in the security dialogue box. This prob-lem turned out to be the most debilitating of all that BVI participants faced. Participants required sighted help to continue. The following is evidence of this problem as experienced by BVI3 and BVI5. The term “Jaws” referred to in this evidence is the screen-reader used by participants.
SR: Moving to another question will save this response… go to previous question button…
BVI5: Moving to another question will save this response, SR: Confirm question submission. Are you sure you want to … Press space
bar. BVI5: We are sure we want to go. So, I will press spacebar to continue. SR*: space. SR: Go to next question button. 4%. 84%. . BVI5: Waiting for. . SR: vertical bar. Go to last question button. Blank. vertical bar. Go to next
question button. vertical bar . Go to next question button. vertical bar. Go to. vertical bar. Go to next question button.
SR*: Enter. SR: Vertical bar. BVI5: Jaws is a bit slow right now.
17
Enhancing Learning Management Systems Utility for Blind Students
SR: 100%. table, column0, row0. no button. more info button. To activate. Yes button. no button. to activate. Yes button. To activate. No button. to activate, press space bar. Yes button. To activate, press space bar.
BVI5: There’s something to answer, yes or no. So, I will finally see if I can “Alt B” it.
SR*: alt B. alt B. BVI5: No. Can’t read it to me. I have a question. There is a yes No question on
my screen. What do I do? Q: Click on yes BVI5: I didn’t know what was in that dialogue box. SR*: Enter. SR: Table, column18, row1. BVI5: There apparently appeared a dialogue box that I could not read. But I
had a yes button and a no button. So, I asked the instructor for direc-tions.
BVI5 could negotiate the security information pop-up only with sighted intervention and avoided a more severe problem from inadvertently choosing “No”. However, other participants ran into more severe problems. For example, we present verbal reports from BVI3’s interaction below:
SR: Security information dialogue. To navigate use Tab…20% BVI3: Warning security. SR: Thirty three percent BVI3: Huh! This is weird. SR: Retail Certificate Dialogue. BVI3: This is a non-visual, this is a non-screen access thing. And I have no idea
what it did. It is still loading the page. And, it wants me to do something. Do we have any visual assistance?
SR: Thirty two percent. BVI3: I basically can't. . . My screen...Jaws is not reading anything except for
the progress bar announcements. And there’s something else on this screen.
Q: Do you need help? BVI3: You'd do better to do it with the mouse. SR: Retailed certificate dialogue. To navigate, use tab. BVI3: And that part is not accessible. SR*: tab. Escape. SR: Warning Security Dialogue. SR*: Escape. SR: Blackboard. SR*: Alt Tab. Alt Tab. SR: Blackboard Academic Suite. Microsoft internet explorer. BVI3: Let's see what we did. SR: No button, to activate. yes button, to activate. . Space bar. BVI3: Oh! It's asking me a question. Hang on. Let me see what it wants. SR*: Alt tab. Blackboard academic suite. Microsoft Internet Explorer. security
information dialogue. This page contains both secure and nonsecure... Do you want… .
BVI3: Yes we want to . . . SR: . . . (Silence)
18
Babu & Singh
BVI3: Now, it basically just stopped. Q: Where are you now? BVI3: I have no idea. SR: blackboard academic suite. Microsoft Internet Explorer. BVI3: It says blackboard academic suite. But I'm seeing absolutely nothing. I
need to get to question three. And right now, it's just, it's just not doing anything. So I'm gonna hit Alt Left Arrow. For some strange reason, I have a feeling . . Better yet, I'm going to hit the F5 key. It refreshes the screen. . . .
SR: . . . (Silence) BVI3: And that didn't seem to work. So I'm going to hit Alt+Left Arrow. Takes
us back. SR: blackboard academic suite. Microsoft Internet Explorer. SR*: Insert F7 SR: no links found. BVI3: And that didn't seem to work either. So unfortunately, I have to close this
out. But no worries, I can open it back. I will need sighted help to see what's going on. I'm stuck at some point. I don't know where I am. Noth-ing’s found.
The security information pop-up remained on the screen and the screen-reader did not announce it or anything other than percentage values intermittently separated by unusually long pauses. A few moments later, it announced “Retail Certificate” dialogue which completely blocked the LMS from the screen-reader. BVI3 tried different problem-solving strategies to access the exam with-out luck. The “Retail Certificate” appears on choosing “No” in the security information dialogue box and renders the screen-reader speechless; a BVI user cannot access any exam-related infor-mation. We would like the reader to understand that when a screen-reader is speechless, the com-puter is unresponsive to the BVI user – a situation comparable to a “Blue Screen of Death” for a sighted user. The main culprit is the security information dialogue box that is not completely per-ceivable, understandable, or operable through a screen-reader. BVI students must spend addi-tional time and effort trying to negotiate this dialogue. Our participants needed sighted assistance to move past this roadblock.
The security information pop-up problem involves two kinds of inconsistencies. There is incon-sistency between expected and observed outcomes to confirm submission of exam answers. The expected outcome of this action is the navigation to a subsequent question page, however, the observed outcome of this action changes if the question is in essay-type format - it brings up a Security Information dialogue box. The second inconsistency is between the expected and ob-served outcomes of the action to dismiss the security information dialogue, which can be dis-missed by a “Yes” or “No” in the dialogue box or through the escape key. The expected outcome is navigation to the next page, but the observed outcome changes: Choosing ‘No’ brings up a Re-tail Certificate and the Escape key does absolutely nothing. The inability to negotiate security information pop-up indicates gulfs of execution and evaluation. The gulf of execution is manifest in the failure to determine the correct action to dismiss the security information dialogue, and the gulf of evaluation is manifest in the inability to perceive the security information and difficulty understanding the “Yes” or the “No” buttons. This creates a serious roadblock for BVI students in completing exams online.
Result of WCAG assessment of LMS design The inaccessible security information pop-up violates two web accessibility principles: the ‘No Keyboard Trap’ principle; and the Compatibility principle.
19
Enhancing Learning Management Systems Utility for Blind Students
Violation of the No Keyboard Trap principle: This principle, in WCAG’s Success Criteria 2.1.2, requires that the keyboard focus should not be trapped by a Web page component. WCAG re-quires that Web sites allow users to move focus to and out of a component using the keyboard alone. WCAG requires the Web site to inform the user about the use of other standard exit meth-ods unequivocally. Violation of this principle results in the Web content "trapping" the keyboard focus in Web page subsections. This was shown in the example discussed where a dialogue box trapped the keyboard focus and BVI participants could not negotiate the security dialog. WCAG notes that these dialogue boxes often trap keyboard focus and recommends informing users of the keystrokes to exit the dialogue box before the launch of the dialogue box and within the dialogue box. However, the LMS we examined provided no such instruction at any stage. Consequently, BVI participants were lost in how to dismiss the security dialog.
Violation of the Compatibility principle: Covered by WCAG Guideline 4.1, this principle requires maximizing compatibility of Web sites with current and future screen-reading technology and makes three important recommendations:
a. Avoid using poorly formed markup that breaks the screen-reader. The LMS in our analysis does not follow this recommendation where the dialog “broke” the screen-reader.
b. Avoid using unconventional markups that circumvent the screen-reader. The LMS in our analysis failed on this account since the Security Information dialogue box circumvented the screen-reader and rendered it speechless.
c. Expose information in the content following standard techniques for screen-reader oper-ability. The LMS in our analysis did not comply with this recommendation. The screen-reader could not recognize or interact with the information contained in either of the Secu-rity dialogs.
WCAG notes that screen-readers have difficulty keeping up with rapid advances in Web technol-ogy. When Web design follows conventions and maintains compatibility with standards, screen-readers can work with emerging technologies.
Results of Web developer assessment of LMS design Web developer assessment identifies the source of the inaccessibility of security dialog as an alert dialogue box incompatible with screen-reading technology. Participants consistently attributed the use of an alert dialogue box by the LMS to inaccessibility and identified potential solutions.
“What happens here is that the system pops up a dialogue box that is not built in an accessible way. This pop-up is triggered by a Java applet. It is definitely possible to make this dialogue accessible. But obviously, not enough time was spent in analyzing this interaction between the Web page and the Java applet in triggering the pop-up.”
“It is advisable that developers do not use the alert dialogue box. Instead, they should use the simple command mode as in a confirm dialogue box.”
“Standard sites like Google and Microsoft allow the user to move between secured and unsecured sites in a minute. Basically, what happens is that the user gets only one confirmation dialogue that asks: “Moving from secure page to unsecure page. Do you want to go?” This is pretty simple.”
The security dialog was an application side alert dialogue that blocks access to the essay-type question page and is incompatible with screen-readers. BVI students fail to perceive, understand, or operate on this information. They simply become helpless and get trapped within the box - use of alert dialogs makes aspects of LMS inaccessible and unusable for the BVI student.
20

Babu & Singh
A feasible solution to address this problem is to use a confirm dialogue box to present security information. Screen-readers have easy access to information in a confirm dialogue box. Conse-quently, the information presented will be perceivable, understandable, and operable. BVI stu-dents can negotiate this content independently.
Obscure Input Area for Essay-Type Question The input area assigned for essay-type questions is partially unavailable or obscured for BVI us-ers. We explain the nature of this problem here.
Results of BVI student assessment of LMS design Obscurity of essay-question input areas results in significant ambiguity and confusion for BVI users in answering the question. This ambiguity is multi-facetted and has three components:
a. Response method: BVI students cannot readily determine how to record their answer - pick an option or type a response;
b. Text formatting tools: Text formatting tools are not evident and BVI Students are disori-ented in navigating them;
c. Difficulty locating text field: BVI students find it difficult, at times impossible, to locate the text box assigned for typing answer.
Evidence of this ambiguity is in verbal reports collected from every participant. We organize these verbal reports to highlight different aspects of the ambiguity.
Ambiguity in the response method Verbal reports show participants’ difficulty determining if the question requires choosing an op-tion from a selection or typing out a response.
SR: Blank link save. Question. How would you define web accessibility? BVI4: How would you define web accessibility? SR: Graphic question three answers. BVI4: So, I'm gonna hear the answers. SR: Same page link graphic. skip visual text editors. link graphic. Edit.
graphic text. Blank. blank. BVI4: Oh no I can't find the answers. I'm gonna go up until it says something
like answers...Maybe you have to type it? I'm gonna look and see if it says answers.
SR: Text blank link graphic blank same page link graphic question three an-swer blank how would you define blank click save find question three. Question completion status link blank blank table end.
BVI4: Maybe, you do have to type it because I'm not seeing anything that says answers. So, I should go back to where it says how would you define web accessibility?
SR: Five points link save blank how would you define web accessibility. Blank. graphic question three answers
BVI4: Oh! I found the answers. I'm gonna Enter on that. SR: Enter. out of table. menu frame. Frame. visited link. announcements. BVI4: Aww man! I can't find the answers. May be, I should look at the whole
thing. So I'm gonna go down. SR: Link external link link tools blank pause table link graphic communica-
tion collect graphic course ….
21
Enhancing Learning Management Systems Utility for Blind Students
BVI4: Gosh! Okay. SR: Link graphic link table end link blank blank menu frame course content
frame. BVI4: I think I'm getting to it. SR: Same page link e-learning visited link assignments link one web accessi-
bility exercise… Graphic and...heading level one heading link . BVI4: I'm going down. SR: Blank table with two frames. BVI4: Looking for the answers. SR: Instructions this list contains... Blank five list end blank multiple, list of
four test table.. Test table one blank blank… Blank table with graphic question.. Five points, how would you define. Blank graphic question three same page blank link graphic expanded blank text style.
BVI4: I think I did find the answers. Maybe not. SR: Text style combo box one of eight blank font size. BVI4: I think expanded is one of the answers. SR: Blank text text blank. BVI4: It just sounded different. May be, I went to something wrong. Well, I
thought I messed up on it. I'm going up to where it says expanded. SR: Graphic expanded. BVI4: It's one of the answers I think. I'm gonna Enter on it. SR: Answer table column one row three expanded visited link graphic. BVI4: Gosh!
BVI4 could not determine how to appropriately respond in the essay-type question. The screen-reader announced a page object as “Graphic Link Question 3 Answers”. This created an expecta-tion that multiple answer choices of a question lay ahead. The link “Expand” were particularly distractive for participants; one user mistook it as a possible answer while another expected an input field. These contributed to confusion about the appropriate response.
Ambiguity about text formatting tools Verbal reports show participants’ difficulty perceiving the affordances of formatting tools in an-swering questions in the LMS. Participants were disoriented in navigating the tools. To a screen-reader, the formatting tools appear interspersed in the question text and the edit box. Poorly la-beled tools disoriented students, losing them in unfamiliar interface objects.
BVI1: Now I answer question three. So, now I'm going to try to... SR: Question three. Five points, how will you define web accessibility.
Blank. Graphic question three answers. Expand. . . Text style. Same page link graphic. Italic. same.. fonts. formats....
BVI1: Down arrow, down arrow. SR: Same page link graphic align left...click submit to submit this assessment. BVI1: I don't understand what this is. I don't really understand what's going on
with this part of the question, with the Internet. I don't understand why it's saying a whole bunch of superscript, numbering, bullets, indents, it’s kind of tough. It's not really telling me. I mean, it’s far more easier to do like radio buttons when it came to like five out of four when it was like multiple choice that way. Otherwise, if it’s this way it’s harder, it’s much more tough.
Q: How did you know that it is not a multiple choice question?
22
Babu & Singh
BVI1: Because it didn't say...because it said multiple attempts on the first ques-tion. But I don't really know how to answer these. I don't understand how to really answer them.
SR: Question 3 text question 3, 5 points. BVI1: Oh! It's text questions. You have to write your answers into it. Got it.
The evidence highlights the ambiguity of BVI1 regarding the purpose of text formatting controls below the question text. He could not perceive the affordances of these objects in the context of answering the question. He came across a link labeled “Skip Visual Text Edit Buttons.” He was unable to make the connection between the link and its purpose - jump over these controls to the edit box. All this contributed to the ambiguity about the text formatting tools.
Difficulty locating text field Verbal reports show participants’ difficulty in finding the text box to type their answers to the essay-type question.
SR: Five points. how will you define web accessibility? BVI2: How would I define web accessibility? Keeping in my mind, I am going
to go down the edit field and type the answer. SR: Blank. Text style. Same page link graphic italic, same.. fonts, formats....
. . Same page link graphic. Align left...Click submit to submit this as-sessment
BVI2: I am having difficulty. I need to enter into the edit field and answer the question. But it’s not reading the edit field. It’s reading the forms mode, but not reading the edit field. I'm on the webpage and I can't seem to find the edit field.
SR: Collapse. Frame. Blank. Frame end. BVI2: Last time between the frame and frame end there was the edit box where
I could type the answer in; now it is not. It just says blank. Don't know what to do.
BVI2 could not locate the edit box to type his response - the difficulty was insurmountable. Unlike the sighted, a BVI student cannot instantly recognize that a question requires typing a re-sponse from quick visual scans. The screen-reader announcements were interpreted by the BVI student as a place to type something as evidenced in the verbal reports:
Q: Can you tell how you concluded that this question required you to type an answer considering you were unsure a few minutes back?
BVI1: What I did was I figured, because I read the beginning of the question before and it said text style which I thought write your answer. And when it said “Edit,” “expanded,” something, “links,” and then I pressed the up arrow and it said “Edit,” I just wrote my response to that question.
In the essay question, the LMS organizes relevant components in this order: instruction; question text; a bunch of interface objects (e.g., text formatting tools, etc.); edit box; and other interface objects (e.g., link Expand, Collapse, etc). A BVI student tries to locate the screen-reader an-nouncement “Edit” in the middle of a long announcement stream of labels of surrounding objects. Locating the edit box was a significant challenge for participants. BVI participants spent extra time and effort due to this ambiguity and some could not continue with the online exam.
Systems interaction problems indicate a gulf between the user’s cognition of the system and the actual behavior of the system. According to this tenet, ambiguity in answering essay questions
23
Enhancing Learning Management Systems Utility for Blind Students
involves discrepancies between the expected and observed outcomes of the action. The screen-reader reads information sequentially from top left to bottom right and the user has access to only a small chunk of this information at a given time. They do not hear the edit box in the page. In-stead, they hear individual formatting tools on multiple lines. According to the Action Model (Norman, 1988), ambiguity in essay-type question pages indicates a gulf of evaluation that mani-fests as difficulty to determine a response, difficulty to perceive affordances of text formatting, and difficulty to understand that the edit box lies beyond these tools.
The expected outcome of Confirming Question Submission is navigation, while the observed out-come for BVI students’ changes; for if the subsequent question is in essay-type format it brings up a Security Information dialogue box.
Result of WCAG assessment of LMS design Our analysis explains that the problem of an obscured input area in LMS for essay-type questions represents a violation of six design principles on Web accessibility or usability. These principles include:
Sensory Characteristic principle of Web accessibility;
Link Purpose principle of Web accessibility;
Name, Role, Value principle of Web accessibility;
Visibility principle of Web usability;
Learnability and Efficiency principles of Web usability;
Good Mapping principle of Web usability
In the following, we discuss how the LMS design violates each of these principles.
Violation of the Sensory Characteristic principle: WCAG’s Success Criterion 1.3.3 requires that instructions to help users understand and operate Web content should not rely exclusively on sen-sory characteristics of an object such as visual location or orientation. WCAG recommends pro-viding additional instruction so users do not lose information due to inaccessible formats. The LMS in our analysis relies on visual location and orientation of interface objects to communicate information related to the response method and the utility of text formatting tools for essay-type questions. It did not include any instruction text informing students about the availability of the input field beyond the question text and the text formatting toolbar.
Violation of the Link Purpose principle: WCAG’s Success Criterion 2.4.4 asserts “The purpose of each link can be determined from the link text alone or from the link text together with its pro-grammatically determined link context.” The intent is to help users understand the utility of a link. Our BVI participants could not understand the purpose of many links on the essay-type question page. Noteworthy is the link labeled “Expand;” BVI participants were not able to under-stand its purpose. The poor labeling and its position below the question text were misleading for the BVI students.
Violation of the Name, Role, Value principle: WCAG’s Success Criterion 4.1.2 requires that names and roles of all interface objects should be programmatically determined. It further re-quires that states, properties, and values that can be set by the user should be programmatically set. It requires that notification of changes to these items be available to the screen-reader to en-sure that the screen-reader can access information pertaining on the state of interface objects in a Web page. In our analysis, the input area in the essay-type question page did not have a name or a label describing the purpose. There was no label whatsoever, explicit or implicit, that the screen-readers employed that participants could access.
24
Babu & Singh
Violation of the Visibility principle: Norman (2002) requires Web design to help users readily perceive the state of a Web site and derive action alternatives by just observing. In our analysis BVI participants could not find the text box for the essay-type question.
Violation of the Learnability and Efficiency principles: These principles of usability discussed in Nielsen (1993) are interrelated. The Learnability principle helps make first-time users productive and efficient. The Efficiency principle helps users accomplish Web interaction tasks quickly without spending much cognitive effort once they have learned the Web site. Our analysis shows that BVI participants spent a lot of time and effort locating the input field and understanding the utility of the text formatting controls. This had adversely affected their productivity and BVI us-ers often required sighted intervention.
Violation of the Good mapping principle: Norman (2002) requires that Web design help users determine the relationships between actions and results, between the controls and their effects, and between the system state and what is visible. In our analysis BVI participants were unable to determine the relationship between the text formatting tools and their effect. They could not un-derstand the consequences of activating links.
Results of Web developer assessment of LMS design Our analysis of Web developer assessment informs that the source of the obscurity of the input area for essay-type question problems is the poor labeling convention for three interface objects:
a. A graphic “Question Three Answers” that created confusion in the appropriate response;
b. A text formatting toolbar that created confusion about formatting controls; and
c. An edit box where it was difficult to locate the text area for typing an answer.
Participants identified a graphic right below the question text that was assigned a misleading la-bel. The label “Graphic Question Three Answers” created a false expectation about possible an-swers. Participants identified a text formatting toolbar without a label. They explained that this confuses screen-reader users leading to disorientation. Participants pointed out that the text area did not have a descriptive caption. Evidence of this explanation in the form of summarized re-sponses of participants is provided:
“We need information before we enter the text area field. This information is not available here. And that particular graphic that says “Question 3 answers” is mis-leading.”
Responding to the question about the problem source, WD3 identified the misleading graphic, and suggested improvements in the LMS design as follows:
“Instead of saying Question 3 Answer, it could say “Space to enter answer for ques-tion 3”. So, that could be just a question of modifying that label to be more descrip-tive.”
Recognizing a lack of clear guidance for screen-reader users about the response, WD5 observed:
“One solution may be to add in a description of what’s going to come in immediately as you are pulling up a text area. It’s definitely possible to ensure that for the text area, you insert a short description that is only visible to the screen reader.”
About the disorientating effect of the poorly labeled text formatting toolbar, WD1 observed:
25
Enhancing Learning Management Systems Utility for Blind Students
“You are provided a space to enter a long form answer. And that space includes a toolbar that has buttons which allow you to format the text you are entering. It is confusing for a screen-reader user.”
Further elaborating on this point, WD2 explained its negative implications for the BVI user as follows:
“These are all text formatting options that the user is not supposed to read. This is the first mistake. If there were only 5 to 6 options, then the user could have been able to make out where the screen-reader announced “Edit”. Because there are thirty to forty announcements that correspond to specific options, the user gets confused.”
WD2 further explained:
“I think that HTML syntax must not be put into readable content. The 2nd thing is that the design should be in a way that the contents are grouped correctly; users must know which section they are going into so that they are able to make the decision whether to go or not to go.”
On the topic of a text area with no descriptive caption, participant WD1 explained:
“The text area currently doesn’t have a caption associated with it. For any text box or input control they say that you should put the caption or label.”
On this same topic, participant WD2 said:
“Here the problem is the developer has not surrounded the input attribute with a la-bel.”
WD4 discussed the problem of caption-less text area as follows:
“If there is a question, it should be provided with some label saying this is Question one. If there is an input text box, we must define it by saying that this particular text box is being used for answering question number one. That will be very informative for the user.”
The source of the obscured input area is a lack of appropriate labels for three interface objects relevant to an essay-type question: a graphic, a set of formatting tools, and an edit box. Remedial measures to potentially address this include:
(1) Replace “Question Three Answers” with “Space to Type Question Three Answer”;
(2) Provide a label for the text formatting toolbar to tell the user about the edit box; and
(3) Include a meaningful caption such as “Type your answer for question 3 here”.
It should be noted that these are suggestions offered by developers and not design principles. They have the potential to remove the ambiguity problem and are worth further investigation and verification.
Practical Implications Results demonstrate the efficacy and feasibility of the TUME technique in providing more com-plete, practically-relevant, solution-oriented assessment of LMS accessibility and usability as a test-taking tool for BVI students. The three question formats used are also common in Web-based
26
Babu & Singh
surveys, online job applications, and online college applications. In addition, they represent the standard forms of information input for web forms. Therefore, while the context of the study was a particular LMS, the usability issues that BVI students encountered here are conceivably com-mon to other forms of entering information on the web.
Our findings have significant implications for BVI e-learning, educators, and learning technolo-gists. BVI students currently face significant challenges due to a lack of accessibility and usabil-ity of e-learning tools. The TUME technique can help create more accessible and usable e-learning environments where BVI students can function and learn effectively.
Academic institutions are required by laws on equal Web access, such as the Americans with Disabilities Act and Section 508 of the Rehabilitation Act, to make their e-learning implementa-tions accessible to students with disabilities. While existing evaluation techniques could possibly aid in providing technical accessibility, they do not ensure effective access for such students. The TUME technique can help academic institutions avoid litigation by assessing the effective acces-sibility of e-learning tools for BVI students. Our future research will investigate if the TUME technique is extendible to students with other disabilities.
Web developers, including learning technologists, are unaware of BVI students’ unique Web ac-cessibility and usability needs. Design standards such as the Web Content Accessibility Guide-lines are good starting points, but they are difficult to comprehend and implement (Clark, 2006). The TUME technique provides actionable guidance in creating more accessible and usable e-learning environments for the BVI user. The solutions identified by TUME are feasible to imple-ment since they consider the technical feasibility perspectives of Web developers.
With further validation and generalization across more problems, the evaluations presented here can provide the basis for developing design principles that lead to accessible, usable, and useful LMS for BVI students. Such design principles can form the basis for automation of Web accessi-bility and usability evaluation for non-visual interaction (NVI). NVI assumes significance in mo-bile and ubiquitous learning environments, as well as in multi-tasking situations.
Conclusion This paper presented a novel task-oriented, user-centered, multi-method evaluation (TUME) technique for a holistic, practically-relevant, solution-oriented assessment of the accessibility, usability, and utility of a Web-based application. A Web-based task is the unit of analysis for this evaluation. This is more useful than traditional evaluation methods that perform an interface-element-wise assessment of accessibility and usability. Using the task context of an online exam, the paper demonstrated the utility of the TUME technique to evaluate a learning management system (LMS) for blind and visually impaired (BVI) users. This evaluation synthesized the results of:
(1) BVI student assessment using verbal protocol analysis;
(2) WCAG assessment using text analysis;
(3) Web developer assessment using structured, open-ended interviews.
It showed how to identify design errors in a LMS task environment, the consequent problems (challenges and roadblocks) BVI students face in completing this task, the technical sources of these problems, and remedial measures to potentially improve LMS utility as a test-taking tool for the BVI student. This provides a more complete, practical, and solution-oriented approach to ac-cessibility and usability evaluation. Completeness is achieved through synthesis of the viewpoints of the user, Web accessibility and usability standards, and the Web developer – three key entities in Web accessibility and usability. The practical utility comes from its task-oriented nature that
27
Enhancing Learning Management Systems Utility for Blind Students
places accessibility and usability of a Web-based application in the context of a task it was de-signed to support. The solution-oriented aspect is that it provides actionable guidance on address-ing a problem and not just identifying it. Such evaluation will help academic institutions enhance the success of their e-learning implementations by accommodating students for whom non-visual interaction is a necessity. Currently, we are conducting a large-scale evaluation of commonly used e-learning tools to identify a comprehensive set of accessibility and usability problems for BVI students and other groups who use NVI.
The TUME technique is useful to make conjectures about design modifications that can poten-tially meet the accessibility and usability needs of BVI users in a Web interaction task. Such con-jectures must undergo a validation process before becoming task-specific design principles on accessibility and usability for Web-based applications. These design principles guide the devel-opment of IT artifacts to effectively improve accessibility and usability. As this paper shows, the solution can be simple design modifications to the LMS interface, which can be achieved at a rea-sonable cost to the developer. For instance, modifying the design of an essay-type question page to include a short message underneath the question text or inserting a caption for the input area can be simple adjustments for the developer. However, these adjustments help improve the visi-bility of the input area and reduce ambiguity and disorientation for BVI students. Potential design solutions such as those identified in this paper are under evaluation in our on-going research em-ploying an experimental design with BVI students and using a prototype online exam interface.
The Americans with Disabilities Act, Section 508 of the Rehabilitation Act, and Individuals with Disabilities & Education Act require that learning tools such as LMS are accessible and usable to BVI students. In this backdrop, our finding that a commonly used LMS lacks accessibility and usability assumes significance for academic institutions and education technologists. Our multi-method evaluation can help the industry and academia feasibly meet their social, moral, and legal obligations by ensuring the accessibility and usability of LMSs and other Web applications.
TUME has value beyond LMS and BVI users. It can be used to test the accessibility and usability of specific task environments offered by website genres other than LMS, including social media, healthcare portals, online stores, and electronic libraries. It provides improved accessibility and usability evaluation for non-visual interaction. NVI is needed in mobile and ubiquitous comput-ing environments that have little to no displays. NVI assumes significance in multi-tasking situa-tions where one task demands complete visual attention, for example a motorist reading direc-tions while focusing on the road ahead. The TUME approach is extensible to other user types in-cluding both typical and atypical groups. For example, it may be feasibly adapted to test LMS accessibility, usability, and utility for older adults with limited dexterities. In summary, TUME has value for the evaluation of systems accessibility and usability in general.
References Alavi, M., & Gallupe, B. R. (2003). Using information technology in learning: Case studies in business and
management education programs. Academy of Management Learning & Education, 2(2), 139-153.
American Foundation for the Blind. (2008). Facts and figures on Americans with vision loss. Retrieved from http://www.afb.org/Section.asp?SectionID=15&DocumentID=4398
Armstrong, H. L. (2009). Advanced IT education for the vision impaired via e-learning. Journal of Infor-mation Technology Education: Research, 8, 243-257. Retrieved from http://www.jite.org/documents/Vol8/JITEv8p243-256Armstrong685.pdf
Arroway, P., Davenport, E., Xu, G., & Updegrove, D. (2010). Educause core data service. Fiscal year 2009 summary report. Boulder, CO: Educause.
28
Babu & Singh
Babu, R. (2011). Developing an understanding of the accessibility and usability problems blind students face in web-enhanced instruction environments. (Doctoral Dissertation). Retrieved from ProQuest Dis-sertations and Theses. (Accession Order No. AAT 3473492)
Babu, R., & Singh, R. (2009). Evaluation of Web accessibility and usability from blind users’ perspective: The context of online assessment. Proceedings of The Fifteenth Americas Conference on Information Systems. San Francisco, CA: ACM.
Babu, R., Singh, R., & Ganesh, J. (2010). Understanding blind users' Web accessibility and usability prob-lems. AIS Transactions on Human Computer Interaction, 2(3), 78-91.
Babu, R., Singh, R., Iyer, L.S., & Midha, V. (2007). Differences in factors affecting academic success for disabled individuals in technology-mediated learning environments. Proceedings from AMCIS 2009: Thirteenth Americas Conference on Information Systems. Keystone, CO.
Brophy, P., & Craven, J. (2007). Web accessibility. Library Trends, 55(4), 950-972.
Brown, L. M., & Kaaresoja, T. (2006, April). Feel who's talking: Using tactons for mobile phone alerts. In CHI '06 Extended Abstracts on Human Factors in Computing Systems (pp. 604-609). New York, NY: ACM.
Christian, K., Kules, B., Shneiderman, B., & Youssef, A. (2000). A comparison of voice controlled and mouse controlled web browsing. Proceedings of the Fourth International ACM Conference on Assis-tive Technologies, Arlington, VA (pp. 72-79). New York, NY: ACM.
Clark, J. (2006). To hell with WCAG 2. A List Apart. Retrieved from http://www.alistapart.com/articles/tohellwithwcag2
Correani, F., Leporini, B., & Paternò, F. (2004). Supporting usability for vision impaired users in web navigation. User-Centered Interaction Paradigms for Universal Access in the Information Society: Eighth ERCIM Workshop on User Interfaces for All, Vienna, Austria. 242-253.
Cotton, D., & Gresty, K. (2006). Reflecting on the think-aloud method for evaluating E-learning. British Journal of Educational Technology, 37(1), 45–54.
Crabtree, B. F., & Miller, W. L. (Eds). (1999). Doing qualitative research in primary care: Multiple strate-gies (2nd ed.). Newbury Park, CA: Sage Publications.
De Smet, C., Bourgonjon, J., De Wever, B., Schellens, T., & Valcke, M. (2012). Researching instructional use and the technology acceptation of learning management systems by secondary school teachers. Computers & Education, 58, 688–696.
Di Blas, N., Paolini, P., & Speroni, M. (2004, June). Usable accessibility to the web for blind users. Pro-ceedings of the 8th ERCIM Workshop: User Interfaces for All. Vienna, Austria.
Ericsson, K. A., & Simon, H. A. (1993). Protocol analysis: Verbal reports as data. London: MIT Press.
Ericsson, K. A., & Simon, H. A. (1984). Protocol analysis: Verbal reports as data (2nd ed.). Cambridge, MA: MIT Press.
Freire, A. P., Goularte, R., & Fortes, R. P. (2007, October). Techniques for developing more accessible web applications: A survey towards a process classification. Proceedings from the 25th Annual ACM International Conference on Design of Communication (pp. 162-169). El Paso, TX: ACM.
Greenbaum, J., & Kyng, M. (1991). Design at work: Cooperative design of computer systems. Philadel-phia, PA: Psychology Press.
Goodhue, D. L. (1986). IS attitudes: Towards theoretical definition and measurement clarity. Proceedings from the Seventh International Conference on Information Systems, San Diego (pp. 181-194).
Goodwin, N. (1987). Functionality and usability. Communications of the ACM, 30(3), 229-233.
Hamuy, E., & Galaz, M. (2010). Information versus communication in course management system partici-pation. Computers & Education, 54, 169-177.
29
Enhancing Learning Management Systems Utility for Blind Students
Heim, S. (2007). The resonant interface: HCI foundations for interaction design. Boston, MA: Addison-Wesley Longman Publishing.
Jana, R. (2009, September 23). How tech for the disabled is going mainstream. Businessweek. Retrieved from: http://www.businessweek.com/stories/2009-09-23/how-tech-for-the-disabled-is-going-mainstream
Katz-Haas, R. (1998). Ten guidelines for user-centered web design. Usability Interface, 5(1).
Kelly, B., Sloan, D., Phipps, L., Petrie, H., & Hamilton, F. (2005). Forcing standardization or accommodat-ing diversity? A framework for applying the WCAG in the real world. Proceedings from the 2005 In-ternational Cross-Disciplinary Workshop on Web Accessibility, Chiba, Japan (pp. 46-54).
Kim-Rupnow, W. S., & Burgstahler, S. (2004). Perceptions of students with disabilities regarding the value of technology-based support activities on postsecondary education and employment. Journal of Special Education & Technology, 19(2), 43-56.
King, M., Thatcher, J. W., & Easton, R. (2005). Managing usability for people with disabilities in a large Web presence. IBM Systems Journal, 44(3), 519-535.
Krug, S. (2005). Don't make me think: A common sense approach to Web usability (2nd ed.). Thousand Oaks, CA: New Riders Publishing.
Lazar, J., Allen, A., Kleinman, J., & Malarkey, C. (2007). What frustrates screen reader users on the Web: A study of 100 blind users. International Journal of Human-Computer Interaction, 22(3), 247-269.
Leuthold, S., Bargas-Avila, J. A., & Opwis, K. (2008). Beyond Web content accessibility guidelines: De-sign of enhanced text user interfaces for blind internet users. International Journal of Human-Computer Studies, 66(4), 257-270.
Lonn, S., & Teasley, S. D. (2009). Saving time or innovating practice: Investigating perceptions and uses of learning management systems. Computers & Education, 53, 686–694.
Lumsden, J., & Brewster, S. (2003, October). A paradigm shift: Alternative interaction techniques for use with mobile & wearable Devices. Proceedings from the Thirteenth Annual IBM Centers for Advanced Studies Conference (CASCON’03), Markham, Ontario, Canada.
Mankoff, J., Fait, H., & Tran, T. (2005, April). Is your Web page accessible? A comparative study of methods for assessing Web page accessibility for the blind. Proceedings of the SIGCHI Conference on Human Factors in Computing Systems, 41-50. ACM.
McCormick, J. (2000). The new school. Newsweek, 135(17), 60-62.
Millar, S. (1994). Understanding and representing space: Theory and evidence from studies with blind and sighted children. Oxford: Oxford University Press.
Moss, T. (2006). The new W3C accessibility guidelines evaluated. Retrieved from http://www.webcredible.co.uk/user-friendlyresources/web-accessibility/wcag-guidelines-20.shtml
Murray, M., Perez, J., Geist, D., & Hedrick, A. (2012). Student interaction with online course content: Build it and they might come. Journal of Information Technology Education: Research, 11, 125-140. Retrieved from http://www.jite.org/documents/Vol11/JITEv11p125-140Murray1095.pdf
Neumeier, P. (2005). A closer look at blended learning: Parameters for designing a blended learning envi-ronment for language teaching and learning. Recall, 17(2), 163-178.
Newell, A., & Simon, H.A. (1972). Human problem solving. Englewood Cliffs, NJ, Prentice-Hall.
Nielsen, J. (1993). Usability engineering. San Diego, CA, Morgan Kaufmann.
Norman, D. A. (1988). The design of everyday things. New York: Basic Books.
Norman, D. A. (2002). The design of everyday things (2nd ed.). New York: Basic Books
Pituch, K. A., & Lee, Y. K. (2006). The influence of system characteristics on E-learning use. Computers & Education, 47, 222–244.
30
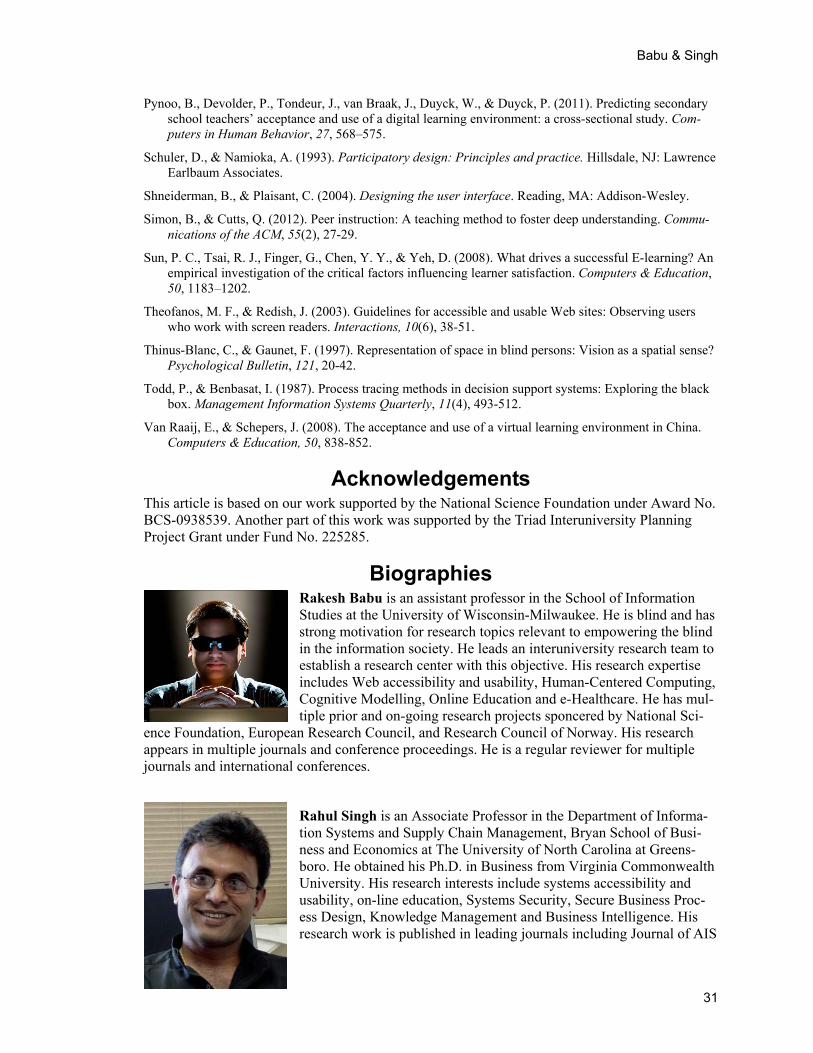
Babu & Singh
Pynoo, B., Devolder, P., Tondeur, J., van Braak, J., Duyck, W., & Duyck, P. (2011). Predicting secondary school teachers’ acceptance and use of a digital learning environment: a cross-sectional study. Com-puters in Human Behavior, 27, 568–575.
Schuler, D., & Namioka, A. (1993). Participatory design: Principles and practice. Hillsdale, NJ: Lawrence Earlbaum Associates.
Shneiderman, B., & Plaisant, C. (2004). Designing the user interface. Reading, MA: Addison-Wesley.
Simon, B., & Cutts, Q. (2012). Peer instruction: A teaching method to foster deep understanding. Commu-nications of the ACM, 55(2), 27-29.
Sun, P. C., Tsai, R. J., Finger, G., Chen, Y. Y., & Yeh, D. (2008). What drives a successful E-learning? An empirical investigation of the critical factors influencing learner satisfaction. Computers & Education, 50, 1183–1202.
Theofanos, M. F., & Redish, J. (2003). Guidelines for accessible and usable Web sites: Observing users who work with screen readers. Interactions, 10(6), 38-51.
Thinus-Blanc, C., & Gaunet, F. (1997). Representation of space in blind persons: Vision as a spatial sense? Psychological Bulletin, 121, 20-42.
Todd, P., & Benbasat, I. (1987). Process tracing methods in decision support systems: Exploring the black box. Management Information Systems Quarterly, 11(4), 493-512.
Van Raaij, E., & Schepers, J. (2008). The acceptance and use of a virtual learning environment in China. Computers & Education, 50, 838-852.
Acknowledgements This article is based on our work supported by the National Science Foundation under Award No. BCS-0938539. Another part of this work was supported by the Triad Interuniversity Planning Project Grant under Fund No. 225285.
Biographies Rakesh Babu is an assistant professor in the School of Information Studies at the University of Wisconsin-Milwaukee. He is blind and has strong motivation for research topics relevant to empowering the blind in the information society. He leads an interuniversity research team to establish a research center with this objective. His research expertise includes Web accessibility and usability, Human-Centered Computing, Cognitive Modelling, Online Education and e-Healthcare. He has mul-tiple prior and on-going research projects sponcered by National Sci-
ence Foundation, European Research Council, and Research Council of Norway. His research appears in multiple journals and conference proceedings. He is a regular reviewer for multiple journals and international conferences.
Rahul Singh is an Associate Professor in the Department of Informa-tion Systems and Supply Chain Management, Bryan School of Busi-ness and Economics at The University of North Carolina at Greens-boro. He obtained his Ph.D. in Business from Virginia Commonwealth University. His research interests include systems accessibility and usability, on-line education, Systems Security, Secure Business Proc-ess Design, Knowledge Management and Business Intelligence. Hisresearch work is published in leading journals including Journal of AIS
31

Enhancing Learning Management Systems Utility for Blind Students
32
(JAIS), IEEE Transactions on Systems Man and Cybernetics, AIS Transactions on Human Com-puter Interaction, Communications of the ACM, European Journal of Information Systems. He is the Editor-In-Chief for the Journal of Information Science and Technology (JIST). He is a mem-ber of the editorial board for the International Journal of Semantic Web and Information Systems, the International Journal for Intelligent Information Technologies, the Journal of Information Technology Theory and Applications, and the International Journal of Information Security and Privacy.
Journal of Information Technology Education: Research Volume 12, 2013
A Survey of ICT Competencies among Students in Teacher Preparation Programmes at the University of Benin, Benin City, Nigeria
R. B. Danner Department of Educational Psychology and Curriculum Studies,
University of Benin, Benin City, Edo State, Nigeria
C. O. A. Pessu Girls’ Model Secondary School Ewvreni,
Delta State, Nigeria
Executive Summary Today’s fast-paced world is becoming increasingly characterized by technology driven communi-cation, which has transformed the world into a large global connected community with ever-increasing outreach of information and communication technology (ICT). Technology plays an increasingly important role in people’s lives, and it is envisaged that technological literacy will soon become a functional requirement for people’s work, social, and even personal lives. For both social and economic reasons students will need computer and communication technology skills if they are to live successfully in a knowledge-based society. The purpose of this study is to examine the ICT usage habits and the self-assessed ICT competencies possessed by undergradu-ate students in teacher preparation programmes in the University of Benin. A second important issue that was addressed was whether there were significant differences in the perceived ICT competency among students according to demographic and study related factors. Thus, the pa-per’s central research objectives are:
To examine the ICT usage habits of students in teacher preparation programmes.
To examine the self-assessed ICT skills’ competencies possessed by students in teacher preparation programmes.
To determine whether there were significant differences in perceived ICT competencies among students in teacher preparation programmes according to demographic and study
related factors (gender, and type of computer training).
A descriptive survey was adopted and the target population was all students in levels 200, 300, and 400 of the faculty of education, University of Benin. The instrument for data collection was a questionnaire adapted from Bassey, Akuegwu, Udida, Ntukidem, and Eka-bua (2007). The results show that:
Material published as part of this publication, either on-line or in print, is copyrighted by the Informing Science Institute. Permission to make digital or paper copy of part or all of these works for personal or classroom use is granted without fee provided that the copies are not made or distributed for profit or commercial advantage AND that copies 1) bear this notice in full and 2) give the full citation on the first page. It is per-missible to abstract these works so long as credit is given. To copy in all other cases or to republish or to post on a server or to redistribute to lists requires specific permission and payment of a fee. Contact [email protected] to request redistribution permission.
Editor: Jane Nash
Survey of ICT Competencies
Students’ ICT usage was low, particularly the use of internet and email.
The respondents perceived themselves to be good in word processing and file navigation, moderate in Internet browsing and emailing. Only two percent (2%) of the respondents perceived themselves to be competent in PowerPoint with about seventy percent (70%) having no capability at all.
There was no significant difference in the perceived competency among students accord-ing to gender and academic year/level. However, there was significant difference in the perceived competency among students according to the type of computer training, with those with formal computer training perceiving themselves to be most competent in ICT skills.
From the findings, the lack of access to computers and Internet connectivity within the faculty present a serious issue affecting staff and students’ use of ICT applications.
It is therefore recommended that government should make funds available for the provision of ICT infrastructure in tertiary institutions in the country. Also special funds should be set aside to revamp the e-learning centres at the faculty level for students and faculty/staff use.
Keywords: ICT skills, ICT competencies, technologies, pedagogy, teacher preparation pro-grammes
Introduction Today’s fast-paced world is becoming increasingly characterized by technology-driven commu-nication, which has transformed the world into a large global connected community with ever-increasing outreach of information and communication technology (ICT). ICT refers to the range of technologies that are applied in the process of collecting, storing, editing, retrieving, and trans-fer of information in various forms (Olakulehin, 2007). The Federal Ministry of Education, Nige-ria (2010) defines ICT as encompassing all equipment and tools (inclusive of traditional tech-nologies of radio, video, and television to the newer technologies of computers, hardware, firm-ware, etc.), as well as the methods, practices, processes, procedures, concepts, and principles that come into play in the conduct of the information and communication activities. The importance of technology in people’s lives is unimaginable and it is envisaged that technological literacy will soon become a functional requirement for people’s work, social, and even personal lives. For both social and economic reasons students will need computer and communication technology skills to live successfully in a knowledge-based society.
Education is the first and best key area for ICT applications. ICT is often perceived as a catalyst for change, change in teaching styles, and change in learning approaches and in access to infor-mation (Watson, 2005). ICTs can help by providing alternative possibilities for education (Casal, 2007). Use of different information communication technologies has become inevitable for stu-dents in learning. By using modern information communication technologies, students can re-trieve required information within a short time. They can access and disseminate electronic in-formation such as e-books and e-journals and can improve their learning by using different mod-ern ICTs in form of wireless networks, internet, search engines, databases, websites, and web 2.0 technologies. Teachers are a vital link in the education chain, and for education to truly respond to the needs of 21st century, they must play a central role in leveraging technology, and in par-ticular, using new and old Information and Communication Technology (ICT) devices in teaching and learning. What kind of skills will teachers need to acquire in order to be effective in an ICT based learning environment? This study will address this issue by highlighting the experiences of teachers using ICT in Nigeria, and offering some further examples of established ICT teaching and learning applications in other developing and developed countries. However, how prepared
34

Danner & Pessu
are the teachers in Nigerian classrooms to deliver 21st century education? The challenge in Nige-ria today is not only shortage in the availability of teachers who are ICT-competent, but the need to move from learning to use ICT to using ICT to learn.
There is a need for capacity building to improve and update the quality of the existing teaching force, and also to ensure that teacher education programmes integrate content, pedagogy, and technology (Hughes, 2005; Koehler, Mishra, & Yahya, 2007). The need for training in the use of ICT applications for teachers has been given top priority by government in the developed world. For instance, all British teachers were expected to have undergone training in the use of ICT by 2002. Teachers were equally supported in the purchase of personal home computers. Through these initiatives it is envisaged that many more teachers will be encouraged to explore the possi-bilities of ICT and increase their confidence in the use of computers (Department for Education and Employment (DfEE), (2000). The use of ICT in teacher education has been widely studied and documented especially the positive influence of ICT in teacher education (Kay, 2006; Mur-ray, Nuttall & Mitchell, 2008), the use of ICT as instructional tool (Murray et al., 2008; Ryan & Scott, 2008). Very few studies have been carried out in Nigeria on the use of ICT in education (Jegede, 2008; Ololube, 2007). These studies investigated attitude and competence in the use of computers by academic and non-academic staff in Nigerian higher institutions.
The purpose of the present study was to analyze the pattern of ICT usage habits and perceived competency possessed by undergraduate students in teacher preparation programmes in the Uni-versity of Benin. Another important issue that was addressed was whether there were significant differences in the perceived ICT competency among students according to demographic and study related factors. Thus, the paper’s central research objectives are:
To describe the ICT usage habits of students in teacher preparation programmes.
To examine the perceived ICT competencies of students in teacher preparation pro-grammes.
To determine whether there were significant differences in perceived ICT competencies among students in teacher preparation programmes according to demographic and study related factors (gender, academic year/level and type of computer training).
Literature Review
Use of ICT in Higher Education Today, a great number of experiences with educational technology in higher education exist worldwide, especially in the developed world. This has resulted in new opportunities in the inte-gration of pedagogical and technological resources, which has enlarged flexibility across the learning process. It has equally improved the communication between lecturers and students and the interaction between different educational resources. Oliver (2002) asserts that the use of ICT in higher education enhances student-centered learning.
Within higher education, one of the major teaching challenges has always been helping students to bridge the gap between knowledge and real life practice. This is especially important in applied academic disciplines such as education where professional knowledge is constantly being re-newed and recreated through real practice (Cheetham & Chivers, 2001). The National Policy on ICT in Education and Framework launched in 2010 presents a holistic and broad vision for ICT integration in the education sector in Nigeria. This policy moves beyond a basic technology liter-acy approach. Rather, it focuses on leveraging technology to transform the roles of the teacher and the learner in the classroom. It has been widely acclaimed that for Nigeria’s vision 20:2020 (the economic blueprint aimed at placing Nigeria among the biggest 20 economies in the world
35
Survey of ICT Competencies
by 2020) to be achieved, education, especially teacher development, will play a key role and ICT equally so.
Teacher development is clearly required to prepare teachers with ICT skills to equip students with the kinds of critical skills needed if they, as members of the society, are to contribute meaning-fully in the country’s future development. All teachers need to be familiar with ICT applications and competent in the use of ICT applications. White (2003) recommends that teachers need to experience online learning as part of their professional development. The National Universities Commission (NUC) has worked assiduously to lay the foundation for ICT integration in higher institutions through investment in ICT infrastructure, management information systems, e-mail access, and library information services. There have been essentially three kinds of ICT infra-structural provisions in Nigerian tertiary institutions. These are:
Local initiatives; conceived and developed using local resources
Corporate initiatives; corporate organizations such as Cisco and Microsoft
International partnership initiatives; for instance the NetTel@Africa telecommunications management post graduate programme project sponsored by the Nigerian Communica-tions Commission in partnership with regional stakeholders united in their desire to in-crease the capacity of African ICT sector.
In line with the National Information Technology Development Agency’s (NITDA) mandate of Private Public Partnership (PPP) arrangement, the University of Benin, in 2002, went into part-nership with Broadband Technology, an IT firm based in Lagos. This led to the establishment of U. B. Technologies, which was specifically, to provide;
Internet services for students and staff,
Training on ICT use for students and staff, and
Computer services at a reduced rate.
However, although, the University of Benin has adopted and customized the Uniben.waeup.org portal (This is the Student Registration Portal [SRP] of the University of Benin, which is part of the West African e-University Project (WAeUP) to improve productivity and promote efficient record-keeping to enhance administrative services.), the use of ICT applications in the teaching and learning process has not really taken-off in the university.
ICT Skills and Competencies Regardless of the quantity and quality of technology available in classrooms, the key to how ICTs are used is the teacher; therefore, teachers must have the competence and the right attitude to-wards technology (Kadel, 2005). Competence is defined as the ability to combine and apply rele-vant attributes to particular tasks in particular contexts. These attributes include high levels of knowledge, values, skill, personal dispositions, sensitivities and capabilities, and the ability to put those combinations into practice in an appropriate way (Commonwealth Department of Educa-tion, Science and Training, 2002). An ICT competency describes what a teacher should know to be able to use technology in his/her professional practice.
Kirschner and Woperies (2003) highlighted some major ICT competencies teachers require. These include competency in:
making personal use of ICT;
mastery of a range of educational paradigms that make use of ICT;
making use of ICT as minds tools;
36
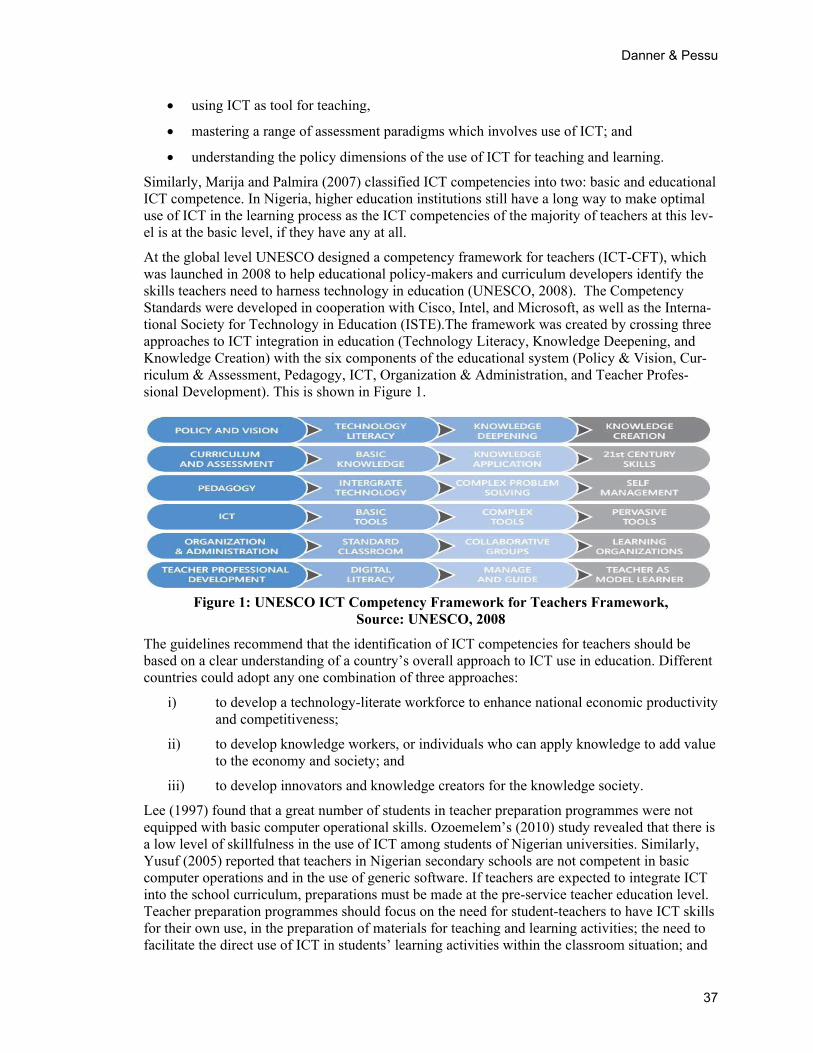
Danner & Pessu
using ICT as tool for teaching,
mastering a range of assessment paradigms which involves use of ICT; and
understanding the policy dimensions of the use of ICT for teaching and learning.
Similarly, Marija and Palmira (2007) classified ICT competencies into two: basic and educational ICT competence. In Nigeria, higher education institutions still have a long way to make optimal use of ICT in the learning process as the ICT competencies of the majority of teachers at this lev-el is at the basic level, if they have any at all.
At the global level UNESCO designed a competency framework for teachers (ICT-CFT), which was launched in 2008 to help educational policy-makers and curriculum developers identify the skills teachers need to harness technology in education (UNESCO, 2008). The Competency Standards were developed in cooperation with Cisco, Intel, and Microsoft, as well as the Interna-tional Society for Technology in Education (ISTE).The framework was created by crossing three approaches to ICT integration in education (Technology Literacy, Knowledge Deepening, and Knowledge Creation) with the six components of the educational system (Policy & Vision, Cur-riculum & Assessment, Pedagogy, ICT, Organization & Administration, and Teacher Profes-sional Development). This is shown in Figure 1.
Figure 1: UNESCO ICT Competency Framework for Teachers Framework,
Source: UNESCO, 2008
The guidelines recommend that the identification of ICT competencies for teachers should be based on a clear understanding of a country’s overall approach to ICT use in education. Different countries could adopt any one combination of three approaches:
i) to develop a technology-literate workforce to enhance national economic productivity and competitiveness;
ii) to develop knowledge workers, or individuals who can apply knowledge to add value to the economy and society; and
iii) to develop innovators and knowledge creators for the knowledge society.
Lee (1997) found that a great number of students in teacher preparation programmes were not equipped with basic computer operational skills. Ozoemelem’s (2010) study revealed that there is a low level of skillfulness in the use of ICT among students of Nigerian universities. Similarly, Yusuf (2005) reported that teachers in Nigerian secondary schools are not competent in basic computer operations and in the use of generic software. If teachers are expected to integrate ICT into the school curriculum, preparations must be made at the pre-service teacher education level. Teacher preparation programmes should focus on the need for student-teachers to have ICT skills for their own use, in the preparation of materials for teaching and learning activities; the need to facilitate the direct use of ICT in students’ learning activities within the classroom situation; and
37
Survey of ICT Competencies
the need for teachers to develop in their students a critical awareness of ICT applications and the social implications (Robbins, 1998).
Gender and ICT Competencies In recent years, the gender gap issue in ICT has been the subject of many studies both interna-tionally and locally. Studies have established that females tend to be less interested in computers than males and use them less often in their spare time (Schaumburg, 2001). In addition, studies have established that girls are less confident than boys in their computer skills, and that boys scored better than girls in computer related knowledge and skills. In addition, the three computer related occupations (computer scientists, computer engineers and system analysts, and computer science and engineering) are the top career choices for boys (Derbyshire, 2003). Bebetsos and Antoniou’s (2008) and Kadel’s (2005) studies also found that females have negative attitudes to-wards computers; as a result they are often less computer literate than males. Sefyrin (2005) as-serted that competence in ICT could be seen as a question of interest in ICT, where men are more interested in ICT then women.
Many studies show the existence of significant gender differences in ICT competencies among students. Oliver’s (1993) study, a replication of an earlier (1985) study, assessed gender differ-ences in ICTs skills among upper primary and lower secondary school students in a city school district in Western Australia. The study revealed significant gender differences among primary school pupils. They further observed that gender differences that were observed among primary school pupils in the 1985 study were still evident in 1991. On the other hand, fewer gender differ-ences were evident among the secondary school students in 1991 compared to what was observed in 1985. In another study, which focused on gender differences in specific areas of computer competency , Rajagopal and Bojin’s (2003) found that there were gender differences among male and female college and university students. Their study revealed that 12 percent of male students and 3 percent of female students declared their skills in creating and editing Web page as excel-lent whereas 35 percent of the male students and 68 percent of the female students reported that they do not have any knowledge in this area. However, in word processing, a clear majority of male, 59 percent and 46 percent of the female students declared their skill as excellent, while 2 percent of the males and 6 percent of the female students said that they have no skill at all. This result is at variance with the common stereotype of women as typist if we were to equate word processing with word processing, a field where women have dominated.
Research by Meelissen (2005) showed that girls seem to have a lower self-efficacy compared to boys especially in more complicated computer tasks. Meelissen’s (2005) study of grade five stu-dents revealed that regardless of their gender the students could perform most of the common computer tasks such as copying text and saving documents, word processing, or using a draw programme. For less common and more advanced computer skills, such as sending an attachment via an e-mail, forwarding an e-mail, and downloading programs or documents from the Internet, boys showed more self-efficacy than girls. Research done by TengkuFaekah (2005) showed that form four male students in the Kubang Pasu district of Kedah, a northern state in Malaysia, have higher perceived ICT competency than their female counterparts. However, activities such as handling computer hardware and performing computer maintenance are still dominated by males (Atan, Azli, Rahman & Idrus, 2002). From the review of studies above, it appears that the evi-dence for specific gender differences in ICT competency is inconclusive although there is a wide-spread belief that computers and the Internet are male-dominated technologies. It would, there-fore, be interesting to find out how gender affects the perceived ICT competencies of under-graduate students in teacher preparation programmes at the University of Benin, Benin City, Ni-geria, especially now that ICT is seen as not only crucial for the teaching and learning process but also for professional advancement.
38
Danner & Pessu
Computer Training and ICT Competencies The literature suggests that lack of adequate training and experience is one of the main factors why teachers do not use technology in their teaching. This also results in teachers’ negative atti-tude towards computer and technology. In addition, lack of confidence leads to reluctance to use computers by teachers (Kumar & Kumar, 2003). Another problem has been the impact of the lack of training on the integration of ICT into teacher preparation programmes in Nigeria. Training focus repeatedly targets digital literacy with little pedagogical content. Many training institutions have recognized the need for the adoption of ICT standards and its inclusion in the Nigeria teach-er education curriculum (Jegede, 2009). The use of ICT in coursework is based on teachers’ own initiative as there is no policy or curriculum requirement to use ICT as a tool for teaching.
It becomes imperative that students should be equipped with digital literacy competencies in or-der to exploit information resources that the electronic age produces. School leavers may not pos-sess the necessary computer skills for their university education although they have been using electronic devices frequently (Nash, 2009). In fact, there is an urgent need for ICT training to be given to fresh university students in order to obtain successful learning outcomes from the use of ICT and to satisfy the needs of their future employers. The most important ICT training needs should include skills development to assist ICT teaching and learning approaches for subject spe-cific areas of specialization; maintenance training; research oriented training on ICT use for data analysis – numerical data; spread sheets; and programmes.
Methodology
Research Design In this study the descriptive survey method was used to investigate ICT usage habits, perceived ICT competency, and related issues of undergraduate students in teacher preparation pro-grammes. A descriptive survey method allows the researcher to pose a series of questions to will-ing participants, summarize their responses with percentages, frequency counts, or more rigorous statistics, and draw inferences about a particular population from the responses of the sample.
Population and Sample for the Study The target population for this study consists of all undergraduate students in teacher preparation programmes in the five departments in the faculty of education in the University of Benin. From this population a sample of 100 undergraduate students was drawn from students in 200, 300 and 400 levels. Students in 100 level were not involved as the survey was carried out during the first week of the semester when first year students were just registering for the new session. All un-dergraduate students in the university are expected to enroll for CSC110 – Introduction to Com-puter – during the first semester of 100 level. Students’ access to computers in the school is very limited. For teachers, this lack of access gives them no choice other than to teach the course, CSC110, in a theoretical format and, as such, a majority of the students who have computer train-ing have done so at their personal expense. This is sad for, while some university communities in some countries enjoy free or inexpensive ICT facilities especially Internet access, students and faculty/staff in Nigeria must pay for time spent accessing the Internet, whether at a cyber café or in the library (although the library offers a discount).
Research Instrument The only instrument for the study was a survey questionnaire: Students ICT Usage and Perceived Competencies Inventory (S-ICT-UPCI) adapted from Bassey et al. (2007). The S-ICT-UPCI questionnaire was structured into three sections. Section A elicited demographic details such as
39

Survey of ICT Competencies
department, gender, age, and academic level of the respondents. Section B examined ICT usage habits of respondents. Section C required the respondents to rate their perceived ICT competen-cies. It was a 5-point Likert items on ICT knowledge and skills adapted from the Western Austra-lian Guide (2003). The reliability of the instrument was calculated using the Cronbach alpha for-mula. Reliability coefficients were calculated separately for section B and each of the five sub-scales in section C. The reliability coefficient of section B was 0.72. The reliability coefficients in each of the five sub-scales were; 0.74 for File Navigator, 0.73 for Word Processing, 0.72 for Email, 0.72 for Internet, and 0.65 for Presentation Software. Descriptive statistics (frequencies, percentages, crosstabs, and ANOVA) were employed in the analysis of data using the Statistical Package for Social Sciences (SPSS) version 16.0.
Results The research findings are presented in three sub-sections corresponding to the three research questions outlined earlier in the paper. Table 1 presents the demographic profile of the respon-dents. As revealed in Table 1, the distribution of respondents in the various departments was 21% for ADE, 19% for EPCS, 20% each for ESAM, HEK and VTE. The majority of the respondents, fifty nine percent (59%), were females. This is in line with the general statistics on the preva-lence of females in teacher education programmes and within the profession itself where ap-proximately seventy five percent (75%) of all teachers are women (American Association of Uni-versity Women [AAUW], 2004). Respondents’ age range fell within the 21-25 year bracket. This age bracket was the highest, representing fifty six percent (56%). Mature students, those in the above 30 years group, were only three percent (3%). Respondents in the 400 level were highest with forty nine percent (49%), followed by 300 level with twenty seven percent (27%) and lastly 200 level with twenty four percent (24%).
Table 1: Demographic Profile of Respondents
n %
Department: Adult and Non-formal Education (ADE) Educational Psychology and Curriculum Studies (EPCS) Educational Studies and Management (ESM) Health, Environmental and Kinetics (HEK) Vocational and Technical Education (VTE)
21 19 20 20 20
21% 19% 20% 20% 20%
Gender: Male Female
41 59
41% 59%
Age: 16 – 20 years 21 – 25 years 26 – 30 years 30 years and above
26 56 15 3
26% 56% 15% 3%
Academic Level: 200 Level 300 Level 400 Level
24 27 49
24% 27% 49%
40
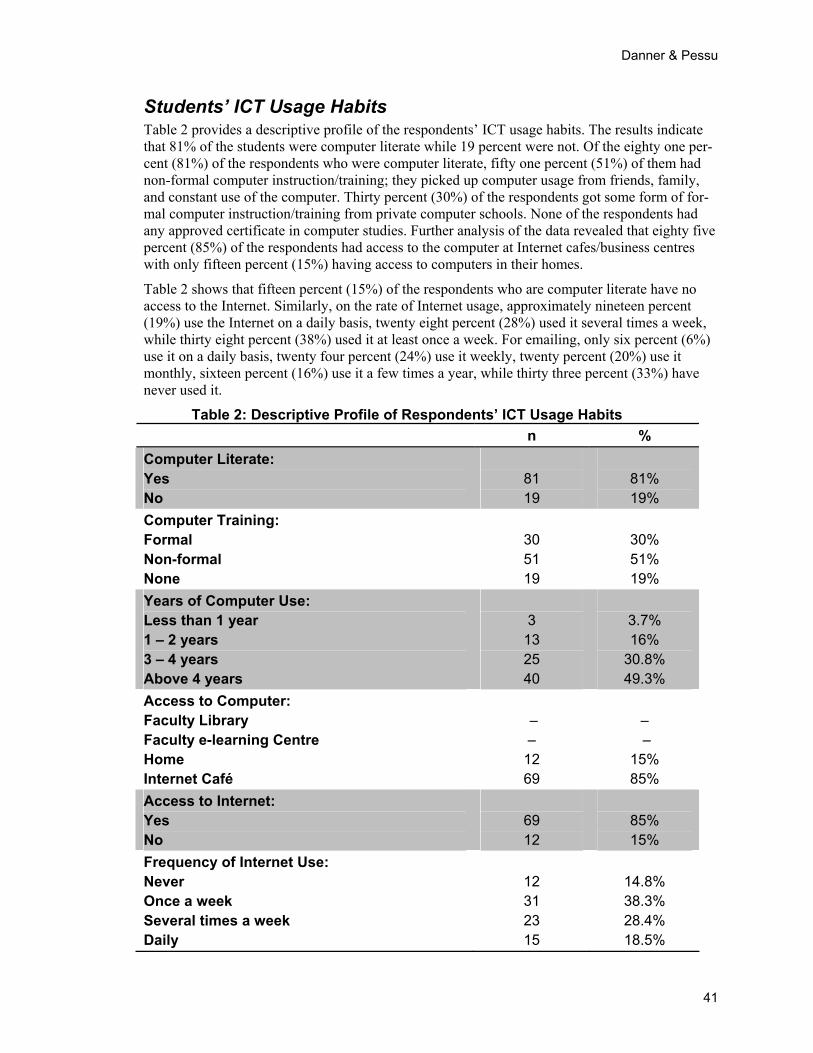
Danner & Pessu
Students’ ICT Usage Habits Table 2 provides a descriptive profile of the respondents’ ICT usage habits. The results indicate that 81% of the students were computer literate while 19 percent were not. Of the eighty one per-cent (81%) of the respondents who were computer literate, fifty one percent (51%) of them had non-formal computer instruction/training; they picked up computer usage from friends, family, and constant use of the computer. Thirty percent (30%) of the respondents got some form of for-mal computer instruction/training from private computer schools. None of the respondents had any approved certificate in computer studies. Further analysis of the data revealed that eighty five percent (85%) of the respondents had access to the computer at Internet cafes/business centres with only fifteen percent (15%) having access to computers in their homes.
Table 2 shows that fifteen percent (15%) of the respondents who are computer literate have no access to the Internet. Similarly, on the rate of Internet usage, approximately nineteen percent (19%) use the Internet on a daily basis, twenty eight percent (28%) used it several times a week, while thirty eight percent (38%) used it at least once a week. For emailing, only six percent (6%) use it on a daily basis, twenty four percent (24%) use it weekly, twenty percent (20%) use it monthly, sixteen percent (16%) use it a few times a year, while thirty three percent (33%) have never used it.
Table 2: Descriptive Profile of Respondents’ ICT Usage Habits
n %
Computer Literate: Yes No
81 19
81% 19%
Computer Training: Formal Non-formal None
30 51 19
30% 51% 19%
Years of Computer Use: Less than 1 year 1 – 2 years 3 – 4 years Above 4 years
3
13 25 40
3.7% 16%
30.8% 49.3%
Access to Computer: Faculty Library Faculty e-learning Centre Home Internet Café
– –
12 69
– –
15% 85%
Access to Internet: Yes No
69 12
85% 15%
Frequency of Internet Use: Never Once a week Several times a week Daily
12 31 23 15
14.8% 38.3% 28.4% 18.5%
41
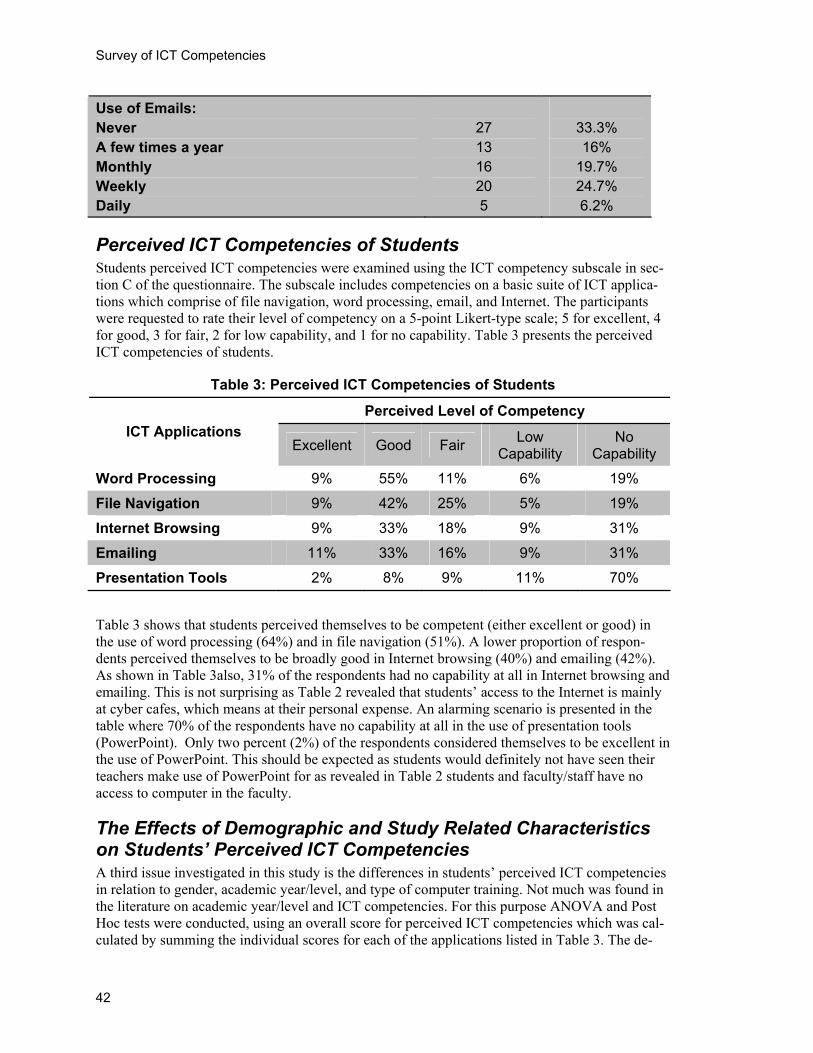
Survey of ICT Competencies
Use of Emails: Never A few times a year Monthly Weekly Daily
27 13 16 20 5
33.3% 16%
19.7% 24.7% 6.2%
Perceived ICT Competencies of Students Students perceived ICT competencies were examined using the ICT competency subscale in sec-tion C of the questionnaire. The subscale includes competencies on a basic suite of ICT applica-tions which comprise of file navigation, word processing, email, and Internet. The participants were requested to rate their level of competency on a 5-point Likert-type scale; 5 for excellent, 4 for good, 3 for fair, 2 for low capability, and 1 for no capability. Table 3 presents the perceived ICT competencies of students.
Table 3: Perceived ICT Competencies of Students
Perceived Level of Competency
ICT Applications Excellent Good Fair
Low Capability
No Capability
Word Processing 9% 55% 11% 6% 19%
File Navigation 9% 42% 25% 5% 19%
Internet Browsing 9% 33% 18% 9% 31%
Emailing 11% 33% 16% 9% 31%
Presentation Tools 2% 8% 9% 11% 70%
Table 3 shows that students perceived themselves to be competent (either excellent or good) in the use of word processing (64%) and in file navigation (51%). A lower proportion of respon-dents perceived themselves to be broadly good in Internet browsing (40%) and emailing (42%). As shown in Table 3also, 31% of the respondents had no capability at all in Internet browsing and emailing. This is not surprising as Table 2 revealed that students’ access to the Internet is mainly at cyber cafes, which means at their personal expense. An alarming scenario is presented in the table where 70% of the respondents have no capability at all in the use of presentation tools (PowerPoint). Only two percent (2%) of the respondents considered themselves to be excellent in the use of PowerPoint. This should be expected as students would definitely not have seen their teachers make use of PowerPoint for as revealed in Table 2 students and faculty/staff have no access to computer in the faculty.
The Effects of Demographic and Study Related Characteristics on Students’ Perceived ICT Competencies A third issue investigated in this study is the differences in students’ perceived ICT competencies in relation to gender, academic year/level, and type of computer training. Not much was found in the literature on academic year/level and ICT competencies. For this purpose ANOVA and Post Hoc tests were conducted, using an overall score for perceived ICT competencies which was cal-culated by summing the individual scores for each of the applications listed in Table 3. The de-
42
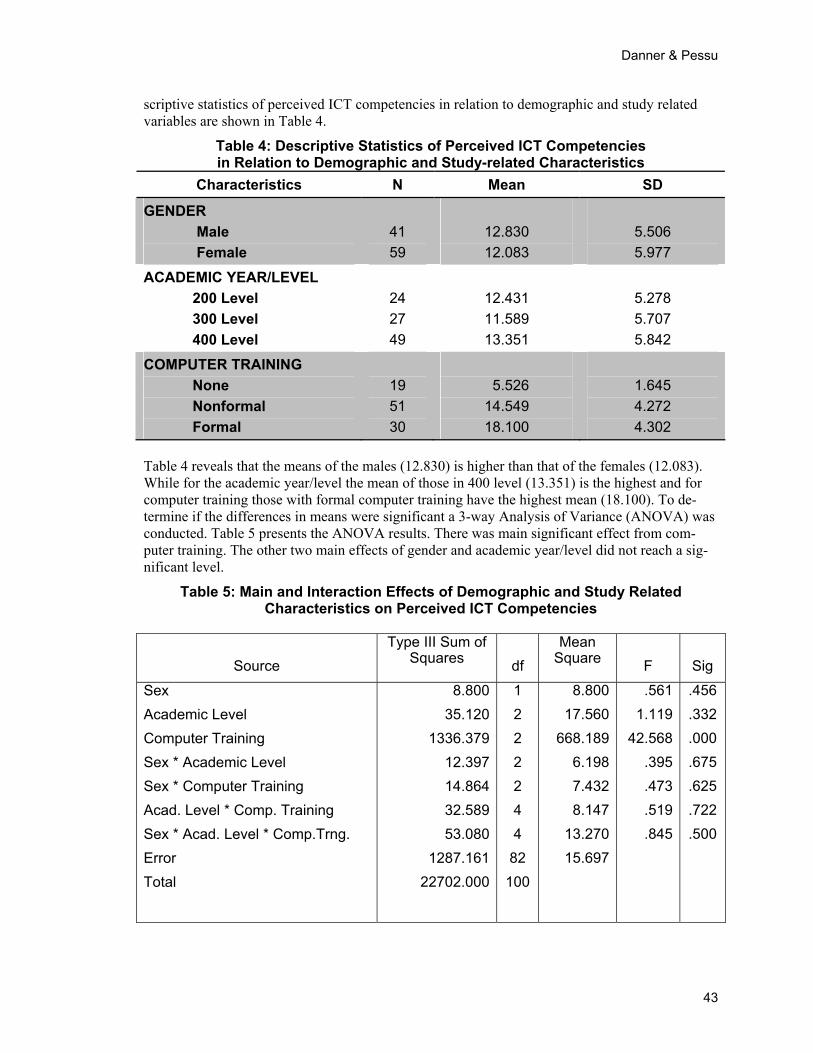
Danner & Pessu
scriptive statistics of perceived ICT competencies in relation to demographic and study related variables are shown in Table 4.
Table 4: Descriptive Statistics of Perceived ICT Competencies in Relation to Demographic and Study-related Characteristics
Characteristics N Mean SD
GENDER
Male
Female
41
59
12.830
12.083
5.506
5.977
ACADEMIC YEAR/LEVEL
200 Level
300 Level
400 Level
24
27
49
12.431
11.589
13.351
5.278
5.707
5.842
COMPUTER TRAINING
None
Nonformal
Formal
19
51
30
5.526
14.549
18.100
1.645
4.272
4.302
Table 4 reveals that the means of the males (12.830) is higher than that of the females (12.083). While for the academic year/level the mean of those in 400 level (13.351) is the highest and for computer training those with formal computer training have the highest mean (18.100). To de-termine if the differences in means were significant a 3-way Analysis of Variance (ANOVA) was conducted. Table 5 presents the ANOVA results. There was main significant effect from com-puter training. The other two main effects of gender and academic year/level did not reach a sig-nificant level.
Table 5: Main and Interaction Effects of Demographic and Study Related Characteristics on Perceived ICT Competencies
Source
Type III Sum of Squares
df
Mean Square
F
Sig
Sex
Academic Level
Computer Training
Sex * Academic Level
Sex * Computer Training
Acad. Level * Comp. Training
Sex * Acad. Level * Comp.Trng.
Error
Total
8.800
35.120
1336.379
12.397
14.864
32.589
53.080
1287.161
22702.000
1
2
2
2
2
4
4
82
100
8.800
17.560
668.189
6.198
7.432
8.147
13.270
15.697
.561
1.119
42.568
.395
.473
.519
.845
.456
.332
.000
.675
.625
.722
.500
43
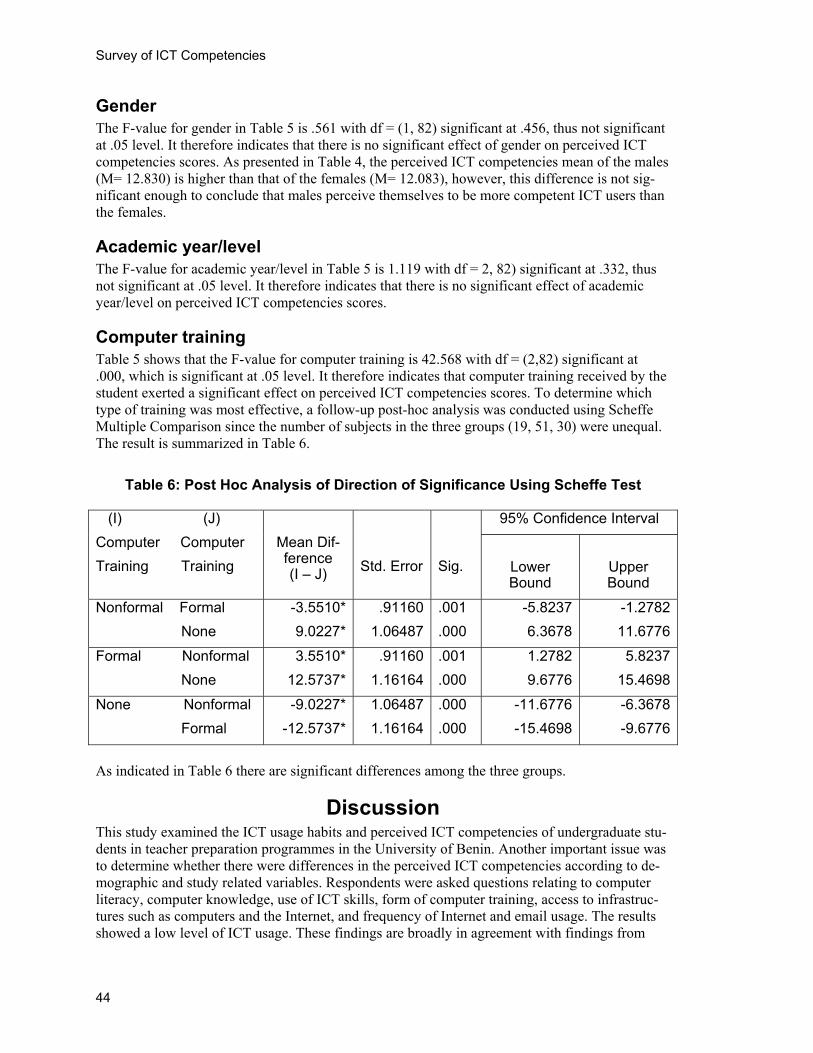
Survey of ICT Competencies
Gender The F-value for gender in Table 5 is .561 with df = (1, 82) significant at .456, thus not significant at .05 level. It therefore indicates that there is no significant effect of gender on perceived ICT competencies scores. As presented in Table 4, the perceived ICT competencies mean of the males (M= 12.830) is higher than that of the females (M= 12.083), however, this difference is not sig-nificant enough to conclude that males perceive themselves to be more competent ICT users than the females.
Academic year/level The F-value for academic year/level in Table 5 is 1.119 with df = 2, 82) significant at .332, thus not significant at .05 level. It therefore indicates that there is no significant effect of academic year/level on perceived ICT competencies scores.
Computer training Table 5 shows that the F-value for computer training is 42.568 with df = (2,82) significant at .000, which is significant at .05 level. It therefore indicates that computer training received by the student exerted a significant effect on perceived ICT competencies scores. To determine which type of training was most effective, a follow-up post-hoc analysis was conducted using Scheffe Multiple Comparison since the number of subjects in the three groups (19, 51, 30) were unequal. The result is summarized in Table 6.
Table 6: Post Hoc Analysis of Direction of Significance Using Scheffe Test
95% Confidence Interval (I) (J)
Computer Computer
Training Training
Mean Dif-ference (I – J)
Std. Error
Sig.
Lower Bound
Upper Bound
Nonformal Formal
None
-3.5510*
9.0227*
.91160
1.06487
.001
.000
-5.8237
6.3678
-1.2782
11.6776
Formal Nonformal
None
3.5510*
12.5737*
.91160
1.16164
.001
.000
1.2782
9.6776
5.8237
15.4698
None Nonformal
Formal
-9.0227*
-12.5737*
1.06487
1.16164
.000
.000
-11.6776
-15.4698
-6.3678
-9.6776
As indicated in Table 6 there are significant differences among the three groups.
Discussion This study examined the ICT usage habits and perceived ICT competencies of undergraduate stu-dents in teacher preparation programmes in the University of Benin. Another important issue was to determine whether there were differences in the perceived ICT competencies according to de-mographic and study related variables. Respondents were asked questions relating to computer literacy, computer knowledge, use of ICT skills, form of computer training, access to infrastruc-tures such as computers and the Internet, and frequency of Internet and email usage. The results showed a low level of ICT usage. These findings are broadly in agreement with findings from
44
Danner & Pessu
studies on the level of computer literacy in Nigerian universities (Adomi & Anie, 2006; Asogwa, 2006; Bassey et al., 2007). While it is recommended that students entering the undergraduate programmes in Nigerian universities be computer literate, as most of the administrative processes (e.g. course registration, payment of fees, booking of hostel accommodation, etc.) are done online, it has not yet been made a mandatory requirement of entry on the basis of equity and ac-cess.
The lack of access to the Internet on campus is not in line with the vision of the U B Technologies initiatives, which was meant to provide access to computer workstations and the Internet for a token fee. The use of cybercafés presents another dimension to the use of the computer/Internet, as the findings revealed that most of the “computing” time is spent partaking in a variety of online activities such as web surfing, as opposed to more “traditional” computing activities like word processing. This result aligns well with a common theme in computer education literature, which suggests that while social or recreational use of computers is high, the more academic use is seen as boring and only undertaken when really necessary.
There are important considerations in the use of the Internet by students that go beyond mere ac-cess to computing facilities and the Internet. Even when every student is “online”, not all of them may have the same type of connections. Some may have the benefit of high speed, dedicated net-working, whereas the only option for some students may be a dialup modem line that does not support the data transfer rate required for high quality interactive multimedia programmes (In-gram, 1996). Additionally, simply having the requisite computer resources does not automatically grant access to the information highway. If one is unfamiliar with computers or the Internet, at-tempting to navigate this new medium can be frustrating and frightening. This confirms Brogan’s (1997) findings, which found that 75 percent of all students in his study indicated the need for training in the use of the Internet.
With respect to perceived ICT competencies, the analysis of the data revealed that overall stu-dents did not perceive themselves very competent in ICT. However, the self-assessment by re-spondents as to their level of competency may be somewhat subjective, as perception of knowl-edge and ability in computer skills do not always correspond to the reality (Ballantine, McCourt, & Cyelere, 2007). The result is in line with findings with Nigerian university students reporting themselves as knowing how to use the Internet (Adomi & Anie, 2006; Asogwa, 2006; Bassey et al., 2007). Students’ patronage of Internet cafes might be the result of their level of competency in the use of word processing and file navigation applications. This however, is not an encourag-ing level of competency if students are to benefit from e-learning. In general, the results for com-petency in Internet browsing and emailing revealed ratings between the ranges of “fair” and “good,” that is a moderate level of skills in these applications. For competency in the use of pres-entation tools, respondents’ results revealed that only a negligible percentage of the respondents have competency in this ICT application. Overall, the results are consistent with the literature that there is dire need to improve and facilitate the innovative use of technology and embed technol-ogy usage in higher education curriculum in the country (Adomi & Anie, 2006; Asogwa, 2006; Bassey et al., 2007).
The findings indicate that there is no significant difference between male and female in their per-ceived ICT competencies. This is not surprising as studies have shown that gender gap in ICT usage is gradually closing up, especially among students in tertiary institutions as evident in that of Ozoemelen (2010) who found out that the gender gap in Internet use has narrowed signifi-cantly in the college age group. However, the finding is at variance with that of Ono and Zavodny’s (2003) study which found females to be less frequent and intense users of the Internet. There was similarly no significant difference among students according to academic year/level. The findings indicate that there is significant difference in the perceived ICT competencies of the students who had taken computer courses. Altan (2003) found a similar result which suggests that
45
Survey of ICT Competencies
there is a significant difference between those who have taken a computer course and those who have not.
Limitations of the Study It should be noted that the study presented here has several limitations. The sample size of one hundred (100) students of the five departments in the Faculty of Education at the University of Benin will make generalization difficult. Furthermore, the use of perception to find out skill com-petency is a limitation as students might not be truthful in reporting their level of competency. Making them carry out these practical skills would have been a better option.
Conclusion The findings of this study showed a low level of ICT usage by the respondents. The lack of ac-cess to computers and Internet connectivity within the faculty is worrisome. From the findings, it is clear that the critical factor of institutional provision of ICT infrastructure has not yet been reached. One not only needs the infrastructure available, but also the personal skills in order to use ICT. It is evident from the literature that unless the issue of ICT competency is addressed, it can itself be a barrier to students’ learning. We suggest that special funds be created to revamp the e-learning support centres at the faculty level for students and faculty/staff use. Regarding future research, further studies utilizing random sampling technique should be designed to in-crease the generalizability of these findings. Further studies employing the use of interviews or observations would generate a fuller understanding of our reported survey results.
References Adomi, E. E., & Anie, S. O. (2006). An assessment of computer literacy skills of professionals in Nigerian
university libraries. Library HiTech News, 23(2), 10- 14.
Altan, A. (2003).The relationship between teacher trainee’s attitudes towards computers and their cognitive styles. The Turkish Online Journal of Educational Technology, 2(1), Article 9.
American Association of University Women (AAUW). (2004). Educating girls in the new computer age. New York: AAUW Educational Foundation Tech Savvy.
Asogwa, U. D. (2006). E-learning: A panacea for access, equity and quality higher education in Nigeria. Paper presented at the 30th Annual conference of Nigerian Association for Educational Administration and Planning (NAEAP) held at the Faculty of Education Hall, Enugu State University of Science and Technology, Enugu, Nigeria. 2-3 October 2006.
Atan, H., Azli, N., Rahman, Z., & Idrus, R. (2002). Computers in distance education: Gender differences in self-perceived computer competencies. Journal of Educational Media 27(3), 123-135.
Ballantine, J., McCourt Larres, P., & Cyelere, P. (2007). Computer usage and the validity of self-assessed computer competence among first year business students. Computers and Education, 49, 976 – 990
Bassey, U. U., Akuegwu, B. A., Udida, L. A., Ntukidem, E. P., & Ekabua, O. O. (2007). Nigerian graduat-ing students’ access to e-learning technology: Implications for higher education management. ICT-Learn2007, 6th International Internet Education Conference. Egypt 2-4 September 2007. Ramses Hil-ton: Cairo.
Bebetsos, E., & Antoniou, P. (2008).University students’ differences on attitudes towards computer use: Comparison with students’ attitudes towards physical activity. Interactive Educational Multimedia, 17, 20-28. Retrieved 15th August 2012 from http://greav.ub.edu/iem/index.php?
Brogan, M. (1997). Off-campus and off-line? Access to the Internet of postgraduate TESOL students at Deakin University. In T. Evans & V. Jakupec & D. Thompsons (Eds). Research in Distance Education
46
Danner & Pessu
4: Revised papers from the Fourth Research in Distance Education conference, Deakin University, 115-117
Casal, R. C. (2007). ICT for education and development. Info, 9(4), 3-9.
Cheetham, G., & Chivers, G. (2001). How professionals learn in practice: An investigation of informal learning amongst people working in professions. Journal of European Industrial Training, 25(5), 248-292.
Commonwealth Department of Education, Science and Training. (2002). Striving for quality: Learning, teaching and scholarship. Canberra.
Department for Education and Employment (DfEE). (2000). Press Release 34/00(31/01/00). End the digital divide –Wills. Retrieved from http://www.dfes.gov.uk/pns/DisplayPN.cgi?pn_id=2000_0034
Derbyshire, H. (2003). Gender issues in the use of computers in education in Africa. Retrieved 15th August 2012 from http://www.enawa.org/icons/Tekstbestanden/Gender%20Report%20the%20
Federal Ministry of Education. (2010). National policy on information and communication technologies (ICT) in education. Abuja: Federal Ministry of Education.
Hughes, M. M. (2005). Reach to teach ICT: Issues and compromises. Education and Information Tech-nologies, 10(3), 263-276.
Ingram, A. L. (1996). Teaching with technology. Association Management, 44(6), 38-47.
Jegede, P. O. (2008). Attitudinal characteristics and use level of Nigerian teachers. Issues in Informing Sci-ence and Information Technology, 5, 261-266. Retrieved 15 August 2012 from http://proceedings.informingscience.org/InSITE2008/IISITv5p261-266Jegede533.pdf
Jegede, P. O. (2009). Assessment of Nigerian teacher educators’ ICT training. Issues in Informing Science and Information Technology, 6, 415-420. Retrieved from http://iisit.org/Vol6/IISITv6p415-420Jegede639.pdf
Kadel, R. (2005). How teacher attitudes affect technology. Learning and Leading with Technology, 39 (5), 34-47.
Kay, R. H. (2006). Evaluating strategies used to incorporate technology into pre-service education: A re-view of the literature. Journal of Research in Technology in Education, 38(4), 383-408.
Kirschner, P., & Woperies, I. G. (2003). Pedagogic benchmarks for information and communication tech-nology in teacher education. Technology, Pedagogy and Education, 12(1), 127-149.
Koehler, M. J., Mishra, P., & Yahya, K. (2007).Tracing the development of teacher knowledge in a design seminar: Integrating content, pedagogy, and technology. Computers and Education, 49, 740–762.
Kumar, P., & Kumar A. (2003).Effect of a web-based project on preservice and in-service teachers’ atti-tudes toward computers and technology skills. Journal of Computing in Teacher Education, 19(3), 87-92.
Lee, D. (1997). Factors influencing the success of computer skills learning among in-service teachers. Brit-ish Journal of Educational Technology, 28, 139-141.
Marija, B., & Palmira, P. (2007). Would-be teachers’ competence in applying ICT: Exposition and precon-ditions for development. Informatics in Education - An International Journal, 6(2), 397-410.
Meelissen, M. R. (2005). ICT: More for Mickey than for Minnie? The role of primary education in making information and communication technology more attractive for girls and boy., Doctoral dissertation, University of Twente, Enschede, The Netherlands.
Murray, S., Nuttall, J., & Mitchell, J. (2008). Research into initial teacher education in Australia: A survey of the literature 1995 – 2004. Teaching and Teacher Education, 24(10), 225-239.
47
Survey of ICT Competencies
Nash, J. (2009). Computer skills of first-year students at a South African university. Proceedings of the 2009 Annual Conference of the Southern African Computer Lecturers' Association, Eastern Cape, South Africa (SACLA ’09), Mpekweni Beach Resort, South Africa, June 29-July 01, 2009.
Olakulehin, F. K. (2007). Information and communication technologies in teacher training and professional development in Nigeria. Turkish Online Journal of Distance Education, 8(1), 133-142.
Oliver, R. (1993). A comparison of students’ information technology skills in 1985 and 1991. British Jour-nal of Educational Technology, 24(1), 52-62.
Oliver, R. (2002). The role of ICT in higher education for the 21st century: ICT as a change agent for edu-cation. Retrieved 15 August 2012 from http://elrond.scam.ecu.edu.au/oliver/2002/he21.pdf
Ololube, N. P. (2007). The relationship between funding, ICT, selection processes, administration, planning and the standard of science teacher education in Nigeria. Asia-Pacific Forum on Science Learning and Teaching, 8(1), 1-29. Retrieved 15 August 2012 from http://www.ied.edu.hk/apfslt/v8_issue1/ololube/index.htm#abstrac
Ono, H., & Zavodny, M. (2003). Gender and the Internet. Social Science Quarterly, 84(1), 111-121.
Ozoemelem, O. A. (2010). Web affinity: A study of undergraduate students in Nigerian universities. Li-brary Philosophy and Practice [e-journal]. Retrieved on 15th April 2012 from http://www.webpages.uidaho.edu/~mbolin/obuh2.htm
Rajagopal, I., & Bojin, N. (2003). A gendered world: Students and instructional technologies. First Monday 8(1), Retrieved on 15th April 2012 from http://firstmonday.org/htbin/cgiwrap
Robbins, V. (1998).The development of information technology skills in trainee teachers for further educa-tion sector. Research in Post-Compulsory Education, 3(2), 240-251.
Ryan, J., & Scott, A. (2008). Integrating technology into teacher education: How online discussion can be used to develop informed and critical literacy teachers. Teaching and Teacher Education, 24(6), 1635 – 1644.
Schaumburg, H. (2001). Fostering girls’ computer through laptop learning – Can mobile computers help to level out the gender difference? Retrieved 12 August 2012 from http://www.notesys.com/Copies/necc01.pdf
Sefyrin, J. (2005). Understandings of gender and competence in ICT. In A. Archibald, J. Emms, F. Grundy, J. Pagne & E. Turner (Eds). The gender politics of ICT (pp. 95-106). London: Middlesex University Press.
TengkuFaekah, T. A. (2005). Gender differences in computer attitudes and skills. Journal Pendidikan, 30, 75-91.
UNESCO. (2008). ICT Competency standards for teachers: Policy framework. Retrieved on 11th April 2012 from http://unesdoc.unesco.org/images/0015/001562/156210E.pdf
Watson, M. D. (2005). Pedagogy before technology: Re-thinking the relationship between ICT and Teach-ing. Education and Information Technologies, 6(4), 252-266.
Western Australian Guide. (2003). Teaching and learning with ICT: A self-evaluation guide. Western Aus-tralia: Department of Education and Training.
White, G. (2003). E-learning: Key Australian initiatives (An opportunity for all learners). Retrieved on 15th April 2012 from http://www.educationau.edu.au/papers/elearning_polaand03.pdf
Yusuf, M.O. (2005). Information and communication technology and education: Analysing the Nigerian national policy for information technology. International Education Journal, 6(3), 316‐321.
48
Danner & Pessu
49
Biographies Regina Danner holds a PhD in Language Education (English) from the University of Benin, Benin City, Nigeria. She is a lecturer in the De-partment of Educational Psychology and Curriculum Studies, University of Benin. Her areas of research interest include instructional methods in English Grammatical Structures, Reading and the use of Information and Communication Technologies (ICTs) in Education. She has pre-sented papers in national and international conferences on ICTs in edu-cation. Before her present appointment, Dr Danner was a chief examina-tion Officer with the National Business and Technical Examinations
Board, Benin City. She is a member of the International Reading Association (IRA).
Clara Pessu holds a B.Ed in English Language and Literature, M.Ed and Ph.D in Educational Planning from the University of Benin, Benin City, and currently the Vice-principal in Girls’ Model Secondary School, Evwreni, Delta State, Nigeria. Prior to her appointment as Vice-principal, she taught English Language and Literature-in-English in senior secondary schools across the state. Her area of research inter-ests include Teacher Improvement and use of ICTs in Education and has functioned as centre coordinator at Teacher Capacity Building
Workshops organized by Delta state government. Dr Pessu is a member of the International Reading Association (IRA) and the Nigerian Association for Educational Administration and Planning (NAEAP).

This page left blank intentionally
Journal of Information Technology Education: Research Volume 12, 2013
Learning Anywhere, Anytime: Student Motivators for M-learning
Romana Martin Curtin University,
Perth, WA, Australia
Tanya McGill and Fay Sudweeks
Murdoch University, Perth, WA, Australia
[email protected] [email protected]
Executive Summary This paper documents the outcomes of a study that focused on identifying what motivates stu-dents to use mobile devices for learning and to engage in m-learning. An outcome of this study was to provide a better understanding of what educators should consider when adapting their course for mobile learners. The research included seven classes from three Australian universi-ties. The students in this study used laptops or tablet PCs, and in three of the classes, these were provided by the university as part of a laptop/tablet program. The findings indicated that mobility was the key motivator for the use of laptops, and the learning tasks that students found to be most motivating involved accessing information, authoring (e.g., writing, blogging, note taking) and communication. .
Keywords: Motivation, motivators, m-learning, mobile learning, engagement.
Introduction M-learning transcends the barriers between in-class and out-of-class experiences with opportuni-ties for anywhere anytime learning and the potential for students to participate in educational ac-tivities beyond the limitations of traditional study environments. Hence there exists an expecta-tion that, with access to mobile technologies and the presence of adequate wireless infrastructure, students can become effectively engaged in m-learning and that this will be of benefit to their overall learning experience (Cobcroft, Towers, Smith, & Bruns, 2006; Corbeil, Pan, Sullivan, & Butler, 2007; Gulek & Demirtas, 2005; Kim, Mims, & Holmes, 2006; Traxler 2009).
In order for students to become engaged in m-learning, some self-direction in learning is required whereby students are motivated to participate in learning related activities that extend beyond the boundaries of teacher direction and formal classes. For instance, Sha, Looi, Chen, and Zhang
(2012) suggest that the characteristics of mobile learning (i.e., enabling student-centered, personal, and ubiquitous learning) provide conditions for learn-ing anywhere and anytime, but also re-quire learners to be motivated and to self-regulate their learning. To foster self-directed and self-regulated learning, a shift is required from teacher- and content-centered learning towards more student-centered learning environments
Material published as part of this publication, either on-line or in print, is copyrighted by the Informing Science Institute. Permission to make digital or paper copy of part or all of these works for personal or classroom use is granted without fee provided that the copies are not made or distributed for profit or commercial advantage AND that copies 1) bear this notice in full and 2) give the full citation on the first page. It is per-missible to abstract these works so long as credit is given. To copy in all other cases or to republish or to post on a server or to redistribute to lists requires specific permission and payment of a fee. Contact [email protected] to request redistribution permission.
Editor: John Beachboard
Learning anywhere, anytime: Student motivators for M-learning
where, consequently, learners become responsible for their learning and the involvement and par-ticipation necessary for their learning (Ingleton, Kiley, Cannon, & Rogers, 2000).
Literature Review For educators it is increasingly important to understand the motivators that encourage student learning and use of mobile devices for learning purposes. According to Garrison (1997), motiva-tion is a key factor in self-directed learning as students are required to assume personal responsi-bility for both managing and monitoring their learning processes and construction of learning. However, Seifert and O’Keefe (2001) stressed that students need to feel confident, have a sense control over their learning, and consider the learning activities to be meaningful and relevant, for the effects of motivation to be maximised. Additionally, Martin (2006, p. 73) suggested that mo-tivation and engagement both have a significant role in students’ study, providing the energy and drive to work effectively, learn, and achieve to their potential.
Often it is assumed that students will be naturally motivated to use mobile devices for learning. For instance, Laurillard (2007, p.156) stated that “m-learning is an activity that is intrinsically motivating for students by providing: control over learning goals, ownership, fun, communica-tion, learning in contexts, and continuity between contexts”. Furthermore, Roblyer and Doering (2010) suggest that integrating new technologies in ways that are meaningful for students and align with their motivations and goals is likely to generate further motivation to learn. However, without an investigation of what students believe motivates them to use mobile devices for m-learning, there can be little certainty as to whether this occurs spontaneously or whether there are specific motivators that prompt students to engage in m-learning.
According to Keller (2008) and MacCallum (2009), m-learning students need to be motivated not only to learn, but also motivated to use mobile devices to support their learning. This was evident in earlier studies in which high levels of student (and teacher) motivation were linked with suc-cessful implementation of laptops in learning (e.g. Hall & Elliott, 2003; McMillan & Honey, 1993; Newhouse, 2001; Oloruntoba, 2006).
Motivation has also been linked with goal orientation and a focus on learning achievements (Klein, Noe & Wang, 2006; Pintrich & Schunk, 2002; Schunk, Pintrich & Meece, 2008; Wolters, 2004). Wolters, Yu, & Pintrich (1996) described goal orientation as an integrated pattern of be-liefs that leads to different ways of approaching, engaging in, and responding to achievement situations, and, according to Pintrich (2003), both motivation and goal orientation are the reasons for students engaging in achievement behaviours. Students’ learning goal orientation, as found by MacCallum (2009), is closely linked with intrinsic motivation. Students who have a learning goal orientation and are intrinsically motivated are more likely to adopt new technologies, enjoy learn-ing about the technologies and, consequently, develop more confidence in using technologies. MacCallum (2009) identified that students who were experienced with using computers were also likely to be goal oriented and independent learners, characteristics that resulted in students adopting new technologies. Goal orientation may encompass intrinsically motivated learning goals (e.g., mastering new knowledge) and extrinsically motivated performance goals (e.g., grades). Therefore, students’ motivation to use laptops and mobile devices is likely to have an impact on their engagement in m-learning and on students achieving their learning goals.
Additionally, Boekaerts (2001) stressed that students’ motivation is context sensitive and high-lighted the importance of considering situated motivation in the learning environment, that is, what students consider motivating or demotivating in their specific context. Furthermore, Breen and Lindsay (2002) found that students may require different motivators that are not necessarily linked to achievement goals, and this may vary depending on their discipline area. In their study,
52
Martin, McGill & Sudweeks
students in the disciplines of computing, history, biology, and geology were motivated more by the enjoyment of learning experiences than by the pursuit of learning goals.
Some studies have indicated that technological innovations are likely to be embraced by students more so than by lecturers (Conole, de Laat, Dillon & Darby, 2008; Lane & Yamashiro, 2005; MacCallum & Jeffrey, 2010; Roberts, 2005) and that the motivation of lecturers to embrace tech-nologies can also influence students’ perceptions of using the technologies to support their learn-ing (Kuo, 2005). Likewise, Demb, Erickson & Hawkins-Wilding (2004) and MacCallum and Jeffrey (2009) identified that one of the major factors affecting student perceptions of the value of laptops to their academic success was their lecturer’s motivation to use mobile devices and the quality of their lecturer’s use of the technology for teaching.
In an early laptop study, McMillan and Honey (1993, p. 2) identified that positive experiences of using laptops were supported by “a high level of student and teacher motivation, the role of the teacher in facilitating and encouraging students’ active appropriation of the technology and a steady increase in the technological competencies among the teachers”. Other researchers (e.g., Hall & Elliott, 2003; Herrington, Herrington, Mantei, Olney, & Ferry, 2009; MacCallum & Jef-frey, 2010; Newhouse, 2001; Oloruntoba, 2006), due to similar findings, recommended profes-sional development to support teaching in m-learning environments as a necessary prerequisite for successful m-learning.
The literature revealed a complex interplay of factors that may affect students’ motivation to use mobile devices for learning and highlights the need for further understanding of what motivates students to engage in m-learning. Hence the research described in this paper aimed to identify the motivators that lead to students’ use of m-learning devices. The research question addressed was: What motivates students to use their laptops for m-learning?
Awareness of the motivators that encourage students’ use of m-learning devices will inform edu-cators on aspects of mobile learning that are significant to students and should assist educators in designing learning experiences that meet students’ needs.
Methodology As part of a larger study on m-learning, and based on the literature on m-learning and guidelines for survey design (de Vaus, 2002), survey questions were developed to explore students’ motiva-tors to use laptops and engage in m-learning. In this study, which commenced in 2008, m-learning was defined as learning that takes place in a variety of contexts, within and beyond traditional learning environments, utilising any type of mobile device.
Although some aspects of motivation, or possible motivators, were embedded in several items throughout the survey, two specific items were included to establish specific motivators. The first question asked the students what motivated them to use their laptops. The second question asked the students whether the learning activities in their current subject engaged and motivated them to study. For each of these questions an optional field was included for text-based input.
Classes from three different universities – Edith Cowan University (ECU), Charles Darwin Uni-versity (CDU), and Murdoch University (MU) – were selected based on predefined criteria:
1. subject offered as part of an undergraduate course at university; 2. students in the subjects were either participants in a laptop or tablet
program or the subject was identified as involving above average formal or informal student use of laptops or tablet computers;
3. subject offered students access to a LMS providing online learning resources or activities; and
53
Learning anywhere, anytime: Student motivators for M-learning
4. reliable availability for participation in the study in the first teaching period of the year.
On the basis of the above criteria approximately ten possible classes were identified; however, the selection method was both purposeful and convenience sampling as the study was limited to the range of classes available at the time of the study and the willingness of Program Directors, Course Coordinators to support the study. Only seven classes sourced from three Australian uni-versities met the required criteria (Table 1).
Table 1: Summary of classes included in the study
Class Subject Discipline Area m-learning pro-gram
University
1 Becoming Multi Literate Education Laptop program 24/7 access
ECU
2 The Mobile Web IT Tablet PC pro-gram with in-class
access
CDU
3 Human Computer Interac-tion Design
IT Tablet PC pro-gram with in-class
access
CDU
4 Introduction to Information Technology
IT Ad hoc use of laptops/tablets
MU
5 Introduction to Multimedia and the Internet
IT Ad hoc use of laptops/tablets
MU
6 Systems Analysis and De-sign
IT Ad hoc use of laptops/tablets
MU
7 Business Associations Law Law Ad hoc use of laptops/tablets
MU
These classes were selected as the expected use or ownership of laptop or tablet computers was likely to be higher than average. Class 1 from ECU and Classes 2 and 3 from CDU were classes in which laptop loan programs (m-learning programs) were in place and therefore all of the stu-dents had access to laptops or tablet computers. The laptop program at ECU provided all first-year Bachelor of Education students with a free loan of a wireless laptop for use throughout their first year of study. Students participating in this program were provided with an initial orienta-tion to using the laptops and wireless network, access to support services for hardware and soft-ware issues, and were encouraged to use the laptops 24/7 for both learning and recreational pur-poses. In contrast, the tablet program at CDU was classroom-based and students were required to copy their work to other devices for use out of class. Classes 4 to 7 from MU did not have a lap-top program. In these units, students were invited to participate in the study only if they used laptop or tablet computers for study purposes. Table 2 shows the total enrolment numbers in each of the classes and the percentage of students in the unit who participated based on enrolment numbers. The laptop users were known in Classes 1, 2 and 3; however, the number of laptop users could not be established in Classes 4 to 7 as information about ownership was not available. In Classes 4 to 7, student laptop owners and users self-selected by volunteering to participate in the survey. Overall, 199 students consented to participate in the study and completed the student survey.
Across all groups there were 108 (54.3%) students in the IT discipline group and 91 (45.7%) stu-dents were enrolled in non-IT disciplines. Participation and non participation in m-learning pro-
54
Martin, McGill & Sudweeks
grams was almost equally balanced with 100 (50.3%) of students participating in m-learning pro-grams and 99 (49.7%) of students not participating in an m-learning program.
The survey was developed and administered through a commercial online survey tool, Survey-Monkey (www.surveymonkey.com) and initially pilot tested by six students.
The students in each class were invited via email or a message via their learning management system (LMS) site to participate in the survey.
Table 2: Percentage participating in case studies
Class Subject Enrolments Total
Participants Percentage participated
1 Becoming Multi Literate 203 81 39.9% 2 The Mobile Web 55 14 25.5% 3 Human Computer Interaction
Design 27 5 18.5%
4 Introduction to Information Technology
248 32 12.9%
5 Introduction to Multimedia and the Internet
108 21 19.4%
6 Systems Analysis and Design 112 36 32.1% 7 Business Associations Law 197 10 5.1% Total 950 199 20.9%
Completion of the survey was voluntary and anonymous, and took approximately 15 minutes. As an incentive, students were offered the chance to win a prize of an Apple iPod®. The research questions were explored by analysing the data qualitatively using QSR NVivo™ 8.0.
Results
Demographics Participants ranged in age from 18 to 57 years (with an average age of 23.8). The majority of participants were in the <20 and 20-24 age groups (71.3%). Students in this age range are often described in the literature as the Net Generation (Oblinger & Oblinger, 2005) or Digital Natives (Prensky, 2001). The 40 and over age group represented less than 5% of the sample and only a quarter of the participants were in the 25 to 39 age groups. 64% of the participants were female and the gender distribution varied in classes, with female participants predominantly in the edu-cation discipline.
Almost all of the students (96%) considered themselves to be experienced or very experienced computer users, and 91.4% indicated that they owned their laptop or tablet computer. When asked about in-class use of their laptops, 20.4% of participants indicated that they always used a laptop/tablet computer in lectures or tutorials, 38.8% only sometimes, whereas 41.3% of the stu-dents reported that they have never used their laptops in class. The Education students reported the lowest level of in class use of their laptops, which was explained by the fact that many of their classes were scheduled in computer laboratories, and they therefore used laboratory PCs instead of their laptops.
55
Learning anywhere, anytime: Student motivators for M-learning
Results - Motivators The first question asked the students about their motivation for using laptops. Table 3 shows the responses based on the options provided.
Table 3: Motivators for use of laptops for m-learning across all classes
Motivators Frequency (N=199)
%
Access to information on the web 138 69.3%
Access to learning resources 134 67.3%
Communication with friends 107 53.8%
Better grades 64 32.2%
Other 25 12.6%
The main motivators for using laptops for m-learning were: access to information on the web, access to learning resources, and communication with friends. Only a third of the students were motivated by better grades.
Motivators varied by cases and a comparison of classes is summarised in Table 4. For example, in Classes 4 and 5 (IT) and Class 7 (Education), students were motivated by achieving better grades (>40%) more so than other groups. The students least motivated by achieving better grades were in an IT subject, Class 3, with none of the students selecting this option, yet this group was highly motivated by accessing learning resources (80%) and information on the web (100%). Class 2 (IT) and Class 7 (Law) had the least focus on communication with friends as a motivator for using their laptops.
Table 4: Motivators for use of laptops for m-learning by class
Motivator Classes
Better grades
Access to learn-ing resources
Communication with friends
Access to in-formation on
the web
Other
Class 1 – Law (N=81)
35.8% 66.7% 45.7% 63.0% 11.1%
Class 2 – IT (N=14)
14.3% 28.6% 28.6% 28.6% 0.0%
Class 3 – IT (N=5)
0.0% 80.0% 40.0% 100.0% 20.0%
Class 4 – IT (N=32)
40.6% 87.5% 84.4% 96.9% 12.5%
Class 5 – IT (N=21)
42.9% 76.2% 71.4% 81.0% 9.5%
Class 6 – IT (N=36)
19.4% 58.3% 58.3% 69.4% 19.4%
Class 7 - Edu-cation (N=10)
40.0% 70.0% 10.0% 50.0% 20.0%
Note: Each instance is calculated as a % of the total pool of students in that class study. This was a multi-response question and therefore percentages do not add up to 100.
56
Martin, McGill & Sudweeks
In addition to the five specified response options, there was the opportunity for students to pro-vide further text-based information. The text responses were content analysed yielding more than one theme per response. Analyses of the qualitative data related to this question resulted in the identification of the themes shown in Table 5. There was some overlap with the motivators in the multi-answer question (e.g., access to learning resources, using the Internet, and researching) re-inforcing the importance of laptops providing access to sources of information to support learn-ing.
The major themes that emerged from these other motivators were mobility, study anytime, and access to learning resources. The most frequently mentioned of these was mobility. Students clearly valued the mobility and freedom that their laptops provided, which enabled them to study and communicate with others anywhere. Having their personal laptop with them at any time also eliminated the need to continually transfer data between computers in different locations.
Table 5: Students’ motivators for using laptops
Motivator Themes Frequency (N=33)
%
Mobility 11 33.3 Study anytime 8 24.2 Access to learning resources 4 12.1 Entertainment 3 9.1 Note taking 3 9.1 Working on assignments 2 6.1 Being organised 2 6.1 Communication with lecturers 2 6.1 Multiple uses 2 6.1 Connecting with friends 1 3.0 Using the Internet 1 3.0 Online discussion 1 3.0 Researching 1 3.0 Using software 1 3.0 Writing 1 3.0
The mobility theme is supported by the participants’ comments. [The comments are coded to identify discipline type (IT, non-IT), m-learning program (P=laptop program, NP=no program), gender (M=male, F=female), and identity number (1-199). All participant comments are pre-sented verbatim.]
Portable, can work anytime because you can take it anywhere. (non-IT, P, F, 39)
I can do and access my work directly, instead of carrying information around on a thumbdrive or other mobile storage devices which are easier to lose. (IT, NP, M, 158)
The freedom of using it anywhere. (IT, NP, M, 182)
The second theme, being able to study anytime, revealed that students appreciated that having a laptop enables convenient access to their university work and information whenever needed.
57
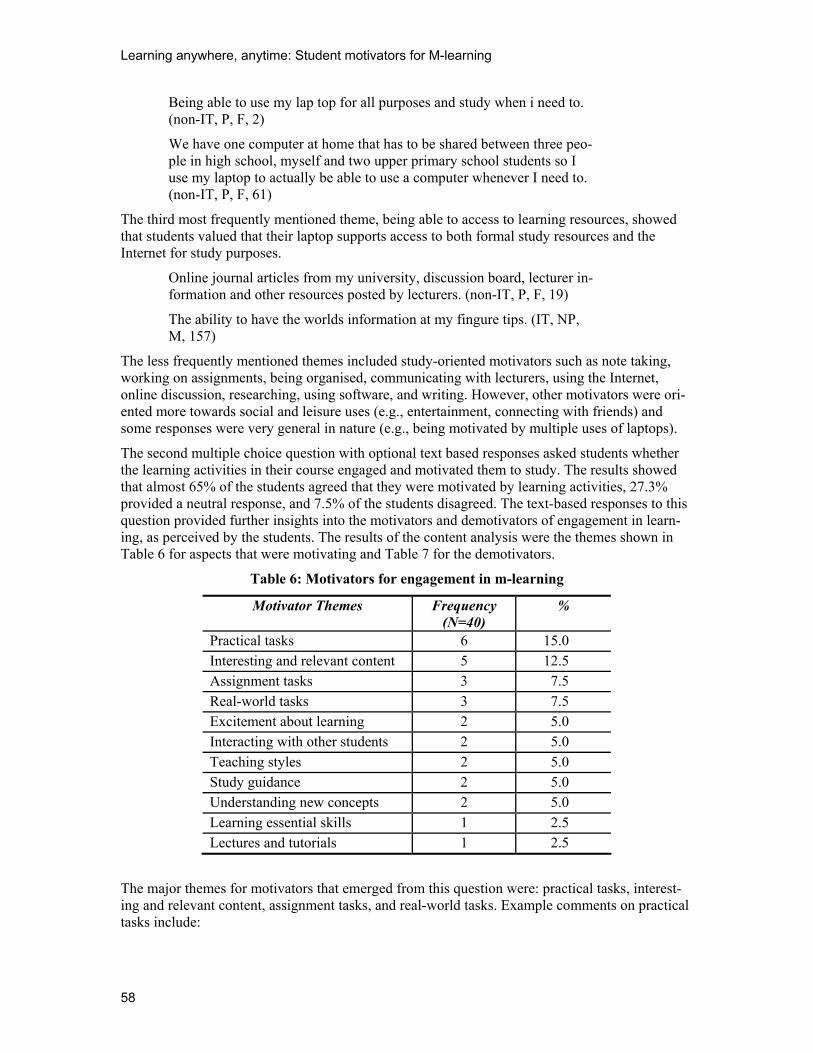
Learning anywhere, anytime: Student motivators for M-learning
Being able to use my lap top for all purposes and study when i need to. (non-IT, P, F, 2)
We have one computer at home that has to be shared between three peo-ple in high school, myself and two upper primary school students so I use my laptop to actually be able to use a computer whenever I need to. (non-IT, P, F, 61)
The third most frequently mentioned theme, being able to access to learning resources, showed that students valued that their laptop supports access to both formal study resources and the Internet for study purposes.
Online journal articles from my university, discussion board, lecturer in-formation and other resources posted by lecturers. (non-IT, P, F, 19)
The ability to have the worlds information at my fingure tips. (IT, NP, M, 157)
The less frequently mentioned themes included study-oriented motivators such as note taking, working on assignments, being organised, communicating with lecturers, using the Internet, online discussion, researching, using software, and writing. However, other motivators were ori-ented more towards social and leisure uses (e.g., entertainment, connecting with friends) and some responses were very general in nature (e.g., being motivated by multiple uses of laptops).
The second multiple choice question with optional text based responses asked students whether the learning activities in their course engaged and motivated them to study. The results showed that almost 65% of the students agreed that they were motivated by learning activities, 27.3% provided a neutral response, and 7.5% of the students disagreed. The text-based responses to this question provided further insights into the motivators and demotivators of engagement in learn-ing, as perceived by the students. The results of the content analysis were the themes shown in Table 6 for aspects that were motivating and Table 7 for the demotivators.
Table 6: Motivators for engagement in m-learning
Motivator Themes Frequency (N=40)
%
Practical tasks 6 15.0 Interesting and relevant content 5 12.5 Assignment tasks 3 7.5
Real-world tasks 3 7.5 Excitement about learning 2 5.0 Interacting with other students 2 5.0
Teaching styles 2 5.0 Study guidance 2 5.0 Understanding new concepts 2 5.0
Learning essential skills 1 2.5 Lectures and tutorials 1 2.5
The major themes for motivators that emerged from this question were: practical tasks, interest-ing and relevant content, assignment tasks, and real-world tasks. Example comments on practical tasks include:
58
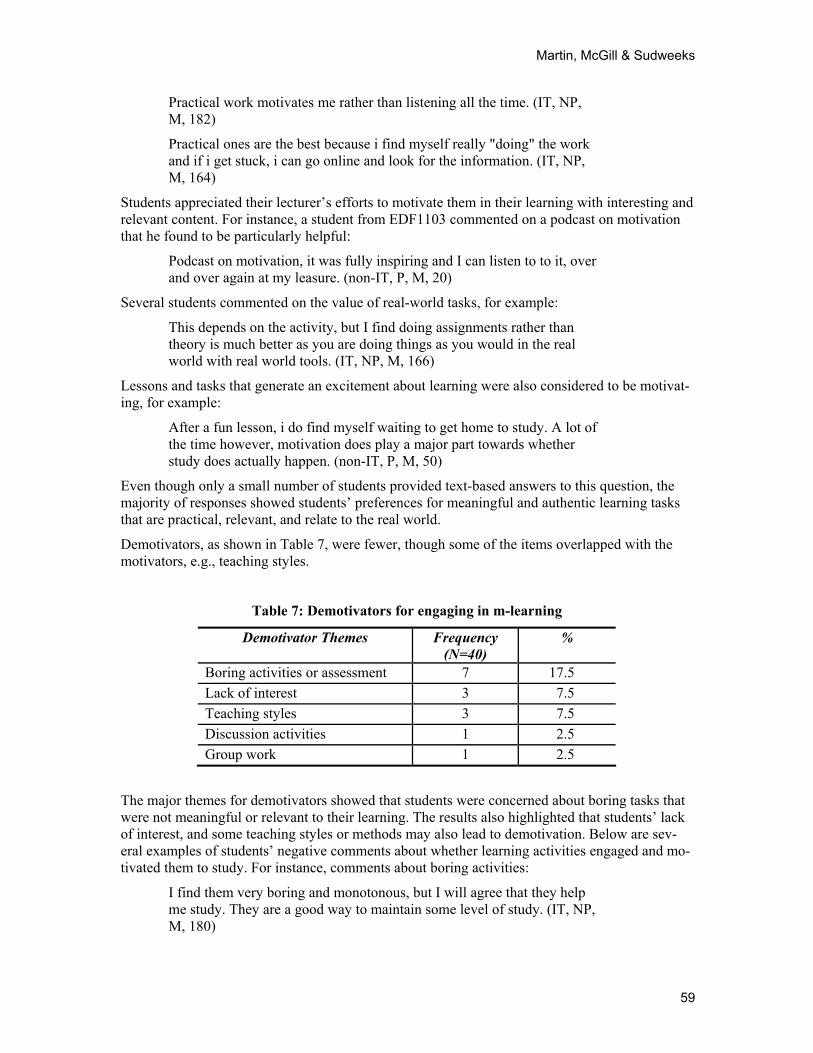
Martin, McGill & Sudweeks
Practical work motivates me rather than listening all the time. (IT, NP, M, 182)
Practical ones are the best because i find myself really "doing" the work and if i get stuck, i can go online and look for the information. (IT, NP, M, 164)
Students appreciated their lecturer’s efforts to motivate them in their learning with interesting and relevant content. For instance, a student from EDF1103 commented on a podcast on motivation that he found to be particularly helpful:
Podcast on motivation, it was fully inspiring and I can listen to to it, over and over again at my leasure. (non-IT, P, M, 20)
Several students commented on the value of real-world tasks, for example:
This depends on the activity, but I find doing assignments rather than theory is much better as you are doing things as you would in the real world with real world tools. (IT, NP, M, 166)
Lessons and tasks that generate an excitement about learning were also considered to be motivat-ing, for example:
After a fun lesson, i do find myself waiting to get home to study. A lot of the time however, motivation does play a major part towards whether study does actually happen. (non-IT, P, M, 50)
Even though only a small number of students provided text-based answers to this question, the majority of responses showed students’ preferences for meaningful and authentic learning tasks that are practical, relevant, and relate to the real world.
Demotivators, as shown in Table 7, were fewer, though some of the items overlapped with the motivators, e.g., teaching styles.
Table 7: Demotivators for engaging in m-learning
Demotivator Themes Frequency (N=40)
%
Boring activities or assessment 7 17.5
Lack of interest 3 7.5
Teaching styles 3 7.5
Discussion activities 1 2.5
Group work 1 2.5
The major themes for demotivators showed that students were concerned about boring tasks that were not meaningful or relevant to their learning. The results also highlighted that students’ lack of interest, and some teaching styles or methods may also lead to demotivation. Below are sev-eral examples of students’ negative comments about whether learning activities engaged and mo-tivated them to study. For instance, comments about boring activities:
I find them very boring and monotonous, but I will agree that they help me study. They are a good way to maintain some level of study. (IT, NP, M, 180)
59
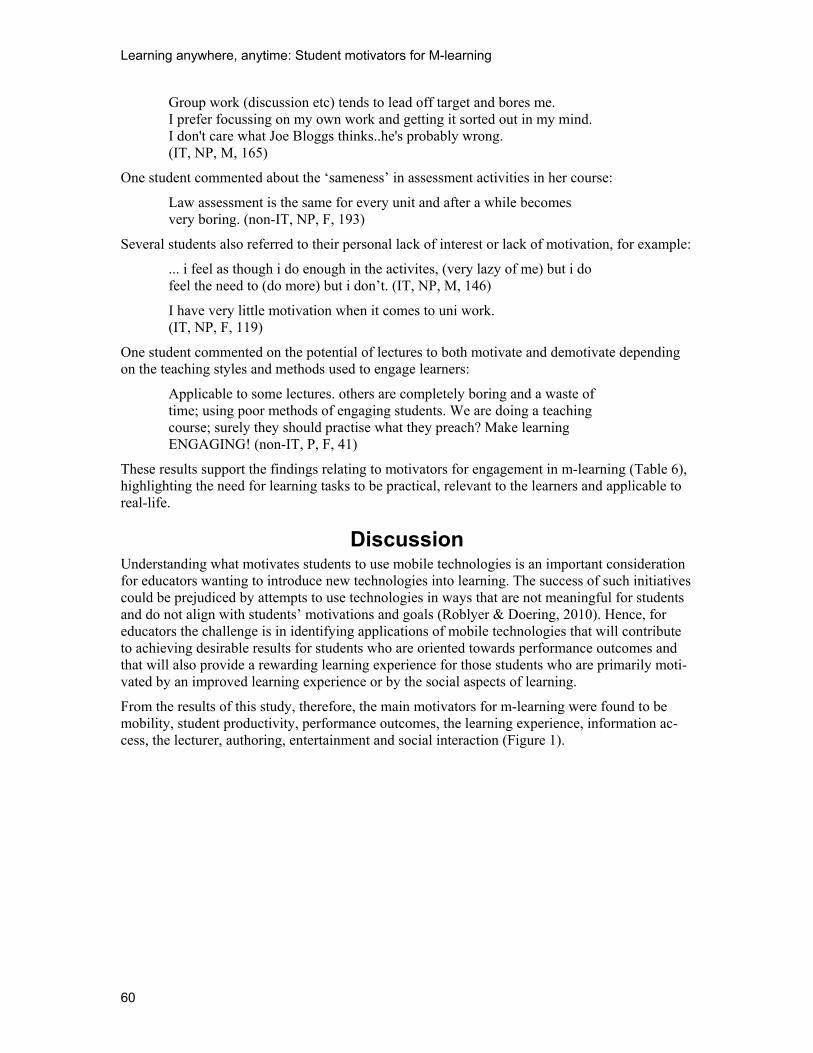
Learning anywhere, anytime: Student motivators for M-learning
Group work (discussion etc) tends to lead off target and bores me. I prefer focussing on my own work and getting it sorted out in my mind. I don't care what Joe Bloggs thinks..he's probably wrong. (IT, NP, M, 165)
One student commented about the ‘sameness’ in assessment activities in her course:
Law assessment is the same for every unit and after a while becomes very boring. (non-IT, NP, F, 193)
Several students also referred to their personal lack of interest or lack of motivation, for example:
... i feel as though i do enough in the activites, (very lazy of me) but i do feel the need to (do more) but i don’t. (IT, NP, M, 146)
I have very little motivation when it comes to uni work. (IT, NP, F, 119)
One student commented on the potential of lectures to both motivate and demotivate depending on the teaching styles and methods used to engage learners:
Applicable to some lectures. others are completely boring and a waste of time; using poor methods of engaging students. We are doing a teaching course; surely they should practise what they preach? Make learning ENGAGING! (non-IT, P, F, 41)
These results support the findings relating to motivators for engagement in m-learning (Table 6), highlighting the need for learning tasks to be practical, relevant to the learners and applicable to real-life.
Discussion Understanding what motivates students to use mobile technologies is an important consideration for educators wanting to introduce new technologies into learning. The success of such initiatives could be prejudiced by attempts to use technologies in ways that are not meaningful for students and do not align with students’ motivations and goals (Roblyer & Doering, 2010). Hence, for educators the challenge is in identifying applications of mobile technologies that will contribute to achieving desirable results for students who are oriented towards performance outcomes and that will also provide a rewarding learning experience for those students who are primarily moti-vated by an improved learning experience or by the social aspects of learning.
From the results of this study, therefore, the main motivators for m-learning were found to be mobility, student productivity, performance outcomes, the learning experience, information ac-cess, the lecturer, authoring, entertainment and social interaction (Figure 1).
60
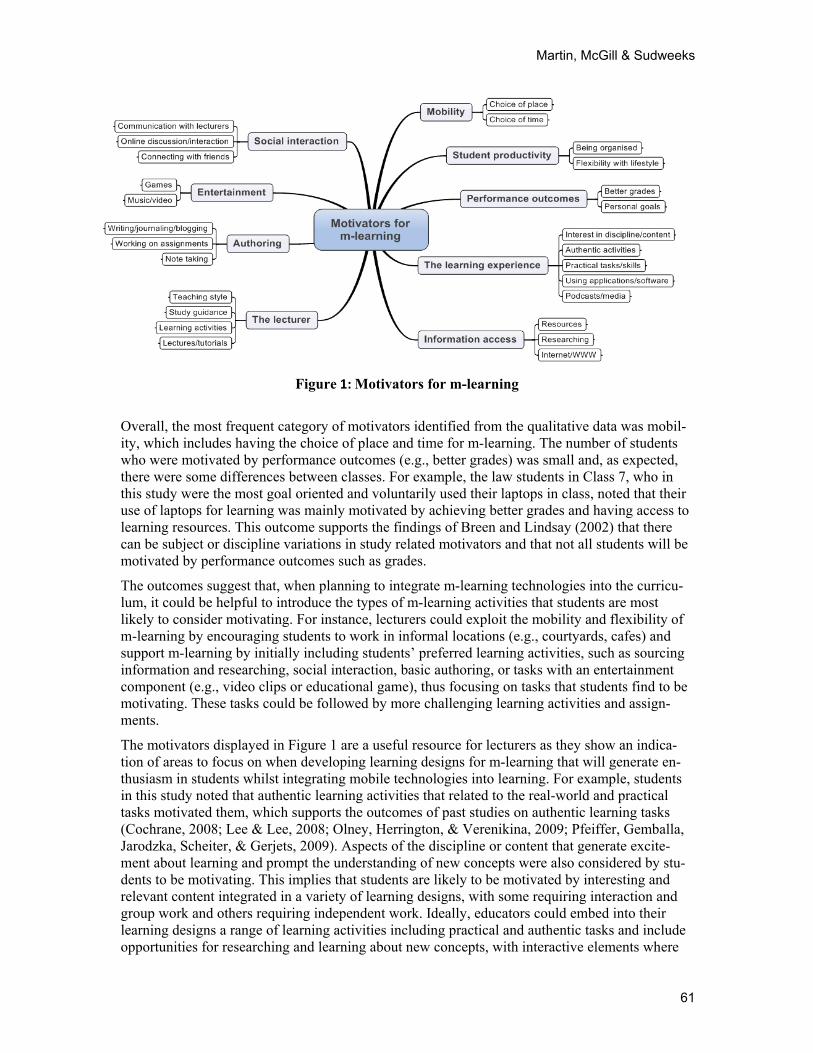
Martin, McGill & Sudweeks
Figure 1: Motivators for m-learning
Overall, the most frequent category of motivators identified from the qualitative data was mobil-ity, which includes having the choice of place and time for m-learning. The number of students who were motivated by performance outcomes (e.g., better grades) was small and, as expected, there were some differences between classes. For example, the law students in Class 7, who in this study were the most goal oriented and voluntarily used their laptops in class, noted that their use of laptops for learning was mainly motivated by achieving better grades and having access to learning resources. This outcome supports the findings of Breen and Lindsay (2002) that there can be subject or discipline variations in study related motivators and that not all students will be motivated by performance outcomes such as grades.
The outcomes suggest that, when planning to integrate m-learning technologies into the curricu-lum, it could be helpful to introduce the types of m-learning activities that students are most likely to consider motivating. For instance, lecturers could exploit the mobility and flexibility of m-learning by encouraging students to work in informal locations (e.g., courtyards, cafes) and support m-learning by initially including students’ preferred learning activities, such as sourcing information and researching, social interaction, basic authoring, or tasks with an entertainment component (e.g., video clips or educational game), thus focusing on tasks that students find to be motivating. These tasks could be followed by more challenging learning activities and assign-ments.
The motivators displayed in Figure 1 are a useful resource for lecturers as they show an indica-tion of areas to focus on when developing learning designs for m-learning that will generate en-thusiasm in students whilst integrating mobile technologies into learning. For example, students in this study noted that authentic learning activities that related to the real-world and practical tasks motivated them, which supports the outcomes of past studies on authentic learning tasks (Cochrane, 2008; Lee & Lee, 2008; Olney, Herrington, & Verenikina, 2009; Pfeiffer, Gemballa, Jarodzka, Scheiter, & Gerjets, 2009). Aspects of the discipline or content that generate excite-ment about learning and prompt the understanding of new concepts were also considered by stu-dents to be motivating. This implies that students are likely to be motivated by interesting and relevant content integrated in a variety of learning designs, with some requiring interaction and group work and others requiring independent work. Ideally, educators could embed into their learning designs a range of learning activities including practical and authentic tasks and include opportunities for researching and learning about new concepts, with interactive elements where
61
Learning anywhere, anytime: Student motivators for M-learning
appropriate. Students were also motivated by productivity aspects, such as being organised, with a few commenting on being dependent on their laptop for managing their study responsibilities.
Findings from this study also indicated that lecturers’ teaching styles could both motivate and demotivate students, whilst several other aspects relating to lecturers were also considered by students to be motivating (e.g., guiding, inspiring). The education students in Class 1 commented specifically on the impact of good lessons and their lecturers on their motivation to learn and, particularly, on the value of receiving clear direction as to what they need to be studying to suc-ceed. Students in this class were also supported by podcasts on motivation designed to build an awareness of motivation in learning through metacognition, that is, becoming aware of their learning processes through reflecting on their learning. Students found these podcasts to be a helpful resource. The usefulness of podcasts for the encouragement of metacognitive thinking has been previously documented by McLoughlin, Lee, and Chan (2006).
Whilst commenting on the motivators for m-learning, students also commented on what they found to be demotivating. An encouraging finding in this study was the presence of a much greater number of motivators than demotivators for m-learning. Feedback showed that variations existed in student experiences and perceptions; therefore, the responses were not homogeneous in terms of preferences. The demotivators were mostly tasks and assessments that students found to be boring, but some students also commented that they found discussion and group work activi-ties, in some instances, to be particularly demotivating. For several individuals, who were less keen on group work and discussion activities, this was probably due to their preference for work-ing independently and concerns about reliance on other students for progress, as found by Waite, Jackson, Diwan, and Leonardi (2004). However, despite some negativity, most responses high-lighted the motivational value of interacting with other students and communicating with lectur-ers. A number of students also admitted that their personal lack of interest was a major demotiva-tor, and some also suggested that a variety in the types of learning activities should be provided to avoid boredom.
In summary, the key motivator for using laptops for m-learning was mobility. The learning tasks that were key motivators were those centred on accessing information, authoring, and communi-cation.
Conclusion Over the past decade, a wide range of technologies have been adopted by universities to support e-learning and blended learning, and this has resulted in more flexible learning options becoming available to students. It is not unusual for today’s university students to be studying full-time, or part-time while working full-time, at the same time as having other commitments (e.g., family) and, for many, their on-campus time is limited (Conole et al., 2008; Eriksson, Vuojärvi, & Ruo-kamo, 2009). Hence they need access to information, administrative systems, and learning resources ‘on the run’, making m-learning an attractive and practical way of conducting their studies.
This paper documents an analysis of students’ motivators for m-learning and a summary of stu-dents’ perceptions about m-learning. The major motivator themes that emerged from the qualita-tive analysis of data were mobility, study anytime, and access to learning resources. However, some aspects relating to lecturers and their teaching also had an influence in motivating or demotivating students’ participation in m-learning mostly through their lecturing and teaching styles, the learning activities, and how they guided students in their studies.
According to Garrison (1997), motivation is a key dimension of self-directed learning and, in this study, students were forthcoming about what they found to be motivating, but also demotivating. Some students felt very strongly about the demotivating effect of having to undertake boring or
62
Martin, McGill & Sudweeks
monotonous tasks or having to participate in activities that do not seem to lead towards their per-formance outcomes or provide an enjoyable learning experience. Motivators should therefore be considered and included in the development of learning designs. Ideally, when designing an ac-tivity, lecturers could consider which aspects of the tasks are most likely to motivate their stu-dents. For example, students may be motivated by tasks with a real-life focus that they can relate to or by the use of networking tools or media that they find to be appealing. Depending on the emphasis of the activity, the learning tasks may encourage involvement in social media or a range of authentic individual or group based learning tasks.
Limitations In this study, in some classes students’ computing needs were catered for by laptop programs, and in other classes students used their own laptops or tablets. Students also used other mobile devices (e.g., iPods and smartphones) and most had access to computer laboratories on campus. However, the focus of this study was on classes where laptops or tablets were provided and classes where laptops were owned by students. Nevertheless, the study found that many students who were in laptop programs also had their own laptops, highlighting that laptop programs may be required only by some students who do not have the means to acquire a laptop.
As the research was limited to laptop/tablet users, there was no control group of non-laptop users. Therefore, when establishing the motivators and demotivators for m-learning, the findings are limited to laptop/tablet users only, which could possibly result in selection bias. The demotivators for m-learning may not all be applicable to students who do not use laptops or tablets. The demotivators for these students may be quite different (e.g., do not have access to a laptop; do not have computer skills).
Practical Implications The findings indicated that a number of different motivators encouraged students’ participation in m-learning. Some motivators centred on academic outcomes, but many motivators were related to students’ learning experiences, social interaction, and the entertainment aspects of learning with technologies.
Mobility was one of the main motivators for students’ use of laptops for m-learning, allowing them to study with others or alone depending on their needs at the time. Other categories of mo-tivators identified by the students were productivity, access to information, authoring, and lec-turer related motivators. Understanding what motivates students to utilise mobile technologies is an important consideration for educators wanting to introduce and meaningfully integrate new technologies into learning (Roblyer & Doering, 2010).
Overall students did not comment any major demotivating issues with infrastructure and access to wireless networks. This result indicates that mobile learning contexts (e.g., wireless networks, computer support services) may have reached a level of maturity in Australia and economically developed countries that allows educators to move beyond focusing on establishing the facilitating conditions for mobile learning, towards a focus on learning designs, embedding m-learning in the curriculum, and creating a motivating learning environment.
63

Learning anywhere, anytime: Student motivators for M-learning
References Boekaerts, M. (2001). Context sensitivity: Activated motivational beliefs, current concerns and emotional
arousal. In S. Volet & S. Jarvela (Eds.), Motivation in learning context: Theoretical advances and methodological implications (pp. 17-31). Oxford, UK: Elsevier Science Ltd.
Breen, R., & Lindsay, R. (2002). Different disciplines require different motivations for student success. Research in Higher Education, 43(6), 693-725.
Cobcroft, R., Towers, S., Smith, J., & Bruns, A. (2006, 26 September). Mobile learning in review: Oppor-tunities and challenges for learners, teachers, and institutions. Proceedings of the Online Learning and Teaching Conference (OLT), Brisbane, Qld, Australia, pp. 21-30. Retrieved from https://olt.qut.edu.au/udf/OLT2006/gen/static/papers/Cobcroft_OLT2006_paper.pdf
Cochrane, T. (2008). Using mobile Web 2.0 to transform pedagogy and engage learners. Auckland, New Zealand: Good Practice Publication Grant e-Book. Retrieved from www.akoaotearoa.ac.nz/gppg-ebook
Conole, G., de Laat, M., Dillon, T., & Darby, J. (2008). Disruptive technologies, pedagogical innovation. What's new: Findings from an in-depth study of students' use and perception of technology. Com-puters & Education, 50(2), 511-524. doi: 10.1016/j.compedu.2007.09.009
Corbeil, R., Pan, C., Sullivan, M., & Butler, J. (2007). Enhancing e-learning through m-learning: Are you ready to go mobile? In C. Crawford (Ed.), Proceedings of Society for Information Technology & Teacher Education (SITE) International Conference 2007 (pp. 273-280). Chesapeake, VA: AACE.
Demb, A., Erickson, D., & Hawkins-Wilding, S. (2004). The laptop alternative: Student reactions and stra-tegic implications. Computers & Education, 43(4), 383-401. doi: 10.1016/j.compedu.2003.08.008
de Vaus, D. A. (2002). Surveys in social research. Crows Nest, NSW, Australia: Allen & Unwin.
Eriksson, M. J., Vuojärvi, H., & Ruokamo, H. (2009). Laptop computers and wireless university campus networks: Is flexibility and effectiveness improved? Australasian Journal of Educational Technology, 25(3), 322-335. Retrieved from http://www.ascilite.org.au/ajet/ajet25/eriksson.html
Garrison, D. R. (1997). Self-directed learning: Toward a comprehensive model. Adult Education Quar-terly, 48(1), 18-33. doi: 10.1177/074171369704800103
Gulek, J. C., & Demirtas, H. (2005). Learning with technology: The impact of laptop use on student achievement. Journal of Technology, Learning, and Assessment, 3(2), 1-39.
Hall, M., & Elliott, K. M. (2003). Diffusion of technology into the teaching process: Strategies to encour-age faculty members to embrace the laptop environment. Journal of Education for Business, 78(6), 301-307.
Herrington, J., Herrington, A., Mantei, J., Olney, I., & Ferry, B. (2009). Using mobile technologies to develop new ways of teaching and learning. In J. Herrington, A. Herrington, J. Mantei, I. Olney, & B. Ferry (Eds.), New technologies, new pedagogies: Mobile learning in higher education. (pp. 1-14). Wollongong, NSW: University of Wollongong. Retrieved from http://ro.uow.edu.au/newtech/
Ingleton, C., Kiley, M., Cannon, R., & Rogers, T. (2000). Leap into... Student-centred learning. Adelaide, SA, Australia: The University of Adelaide, ACUE. Retrieved from http://web.services.adelaide.edu.au/clpd/resources/leap/leapinto/StudentCentredLearning.pdf
Keller, J. M. (2008). First principles of motivation to learn and e3-learning. Distance Education, 29(2), 175 - 185.
Kim, S. H., Mims, C., & Holmes, K. P. (2006). An introduction to current trends and benefits of mobile wireless technology use in higher education. AACE Journal, 14(1), 77-100.
Klein, H. J., Noe, R. A., & Wang, C. (2006). Motivation to learn and course outcomes: The impact of de-livery mode, learning goal orientation, and perceived barriers and enablers. Personnel Psychology, 59, 665-702.
64
Martin, McGill & Sudweeks
Kuo, C.-L. (2005). Wireless technology in higher education: The perceptions of faculty and students con-cerning the use of wireless laptops. (Doctoral Disseration), Ohio University, Ohio, OH. Retrieved from http://etd.ohiolink.edu/etd/ (1125521504) OhioLINK Electronic Theses and Dissertations Center database.
Lane, C., & Yamashiro, G. (2005). Educational technology at the University of Washington: Report on the 2005 instructor and student surveys (pp. 1-30). Seattle, WA: Office of Learning Technologies, Uni-versity of Washington. Retrieved from http://catalyst.washington.edu/research_development/papers/2006/edtech_2005report.pdf
Laurillard, D. (2007). Pedagogical forms for mobile learning. In N. Pachler (Ed.), Mobile learning: To-wards a research agenda (pp. 153-175). London, UK: WLE Centre.
Lee, Y., & Lee, S. (2008). Situated mobile learning in higher education. In C. J. Bonk, M. M. Lee, & T. Reynolds (Eds.), Proceedings of the World Conference on E-Learning in Corporate, Government, Healthcare, and Higher Education 2008. (pp. 1745-1750). Las Vegas, NV: AACE.
MacCallum, K. (2009, 29 September-1 October). Student characteristics and variables that determine mo-bile learning adoption: An initial study. Proceedings of the Universal College of Learning: Teaching and Learning Conference, Palmerston North, NZ, pp. 1-8. Retrieved from http://akoaotearoa.ac.nz/download/ng/file/group-3740/n3750-student-characteristics-and-variables-that-determine-mobile-learning-adoption---an-initial-study---mac-callum.pdf
MacCallum, K., & Jeffrey, L. (2009). Identifying discriminating variables that determine mobile learning adoption by educators: An initial study. In R. J. Atkinson & C. McBeath (Eds.), Same places, different spaces. Proceedings of the 26th Annual Conference of the Australasian Society for Computers in Learning in Tertiary Education (ASCILITE 2009) (pp. 602-608). Auckland, New Zealand: AS-CILITE.
MacCallum, K., & Jeffrey, L. (2010). Resistance to the inclusion of mobile tools in the classroom: The impact of attitudes and variables on the adoption of mobile learning In R. Guy (Ed.), Mobile learning: Pilot projects and initiatives (pp. 143-166). Santa Rosa, CA: Informing Science Press.
Martin, A. J. (2006). The relationship between teachers' perceptions of student motivation and engagement and teachers' enjoyment of and confidence in teaching. Asia-Pacific Journal of Teacher Education, 34(1), 73-93. doi: 10.1080/13598660500480100
McLoughlin, C., Lee, M. J. W., & Chan, A. (2006, 2-4 October). Fostering reflection and metacognition through student generated podcasts. Proceedings of the Australian Computers in Education Confer-ence (ACEC 2006), Cairns, Qld, Australia, pp. 1-8. Retrieved from http://csusap.csu.edu.au/~achan/papers/2006_POD_ACEC.pdf
McMillan, K., & Honey, M. (1993). Year one of project pulse: Pupils using laptops in Science and Eng-lish. A final report. New York, NY: Center for Technology in Education. Retrieved from ERIC ED358822 http://eric.ed.gov/
Newhouse, C. P. (2001). A follow-up study of students using portable computers at a secondary school. British Journal of Educational Technology, 32(2), 209-219. doi: 10.1111/1467-8535.00191
Oblinger, D., & Oblinger, J. L. (2005). Educating the Net Generation (pp. 264). Retrieved from http://www.educause.edu/ir/library/pdf/pub7101.pdf
Olney, I., Herrington, J., & Verenikina, I. (2009). Digital story telling using iPods. In J. Herrington, A. Herrington, J. Mantei, I. Olney, & B. Ferry (Eds.), New technologies, new pedagogies: Mobile learn-ing in higher education (pp. 36-44). Wollongong, NSW, Australia: University of Wollongong.
Oloruntoba, R. (2006). Mobile learning environments: A conceptual overview. In A. Brown (Ed.), Pro-ceedings of Learning on the Move: Online Learning and Teaching Conference 2006 (pp. 1-9). Bris-bane, Qld, Australia: Queensland University of Technology.
Pfeiffer, V. D. I., Gemballa, S., Jarodzka, H., Scheiter, K., & Gerjets, P. (2009). Situated learning in the mobile age: Mobile devices on a field trip to the sea. ALT-J: Research in Learning Technology, 17(3), 187 - 199.
65
Learning anywhere, anytime: Student motivators for M-learning
Pintrich, P. R. (2003). A motivational science perspective on the role of student motivation in learning and teaching contexts. Journal of Educational Psychology, 95(4), 667-686.
Pintrich, P. R., & Schunk, D. H. (2002 ). Motivation in education: Theory, research, and applications. (2nd ed.). Michigan, MI: Merrill.
Prensky, M. (2001). Digital Natives, Digital Immigrants. On the Horizon, 9(5), 1-6.
Roberts, G. R. (2005). Technology and learning expectations of the Net Generation. In D. Oblinger & J. Oblinger (Eds.), Educating the Net Generation. (pp. 3.1-3.7). Boulder, CO: EDUCAUSE.
Roblyer, M. D., & Doering, A. H. (2010). Integrating educational technology into teaching (5th ed.). New York, NY: Allyn & Bacon.
Sha, L., Looi, C. K., Chen, W., & Zhang, B. H. (2012). Understanding mobile learning from the perspec-tive of self-regulated learning. Journal of Computer Assisted Learning, 28(4), 366-378. doi: 10.1111/j.1365-2729.2011.00461.x
Schunk, D. H., Pintrich, P. R., & Meece, J. L. (2008). Motivation in education: Theory, research, and ap-plications. (3rd ed.). Upper Saddle River, NJ: Pearson.
Seifert, T. L., & O'Keefe, B. A. (2001). The relationship of work avoidance and learning goals to perceived competence, externality and meaning. British Journal of Educational Psychology, 71(1), 81-92. doi: 10.1348/000709901158406
Traxler, J. (2009). Learning in a mobile age. International Journal of Mobile and Blended Learning, 1(1), 1-12.
Waite, W. M., Jackson, M. H., Diwan, A., & Leonardi, P. M. (2004). Student culture vs group work in computer science. ACM SIGCSE Bulletin, 36(1), 1-16. doi: 10.1.1.4.7900
Wolters, C. A. (2004). Advancing achievement goal theory: Using goal structures and goals orientations to predict students’ motivation, cognition, and achievement. Journal of Educational Psychology, 96, 236-250.
Wolters, C. A., Yu, S. L., & Pintrich, P. R. (1996). The relation between goal orientation and students' mo-tivational beliefs and self-regulated learning. Learning and Individual Differences, 8(3), 211-238. doi: http://dx.doi.org/10.1016/S1041-6080(96)90015-1
66

Martin, McGill & Sudweeks
67
r-
chnology and Communication.
Biographies Romana Martin is a Lecturer in the Teaching and Learning team at the Curtin Business School at Curtin University in Western Australia. Her qualifications include a MEd from Edith Cowan University and a PhD from Murdoch University in Western Australia. Her background is in the field of educational design, academic development and educa-tional technology and she has multidisciplinary qualifications in edu-cation, information technology and educational multimedia. In her curent role she provides academic leadership and expertise in online and blended learning and the application of new technologies to support student learning. She has led a wide range of teaching and learning initiatives and her research interests are in the field of online learning,
mobile learning, student engagement, student-centered learning and new generation learning spaces.
Tanya McGill is an Associate Professor in the School of Engineering and Information Technology at Murdoch University in Western Aus-tralia. She has an MBA from the University of Western Australia and a PhD from Murdoch University. Her major research interests include e-learning, technology adoption, and information technology education. She is the author of over 100 journal articles, book chapters, and arti-cles in conference proceedings. Her research has been published in various journals including Behaviour and Information Technology, Decision Support Systems, Computers & Education, Journal of Com-puter Assisted Learning, ACM Transactions on Information and Sys-
tem Security, Journal of Computing in Higher Education, and Information Resources Manage-ment Journal.
Fay Sudweeks is Emerita Associate Professor at Murdoch University and former Adjunct Associate Professor at the Australian National University. She has a Bachelor of Arts (Psychology and Sociology), Master of Cognitive Science and Doctor of Philosophy (Communica-tion Studies). Her current research interests are e-learning and the so-cial, cultural and economic aspects of computer-mediated communica-tion. She has published an authored book, 8 edited books, 10 edited proceedings, and more than 80 papers in journals, books and confer-ence proceedings. She is on the editorial board of the Journal of Com-puter-Mediated Communication, New Media and Society, Interna-tional Journal of e-Learning, and Human Communication Research. With Charles Ess, she has co-chaired five international and interdisci-
plinary conferences on Cultural Attitudes towards Te

This page left blank intentionally
Journal of Information Technology Education: Research Volume 12, 2013
Systematically Evaluating the Effectiveness of an Information Systems Capstone Course:
Implications for Practice
T. Grandon Gill University of South Florida,
Tampa, FL, USA
Albert D. Ritzhaupt University of Florida, Gainesville, FL, USA
Executive Summary The information systems capstone experience for undergraduate majors is a topic frequently dis-cussed in academic circles within the field. Though very little consensus exists on this topic, there are core themes that emerge in the design, development, and delivery of the undergraduate cap-stone courses. Our analysis of prior literature reveals four components to capstone experiences that are often used in these courses, which include 1) a focus on real-world, complex information systems design, development, and integration; 2) the use of the case method to engage students in critical thinking, problem-solving, and decision-making; 3) the use of ePortfolios to assist stu-dents in integrating knowledge across the discipline and showcasing their learning to potential employers; and 4) an emphasis with the undergraduate information systems majors interacting with seasoned professionals in the field. These dimensions were carefully considered in the im-plementation of a capstone course at a large research extensive university in the southeastern United States. This project was funded by a National Science Foundation (NSF) grant program.
The paper presents a novel information systems undergraduate capstone course that includes two major design themes: case pedagogy and individual projects. The course is carefully described in terms of the student learning objectives, salient features, and philosophy. Further, the course was systematically evaluated using a multi-method approach, involving five distinct data sources: the Critical Thinking Assessment Test (CAT), the Student Assessment of Learning Gains (SALG), the Student Assessment of Instruction (SAI), faculty review of mini-cases, and student and instructor reviews of final projects. These data were examined both descriptively and inferentially. Results indicate that students were generally satisfied with the course design. However, some negative comments were made. Students did not show significant increases in critical thinking skills as measured by the CAT. However, faculty review of the pre- and post-mini-case submissions shows that students had significant gains in evaluating information, creative thinking, and learn-
ing and problem-solving. Implications for practice are provided in light of the find-ings.
Keywords: Information systems, cap-stone, case pedagogy, evaluation, IS cur-riculum, critical thinking, education.
Material published as part of this publication, either on-line or in print, is copyrighted by the Informing Science Institute. Permission to make digital or paper copy of part or all of these works for personal or classroom use is granted without fee provided that the copies are not made or distributed for profit or commercial advantage AND that copies 1) bear this notice in full and 2) give the full citation on the first page. It is per-missible to abstract these works so long as credit is given. To copy in all other cases or to republish or to post on a server or to redistribute to lists requires specific permission and payment of a fee. Contact [email protected] to request redistribution permission.
Editor: Keith Willoughby
Evaluating IS Capstone Course
Introduction Many academic programs in the broad field of information systems offer a capstone experience for their students, and many of these faculty members share the discourse on how best to facilitate such a course for their diverse populations (Astani, 2006; Brandon, Pruett, & Wade, 2002; Gupta, & Wachter, 1998; Harper, Lamb, & Buffington, 2008; Hashemi, & Kellersberger, 2009; Janicki, Fischetti, & Burns, 2006; Kumar, 2006; McGann, & Cahill, 2005; Morgan, & Aitken, 2006; Schwieger, & Surendran, 2010; Shih, LeClair, & Varden, 2010; Surendran, & Schwieger, 2011; Tuttle, 2000, 2001). After more than a decade of discourse on the topic, there is still very little agreement on how best to design, develop, and deliver an information systems capstone experi-ence for undergraduate majors. The objectives of an information systems capstone course have been described as follows: “a means for students to apply knowledge gained in previous courses and integrate those experiences in a more realistic setting, where concepts are applied simultane-ously, rather than sequentially and in isolation” (Denton & Spangler, 2001, p. 150). Such a broad mandate has necessarily led to a variety of unique approaches offered by the various academic programs in our field.
One solution, presented in the undergraduate IS 2002 model curriculum (Gorgone, Davis, Valacich, Topi, Feinstein, & Longenecker 2003) has been to build the course around project management. An alternative approach has been to structure the course around student presenta-tions of case studies, situation analysis reports and team projects (Brandon et al., 2002; Gupta & Wachter, 1998). Still other courses have emphasized the use of guest speakers and student re-search projects (Kumar, 2006). Yet another approach is for students to develop an ePortfolio to demonstrate their competency across the curriculum (Shih et al., 2010). In most of these exam-ples, evidence supports the view that students and faculty alike were satisfied with the course out-comes. What is less clear is the degree to which the actual learning outcomes could be demon-strated. Of particular concern is how these outcomes map to the expectations we set forth for our capstone experience.
The course that is the focus of this paper is the undergraduate capstone course for information systems majors. The course and program is situated within a College of Business at a large, re-search extensive state university. As of spring 2012, the first offering of the course, approxi-mately 300 students were declared for the 2-year upper level major, meaning that course enroll-ment was typically between 40 and 50 students in each of the fall, spring, and summer sessions. The previous version of the capstone course - offered in a more traditional lecture-based format - received relatively high student evaluations. There were concerns, however, that the full range of learning outcomes intended for a capstone course was not necessarily being achieved. These con-cerns motivated a redesign of that course.
Although the two core activities in the redesigned course - case pedagogy (e.g., Brandon et al., 2002; Gupta, & Wachter, 1998; Harper et al., 2008) and student projects (e.g., Gupta, & Wachter, 1998; Hashemi, & Kellersberger, 2009; McGann & Cahill, 2005 Tuttle, 2000, 2001) - have fre-quently been included in capstone courses, the course here described introduced many features that were quite novel. The paper begins by providing a synthesis across information systems cap-stone courses, then summarizes the key learning objectives of the course. The design of the course is then presented along with a philosophy, after which initial learning outcomes are de-scribed. The paper then describes a multi-method approach to systematically evaluate the course features. The paper concludes with some thoughts on the broader impacts of the project and how the project might be extended as well as implications for practice in the field of information sys-tems at other institutions of higher education.
70
Gill & Ritzhaupt
Relevant Literature Within the information systems literature, a significant disconnect exists between what we re-search and what we teach has been observed (Gill & Bhattacherjee, 2009). The source of the problem seems to be that much of what we teach, particularly in undergraduate programs, is tech-nical subjects such as programming, databases, data communications, and systems analysis and design. What we research, on the other hand, tends towards the behavioral sciences (although ex-ceptions obviously exist). Compounding the problem is the fact that we are increasingly being asked to assess learning on core skill dimensions that do not directly relate to either activity - such as problem solving, communications, collaboration, and ability to learn (Gill, 2010). Many have suggested the undergraduate capstone as a place for this assessment to occur.
The capstone experience for undergraduate information systems majors has been a topic of inter-est for more than a decade. As previously mentioned and as clearly illustrated in Table 1, very little agreement exists on what topics should be covered and the pedagogy for such a course. However, when examining across these various descriptions, a few pertinent themes emerge. First, across several of the course descriptions, there is an emphasis on the design, development, and implementation of real-world technology solutions for real-world clients (e.g., Gupta, & Wa-chter, 1998; Hashemi, & Kellersberger, 2009; McGann & Cahill, 2005 Tuttle, 2000, 2001). This theme emphasizes the importance of information systems students working on authentic problems within a business domain and integrating technology with real clients to better grasp the complex process of systems analysis, design, development, and integration. Further, the emphasis on stu-dent working in teams is consistent with the belief that information system majors should be well-versed in the soft-skills of collaborating, leadership, diplomacy, and more.
A second theme to emerge from these vast course implementations is the use of the case method to engage students in complex discussions surrounding both the technology and management type decisions facing information systems professionals (e.g., Brandon et al., 2002; Harper et al., 2008). The case method is a pedagogical approach that has been widely adopted in several disci-plines, including business, medicine, law, and education. In the context of information systems, we are concerned with encouraging students to engage in critical thinking, problem-solving, ex-pression of complex ideas, synthesis and analysis, and decision-making abilities. The case method is a novel way to address these concerns by posing semi-structured and authentic prob-lems, usually written in a way that highlights the decisions a protagonist must address. The case method is a key focus of the course design described here.
A third theme to emerge from these data is an emphasis on student portfolios (e.g., McGann & Cahill, 2005; Shih et al., 2010), particularly ePortfolios, which involve students’ representation, reflection, and revision (Ritzhaupt, Singh, Seyferth, & Dedrick, 2008). ePortfolios are a newer approach to an old problem: helping students synthesize and integrate knowledge across their academic program and helping students showcase their knowledge, skills, and dispositions to po-tential employers. ePortfolios are still in their infancy in the field of information systems, but ac-crediting agencies like Accreditation Board for Engineering and Technology (ABET) (Brumm, Ellertson, & Mickelson, 2003) are already exploring the utility of these tools for accreditation and student learning outcomes. We anticipate that ePortfolios will have a significant role to play in information systems programs in the near future.
A fourth and final theme to arise from the literature is an emphasis on undergraduate information systems students interacting with professionals already practicing in the field (e.g., Astani, 2006; Brandon et al., 2002; Kumar, 2006; McGann & Cahill, 2005). Whether students are soliciting requirements from real-world clients or interviewing seasoned professionals, the contact between a student and professional is a valuable component to a capstone experience. Professional can share their experiences to help students make explicit connections between theory and practice.
71
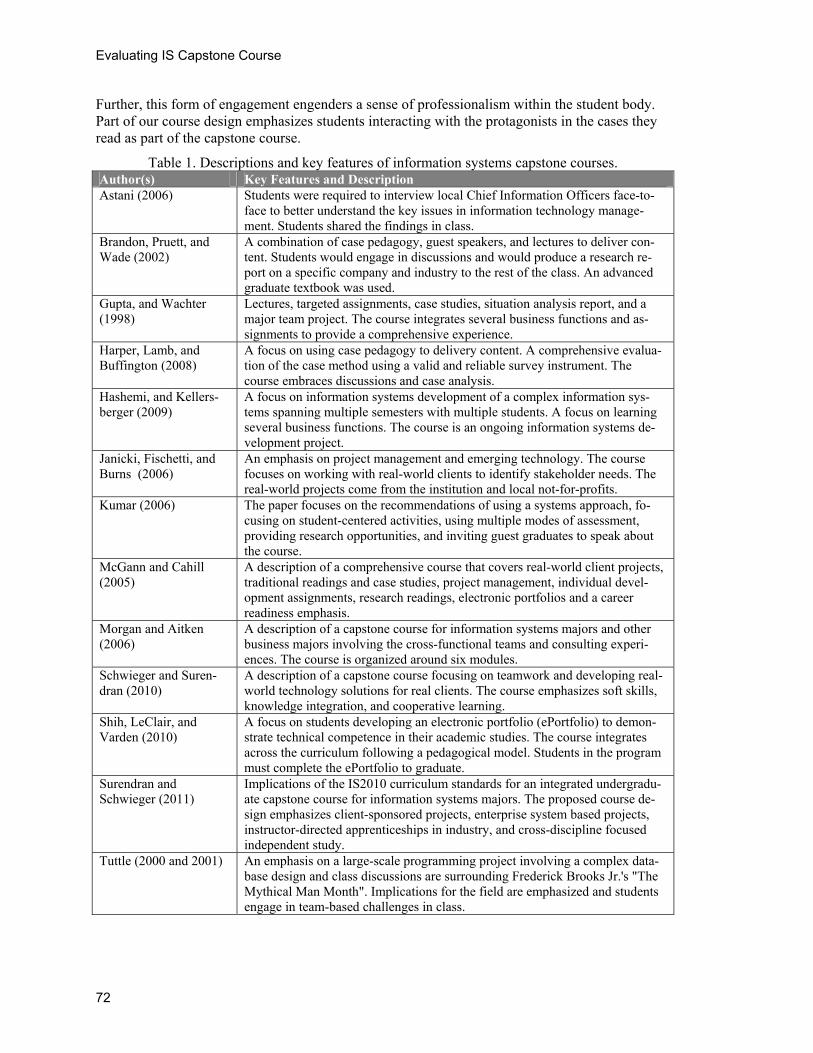
Evaluating IS Capstone Course
Further, this form of engagement engenders a sense of professionalism within the student body. Part of our course design emphasizes students interacting with the protagonists in the cases they read as part of the capstone course.
Table 1. Descriptions and key features of information systems capstone courses. Author(s) Key Features and Description Astani (2006) Students were required to interview local Chief Information Officers face-to-
face to better understand the key issues in information technology manage-ment. Students shared the findings in class.
Brandon, Pruett, and Wade (2002)
A combination of case pedagogy, guest speakers, and lectures to deliver con-tent. Students would engage in discussions and would produce a research re-port on a specific company and industry to the rest of the class. An advanced graduate textbook was used.
Gupta, and Wachter (1998)
Lectures, targeted assignments, case studies, situation analysis report, and a major team project. The course integrates several business functions and as-signments to provide a comprehensive experience.
Harper, Lamb, and Buffington (2008)
A focus on using case pedagogy to delivery content. A comprehensive evalua-tion of the case method using a valid and reliable survey instrument. The course embraces discussions and case analysis.
Hashemi, and Kellers-berger (2009)
A focus on information systems development of a complex information sys-tems spanning multiple semesters with multiple students. A focus on learning several business functions. The course is an ongoing information systems de-velopment project.
Janicki, Fischetti, and Burns (2006)
An emphasis on project management and emerging technology. The course focuses on working with real-world clients to identify stakeholder needs. The real-world projects come from the institution and local not-for-profits.
Kumar (2006) The paper focuses on the recommendations of using a systems approach, fo-cusing on student-centered activities, using multiple modes of assessment, providing research opportunities, and inviting guest graduates to speak about the course.
McGann and Cahill (2005)
A description of a comprehensive course that covers real-world client projects, traditional readings and case studies, project management, individual devel-opment assignments, research readings, electronic portfolios and a career readiness emphasis.
Morgan and Aitken (2006)
A description of a capstone course for information systems majors and other business majors involving the cross-functional teams and consulting experi-ences. The course is organized around six modules.
Schwieger and Suren-dran (2010)
A description of a capstone course focusing on teamwork and developing real-world technology solutions for real clients. The course emphasizes soft skills, knowledge integration, and cooperative learning.
Shih, LeClair, and Varden (2010)
A focus on students developing an electronic portfolio (ePortfolio) to demon-strate technical competence in their academic studies. The course integrates across the curriculum following a pedagogical model. Students in the program must complete the ePortfolio to graduate.
Surendran and Schwieger (2011)
Implications of the IS2010 curriculum standards for an integrated undergradu-ate capstone course for information systems majors. The proposed course de-sign emphasizes client-sponsored projects, enterprise system based projects, instructor-directed apprenticeships in industry, and cross-discipline focused independent study.
Tuttle (2000 and 2001) An emphasis on a large-scale programming project involving a complex data-base design and class discussions are surrounding Frederick Brooks Jr.'s "The Mythical Man Month". Implications for the field are emphasized and students engage in team-based challenges in class.
72
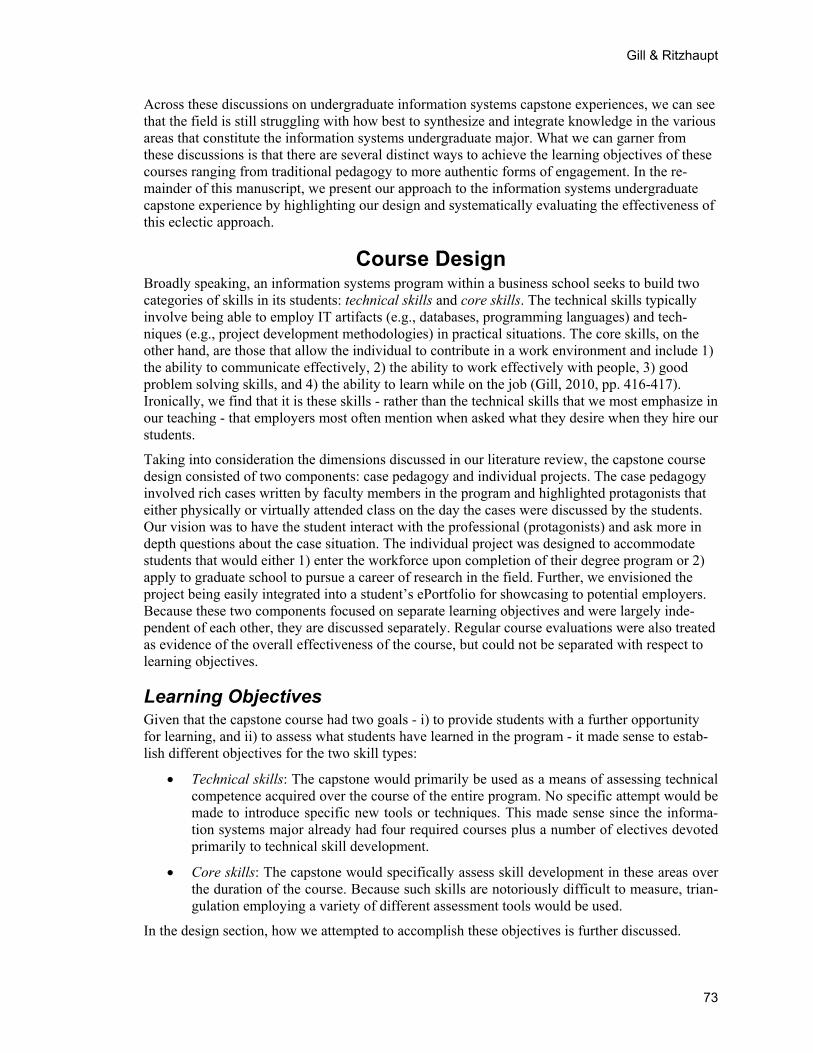
Gill & Ritzhaupt
Across these discussions on undergraduate information systems capstone experiences, we can see that the field is still struggling with how best to synthesize and integrate knowledge in the various areas that constitute the information systems undergraduate major. What we can garner from these discussions is that there are several distinct ways to achieve the learning objectives of these courses ranging from traditional pedagogy to more authentic forms of engagement. In the re-mainder of this manuscript, we present our approach to the information systems undergraduate capstone experience by highlighting our design and systematically evaluating the effectiveness of this eclectic approach.
Course Design Broadly speaking, an information systems program within a business school seeks to build two categories of skills in its students: technical skills and core skills. The technical skills typically involve being able to employ IT artifacts (e.g., databases, programming languages) and tech-niques (e.g., project development methodologies) in practical situations. The core skills, on the other hand, are those that allow the individual to contribute in a work environment and include 1) the ability to communicate effectively, 2) the ability to work effectively with people, 3) good problem solving skills, and 4) the ability to learn while on the job (Gill, 2010, pp. 416-417). Ironically, we find that it is these skills - rather than the technical skills that we most emphasize in our teaching - that employers most often mention when asked what they desire when they hire our students.
Taking into consideration the dimensions discussed in our literature review, the capstone course design consisted of two components: case pedagogy and individual projects. The case pedagogy involved rich cases written by faculty members in the program and highlighted protagonists that either physically or virtually attended class on the day the cases were discussed by the students. Our vision was to have the student interact with the professional (protagonists) and ask more in depth questions about the case situation. The individual project was designed to accommodate students that would either 1) enter the workforce upon completion of their degree program or 2) apply to graduate school to pursue a career of research in the field. Further, we envisioned the project being easily integrated into a student’s ePortfolio for showcasing to potential employers. Because these two components focused on separate learning objectives and were largely inde-pendent of each other, they are discussed separately. Regular course evaluations were also treated as evidence of the overall effectiveness of the course, but could not be separated with respect to learning objectives.
Learning Objectives Given that the capstone course had two goals - i) to provide students with a further opportunity for learning, and ii) to assess what students have learned in the program - it made sense to estab-lish different objectives for the two skill types:
Technical skills: The capstone would primarily be used as a means of assessing technical competence acquired over the course of the entire program. No specific attempt would be made to introduce specific new tools or techniques. This made sense since the informa-tion systems major already had four required courses plus a number of electives devoted primarily to technical skill development.
Core skills: The capstone would specifically assess skill development in these areas over the duration of the course. Because such skills are notoriously difficult to measure, trian-gulation employing a variety of different assessment tools would be used.
In the design section, how we attempted to accomplish these objectives is further discussed.
73
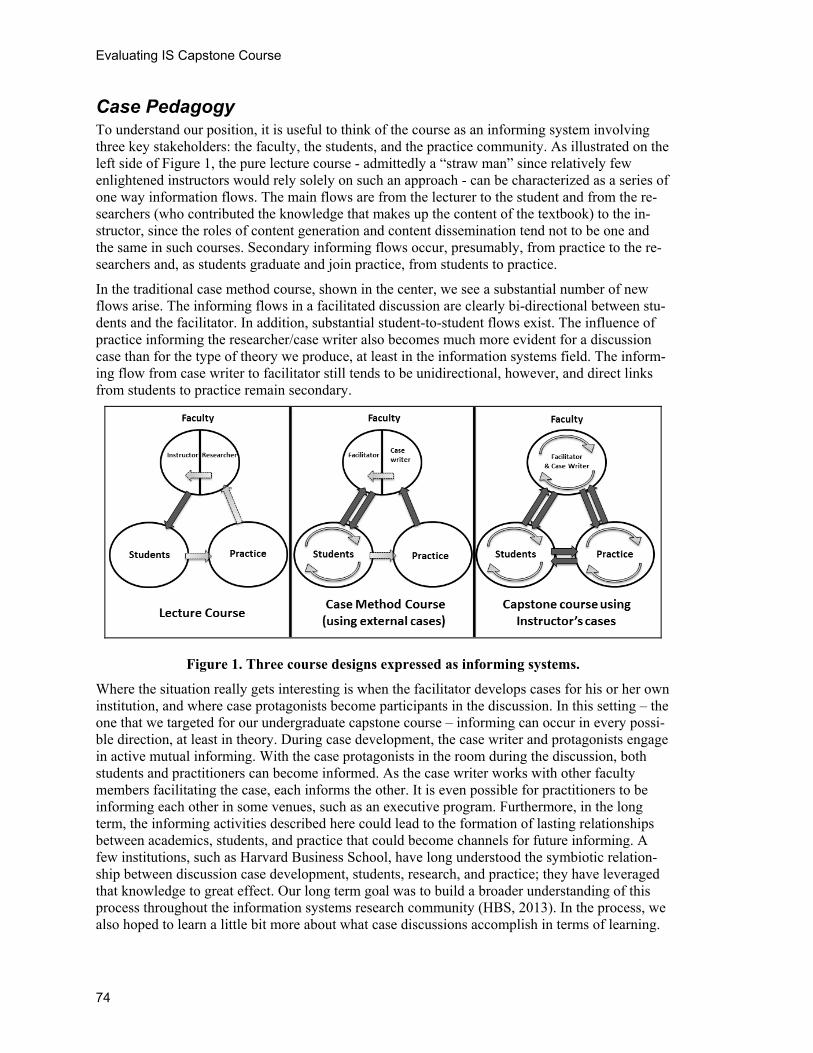
Evaluating IS Capstone Course
Case Pedagogy To understand our position, it is useful to think of the course as an informing system involving three key stakeholders: the faculty, the students, and the practice community. As illustrated on the left side of Figure 1, the pure lecture course - admittedly a “straw man” since relatively few enlightened instructors would rely solely on such an approach - can be characterized as a series of one way information flows. The main flows are from the lecturer to the student and from the re-searchers (who contributed the knowledge that makes up the content of the textbook) to the in-structor, since the roles of content generation and content dissemination tend not to be one and the same in such courses. Secondary informing flows occur, presumably, from practice to the re-searchers and, as students graduate and join practice, from students to practice.
In the traditional case method course, shown in the center, we see a substantial number of new flows arise. The informing flows in a facilitated discussion are clearly bi-directional between stu-dents and the facilitator. In addition, substantial student-to-student flows exist. The influence of practice informing the researcher/case writer also becomes much more evident for a discussion case than for the type of theory we produce, at least in the information systems field. The inform-ing flow from case writer to facilitator still tends to be unidirectional, however, and direct links from students to practice remain secondary.
Figure 1. Three course designs expressed as informing systems.
Where the situation really gets interesting is when the facilitator develops cases for his or her own institution, and where case protagonists become participants in the discussion. In this setting – the one that we targeted for our undergraduate capstone course – informing can occur in every possi-ble direction, at least in theory. During case development, the case writer and protagonists engage in active mutual informing. With the case protagonists in the room during the discussion, both students and practitioners can become informed. As the case writer works with other faculty members facilitating the case, each informs the other. It is even possible for practitioners to be informing each other in some venues, such as an executive program. Furthermore, in the long term, the informing activities described here could lead to the formation of lasting relationships between academics, students, and practice that could become channels for future informing. A few institutions, such as Harvard Business School, have long understood the symbiotic relation-ship between discussion case development, students, research, and practice; they have leveraged that knowledge to great effect. Our long term goal was to build a broader understanding of this process throughout the information systems research community (HBS, 2013). In the process, we also hoped to learn a little bit more about what case discussions accomplish in terms of learning.
74
Gill & Ritzhaupt
Case Discussions Until the last two weeks of the semester – which were set aside for project poster presentations – virtually all class time was utilized in discussing a single case study each week. During the first offering of the course, the class met nightly from 6:20 PM to 9:05 PM. The semester timeline is presented in Figure 2.
Figure 2. Activity timeline for information systems capstone course, spring semester 2012.
Protocol We followed a consistent protocol for each class session. On a typical evening, the schedule would be as follows:
6:20-6:45 PM: Pre-case question. A question related to that evening’s case was written on the whiteboard by the instructor. Students had 20-25 minutes to write a response and upload it to Blackboard, the institution’s course management system. Laptops were made available to the 2-3 students who did not have their own.
6:45-7:45 PM: Case discussion. A student would be called upon to open the case with-out prior warning (referred to as a cold call) while the instructor wrote notes on the board. Once the opening was complete, the facilitated discussion began.
7:45 PM to 8:15 PM: Wrap-up. Originally, it was planned that the instructor would pro-vide a short summary and reflections on what was covered in the discussion. In practice, the actual protagonist from the case being discussed sat in on all but one of the discus-
75
Evaluating IS Capstone Course
sions throughout the entire semester. As a consequence, it was normally that individual who led the discussion.
8:15 PM to 8:30 PM: Post-case forms. Students prepared and submitted a case reflection form to Blackboard. This form always consisted of the same two questions: 1) What are the three most important things you learned from the case? and 2) How did the discus-sion of the case change your views? In addition, students had to fill in a brief case study rating form that was administered online.
The remainder of each class period was set aside for questions about specific projects, and stu-dents were free to leave after they had completed their post-case forms. Each week, the instructor evaluated the students’ pre- and post-case submissions on a 3 point scale: W=weak, S=satisfactory, and E=excellent. These completed forms were also sent to the protagonist of each case.
The only major variation from the just-described protocol occurred for two cases where the pro-tagonist was non-local, one located in Boston, Massachusetts, and one located in West Palm Beach, Florida. For these two cases, the entire class was conducted online using Elluminate, which provided a conferenced audio channel and a shared whiteboard. This venue allowed case protagonists to participate in the discussion without travelling and to share their observations with the class. The same schedule for the class period was maintained, however.
To prepare students for the case method pedagogy to be used over the course of the semester, the first case study that was discussed was a case about the design of the course itself. That case, which featured the instructor as the protagonist, presented the students with a series of decisions that included:
• Should the course contain an online component or be entirely face-to-face?
• Should progress deadlines within the class be strictly enforced or flexible?
• Should a detailed grading rubric with specific point values for each activity be established or should a more subjective approach be taken?
At the end of the case discussion – which demonstrated a surprisingly large diversity of opinion – students were given the opportunity to vote anonymously using an online survey and their choices became the new course policy. Their choices were as follows:
60% weight for case discussion participation in final grade (73% percent of the class selected that participation should count for either 60% or 70%; choices went as high as 70% and as low as 30%)
Flexible grading as opposed to firm rubric (70% voted for flexible)
Participation balanced between oral and written forms (57% voted for balance)
Project grades balanced between written report and poster presentation (65%)
Late work accepted but with substantial penalty (59%; 11% voted for not accepting late sub-missions, 30% voted for no penalty on late work)
Classes to be held online whenever doing so made it possible for the case protagonist to at-tend (57%; 27% voted for no online classes and 16% voted that online classes should be al-lowed only if scheduled at the beginning of the semester).
Unfortunately, regardless of whatever virtues case discussions might offer, classroom discussions alone were to help us much in understanding the success of technical component of our under-graduate program – particularly in the form of evidence that could be used for outcomes assess-
76
Gill & Ritzhaupt
ment for the program as a whole. For this reason, we added an individual project component. This was less driven by any literature than by our need for data: by looking at the quality of projects and distribution of project types, we hoped to learn about our effectiveness in preparing students. For this information to be useful, however, we needed to offer students considerable latitude in their choice of projects.
Final Projects The decision was made that each project be an individual, rather than team, effort. There were two compelling reasons for this choice. First, our intention was to use the distribution of projects as an indicator of where our technical focus was strongest and weakest. The second was our in-terest in using the quality of these projects as a basis for evaluating the overall performance of our major for purposes of accreditation and state-mandated programs. These agencies invariably looked for evidence that documented individual work. It was also felt that the program already had so much group work that additional team-related activities in the capstone were not manda-tory. The purpose of the project is to demonstrate the technological and research skill that stu-dents have acquired over the course of the information systems major. The project was intended to involve substantial complexity but students were given substantial freedom in project type. Instructions provided in the course syllabus were as follows:
A programming project: A stand-alone or web-based project that involves substantial coding in a programming language such as C#, VB, or Java. Mobile apps or a web-based project involving PHP or some other environment (ASP, Ruby-on-Rails) were also al-lowed.
A database project: A project built around designing an SQL-based database (as well as related forms, queries, and reports) for a particular business situation. Real-world or test data was used.
An analysis and design project: A project built around designing a system or application. Appropriate diagrams (entity-relationship diagrams, unified modeling language notation) were prepared, along with form layouts, business process diagrams, and project plans.
A real-world web site: For pure web site projects, a real-world client was required. Such a client may have been identified by the student or, from time to time, supplied by the in-structor. A thorough needs analysis and approach to determining the effectiveness of such a site was required for this category of project.
A real-world case study: Students working in business or facing complex career decisions may choose to develop a case study that is intended for use in subsequent offerings of the course. These projects had to be developed in close collaboration with the instructor and necessarily demanded a very high standard of quality.
A research white paper: An in-depth research paper—20 pages in length or more—that explores a particular technology, such as WiMax, or information systems issue, such as outsourcing. Safe Assignment was used to ensure that the work is original. Students should have a substantial number of sources and should cite them.
Throughout the semester, the instructor met with students after class to discuss the progress of their project proposals and their final projects. Early in the semester, students submitted a project proposal. The instructor provided comments on these proposals and approved them when they were in a form that made sense. Students were not allowed to begin their projects until they were approved by the instructor. A month or so before the end of the semester, students were required to submit a draft of their project that included all their work to that point. The instructor graded and commented on the draft. Students were encouraged to incorporate these comments into their final submissions.
77

Evaluating IS Capstone Course
Each student prepared a PowerPoint presentation describing his or her project. The individual slides were posted on a “science fair” style board. For database, programming and other “run-nable” projects, computer versions were generally demonstrated as well. Half the class presented during each poster session, and the other half (and the instructor) acted as “judges” using a rota-tion scheme akin to “speed dating”. Half the students – the ones not presenting – evaluated each student’s poster during the poster session using a formal rubric provided by the instructor. Six to ten of the best poster presentations were selected for presentation at the meeting of the Depart-ment Executive Advisory Board. This board consists of over 20 of the top information technology executives in the region. Projects were graded based upon the difficulty of the project and the quality of its components. Presentation peer evaluations were included in this assessment. Figure 3 illustrates the layout for the poster sessions.
Figure 3. Poster Presentation Classroom Layout.
Students responsible for the top eight posters were invited to the spring 2012 meeting of the de-partment’s Executive Advisory Board (EAB). This board, consisting of roughly 20 of the top IT executives in the university’s service area, then acted as judges during a 1 hour session scheduled during the board meeting. This offered the students considerable visibility while, at the same time, providing the basis for an external evaluation of our program as a whole (or, at least, the top quintile of our program). The three strongest student presentations were then awarded cash prizes.
78
Gill & Ritzhaupt
Method of Evaluation This paper relies on several data sources using a multi-method approach (Bryman, 2006) for the evaluation of this eclectic course. The evaluation system included several data sources to triangu-late findings, indulging faculty mini-case evaluations, the Critical Thinking Assessment Test (CAT), the Student Assessment of Learning Gains (SALG), the Student Assessment of Instruction (SAI), and student and instructor reviews of final projects. This paper evaluates the Spring 2012 offering of the course, which included 42 information systems undergraduate students. Figure 2, presented earlier, presents a timeline of the data collection procedures for this evaluation.
Student Assessment of Instruction We used the final course evaluations completed by students at the end of the semester to evaluate the student perception of the course. Specifically, the instrument is titled the Student Assessment of Instruction (SAI). This instrument is used university-wide for all courses and consists of eight items and a general open-ended item for free-form responses. The instrument has been shown to demonstrate both validity and reliability across disciplines and course levels (e.g., undergraduate versus graduate). These data were analyzed descriptively.
Faculty Mini-Case Evaluations Each student was randomly assigned to analyze one of the two cases on the first day, and the other on the last day. Faculty members in information systems (who were not the instructor) then assessed both responses on a series of dimensions and were required to guess the order in which the student had performed the analyses (first or last). In addition, an external evaluator at a differ-ent university performed the same rating and guessing task on all of the responses, allowing inter-rater reliability to be established. The correlations between the faculty members rating and the external evaluator ratings follow: evaluating information was .23, for creative thinking was .14, for learning and problem-solving was .39, for communication was .06, and overall was .30. We report the faculty member assessments within this manuscript. These data were analyzed both descriptively and inferentially. We included an example mini-case in the Appendix to give the reader an understanding of the tasks involved as well as the structure of the cases in general.
Critical Thinking Assessment Test (CAT) A NSF-funded instrument intended to measure overall changes in critical thinking and its indi-vidual components was used in this evaluation. These four components were 1) Evaluating in-formation, 2) Creative thinking, 3) Learning and problem solving, and 4) Communication (see http://www.tntech.edu/cat/home/). Each student completed the same instrument before and after the course, after which the results were sent to external graders trained by the institution that de-veloped the instrument. The CAT instrument has been shown to demonstrate both validity and reliability under several different conditions (Stein, Haynes, Redding, Ennis, & Cecil, 2007; Stein, Haynes, Redding, Harris, Tylka, & Lisic, 2010). The results are illustrated to gauge student gains in each of the dimensions listed. A random sample of 20 CATs was analyzed for this evaluation program. These data were analyzed descriptively and inferentially.
Student Assessment of Learning Gains With a week left in the semester, students also were asked to fill out an online form modeled after the Student Assessment of Learning Gains (SALG; http://www.salgsite.org/) instrument, which rates elements of a course based upon how helpful to learning they are perceived to be. This in-strument has been used in the information systems context in other studies and has been shown to
79
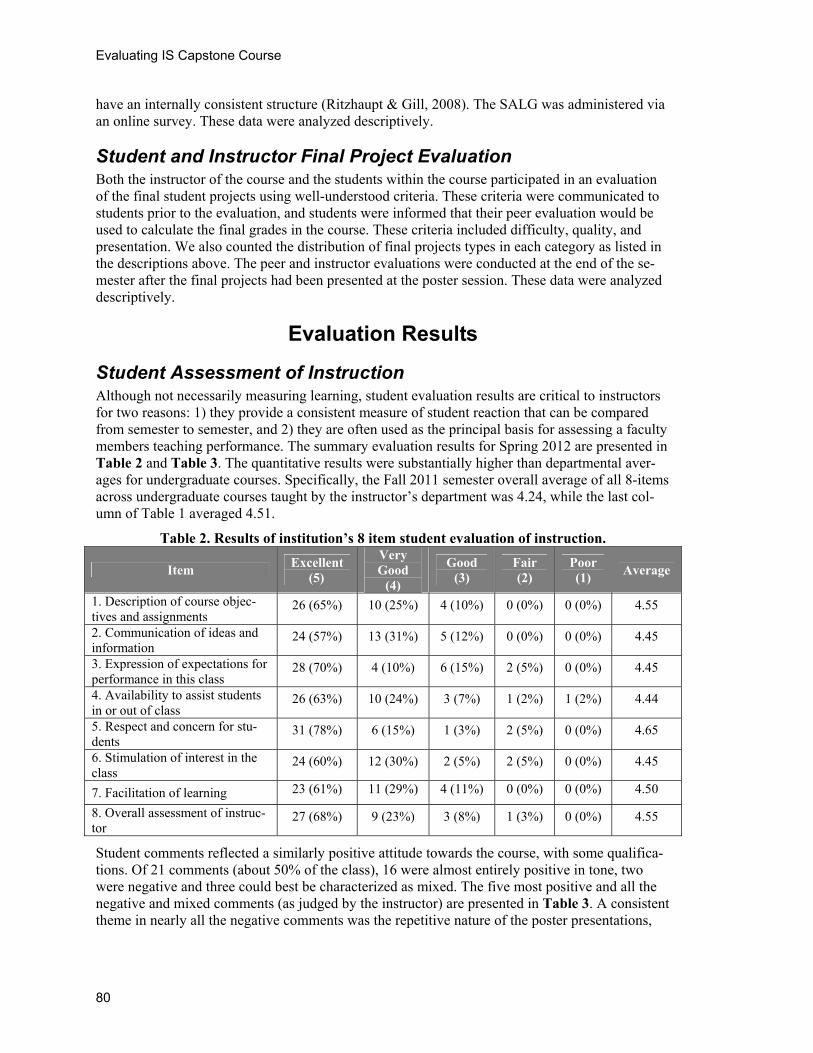
Evaluating IS Capstone Course
have an internally consistent structure (Ritzhaupt & Gill, 2008). The SALG was administered via an online survey. These data were analyzed descriptively.
Student and Instructor Final Project Evaluation Both the instructor of the course and the students within the course participated in an evaluation of the final student projects using well-understood criteria. These criteria were communicated to students prior to the evaluation, and students were informed that their peer evaluation would be used to calculate the final grades in the course. These criteria included difficulty, quality, and presentation. We also counted the distribution of final projects types in each category as listed in the descriptions above. The peer and instructor evaluations were conducted at the end of the se-mester after the final projects had been presented at the poster session. These data were analyzed descriptively.
Evaluation Results
Student Assessment of Instruction Although not necessarily measuring learning, student evaluation results are critical to instructors for two reasons: 1) they provide a consistent measure of student reaction that can be compared from semester to semester, and 2) they are often used as the principal basis for assessing a faculty members teaching performance. The summary evaluation results for Spring 2012 are presented in Table 2 and Table 3. The quantitative results were substantially higher than departmental aver-ages for undergraduate courses. Specifically, the Fall 2011 semester overall average of all 8-items across undergraduate courses taught by the instructor’s department was 4.24, while the last col-umn of Table 1 averaged 4.51.
Table 2. Results of institution’s 8 item student evaluation of instruction.
Item Excellent
(5)
Very Good
(4)
Good (3)
Fair (2)
Poor (1)
Average
1. Description of course objec-tives and assignments
26 (65%) 10 (25%) 4 (10%) 0 (0%) 0 (0%) 4.55
2. Communication of ideas and information
24 (57%) 13 (31%) 5 (12%) 0 (0%) 0 (0%) 4.45
3. Expression of expectations for performance in this class
28 (70%) 4 (10%) 6 (15%) 2 (5%) 0 (0%) 4.45
4. Availability to assist students in or out of class
26 (63%) 10 (24%) 3 (7%) 1 (2%) 1 (2%) 4.44
5. Respect and concern for stu-dents
31 (78%) 6 (15%) 1 (3%) 2 (5%) 0 (0%) 4.65
6. Stimulation of interest in the class
24 (60%) 12 (30%) 2 (5%) 2 (5%) 0 (0%) 4.45
7. Facilitation of learning 23 (61%) 11 (29%) 4 (11%) 0 (0%) 0 (0%) 4.50
8. Overall assessment of instruc-tor
27 (68%) 9 (23%) 3 (8%) 1 (3%) 0 (0%) 4.55
Student comments reflected a similarly positive attitude towards the course, with some qualifica-tions. Of 21 comments (about 50% of the class), 16 were almost entirely positive in tone, two were negative and three could best be characterized as mixed. The five most positive and all the negative and mixed comments (as judged by the instructor) are presented in Table 3. A consistent theme in nearly all the negative comments was the repetitive nature of the poster presentations,
80
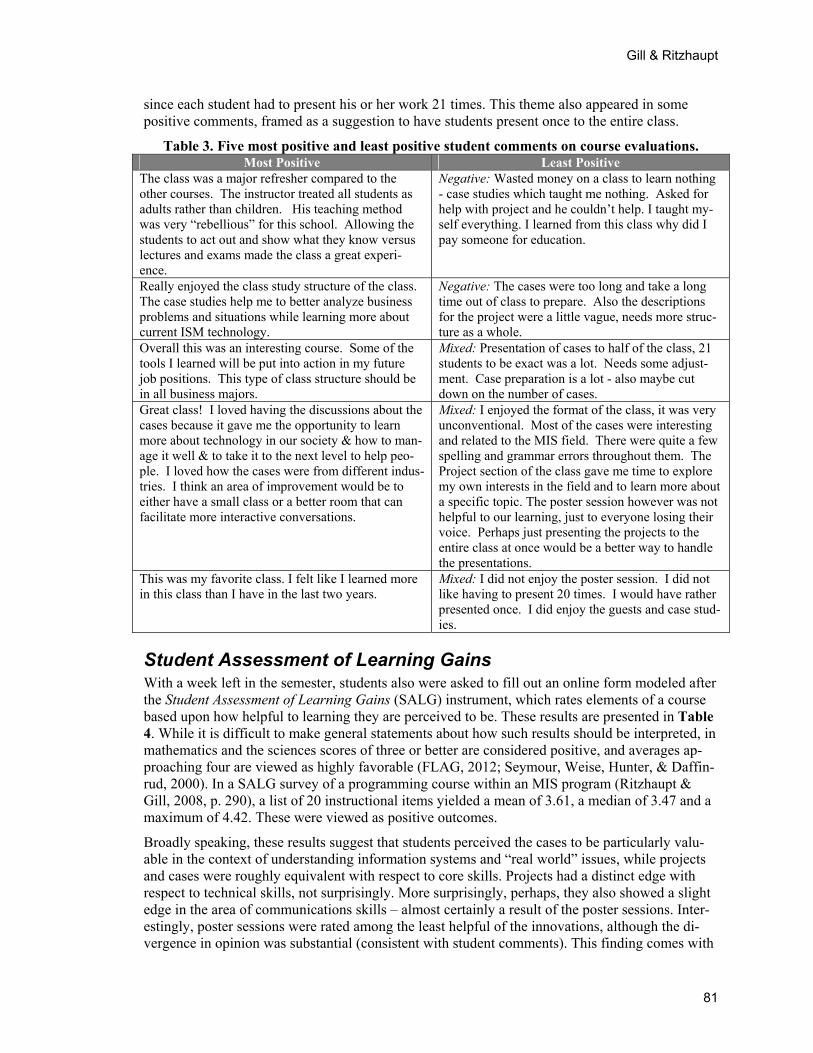
Gill & Ritzhaupt
since each student had to present his or her work 21 times. This theme also appeared in some positive comments, framed as a suggestion to have students present once to the entire class.
Table 3. Five most positive and least positive student comments on course evaluations. Most Positive Least Positive The class was a major refresher compared to the other courses. The instructor treated all students as adults rather than children. His teaching method was very “rebellious” for this school. Allowing the students to act out and show what they know versus lectures and exams made the class a great experi-ence.
Negative: Wasted money on a class to learn nothing - case studies which taught me nothing. Asked for help with project and he couldn’t help. I taught my-self everything. I learned from this class why did I pay someone for education.
Really enjoyed the class study structure of the class. The case studies help me to better analyze business problems and situations while learning more about current ISM technology.
Negative: The cases were too long and take a long time out of class to prepare. Also the descriptions for the project were a little vague, needs more struc-ture as a whole.
Overall this was an interesting course. Some of the tools I learned will be put into action in my future job positions. This type of class structure should be in all business majors.
Mixed: Presentation of cases to half of the class, 21 students to be exact was a lot. Needs some adjust-ment. Case preparation is a lot - also maybe cut down on the number of cases.
Great class! I loved having the discussions about the cases because it gave me the opportunity to learn more about technology in our society & how to man-age it well & to take it to the next level to help peo-ple. I loved how the cases were from different indus-tries. I think an area of improvement would be to either have a small class or a better room that can facilitate more interactive conversations.
Mixed: I enjoyed the format of the class, it was very unconventional. Most of the cases were interesting and related to the MIS field. There were quite a few spelling and grammar errors throughout them. The Project section of the class gave me time to explore my own interests in the field and to learn more about a specific topic. The poster session however was not helpful to our learning, just to everyone losing their voice. Perhaps just presenting the projects to the entire class at once would be a better way to handle the presentations.
This was my favorite class. I felt like I learned more in this class than I have in the last two years.
Mixed: I did not enjoy the poster session. I did not like having to present 20 times. I would have rather presented once. I did enjoy the guests and case stud-ies.
Student Assessment of Learning Gains With a week left in the semester, students also were asked to fill out an online form modeled after the Student Assessment of Learning Gains (SALG) instrument, which rates elements of a course based upon how helpful to learning they are perceived to be. These results are presented in Table 4. While it is difficult to make general statements about how such results should be interpreted, in mathematics and the sciences scores of three or better are considered positive, and averages ap-proaching four are viewed as highly favorable (FLAG, 2012; Seymour, Weise, Hunter, & Daffin-rud, 2000). In a SALG survey of a programming course within an MIS program (Ritzhaupt & Gill, 2008, p. 290), a list of 20 instructional items yielded a mean of 3.61, a median of 3.47 and a maximum of 4.42. These were viewed as positive outcomes.
Broadly speaking, these results suggest that students perceived the cases to be particularly valu-able in the context of understanding information systems and “real world” issues, while projects and cases were roughly equivalent with respect to core skills. Projects had a distinct edge with respect to technical skills, not surprisingly. More surprisingly, perhaps, they also showed a slight edge in the area of communications skills – almost certainly a result of the poster sessions. Inter-estingly, poster sessions were rated among the least helpful of the innovations, although the di-vergence in opinion was substantial (consistent with student comments). This finding comes with
81
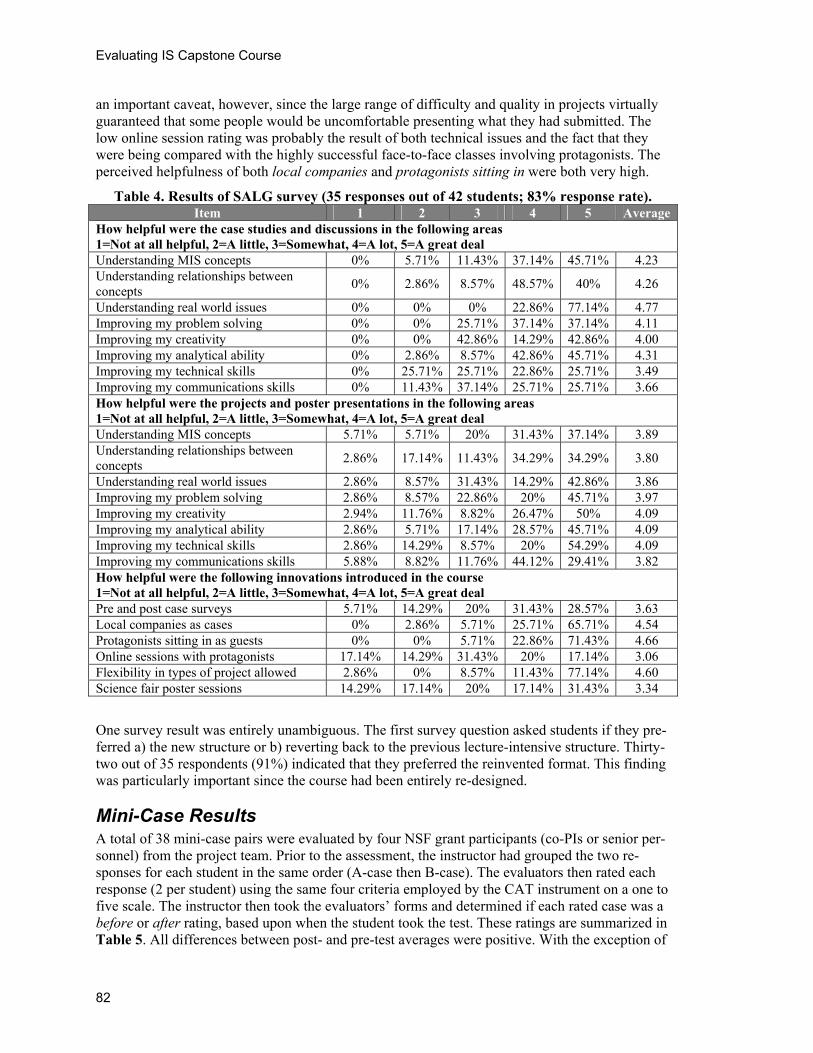
Evaluating IS Capstone Course
an important caveat, however, since the large range of difficulty and quality in projects virtually guaranteed that some people would be uncomfortable presenting what they had submitted. The low online session rating was probably the result of both technical issues and the fact that they were being compared with the highly successful face-to-face classes involving protagonists. The perceived helpfulness of both local companies and protagonists sitting in were both very high.
Table 4. Results of SALG survey (35 responses out of 42 students; 83% response rate). Item 1 2 3 4 5 Average
How helpful were the case studies and discussions in the following areas 1=Not at all helpful, 2=A little, 3=Somewhat, 4=A lot, 5=A great deal Understanding MIS concepts 0% 5.71% 11.43% 37.14% 45.71% 4.23 Understanding relationships between concepts
0% 2.86% 8.57% 48.57% 40% 4.26
Understanding real world issues 0% 0% 0% 22.86% 77.14% 4.77 Improving my problem solving 0% 0% 25.71% 37.14% 37.14% 4.11 Improving my creativity 0% 0% 42.86% 14.29% 42.86% 4.00 Improving my analytical ability 0% 2.86% 8.57% 42.86% 45.71% 4.31 Improving my technical skills 0% 25.71% 25.71% 22.86% 25.71% 3.49 Improving my communications skills 0% 11.43% 37.14% 25.71% 25.71% 3.66 How helpful were the projects and poster presentations in the following areas 1=Not at all helpful, 2=A little, 3=Somewhat, 4=A lot, 5=A great deal Understanding MIS concepts 5.71% 5.71% 20% 31.43% 37.14% 3.89 Understanding relationships between concepts
2.86% 17.14% 11.43% 34.29% 34.29% 3.80
Understanding real world issues 2.86% 8.57% 31.43% 14.29% 42.86% 3.86 Improving my problem solving 2.86% 8.57% 22.86% 20% 45.71% 3.97 Improving my creativity 2.94% 11.76% 8.82% 26.47% 50% 4.09 Improving my analytical ability 2.86% 5.71% 17.14% 28.57% 45.71% 4.09 Improving my technical skills 2.86% 14.29% 8.57% 20% 54.29% 4.09 Improving my communications skills 5.88% 8.82% 11.76% 44.12% 29.41% 3.82 How helpful were the following innovations introduced in the course 1=Not at all helpful, 2=A little, 3=Somewhat, 4=A lot, 5=A great deal Pre and post case surveys 5.71% 14.29% 20% 31.43% 28.57% 3.63 Local companies as cases 0% 2.86% 5.71% 25.71% 65.71% 4.54 Protagonists sitting in as guests 0% 0% 5.71% 22.86% 71.43% 4.66 Online sessions with protagonists 17.14% 14.29% 31.43% 20% 17.14% 3.06 Flexibility in types of project allowed 2.86% 0% 8.57% 11.43% 77.14% 4.60 Science fair poster sessions 14.29% 17.14% 20% 17.14% 31.43% 3.34
One survey result was entirely unambiguous. The first survey question asked students if they pre-ferred a) the new structure or b) reverting back to the previous lecture-intensive structure. Thirty-two out of 35 respondents (91%) indicated that they preferred the reinvented format. This finding was particularly important since the course had been entirely re-designed.
Mini-Case Results A total of 38 mini-case pairs were evaluated by four NSF grant participants (co-PIs or senior per-sonnel) from the project team. Prior to the assessment, the instructor had grouped the two re-sponses for each student in the same order (A-case then B-case). The evaluators then rated each response (2 per student) using the same four criteria employed by the CAT instrument on a one to five scale. The instructor then took the evaluators’ forms and determined if each rated case was a before or after rating, based upon when the student took the test. These ratings are summarized in Table 5. All differences between post- and pre-test averages were positive. With the exception of
82
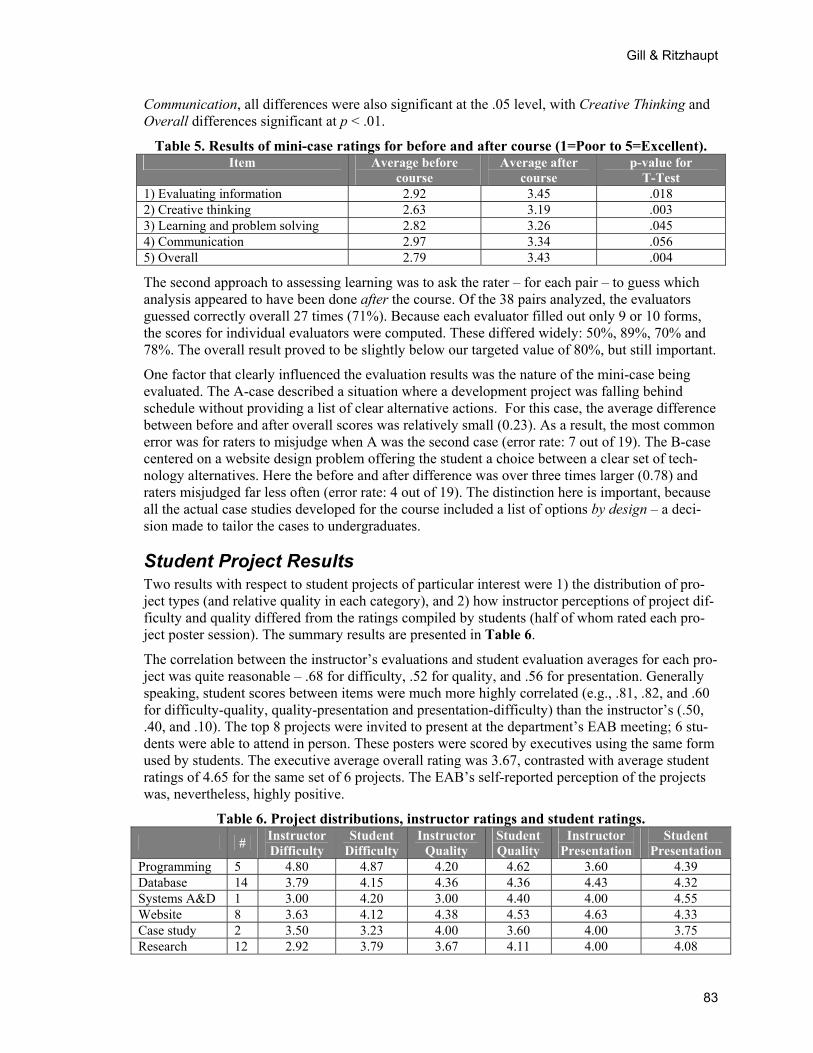
Gill & Ritzhaupt
Communication, all differences were also significant at the .05 level, with Creative Thinking and Overall differences significant at p < .01.
Table 5. Results of mini-case ratings for before and after course (1=Poor to 5=Excellent). Item Average before
course Average after
course p-value for
T-Test 1) Evaluating information 2.92 3.45 .018 2) Creative thinking 2.63 3.19 .003 3) Learning and problem solving 2.82 3.26 .045 4) Communication 2.97 3.34 .056 5) Overall 2.79 3.43 .004
The second approach to assessing learning was to ask the rater – for each pair – to guess which analysis appeared to have been done after the course. Of the 38 pairs analyzed, the evaluators guessed correctly overall 27 times (71%). Because each evaluator filled out only 9 or 10 forms, the scores for individual evaluators were computed. These differed widely: 50%, 89%, 70% and 78%. The overall result proved to be slightly below our targeted value of 80%, but still important.
One factor that clearly influenced the evaluation results was the nature of the mini-case being evaluated. The A-case described a situation where a development project was falling behind schedule without providing a list of clear alternative actions. For this case, the average difference between before and after overall scores was relatively small (0.23). As a result, the most common error was for raters to misjudge when A was the second case (error rate: 7 out of 19). The B-case centered on a website design problem offering the student a choice between a clear set of tech-nology alternatives. Here the before and after difference was over three times larger (0.78) and raters misjudged far less often (error rate: 4 out of 19). The distinction here is important, because all the actual case studies developed for the course included a list of options by design – a deci-sion made to tailor the cases to undergraduates.
Student Project Results Two results with respect to student projects of particular interest were 1) the distribution of pro-ject types (and relative quality in each category), and 2) how instructor perceptions of project dif-ficulty and quality differed from the ratings compiled by students (half of whom rated each pro-ject poster session). The summary results are presented in Table 6.
The correlation between the instructor’s evaluations and student evaluation averages for each pro-ject was quite reasonable – .68 for difficulty, .52 for quality, and .56 for presentation. Generally speaking, student scores between items were much more highly correlated (e.g., .81, .82, and .60 for difficulty-quality, quality-presentation and presentation-difficulty) than the instructor’s (.50, .40, and .10). The top 8 projects were invited to present at the department’s EAB meeting; 6 stu-dents were able to attend in person. These posters were scored by executives using the same form used by students. The executive average overall rating was 3.67, contrasted with average student ratings of 4.65 for the same set of 6 projects. The EAB’s self-reported perception of the projects was, nevertheless, highly positive.
Table 6. Project distributions, instructor ratings and student ratings.
# Instructor Difficulty
Student Difficulty
Instructor Quality
Student Quality
Instructor Presentation
Student Presentation
Programming 5 4.80 4.87 4.20 4.62 3.60 4.39 Database 14 3.79 4.15 4.36 4.36 4.43 4.32 Systems A&D 1 3.00 4.20 3.00 4.40 4.00 4.55 Website 8 3.63 4.12 4.38 4.53 4.63 4.33 Case study 2 3.50 3.23 4.00 3.60 4.00 3.75 Research 12 2.92 3.79 3.67 4.11 4.00 4.08
83
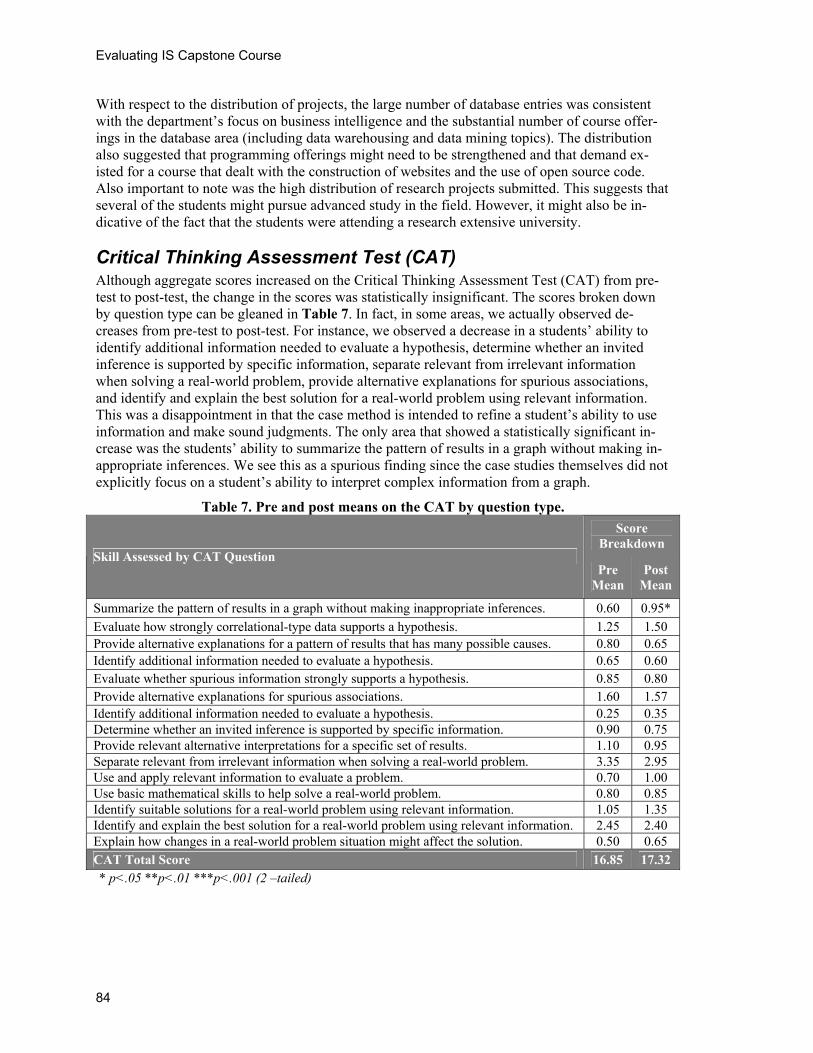
Evaluating IS Capstone Course
With respect to the distribution of projects, the large number of database entries was consistent with the department’s focus on business intelligence and the substantial number of course offer-ings in the database area (including data warehousing and data mining topics). The distribution also suggested that programming offerings might need to be strengthened and that demand ex-isted for a course that dealt with the construction of websites and the use of open source code. Also important to note was the high distribution of research projects submitted. This suggests that several of the students might pursue advanced study in the field. However, it might also be in-dicative of the fact that the students were attending a research extensive university.
Critical Thinking Assessment Test (CAT) Although aggregate scores increased on the Critical Thinking Assessment Test (CAT) from pre-test to post-test, the change in the scores was statistically insignificant. The scores broken down by question type can be gleaned in Table 7. In fact, in some areas, we actually observed de-creases from pre-test to post-test. For instance, we observed a decrease in a students’ ability to identify additional information needed to evaluate a hypothesis, determine whether an invited inference is supported by specific information, separate relevant from irrelevant information when solving a real-world problem, provide alternative explanations for spurious associations, and identify and explain the best solution for a real-world problem using relevant information. This was a disappointment in that the case method is intended to refine a student’s ability to use information and make sound judgments. The only area that showed a statistically significant in-crease was the students’ ability to summarize the pattern of results in a graph without making in-appropriate inferences. We see this as a spurious finding since the case studies themselves did not explicitly focus on a student’s ability to interpret complex information from a graph.
Table 7. Pre and post means on the CAT by question type.
Score Breakdown
Skill Assessed by CAT Question Pre
Mean Post
Mean
Summarize the pattern of results in a graph without making inappropriate inferences. 0.60 0.95*
Evaluate how strongly correlational-type data supports a hypothesis. 1.25 1.50 Provide alternative explanations for a pattern of results that has many possible causes. 0.80 0.65 Identify additional information needed to evaluate a hypothesis. 0.65 0.60 Evaluate whether spurious information strongly supports a hypothesis. 0.85 0.80 Provide alternative explanations for spurious associations. 1.60 1.57 Identify additional information needed to evaluate a hypothesis. 0.25 0.35 Determine whether an invited inference is supported by specific information. 0.90 0.75 Provide relevant alternative interpretations for a specific set of results. 1.10 0.95 Separate relevant from irrelevant information when solving a real-world problem. 3.35 2.95 Use and apply relevant information to evaluate a problem. 0.70 1.00 Use basic mathematical skills to help solve a real-world problem. 0.80 0.85 Identify suitable solutions for a real-world problem using relevant information. 1.05 1.35 Identify and explain the best solution for a real-world problem using relevant information. 2.45 2.40 Explain how changes in a real-world problem situation might affect the solution. 0.50 0.65 CAT Total Score 16.85 17.32 * p<.05 **p<.01 ***p<.001 (2 –tailed)
84
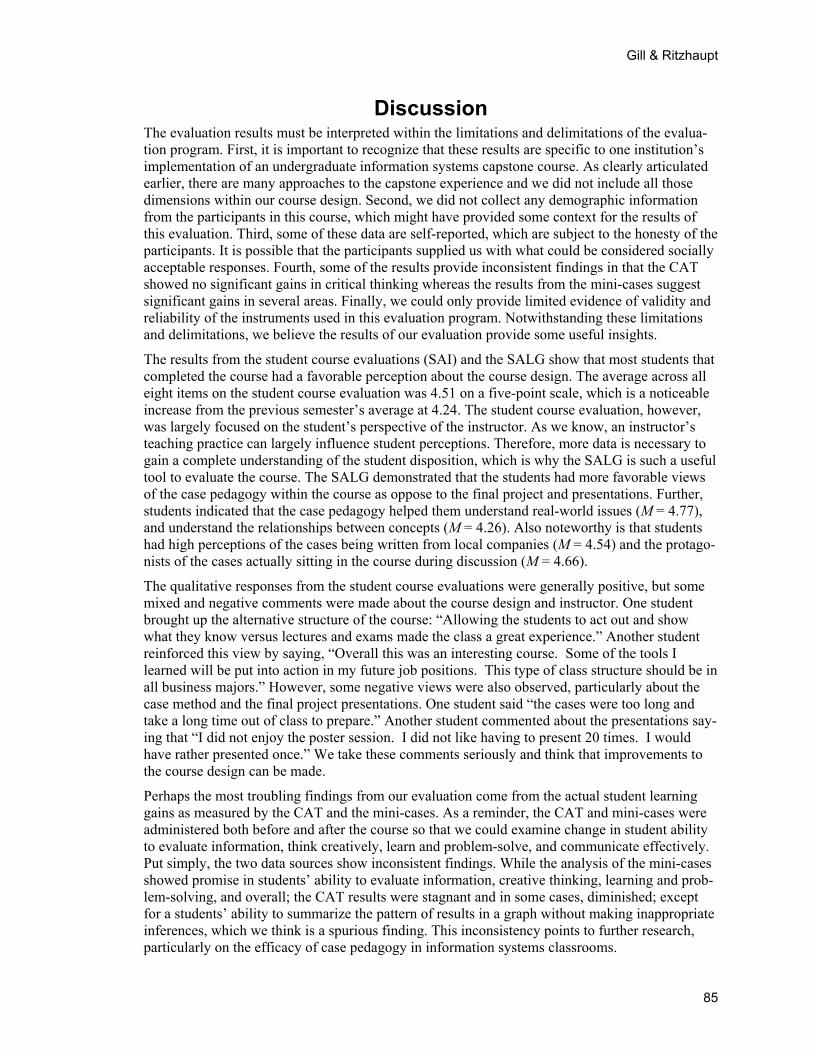
Gill & Ritzhaupt
Discussion The evaluation results must be interpreted within the limitations and delimitations of the evalua-tion program. First, it is important to recognize that these results are specific to one institution’s implementation of an undergraduate information systems capstone course. As clearly articulated earlier, there are many approaches to the capstone experience and we did not include all those dimensions within our course design. Second, we did not collect any demographic information from the participants in this course, which might have provided some context for the results of this evaluation. Third, some of these data are self-reported, which are subject to the honesty of the participants. It is possible that the participants supplied us with what could be considered socially acceptable responses. Fourth, some of the results provide inconsistent findings in that the CAT showed no significant gains in critical thinking whereas the results from the mini-cases suggest significant gains in several areas. Finally, we could only provide limited evidence of validity and reliability of the instruments used in this evaluation program. Notwithstanding these limitations and delimitations, we believe the results of our evaluation provide some useful insights.
The results from the student course evaluations (SAI) and the SALG show that most students that completed the course had a favorable perception about the course design. The average across all eight items on the student course evaluation was 4.51 on a five-point scale, which is a noticeable increase from the previous semester’s average at 4.24. The student course evaluation, however, was largely focused on the student’s perspective of the instructor. As we know, an instructor’s teaching practice can largely influence student perceptions. Therefore, more data is necessary to gain a complete understanding of the student disposition, which is why the SALG is such a useful tool to evaluate the course. The SALG demonstrated that the students had more favorable views of the case pedagogy within the course as oppose to the final project and presentations. Further, students indicated that the case pedagogy helped them understand real-world issues (M = 4.77), and understand the relationships between concepts (M = 4.26). Also noteworthy is that students had high perceptions of the cases being written from local companies (M = 4.54) and the protago-nists of the cases actually sitting in the course during discussion (M = 4.66).
The qualitative responses from the student course evaluations were generally positive, but some mixed and negative comments were made about the course design and instructor. One student brought up the alternative structure of the course: “Allowing the students to act out and show what they know versus lectures and exams made the class a great experience.” Another student reinforced this view by saying, “Overall this was an interesting course. Some of the tools I learned will be put into action in my future job positions. This type of class structure should be in all business majors.” However, some negative views were also observed, particularly about the case method and the final project presentations. One student said “the cases were too long and take a long time out of class to prepare.” Another student commented about the presentations say-ing that “I did not enjoy the poster session. I did not like having to present 20 times. I would have rather presented once.” We take these comments seriously and think that improvements to the course design can be made.
Perhaps the most troubling findings from our evaluation come from the actual student learning gains as measured by the CAT and the mini-cases. As a reminder, the CAT and mini-cases were administered both before and after the course so that we could examine change in student ability to evaluate information, think creatively, learn and problem-solve, and communicate effectively. Put simply, the two data sources show inconsistent findings. While the analysis of the mini-cases showed promise in students’ ability to evaluate information, creative thinking, learning and prob-lem-solving, and overall; the CAT results were stagnant and in some cases, diminished; except for a students’ ability to summarize the pattern of results in a graph without making inappropriate inferences, which we think is a spurious finding. This inconsistency points to further research, particularly on the efficacy of case pedagogy in information systems classrooms.
85
Evaluating IS Capstone Course
We think the final project distributions are indicative of the faculty in which the program resides. Some of our faculty members specialize in areas related to database design, data warehousing, and data mining. Most students pursued database projects and followed second by research pro-jects. However, some decided to conduct comprehensive programming projects or website im-plementations, which involved real-world clients. What’s more important about this particular facet of the evaluation is that both the students within the course and the instructor influenced the final grade on the project. Essentially, we were able to create a more authentic form of assessment based on peer-evaluation. Indeed, meta-analytic studies have verified the use of peer-evaluation closely resembles teacher assessment when judgments are made on well-understood criteria (Fal-chikov & Goldfinch, 2000). We think that the use of peer-evaluation in information systems courses is a salient design feature that can be replicated across our programs and courses.
In summary, we believe we have provided a rich description of a novel information systems cap-stone course for undergraduate majors. We have reviewed several implementations of capstone courses offered at other intuitions of higher education and have identified common themes in these courses. Further, we have provided evidence of student learning gains and perceptions within this course based on a multi-method approach to evaluation. We believe this paper con-tributes to the body of knowledge in information systems education by providing several impor-tant considerations for information systems faculty members. In light of this objective, we pro-vide some implications for practice in the subsequent section.
Implications for Practice Though our implementation of the information systems capstone experience did not include all those possible dimensions (e.g., comprehensive team-based project), we do feel that we were suc-cessful in providing students an integrated and comprehensive experience. Information systems instructors must consider several important features of their capstone experience in light of how other courses are taught within the program. We were able to create a course design that empha-sized the creation of a complex project, interaction with professionals in the field, and the effec-tive integration of case pedagogy. Based on our experiences, we make the following recommen-dations to other faculty members in the field:
We are advocates of the case method to stimulate fruitful dialog among students, encour-age in-depth analysis and synthesis, and to build more integrated learning experiences for information systems students. Thus, we recommend that faculty adopt the case method in their instruction. This form of pedagogy requires a shift in perspective of faculty mem-bers from the sage-on-stage perpetuating traditional methods like lecture to more of a guide-on-the-side embracing interactive pedagogies (King, 1993). Opportunities are available to learn more about the case method (e.g., conferences) and to identify quality cases that can be used in the classroom.
Using the case method in information systems curriculum requires quality cases be writ-ten on a variety of technical and managerial topics. Further, since technology changes so quickly, keeping these cases up-to-date is problematic. Therefore, we recommend that faculty share their teaching cases in a repository like the one supported by the Informing Science Institute. This practice not only provides a publication venue for faculty scholar-ship, but it also provides venue to gather quality instructional materials (cases) that can be seamlessly integrated into information systems courses.
Providing flexibility in learning is an infrequently used design feature, but offers a lot of promise in that it gains buy-in from your learners. In this course, we essentially enabled the students to make the choices about the course policies via consensus through an online survey. Students made choices about the grading policy, the structure of the as-
86
Gill & Ritzhaupt
signments, the late work policy, and whether classes would be offered via online using a virtual classroom (we use Elluminate Live). We believe that giving students the choice to determine their own destiny gains buy-in and holds the students accountable to those policies later in the course. While this is one extreme, instructors might use some combi-nation of this design strategy to meet the diverse need of their learners.
The necessity for quality assessment in information systems is of paramount concern. In particular, there has been a call in our field for more alternative (a.k.a. authentic) methods of assessment as oppose to traditional methods (e.g., exams) which have been rightfully criticized for a lack of validity in measuring students' ability to apply knowledge to real-world situations (Wellington, Thomas, Powell, & Clarke, 2002). Alternative methods of assessment attempt to overcome the limitation by developing authentic contexts in which students can demonstrate their mastery. A method often overlooked in the context of in-formation systems includes the use of peer-evaluation as a mechanism to provide forma-tive assessment to improve the quality of their peers’ work, and provide a summative as-sessment of the work according to guidelines which meet course objectives. We encour-age faculty to establish well-understood criteria to enable peer-evaluation within their courses.
Speaking of alternative assessments, the use of ePortfolios is another option that offers several advantages over traditional methods. Though the use of ePortfolios was not em-phasized in our course design, we believe the final projects reached the goal of represen-tation, reflection, and revision – the essence of an ePortfolio initiative. Further, the final project was intended to be easily added to a student’s ePortfolio. As we are still strug-gling with how to effectively evaluate our courses and programs, especially for accredita-tion purposes, we need to think about alternative forms of assessment that are authentic and strong indicators of quality. We believe that ePortfolios are a powerful way for fac-ulty in information systems to accomplish these simultaneous goals. Our future course design will likely include an ePortfolio component.
Information systems faculty should employ several methods to measure the outcomes of their courses, especially a capstone experience designed to be a culminating experience. Not only is this an expectation of accrediting agencies (e.g., ABET or AACSB), this is also an opportunity to help others in the field and conduct the scholarship of teaching and learning within our courses. The course design presented in this paper used a multi-method approach to document both student perceptions and student learning gains using both valid and reliable instruments. Similar approaches can be integrated into other courses seamlessly. Further, by doing so, faculty members can share their course design and evaluations in venues like the Journal of Information Technology in Education or the Journal of Information Systems Education.
Information systems faculty should encourage intentional interactions between students and professionals in the field. In this course design, we invited the protagonists in the cases to class in which the students discussed the case studies in their presence. The pro-tagonists were encouraged to engage in the conversation to make the experience more au-thentic for the students. Further, those students that achieved the highest scores on the fi-nal project had the opportunity to share their work with members of the advisory board for the department, a group of professionals throughout the region that the university serves. However, there are other ways to accomplish this goal. For instance, faculty members might invite recent graduates that are working in the field as guest speakers.
Technology is not just a function of business today. We have widely adopted several emerging technologies in higher education to facilitate both face-to-face and online
87
Evaluating IS Capstone Course
courses. One new strand that has emerged in recent years is the effectiveness of blended learning environments that fuse together both face-to-face and online components. We now have strong evidence that blended learning is perhaps the most effective model we have in higher education as evidenced by a Department of Education commissioned meta-analysis (Means, Toyama, Murphy, Bakia, & Jones, 2010). Thus, we encourage faculty to thoughtfully integrate technology into the teaching and learning process (Learning Management Systems, Virtual Classrooms, etc.). As innovators and early adopters of technology (Rogers, 2003), we believe this integration process is feasible for our colleagues in a technology-centric field.
Conclusions What can be concluded from this systematic evaluation of an information systems capstone ex-perience for undergraduates? We believe our results suggest that the use of authentic case studies in information systems capstone courses for undergraduate students is an effective approach. We base this conclusion on the fact that the students had an overall high favorable perception the course design features and that the mini-cases demonstrated growth in critical areas. Though the use of the CAT did not demonstrate significant gains, we believe that one possible explanation for this is that the students were not graded on this activity and therefore perceived the activity to be a low-stakes assessment as oppose to a high-stakes assessment. We also believe that our paper presents the use of peer-evaluation as a viable alternative to traditional methods. We provided students the opportunity to evaluate their peers’ work via well-established criteria. This approach can be easily and seamlessly integrated in other courses and programs.
This paper adds to a limited knowledge base about the efficacy of the case method in information systems education. Though the case method has existed for several decades, there is limited re-search on the effectiveness of this instructional method, particularly in information system educa-tion. We believe that the capstone course for the undergraduate information systems major is an appropriate venue for the case method. Further, we feel that this paper should serve as a catalyst for other information systems educators and researchers to innovatively study the case method within their own instructional practices.
Acknowledgement This material is based in part upon work supported by the National Science Foundation under NSF Award 1043919. Any opinions, findings, and conclusions or recommendations expressed in this material are those of the authors and do not necessarily reflect the views of the National Sci-ence Foundation.
References Astani, M. (2006). The MIS capstone course: An active learning approach. Issues in Information Systems,
7(1), 119-123.
Brandon, D., Pruett, J., & Wade, J. (2002). Experiences in developing and implementing a capstone course in information technology management. Journal of Information Technology Education, 1(2), 91-102. Retrieved from http://www.jite.org/documents/Vol1/v1n2p091-102.pdf
Brumm, T. J., Ellertson, A., & Mickelson, S. K. (2003). Using ePortfolios to develop and assess ABET-aligned competencies. In Proceedings of the Annual Meeting of the American Society for Engineering Education, American Society for Engineering Education, Nashville, Tennessee (pp. 22-26).
Bryman, A. (2006). Integrating quantitative and qualitative research: How is it done? Qualitative Research, 6(1), 97-113.
88
Gill & Ritzhaupt
Denton, J. W., & Spangler, W. E. (2001). Effectiveness of an integrated pre-capstone project in learning information systems concepts. Journal of Information Systems Education, 12(3), 149-156.
Falchikov, N., & Goldfinch, J. (2000).Student peer-evaluation in higher education: A meta-analysis com-paring peer and teacher marks. Review of Educational Research, 70(3), 287-322.
FLAG. (2012). Field-Tested Learning Assessment Guide - Classroom Assessment Techniques: Student Assessment of Learning Gains (SALG). Retrieved from http://www.flaguide.org/cat/salg/salg1.php
Gill, T. G. (2010). Informing business: Research and education on a rugged landscape. Santa Rosa, CA: Informing Science Press.
Gill, T. G., & Bhattacherjee, A. (2009). Whom are we informing? Issues and recommendations for MIS research from an informing sciences perspective. MIS Quarterly, 33(2), 217-235.
Gorgone, J. T., Davis, G. B., Valacich, J. S., Topi, H., Feinstein, D. L., & Longenecker, H. E., Jr. (2003). IS 2002: Model curriculum and guidelines for undergraduate degree programs in information systems. Communications of the Association for Information Systems, 11(1), 1-63. Reprinted in Data Base, 34(1), iv-52.
Gupta, J. N. D., & Wachter, R. M. (1998). A capstone course in information systems curriculum. Interna-tional Journal of Information Management, 18(6), 427-441.
Harper, J. S., Lamb, S. W., & Buffington, J. R. (2008). Effective use of case studies in the MIS capstone course through semi-formal collaborative teaching. Journal of Information Systems Education, 19(4), 411-418.
Hashemi, S., & Kellersberger, G. (2009). The pedagogy of utilizing lengthy and multifaceted projects in capstone experiences. Information Systems Education Journal, 7(17), Available at: http://isedj.org/7/17/
HBS. (2013). Harvard Business School Case Method. Retrieved from http://www.hbs.edu/mba/academic-experience/Pages/the-hbs-case-method.aspx
Janicki, T. N., Fischetti, D., & Burns, A. (2006). Incorporating real world projects and emerging technolo-gies into one MIS capstone course. Information Systems Education Journal, 5(24). Available at: http://isedj.org/5/24/
King, A. (1993). From the sage on the stage to the guide on the side. College Teaching, 41, 30-35.
Kumar, A. (2006). Strategies to enhance student learning in a capstone MIS course. Issues in Informing Science and Information Technology, 3, 327-332.
McGann, S., & Cahill, M. (2005). Pulling it all TOGETHER: An IS capstone course for the 21st Century emphasizing experiential and conceptual aspects, soft skills and career readings. Issues in Information Systems, 6(1), 1-7.
Means, B., Toyama, Y., Murphy, R., Bakia, M., & Jones, K. (2010). Evaluation of evidence-based prac-tices in online learning: A meta-analysis and review of online learning studies. United States Depart-ment of Education.
Morgan, R. E., & Aitken, R. (2006). The business of information technology: An integrated, multi-disciplinary approach to a capstone experience for management information sciences students. Infor-mation Systems Education Journal, 8(29). Available at: http://www.isedj.org/4/67/
Ritzhaupt, A. D., & Gill, T. G. (2008). A hybrid and novel approach to teaching computer programming in MIS curriculum. In S. Negash, M. E. Whitman, A. B. Woszczynski, K. Hoganson, & H. Mattord (Eds.), Handbook of distance learning for real-time and asynchronous information technology educa-tion (pp. 259-281). IGI Global.
Ritzhaupt, A. D., Singh, O., Seyferth, T., & Dedrick, R. F. (2008). Development of the electronic portfolio student perspective instrument: An ePortfolio integration initiative. Journal of Computing in Higher Education, 19(2), 47-71.
89
Evaluating IS Capstone Course
Rogers, E. M. (2003). Diffusion of innovations. Social Science.
Seymour, E., Weise, D. J., Hunter, A. B., & Daffinrud, S. (2000). Using real-world questions to promote active learning. National Meeting of the American Chemical Society, San Francisco.
Schwieger, D., & Surendran, K. (2010). Enhancing the value of the capstone experience course. Informa-tion Systems Education Journal, 8(29). Available at: http://isedj.org/8/29/
Shih, L. F., LeClair, J. A., & Varden, S. A. (2010). The integrated technology assessment: A portfolio-based capstone experience. Information Systems Education Journal, 8(63). Available at: http://isedj.org/8/63/
Stein, B., Haynes, A., Redding, M., Ennis, T., & Cecil, M. (2007). Assessing critical thinking in STEM and beyond. In M. Iskander, Innovations in e-learning, instruction technology, assessment, and engineer-ing education (pp. 79-82). Springer Publishing.
Stein, B., Haynes, A., Redding, M., Harris, K., Tylka, M., & Lisic, E. (2010). Faculty driven assessment of critical thinking: National dissemination of the CAT instrument. In K. Elleithy, T. Sobh, M. Iskander, V. Kapila, M. A. Karim, & A. Mahmood, Technological Developments in Networking, Education and Automation (pp. 55-58). Springer Publishing.
Surendran, K., & Schwieger, D. (2011). Incorporating capstone courses in programs based upon IS2010 Model Curriculum. Information Systems Education Journal, 9. Available at: http://isedj.org/2011-9/N2/ISEDJv9n2p65.html
Tuttle, S. M. (2000). A capstone course for a computer information systems major. ACM SIGCSE Bulletin, 32(1), 265-269.
Tuttle, S. M. (2001). A capstone course for a computer information systems major. Journal of Computing Sciences in Colleges, 16(2), 41-48.
Wellington, P., Thomas, I., Powell, I. & Clarke, B. (2002).Authentic assessment applied to engineering and business undergraduate consulting teams. International Journal of Engineering Education, 18(2), 168-179.
90
Gill & Ritzhaupt
Appendix: Mini-Case Example
Turnaround LLC Janet Washington was frustrated. In her role of CIO of Turnaround LLC, a medium-sized real estate company that specialized in turning around foreclosed properties, she had promised her boss Ellen—the company’s CEO—that she would have a new application to manage the rapidly growing business in place by April. It was now June and, according to the project’s lead devel-oper, Fred, completion was still two weeks away. The problem was this: completion had been “two weeks” away for the last three months! What was she going to do?
The Company
Turnaround was a participant in the residential real estate industry. Its original principals were three real estate agents whose brokerage firms had gone out of business during the collapse in real estate that occurred within Florida starting in 2008. Rather than leave the business entirely, as many of the unemployed agents within the state had done, the trio had decided to get into the business of taking properties under the imminent threat of foreclosure and packaging them for rapid sales. Their business model was to work collaboratively with both owners and lenders to achieve a compromise that was beneficial to both and then to aggressively market the properties to buyers. The major source of the company’s buyers was international investors and individuals seeking vacation properties. Boosted by a combination of rapidly dropping property values, low interest rates and a declining U.S. dollar, it was often possible for these customers to acquire properties at a 60% discount from what they would have paid in 2007, at the peak of the Florida real estate bubble.
In the two years since the company’s inception, it had grown from the three founders to over 100 employees. The key to success in the foreclosure industry was information. To put together a deal, Turnaround needed to be first to identify attractive properties that were likely to enter fore-closure. It then needed to contact the owners of the property to determine if they were amenable to working with Turnaround and also contact the lenders to determine if they would consider a short sale (i.e., a sale where the price paid for the property was less than the amount owed on the mortgage, meaning that the bank would need to write down its loan). Finally, the company had to determine whether or not the property was a match for any of the potential clients who had signed up for the service. When all three conditions were right, a deal could be structured. Typically, Turnaround received a 6% commission on any deal that closed, 2% paid by the seller, 2% by the purchaser and 2% by the lender. Such a commission structure was unusual in the industry—where the seller was usually responsible for the entire commission—but it was attractive for all three parties in the event of the challenging type of sale that Turnaround usually put together.
By early 2011, the time of the case, Turnaround was brokering roughly 1400 properties a year, averaging $8000 in commission from each transaction. The company had worked successfully with 11 different lenders and in six different Florida counties—a significant factor since rules for closing properties and responsibility for closing fees varied by county. To assist in the transaction volume, the company had acquired a title company in 2009 to help perform the closings. Gener-ally speaking, Florida law, however, mandated that the purchaser have the right to choose its own title company to close a purchase sale. About 90% of purchasers chose to use the Turnaround af-filiate title company. Those who chose to pick their own closing agent were required to pay a $500 consulting fee to Turnaround. The purpose of this fee was to verify the quality of the closing documents, since errors in a near-foreclosure situation could be very costly.
91
Evaluating IS Capstone Course
The MIS Department
Within a year of Turnaround’s founding, the company was swamped in paperwork. Since none of its founders had an MIS background, all their processes had been manual. They did use the com-puter—e.g., to do their bookkeeping, to search county records for liens on properties (often a pre-cursor to foreclosures), to perform credit checks on both buyers and sellers, and to perform online appraisals—but their use was task-driven, with no integrated workflow. In late 2008, the com-pany hired Janet Washington, the MIS supervisor for a local mortgage broker that was cutting staff. She developed a series of spreadsheets to help keep track of business flows, set up a wire-less network to handle the multiple workstations that were being added, installed a fax server and developed the company’s web site. As the company grew, however, she found that she was spending nearly all her time training new hires on how to operate the various pieces of software used by the company and on keeping the system up and running.
By mid-2010, the company decided it needed a professional developer. Fred Eccles, a recent graduate of a local MS-MIS program, had applied for the job and everyone had been impressed by his “can do” attitude and his easygoing personality. His first month on the job, he successfully installed a Microsoft SharePoint server that was then used as a portal for document tracking and business process management. The installation was major success, allowing individual agents to identify and qualify potential buyers/sellers/properties 27% faster. Average turnaround time on each deal also declined from 11 weeks to 9 weeks. By December 2010, the installation was com-pleted. By that time, Janet had another project in mind for him.
The “Turnaround Central” Project
The “Turnaround Central” project was originally based on something that Fred had read about on the Google site1. In November 2011, the company had introduced a product referred to as “Google Bust” that could be used to identify properties likely to enter foreclosure across the country. The product, currently in beta release (as was typical for Google), accessed county online records covering about 94% of the U.S. population (99% of Florida) and used a proprietary algorithm to assess the likelihood that they would enter foreclosure. More importantly, Google provided a free application program interface (API) that developers could embed into their code, making it possible to bring the data into the application, analyze it, then display it on a map (using another Google API for mapping). What Janet immediately perceived when Fred brought the API to her attention was that it could be the core of a new application that could be used to match cli-ent requests to suitable properties in real time. Fred further suggested that, using another API from Skype and an open source text-to-voice product, the product could be made to automatically call out to clients when a match appeared likely to determine if they were interested. In addition, he proposed that the system could be used to create and populate with data (e.g., property loca-tion, owner information, lender and mortgage facts) all the documents needed to initiate a work-flow using SharePoint. This last activity alone, Janet estimated, could save the company up to 4 hours per property.
Fred, who had taken two programming courses as part of his undergraduate degree in MIS had suggested the program be developed using agile methods. Specifically, he planned to create a se-ries of prototype applications with successively increasing functionality until a useful tool had been reached. From that point on, he planned to add features as needed. He was really excited about building the system and worked 12+ hours per day over the holiday period to develop the first prototype, intended to demonstrate the interface. Janet and her boss, Ellen Sanchez, had been
1 Note: The “Google Bust” product described is fictional and is introduced solely for the purposes of the ex-ample case.
92
Gill & Ritzhaupt
so impressed that the two decided to hire another MIS employee so that Fred could complete the development as fast as possible.
In February 2011, Fred had demonstrated the system using test data—a little ahead of the infor-mal schedule. At that time, Ellen had expressed her pleasure with how things were going. She had also suggested a few more features, ones that would be easy to implement (in Fred’s opinion). Since bringing in real data seemed to be a largely mechanical activity—Fred had extensive data-base experience from three classes in his Master’s program—he had estimated two weeks to completion. Since that time, however, the project had seemed to advance in fits and spurts. Cer-tain features, such as the generation and loading of documents to SharePoint had been imple-mented rapidly. Other functionality, such as acquiring data from the Google API had caused problems from the very start—the amount of data was huge and the format in which it arrived seemed to vary from county to county. The potential customer database had been successfully imported from the spreadsheet where it was stored, but it was not clear how the system would be kept up-to-date.
The Current Situation
After hearing Fred’s most recent two week estimate, Janet was very concerned. In anticipation of the productivity increases expected from the system, Turnaround had been very conservative in its hiring. As a result of the delays, however, average turnaround on a property had crept up to 12 weeks. This was serious, since part of the incentive for banks to work with Turnaround was to get delinquent properties off their books quickly. Moreover, the bad real estate market was not going to last forever. If they missed opportunities now, they might be gone forever.
Meanwhile, she could see that Fred realized the issue and was working like mad to try to get the project completed. And, to be sure, he was making progress. But was two weeks more work be-lievable? Unfortunately, there was no documentation on the system—Fred ensured her the tools he was using were self-documenting—so she was having a very hard time getting a handle on what remained to be done.
Questions
Answer the two questions. Both explanations should refer to the facts as stated in the case.
1. What is your assessment of the “Turnaround Central” project and where it now stands? 2. If you were Janet Washington, what actions would you consider taking at this point and
what do you think would be your best choice?
93

Evaluating IS Capstone Course
94
Biographies T. Grandon Gill is a Professor in the Information Systems and Deci-sion Sciences department at the University of South Florida. He holds a doctorate in Management Information Systems from Harvard Busi-ness School, where he also received his M.B.A. His principal research areas are the impacts of complexity on decision-making and IS education, and he has published many articles describing how technologiesand innovative pedagogies can be combined to increase the effective-ness of teaching across a broad range of IS topics. Currently, he is Edtor-in-Chief of Informing Science: The International Journal of an Emerging Transdiscipline and an Editor of the Journal of Information Technology
-
i-
Education.
y
th-s
vior.
Albert D. Ritzhaupt is an assistant professor of educational technol-ogy in the School of Teaching and Learning at the University of Flor-ida. His primary research areas focus on the design and development of technology-enhanced learning environments, computer and informa-tion systems education, and technology integration in education. His publications have appeared in multiple venues, including the Journal of Information Systems Education, Journal of Research on Technologin Education, Computers in the Schools, Journal of Computing in Higher Education, Computers & Education, Behavior Research Meods, Journal of Interactive Learning Research, Journal of Computerin Mathematics and Science Teaching, Journal of Educational Com-puting Research, and Computers in Human Beha
Journal of Information Technology Education: Research Volume 12, 2013
A Tale of Two Cultures: Cross Cultural Comparison in Learning the Prezi Presentation Software Tool in the US and Norway
Sabra Brock Touro College,
New York, NY, USA
Cornelia Brodahl University of Agder,
Kristiansand, Norway
Executive Summary Presentation software is an important tool for both student and professorial communicators. PowerPoint has been the standard since it was introduced in 1990. However, new “improved” software platforms are emerging. Prezi is one of these, claiming to remedy the linear thinking that underlies PowerPoint by creating one canvas and permitting the presenter to zoom in and out as each element is introduced. Users can move back and forth to display the separate elements and reflect how they fit into a larger context.
As these new tools are introduced, there may be different responses to them depending on the cultural background of the user. In order to understand one such interplay, Prezi was introduced to students in a class in Norway and in the same way to a class in the U.S. The mixed method study compared the introduction of this new software tool to two undergraduate classes in Spring 2012. The two professors used the same introduction to the tool. The output was the final project presentation for the class done using the Prezi tool. Students evaluated each other’s presentations on 10 attributes and answered two open-ended questions about the presentations. They also com-pleted an 8-question self-evaluation of their or their team’s presentation. The instruc-tor/researchers also used the same questions to evaluate her class. An additional 13 questions were added to the instructor instrument. Each instructor/researcher also viewed videos of the presentations from the other class and evaluated these presentations using the same set of ques-tions.
Results showed that both sets of students used the new tool well despite minimal direct instruc-tion. Most made their presentations less linear than they would have been in PowerPoint. They generally used the Prezi technique of grouping elements and constructing a pathway between groups. Most inserted multimedia such as photos, videos, and links. Some especially appreciated the Prezi feature of more than one user being able to work on a presentation at the same time.
Peers liked each other’s presentations and found them engaging. However, open-ended comments were more di-rected to actual content than use of Prezi. In student feedback the answer to the first attribute, being engaging, ap-peared to create a halo for most of the other attributes.
In evaluating their peers’ presentations, the U.S. students were significantly
Material published as part of this publication, either on-line or in print, is copyrighted by the Informing Science Institute. Permission to make digital or paper copy of part or all of these works for personal or classroom use is granted without fee provided that the copies are not made or distributed for profit or commercial advantage AND that copies 1) bear this notice in full and 2) give the full citation on the first page. It is per-missible to abstract these works so long as credit is given. To copy in all other cases or to republish or to post on a server or to redistribute to lists requires specific permission and payment of a fee. Contact [email protected] to request redistribution permission.
Editor: Anthony Scime
A Tale of Two Cultures
more positive than the Norwegian ones, reinforcing the belief that the American culture is well above the global norm in optimism. Norwegians were lengthier in their open-ended feedback to their peers and focused more on content and style than the Americans. In self-evaluations, Ameri-cans had more to say than Norwegians. They stressed the creative aspect of Prezi whereas Nor-wegians highlighted presentations being tidy and calm.
Males were higher raters on average than females. The researchers were less positive than the students, reflecting stricter standards than students.
Researcher recommendations for teaching Prezi are included.
Keywords: Prezi, PowerPoint, teaching concept, higher education, presentation skills, multime-dia presentations.
Introduction Along with student presentations and peer critiques (Hadjerrouit, 2005; Koohang, Riley, & Smith, 2009; Zhang & Olfman, 2010), problem-based projects are encouraged activities in constructiv-ist-based teaching and learning strategies. Consequently, effective presentation skills turn out to be critically important for students’ path to academic success and career growth (Alshare & Hindi, 2004; Derrick, 2006). Presentation software has been an important component of postsec-ondary education for the last decade, not just in support of professorial lectures, but also for stu-dent projects (Huxham, 2010).
Presentation software is used to create and display information, normally in the form of a series of slides. It mostly includes three major functions: a text-editor, a method for embedding multi-media content, and a slide show generator. Each single slide may combine text, images, video clips, charts, tables, movies, and music files. All slides belonging to a presentation will be proc-essed and stored together in one file.
Zooming presentation, a user interface based on scalable technology wherein the areas to be dis-played can be zoomed in on demand, is an alternative to slides-based presentation techniques. The user prepares the content and creates a path to and the appropriate zoom level for each sec-tion at a time to be shown. Following this path during presentation, only a part of the entire con-tent is being revealed and zoomed into at each step. Navigating further, the user is led to the next stopping point and zoom level by flowing animation.
One example of this technology is Prezi, a free online visual presentation tool launched in 2009 that allows the audience to interact with the content by moving around and zooming in and out on a large canvas that can be filled with images, video, and text (Fransson & Holmberg, 2012). Users can pan and zoom, import media, collaborate from remote sites, and make the presentation avail-able online and offline. (See Figure 1 for screenshot.)
On a conceptual level, Prezi is a Web 2.0 tool, in terms of three key aspects of second generation software and its “Architecture of Participation”: creation of content, communication, and collabo-ration (Barnatt, 2008; O’Reilly, 2005). Prezi offers online service delivery in which software and associated data are centrally hosted (Software as a service, SaaS), free from locally installed software. Prezi allows users to read, write, and save online, offers interpersonal content sharing, and more than one editor for simultaneous editing.
96
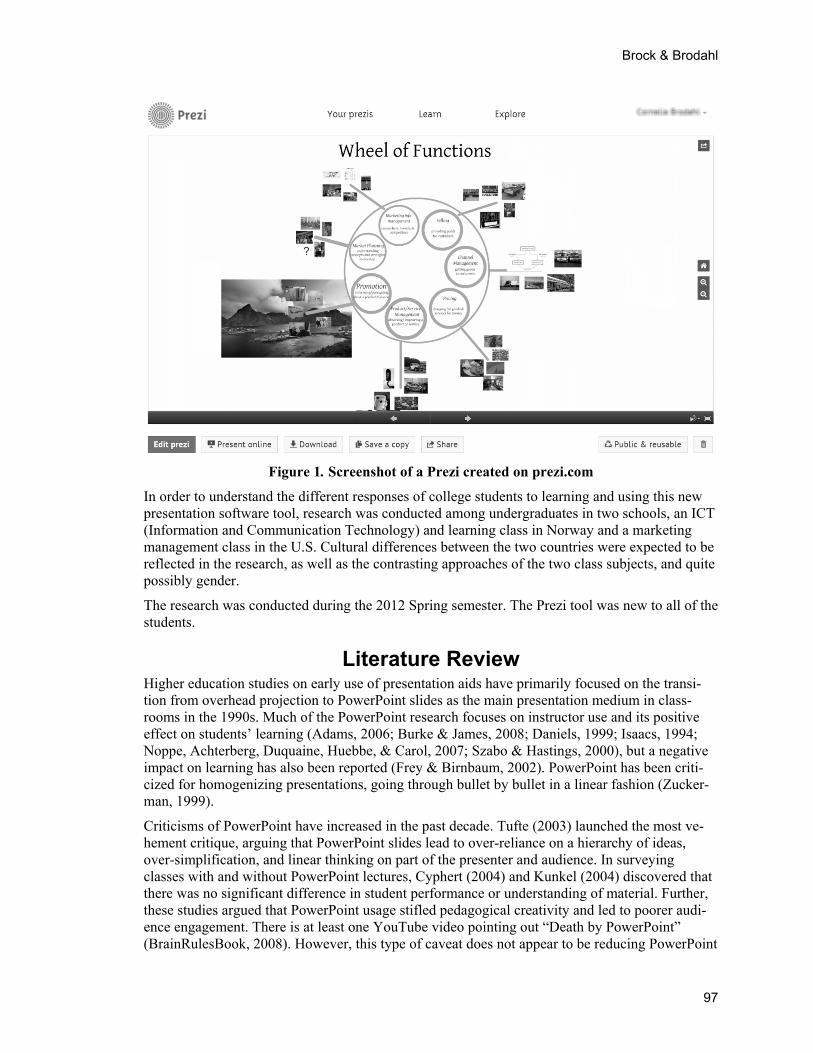
Brock & Brodahl
Figure 1. Screenshot of a Prezi created on prezi.com
In order to understand the different responses of college students to learning and using this new presentation software tool, research was conducted among undergraduates in two schools, an ICT (Information and Communication Technology) and learning class in Norway and a marketing management class in the U.S. Cultural differences between the two countries were expected to be reflected in the research, as well as the contrasting approaches of the two class subjects, and quite possibly gender.
The research was conducted during the 2012 Spring semester. The Prezi tool was new to all of the students.
Literature Review Higher education studies on early use of presentation aids have primarily focused on the transi-tion from overhead projection to PowerPoint slides as the main presentation medium in class-rooms in the 1990s. Much of the PowerPoint research focuses on instructor use and its positive effect on students’ learning (Adams, 2006; Burke & James, 2008; Daniels, 1999; Isaacs, 1994; Noppe, Achterberg, Duquaine, Huebbe, & Carol, 2007; Szabo & Hastings, 2000), but a negative impact on learning has also been reported (Frey & Birnbaum, 2002). PowerPoint has been criti-cized for homogenizing presentations, going through bullet by bullet in a linear fashion (Zucker-man, 1999).
Criticisms of PowerPoint have increased in the past decade. Tufte (2003) launched the most ve-hement critique, arguing that PowerPoint slides lead to over-reliance on a hierarchy of ideas, over-simplification, and linear thinking on part of the presenter and audience. In surveying classes with and without PowerPoint lectures, Cyphert (2004) and Kunkel (2004) discovered that there was no significant difference in student performance or understanding of material. Further, these studies argued that PowerPoint usage stifled pedagogical creativity and led to poorer audi-ence engagement. There is at least one YouTube video pointing out “Death by PowerPoint” (BrainRulesBook, 2008). However, this type of caveat does not appear to be reducing PowerPoint
97
A Tale of Two Cultures
usage in business or even the military (Klein, 2009). Neal (1998) argues that technology use in the classroom can actually have a negative impact on teaching and learning by creating imperson-ality and a shift of focus from a “learning experience” to the “delivery of instruction.” Several researchers have focused on discovering ways to use the existing format of PowerPoint more ef-fectively, but Brock and Joglekar (2012) conclude that the non-linear structure of Prezi may be the wave of the future.
Studies of the usefulness of Prezi are more limited, but Conboy, Fletcher, Russell, and Wilson (2012) report this may be influenced by instructor style. They also mention the phenomenon of Prezi dizziness caused by excessive zooming. Virtanen, Myllärniemi, and Wallander (2012) note the need for a teacher skilled in the software and adequate preparation in the classroom for suc-cessful use of Prezi. Bender and Bull (2012) report a learning curve for professors and other us-ers. The newer technologies reflected in Web 2.0 have been studied with recommendations that these technologies should be easy to use and take little time to learn, but a short introduction might be needed to motivate the necessary learning (Brodahl, Hansen, & Hadjerrouit, 2011; Zhang & Olfman, 2010).
Comparison of the use of rating scales across country cultures has been examined extensively. Heine, Lehman, Peng, and Greenholtz (2002) found that some researchers have cautioned that differences are exaggerated because the use of instruments varies among cultures and respondents use their own context (Berry, 2011; Gudykunst, Matsumoto, Ting-Toomey, Nishida, Kim, & Heyman, 1996). Americans were found to indicate extreme values on Likert scales compared to Canadian and Asian samples (Chen, Lee, & Stevenson, 1995), more optimism than Chinese (Lee & Seligman, 1997) and more openness than Hong Kong undergraduates (McCrae, Yik, Trapnell, Bond, & Paulhus, 1998).
In a study comparing U.S. and Norwegian subjects, Sørnes, Stephens, Sætre, and Browning (2003) showed that “ICTs [Information and Communication Technologies] have a homogenizing effect on cultural differences—but also a reinforcing effect on existing similarities.” Olaussen & Bråten (1999) also found that Norwegian students adapted to reflect similar strategies to U.S. ones. However, Elkjær (2009) reported differences between the two country cultures: on the one hand, there is an emphasis in the US on action, results, and individual competitive achievements, while, on the other hand, the Norwegian orientation is to team competitive cooperative achieve-ments and to value the equality of people and give them freedom to achieve.
Undergraduate college students have been found to demonstrate gender differences in learning styles with women more likely to display listening behaviors and value peers as collaborators, while men show an active approach to learning and to use peers for testing achievement, but these differences may diminish with maturity (Baxter Magolda, 1992). Women in mid-career have shown more receptivity to learning elements such as talk and reflection (Carter, 2002) and fe-males, in general, may benefit from more social support than males (Taylor, Klein, Lewis, Gruenewald, Gurung, & Updegraff, 2000). Undergraduate female students have also indicated less receptivity to learning through competitive activities (Gneezy, Niederle, & Rustichini, 2003), making competition a negative factor insofar as workplace promotion is based on competition (Schrage, 2008), and women tend to benefit from a more cooperative atmosphere (Mason, 2009).
Research Questions The following research questions were used to guide the study and analysis:
1. How well is the tool, Prezi, used by students? In addition to overall quality, did presenters make use of its advanced features?
98
Brock & Brodahl
2. How does use of Prezi differ from the commonly used PowerPoint presentation tool? Did presenters move away from the linear structure characteristic of PowerPoint and its com-monly used formats such as bullet points?
3. What differences are observed in use of the tool between the two classes? In rating their peers, did Norwegian students differ from American ones in how they used predefined attrib-utes and the overall ratings they gave on each attribute?
4. How do instructor ratings compare to those of students rating their peers? Using the prede-fined attributes, how were instructor ratings different from the ratings students gave their peers?
Method Students were recruited from undergraduate programs at two different institutions. They were given an introduction to Prezi of approximately one hour early in the course. They also received one page of written highlights about Prezi (Diamond, 2010a).
The presentation was the culminating assignment of the classes. It was assigned through oral de-scription and in the course outline. Students were informed that their peers and the instructor would rate their presentations on a questionnaire they had seen.
All students in both classes were a part of the research. A total of 14 marketing students partici-pated in the U.S. sample and the same number in Norway. In the U.S. there were three group presentations with 12 of the 14 students presenting. The topic was marketing recommendations for the college’s graduate school of business. All 14 rated the presentations of peer teams. In Norway the presentations were individual except for one pair who presented together. The sub-jects in Norway addressed emerging technologies and practices in education. Each student picked a software program such as Dropbox, FaceBook, Glogster, Google Earth, Mindmaster, Quizlet, Slideshare, Storybird, Wallwisher, and Youtube, to examine the tool’s possible value as vehicle of learning. Every student rated the other presenters in this sample. Each student (except for three Norwegians) also rated their (or their team’s) presentation.
The U.S. presentations were in English and the Norwegian ones in Norwegian. The question-naires were in the respective native languages.
The instructors in each of the classes also rated videos made of the presentations from both classes on the same criteria students used plus 13 additional questions. No names were used and students were assigned code numbers (though of course they could be identified from the videos). No names or images were used in compiling the data.
The Norwegian sample was largely female (9 of the 14) and the U.S. sample largely male (9 of the 14). The average age of the Norwegian subjects was 35, of the American subjects 25. The percentage working more than part-time was 50% and 40%, respectively.
Ingoing assumptions included that (1) Web 2.0 technologies should be easy to use and take little time to learn, (2) a short introduction of tools might be needed, but with emphasis on good use and motivation, not details, and (3) the assignment had to focus on the academic/subject content, not on technical skills and instructions on the Prezi tool. Thus the instruction on Prezi was short and incidental to the main learning objectives of both classes. However, although the assignment to use Prezi was over and above subject content, the intention was to provide opportunities for students to acquire and practice ICT skills and technologies, in particular the Prezi application, as well as to experience its implications for presentation strategies.
Chi Square analysis in IBM SPSS Statistics software package (version 19) was used for quantita-tive data. NVivo software (version 9) was used to manage the qualitative data. NVivo is a qualita-
99
A Tale of Two Cultures
tive data management tool that enabled the researchers to input students’ and researchers’ open-ended and scaled data, links to students’ presentations (videos), and then to code their data. Cod-ing was mainly guided by the research questions themselves, as well as details of the questions from peer and observer evaluation forms and self-evaluations. Through reading and rereading, researchers identified themes, which they labeled with codes. NVivo was then used to group all chunks of data associated with each code or combination of codes. These data chunks under each code or combination of codes were viewed together and exported to Excel for further formatting, reading, and analysis.
Word count comparisons were also used in qualitative analysis after studying a series of data chunks and observing the difference of shorter and fuller answers along with students’ attention to details. Although length in answers for each question by no means indicates quality and may play no role as a criterion of quality, a fuller answer will give more information (relate to more of the details students gave when asked “Consider content, form and delivery – one or all”), given the constraints that the student’s answer was clearly expressed, and directly relevant to answering the question and without repetitions.
The appendixes show the specific questions. Analysis for Research Question 1 was drawn from answers from the peer survey shown in Appendix A, Questions 1, 11, and 12; for Research Ques-tion 2, answers from the self-evaluation survey shown in Appendix C. Research Question 3 analysis was based on answers to questions on the peer review form in Appendix A and the self-evaluation form shown in Appendix C. The analysis for Research Question 4 was taken from an-swers to the questions shown in Appendix A, and those for Questions 1-12 on the observer evaluation form in Appendix B.
Institutional Review Board approval had been obtained by both researchers for the study.
Results This section is arranged by the four a priori research questions.
Research Question 1. How well is the tool, Prezi, used by students? In addition to overall quality, did presenters make use of its advanced features? Students generally rated their peers’ presentations as positive, 2.0 on a Likert scale ranging from 1 “Loved it” to 5 “Really didn’t like it” for being engaging and for having effective visuals. See Appendix A, Questions 1and 10, for the exact wording.
The open-ended responses to what they liked considered content, form, and delivery, as well as the performance and professionalism of the presentation. In qualitative feedback when students were asked what they would improve in their peers’ presentations, most said nothing or left the answer blank. Specific improvements suggested were larger visuals, less information and writing on the slides, more pictures, and less moving from picture to picture and zooming. Of the 88 sug-gestions made, only 19 were related to the use of Prezi. See Appendix A, Questions 11 and 12, for the exact wording.
Only the instructors rated the effectiveness of the overall use of Prezi, and that was a positive 2.4 (“somewhat effective”).
Observers thought that the student presentations were mostly “very” or “somewhat organized,” either “very” or “somewhat easy to follow,” “somewhat attractive,” and “somewhat compelling.” See Appendix B, Questions 13 through 20, for exact wording.
100
Brock & Brodahl
Research Question 2. How does use of Prezi differ from the commonly used PowerPoint presentation tool? Did presenters move away from the linear structure characteristic of PowerPoint and its commonly used formats such as bullet points? The presentations did include multimedia such as photos, videos, and links and, according to feedback, blended them with their work in a “very” or “somewhat interesting way.” Students self-evaluated their presentations as being either “very” or “somewhat different from a PowerPoint presentation.” Most (15 of the 25) said that their presentation broke with the bullet-point ap-proach. They reported using the pre-defined path feature of Prezi. But in the end most (14 of the 25) of the presenters said that the structure of their presentation was not different from a Power-Point one.
In qualitative feedback when asked what they liked about their peers’ presentations, the students were positive about the use of Prezi. Specific comments included, “well made with many nice illustrations,” “good to alternate between showing content on the website and the presentation about content,” and “depth of slides on Prezi.”
Students liked many aspects of the Prezi format, saying it was more alive, fresh, and exciting compared to the more limited and serious PowerPoint approach. One said, “To me Prezi is a fresh breeze in a world of boring PowerPoint use… I like the function that the video plays automati-cally.” A similar comment was, “If we had done a PowerPoint presentation it would have been plain and boring with just facts and reading, but because Prezi allowed for the zooming-in-and-out effects and the space on the ‘canvas’ was pretty much infinite, it made the presentation much more interactive and fun.”
Another said, “The best part is its ability for multiple-person viewing and editing at the same time.” Another point of view was, “When using Prezi you are no longer giving an informative presentation as much as a show.” In that respect, Prezi was felt to have potential as a sales and marketing tool. There was however, a learning curve, and possibly as one student said, “You need to be more creative in order to make a nice Prezi with flow.” Or another remarked, “Prezi clearly has somewhat of a start and finish line and forces you to put things in order properly.”
See Appendix C for question wording.
In looking at the specific Prezi features, the instructors noted that most of the presentations broke from the bullet list approach. Only four of the presentations used more than three “slides” with bullets. Most of the presentations did use the Prezi characteristic of grouping elements. All but one included an easily followed path. On the other hand, there was little organized use of the big canvas, but one presentation did take advantage of this feature. See Appendix B, Q14 for exact question wording.
Research Question 3. What differences are observed in use of the tool between the two classes? In rating their peers, did Norwegian students differ from American ones in how they used predefined attributes and the overall ratings they gave on each attribute? The peer ratings of the Prezi presentations were substantially different between the two samples. Of the 10 closed-end rating questions, all but two showed statistically significant differences. In
101
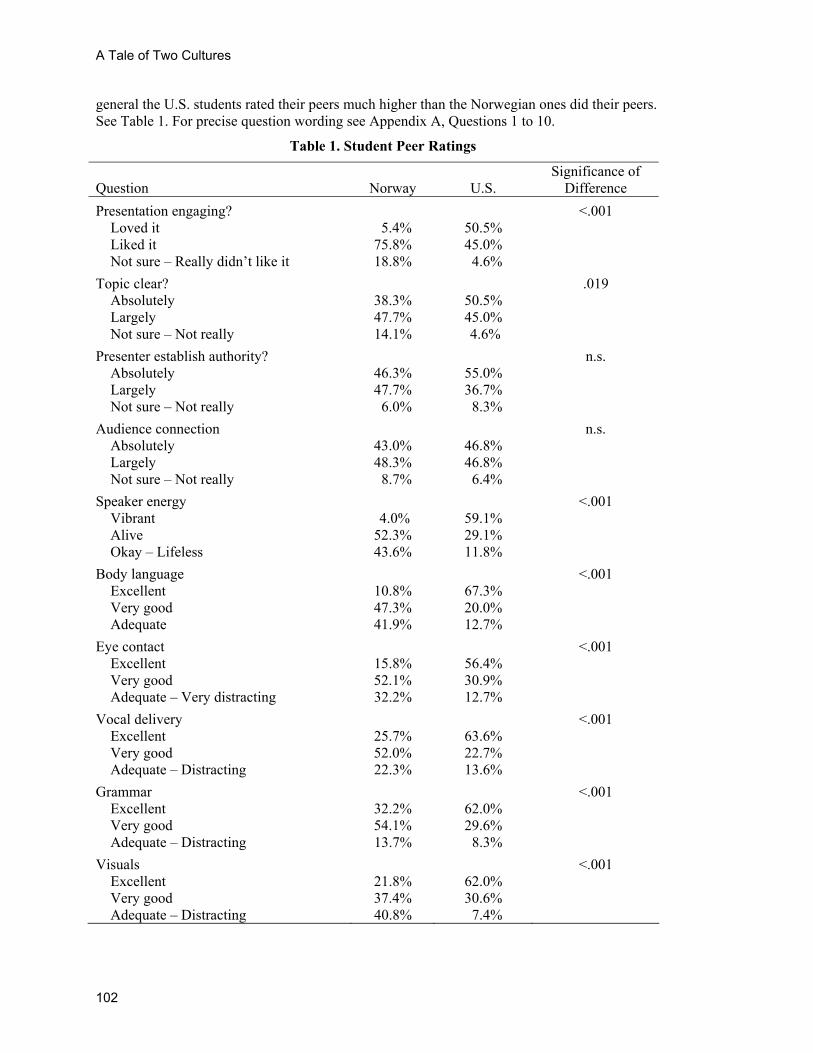
A Tale of Two Cultures
general the U.S. students rated their peers much higher than the Norwegian ones did their peers. See Table 1. For precise question wording see Appendix A, Questions 1 to 10.
Table 1. Student Peer Ratings
Question
Norway
U.S.
Significance of Difference
Presentation engaging? <.001 Loved it 5.4% 50.5% Liked it 75.8% 45.0% Not sure – Really didn’t like it 18.8% 4.6%
Topic clear? .019 Absolutely 38.3% 50.5% Largely 47.7% 45.0% Not sure – Not really 14.1% 4.6%
Presenter establish authority? n.s. Absolutely 46.3% 55.0% Largely 47.7% 36.7% Not sure – Not really 6.0% 8.3%
Audience connection n.s. Absolutely 43.0% 46.8% Largely 48.3% 46.8% Not sure – Not really 8.7% 6.4%
Speaker energy <.001 Vibrant 4.0% 59.1% Alive 52.3% 29.1% Okay – Lifeless 43.6% 11.8%
Body language <.001 Excellent 10.8% 67.3% Very good 47.3% 20.0% Adequate 41.9% 12.7%
Eye contact <.001 Excellent 15.8% 56.4% Very good 52.1% 30.9% Adequate – Very distracting 32.2% 12.7%
Vocal delivery <.001 Excellent 25.7% 63.6% Very good 52.0% 22.7% Adequate – Distracting 22.3% 13.6%
Grammar <.001 Excellent 32.2% 62.0% Very good 54.1% 29.6% Adequate – Distracting 13.7% 8.3%
Visuals <.001 Excellent 21.8% 62.0% Very good 37.4% 30.6% Adequate – Distracting 40.8% 7.4%
102
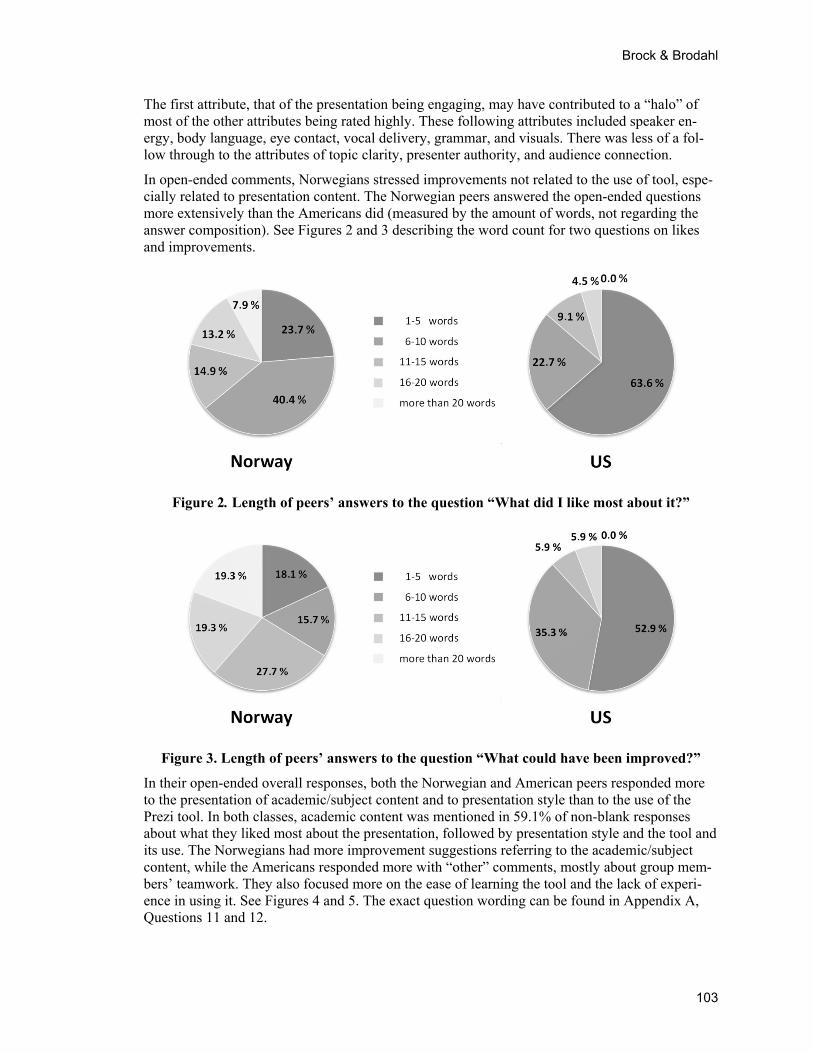
Brock & Brodahl
The first attribute, that of the presentation being engaging, may have contributed to a “halo” of most of the other attributes being rated highly. These following attributes included speaker en-ergy, body language, eye contact, vocal delivery, grammar, and visuals. There was less of a fol-low through to the attributes of topic clarity, presenter authority, and audience connection.
In open-ended comments, Norwegians stressed improvements not related to the use of tool, espe-cially related to presentation content. The Norwegian peers answered the open-ended questions more extensively than the Americans did (measured by the amount of words, not regarding the answer composition). See Figures 2 and 3 describing the word count for two questions on likes and improvements.
Figure 2. Length of peers’ answers to the question “What did I like most about it?”
Figure 3. Length of peers’ answers to the question “What could have been improved?”
In their open-ended overall responses, both the Norwegian and American peers responded more to the presentation of academic/subject content and to presentation style than to the use of the Prezi tool. In both classes, academic content was mentioned in 59.1% of non-blank responses about what they liked most about the presentation, followed by presentation style and the tool and its use. The Norwegians had more improvement suggestions referring to the academic/subject content, while the Americans responded more with “other” comments, mostly about group mem-bers’ teamwork. They also focused more on the ease of learning the tool and the lack of experi-ence in using it. See Figures 4 and 5. The exact question wording can be found in Appendix A, Questions 11 and 12.
103
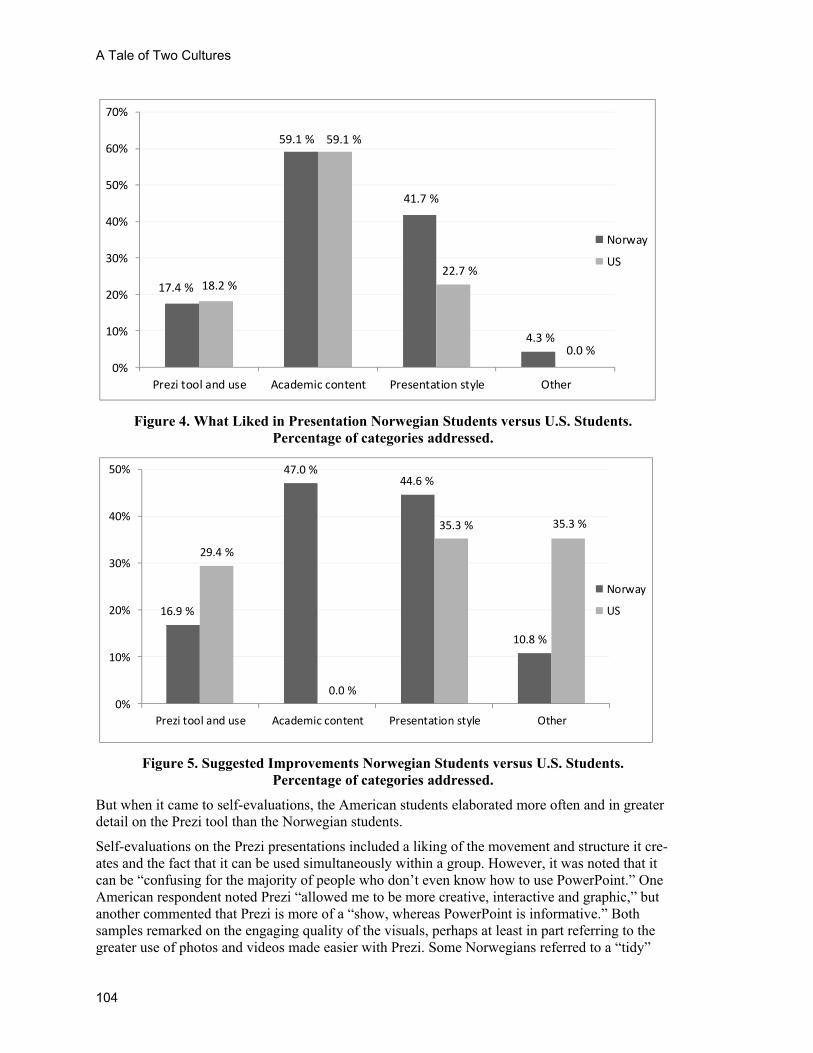
A Tale of Two Cultures
17.4 %
59.1 %
41.7 %
4.3 %
18.2 %
59.1 %
22.7 %
0.0 %
0%
10%
20%
30%
40%
50%
60%
70%
Prezi tool and use Academic content Presentation style Other
Norway
US
Figure 4. What Liked in Presentation Norwegian Students versus U.S. Students. Percentage of categories addressed.
16.9 %
47.0 %44.6 %
10.8 %
29.4 %
0.0 %
35.3 % 35.3 %
0%
10%
20%
30%
40%
50%
Prezi tool and use Academic content Presentation style Other
Norway
US
Figure 5. Suggested Improvements Norwegian Students versus U.S. Students. Percentage of categories addressed.
But when it came to self-evaluations, the American students elaborated more often and in greater detail on the Prezi tool than the Norwegian students.
Self-evaluations on the Prezi presentations included a liking of the movement and structure it cre-ates and the fact that it can be used simultaneously within a group. However, it was noted that it can be “confusing for the majority of people who don’t even know how to use PowerPoint.” One American respondent noted Prezi “allowed me to be more creative, interactive and graphic,” but another commented that Prezi is more of a “show, whereas PowerPoint is informative.” Both samples remarked on the engaging quality of the visuals, perhaps at least in part referring to the greater use of photos and videos made easier with Prezi. Some Norwegians referred to a “tidy”
104
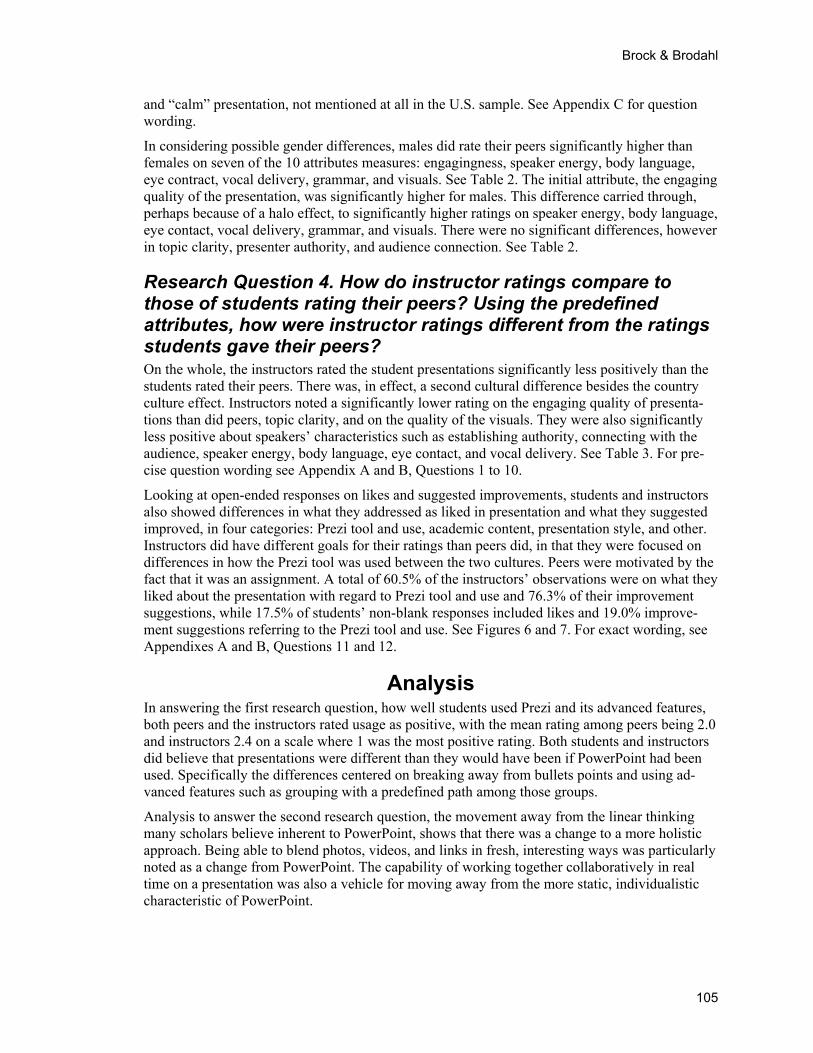
Brock & Brodahl
and “calm” presentation, not mentioned at all in the U.S. sample. See Appendix C for question wording.
In considering possible gender differences, males did rate their peers significantly higher than females on seven of the 10 attributes measures: engagingness, speaker energy, body language, eye contract, vocal delivery, grammar, and visuals. See Table 2. The initial attribute, the engaging quality of the presentation, was significantly higher for males. This difference carried through, perhaps because of a halo effect, to significantly higher ratings on speaker energy, body language, eye contact, vocal delivery, grammar, and visuals. There were no significant differences, however in topic clarity, presenter authority, and audience connection. See Table 2.
Research Question 4. How do instructor ratings compare to those of students rating their peers? Using the predefined attributes, how were instructor ratings different from the ratings students gave their peers? On the whole, the instructors rated the student presentations significantly less positively than the students rated their peers. There was, in effect, a second cultural difference besides the country culture effect. Instructors noted a significantly lower rating on the engaging quality of presenta-tions than did peers, topic clarity, and on the quality of the visuals. They were also significantly less positive about speakers’ characteristics such as establishing authority, connecting with the audience, speaker energy, body language, eye contact, and vocal delivery. See Table 3. For pre-cise question wording see Appendix A and B, Questions 1 to 10.
Looking at open-ended responses on likes and suggested improvements, students and instructors also showed differences in what they addressed as liked in presentation and what they suggested improved, in four categories: Prezi tool and use, academic content, presentation style, and other. Instructors did have different goals for their ratings than peers did, in that they were focused on differences in how the Prezi tool was used between the two cultures. Peers were motivated by the fact that it was an assignment. A total of 60.5% of the instructors’ observations were on what they liked about the presentation with regard to Prezi tool and use and 76.3% of their improvement suggestions, while 17.5% of students’ non-blank responses included likes and 19.0% improve-ment suggestions referring to the Prezi tool and use. See Figures 6 and 7. For exact wording, see Appendixes A and B, Questions 11 and 12.
Analysis In answering the first research question, how well students used Prezi and its advanced features, both peers and the instructors rated usage as positive, with the mean rating among peers being 2.0 and instructors 2.4 on a scale where 1 was the most positive rating. Both students and instructors did believe that presentations were different than they would have been if PowerPoint had been used. Specifically the differences centered on breaking away from bullets points and using ad-vanced features such as grouping with a predefined path among those groups.
Analysis to answer the second research question, the movement away from the linear thinking many scholars believe inherent to PowerPoint, shows that there was a change to a more holistic approach. Being able to blend photos, videos, and links in fresh, interesting ways was particularly noted as a change from PowerPoint. The capability of working together collaboratively in real time on a presentation was also a vehicle for moving away from the more static, individualistic characteristic of PowerPoint.
105
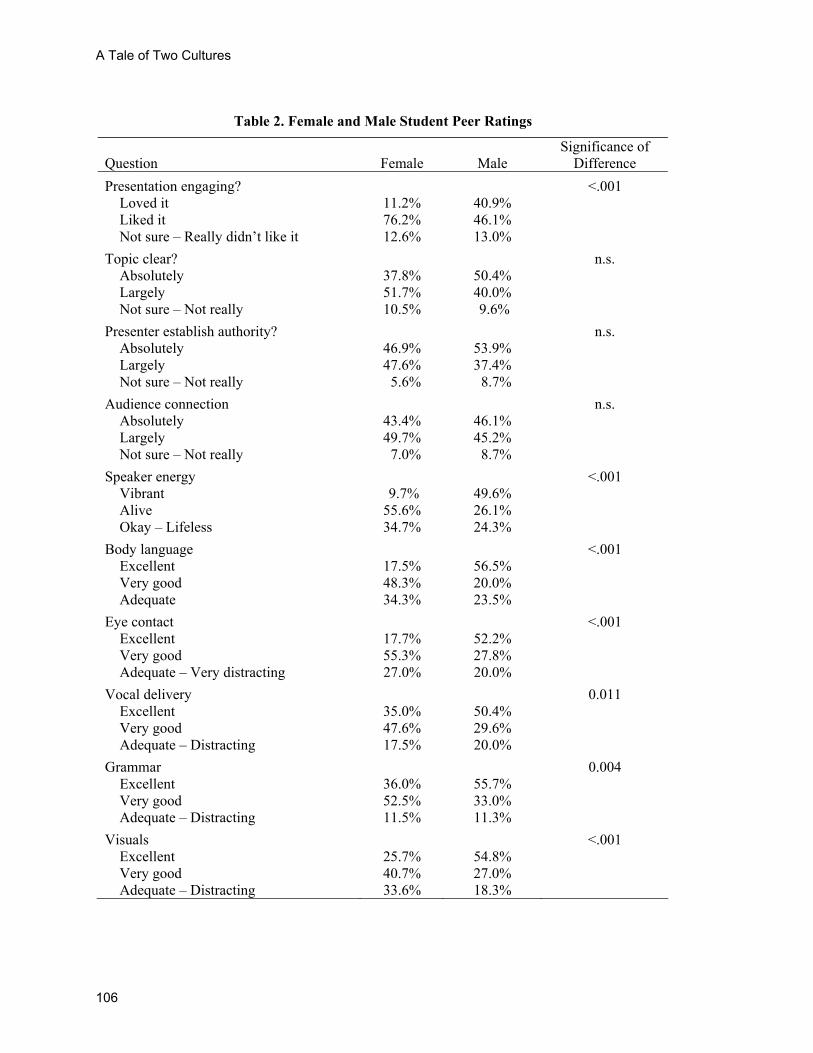
A Tale of Two Cultures
Table 2. Female and Male Student Peer Ratings
Question
Female
Male
Significance of Difference
Presentation engaging? <.001 Loved it 11.2% 40.9% Liked it 76.2% 46.1% Not sure – Really didn’t like it 12.6% 13.0%
Topic clear? n.s. Absolutely 37.8% 50.4% Largely 51.7% 40.0% Not sure – Not really 10.5% 9.6%
Presenter establish authority? n.s. Absolutely 46.9% 53.9% Largely 47.6% 37.4% Not sure – Not really 5.6% 8.7%
Audience connection n.s. Absolutely 43.4% 46.1% Largely 49.7% 45.2% Not sure – Not really 7.0% 8.7%
Speaker energy <.001 Vibrant 9.7% 49.6% Alive 55.6% 26.1% Okay – Lifeless 34.7% 24.3%
Body language <.001 Excellent 17.5% 56.5% Very good 48.3% 20.0% Adequate 34.3% 23.5%
Eye contact <.001 Excellent 17.7% 52.2% Very good 55.3% 27.8% Adequate – Very distracting 27.0% 20.0%
Vocal delivery 0.011 Excellent 35.0% 50.4% Very good 47.6% 29.6% Adequate – Distracting 17.5% 20.0%
Grammar 0.004 Excellent 36.0% 55.7% Very good 52.5% 33.0% Adequate – Distracting 11.5% 11.3%
Visuals <.001 Excellent 25.7% 54.8% Very good 40.7% 27.0% Adequate – Distracting 33.6% 18.3%
106

Brock & Brodahl
Table 3. Researchers’ Evaluation and Student Peer Rating
Question
Researchers
Students
Significance of Difference
Presentation engaging? .002 Loved it 3.6% 24.4% Liked it 83.9% 62.8% Not sure – Really didn’t like it 12.5% 12.8%
Topic clear? .014 Absolutely 64.3% 43.4% Largely 32.1% 46.5% Not sure – Not really 3.6% 10.1%
Presenter establish authority? <.001 Absolutely 21.4% 50.0% Largely 51.7% 43.0% Not sure – Not really 26.8% 7.0%
Audience connection <.001 Absolutely 17.9% 44.6% Largely 58.9% 47.7% Not sure – Not really 23.2% 7.8%
Speaker energy .010 Vibrant 8.9% 27.4% Alive 48.2% 42.5% Okay – Lifeless 42.9% 30.1%
Body language <.001 Excellent 14.3% 34.9% Very good 21.4% 35.7% Adequate – Distracting 64.3% 29.5%
Eye contact <.001 Excellent 1.8% 33.2% Very good 50.0% 43.0% Adequate – Very distracting 48.2% 23.8%
Vocal delivery <.001 Excellent 5.4% 41.9% Very good 44.6% 39.5% Adequate – Distracting 50.0% 18.6%
Grammar n.s. Excellent 46.4% 44.9% Very good 53.6% 43.7% Adequate – Distracting 0.0% 11.4%
Visuals <.001 Excellent 5.4% 38.8% Very good 39.3% 34.5% Adequate – Distracting 55.4% 26.7%
107
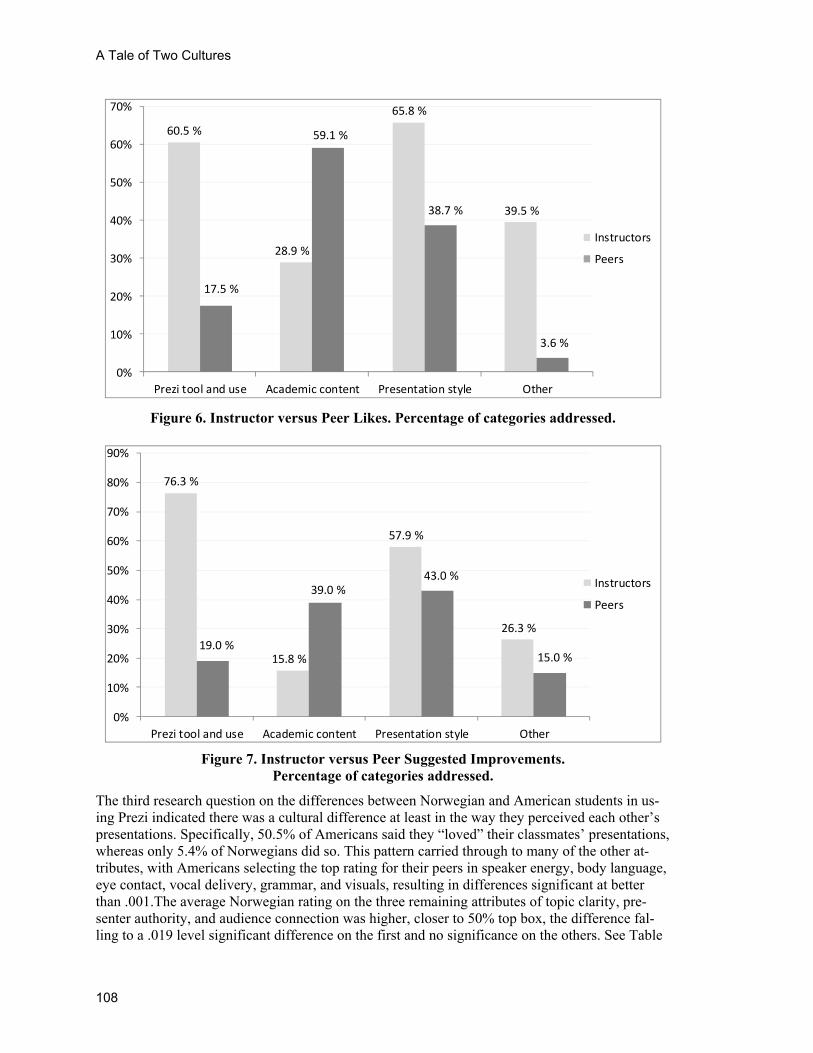
A Tale of Two Cultures
60.5 %
28.9 %
65.8 %
39.5 %
17.5 %
59.1 %
38.7 %
3.6 %
0%
10%
20%
30%
40%
50%
60%
70%
Prezi tool and use Academic content Presentation style Other
Instructors
Peers
Figure 6. Instructor versus Peer Likes. Percentage of categories addressed.
76.3 %
15.8 %
57.9 %
26.3 %
19.0 %
39.0 %43.0 %
15.0 %
0%
10%
20%
30%
40%
50%
60%
70%
80%
90%
Prezi tool and use Academic content Presentation style Other
Instructors
Peers
Figure 7. Instructor versus Peer Suggested Improvements.
Percentage of categories addressed.
The third research question on the differences between Norwegian and American students in us-ing Prezi indicated there was a cultural difference at least in the way they perceived each other’s presentations. Specifically, 50.5% of Americans said they “loved” their classmates’ presentations, whereas only 5.4% of Norwegians did so. This pattern carried through to many of the other at-tributes, with Americans selecting the top rating for their peers in speaker energy, body language, eye contact, vocal delivery, grammar, and visuals, resulting in differences significant at better than .001.The average Norwegian rating on the three remaining attributes of topic clarity, pre-senter authority, and audience connection was higher, closer to 50% top box, the difference fal-ling to a .019 level significant difference on the first and no significance on the others. See Table
108
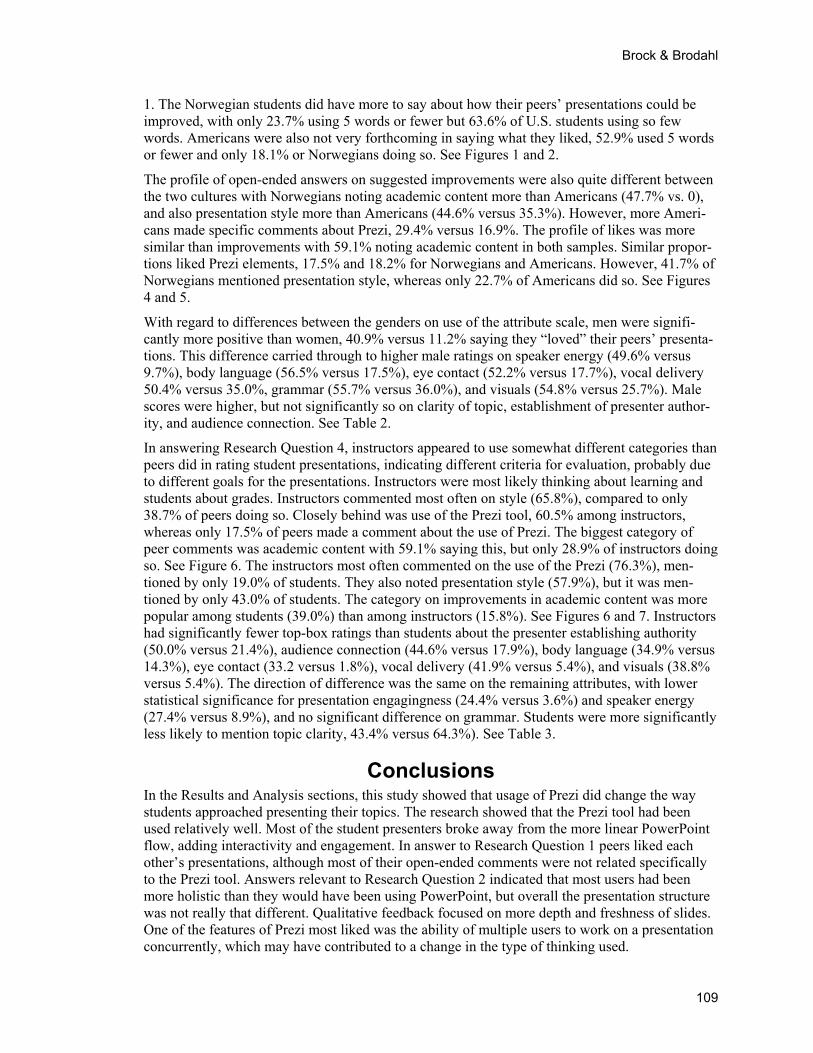
Brock & Brodahl
1. The Norwegian students did have more to say about how their peers’ presentations could be improved, with only 23.7% using 5 words or fewer but 63.6% of U.S. students using so few words. Americans were also not very forthcoming in saying what they liked, 52.9% used 5 words or fewer and only 18.1% or Norwegians doing so. See Figures 1 and 2.
The profile of open-ended answers on suggested improvements were also quite different between the two cultures with Norwegians noting academic content more than Americans (47.7% vs. 0), and also presentation style more than Americans (44.6% versus 35.3%). However, more Ameri-cans made specific comments about Prezi, 29.4% versus 16.9%. The profile of likes was more similar than improvements with 59.1% noting academic content in both samples. Similar propor-tions liked Prezi elements, 17.5% and 18.2% for Norwegians and Americans. However, 41.7% of Norwegians mentioned presentation style, whereas only 22.7% of Americans did so. See Figures 4 and 5.
With regard to differences between the genders on use of the attribute scale, men were signifi-cantly more positive than women, 40.9% versus 11.2% saying they “loved” their peers’ presenta-tions. This difference carried through to higher male ratings on speaker energy (49.6% versus 9.7%), body language (56.5% versus 17.5%), eye contact (52.2% versus 17.7%), vocal delivery 50.4% versus 35.0%, grammar (55.7% versus 36.0%), and visuals (54.8% versus 25.7%). Male scores were higher, but not significantly so on clarity of topic, establishment of presenter author-ity, and audience connection. See Table 2.
In answering Research Question 4, instructors appeared to use somewhat different categories than peers did in rating student presentations, indicating different criteria for evaluation, probably due to different goals for the presentations. Instructors were most likely thinking about learning and students about grades. Instructors commented most often on style (65.8%), compared to only 38.7% of peers doing so. Closely behind was use of the Prezi tool, 60.5% among instructors, whereas only 17.5% of peers made a comment about the use of Prezi. The biggest category of peer comments was academic content with 59.1% saying this, but only 28.9% of instructors doing so. See Figure 6. The instructors most often commented on the use of the Prezi (76.3%), men-tioned by only 19.0% of students. They also noted presentation style (57.9%), but it was men-tioned by only 43.0% of students. The category on improvements in academic content was more popular among students (39.0%) than among instructors (15.8%). See Figures 6 and 7. Instructors had significantly fewer top-box ratings than students about the presenter establishing authority (50.0% versus 21.4%), audience connection (44.6% versus 17.9%), body language (34.9% versus 14.3%), eye contact (33.2 versus 1.8%), vocal delivery (41.9% versus 5.4%), and visuals (38.8% versus 5.4%). The direction of difference was the same on the remaining attributes, with lower statistical significance for presentation engagingness (24.4% versus 3.6%) and speaker energy (27.4% versus 8.9%), and no significant difference on grammar. Students were more significantly less likely to mention topic clarity, 43.4% versus 64.3%). See Table 3.
Conclusions In the Results and Analysis sections, this study showed that usage of Prezi did change the way students approached presenting their topics. The research showed that the Prezi tool had been used relatively well. Most of the student presenters broke away from the more linear PowerPoint flow, adding interactivity and engagement. In answer to Research Question 1 peers liked each other’s presentations, although most of their open-ended comments were not related specifically to the Prezi tool. Answers relevant to Research Question 2 indicated that most users had been more holistic than they would have been using PowerPoint, but overall the presentation structure was not really that different. Qualitative feedback focused on more depth and freshness of slides. One of the features of Prezi most liked was the ability of multiple users to work on a presentation concurrently, which may have contributed to a change in the type of thinking used.
109
A Tale of Two Cultures
Examination of the study results and successive analysis indicated, mostly in instructor observa-tions and open-ended responses, that students in both the U.S. and Norway experienced a learning curve for Prezi. Other researchers (Bender & Bull, 2012) found a similar experience in a 7th grade sample, saying, “However, as with any new tool, software, hardware, or emerging technol-ogy, there is a learning curve. [… ] Prezi was difficult to learn at first, and because of the short duration of this intervention [to a] ‘mastery’ phase” (p. 2713). Also the pedagogical approach did not stress technical skills and instructions on the Prezi tool; the students had to attain their mas-tery phase while their focus was on the academic subject.
Between the two cultures, as shown in answer to Research Question 3, the U.S. students were much higher raters on questionnaire scales than the Norwegians; which is consistent with the lit-erature (Chen et al., 1995; McCrae et al., 1998). On the one hand, the Norwegians answered the open-ended questions in giving feedback and suggestions for improvement more extensively than their U.S. counterparts. On the other hand, Americans more often noted the quality of teamwork, perhaps due to the greater use of teams in the American design, and American students did more often reflect on how they used Prezi in the open-ended questions. Norwegians remarked on neat-ness and tidiness, concepts unmentioned in the American responses.
In looking at the answer to Research Question 4, the researchers were generally lower raters of the student presentations than peers were, possibly indicating their higher standards.
Delimitations and Limitations This study was limited to two classes. Observations of differences in cultures may have been con-founded by the fact that the subject of one class was marketing management, the other ICT and learning. Also one class had exclusively group presentations, whereas the other class was mainly individual ones. The personalities of the instructors differed. As well, the gender composition of the two groups was not the same, with the Norwegian being more female and the U.S. one more male. The small samples make these results exploratory and not definitive.
Recommendations The instructors had made three assumptions in designing their classes:
1) Web 2.0 technologies should supposedly be easy to use and take little time to learn;
2) A short introduction of tools might be needed, but with emphasis on good use and motivation, not details; and
3) The assignment had to focus on the academic/subject content, not on technical skills and instructions on the Prezi tool.
Prezi is a tool that facilitates new ways of approaching communication, while at the same time being relatively easy to learn with an immediately visible output. While it is possible to limit an introduction to a one-hour session and how best to use the tool, instructors may consider that in-troduction of new presentation tools such as Prezi allows the opportunity to expand students’ knowledge about visual thinking. More general recommendations include the continued inclusion of presentation skills and practice in undergraduate curricula. Communication skill continues to be an extremely important qualification in the workplace (Mantell, 2012).
The students all adapted the tool without prior hands-on training, but did not take full advantage of the features that would make their first Prezi differ from PowerPoint-based presentations. What do students need to know before using Prezi to more quickly use the tool’s central capabilities and navigation styles? The following suggestions come directly from the research and are derived from the conclusions that address the major challenges from a pedagogical perspective.
110
Brock & Brodahl
Challenge (1) - To be Innovative in Creating Something From Nothing A blank canvas presents a challenge and makes it hard to start out. A recommendation would be to provide templates using Prezi as part of the introduction, although a template may diminish creativity. However, the instructor may give creative examples of Prezis where blank canvas is split up by using backdrops behind parts of the presentation or metaphors are used that visualize the structure of the presentation on the canvas.
The authors recommend that when introducing Prezi, instructors put particular emphasis on dem-onstrating good use and encouraging discussion. Examples (Diamond, 2010b) may stimulate stu-dents to think how to begin. The focus in the classroom needs to be raising students’ level of awareness of the benefits that can be drawn from the infinite canvas by visual-spatial organization of content. Students need to grasp:
the importance of sorting and grouping elements and chunk information, the importance of the placement and scale of items on the blank canvas, and the features and concepts of zooming.
The instructor may provide Prezis where mapping, scaling items, and placing them around has some kind of logical sense. For example, the instructor might present a Prezi showing images used as examples of a bigger idea, shrunk down a bit, and placed under the text that represents the idea, followed by a discussion about how items logically and technically are grouped, placed, and connected, and how well the concept of zooming has been applied.
A recommendation is to have a central discussion in class on how to avoid motion sickness. This may be initiated by comparing a Prezi with respectively intuitive navigation and a pleasant zoom and a Prezi with a rather bizarre path between the elements and an uncomfortable zoom. Explain-ing the intentions of useful zooming and discussing examples that contrast good and distracting use, may make students aware that logical placement of elements on the canvas will support a natural path for delivery of the presentation, and, when needing to zoom far out for something, this can be done by going in stages so that zooming is not so extreme.
Recommendations include to present Prezis providing a perspective on the big picture (zoom out) in order to give a summary or overview, and changing focus to provide the audience with a detail of the presentation (zoom in), both related to the level of information (main point vs. detail). Then discuss how to think about placing information in layers in order to create a stacked effect, where each layer of information would support itself on its own.
A good example of panning the canvas to show relationships among grouped items is recom-mended, as well, as it may both communicate approach and the possibility of moving along in several directions.
Challenge (2) - To Break From Traditional Bullet Lists and Sequential Approach Take time to discuss the advantages and disadvantages coming with bulleted presentations driven by navigation from slide to slide (“powerpointification” of communication) and reasons to re-think, and stimulate considering a new mindset and new ways of presenting by breaking the slides barrier. The benefits of freshness and creativity will motivate many students. With American stu-dents, emphasis on the enhanced creativity benefits, as well as improvements in teamwork, may work well; whereas, in a Norwegian classroom, the appeal may be to the tidiness a Prezi format allows in contrast to the more drawn out PowerPoint. Olaussen & Bråten (1999) and Adorno (2009) had previously observed that differences between students in the two country cultures.
111
A Tale of Two Cultures
Challenge (3) - To Develop Demonstrating Non-Linear Thinking The conceptual jump from linear (point to point) to non-linear design would appear to be a first step to students’ learning and utilization of tool. They may need to experience the fact that Prezi can be used both in a linear or non-linear way and grasp the difference. Presenting a Prezi that reflects associations and mind maps could serve this purpose.
In line with students’ valuing Prezi as a collaboration tool, another recommendation is to include a brief demonstration of the collaborative features of the Prezi presentation tool that will inspire students to take advantage of meeting online to collaborate on their Prezi. The simultaneous col-laboration feature of Prezi, not available in PowerPoint, may be a tool to incorporate new ways of thinking through immediate feedback from collaborators.
References Adams, C. (2006). PowerPoint, habits of mind, and classroom culture. Journal of Curriculum Studies, 38,
389-411.
Adorno, T. W. (2009). ‘Kultur’ and culture. Social Text, 27(2), 145-158. doi: 10.1215/01642472-2008-028.
Alshare, K., & Hindi, N. M. (2004). The importance of presentation skills in the classroom: Students and instructors perspectives. Journal of Computing Sciences in Colleges, 19(4), 6-15.
Barnatt, C. (2008, March 30). Explaining Web 2.0. Retrieved from http://youtu.be/7BAXvFdMBWw
Baxter Magolda, M. (1992). Knowing and reasoning in college: Gender-related patterns in students' intel-lectual development. San Francisco: Jossey-Bass.
Bender, C., & Bull, P. H. (2012). Using Prezi in a middle school science class. In P. Resta (Ed.), Proceed-ings of Society for Information Technology & Teacher Education International Conference 2012, 2708-2713. Retrieved from http://www.editlib.org/p/39996
Berry, J. W. (2011). Cross-cultural psychology: Research and applications (3rd ed.), 652. Downloaded eBook (free on EBSCOhost). Book Collection (EBSCOhost).
BrainRulesBook. (2008, March 6). Death by PowerPoint. Retrieved from http://youtu.be/FJ5dbUCu2Ug
Brock, S. & Joglekar, Y. (2012). Empowering PowerPoint: Slides and teaching effectiveness. Interdiscipli-nary Journal of Information, Knowledge, and Management, 6, 85-94. Retrieved from http://www.ijikm.org/Volume6/IJIKMv6p085-094Brock545.pdf
Brodahl, C., Hansen, N.K., & Hadjerrouit, S. (2011). Collaborative writing with web 2.0 technologies: Education students' perceptions. Journal of Information Technology Education, 10, IIP73-IIP103. Re-trieved from http://www.jite.org/documents/Vol10/JITEv10IIPp073-103Brodahl948.pdf
Burke, L. A., & James, K. E. (2008). PowerPoint-based lectures in business education: An empirical inves-tigation of student-perceived novelty and effectiveness. Business Communication Quarterly, 71, 278-296.
Carter, T. (2002). The importance of talk to mid-career women's development: A collaborative inquiry. The Journal of Business Communication, 39(1), 55-91.
Chen, C., Lee, S. Y., & Stevenson, H. W. (1995). Response style and cross-cultural comparisons of rating scales among East Asian and North American students. Psychological Science, 6(3), 170-175.
Conboy, C., Fletcher, S., Russell, K., & Wilson, M., (2012). An evaluation of the potential and impact of Prezi, the zooming editor software as a tool to facilitate learning in higher education. Innovations in Practice, 7, 31-45.
Cyphert, D. (2004). The problem of PowerPoint: Visual aid or visual rhetoric? Business Communication Quarterly, 67, 80-84.
112
Brock & Brodahl
Daniels, L. (1999). Introducing technology in the classroom: PowerPoint as a first step. Journal of Comput-ing in Higher Education, 10, 42-56.
Derrick, E. J. (2006). Tools for student engagement that facilitate development of communication skills. In K. Elleithy, T. Sobh, A. Mahmood, M. Iskander & M. Karim (Eds.), advances in computer, informa-tion, and systems sciences, and engineering (pp. 481-484). Springer Netherlands.
Diamond, S. (2010a). Prezi for dummies cheat sheet. Retrieved from http://www.dummies.com/how-to/content/prezi-for-dummies-cheat-sheet.html
Diamond, S. (2010b). Prezi for dummies. Hoboken, N.J., Wiley Publ.
Elkjær, J. K. (Ed.) (2009). Global leadership country report. Copenhagen Business School, Denmark.
Fransson, G., & Holmberg, J. (2012): Understanding the theoretical framework of technological pedagogi-cal content knowledge: A collaborative self-study to understand teaching practice and aspects of knowledge. Studying Teacher Education, 8(2), 193-204.
Frey, B., & Birnbaum, P. (2002). Learners' perceptions on the use of PowerPoint in lectures. Computers and Education, 41, 72-86.
Gneezy, U., Niederle, M., & Rustichini, A. (2003). Performance in competitive environments: Gender dif-ferences. The Quarterly Journal of Economics, 118(3), 1049.
Gudykunst, W. B., Matsumoto, Y., Ting-Toomey, S., Nishida, T., Kim, K., & Heyman, S. (1996). The in-fluence of cultural individualism-collectivism, self construals, and individual values on communication styles across cultures. Human Communication Research, 22, 510–543.
Hadjerrouit, S. (2005). Designing a pedagogical model for web engineering education: An evolutionary perspective. Journal of Information Technology Education, 4, 115-140. Retrieved from http://www.jite.org/documents/Vol4/v4p115-140Hadj50.pdf
Heine, S. J., Lehman, D. R., Peng, K., & Greenholtz, J. (2002). What’s wrong with cross-cultural compari-sons of subjective Likert scales? The reference-group effect. Journal of Personality and Social Psy-chology, 82, 903–918.
Huxham, M. (2010). The medium makes the message: Effects of cues on students' lecture notes. Learning in Higher Education, 11(3), 179-188.
Isaacs, G. (1994). Lecturing practices and note-taking purposes. Studies in Higher Education, 19, 203-217.
Klein, J. (2009, December 28). Time, 174(25), 86-93.
Koohang, A., Riley, L., & Smith, T. (2009). E-learning and constructivism: From theory to application. Interdisciplinary Journal of E-Learning and Learning Objects, 5, 91-109. Retrieved from http://www.ijello.org/Volume5/IJELLOv5p091-109Koohang655.pdf
Kunkel, K. (2004). A research note assessing the benefit of PowerPoint software in different lecture courses. Teaching Sociology, 32, 188-196.
Lee, Y. T., & Seligman, M. E. P. (1997). Are Americans more optimistic than the Chinese? PSPB, 23(1), 34-40.
Mason, M. (2009). How the 'snow-woman effect' slows women's progress. The Chronicle of Higher Educa-tion, 1-4.
Mantell, R. (2012). Must-have job skills in 2013. Online Wall St. Journal, 11 Nov. 2012. Retrieved from http://online.wsj.com/article/SB10001424127887324735104578118902763095818.html
McCrae, R., Yik, M. S. M., Trapnell, P. D., Bond, M. H., & Paulhus, D. L. (1998). Interpreting personality profiles across cultures: Bilingual, acculturation, and peer rating studies of Chinese undergraduates. Journal of Personality and Social Psychology, 74(4), 1041-1055.
Neal, E. (1998, June 19). Using technology in teaching: We need to exercise healthy skepticism. The Chronicle of Higher Education.
113
A Tale of Two Cultures
Noppe, I., Achterberg, J., Duquaine, L., Huebbe, M., & Carol, W. (2007). PowerPoint handouts and college student learning outcomes. International Journal for the Scholarship of Teaching and Learning, 48(1), 2-10.
Olaussen, B. S., & Bråten, I. (1999). Students’ use of strategies for self-regulated learning: Cross-cultural perspectives. Scandinavian Journal of Educational Research, 43(4), 409-443.
O’Reilly, T. (2005). The open source paradigm shift. In J. Feller, B. Fitzgerald, S. Hissam, & K. Lakhani (Eds.). Perspectives on free and open source software (pp. 461-481). Boston: The MIT Press.
Schrage, M. (2008). A better work force. The Conference Board Review, 37-45.
Sørnes, J. O., Stephens, K. K., Sætre, A. S., & Browning, L. D. (2003). Leveling differences and reinforc-ing similarities: The interaction between information and communication technologies and national culture. Proceedings of the 2003 Informing Science and IT Education Conference, Pori, Finland, 1157-1181. Retrieved from http://proceedings.informingscience.org/IS2003Proceedings/docs/144Soern.pdf
Szabo, A., & Hastings, N. (2000). Using IT in the undergraduate classroom: Should we replace the black-board with PowerPoint? Computers and Education, 35, 175-187.
Taylor, S. E., Klein, L. C., Lewis, B. P., Gruenewald, T. L. Gurung, A. R., & Updegraff, J. A. (2000). Biobehavioral responses to stress in females: Tend-and-befriend, not fight-or-fight. Psychological Re-view, 107(3), 411-429.
Tufte, E. (2003). PowerPoint is evil. Wired, 11. Retrieved from Wired: http://www.wired.com/wired/archive/11.09/ppt2.html
Virtanen, P., Myllärniemi, J., & Wallander, H. (2012). Diversifying higher education: Innovative tools to facilitate different ways of learning. Proceedings of the 12th International Conference on Information Communication Technologies in Education (ICICTE) 2012, 105-116. Retrieved from http://www.icicte.org/Proceedings2012/Papers/03-2-Virtanen.pdf
Zhang, X., & Olfman, L. (2010). Studios, mini-lectures, project presentations, class blog and wiki: A new approach to teaching web technologies. Journal of Information Technology Education, IIP187-IIP199. Retrieved from http://www.jite.org/documents/Vol9/JITEv9IIPp187-199Zhang813.pdf
Zuckerman, L. (1999, April 17). Words go right to the brain, but can they stir the heart? New York Times, A17-A19.
114

Brock & Brodahl
Appendix A Peer Review Form for Students’ Presenter Ratings (English version)
Q01. How engaging was the presentation?
1 - Loved it 2 - Liked it 3 - Not sure 4 - Didn't like it 5 - Really didn't like it
Q02. Was the topic clear?
1 - Absolutely 2 - Largely 3 - Not sure 4 - Not really 5 - Not at all
Q03. Did the presenter establish authority?
1 - Absolutely 2 - Largely 3 - Not sure 4 - Not really 5 - Not at all
Q04. Did the presenter connect with the audience?
1 - Absolutely 2 - Largely 3 - Not sure 4 - Not really 5 - Not at all
Q05. How was the speaker's overall energy?
1 - Vibrant 2 - Alive 3 - Okay 4 - Low energy 5 - Lifeless
Q06. How was the overall body language?
1 - Excellent 2 - Very good 3 - Adequate 4 - Distracting 5 - Very distracting
Q07. How was the overall eye contact?
1 - Excellent 2 - Very good 3 - Adequate 4 - Distracting 5 - Very distracting
Q08. How was the vocal delivery? (Consider diction, volume, pitch, pace and use of pauses)
1 - Excellent 2 - Very good 3 - Adequate 4 - Distracting 5 - Very distracting
Q09. How was the speaker's grammar?
1 - Excellent 2 - Very good 3 - Adequate 4 - Distracting 5 - Very distracting
Q10. How effective were the visuals?
1 - Excellent 2 - Very good 3 - Adequate 4 - Distracting 5 - Very distracting
Q11. What did I like most about it? (Consider content, form and delivery – one or all)
Q12. What could have been improved? (Consider content, form and delivery – one or all)
115
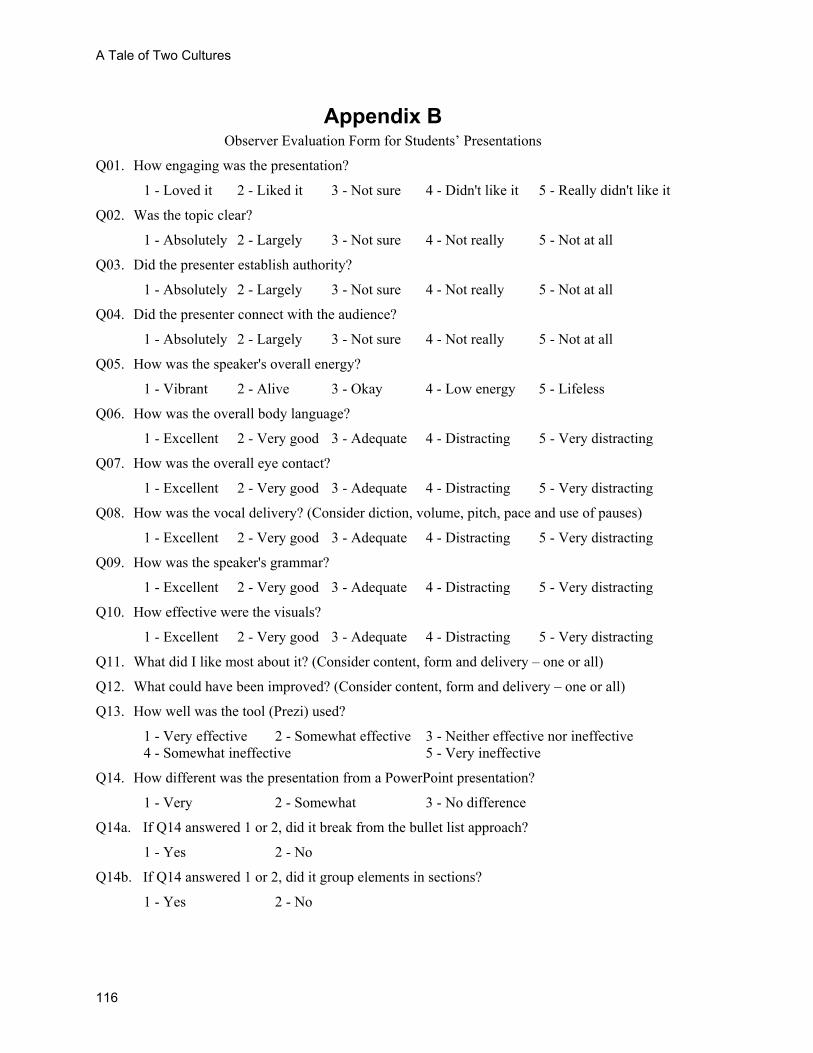
A Tale of Two Cultures
Appendix B Observer Evaluation Form for Students’ Presentations
Q01. How engaging was the presentation?
1 - Loved it 2 - Liked it 3 - Not sure 4 - Didn't like it 5 - Really didn't like it
Q02. Was the topic clear?
1 - Absolutely 2 - Largely 3 - Not sure 4 - Not really 5 - Not at all
Q03. Did the presenter establish authority?
1 - Absolutely 2 - Largely 3 - Not sure 4 - Not really 5 - Not at all
Q04. Did the presenter connect with the audience?
1 - Absolutely 2 - Largely 3 - Not sure 4 - Not really 5 - Not at all
Q05. How was the speaker's overall energy?
1 - Vibrant 2 - Alive 3 - Okay 4 - Low energy 5 - Lifeless
Q06. How was the overall body language?
1 - Excellent 2 - Very good 3 - Adequate 4 - Distracting 5 - Very distracting
Q07. How was the overall eye contact?
1 - Excellent 2 - Very good 3 - Adequate 4 - Distracting 5 - Very distracting
Q08. How was the vocal delivery? (Consider diction, volume, pitch, pace and use of pauses)
1 - Excellent 2 - Very good 3 - Adequate 4 - Distracting 5 - Very distracting
Q09. How was the speaker's grammar?
1 - Excellent 2 - Very good 3 - Adequate 4 - Distracting 5 - Very distracting
Q10. How effective were the visuals?
1 - Excellent 2 - Very good 3 - Adequate 4 - Distracting 5 - Very distracting
Q11. What did I like most about it? (Consider content, form and delivery – one or all)
Q12. What could have been improved? (Consider content, form and delivery – one or all)
Q13. How well was the tool (Prezi) used?
1 - Very effective 2 - Somewhat effective 3 - Neither effective nor ineffective 4 - Somewhat ineffective 5 - Very ineffective
Q14. How different was the presentation from a PowerPoint presentation?
1 - Very 2 - Somewhat 3 - No difference
Q14a. If Q14 answered 1 or 2, did it break from the bullet list approach?
1 - Yes 2 - No
Q14b. If Q14 answered 1 or 2, did it group elements in sections?
1 - Yes 2 - No
116
Brock & Brodahl
Q14c. If Q14 answered 1 or 2, did it include an easily followed path?
1 - Yes 2 - No
Q14d. If Q14 answered 1 or 2, did the Prezi include a structure based on features other than those PowerPoint could provide?
1 - Yes 2 - No
Q14e. If answered (Yes) in question Q14a, Q14b, Q14c or Q14d, please explain the difference. (Consider structure, content, form and delivery – one or all, in single parts of the Prezi or of the whole)?
Q15. How well was the presentation organized?
1 - Very organized 2 - Somewhat organized 3 - Somewhat disorganized 4 - Very disorganized
Q16. Was it easy to follow?
1 - Very easy to follow 2 - Somewhat easy to follow 3 - Somewhat hard to follow 4 - Very hard to follow
Q17. Was it attractive?
1 - Very 2 - Somewhat 3 - Not at all
Q18. Did the presentation include multimedia (photos, videos, and links)?
1 - Yes 2 - No
Q19. Did it blend existing media and the presenter’s work in an interesting way?
1 - Very 2 - Somewhat 3 - Not at all
Q20. Was the final product compelling?
1 - Very 2 - Somewhat 3 - Not at all
117
A Tale of Two Cultures
Appendix C Self-evaluation Form (English Version)
Q21. How different was your Prezi presentation from what you would have created in a PowerPoint presentation? (Consider content, form and delivery – one or all)
1 - Very 2 - Somewhat 3 - No difference
Q22. If answered (1) and (2) in question Q21, please explain the difference. (Consider content, form and delivery – one or all)
Q23. Did your Prezi presentation break from the bullet list approach?
1 - Yes 2 - No
Q24. Did your Prezi include a predefined path?
1 - Yes 2 - No
Q25. Did you design a structure in your Prezi different from how you would have done in a PowerPoint presentation?
1 - Yes 2 - No
Q26. If answered (1) in question Q25, please explain the difference. (Consider the structure – in single parts of your Prezi or of the whole)
Q27. Retrospectively, what did you like most about your Prezi presentation? (Consider structure, content, form and delivery – one or all)
Q28. Retrospectively, what could have been improved? (Consider structure, content, form and delivery – one or all)
118

Brock & Brodahl
119
of
Biographies Sabra Brock is Interim Dean at the Touro College Graduate School of Business in New York City, also teaching marketing and change man-agement at the graduate and undergraduate level. She received her doc-torate from New York University. Her research interests include col-laborative learning in business schools and the workplace, cross cul-tural teaching, and managing change through transformative learning.
Cornelia Brodahl is an Associate Professor at the Faculty of Engi-neering and Science at University of Agder in Kristiansand/Norway. She received the master degree in Mathematics from the UniversityMünster/Germany in 1979. Her research and teaching interests include ICT and learning, Professional ICT Didactics, and Mathematics in Teacher Education. Main areas of expertise and interest are ICT sup-ported learning, digital teaching aids, learning and teaching with Web 2.0, pedagogical Web design, didactical animations and adopting flipped classroom.

This page left blank intentionally
Journal of Information Technology Education: Research Volume 12, 2013
Pre-Service Teachers Use E-learning Technologies to Enhance Their Learning
Judith J. Smith and H. Carol Greene Department of Elementary Education
and Middle Grades Education, East Carolina University, Greenville, NC, USA
[email protected] [email protected]
Executive Summary The purpose of this study was twofold. The primary purpose was to improve pre-service teacher education by using technology to help pre-service teachers bridge the gap between academic preparation and practice. The secondary, but still important, objective was to familiarize pre-service teachers in the use of technology to support their future pedagogical activities. Therefore, this research sought to develop a method for training undergraduate students in designing, im-plementing, and evaluating lesson plans to solidify the relationship between research, pedagogy, and teaching practice. Specifically, this study investigated the implementation of e-learning as a method of instruction to help pre-service teachers evaluate and improve upon the implementation of their lesson plans during their real world practicum experiences. The study was guided by the following research questions: 1) What successes, challenges, and benefits do university instruc-tors and pre-service teachers experience in using and analyzing video in teacher education meth-ods coursework? 2) In what ways did the use of e-learning help the pre-service teachers improve their teaching during the practicum experience? Results showed that participants reported im-proved lesson planning, improved lesson implementation, visual interpretations of best practices, modeling, and peer and university instructor feedback as successes of the e-learning project. Challenges included participants’ frustrations of being overworked and overwhelmed with the technical problems associated with e-learning. Overall participants judged the e-learning project as a very positive aspect of their teacher training.
Keywords: e-learning, teacher education, 21st century learners, teaching and learning
Introduction One of the multiple realities of implementing quality preparation and support of teacher educators is inclusion of 21st century “technology” skills in teaching. To prepare K-12 students for the fu-ture, we must ensure that our teachers are equipped for the future as well. Therefore, as teacher
educators, we are challenged to revise our teacher preparation programs to re-flect the needs of 21st century learners so that we produce teachers who effec-tively and comfortably use technology to enhance student learning. While to-day’s college students may be very fa-miliar with social networking sites, digi-tal music, and video sharing, they are not as familiar with many of the oppor-tunities technology offers to enhance
Material published as part of this publication, either on-line or in print, is copyrighted by the Informing Science Institute. Permission to make digital or paper copy of part or all of these works for personal or classroom use is granted without fee provided that the copies are not made or distributed for profit or commercial advantage AND that copies 1) bear this notice in full and 2) give the full citation on the first page. It is per-missible to abstract these works so long as credit is given. To copy in all other cases or to republish or to post on a server or to redistribute to lists requires specific permission and payment of a fee. Contact [email protected] to request redistribution permission.
Editor: Jane Nash
Pre-Service Teachers Use E-learning Technologies
and provide quality K-12 instruction in a classroom setting (Albion, 2008; Orey, McClendon & Branch, 2006). Effective technology integration by instructors in the college classroom is also often lacking so that pre-service teachers are not seeing the use of technology in education mod-eled for them (Cuban, 2001; Dawson, 2006; Koehler & Mishra, 2007; Swain, 2006).
In investigating the teaching of technology-assisted teaching, we have identified two challenges: first, the need to generally increase the technical competency of pre-service teachers, and second, the need to help them better understand how e-learning technologies can be effectively applied. Thus, we wanted to evaluate a means of familiarizing pre-service teachers with using e-learning technology while modeling the use of technology to achieve a set of pedagogical learning objec-tives. Since we did not have the resources to implement a dedicated “Teaching with Technology” course, we needed to identify a course within an existing curriculum where we saw an opportu-nity to have our students use e-learning technology to enhance their learning.
We elected to focus on the particularly challenging area of helping our students, i.e., pre-service teachers, integrate theory and methods from their university coursework into teaching practice (Duquette, 1993; Fang, 1996; McCormack, Gore, & Thomas, 2006). Although teacher education programs strive to instill in teacher candidates the ability to transition the theory of pedagogy into practice as they deliberate their approaches to instruction, this remains an area of great difficulty for many pre-service teachers. Education researchers have found reflective practice may be an effective way to support pre-service teachers in connecting their university learning experiences to the practice of teaching students (Lai & Calandra, 2010; Rhine & Bryant, 2007; Snoeyink, 2010). Consequently, the objectives of our efforts need to be understood on two levels: 1) to model and to familiarize pre-service teachers with an example of effective use of technology in instruction, and 2) to assist our students to bridge the gap between academic preparation and teaching practice by examining their own teaching through video sharing and reflection. The study represents our evaluation of the initiative.
Specifically, this study evaluated the implementation of e-learning as a method of instruction to help pre-service teachers evaluate and improve upon the implementation of their lesson plans dur-ing their real world practicum experiences and assessed student perceptions regarding the use of technology in achieving the learning objectives.
Accordingly, the study was guided by the following research questions: 1) What successes, chal-lenges, and benefits do university instructors and pre-service teachers experience in using and analyzing video in teacher education methods coursework? 2) How did the pre-service teachers perceive the usefulness of e-learning to help them improve their teaching during the practicum experience?
Review of the Literature This review first discusses the need for technology integration in our K-12 classrooms and to what degree technology is being utilized and valued as an important part of K-12 students’ educa-tions. From there, this review explores how technology, specifically e-learning, may support the instruction of pre-service teachers in the college classroom.
Limitations to Technology Integration in Today’s Classrooms Educators agree that to prepare students for the 21st century, our educational system requires broad and intensive use of technology; therefore, teachers must adjust their traditional modes of instruction to include these 21st century skills. For example, teachers’ use of the internet is neces-sary in order to connect children to the real world in an increasingly global learning environment (McCoog, 2008; Ross, 2000; Vockley, 2007). However, Moylan (2008) found that a significant
122
Smith & Greene
gap exists between the knowledge and skills needed for success in life and the current primary and secondary education systems in place throughout the world.
The idea that schools are using technology widely is just not true. According to Vockley (2007), even with federal, state, and local investments in technology, most schools use technology fru-gally. She stated, “To a wireless nation, which relies on technology for ordinary tasks and ex-traordinary achievements, it is shocking and inconceivable….that technology is marginalized in the complex and vital affairs of education.” This lack of technology integration is a problem for today’s teachers as many researchers have noted the importance of utilizing technology in class-rooms. McCoog (2008), Moersch (2011), and Walker, Redmond and Giles (2010), have all stated that technology needs to be part of the daily curriculum in elementary and secondary school, yet this is often not the case.
Since technology is embedded in all aspects of our daily lives, and its advances and uses in our society are constantly increasing, one must wonder why its use in education and public schools lags so far behind. Several studies have attempted to address this issue. For example, in a qualita-tive study, Bauer and Kenton (2005) reported that the 30 teachers they interviewed were reluctant to integrate technology into their classrooms because of problems with, or lack of, equipment; scheduling difficulties; and software availability. Additionally, Hsu (2010) and Swain (2006) concluded that teachers in their studies felt that technology integration was not a valuable use of time and effort, while other teachers felt technology was arduous to use (Hofer & Swan, 2006).
Other studies have found that even with inclusion of new technologies in the classroom, actual instructional strategies remain largely unchanged or that these attempts are sometimes met with a degree of disdain. Hofer and Swan (2006) found that teachers are hesitant to adopt a transforma-tive view of technology where laptops are more than notebooks, where Power Point means more than handwritten overheads, and e-textbooks do more than simply replace hard copy textbooks. Often teachers are afraid technology may be broken, so restrictions are placed on students’ usage even though educators acknowledge that young children need to explore and investigate in order to learn. In a study of early childhood classrooms where students lacked freedom to explore with iPads and laptops, O’Mara and Laidlaw (2011) noted the problem for teachers was not the tech-nologies but the methods being used to implement them. Instead of using technologies to change approaches to the curriculum, teachers continued the regular drill and skill programs.
While media stories in Logan, Utah; Vancouver, British Columbia; and Knoxville, Tennessee touted school boards had funded new technologies for elementary classrooms, curricula were left unchanged. Teachers continued to drill skills using iPad, iPods, Smartboards, apps, and laptops to supplement material (Kirk, 2011; Little, 2011; Steffenhagan, 2011). Additionally, a new e-learning requirement was established by the Idaho Board of Education which required high school students to take two credits of online coursework to graduate. Idaho’s school reform initia-tive shifted funds from teacher and administrator salaries to technology improvements and a new focus on online learning (American School and University, 2011; Henig, & Reville, 2011; Rus-sell, 2011); however, teachers and parents responded negatively. The Idaho law as it pertained to technology use was overturned by voters in November 2012 (Robinson, 2012).
Change is sometimes slow and, oftentimes, change is slowest in education. Integration of tech-nology into instruction happens when the teacher is comfortable and competent in doing so, pro-vided that the technology resources are available to the teacher. Teachers will only become com-petent and confident when technology instruction is both provided and modeled for them in their own educations and when they are expected to use it in their teacher education program methods courses. If pre-service teachers graduate with full competence in the use of technology and fa-miliarity in how to integrate it into education, the use of technology in public school classrooms
123
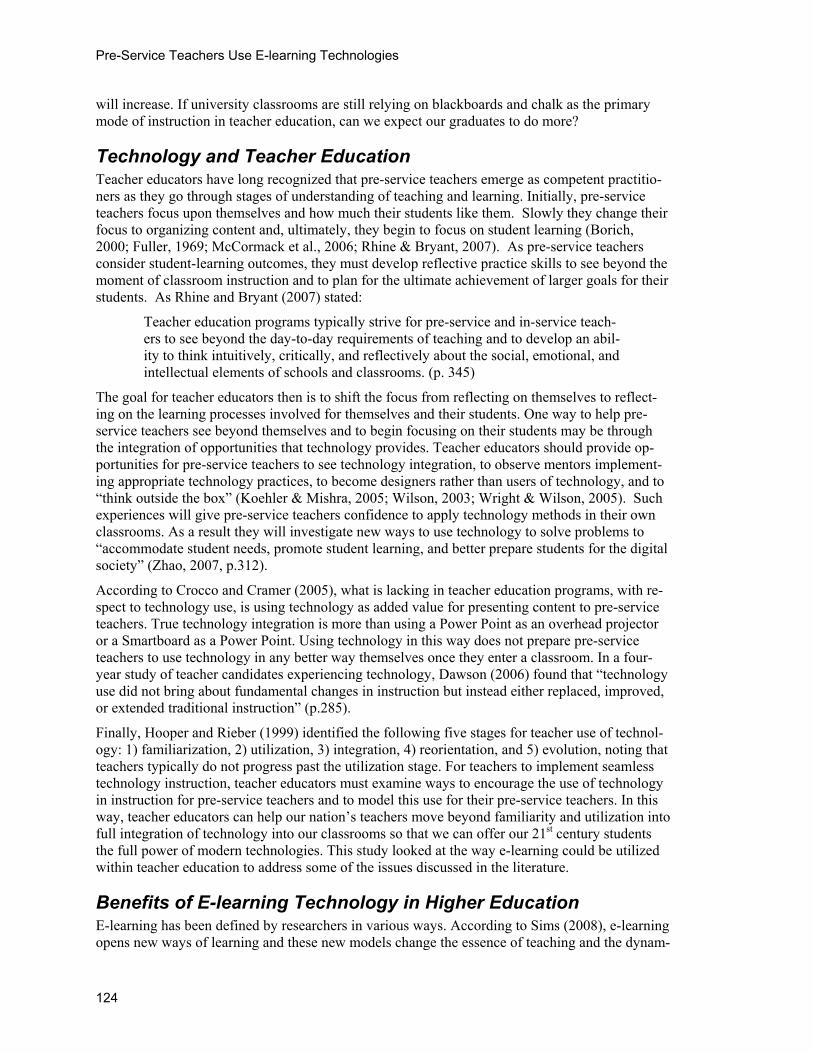
Pre-Service Teachers Use E-learning Technologies
will increase. If university classrooms are still relying on blackboards and chalk as the primary mode of instruction in teacher education, can we expect our graduates to do more?
Technology and Teacher Education Teacher educators have long recognized that pre-service teachers emerge as competent practitio-ners as they go through stages of understanding of teaching and learning. Initially, pre-service teachers focus upon themselves and how much their students like them. Slowly they change their focus to organizing content and, ultimately, they begin to focus on student learning (Borich, 2000; Fuller, 1969; McCormack et al., 2006; Rhine & Bryant, 2007). As pre-service teachers consider student-learning outcomes, they must develop reflective practice skills to see beyond the moment of classroom instruction and to plan for the ultimate achievement of larger goals for their students. As Rhine and Bryant (2007) stated:
Teacher education programs typically strive for pre-service and in-service teach-ers to see beyond the day-to-day requirements of teaching and to develop an abil-ity to think intuitively, critically, and reflectively about the social, emotional, and intellectual elements of schools and classrooms. (p. 345)
The goal for teacher educators then is to shift the focus from reflecting on themselves to reflect-ing on the learning processes involved for themselves and their students. One way to help pre-service teachers see beyond themselves and to begin focusing on their students may be through the integration of opportunities that technology provides. Teacher educators should provide op-portunities for pre-service teachers to see technology integration, to observe mentors implement-ing appropriate technology practices, to become designers rather than users of technology, and to “think outside the box” (Koehler & Mishra, 2005; Wilson, 2003; Wright & Wilson, 2005). Such experiences will give pre-service teachers confidence to apply technology methods in their own classrooms. As a result they will investigate new ways to use technology to solve problems to “accommodate student needs, promote student learning, and better prepare students for the digital society” (Zhao, 2007, p.312).
According to Crocco and Cramer (2005), what is lacking in teacher education programs, with re-spect to technology use, is using technology as added value for presenting content to pre-service teachers. True technology integration is more than using a Power Point as an overhead projector or a Smartboard as a Power Point. Using technology in this way does not prepare pre-service teachers to use technology in any better way themselves once they enter a classroom. In a four-year study of teacher candidates experiencing technology, Dawson (2006) found that “technology use did not bring about fundamental changes in instruction but instead either replaced, improved, or extended traditional instruction” (p.285).
Finally, Hooper and Rieber (1999) identified the following five stages for teacher use of technol-ogy: 1) familiarization, 2) utilization, 3) integration, 4) reorientation, and 5) evolution, noting that teachers typically do not progress past the utilization stage. For teachers to implement seamless technology instruction, teacher educators must examine ways to encourage the use of technology in instruction for pre-service teachers and to model this use for their pre-service teachers. In this way, teacher educators can help our nation’s teachers move beyond familiarity and utilization into full integration of technology into our classrooms so that we can offer our 21st century students the full power of modern technologies. This study looked at the way e-learning could be utilized within teacher education to address some of the issues discussed in the literature.
Benefits of E-learning Technology in Higher Education E-learning has been defined by researchers in various ways. According to Sims (2008), e-learning opens new ways of learning and these new models change the essence of teaching and the dynam-
124

Smith & Greene
ics of learning. He defines e-learning as, “forms of technology-enhanced learning that are effi-cient, effective, and engaging” (p.154). E-learning, as explained by Safran, Helic and Gutl, (2007), supports communities of practice where learners interact and learn together. Interaction typically occurs through discussion, commenting, collaborative writing, or working together on projects. In a study of secondary education teachers and college professors in Scotland, Davidson and Elliot (2007), defined e-learning as “any learning that is electronically mediated or facilitated by transactions software” (p.512). E-learning encourages students to be collaborative, contextual, and connected in their learning.
Monaco (2008) noted that “in education, a dichotomous perspective on technology exists: It is both praised and ignored in schools and in teacher education” (p.19). While Web 2.0 technology tools abound, too often teachers and professors in the field choose not to use the technological tools in their classrooms.
Numerous research studies confirm that pre-service teachers gain new insights into planning and organization, pedagogical strategies, delivery, content knowledge, and classroom management by analyzing and reflecting on video during their field experience (Alger & Kopcha, 2009; Downey, 2008; Shepherd & Hannafin, 2008; Snoeyink, 2010; Yeh, 2007). According to Rosaen, Lunde-berg, Terpstra, Cooper, Fu, and Niu (2010), video based reflection helps with more specific comments about pre-service teachers’ practice and shifts the focus from management to content and instruction. They also found that pre-service teachers analyzed and reflected on lesson strengths/weaknesses and gained a clearer vision of the role of the teacher in the classroom. Fi-nally, in a study conducted by Snoeyink (2010), eight elementary and secondary pre-service teachers indicated a strong belief in the effectiveness of video self-analysis. The pre-service teachers saw themselves from the students’ perspective, reduced their annoying mannerisms, and improved their management skills.
Students today are comfortable with technology as part of their daily lives. The North Carolina Center for the Advancement of Teaching (2009) found that technology engages students and ad-vances their learning. Additionally, the International Society for Technology in Education (2008) noted that e-learning engages students, improves learning, enriches professional practice, and provides positive role models in teacher education. However, although the bulk of the literature describes positive benefits and outcomes associated with e-learning, some studies have found contradictory results.
Mixed Messages Regarding E-learning In contrast to some of the studies describing the positive outcomes of e-learning, Capobianco (2007) studied 2,000 undergraduate teacher education students. He noted that integration of in-structional technology to facilitate pre-service science teachers’ learning was influenced more by the professor’s philosophy than by the technology. In addition, Rhine and Bryant (2007) discov-ered issues related to the implementation of e-learning. In a three year study of MAT (Masters of Teaching) students, the students uploaded video clips to Blackboard, wrote a description of their lesson, and posted questions for their peers. Common topics emerged in the discussion but there were many negative issues in executing the technology tools. Initially, pre-service teachers did not have access to necessary technology tools in their classrooms. There was also a wide range of technical skills among the pre-service teachers and many students had significant anxiety imple-menting the technology.
Summary Technology integration in the P-16 classroom is not keeping up with the use of technology in the real world. More effective use of technology in education with real purposes for learning out-
125
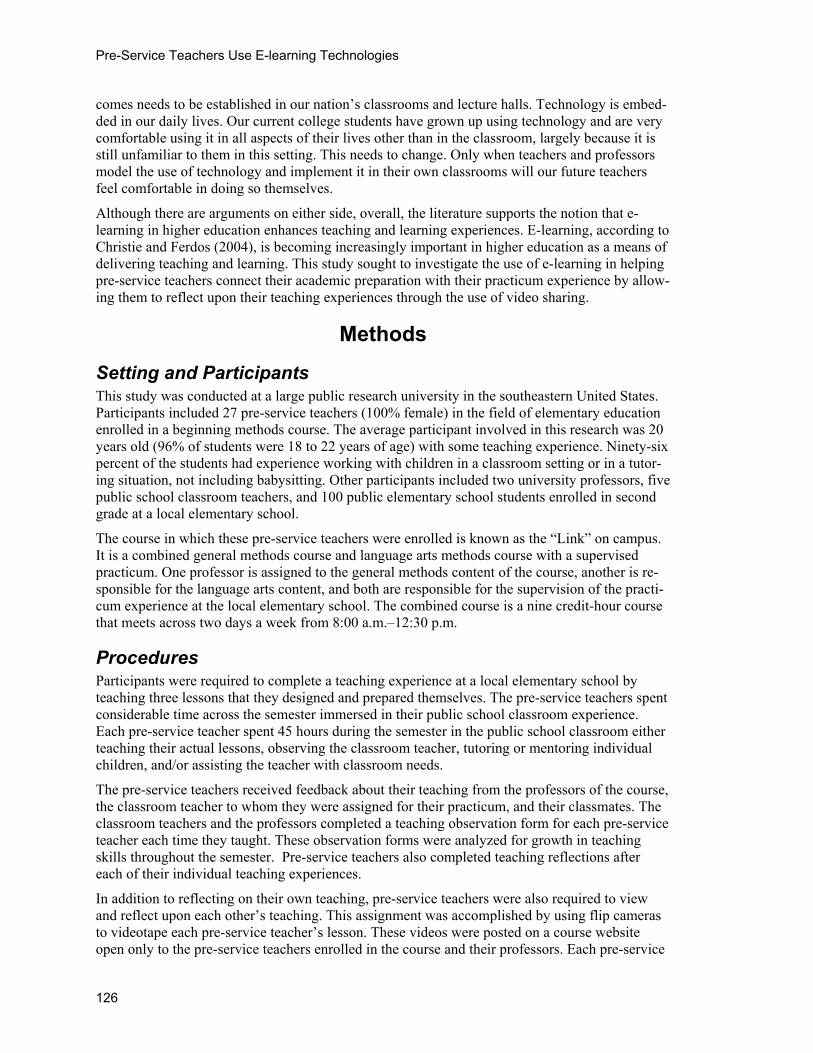
Pre-Service Teachers Use E-learning Technologies
comes needs to be established in our nation’s classrooms and lecture halls. Technology is embed-ded in our daily lives. Our current college students have grown up using technology and are very comfortable using it in all aspects of their lives other than in the classroom, largely because it is still unfamiliar to them in this setting. This needs to change. Only when teachers and professors model the use of technology and implement it in their own classrooms will our future teachers feel comfortable in doing so themselves.
Although there are arguments on either side, overall, the literature supports the notion that e-learning in higher education enhances teaching and learning experiences. E-learning, according to Christie and Ferdos (2004), is becoming increasingly important in higher education as a means of delivering teaching and learning. This study sought to investigate the use of e-learning in helping pre-service teachers connect their academic preparation with their practicum experience by allow-ing them to reflect upon their teaching experiences through the use of video sharing.
Methods
Setting and Participants This study was conducted at a large public research university in the southeastern United States. Participants included 27 pre-service teachers (100% female) in the field of elementary education enrolled in a beginning methods course. The average participant involved in this research was 20 years old (96% of students were 18 to 22 years of age) with some teaching experience. Ninety-six percent of the students had experience working with children in a classroom setting or in a tutor-ing situation, not including babysitting. Other participants included two university professors, five public school classroom teachers, and 100 public elementary school students enrolled in second grade at a local elementary school.
The course in which these pre-service teachers were enrolled is known as the “Link” on campus. It is a combined general methods course and language arts methods course with a supervised practicum. One professor is assigned to the general methods content of the course, another is re-sponsible for the language arts content, and both are responsible for the supervision of the practi-cum experience at the local elementary school. The combined course is a nine credit-hour course that meets across two days a week from 8:00 a.m.–12:30 p.m.
Procedures Participants were required to complete a teaching experience at a local elementary school by teaching three lessons that they designed and prepared themselves. The pre-service teachers spent considerable time across the semester immersed in their public school classroom experience. Each pre-service teacher spent 45 hours during the semester in the public school classroom either teaching their actual lessons, observing the classroom teacher, tutoring or mentoring individual children, and/or assisting the teacher with classroom needs.
The pre-service teachers received feedback about their teaching from the professors of the course, the classroom teacher to whom they were assigned for their practicum, and their classmates. The classroom teachers and the professors completed a teaching observation form for each pre-service teacher each time they taught. These observation forms were analyzed for growth in teaching skills throughout the semester. Pre-service teachers also completed teaching reflections after each of their individual teaching experiences.
In addition to reflecting on their own teaching, pre-service teachers were also required to view and reflect upon each other’s teaching. This assignment was accomplished by using flip cameras to videotape each pre-service teacher’s lesson. These videos were posted on a course website open only to the pre-service teachers enrolled in the course and their professors. Each pre-service
126
Smith & Greene
teacher was required to view and then to reflect and respond to their classmates’ teaching. Profes-sors analyzed the videos and responded with feedback. Students reviewed videos and revised fu-ture lessons based on feedback from professors and peers. Students’ used a Video Response Log that included the following questions to guide peer feedback:
1. What I saw (Describe the lesson you viewed). Be specific (at least 3-4 sentences). 2. What I liked. Be specific (at least 3-4 sentences). 3. Suggestions for enhancing the lesson. Provide at least 2 suggestions.
Figure 1 depicts the actual design of the project and shows the process used for the video reflec-tion cycle.
Figure 1: Project Design
Pre-service teachers received technology-specific training prior to their practicum experience. A university technology specialist spent one 40-minute class period with the pre-service teachers and explained in detail how to download video clips to their computers and then save on a CD. The process from beginning to end included: 1) Save the video from the flip camera to the com-puter, 2) share the video online, 3) burn the video to a disc, 4) submit the disc to your professor, 5) professor submits disc to the technology specialist, and 6) technology specialist uploads to course website. The process was time intensive, taking students approximately 30 to 60 minutes to complete steps one through five.
Pre-service teachers were grouped in triads for their teaching experiences. One member of the triad videotaped the lesson using a flip camera while a second triad member assisted the pre-service teacher. After videotaping the lesson, downloading to the computer and saving to a CD, the pre-service teacher submitted the CD to the technology facilitator who then uploaded the video to the course website. Each day, the technology specialist uploaded multiple student video files to the course website. Pre-service teachers could then view their classmates’ teaching epi-sodes and share feedback on lessons.
Upon completion of the practicum experience, participants completed a post-test survey to deter-mine perceived benefits of their participation in videotape reflection in practicum settings. The survey, student reflections, and instructor reflections identified challenges and successes the uni-versity instructors and pre-service teachers experienced in using and analyzing video in their teacher education methods coursework.
Data Collection and Analysis Data were collected over a five-month period. Data sources included: a) videotapes, b) student reflections, c) cooperating teacher feedback, d) university instructor evaluations, e) surveys, and f) peer feedback. Responses were analyzed using a combination of content analysis (Silverman, 1999) and the constant-comparative method (Glaser & Straus, 1967) to determine patterns or themes in the data.
Influenced by the code card method suggested by Fonteyn, Vettese, Lancaster, and Bauer-Wu (2008), the researchers created a card for each category with a description and inclusion criteria. First, responses from the video response logs were color coded into a notebook by successes and challenges. Each researcher read the video feedback and coded the responses into categories. Re-searchers ensured that the research findings possessed a measure of authenticity by being reflex-
127
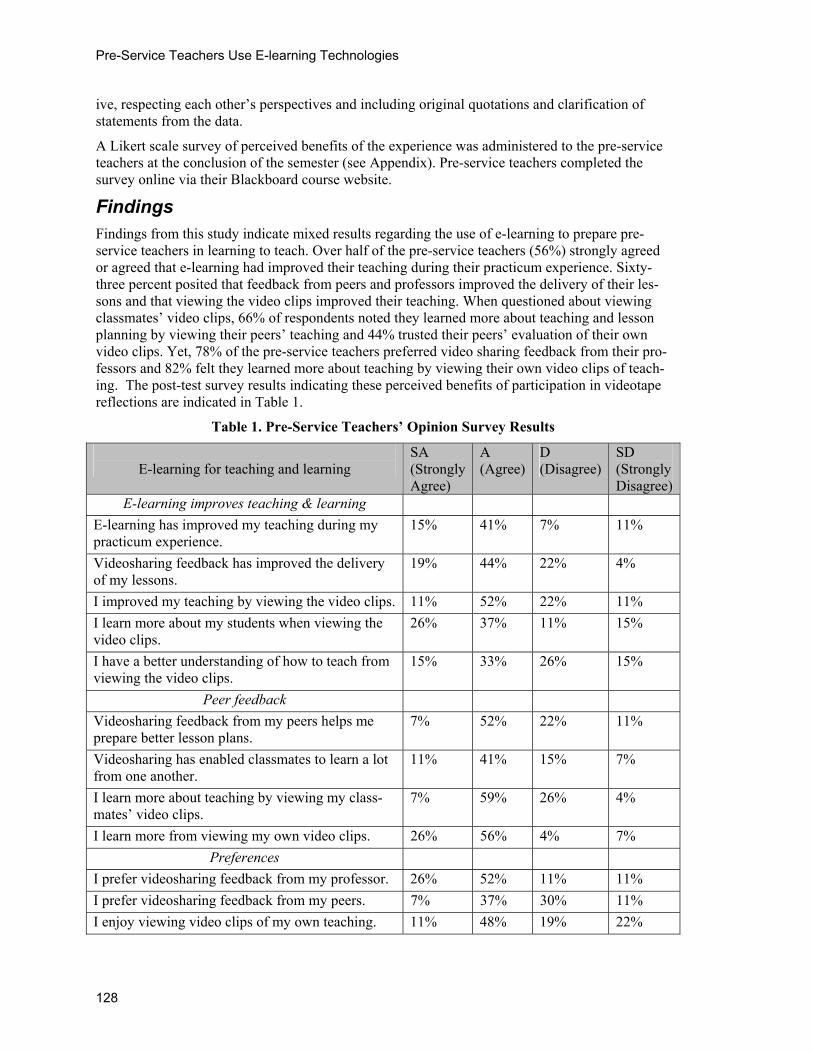
Pre-Service Teachers Use E-learning Technologies
ive, respecting each other’s perspectives and including original quotations and clarification of statements from the data.
A Likert scale survey of perceived benefits of the experience was administered to the pre-service teachers at the conclusion of the semester (see Appendix). Pre-service teachers completed the survey online via their Blackboard course website.
Findings Findings from this study indicate mixed results regarding the use of e-learning to prepare pre-service teachers in learning to teach. Over half of the pre-service teachers (56%) strongly agreed or agreed that e-learning had improved their teaching during their practicum experience. Sixty-three percent posited that feedback from peers and professors improved the delivery of their les-sons and that viewing the video clips improved their teaching. When questioned about viewing classmates’ video clips, 66% of respondents noted they learned more about teaching and lesson planning by viewing their peers’ teaching and 44% trusted their peers’ evaluation of their own video clips. Yet, 78% of the pre-service teachers preferred video sharing feedback from their pro-fessors and 82% felt they learned more about teaching by viewing their own video clips of teach-ing. The post-test survey results indicating these perceived benefits of participation in videotape reflections are indicated in Table 1.
Table 1. Pre-Service Teachers’ Opinion Survey Results
E-learning for teaching and learning
SA (Strongly Agree)
A (Agree)
D (Disagree)
SD (Strongly Disagree)
E-learning improves teaching & learning
E-learning has improved my teaching during my practicum experience.
15% 41% 7% 11%
Videosharing feedback has improved the delivery of my lessons.
19% 44% 22% 4%
I improved my teaching by viewing the video clips. 11% 52% 22% 11%
I learn more about my students when viewing the video clips.
26% 37% 11% 15%
I have a better understanding of how to teach from viewing the video clips.
15% 33% 26% 15%
Peer feedback
Videosharing feedback from my peers helps me prepare better lesson plans.
7% 52% 22% 11%
Videosharing has enabled classmates to learn a lot from one another.
11% 41% 15% 7%
I learn more about teaching by viewing my class-mates’ video clips.
7% 59% 26% 4%
I learn more from viewing my own video clips. 26% 56% 4% 7%
Preferences
I prefer videosharing feedback from my professor. 26% 52% 11% 11%
I prefer videosharing feedback from my peers. 7% 37% 30% 11%
I enjoy viewing video clips of my own teaching. 11% 48% 19% 22%
128
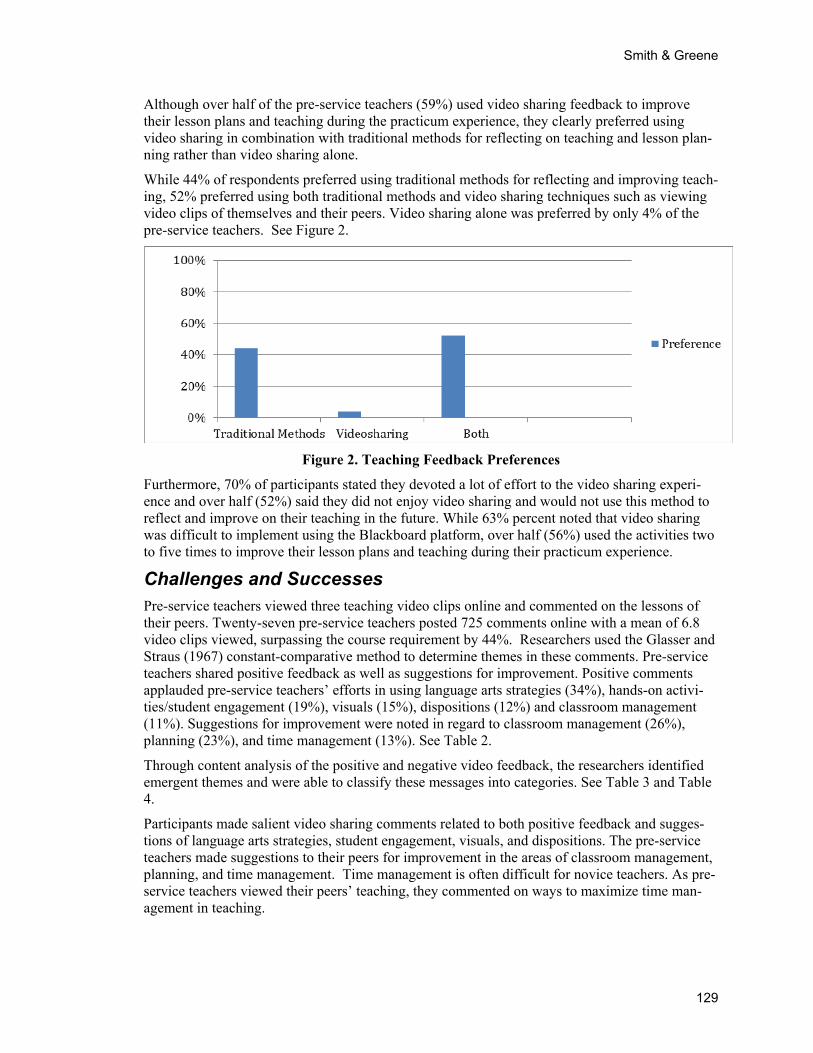
Smith & Greene
Although over half of the pre-service teachers (59%) used video sharing feedback to improve their lesson plans and teaching during the practicum experience, they clearly preferred using video sharing in combination with traditional methods for reflecting on teaching and lesson plan-ning rather than video sharing alone.
While 44% of respondents preferred using traditional methods for reflecting and improving teach-ing, 52% preferred using both traditional methods and video sharing techniques such as viewing video clips of themselves and their peers. Video sharing alone was preferred by only 4% of the pre-service teachers. See Figure 2.
Figure 2. Teaching Feedback Preferences
Furthermore, 70% of participants stated they devoted a lot of effort to the video sharing experi-ence and over half (52%) said they did not enjoy video sharing and would not use this method to reflect and improve on their teaching in the future. While 63% percent noted that video sharing was difficult to implement using the Blackboard platform, over half (56%) used the activities two to five times to improve their lesson plans and teaching during their practicum experience.
Challenges and Successes Pre-service teachers viewed three teaching video clips online and commented on the lessons of their peers. Twenty-seven pre-service teachers posted 725 comments online with a mean of 6.8 video clips viewed, surpassing the course requirement by 44%. Researchers used the Glasser and Straus (1967) constant-comparative method to determine themes in these comments. Pre-service teachers shared positive feedback as well as suggestions for improvement. Positive comments applauded pre-service teachers’ efforts in using language arts strategies (34%), hands-on activi-ties/student engagement (19%), visuals (15%), dispositions (12%) and classroom management (11%). Suggestions for improvement were noted in regard to classroom management (26%), planning (23%), and time management (13%). See Table 2.
Through content analysis of the positive and negative video feedback, the researchers identified emergent themes and were able to classify these messages into categories. See Table 3 and Table 4.
Participants made salient video sharing comments related to both positive feedback and sugges-tions of language arts strategies, student engagement, visuals, and dispositions. The pre-service teachers made suggestions to their peers for improvement in the areas of classroom management, planning, and time management. Time management is often difficult for novice teachers. As pre-service teachers viewed their peers’ teaching, they commented on ways to maximize time man-agement in teaching.
129
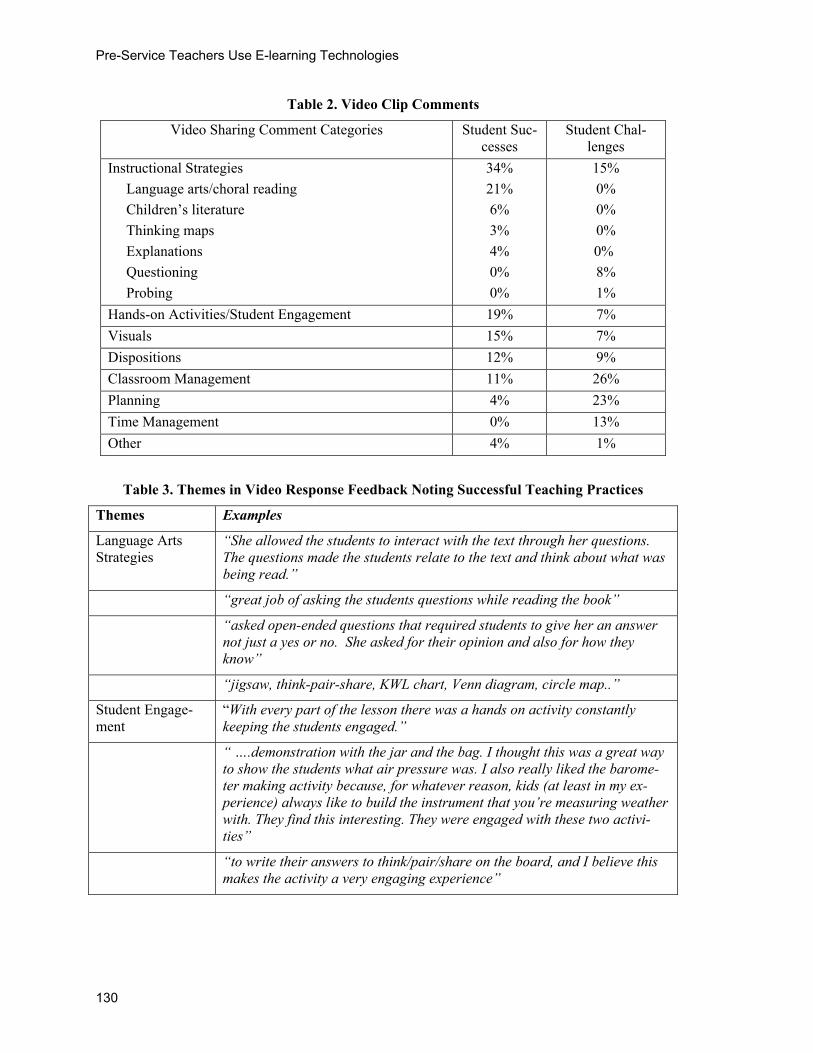
Pre-Service Teachers Use E-learning Technologies
Table 2. Video Clip Comments
Video Sharing Comment Categories Student Suc-cesses
Student Chal-lenges
Instructional Strategies
Language arts/choral reading
Children’s literature
Thinking maps
Explanations
Questioning
Probing
34%
21%
6%
3%
4%
0%
0%
15%
0%
0%
0%
0%
8%
1%
Hands-on Activities/Student Engagement 19% 7%
Visuals 15% 7%
Dispositions 12% 9%
Classroom Management 11% 26%
Planning 4% 23%
Time Management 0% 13%
Other 4% 1%
Table 3. Themes in Video Response Feedback Noting Successful Teaching Practices
Themes Examples
Language Arts Strategies
“She allowed the students to interact with the text through her questions. The questions made the students relate to the text and think about what was being read.”
“great job of asking the students questions while reading the book”
“asked open-ended questions that required students to give her an answer not just a yes or no. She asked for their opinion and also for how they know”
“jigsaw, think-pair-share, KWL chart, Venn diagram, circle map..”
Student Engage-ment
“With every part of the lesson there was a hands on activity constantly keeping the students engaged.”
“ ….demonstration with the jar and the bag. I thought this was a great way to show the students what air pressure was. I also really liked the barome-ter making activity because, for whatever reason, kids (at least in my ex-perience) always like to build the instrument that you’re measuring weather with. They find this interesting. They were engaged with these two activi-ties”
“to write their answers to think/pair/share on the board, and I believe this makes the activity a very engaging experience”
130
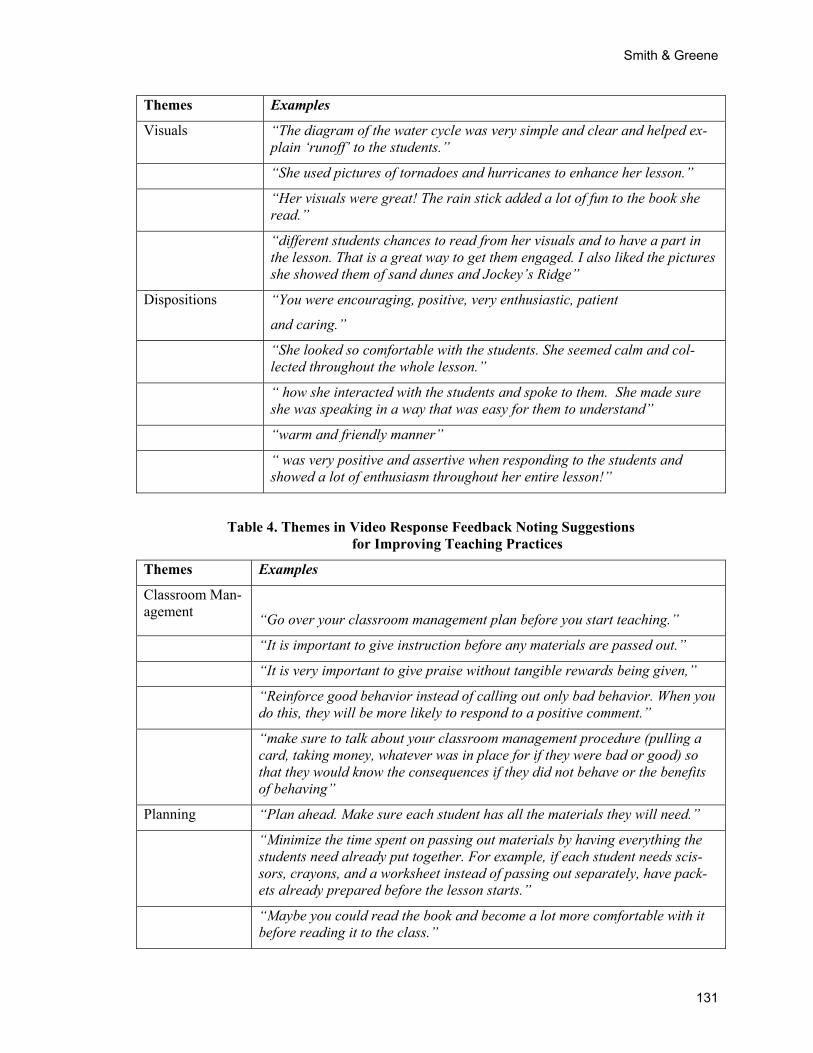
Smith & Greene
Themes Examples
Visuals “The diagram of the water cycle was very simple and clear and helped ex-plain ‘runoff’ to the students.”
“She used pictures of tornadoes and hurricanes to enhance her lesson.”
“Her visuals were great! The rain stick added a lot of fun to the book she read.”
“different students chances to read from her visuals and to have a part in the lesson. That is a great way to get them engaged. I also liked the pictures she showed them of sand dunes and Jockey’s Ridge”
Dispositions “You were encouraging, positive, very enthusiastic, patient
and caring.”
“She looked so comfortable with the students. She seemed calm and col-lected throughout the whole lesson.”
“ how she interacted with the students and spoke to them. She made sure she was speaking in a way that was easy for them to understand”
“warm and friendly manner”
“ was very positive and assertive when responding to the students and showed a lot of enthusiasm throughout her entire lesson!”
Table 4. Themes in Video Response Feedback Noting Suggestions for Improving Teaching Practices
Themes Examples
Classroom Man-agement
“Go over your classroom management plan before you start teaching.”
“It is important to give instruction before any materials are passed out.”
“It is very important to give praise without tangible rewards being given,”
“Reinforce good behavior instead of calling out only bad behavior. When you do this, they will be more likely to respond to a positive comment.”
“make sure to talk about your classroom management procedure (pulling a card, taking money, whatever was in place for if they were bad or good) so that they would know the consequences if they did not behave or the benefits of behaving”
Planning “Plan ahead. Make sure each student has all the materials they will need.”
“Minimize the time spent on passing out materials by having everything the students need already put together. For example, if each student needs scis-sors, crayons, and a worksheet instead of passing out separately, have pack-ets already prepared before the lesson starts.”
“Maybe you could read the book and become a lot more comfortable with it before reading it to the class.”
131
Pre-Service Teachers Use E-learning Technologies
“have all your items for building the wind vane out already so it doesn’t take as long to get ready for the project”
Time Manage-ment
“Choose a smaller amount of pages to read from the book at the beginning. A couple of kids looked restless.”
“Give a specific time limit so students know how much time they have to do something.”
“There were some long breaks in the lesson. Keep the lesson moving at a brisk pace.”
“book seemed to go longer than students stayed engaged and I would sug-gests selecting certain key pages in the book in order to maintain time and student attention”
“I would give them a specific time limit so they know how much time they have to do something”
Discussion and Practical Implications According to the results of this research, the use of e-learning engaged participants in reflection and feedback for mentoring and coaching of post teaching video discussions. This engagement enhanced pre-service teachers’ practice in real life classroom settings. A few participants indi-cated prior knowledge of teaching best practices, but overall, participants cited the e-learning ex-periences as complementary best practice for beginning teacher educators. The improved plan-ning and implementation skills reflect the findings of Alger and Kopcha (2009), Downey (2008), Kay, Knaack, and Petrarca (2009), Shepherd and Hannafin (2008), Snoeyink (2010), and Yeh (2007). Participants reported improved lesson planning, improved lesson implementation, visual interpretations of best practices, modeling, and peer and university instructor feedback as suc-cesses of the e-learning project.
Challenges of the project included participants’ frustrations of being overworked and over-whelmed with the technical problems associated with downloading their video clips. The cumber-some video download process echoes the experience of other teachers (Bauer & Kenton, 2005; Hofer & Swan, 2006). Respondents reported they encountered difficulties transferring video from the flip cameras to their computers, then uploading to a DVD, and finally sharing with the tech-nologist who in turn posted the videos online. The process was lengthy and cumbersome. Many students spent from 30 minutes to an hour after class waiting for the video to download from the flip camera to the computer. MAC and PC computer programs responded differently to the method of video transfer, which added to the student frustrations. However, once the students had access to their videos online, they were pleased with the capability of viewing and reflecting on their own and their classmates’ teaching episodes.
Participants judged the e-learning project as a very positive aspect of their teacher training. Au-thentic settings recorded and posted online enabled participants to evaluate, redesign, and im-prove teaching practice. Instructors and peers provided support through online discussion boards. Online feedback and reflections provided support for beginning teacher education candidates in that participants were made well aware of university instructors’ expectations.
As noted by Wang (2009), applying blended learning to teacher education maintains and im-proves the quality of teaching preparation, and the results of this research support the benefits of applying e-learning in teacher education at the program level. However, these findings also indi-cate students did not favor e-learning as a method for learning to teach. Pre-service teachers
132
Smith & Greene
found e-learning methods beneficial, yet cumbersome and difficult, and they preferred both tradi-tional methods and video sharing together as a means of teaching reflection.
While the video sharing findings of this project agreed with the literature in reaping rewards for students in planning and implementing lessons, students preferred video sharing feedback from professors only when paired with traditional methods of feedback. The technology process of using flip cameras, downloading videos to the computer, and uploading to a CD limited this study. The university technology capabilities are up-to-date in many areas, but using video shar-ing is in early stages of development and was not user-friendly at the time of this study. Further-more, similar to the study by Rhine and Bryant (2007), there were a wide range of technical skills among the pre-service teachers, and according to Saade and Kira (2009) many students had sig-nificant anxiety implementing the technology.
Conclusions The undergraduate students’ e-learning experiences in this study are similar to those reported in the research literature, thus extending the literature in this area. However, this research adds to the current literature by suggesting e-learning as a model of support to add rigor and relevance to teacher education methods instruction. As noted by Bates (2005), the choice of technology should be driven by the needs of the learners and the context in which the learners, in this study our pre-service teachers, are working.
As instructors of the e-learning project, lessons were learned from this initial implementation that will guide future implementations. Practice and competence with the full implementation of video clip uploading to the website prior to classroom use by the students is a necessity. Suggestions for future implementations of this project include: 1) secure online technology support for stu-dents throughout the practicum experience rather than relying only on one initial training experi-ence, and 2) plan several practice sessions of the process from beginning to end before students actually implement their lessons at the practicum. Students will gain confidence and competence in the process thereby entering the project with full knowledge of how to navigate the technology of the e-learning activity. The benefits of e-learning were recognized by the participants, but were somewhat overshadowed by the technological difficulties experienced. Relieving those difficul-ties may allow the benefits of the actual e-learning experience to be more fully realized.
As university teacher education programs strive to bridge the gap between academic preparation and practice, as well as to model effective integration of technology in the classroom setting, this e-learning experience provided a model of renewed support for university instruction in designing and implementing best teaching practices. Future research is needed to deepen learning experi-ences for pre-service teachers. As teacher educators, we must continue to ask ourselves, “Did our students transfer learning outcomes from research pedagogy to practice? Could we do more to add depth and breadth and how? Are pre-service teachers gaining the ability to think intuitively and critically through the use of e-learning?”
Acknowledgement This article is a substantial revision of an earlier paper entitled “E-Learning: Using Technology to Guide Teaching Practice.” We gratefully acknowledge the support of Professor John Beachboard, Idaho State University, for his valuable comments and guidance that added depth to our study.
133
Pre-Service Teachers Use E-learning Technologies
References Albion, P. (2008). Web 2.0 in teacher education: Two imperatives for action. Computers in the Schools,
25(3/4), 181-198.
Alger, C., & Kopcha, T.J. (2009). eSupervision: A technology framework for 21st century field experience in teacher education. Issues in Teacher Education, 18(2), 31-46.
American School and University. (2011). Online courses required in Idaho. Retrieved December 20, 2011 from http://asumag.com/maintenancebusiness/online-courses-required-idaho
Bauer, J., & Kenton, J. (2005). Toward technology integration in the schools: Why it isn’t happening. Journal of Technology and Teacher Education, 13(4), 519-546.
Bates, A. W. (2005). Technology, e-learning and distance education. New York: Taylor & Francis.
Borich, G. D. (2000). Effective teaching methods. New Jersey: Merrill.
Capobianco, B. (2007). A self-study of the role of technology in promoting reflection and inquiry-based science teaching. Journal of Science Teacher Education, 18(2), 271-295.
Christie, M. F., & Ferdos, F. (2004). The mutual impact of educational and Information technologies: Building a pedagogy of e-learning. Journal of Information Technology Impact, 4(1), 15-26.
Crocco, M., & Cramer, J. (2005). Technology use, women, and global studies in social studies teacher edu-cation. Contemporary Issues in Technology and Teacher Education [Online serial], 5(1). Retrieved May 8, 2012 from http://www.citejournal.org/vol5/iss1/socialstudies/article1.cfm
Cuban, L. (2001). Oversold & underused: Computers in the classroom. Cambridge, MA: Harvard Univer-sity Press.
Davidson, J. K., & Elliot, D. L. (2007). A comparison of e-learning in Scotland’s colleges and secondary schools: The case of national qualifications in ‘core skills’. Journal of Computer Assisted Learning, 23, 511-522.
Dawson, K. (2006). Teacher inquiry: A vehicle to merge prospective teachers’ experience and reflection during curriculum-based, technology-enhanced field experiences. Journal of Research on Technology in Education, 38(3), 265-292.
Downey, J. (2008). “It’s not as easy as it looks”: Preservice teachers’ insights about teaching emerging from an innovate assignment in educational psychology. Teaching Educational Psychology, 3(1), 1-13.
Duquette, C. (1993). A school-based teacher education program: perceptions and attitudes. Alberta Journal of Educational Research, 39(4), 419-432.
Fang, Z. (1996). A review of research on teacher beliefs and practices. Educational Research, 38(1), 47-65.
Fonteyn, M. E., Vettese, M., Lancaster, D. R., & Bauer-Wu, S. (2008). Developing a codebook to guide content analysis of expressive writing transcripts. Applied Nursing Research, 21, 165-168.
Fuller, F. (1969). Concerns of teachers: A developmental conceptualization. America Educational Research Journal, 2(6), 207-226.
Glaser, B. G., & Straus, A. L. (1967). The discovery of grounded theory. Chicago: Aldine
Henig, J., & Reville, S. (2011). Idaho sets the stage for new e-learning requirement. Education Week, 31(12), 8.
Hofer, M., & Swan, K. (2006). Standards, firewalls, and general classroom mayhem: Implementing stu-dent-centered technology projects in the elementary classroom. Contemporary Issues in Technology and Teacher Education, 7(2), 42-58.
Hooper, S., & Rieber, L.P. (1999). Teaching, instruction, and technology. In A. C. Ornstein & L. S. Behar-Horenstein (Eds.), Contemporary issues in curriculum (pp.252-264). Boston: Allyn and Bacon.
134
Smith & Greene
Hsu, S. (2010). The relationship between teacher’s technology integration ability and usage. Journal of Educational Computing Research, 43(3), 309-325.
International Society for Technology in Education. (2008). ISTE’s educational technology standards for teachers. Retrieved January 8, 2012 from http://www.iste.org/Content/NavigationMenu/NETS/ForTeachers/2008Standards/NETS_for_Teachers_2008.htm
Kay, R., Knaack, L., & Petrarca, D. (2009). Exploring teachers’ perceptions of web-based learning tools. Interdisciplinary Journal of E-Learning and Learning Objects, 5, 27-50. Retrieved April 23, 2012 from www.ijello.org/Volume5/IJELLOv5p027-050Kay649.pdf
Kirk, A. (2011, January 10). Apple in the classroom: Students using iPods, iPads to improve reading, math. [Online newspaper article]. Retrieved November 20, 2011 from http://news.hjnews.com/news/education/article_937f4736-1c7b-11e0-94f2-001cc4c03286.html
Koehler, M., & Mishra, P. (2005). Teachers learning technology by design. Journal of Computing in Teacher Education, 21(3), 94-102.
Koehler, M., & Mishra, P. (2007). Introducing technological pedagogical knowledge. In The American Association of Colleges of Teacher Education (Ed), The handbook of technological pedagogical con-tent knowledge for teaching and teacher educators. Mahwah, NJ: Lawrence Erlbaum.
Lai, G., & Calandra, B. (2010). Examining the effects of computer-based scaffolds on novice teachers’ re-flective journal writing. Educational Technology Research & Development, 58, 421-437.
Little, K. (2011, February 6). Web school to require students in grades 4-12 to have iPads for learn-ing.[Online newspaper article]. Retrieved August 22, 2011, from http://www.knoxnews.com/news/2011/feb/06/turning-the-electronic-page/
McCoog, I. (2008). 21st century teaching and learning. Retrieved February 19, 2012 from http://www.eric.ed.gov/ERICWebPortal/recordDetail?accno=ED502607
McCormack, A., Gore, J., & Thomas, K. (2006). Early career teacher professional learning. Asia-Pacific Journal of Teacher Education, 34(1), 95-113.
Moersch, C. (2011). Turning up the H.E.A.T. on student learning: Assessing 21st century skills in class-rooms today. Educational Technology, 52(3), 42-46.
Monaco, M. (2008). Opening our eyes to the power of technology. Reading Today, 26(3), 19.
Moylan, W. (2008). Learning by project: Developing essential 21st century skills using student team pro-jects. International Journal of Learning, 15(9), 287-292.
North Carolina Center for the Advancement of Teaching. (2009). Technology engages students, advances learning. NCCAT Winter Newsletter, 22(1), 5.
O’Mara, J., & Laidlaw, L. (2011). Living in the iworld: Two literacy researchers reflect on the changing texts and literacy practices of childhood. English Teaching: Practice and Critique, 10(4), 149-159.
Orey, M., McClendon, V. J., & Branch, R. M. (Eds.). (2006). Educational media and technology yearbook. Englewood, CO: Libraries Unlimited.
Rhine, S., & Bryant, J. (2007). Enhancing pre-service teachers’ reflective practice with digital video-based dialogue. Reflective Practice, 8(3), 345-358.
Robinson, J. (2012, November 07). Idaho rejects teacher pay reforms, classrooom technology laws [Online newspaper article]. Retrieved from May 18, 2012 http://www.opb.org/news/article/n3-idaho-rejects-teacher-pay-reforms-classroom-technology-laws/
Rosaen, C. L., Lundeberg, M., Terpstra, M., Cooper, M., Fu, J., & Niu, R. (2010). Seeing through a differ-ent lens: What do interns learn when they make video cases of their own teaching? Teacher Educator, 45, 1-22.
135
http://www.iste.org/Content/NavigationMenu/NETS/ForTeachers/2008Standards/NETS_for_Teachers_2008.htm
Pre-Service Teachers Use E-learning Technologies
Ross, E. (2000). The praise and perils of e-learning. Theory and Research in Social Education, 28(4), 482-492.
Russell, B. (2011). Idaho to require two online classes. Retrieved May 18, 2012 from http://www.spokesman.com/stories/2011/nov/04/idaho-to-require-two-online-classes/
Saade, R., & Kira, D. (2009). Computer anxiety in e-learning: The effect of computer self-efficacy. Journal of Information Technology Education, 8, 177-191. Retrieved January 3, 2012, from www.jite.org/documents/Vol8/JITEv8p177-191Saade724.pdf
Safran, C., Helic, D., & Gutl, C. (2007, September). E-learning practices and Web 2.0. Paper presented at the meeting of the International Conference on Interactive Computer Aided Learning, Villach, Austria.
Shepherd, E. E., & Hannafin, M. J. (2008). Examining preservice teacher inquiry through video-based, formative assessment e-portfolios. Journal of Computing in Teacher Education, 25(1), 31-37.
Silverman, D. (1999). Interpreting qualitative data: Methods for analyzing talk, text, and interaction (2nd ed). London: Sage.
Sims, R. (2008). Rethinking (e)learning: A manifesto for connected generations. Distance Education, 39(92), 153-164.
Snoeyink, R. (2010). Using video self-analysis to improve the “withitness” of student teachers. Journal of Digital Learning in Teacher Education, 23(3), 101-110.
Steffenhagan, J. (2011, January 13). No more pencils, no more books: This Vancouver School has em-braced iPad, iPods, and apps. The Vancouver Sun. Retrieved June 9, 2012 from http://www.vancouversun.com/technology/Photos+more+pencils+more+books+Vancouver+school+embraces+iPads/4106245/story.html
Swain, C. (2006). Preservice teachers’ self-assessment using technology: Determining what is worthwhile and looking for changes in daily teaching and learning practices. Journal of Technology and Teacher Education. 14(1), 29-59.
Vockley, M. (2007). Maximizing the impact: The pivotal role of technology in a 21st century education system. Retrieved October 2, 2011 from http://info.watertown.k12.ma.us/academics/documents/P21document-2007.pdf
Walker, E., Redmond, J., & Giles, M. (2010). Multivariate analysis of attitudes of elementary education teachers towards the environment, computers and E-learning. International Journal of Business Stud-ies, 18(1), 55-72. Retrieved October 2, 2011 from http://search.proquest.com/docview/821544280?accountid=10639
Wang, Y. (2009). A case study of an accelerated blended teacher education program. Dissertation Ab-stracts International, Retrieved October 2, 2011, from http://www.scribd.com/doc/30902662/E-learning-on-Teacher-Education (UMI No. 3358950).
Wilson, E. (2003). Preservice secondary social studies teachers and technology integration: What do they think and do in their field experiences? Journal of Computing in Teacher Education, 20(1), 29-39.
Wright, V., & Wilson, E. (Winter 2005-2006). From preservice to inservice teaching: A study of technol-ogy integration. Journal of Computing in Teacher Education, 22(2), 49-55.
Yeh, Y. C. (2007). Integrating e-learning into the direct instruction model to enhance the effectiveness of critical-thinking instruction. Instructional Science, 37, 185-203.
Zhao, Y. (2007). Social studies teachers’ perspectives of technology integration. Journal of Technology and Teacher Education, 15(3), 311-333.
136
Smith & Greene
Appendix
E-learning Survey This survey is being used to determine how the use of E-learning affects the performance of teacher education candidates in practicum settings. The survey will also determine the struggles, challenges and successes students experience in using and analyzing video in teacher education methods coursework.
Part one. Please tell us about yourself.
1. Please indicate your gender.
� Male
� Female
2. What is your age?
� 18-22
� 23-27
� 28-32
� 33-37
� 38+
3. How many years of experience do you have working with children in a classroom setting or in a tutoring situation? Do not include babysitting.
�� 0
�� less than1
�� 1-2
�� 2-3
�� 3-4
4. How many of your professors have instructed using some type of advanced technology (be-yond power points and Blackboard) and/or require you to use it?
�� none
�� a few
�� about half
�� most
�� all
Part two. Please tell us about your use of E-learning.
5. Indicate your experience and/or comfort level in using each Web 2.0 tool listed below. Use the following scale for your ratings: 5 - Proficient/Very Comfortable 4 - Developing/Somewhat Comfortable 3 - Developing/Somewhat Uncomfortable
137

Pre-Service Teachers Use E-learning Technologies
2 - Limited/ Uncomfortable 1 - Have not tried, but would like to learn 0 - I don't know what this is.
Experience/Comfort Level 5 4 3 2 1 0
Blogs (Blogger, Blogmeister) � � � � � �
Wikis (Wikispaces, PBWiki) � � � � � �
Social Bookmarking (Delicious, Digg) � � � � � �
Social Networking (Facebook, MySpace) � � � � � �
Microblogging (Twitter) � � � � � �
Online presentations (VoiceThread, Google Docs) � � � � � �
Videosharing (Video Clips, YouTube, TeacherTube) � � � � � �
Photosharing(Flikr, Picasa) � � � � � �
Web tours (Trailfire) � � � � � �
Podcasting - downloading and using (news feeds, NPR, iTunes) � � � � � �
Podcasting - creating and publishing (GarageBand, Audacity) � � � � � �
6. Have you used any of these tools to prepare or teach a lesson? Check all that apply
� blogs
� wikis
� social bookmarking
� social networking
� microblogging
� online presentations
� videosharing
� photosharing
� web tours
� podcasting - downloading and listening
� podcasting - creating and publishing
� Other ___________________________________
7. If you haven’t used any of the above or only a few, why have you not done more?
� no internet access in schools
� firewall
� never occurred to me
� I’m not comfortable with the technology
138
Smith & Greene
Part three. Please give us your opinion of the use of E-learning for teaching and learning.
8. For each of the statements below, indicate your level of agreement. Use the following scale for your ratings. SA - Strongly agree A - Agree D - Disagree SD - Strongly disagree N - No opinion or Not applicable
SA A D SD N
E-learning has improved my teaching during my practicum experience. � � � � �
The videosharing feedback from my peers helps me prepare better lesson plans.
� � � � �
I learn more about teaching by viewing my classmates’ video clips. � � � � �
I learn more about teaching by viewing my own video clips of teaching. � � � � �
I prefer videosharing feedback from my professor. � � � � �
I prefer videosharing feedback from my peers. � � � � �
Getting videosharing feedback from my peers and professors has helped me improve the delivery of my lessons.
� � � � �
I trust my peers evaluation of my teaching via video clips. � � � � �
I enjoy viewing video clips of my own teaching. � � � � �
I learn more about lesson planning by viewing the video clips of my peers’ teaching.
� � � � �
I have improved my teaching by viewing the video clips. � � � � �
I have access to the technology to participate fully in the videosharing activi-ties.
� � � � �
Videosharing has been easy to implement via Blackboard. � � � � �
Using videosharing has enabled the people in this class to learn a lot from one another.
� � � � �
I learn more about my students when viewing the video clips. � � � � �
I have a better understanding of how to teach because of the information I gained from viewing the video clips.
� � � � �
I enjoy using videosharing. � � � � �
In the future, I will use videosharing to reflect and improve on my teaching. � � � � �
I devoted a lot of effort to the videosharing experience � � � � �
139
Pre-Service Teachers Use E-learning Technologies
140
-
-
RA, and LRA
t
n 20 articles and has given over 40 presentations related to these topics.
Part four. Please reflect on your use of videosharing.
9. How often did you use the videosharing feedback to improve your lesson plans and teaching during your practicum experience?
� I did not use the feedback from the video clips.
� Once
� 2 - 5 times
� More than 5 times.
10. I prefer reflecting and improving my teaching using:
� traditional methods
� Videosharing techniques such as viewing video clips
��Both
11. Explain your answer to question 10.
______________________________________________________________
______________________________________________________________
______________________________________________________________
Thank you for completing the survey.
Biographies Dr. Judith J. Smith is an Assistant Professor in the College of Educa-tion, Department of Elementary Education and Middle Grades Educa-tion at East Carolina University, Greenville, N.C. Her research inter-ests include language/literacy, educational technology/21st century literacies, and teacher-education. Dr. Smith has published articles in In-sight: A Journal of Scholarly Teaching, The Delta Kappa Gamma Bulletin, Computers in the Schools, Current Issues in Education and Studying Teacher Education. She is a member of the Delta Kappa Gamma Society International, the Literacy Research Association, and the American Educational Research Association. She has presented nationally and internationally at AACTE, ELEARN, SITE, AE
Dr. H. Carol Greene is an Associate Professor of Education in the Department of Elementary Education and Middle Grades Education aEast Carolina University in Greenville, NC. She has a PhD in Educa-tional Psychology from Virginia Tech. Her research interests include technology in teacher education and working with children and fami-lies from poverty. She has published more tha
Journal of Information Technology Education: Research Volume 12, 2013
Editor: Benson Soong
Empowerment Patterns of Leaders in ICT and School Strengths Following the Implementation of
National ICT Reform
Tamar Shamir-Inbal Ministry of Education
Haifa University, Haifa, Israel
Orit Avidov-Ungar Achva Academic College Open University of Israel,
Israel
Executive Summary The Ministry of Education in Israel has, over the past two years, been running an education pro-gram designed to lead the implementation of ICT (Information and Communications Technology) in schools. Implementation of the program is accompanied by training and support of teachers selected to be ICT leaders. The role of the ICT leader is divided to two positions: (1) the School ICT Coordinator, in charge of ICT reform at their school, and (2) the Regional ICT Advisor, in charge at the district level and operating in several schools. Participants in the current research were 226 ICT leaders from one of the districts in Israel that participated in the ICT reform. The purpose of the study was to evaluate the contribution of the ICT reform on schools' ICT leaders and schools' strengths. We also had a theoretical basis for assuming that the ICT leaders will ex-perience personal empowerment as a result of their position and training. Thus, we set out to evaluate the personal empowerment patterns of ICT leaders and how they relate to the schools’ strengths. The strengths were identified using content analysis on ICT leaders' perceptions of the schools’ strengths. This analysis revealed nine fields in which the schools improved following the ICT plan: information sharing, student empowerment, dialogue, technological assimilation, teacher empowerment, management optimization, pedagogical change, bridging the gaps, and community visibility. These nine fields were categorized to three aspects of school change fol-lowing ICT reform: pedagogical, technological, and organizational aspects. The personal empow-erment of the ICT leaders was measured with an online questionnaire in which the ICT leaders reported their sense of learning and satisfaction as leaders of organizational change. This served as a measure of personal empowerment in the pedagogical and technological domains. The results showed that ICT leaders who reported pedagogical change at school also had significantly higher pedagogical and technological personal empowerment. We assume that these results represent a gradual model, in which the pedagogical strength is the end stage of the ICT implemen-
tation process. The findings highlight the importance of providing professional guidance for ICT leaders as messengers of innovative pedagogical perception in schools following ICT implementation. Also, they shed light in the process of ICT implementation and can help con-struct new ways of evaluating such pro-cesses.
Material published as part of this publication, either on-line or in print, is copyrighted by the Informing Science Institute. Permission to make digital or paper copy of part or all of these works for personal or classroom use is granted without fee provided that the copies are not made or distributed for profit or commercial advantage AND that copies 1) bear this notice in full and 2) give the full citation on the first page. It is per-missible to abstract these works so long as credit is given. To copy in all other cases or to republish or to post on a server or to redistribute to lists requires specific permission and payment of a fee. Contact [email protected] to request redistribution permission.
Empowerment Patterns of Leaders
142
Keywords: Empowerment, leaders in ICT, school's strengths, innovative pedagogy, TCPK (Technological and Pedagogical Knowledge), ICT reform.
Introduction The digital age we live in leads to the introduction of far-reaching changes that affect the way we live. Educators around the world and in Israel are looking for ways to adapt the education system to the social and cultural changes following the digital age (Avidov-Ungar & Eshet-Alkalai, 2011a, 2011b; Kozma, 2008). For the last two years, the Israeli Ministry of Education has been running an educational program called "Adjusting the education system to the 21st century". The purpose of this program is to implement innovative technology in schools in order to improve the quality of teaching and learn-ing. This program has a comprehensive approach which focuses on organizational, technological, and pedagogical aspects. The main elements of the program are the following: integrating ICT in the learning environment; using the school's portal as a communication tool between school staff, parents and students; digital communication within the school community and beyond; imple-menting online pedagogical management systems; and practice on ethics issues regarding the use of ICT (Israeli Ministry of Education, 2012). The national ICT program is being implemented in Israel in the years 2010-2012 to approximately 800 schools in two districts.
Implementation of the program in schools is accompanied by guidance and support of teachers selected to be ICT leaders. There are two ICT leader positions. The first, called "School ICT Coordinator", are school teachers selected by the Ministry of Education to lead the national ICT reform at the school level. The School ICT Coordinator is a key figure in school and the princi-pal’s "right hand" in every aspect of instilling a culture of ICT in the school. In the technological domain, the School ICT Coordinator serves as a guide for teachers, helping them acquire new technological tools. In the pedagogical domain, the Coordinator’s role is to guide teachers to use ICT in an intelligent way and incorporate this tool in their lessons. This role requires both guid-ance on the ICT material available for the teachers and instructing them on how to design their own ICT-based lessons. The main purpose is to incorporate ICT in a way that provides added value to the pedagogy. In the organizational- managerial domain, the School ICT Coordinator is involved in decision making and helps the principal to monitor the performance required within the program outputs. The second position is "Regional ICT Advisor". These are ICT leaders who function at the regional level. Each Regional ICT Advisor is in charge of numerous schools, and the advisors’ role is to be the link between the national program requirements and the needs of every specific school. Thus, the advisors can serve as a "bridge" that can help facilitate the successful implementation of ICT reform in schools. The Regional ICT Advisor works with the principal and the School ICT Coordinator to provide guidance and support in the pedagogical, technological and organizational-managerial domains.
In order to ensure that the ICT leaders were suitable to lead the national ICT reform, they had to acquire Technology Pedagogy Content Knowledge (TPCK). This knowledge is critical for the effective implementation of innovative technology in schools (Doering, Veletsianos, Scharber, & Miller, 2009; Mishra & Koehler, 2006; Polly & Mims, 2009) and is critical for their personal em-powerment as leaders of an organizational change (Cribner, Truell, Hager, & Srichai, 2001). In educational systems, there is often an in-built resistance to organizational change. This re-sistance is ingrained in the structure, culture and climate of the school (Carter, 2008; Fullan, 2001; Levin & Fullan, 2008). Studies conducted on the implementation of innovative technolo-gies at schools reveal that the implementation process is often established in a top-down manner. In this top-down process, the teachers' opinions are not taken into account (Levin & Fullan, 2008; Tyack & Cuban, 1995) and there is no consideration given to the organization’s previous practice,
Avidov-Ungar & Shmir-Inbal
143
norms, and past experience with unsuccessful technological reforms (Levin & Fullan, 2008; Ogo-bonna & Harris, 2003; Vaillant, 2005; Zimmerman, 2006). Successful ICT implementation in-volves many factors (Hargreaves & Goodson, 2006) and is related to substantial cultural and or-ganizational change (Sarason, 1995; White, 2007), in which change is taking place at all levels of the organization and in its fundamental assumptions. The role of the ICT leader is critical for the effective implementation of organizational change, since the leaders serve as the key figures that can facilitate change in which ICT will become an integral part of the school’s norms and practic-es (Shamir-Inbal, Dayan, & Kalli, 2009).
Studies reveal that ICT implementation occurs at different rates and in different ways according to the teacher's specific profile (Mioduser, Nachmias, Forkosh, & Tubin, 2004; Peled, Kali, & Dori, 2007), but also in accordance with the school’s attitudes toward ICT as a tool for pedagogi-cal improvement (Shamir-Inbal et al., 2009). Also, it is known that the inclusion of teachers as ICT leaders and their sense of empowerment play a significant role in the successful implementa-tion of ICT at the school level (Avidov-Ungar & Eshet-Alkalai, 2011a; Vaillant, 2005).
Empowerment reflects an interactive process which occurs between the individual and his envi-ronment (Kieffer, 1983). The teacher undergoes a process of empowerment as a result of his own personal and professional development (Darling-Hammond & Bransford, 2005; Day & Gu, 2007). Thus, teacher empowerment is related to the specific circumstances each teacher experi-ences during his own professional development (Fraser, Kennedy, Reid, & Mckinney, 2007; Kennedy, 2005). The sense of empowerment is reflected through internal and external changes that empowered teachers undergo (Darling-Hammond, Wei, Andree, Richardson, & Orphanos, 2009). The empowerment is a process that is motivated by the teacher, co-workers, school organ-ization, and the nature of the interpersonal relationships at the workplace (Edwards, Green, & Lyons, 2002). This means that empowerment is a process that can be achieved by the individual itself, but is also enhanced through the organization and thus contributes to higher self-evaluation and more productivity at the organizational level (Hargreaves, 2005).
Studying the factors that affect the sense of empowerment can assist in understanding the contri-bution organizational changes have on personal empowerment (Kuijpers, Houtveen, & Wubbels, 2010). According to Avidov-Ungar & Friedman (2011) the main factors contributing to a sense of empowerment are the following: understanding the job requirements- teachers who felt em-powered were those who defined their professional success as resulting from their profound un-derstanding of their job requirements and expectations of them in that position; receiving system functions in the early stages of their career – empowered teachers were those who received additional responsibilities early in their career, leading to a sense of achievement and develop-ment in the organizational ranks; understanding experience is a significant human resource- empowered teachers acknowledged their career experience as a fundamental part of their profes-sionalism and as a means towards development up the organizational ranks; positive self-perception – the literature defines "self-perception" as the overview one has of one’s own abili-ties (Pajares & Miller, 1994). This overview is a complex evaluation, which is based on an indi-vidual’s direct and indirect attempts at self-evaluation and on how that individual is perceived by his significant others (Bandura, 1997 ) . Thus, feeling empowered involves a strong belief in one’s professional abilities and positive feedback from supervisors and co-workers. Growth-promoting school framework- from teachers’ interviews it seems that educational growth is a key variable in one’s sense of professional empowerment. The school framework, whether it is academic or professional, is important for growth and development. During this learning process teachers can achieve a reflective and retrospective approach on their own learning and practice during their careers (Pajares & Miller, 1994). The teachers mentioned this as a key element in their personal and professional development. Viewing the school as an organizational-systemic framework – most teachers perceive their role in a focused manner as in charge of classroom
Empowerment Patterns of Leaders
144
instruction. However, teachers who were assigned additional responsibilities early in their career perceived their professional position as a more complex one that can have an effect both on the classroom and the school as an organization. This systemic approach strengthens the sense of competence and enhances self-empowerment. Based on the factors of empowerment mentioned above, we have strong reason to assume that teachers receiving the position of "ICT leaders" are undergoing a process of professional empowerment resulting from their organizational position and educational training.
The inclusion of ICT leaders in schools has been acknowledged as a key element in successful ICT implementation (Fishman, Marx, Blumenfeld, Krajcik, & Soloway, 2004). The person cho-sen for the position of ICT leader should be a person with leadership qualities and be reliable and responsible. Also, these individuals should be involved in decision-making processes, receive full support from their superiors, and be part of a professional learning community (Hadjithoma-Garstka, 2011). The incorporation of an ICT leader who serves not only as a technological guide, but also helps school staff to integrate ICT as part of their daily job routine and as a pedagogical tool, is of great importance to schools. This helps teachers to better integrate ICT in their class-rooms and enables more teachers to be a part of this change, not only those considered as being "groundbreaking" teachers (Newhouse, 2010; Shamir-Inbal et al., 2009).
It is worth mentioning that all of the ICT leaders in this research are qualified teachers with tech-nological knowledge and experienced in implementation processes of ICT in educational do-mains. Those chosen as ICT leaders have accepted upon themselves this position, fully aware of the challenges such a role requires. Also, they were fully cooperative during their training. Thus, the assumption was that they will experience empowerment during their year of training and working as ICT leaders.
The main goal of this current research was to characterize the schools’ strengths following ICT implementation, as perceived by the ICT leaders themselves. Also, the research set out to reveal whether and how the personal empowerment of the ICT leaders will be related to the schools’ strengths following ICT implementation.
Methodology
Research Objectives This study’s goal is to examine the relationship between the personal empowerment experienced by ICT leaders and the schools’ strengths following ICT implementation. Based on the assump-tion that ICT leaders are undergoing a process of personal empowerment, this research distin-guishes between two dimensions of personal empowerment. The first, "technological empower-ment", is manifested in providing innovative tools, knowledge, and skills as leaders of the techno-logical assimilation process at the school. The second, "pedagogical empowerment", is manifest-ed in the understanding of the added value of ICT in teaching and a sense of leadership in the pedagogical domain. These personal empowerment dimensions will be evaluated in regard to their possible connection with school strengths following ICT implementation.
Participants The study was performed on one of the two districts in Israel that took part in the national ICT plan. A total of 226 ICT leaders participated (representing 46% of the total number of ICT leaders in the district). The ICT leaders were divided to three groups according to their position or senior-ity: School ICT Coordinators - new; School ICT Coordinators - senior; and Regional ICT Advi-sors. See Table 1 for a more detailed description of the groups.
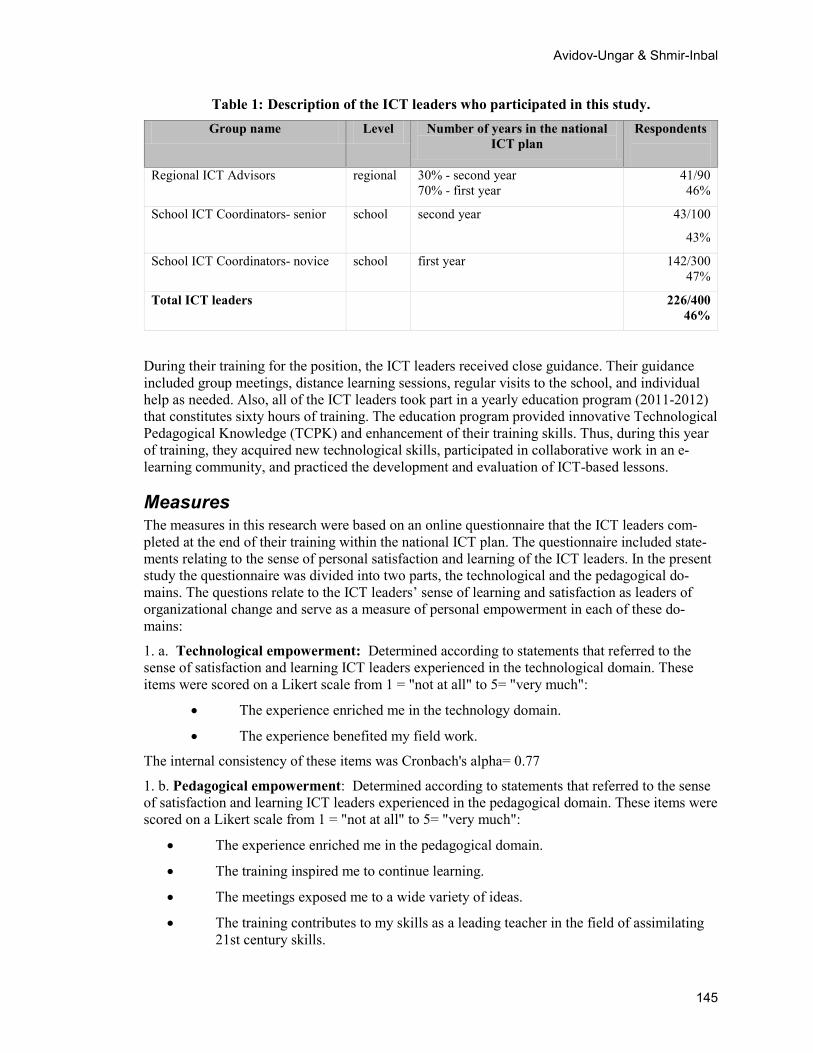
Avidov-Ungar & Shmir-Inbal
145
Table 1: Description of the ICT leaders who participated in this study. Group name Level Number of years in the national
ICT plan Respondents
Regional ICT Advisors regional 30% - second year 70% - first year
41/90 46%
School ICT Coordinators- senior school second year 43/100
43%
School ICT Coordinators- novice school first year 142/300 47%
Total ICT leaders 226/400 46%
During their training for the position, the ICT leaders received close guidance. Their guidance included group meetings, distance learning sessions, regular visits to the school, and individual help as needed. Also, all of the ICT leaders took part in a yearly education program (2011-2012) that constitutes sixty hours of training. The education program provided innovative Technological Pedagogical Knowledge (TCPK) and enhancement of their training skills. Thus, during this year of training, they acquired new technological skills, participated in collaborative work in an e-learning community, and practiced the development and evaluation of ICT-based lessons.
Measures The measures in this research were based on an online questionnaire that the ICT leaders com-pleted at the end of their training within the national ICT plan. The questionnaire included state-ments relating to the sense of personal satisfaction and learning of the ICT leaders. In the present study the questionnaire was divided into two parts, the technological and the pedagogical do-mains. The questions relate to the ICT leaders’ sense of learning and satisfaction as leaders of organizational change and serve as a measure of personal empowerment in each of these do-mains:
1. a. Technological empowerment: Determined according to statements that referred to the sense of satisfaction and learning ICT leaders experienced in the technological domain. These items were scored on a Likert scale from 1 = "not at all" to 5= "very much":
• The experience enriched me in the technology domain.
• The experience benefited my field work.
The internal consistency of these items was Cronbach's alpha= 0.77
1. b. Pedagogical empowerment: Determined according to statements that referred to the sense of satisfaction and learning ICT leaders experienced in the pedagogical domain. These items were scored on a Likert scale from 1 = "not at all" to 5= "very much":
• The experience enriched me in the pedagogical domain.
• The training inspired me to continue learning.
• The meetings exposed me to a wide variety of ideas.
• The training contributes to my skills as a leading teacher in the field of assimilating 21st century skills.
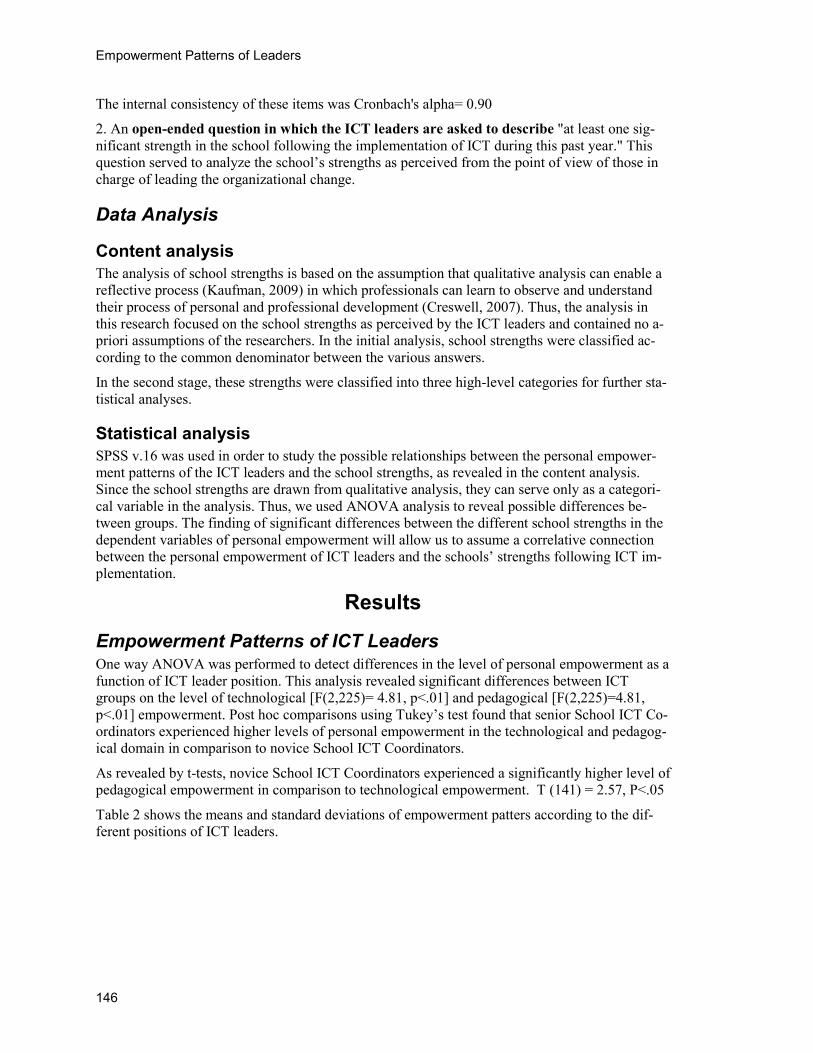
Empowerment Patterns of Leaders
146
The internal consistency of these items was Cronbach's alpha= 0.90
2. An open-ended question in which the ICT leaders are asked to describe "at least one sig-nificant strength in the school following the implementation of ICT during this past year." This question served to analyze the school’s strengths as perceived from the point of view of those in charge of leading the organizational change.
Data Analysis
Content analysis The analysis of school strengths is based on the assumption that qualitative analysis can enable a reflective process (Kaufman, 2009) in which professionals can learn to observe and understand their process of personal and professional development (Creswell, 2007). Thus, the analysis in this research focused on the school strengths as perceived by the ICT leaders and contained no a-priori assumptions of the researchers. In the initial analysis, school strengths were classified ac-cording to the common denominator between the various answers.
In the second stage, these strengths were classified into three high-level categories for further sta-tistical analyses.
Statistical analysis SPSS v.16 was used in order to study the possible relationships between the personal empower-ment patterns of the ICT leaders and the school strengths, as revealed in the content analysis. Since the school strengths are drawn from qualitative analysis, they can serve only as a categori-cal variable in the analysis. Thus, we used ANOVA analysis to reveal possible differences be-tween groups. The finding of significant differences between the different school strengths in the dependent variables of personal empowerment will allow us to assume a correlative connection between the personal empowerment of ICT leaders and the schools’ strengths following ICT im-plementation.
Results
Empowerment Patterns of ICT Leaders One way ANOVA was performed to detect differences in the level of personal empowerment as a function of ICT leader position. This analysis revealed significant differences between ICT groups on the level of technological [F(2,225)= 4.81, p<.01] and pedagogical [F(2,225)=4.81, p<.01] empowerment. Post hoc comparisons using Tukey’s test found that senior School ICT Co-ordinators experienced higher levels of personal empowerment in the technological and pedagog-ical domain in comparison to novice School ICT Coordinators.
As revealed by t-tests, novice School ICT Coordinators experienced a significantly higher level of pedagogical empowerment in comparison to technological empowerment. T (141) = 2.57, P<.05
Table 2 shows the means and standard deviations of empowerment patters according to the dif-ferent positions of ICT leaders.
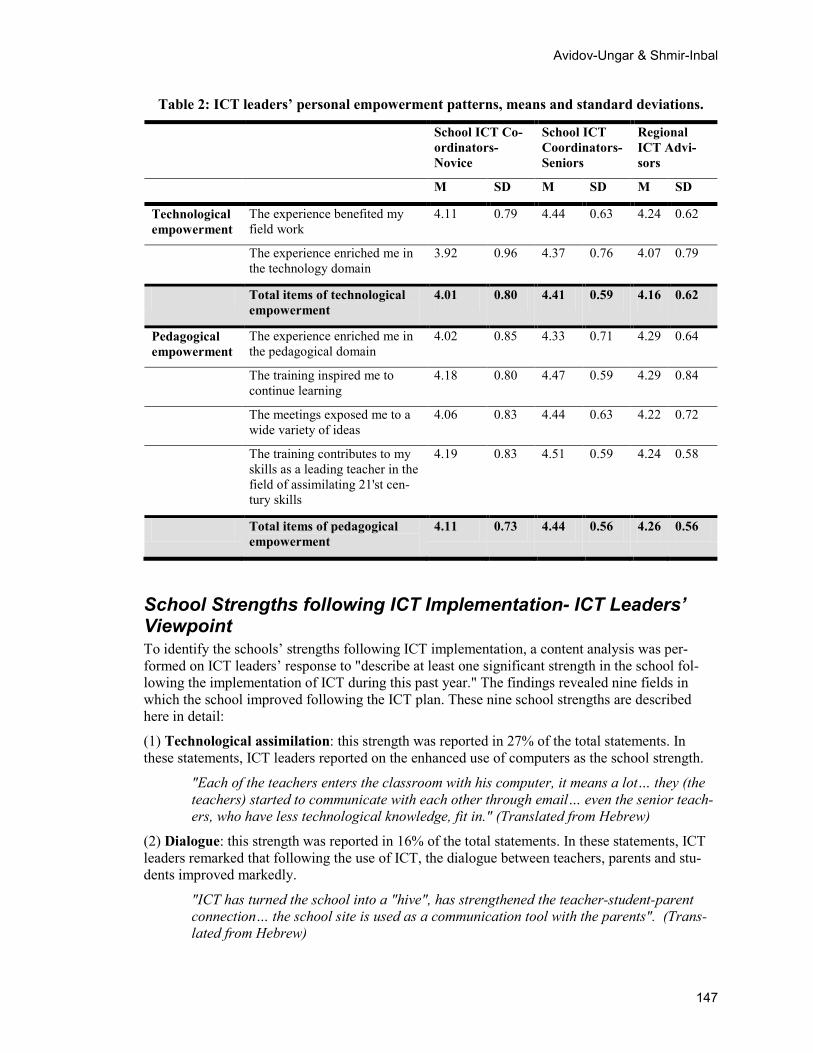
Avidov-Ungar & Shmir-Inbal
147
Table 2: ICT leaders’ personal empowerment patterns, means and standard deviations.
School ICT Co-ordinators- Novice
School ICT Coordinators- Seniors
Regional ICT Advi-sors
M SD M SD M SD
Technological empowerment
The experience benefited my field work
4.11 0.79 4.44 0.63 4.24 0.62
The experience enriched me in the technology domain
3.92 0.96 4.37 0.76 4.07 0.79
Total items of technological empowerment
4.01 0.80 4.41 0.59 4.16 0.62
Pedagogical empowerment
The experience enriched me in the pedagogical domain
4.02 0.85 4.33 0.71 4.29 0.64
The training inspired me to continue learning
4.18 0.80 4.47 0.59 4.29 0.84
The meetings exposed me to a wide variety of ideas
4.06 0.83 4.44 0.63 4.22 0.72
The training contributes to my skills as a leading teacher in the field of assimilating 21'st cen-tury skills
4.19 0.83 4.51 0.59 4.24 0.58
Total items of pedagogical empowerment
4.11 0.73 4.44 0.56 4.26 0.56
School Strengths following ICT Implementation- ICT Leaders’ Viewpoint To identify the schools’ strengths following ICT implementation, a content analysis was per-formed on ICT leaders’ response to "describe at least one significant strength in the school fol-lowing the implementation of ICT during this past year." The findings revealed nine fields in which the school improved following the ICT plan. These nine school strengths are described here in detail:
(1) Technological assimilation: this strength was reported in 27% of the total statements. In these statements, ICT leaders reported on the enhanced use of computers as the school strength.
"Each of the teachers enters the classroom with his computer, it means a lot… they (the teachers) started to communicate with each other through email… even the senior teach-ers, who have less technological knowledge, fit in." (Translated from Hebrew)
(2) Dialogue: this strength was reported in 16% of the total statements. In these statements, ICT leaders remarked that following the use of ICT, the dialogue between teachers, parents and stu-dents improved markedly.
"ICT has turned the school into a "hive", has strengthened the teacher-student-parent connection… the school site is used as a communication tool with the parents". (Trans-lated from Hebrew)
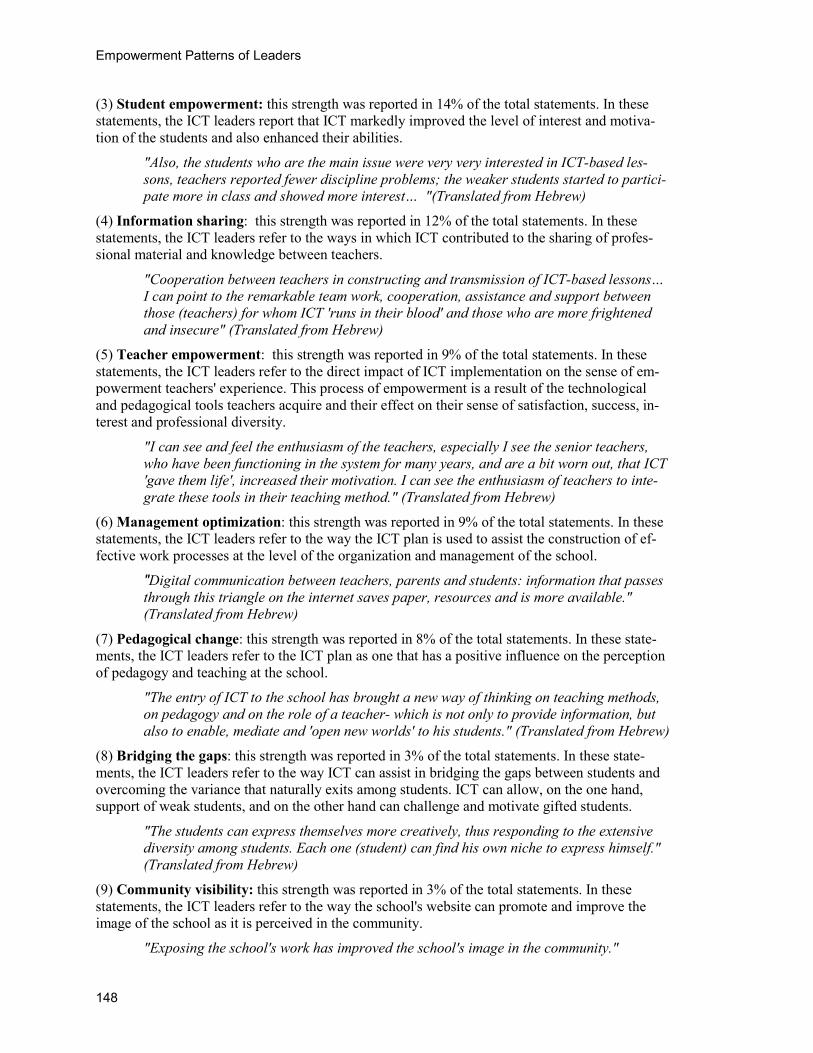
Empowerment Patterns of Leaders
148
(3) Student empowerment: this strength was reported in 14% of the total statements. In these statements, the ICT leaders report that ICT markedly improved the level of interest and motiva-tion of the students and also enhanced their abilities.
"Also, the students who are the main issue were very very interested in ICT-based les-sons, teachers reported fewer discipline problems; the weaker students started to partici-pate more in class and showed more interest… "(Translated from Hebrew)
(4) Information sharing: this strength was reported in 12% of the total statements. In these statements, the ICT leaders refer to the ways in which ICT contributed to the sharing of profes-sional material and knowledge between teachers.
"Cooperation between teachers in constructing and transmission of ICT-based lessons… I can point to the remarkable team work, cooperation, assistance and support between those (teachers) for whom ICT 'runs in their blood' and those who are more frightened and insecure" (Translated from Hebrew)
(5) Teacher empowerment: this strength was reported in 9% of the total statements. In these statements, the ICT leaders refer to the direct impact of ICT implementation on the sense of em-powerment teachers' experience. This process of empowerment is a result of the technological and pedagogical tools teachers acquire and their effect on their sense of satisfaction, success, in-terest and professional diversity.
"I can see and feel the enthusiasm of the teachers, especially I see the senior teachers, who have been functioning in the system for many years, and are a bit worn out, that ICT 'gave them life', increased their motivation. I can see the enthusiasm of teachers to inte-grate these tools in their teaching method." (Translated from Hebrew)
(6) Management optimization: this strength was reported in 9% of the total statements. In these statements, the ICT leaders refer to the way the ICT plan is used to assist the construction of ef-fective work processes at the level of the organization and management of the school.
"Digital communication between teachers, parents and students: information that passes through this triangle on the internet saves paper, resources and is more available." (Translated from Hebrew)
(7) Pedagogical change: this strength was reported in 8% of the total statements. In these state-ments, the ICT leaders refer to the ICT plan as one that has a positive influence on the perception of pedagogy and teaching at the school.
"The entry of ICT to the school has brought a new way of thinking on teaching methods, on pedagogy and on the role of a teacher- which is not only to provide information, but also to enable, mediate and 'open new worlds' to his students." (Translated from Hebrew)
(8) Bridging the gaps: this strength was reported in 3% of the total statements. In these state-ments, the ICT leaders refer to the way ICT can assist in bridging the gaps between students and overcoming the variance that naturally exits among students. ICT can allow, on the one hand, support of weak students, and on the other hand can challenge and motivate gifted students.
"The students can express themselves more creatively, thus responding to the extensive diversity among students. Each one (student) can find his own niche to express himself." (Translated from Hebrew)
(9) Community visibility: this strength was reported in 3% of the total statements. In these statements, the ICT leaders refer to the way the school's website can promote and improve the image of the school as it is perceived in the community.
"Exposing the school's work has improved the school's image in the community."
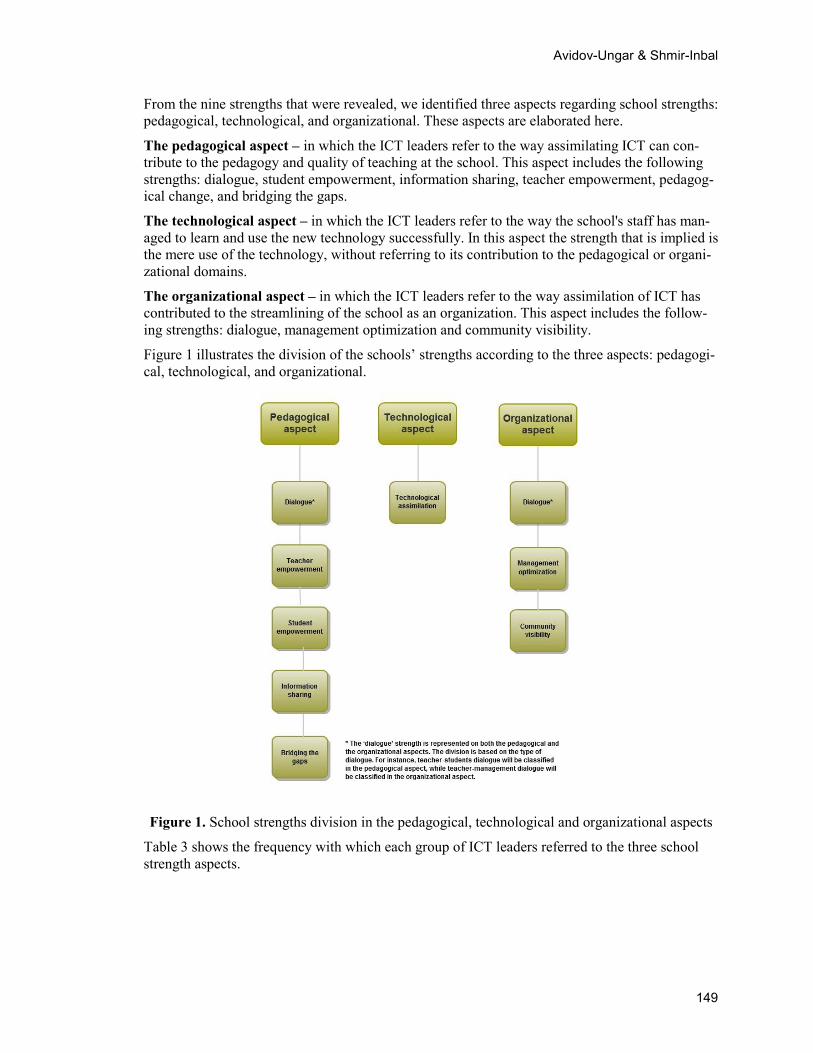
Avidov-Ungar & Shmir-Inbal
149
From the nine strengths that were revealed, we identified three aspects regarding school strengths: pedagogical, technological, and organizational. These aspects are elaborated here. The pedagogical aspect – in which the ICT leaders refer to the way assimilating ICT can con-tribute to the pedagogy and quality of teaching at the school. This aspect includes the following strengths: dialogue, student empowerment, information sharing, teacher empowerment, pedagog-ical change, and bridging the gaps.
The technological aspect – in which the ICT leaders refer to the way the school's staff has man-aged to learn and use the new technology successfully. In this aspect the strength that is implied is the mere use of the technology, without referring to its contribution to the pedagogical or organi-zational domains.
The organizational aspect – in which the ICT leaders refer to the way assimilation of ICT has contributed to the streamlining of the school as an organization. This aspect includes the follow-ing strengths: dialogue, management optimization and community visibility.
Figure 1 illustrates the division of the schools’ strengths according to the three aspects: pedagogi-cal, technological, and organizational.
Figure 1. School strengths division in the pedagogical, technological and organizational aspects
Table 3 shows the frequency with which each group of ICT leaders referred to the three school strength aspects.
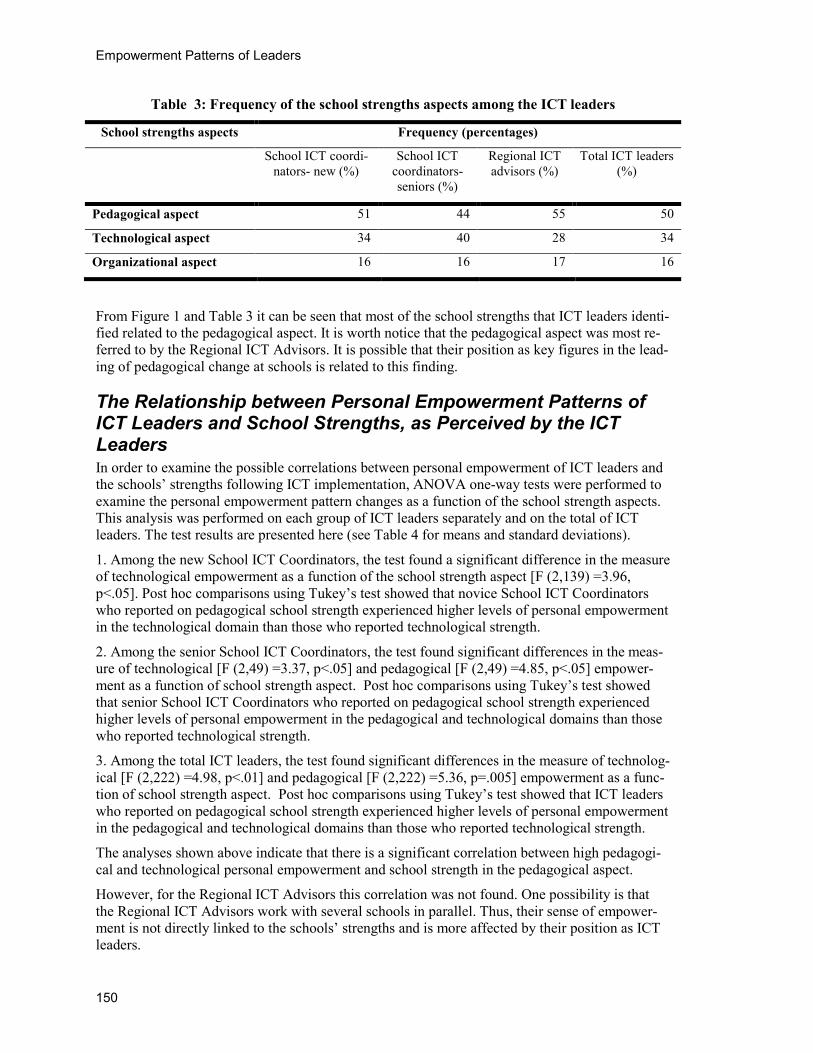
Empowerment Patterns of Leaders
150
Table 3: Frequency of the school strengths aspects among the ICT leaders School strengths aspects Frequency (percentages)
School ICT coordi-nators- new (%)
School ICT coordinators- seniors (%)
Regional ICT advisors (%)
Total ICT leaders (%)
Pedagogical aspect 51 44 55 50
Technological aspect 34 40 28 34
Organizational aspect 16 16 17 16
From Figure 1 and Table 3 it can be seen that most of the school strengths that ICT leaders identi-fied related to the pedagogical aspect. It is worth notice that the pedagogical aspect was most re-ferred to by the Regional ICT Advisors. It is possible that their position as key figures in the lead-ing of pedagogical change at schools is related to this finding.
The Relationship between Personal Empowerment Patterns of ICT Leaders and School Strengths, as Perceived by the ICT Leaders In order to examine the possible correlations between personal empowerment of ICT leaders and the schools’ strengths following ICT implementation, ANOVA one-way tests were performed to examine the personal empowerment pattern changes as a function of the school strength aspects. This analysis was performed on each group of ICT leaders separately and on the total of ICT leaders. The test results are presented here (see Table 4 for means and standard deviations).
1. Among the new School ICT Coordinators, the test found a significant difference in the measure of technological empowerment as a function of the school strength aspect [F (2,139) =3.96, p<.05]. Post hoc comparisons using Tukey’s test showed that novice School ICT Coordinators who reported on pedagogical school strength experienced higher levels of personal empowerment in the technological domain than those who reported technological strength.
2. Among the senior School ICT Coordinators, the test found significant differences in the meas-ure of technological [F (2,49) =3.37, p<.05] and pedagogical [F (2,49) =4.85, p<.05] empower-ment as a function of school strength aspect. Post hoc comparisons using Tukey’s test showed that senior School ICT Coordinators who reported on pedagogical school strength experienced higher levels of personal empowerment in the pedagogical and technological domains than those who reported technological strength.
3. Among the total ICT leaders, the test found significant differences in the measure of technolog-ical [F (2,222) =4.98, p<.01] and pedagogical [F (2,222) =5.36, p=.005] empowerment as a func-tion of school strength aspect. Post hoc comparisons using Tukey’s test showed that ICT leaders who reported on pedagogical school strength experienced higher levels of personal empowerment in the pedagogical and technological domains than those who reported technological strength.
The analyses shown above indicate that there is a significant correlation between high pedagogi-cal and technological personal empowerment and school strength in the pedagogical aspect. However, for the Regional ICT Advisors this correlation was not found. One possibility is that the Regional ICT Advisors work with several schools in parallel. Thus, their sense of empower-ment is not directly linked to the schools’ strengths and is more affected by their position as ICT leaders.
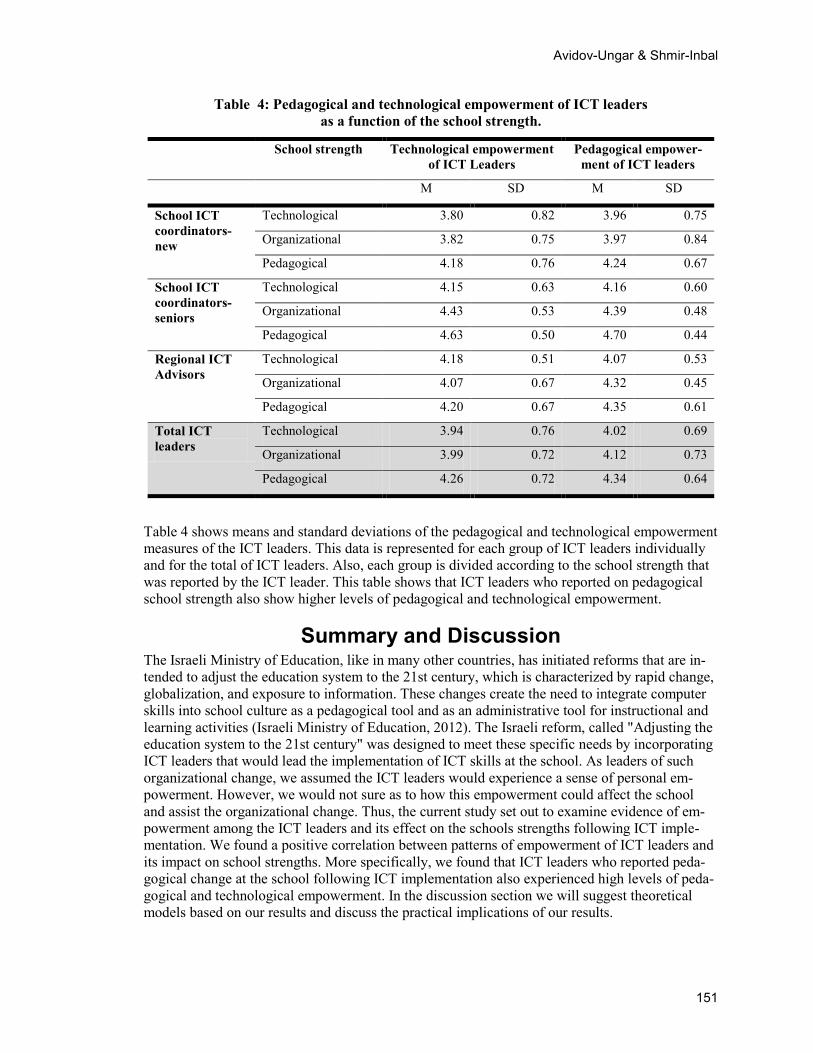
Avidov-Ungar & Shmir-Inbal
151
Table 4: Pedagogical and technological empowerment of ICT leaders as a function of the school strength.
School strength Technological empowerment of ICT Leaders
Pedagogical empower-ment of ICT leaders
M SD M SD
School ICT coordinators- new
Technological 3.80 0.82 3.96 0.75
Organizational 3.82 0.75 3.97 0.84
Pedagogical 4.18 0.76 4.24 0.67
School ICT coordinators- seniors
Technological 4.15 0.63 4.16 0.60
Organizational 4.43 0.53 4.39 0.48
Pedagogical 4.63 0.50 4.70 0.44
Regional ICT Advisors
Technological 4.18 0.51 4.07 0.53
Organizational 4.07 0.67 4.32 0.45
Pedagogical 4.20 0.67 4.35 0.61
Total ICT leaders
Technological 3.94 0.76 4.02 0.69
Organizational 3.99 0.72 4.12 0.73
Pedagogical 4.26 0.72 4.34 0.64
Table 4 shows means and standard deviations of the pedagogical and technological empowerment measures of the ICT leaders. This data is represented for each group of ICT leaders individually and for the total of ICT leaders. Also, each group is divided according to the school strength that was reported by the ICT leader. This table shows that ICT leaders who reported on pedagogical school strength also show higher levels of pedagogical and technological empowerment.
Summary and Discussion The Israeli Ministry of Education, like in many other countries, has initiated reforms that are in-tended to adjust the education system to the 21st century, which is characterized by rapid change, globalization, and exposure to information. These changes create the need to integrate computer skills into school culture as a pedagogical tool and as an administrative tool for instructional and learning activities (Israeli Ministry of Education, 2012). The Israeli reform, called "Adjusting the education system to the 21st century" was designed to meet these specific needs by incorporating ICT leaders that would lead the implementation of ICT skills at the school. As leaders of such organizational change, we assumed the ICT leaders would experience a sense of personal em-powerment. However, we would not sure as to how this empowerment could affect the school and assist the organizational change. Thus, the current study set out to examine evidence of em-powerment among the ICT leaders and its effect on the schools strengths following ICT imple-mentation. We found a positive correlation between patterns of empowerment of ICT leaders and its impact on school strengths. More specifically, we found that ICT leaders who reported peda-gogical change at the school following ICT implementation also experienced high levels of peda-gogical and technological empowerment. In the discussion section we will suggest theoretical models based on our results and discuss the practical implications of our results.

Empowerment Patterns of Leaders
152
Dimensions of Leaders' Empowerment and its Impact on School Strengths The findings suggest that ICT leaders - School ICT Coordinators, both novice and seniors, and Regional ICT Advisors - experienced a sense of empowerment stemming from the year of the training and guiding process. Pedagogical empowerment was reported as significantly higher than empowerment focused on technology alone. In fact, we can say that ICT leaders reported em-powerment sensed due to the acquisition of technological pedagogical knowledge as it is present-ed by Mishra & Koehler (2006). This innovative knowledge is required from all teachers who intend to implement technology in their instruction in order to enrich their pedagogical work and make it up-to-date.
In addition to the above, it should be noted that the findings indicate that the seniors ICT school leaders reported a higher empowerment experience combining pedagogical and technological teaching, than the new ICT school leaders. This finding demonstrates the importance of long-term processes for optimal implementation of ICT as a tool for empowerment pedagogy (Shamir-Inbal & Kally, 2011). The current study demonstrates a positive correlation between empowerment of ICT leaders and implementing of school strengths. Thus, our results suggest that the empowerment of the ICT leaders has contributed to the enhancement of pedagogical change at the school. Similar effects were found in studies that showed that empowering teachers has positive effect on organizational change and growth (e.g., Enderlin-Lampe, 2002; Irwin, 1996). Also, this correlation suggests the other direction is possible as well. Meaning, the schools strengths following the ICT implementa-tion could contribute to the ICT leaders' sense of empowerment. Schools' staff tends to relate or-ganizational success as a personal achievement and as such, it contributes to their personal em-powerment as well (Avidov-Ungar, Friedman, & Olstein, 2011). Clearly, ICT leaders could also assert their personal contribution to the process of ICT implementation at the school. Thus, we assumed that ICT leaders' empowerment and school strengths are related processes that affect each other continuously in a cycle of impact. This cycle reinforces both the leaders and the schools. We also believe that this cycle of mutual influence enables the leaders to be a bridge be-tween the demands of the system (top-down) and the needs of the school - the accepted norms, the staff and its motivation (bottom-up) (Fishman et al., 2004). Figure 2 illustrates the manner in which this mutual influence occurs.
Figure 2: Contact circuits between self-empowerment of ICT leaders and school strengths.
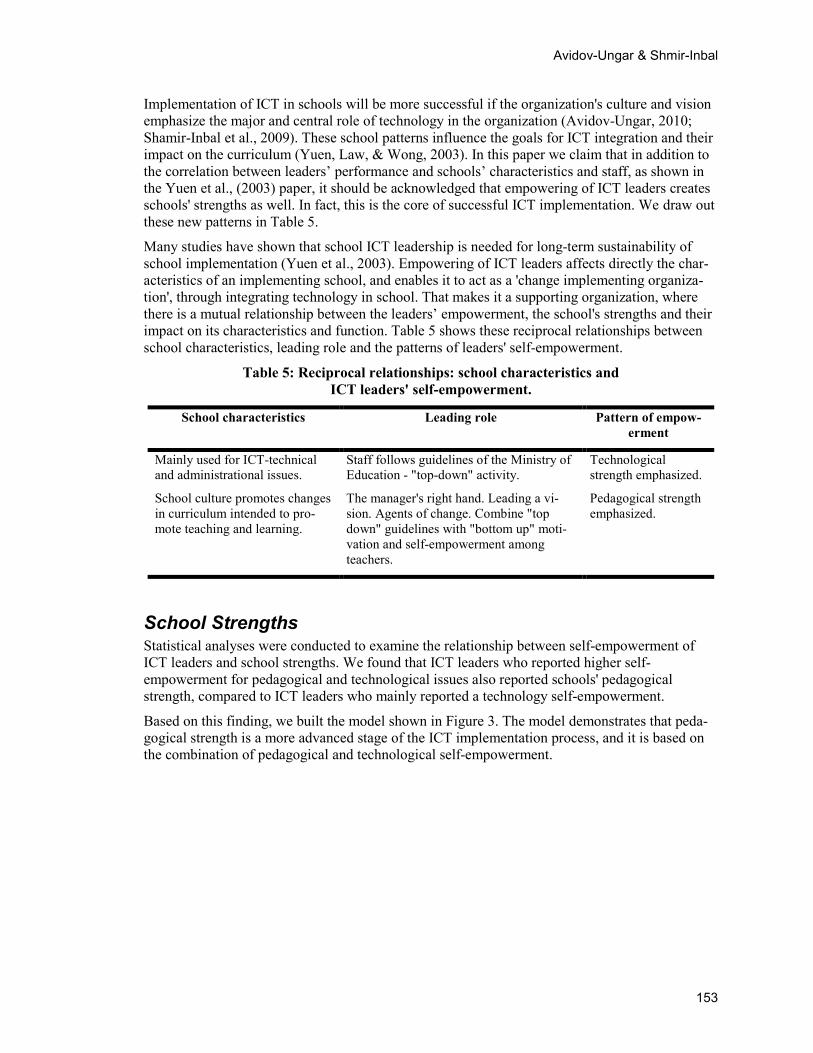
Avidov-Ungar & Shmir-Inbal
153
Implementation of ICT in schools will be more successful if the organization's culture and vision emphasize the major and central role of technology in the organization (Avidov-Ungar, 2010; Shamir-Inbal et al., 2009). These school patterns influence the goals for ICT integration and their impact on the curriculum (Yuen, Law, & Wong, 2003). In this paper we claim that in addition to the correlation between leaders’ performance and schools’ characteristics and staff, as shown in the Yuen et al., (2003) paper, it should be acknowledged that empowering of ICT leaders creates schools' strengths as well. In fact, this is the core of successful ICT implementation. We draw out these new patterns in Table 5. Many studies have shown that school ICT leadership is needed for long-term sustainability of school implementation (Yuen et al., 2003). Empowering of ICT leaders affects directly the char-acteristics of an implementing school, and enables it to act as a 'change implementing organiza-tion', through integrating technology in school. That makes it a supporting organization, where there is a mutual relationship between the leaders’ empowerment, the school's strengths and their impact on its characteristics and function. Table 5 shows these reciprocal relationships between school characteristics, leading role and the patterns of leaders' self-empowerment.
Table 5: Reciprocal relationships: school characteristics and ICT leaders' self-empowerment.
Pattern of empow-erment
Leading role School characteristics
Technological strength emphasized.
Staff follows guidelines of the Ministry of Education - "top-down" activity.
Mainly used for ICT-technical and administrational issues.
Pedagogical strength emphasized.
The manager's right hand. Leading a vi-sion. Agents of change. Combine "top down" guidelines with "bottom up" moti-vation and self-empowerment among teachers.
School culture promotes changes in curriculum intended to pro-mote teaching and learning.
School Strengths Statistical analyses were conducted to examine the relationship between self-empowerment of ICT leaders and school strengths. We found that ICT leaders who reported higher self-empowerment for pedagogical and technological issues also reported schools' pedagogical strength, compared to ICT leaders who mainly reported a technology self-empowerment.
Based on this finding, we built the model shown in Figure 3. The model demonstrates that peda-gogical strength is a more advanced stage of the ICT implementation process, and it is based on the combination of pedagogical and technological self-empowerment.
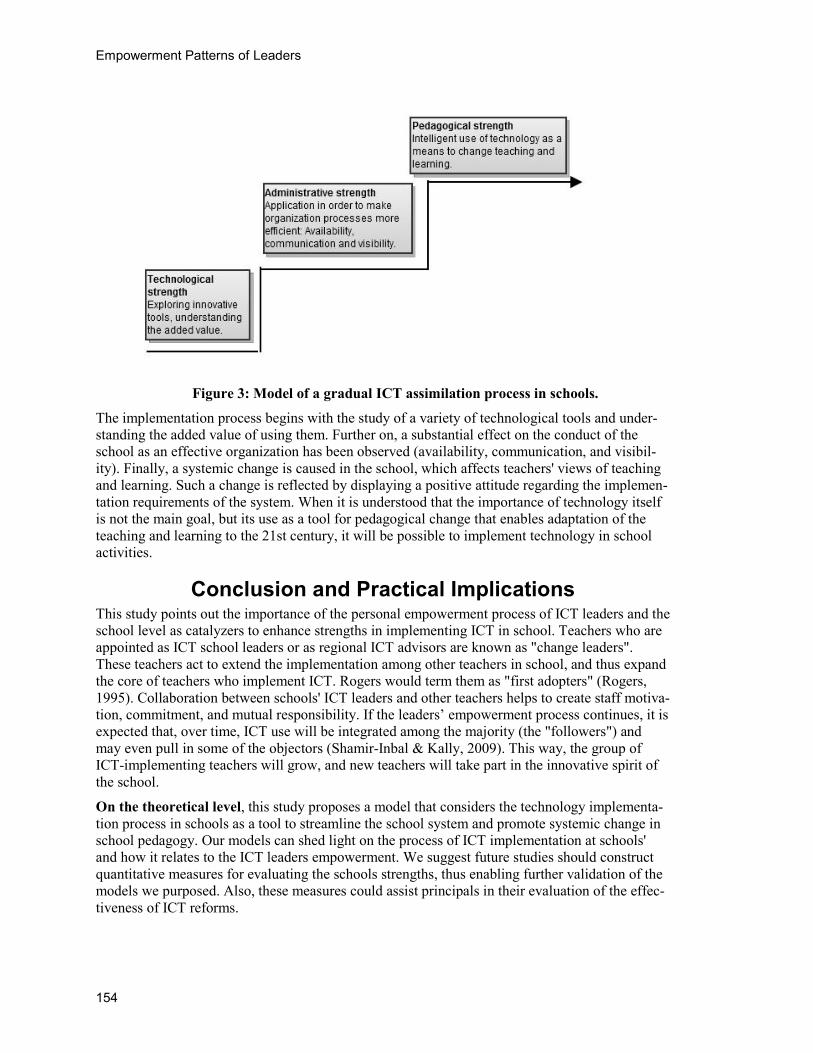
Empowerment Patterns of Leaders
154
Figure 3: Model of a gradual ICT assimilation process in schools.
The implementation process begins with the study of a variety of technological tools and under-standing the added value of using them. Further on, a substantial effect on the conduct of the school as an effective organization has been observed (availability, communication, and visibil-ity). Finally, a systemic change is caused in the school, which affects teachers' views of teaching and learning. Such a change is reflected by displaying a positive attitude regarding the implemen-tation requirements of the system. When it is understood that the importance of technology itself is not the main goal, but its use as a tool for pedagogical change that enables adaptation of the teaching and learning to the 21st century, it will be possible to implement technology in school activities.
Conclusion and Practical Implications This study points out the importance of the personal empowerment process of ICT leaders and the school level as catalyzers to enhance strengths in implementing ICT in school. Teachers who are appointed as ICT school leaders or as regional ICT advisors are known as "change leaders". These teachers act to extend the implementation among other teachers in school, and thus expand the core of teachers who implement ICT. Rogers would term them as "first adopters" (Rogers, 1995). Collaboration between schools' ICT leaders and other teachers helps to create staff motiva-tion, commitment, and mutual responsibility. If the leaders’ empowerment process continues, it is expected that, over time, ICT use will be integrated among the majority (the "followers") and may even pull in some of the objectors (Shamir-Inbal & Kally, 2009). This way, the group of ICT-implementing teachers will grow, and new teachers will take part in the innovative spirit of the school.
On the theoretical level, this study proposes a model that considers the technology implementa-tion process in schools as a tool to streamline the school system and promote systemic change in school pedagogy. Our models can shed light on the process of ICT implementation at schools' and how it relates to the ICT leaders empowerment. We suggest future studies should construct quantitative measures for evaluating the schools strengths, thus enabling further validation of the models we purposed. Also, these measures could assist principals in their evaluation of the effec-tiveness of ICT reforms.
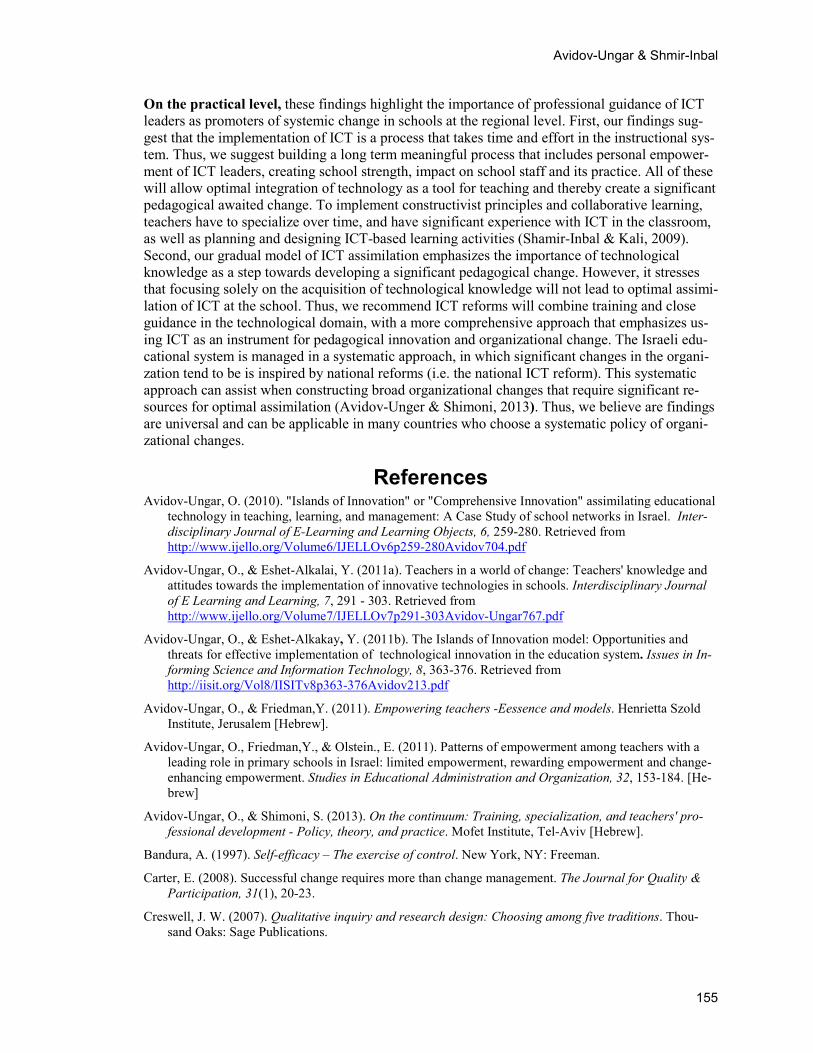
Avidov-Ungar & Shmir-Inbal
155
On the practical level, these findings highlight the importance of professional guidance of ICT leaders as promoters of systemic change in schools at the regional level. First, our findings sug-gest that the implementation of ICT is a process that takes time and effort in the instructional sys-tem. Thus, we suggest building a long term meaningful process that includes personal empower-ment of ICT leaders, creating school strength, impact on school staff and its practice. All of these will allow optimal integration of technology as a tool for teaching and thereby create a significant pedagogical awaited change. To implement constructivist principles and collaborative learning, teachers have to specialize over time, and have significant experience with ICT in the classroom, as well as planning and designing ICT-based learning activities (Shamir-Inbal & Kali, 2009). Second, our gradual model of ICT assimilation emphasizes the importance of technological knowledge as a step towards developing a significant pedagogical change. However, it stresses that focusing solely on the acquisition of technological knowledge will not lead to optimal assimi-lation of ICT at the school. Thus, we recommend ICT reforms will combine training and close guidance in the technological domain, with a more comprehensive approach that emphasizes us-ing ICT as an instrument for pedagogical innovation and organizational change. The Israeli edu-cational system is managed in a systematic approach, in which significant changes in the organi-zation tend to be is inspired by national reforms (i.e. the national ICT reform). This systematic approach can assist when constructing broad organizational changes that require significant re-sources for optimal assimilation (Avidov-Unger & Shimoni, 2013). Thus, we believe are findings are universal and can be applicable in many countries who choose a systematic policy of organi-zational changes.
References Avidov-Ungar, O. (2010). "Islands of Innovation" or "Comprehensive Innovation" assimilating educational
technology in teaching, learning, and management: A Case Study of school networks in Israel. Inter-disciplinary Journal of E-Learning and Learning Objects, 6, 259-280. Retrieved from http://www.ijello.org/Volume6/IJELLOv6p259-280Avidov704.pdf
Avidov-Ungar, O., & Eshet-Alkalai, Y. (2011a). Teachers in a world of change: Teachers' knowledge and attitudes towards the implementation of innovative technologies in schools. Interdisciplinary Journal of E Learning and Learning, 7, 291 - 303. Retrieved from http://www.ijello.org/Volume7/IJELLOv7p291-303Avidov-Ungar767.pdf
Avidov-Ungar, O., & Eshet-Alkakay, Y. (2011b). The Islands of Innovation model: Opportunities and threats for effective implementation of technological innovation in the education system. Issues in In-forming Science and Information Technology, 8, 363-376. Retrieved from http://iisit.org/Vol8/IISITv8p363-376Avidov213.pdf
Avidov-Ungar, O., & Friedman,Y. (2011). Empowering teachers -Eessence and models. Henrietta Szold Institute, Jerusalem [Hebrew].
Avidov-Ungar, O., Friedman,Y., & Olstein., E. (2011). Patterns of empowerment among teachers with a leading role in primary schools in Israel: limited empowerment, rewarding empowerment and change-enhancing empowerment. Studies in Educational Administration and Organization, 32, 153-184. [He-brew]
Avidov-Ungar, O., & Shimoni, S. (2013). On the continuum: Training, specialization, and teachers' pro-fessional development - Policy, theory, and practice. Mofet Institute, Tel-Aviv [Hebrew].
Bandura, A. (1997). Self-efficacy – The exercise of control. New York, NY: Freeman.
Carter, E. (2008). Successful change requires more than change management. The Journal for Quality & Participation, 31(1), 20-23.
Creswell, J. W. (2007). Qualitative inquiry and research design: Choosing among five traditions. Thou-sand Oaks: Sage Publications.
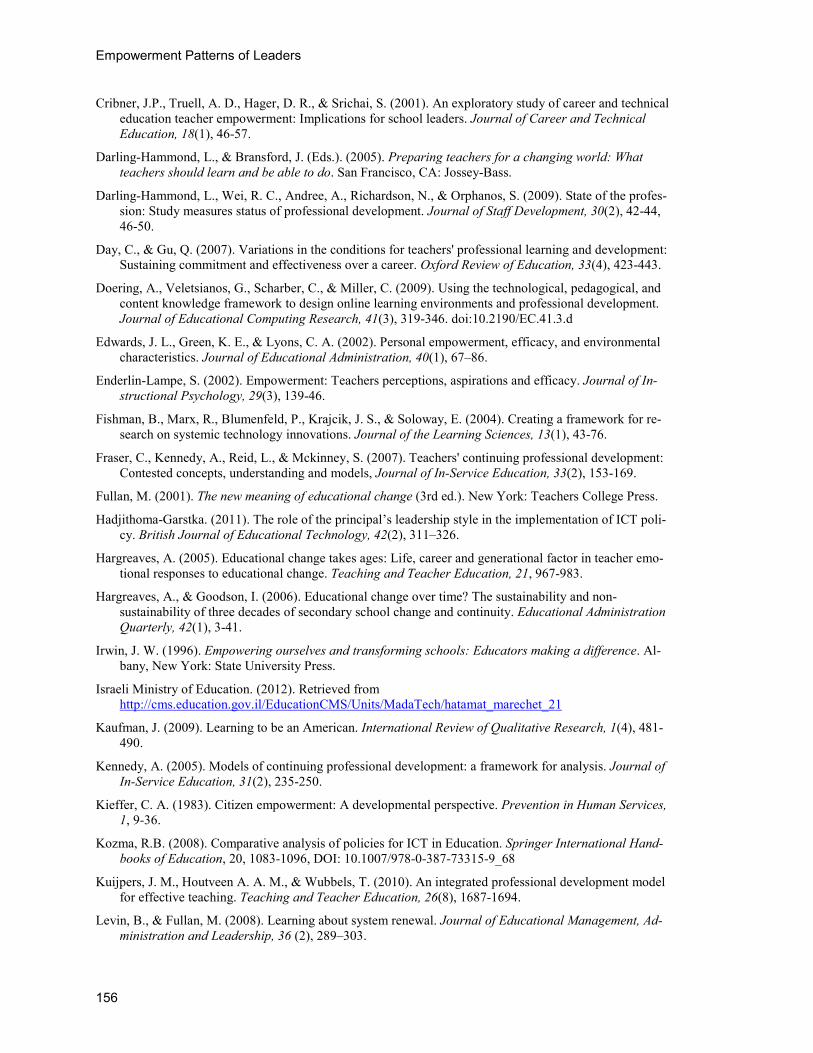
Empowerment Patterns of Leaders
156
Cribner, J.P., Truell, A. D., Hager, D. R., & Srichai, S. (2001). An exploratory study of career and technical education teacher empowerment: Implications for school leaders. Journal of Career and Technical Education, 18(1), 46-57.
Darling-Hammond, L., & Bransford, J. (Eds.). (2005). Preparing teachers for a changing world: What teachers should learn and be able to do. San Francisco, CA: Jossey-Bass.
Darling-Hammond, L., Wei, R. C., Andree, A., Richardson, N., & Orphanos, S. (2009). State of the profes-sion: Study measures status of professional development. Journal of Staff Development, 30(2), 42-44, 46-50.
Day, C., & Gu, Q. (2007). Variations in the conditions for teachers' professional learning and development: Sustaining commitment and effectiveness over a career. Oxford Review of Education, 33(4), 423-443.
Doering, A., Veletsianos, G., Scharber, C., & Miller, C. (2009). Using the technological, pedagogical, and content knowledge framework to design online learning environments and professional development. Journal of Educational Computing Research, 41(3), 319-346. doi:10.2190/EC.41.3.d
Edwards, J. L., Green, K. E., & Lyons, C. A. (2002). Personal empowerment, efficacy, and environmental characteristics. Journal of Educational Administration, 40(1), 67–86.
Enderlin-Lampe, S. (2002). Empowerment: Teachers perceptions, aspirations and efficacy. Journal of In-structional Psychology, 29(3), 139-46.
Fishman, B., Marx, R., Blumenfeld, P., Krajcik, J. S., & Soloway, E. (2004). Creating a framework for re-search on systemic technology innovations. Journal of the Learning Sciences, 13(1), 43-76.
Fraser, C., Kennedy, A., Reid, L., & Mckinney, S. (2007). Teachers' continuing professional development: Contested concepts, understanding and models, Journal of In-Service Education, 33(2), 153-169.
Fullan, M. (2001). The new meaning of educational change (3rd ed.). New York: Teachers College Press.
Hadjithoma-Garstka. (2011). The role of the principal’s leadership style in the implementation of ICT poli-cy. British Journal of Educational Technology, 42(2), 311–326.
Hargreaves, A. (2005). Educational change takes ages: Life, career and generational factor in teacher emo-tional responses to educational change. Teaching and Teacher Education, 21, 967-983.
Hargreaves, A., & Goodson, I. (2006). Educational change over time? The sustainability and non-sustainability of three decades of secondary school change and continuity. Educational Administration Quarterly, 42(1), 3-41.
Irwin, J. W. (1996). Empowering ourselves and transforming schools: Educators making a difference. Al-bany, New York: State University Press.
Israeli Ministry of Education. (2012). Retrieved from http://cms.education.gov.il/EducationCMS/Units/MadaTech/hatamat_marechet_21
Kaufman, J. (2009). Learning to be an American. International Review of Qualitative Research, 1(4), 481-490.
Kennedy, A. (2005). Models of continuing professional development: a framework for analysis. Journal of In-Service Education, 31(2), 235-250.
Kieffer, C. A. (1983). Citizen empowerment: A developmental perspective. Prevention in Human Services, 1, 9-36.
Kozma, R.B. (2008). Comparative analysis of policies for ICT in Education. Springer International Hand-books of Education, 20, 1083-1096, DOI: 10.1007/978-0-387-73315-9_68
Kuijpers, J. M., Houtveen A. A. M., & Wubbels, T. (2010). An integrated professional development model for effective teaching. Teaching and Teacher Education, 26(8), 1687-1694.
Levin, B., & Fullan, M. (2008). Learning about system renewal. Journal of Educational Management, Ad-ministration and Leadership, 36 (2), 289–303.
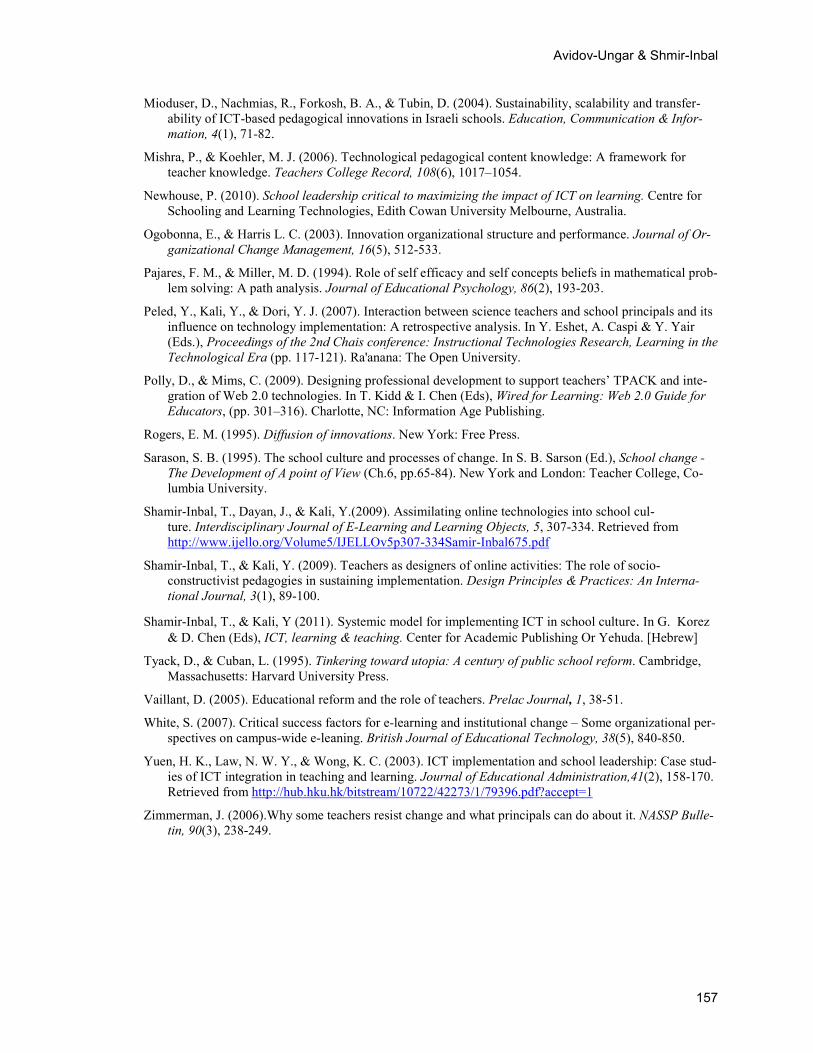
Avidov-Ungar & Shmir-Inbal
157
Mioduser, D., Nachmias, R., Forkosh, B. A., & Tubin, D. (2004). Sustainability, scalability and transfer-ability of ICT-based pedagogical innovations in Israeli schools. Education, Communication & Infor-mation, 4(1), 71-82.
Mishra, P., & Koehler, M. J. (2006). Technological pedagogical content knowledge: A framework for teacher knowledge. Teachers College Record, 108(6), 1017–1054.
Newhouse, P. (2010). School leadership critical to maximizing the impact of ICT on learning. Centre for Schooling and Learning Technologies, Edith Cowan University Melbourne, Australia.
Ogobonna, E., & Harris L. C. (2003). Innovation organizational structure and performance. Journal of Or-ganizational Change Management, 16(5), 512-533.
Pajares, F. M., & Miller, M. D. (1994). Role of self efficacy and self concepts beliefs in mathematical prob-lem solving: A path analysis. Journal of Educational Psychology, 86(2), 193-203.
Peled, Y., Kali, Y., & Dori, Y. J. (2007). Interaction between science teachers and school principals and its influence on technology implementation: A retrospective analysis. In Y. Eshet, A. Caspi & Y. Yair (Eds.), Proceedings of the 2nd Chais conference: Instructional Technologies Research, Learning in the Technological Era (pp. 117-121). Ra'anana: The Open University.
Polly, D., & Mims, C. (2009). Designing professional development to support teachers’ TPACK and inte-gration of Web 2.0 technologies. In T. Kidd & I. Chen (Eds), Wired for Learning: Web 2.0 Guide for Educators, (pp. 301–316). Charlotte, NC: Information Age Publishing.
Rogers, E. M. (1995). Diffusion of innovations. New York: Free Press.
Sarason, S. B. (1995). The school culture and processes of change. In S. B. Sarson (Ed.), School change - The Development of A point of View (Ch.6, pp.65-84). New York and London: Teacher College, Co-lumbia University.
Shamir-Inbal, T., Dayan, J., & Kali, Y.(2009). Assimilating online technologies into school cul-ture. Interdisciplinary Journal of E-Learning and Learning Objects, 5, 307-334. Retrieved from http://www.ijello.org/Volume5/IJELLOv5p307-334Samir-Inbal675.pdf
Shamir-Inbal, T., & Kali, Y. (2009). Teachers as designers of online activities: The role of socio-constructivist pedagogies in sustaining implementation. Design Principles & Practices: An Interna-tional Journal, 3(1), 89-100.
Shamir-Inbal, T., & Kali, Y (2011). Systemic model for implementing ICT in school culture. In G. Korez & D. Chen (Eds), ICT, learning & teaching. Center for Academic Publishing Or Yehuda. [Hebrew]
Tyack, D., & Cuban, L. (1995). Tinkering toward utopia: A century of public school reform. Cambridge, Massachusetts: Harvard University Press.
Vaillant, D. (2005). Educational reform and the role of teachers. Prelac Journal, 1, 38-51.
White, S. (2007). Critical success factors for e-learning and institutional change – Some organizational per-spectives on campus-wide e-leaning. British Journal of Educational Technology, 38(5), 840-850.
Yuen, H. K., Law, N. W. Y., & Wong, K. C. (2003). ICT implementation and school leadership: Case stud-ies of ICT integration in teaching and learning. Journal of Educational Administration,41(2), 158-170. Retrieved from http://hub.hku.hk/bitstream/10722/42273/1/79396.pdf?accept=1
Zimmerman, J. (2006).Why some teachers resist change and what principals can do about it. NASSP Bulle-tin, 90(3), 238-249.

Empowerment Patterns of Leaders
158
Biographies Dr. Orit Avidov-Ungar is the Head of Research Authority and senior lecturer at the School of Education Systems Management at Achva Academic College she is also a member of the faculty of the Open University in Israel. She heads the specialization in professional development at the Mofet Institute and is the aca-demic advisor to the Ministry of Education in Israel manage-ment in the implementation of innovative technology systems and the professional development of teachers. Her research studies deal with the implementation of innovative technologies in education systems, the empowerment and professional devel-opment of teachers, and leading organizational change in educa-tion systems.
Dr. Tamar Shamir-Inbal is a pedagogical coordinator and academic advisor for the Israeli Ministry of Education. Tamar leads professional development programs and teacher training courses, which enhance digital teaching and learning in schools, and empowerment of ICT Leaders and principals. Tamar is a member of the Teaching and Design (TeLTaD) re-search group at the University of Haifa and also a moderator of courses of "ICT implementation: Practice & Theory" at the Is-raeli Open University. Her research studies focus on profes-sional development of teachers adopting technology-enhanced strategies for their everyday instruction, design and implemen-tation of socio-constructivist pedagogies in online activities.
Journal of Information Technology Education: Research Volume 12, 2013
Building a Student-Centred Learning Framework using Social Software in the Middle Years
Classroom: An Action Research Study
Gail Casey Deakin University, Geelong, Victoria, Australia
Executive Summary This article discusses the development of the online spaces that were used to create a learning framework: a student-centred framework that combined face-to-face teaching with online social and participatory media. The author, as part of her Doctoral research study, used action research as a mechanism for continual improvement as she redesigned many curriculum projects for her thirteen Middle Years’ classes, over an eighteen-month period. This article discusses part of this research study and specifically documents:
1. the complexity found within the tools and spaces of the selected social software, and
2. the continual review, through the action research cycle, in building the student-centred learning framework, and the consequent implications these had on the learning design.
The study uses a theoretical framework that values students as active participants in the learning process and sets up an environment where students can provide supportive feedback, and even assessment, to their peers. Through the open nature of social and participatory media, a peer-to-peer modelling process was possible, where students could learn from the posts of others. In look-ing closely at the tools that enable peer-to-peer interactions to take place, this article highlights the challenges in utilising the dynamic nature of social media and the structural processes needed to support students in becoming active participants in their learning and the learning of their peers.
This article discusses the research study in three phases, and in each phase it provides two exam-ples of teacher projects. In doing so, it presents screen clips of the online project as well as a structural diagram showing the analysis of the interaction within the project. The complexities and issues dealt with through the action research process are also highlighted. In describing this exploration, the article looks closely at the unique qualities that social software offers teaching and learning. It investigates many of the social tools such as ‘My Page’, Blogs, Groups and Dis-cussion Forums. It also identifies the search tools and mechanisms that social sites offer in sup-
porting the structural organisation of user-generated content in such a dy-namic environment.
When considering the tools and mecha-nisms within social sites, it does appear that social media has the potential to alter how learners access information and knowledge, as well as how learners interact with the teacher and their peers. Through identifying and analysing the
Material published as part of this publication, either on-line or in print, is copyrighted by the Informing Science Institute. Permission to make digital or paper copy of part or all of these works for personal or classroom use is granted without fee provided that the copies are not made or distributed for profit or commercial advantage AND that copies 1) bear this notice in full and 2) give the full citation on the first page. It is per-missible to abstract these works so long as credit is given. To copy in all other cases or to republish or to post on a server or to redistribute to lists requires specific permission and payment of a fee. Contact [email protected] to request redistribution permission.
Editor: Lynn Jeffrey
Student-Centred Learning Framework
different social media spaces, the author was able to document the complexities involved in social sites and the range of options within the individual spaces. This highlighted the importance of the information retrieval mechanisms within such sites.
Through dissecting and analysing, the author became better informed as to the flow of student participation and interactivity within her class projects and was more able to construct a learning environment that provided students with individualised learning spaces. This was achieved through the use of blogs and each student’s ‘My Page’. Structurally, these were able to support personalised feedback from both peers and the teacher and were easily accessible for student as-sessment and the final reporting processes to parents. It was found that Groups and Discussion Forums were ideal for posting teacher project instructions and for student generated interest groups, as well as other interactions that were not likely to contain more than ten posts. It was clearly documented, within the research data, that when posting curriculum projects within poten-tially dynamic social sites, a high importance must be given to how the project will be structured and accessed. In this study, this helped to avoid students becoming lost (disorientated within the site), distracted or engulfed in confusion and information overload.
Keywords: online learning, social media, student-centred learning, learning design, complexity.
Introduction As I walk down the street, pass the local shopping centre, and use public transport, I continue to be faced with people of all ages, using mobile devices. Markham (2013) explains that this instan-taneous connectivity to personal networks and endless sources of information shapes every-day reality, and I am reminded of this as I check the ‘Facebook’ status of my two children, monitor my ‘Twitter’ account for resources from a recent educator conference, and respond to a ‘connect’ request from an academic on ‘Linkedin’ (see https://www.linkedin.com/). I live on a planet where the use of social and participatory media has become commonplace in the developed world, and increasingly so elsewhere. This has implications for my classes where many of my student’s out-of-school activities are focused around the social connectivity offered by computers and mobile devices.
This article reports on part of my doctoral action research study that investigated ways in which social and participatory media could be used to enhance the Middle-Years’ (students aged 13 to 16 years) school curriculum. Three social media sites were created over an eighteen-month data collection period, and this article focuses its discussion on the structural design of these sites. It further discusses how this design evolved to build a student-centred learning framework. Specifi-cally, it details:
1. The complexity found within the tools and spaces of the social software used.
2. The continual review, through the action research cycle, in building a student-centred learning environment, and consequent implications to the learning design.
Technological Change and Social Software Put simply, social software encompasses all types of internet applications that support interaction between and within groups (Selwyn & Grant, 2009). For the purposes of this article, social soft-ware, social media, and social networking are terms that can be interchanged. Current develop-ments with technology and social software are significantly altering how learners access informa-tion and knowledge, as well as how learners dialogue with their instructors and with each other (Siemens, 2008). By virtue of their platform, social and participatory software provide the poten-tial for creative and innovative learning. The articulation and understanding of the nature of the interactions among users, within social software and between the users and the tools that form
160
Casey
part of the environment, are key challenges in researching new learning contexts through socially mediated environments (Conole, Gallery, & Culver, 2011). This article looks closely at the tools that enable such interactions to take place and the challenges in using these to construct a frame-work that offers a student-centred learning environment. In explaining how this was done, it may be helpful to consider the ways in which social networks are unique.
In their special theme section on social networks, Boyd and Ellison (2007) survey research that is directly concerned with social network sites. In so doing, they set the scene for the scholarship and diversity that social software offers researchers. Their discussion on the history of social net-working, dating back to 1997, provides a background to the shift in the organisation of online communities. What is unique in social networks, as explained by Boyd and Ellison (p. 211), is not that they allow individuals to meet strangers, but rather they enable users to articulate and make visible their social networks, and it is this that can result in connections between individuals that would not otherwise be made. Students of different ages and from the different subjects sharing the one social media site captured this uniqueness in this study.
Social and participatory media tools enable both open and closed interactions, and sharing of ma-terials and information, to occur quickly from almost anywhere at anytime. Ryan, Magro, and Sharp (2011) explain that socialisation, whether educational or otherwise, leads to more inclu-sion, support, and understanding and this can help to alleviate the sense of isolation among stu-dents and can increase their chance of success. As the Internet and social media evolve, we are now discovering that knowledge can be produced, searched, organized, and shared in a seemingly infinite number of configurations, without necessarily resorting to an instructor or an external learning management system (Bouchard, 2011). This is emphasised in this study through the fo-cus of a student-centred framework that is made possible by the World Wide Web (web). With the advent of such interactive web media, Bouchard asserts that for the first time we appreciate the act of learning as a response to changes in the learning environment, rather than as an adap-tion to a predetermined learning system. He argues that the traditional means of knowledge pro-duction, top-down and one-to-many, required in the past that the producer, disseminator, or pub-lisher of knowledge distribute and organise information in a way that is intelligible to the learner. Bouchard discusses changes in the way learning occurs while Jones (2010), in his editorial on a new generation of learners, suggests a complex picture of change amongst young people, such that leisure and study activities intertwine. Jones asserts that new methods of research need to be adopted to complement the predominantly survey methods currently deployed. The lively interac-tion of online networks and relationships created through social media technologies is of growing importance to individuals, organizations, and communities, and understanding how these social media networks grow, change, fail, or succeed is of increasing concern to researchers and profes-sionals (Hansen, Shneidermann, & Smith, 2009).
As discussed by Jones (2010), the issue of technological change and the way it affects young people is important to networked eLearning because these include specific claims about ap-proaches to learning in the new generation. This includes a change from teacher-centred to learn-ing-centred based on collaboration and this change, in particular, supported this study, as the ac-tion research progressed, in building a student focused learning approach using action research. This included ongoing cycles of planning, acting, observing, and reflecting that became part of the teaching and learning process: hence, the growth, change, failure, or success of the interac-tions within the online social media site were continually being analysed. The action research cy-clic process became complex as multiple classes were being studied at the same time and the ac-tion research cycle of one class informed the cycle of others. Complexity also existed within the social media tools, as found by Luckin et al. (2009) in their research relating to the activities and perceptions of learning with Web 2.0 technologies. Like Luckin et al., I found that the use of so-
161
Student-Centred Learning Framework
cial tools by learners can be categorised into four main groups (researchers, collaborators, pro-ducers, and publishers) and this could be seen in the many student responses to teacher projects.
In this article, I describe how the students used social tools and spaces. I dissect and analyse these to show the thinking and processes that occurred during the action research cycle, with the aim to optimise the peer-to-peer interactions (hence learning). Merchant (2011) acknowledges that re-searchers, over the years, have described the learning that takes place within such sites and he asserts that no model has yet been developed to theorise this learning. He argues that, despite claims that the social web is a rich space for informal learning, there has been little serious atten-tion paid to the form or nature of that learning. Through this article, I hope that this research may contribute to the Model called for by Merchant by detailing possible structures within the learning process. Online networks easily trace the contours of existing social divisions as they transcend or transform (Merchant). The notions of ‘social capital’ and ‘belonging’ within social networking sites, as argued by Merchant, offer a context for more principled educational approaches to social networking. Merchant offers three approaches for the use of social networking sites in educa-tional settings: learning about them, learning from them, and learning with them. Glimpses of these can be seen within the discussion provided in this article.
As more learning management systems within schools and universities are extended to include blogs, groups, chats, and discussion forums, the findings of research, such as this, will add to the important knowledge base for learning designers. This study highlights the complexities within social media tools and provides, within context, supportive examples and extensive explanations of how and why learning was structured. Its discussion, including varying constraints, may add to the growing bank of knowledge that supports the use of social and participatory media within educational spheres. While this article explains some of the pitfalls in using groups and discus-sion forums for teacher projects, it also aims to point towards solutions. The six examples of teacher online projects provide educators with samples of workable student-centred activities that were devised specifically for such dynamic environments. This study models the safe and secure use of social media within the teaching and learning sphere. It provides supportive evidence for those looking for examples of such use and also highlights a move from a teacher-centred ap-proach to one that is learning-centred, within such social software.
Theoretical Framework From the outset, this study involved the creation of a single social networking site shared between all of my classes during any one semester. Like Nuthall (2007), my experiences had led me to believe that teaching was about sensitivity and adaption, knowing that the things that interest some students do not interest others and what works one day may not work the next. The exten-sive research of Nuthall helped to provide this research with an appreciation of how different stu-dents experience the classroom, and how their experiences shape the changes that are going on in their minds. He argues that their motivations and interests, their attention and involvement may all be strongly affected by their ongoing relationships with their peers, and he asserts that teachers cannot be effective unless they take the peer relationships in the classroom into account. Al-though Nuthall does not discuss the concepts of social media in education, the importance he places on peer-to-peer interaction and influence were well supported through the social media environments used in this study.
There is without doubt a place for teacher instruction and individual work. Blatchford, Kutnick, Baines, and Galton (2003) suggest this and also that there is a need to construct a social pedagogy that can underpin the development of group work in schools. They predict that in the future, the distinction between teacher and pupil, or expert and novice, may well become blurred, especially as information becomes more widely and instantly available, a concept supported by this study. Blatchford et al. assert that learning is not just about information rather that the classroom of the
162
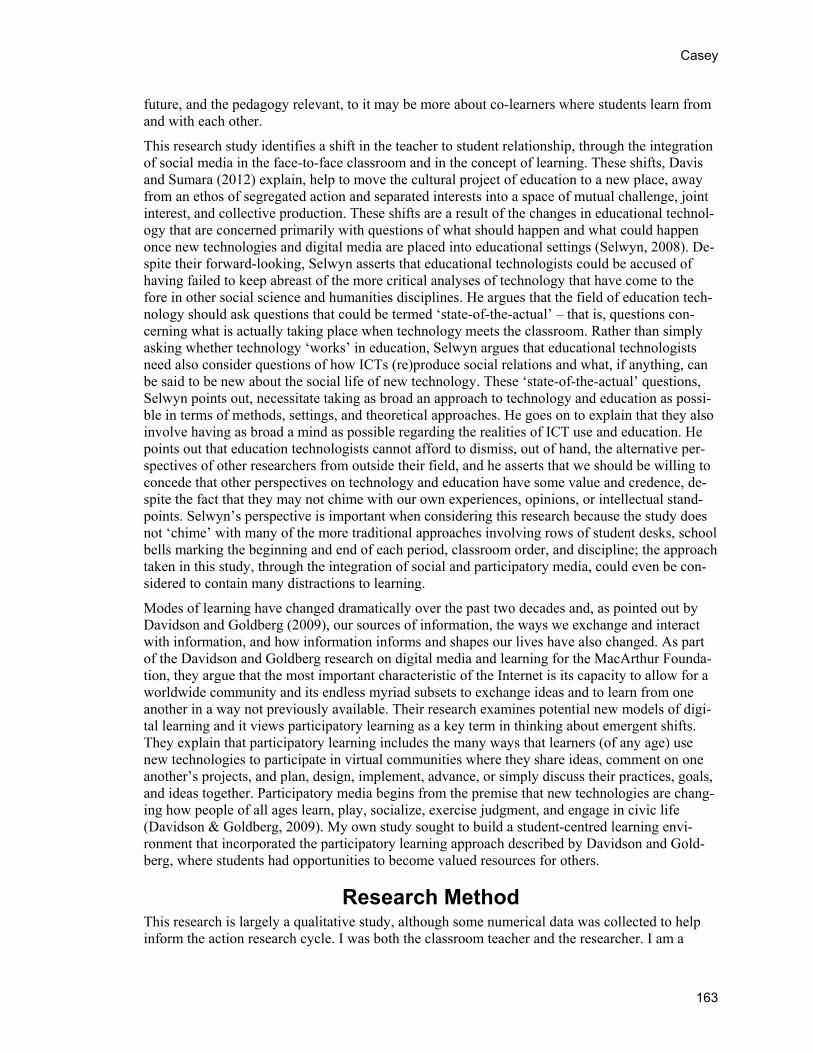
Casey
future, and the pedagogy relevant, to it may be more about co-learners where students learn from and with each other.
This research study identifies a shift in the teacher to student relationship, through the integration of social media in the face-to-face classroom and in the concept of learning. These shifts, Davis and Sumara (2012) explain, help to move the cultural project of education to a new place, away from an ethos of segregated action and separated interests into a space of mutual challenge, joint interest, and collective production. These shifts are a result of the changes in educational technol-ogy that are concerned primarily with questions of what should happen and what could happen once new technologies and digital media are placed into educational settings (Selwyn, 2008). De-spite their forward-looking, Selwyn asserts that educational technologists could be accused of having failed to keep abreast of the more critical analyses of technology that have come to the fore in other social science and humanities disciplines. He argues that the field of education tech-nology should ask questions that could be termed ‘state-of-the-actual’ – that is, questions con-cerning what is actually taking place when technology meets the classroom. Rather than simply asking whether technology ‘works’ in education, Selwyn argues that educational technologists need also consider questions of how ICTs (re)produce social relations and what, if anything, can be said to be new about the social life of new technology. These ‘state-of-the-actual’ questions, Selwyn points out, necessitate taking as broad an approach to technology and education as possi-ble in terms of methods, settings, and theoretical approaches. He goes on to explain that they also involve having as broad a mind as possible regarding the realities of ICT use and education. He points out that education technologists cannot afford to dismiss, out of hand, the alternative per-spectives of other researchers from outside their field, and he asserts that we should be willing to concede that other perspectives on technology and education have some value and credence, de-spite the fact that they may not chime with our own experiences, opinions, or intellectual stand-points. Selwyn’s perspective is important when considering this research because the study does not ‘chime’ with many of the more traditional approaches involving rows of student desks, school bells marking the beginning and end of each period, classroom order, and discipline; the approach taken in this study, through the integration of social and participatory media, could even be con-sidered to contain many distractions to learning.
Modes of learning have changed dramatically over the past two decades and, as pointed out by Davidson and Goldberg (2009), our sources of information, the ways we exchange and interact with information, and how information informs and shapes our lives have also changed. As part of the Davidson and Goldberg research on digital media and learning for the MacArthur Founda-tion, they argue that the most important characteristic of the Internet is its capacity to allow for a worldwide community and its endless myriad subsets to exchange ideas and to learn from one another in a way not previously available. Their research examines potential new models of digi-tal learning and it views participatory learning as a key term in thinking about emergent shifts. They explain that participatory learning includes the many ways that learners (of any age) use new technologies to participate in virtual communities where they share ideas, comment on one another’s projects, and plan, design, implement, advance, or simply discuss their practices, goals, and ideas together. Participatory media begins from the premise that new technologies are chang-ing how people of all ages learn, play, socialize, exercise judgment, and engage in civic life (Davidson & Goldberg, 2009). My own study sought to build a student-centred learning envi-ronment that incorporated the participatory learning approach described by Davidson and Gold-berg, where students had opportunities to become valued resources for others.
Research Method This research is largely a qualitative study, although some numerical data was collected to help inform the action research cycle. I was both the classroom teacher and the researcher. I am a
163
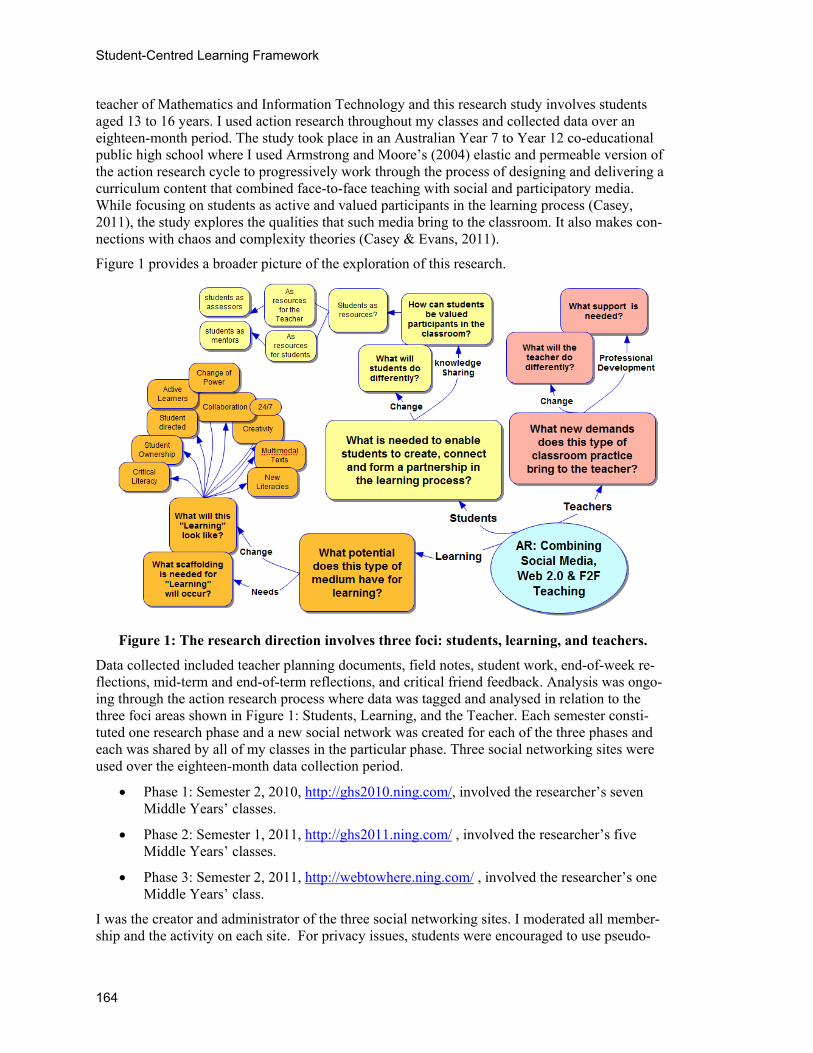
Student-Centred Learning Framework
teacher of Mathematics and Information Technology and this research study involves students aged 13 to 16 years. I used action research throughout my classes and collected data over an eighteen-month period. The study took place in an Australian Year 7 to Year 12 co-educational public high school where I used Armstrong and Moore’s (2004) elastic and permeable version of the action research cycle to progressively work through the process of designing and delivering a curriculum content that combined face-to-face teaching with social and participatory media. While focusing on students as active and valued participants in the learning process (Casey, 2011), the study explores the qualities that such media bring to the classroom. It also makes con-nections with chaos and complexity theories (Casey & Evans, 2011).
Figure 1 provides a broader picture of the exploration of this research.
Figure 1: The research direction involves three foci: students, learning, and teachers.
Data collected included teacher planning documents, field notes, student work, end-of-week re-flections, mid-term and end-of-term reflections, and critical friend feedback. Analysis was ongo-ing through the action research process where data was tagged and analysed in relation to the three foci areas shown in Figure 1: Students, Learning, and the Teacher. Each semester consti-tuted one research phase and a new social network was created for each of the three phases and each was shared by all of my classes in the particular phase. Three social networking sites were used over the eighteen-month data collection period.
Phase 1: Semester 2, 2010, http://ghs2010.ning.com/, involved the researcher’s seven Middle Years’ classes.
Phase 2: Semester 1, 2011, http://ghs2011.ning.com/ , involved the researcher’s five Middle Years’ classes.
Phase 3: Semester 2, 2011, http://webtowhere.ning.com/ , involved the researcher’s one Middle Years’ class.
I was the creator and administrator of the three social networking sites. I moderated all member-ship and the activity on each site. For privacy issues, students were encouraged to use pseudo-
164
Casey
nyms (these added another dimension to the research) and students were not to post identifiable content. The site could be openly viewed on the Internet by anyone in the world, but only those with membership to the site could post content.
Although a social networking environment called a ‘Ning’, http://ca.ning.com/, was used throughout this research, the components of the Ning included blogs, discussion forums, groups and members pages, etc.; these are common on the Internet and in many learning management systems. Hence, readers may relate much of the following discussion to many other types of so-cial software tools. It should be noted that the administrators of such environments, largely, have controls over the tools, facilities, and privacy of the site. The intention of this article is not to pre-scribe and delimit, but to offer readers some insight into the options when designing for learning using social and participatory media environments. One needs to keep in mind that the dynamic nature of such sites will continue to evolve.
Learning and Interaction or Frustration and Information Overload?
Initially when I posted my class materials on the social network, I found that some students had trouble navigating to the materials and others could become distracted by the range of links and content that surrounded them. At times, students became frustrated because they were required to click into pages that were linked within a series of other pages and, hence, there were many mouse clicks and screens to read. The development of an efficient and effective structure, for po-sitioning content and for retrieval of information, soon became a key factor arising within the ac-tion research process.
The following Figures 2 to 11 provide information and screen clips showing many key features within the social network used in this study. The red arrows, embedded on many of the Figures identify key features and important quick access links to materials and content that was useful to the users (students) and visitors. These links can be accessed by a click of a mouse button and often provide further site content and links. The arrows point out a wide range of options that were available to students within the social media site. In creating the environment, it was impor-tant to consider and often incorporate these links into the online design framework for teaching and learning to avoid students becoming distracted or confused. As the research progressed, I found that it was imperative that I give careful consideration to the design of the main page, Fig-ure 2, to optimise the flow of ‘traffic’. The following pages provide a description of the different types of social spaces within the selected social site and they also highlight features that were considered when structuring project work and student interaction.
The Social Network The Phase 2 main social networking page is shown in Figure 2. This main page was important because it provided a gateway to the site and the links to key social spaces. It was important to position project material within one or two mouse clicks of this main page and to highlight, to students, the ‘Main Menu’ as being an important means to navigate and to access significant areas within the site. This Menu (top left hand side of the Figure 2) appears in the same position throughout the site. The general search engine for the site, top right hand arrow, also appears on all site pages and was an important tool in helping to find a particular resource or member.
I could, as the site administrator, change aspects of the layout for the main home page and theme of the site at any time and, to some extent, I could determine the structure of the page and its sub-components. Changing the layout would affect some of the points, indicated by the red arrows. For example, as the administrator, I could move the ‘Groups’ section shown on the left hand side
165
Student-Centred Learning Framework
of the main home page, Figure 2, to the centre of that page or even delete it from the page. This flexibility helped when designing the structure of the site.
Figure 2: Quick access mechanisms available on the social networking main page
(from Phase 2).
The other four arrows, in Figure 2, point to important quick access mechanisms for site users.
‘Main Menu’. This provided convenient retrieval of the main site information that is categorised as Members, Photos, Videos, Blogs, and Groups. (The categories that appear in the Main Menu can be adjusted by the administrator.)
‘Groups’. This is a filtered list, which the administrator set up, to enable 25 specific teacher created groups to be retrieved quickly. Without these quick links, students strug-gled to access the teacher set projects and content in a timely fashion.
‘Comments’ and ‘Like’ icons provided information on the total number of comments and ‘likes’ for each group. These allowed members and visitors access to information on the popularity and interactivity of the groups. They also provided users with a direct retrieval mechanism to the details of these comments and ‘likes’.
‘Latest Activity’. This provided members and visitors with detailed information regard-ing the most recent activity, updated as it occurred. The newest activity is shown at the top of this list. For the teacher, this information provided an essential mechanism for moderation. While in the classroom the teacher could easily view information on student
166
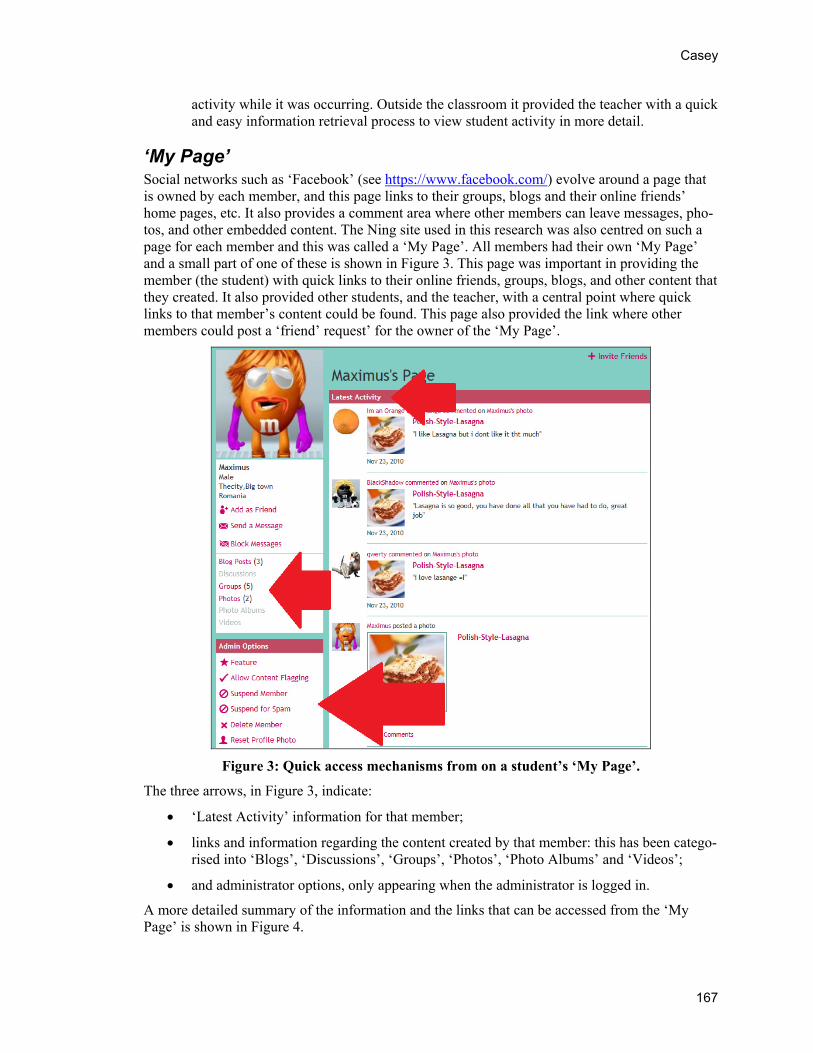
Casey
activity while it was occurring. Outside the classroom it provided the teacher with a quick and easy information retrieval process to view student activity in more detail.
‘My Page’ Social networks such as ‘Facebook’ (see https://www.facebook.com/) evolve around a page that is owned by each member, and this page links to their groups, blogs and their online friends’ home pages, etc. It also provides a comment area where other members can leave messages, pho-tos, and other embedded content. The Ning site used in this research was also centred on such a page for each member and this was called a ‘My Page’. All members had their own ‘My Page’ and a small part of one of these is shown in Figure 3. This page was important in providing the member (the student) with quick links to their online friends, groups, blogs, and other content that they created. It also provided other students, and the teacher, with a central point where quick links to that member’s content could be found. This page also provided the link where other members could post a ‘friend’ request’ for the owner of the ‘My Page’.
Figure 3: Quick access mechanisms from on a student’s ‘My Page’.
The three arrows, in Figure 3, indicate:
‘Latest Activity’ information for that member;
links and information regarding the content created by that member: this has been catego-rised into ‘Blogs’, ‘Discussions’, ‘Groups’, ‘Photos’, ‘Photo Albums’ and ‘Videos’;
and administrator options, only appearing when the administrator is logged in.
A more detailed summary of the information and the links that can be accessed from the ‘My Page’ is shown in Figure 4.
167
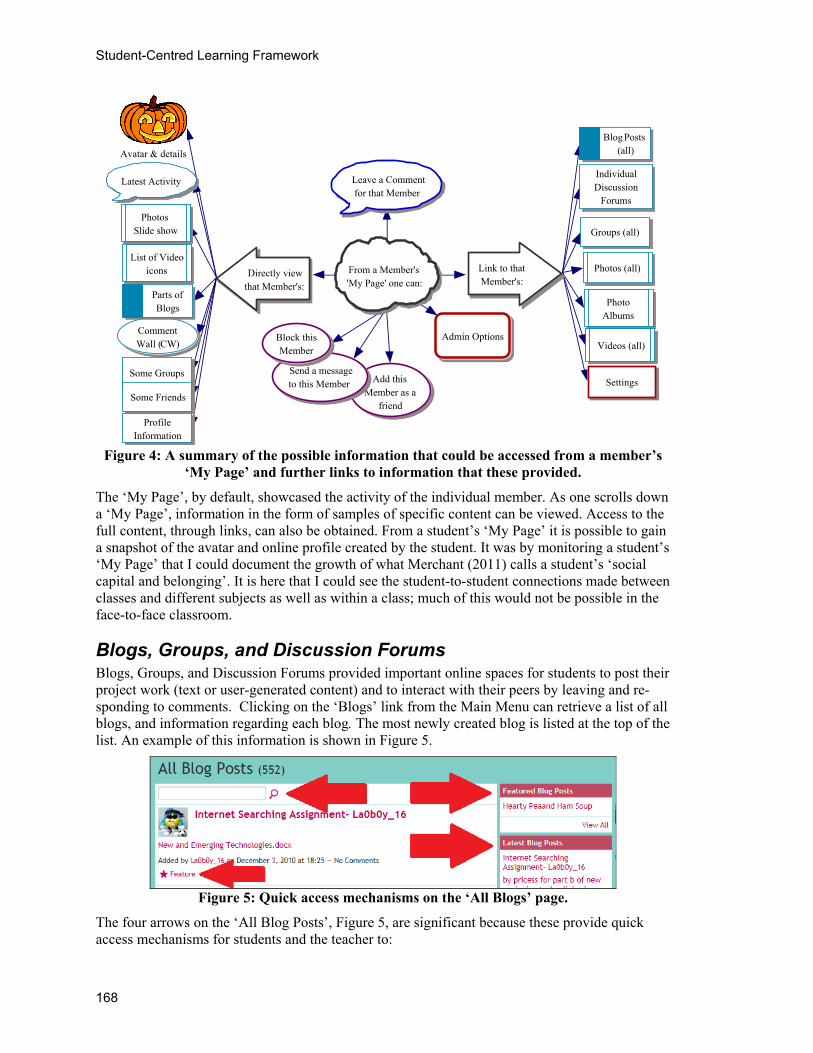
Student-Centred Learning Framework
Comment Wall (CW)
Parts of Blogs
PhotosSlide show
Latest Activity
Link to that Member's:
Admin Options
Add this Member as a
friend
Send a message to this Member
Block this Member
Some Groups
Some Friends
Avatar & details
From a Member's'My Page' one can:
Directly view that Member's:
List of Video icons
Leave a Comment for that Member
Blog Posts (all)
Individual Discussion
Forums
Groups (all)
Photos (all)
PhotoAlbums
Videos (all)
Settings
Profile Information
Figure 4: A summary of the possible information that could be accessed from a member’s ‘My Page’ and further links to information that these provided.
The ‘My Page’, by default, showcased the activity of the individual member. As one scrolls down a ‘My Page’, information in the form of samples of specific content can be viewed. Access to the full content, through links, can also be obtained. From a student’s ‘My Page’ it is possible to gain a snapshot of the avatar and online profile created by the student. It was by monitoring a student’s ‘My Page’ that I could document the growth of what Merchant (2011) calls a student’s ‘social capital and belonging’. It is here that I could see the student-to-student connections made between classes and different subjects as well as within a class; much of this would not be possible in the face-to-face classroom.
Blogs, Groups, and Discussion Forums Blogs, Groups, and Discussion Forums provided important online spaces for students to post their project work (text or user-generated content) and to interact with their peers by leaving and re-sponding to comments. Clicking on the ‘Blogs’ link from the Main Menu can retrieve a list of all blogs, and information regarding each blog. The most newly created blog is listed at the top of the list. An example of this information is shown in Figure 5.
Figure 5: Quick access mechanisms on the ‘All Blogs’ page.
The four arrows on the ‘All Blog Posts’, Figure 5, are significant because these provide quick access mechanisms for students and the teacher to:
168
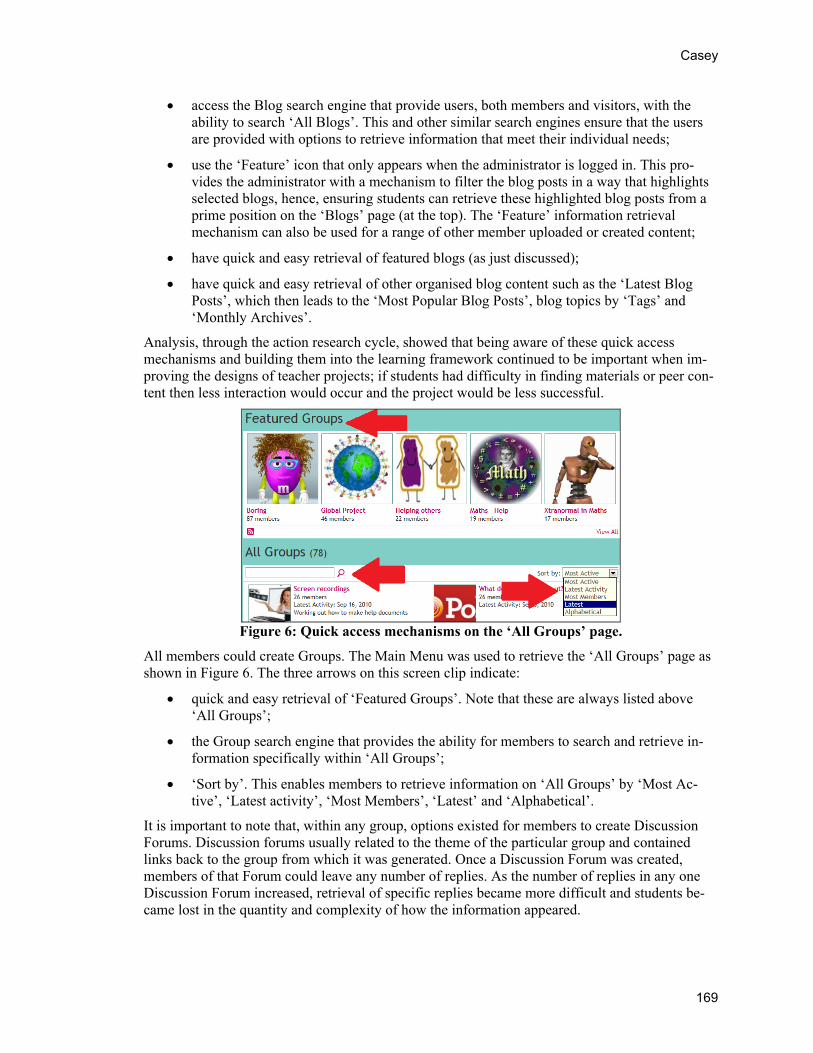
Casey
access the Blog search engine that provide users, both members and visitors, with the ability to search ‘All Blogs’. This and other similar search engines ensure that the users are provided with options to retrieve information that meet their individual needs;
use the ‘Feature’ icon that only appears when the administrator is logged in. This pro-vides the administrator with a mechanism to filter the blog posts in a way that highlights selected blogs, hence, ensuring students can retrieve these highlighted blog posts from a prime position on the ‘Blogs’ page (at the top). The ‘Feature’ information retrieval mechanism can also be used for a range of other member uploaded or created content;
have quick and easy retrieval of featured blogs (as just discussed);
have quick and easy retrieval of other organised blog content such as the ‘Latest Blog Posts’, which then leads to the ‘Most Popular Blog Posts’, blog topics by ‘Tags’ and ‘Monthly Archives’.
Analysis, through the action research cycle, showed that being aware of these quick access mechanisms and building them into the learning framework continued to be important when im-proving the designs of teacher projects; if students had difficulty in finding materials or peer con-tent then less interaction would occur and the project would be less successful.
Figure 6: Quick access mechanisms on the ‘All Groups’ page.
All members could create Groups. The Main Menu was used to retrieve the ‘All Groups’ page as shown in Figure 6. The three arrows on this screen clip indicate:
quick and easy retrieval of ‘Featured Groups’. Note that these are always listed above ‘All Groups’;
the Group search engine that provides the ability for members to search and retrieve in-formation specifically within ‘All Groups’;
‘Sort by’. This enables members to retrieve information on ‘All Groups’ by ‘Most Ac-tive’, ‘Latest activity’, ‘Most Members’, ‘Latest’ and ‘Alphabetical’.
It is important to note that, within any group, options existed for members to create Discussion Forums. Discussion forums usually related to the theme of the particular group and contained links back to the group from which it was generated. Once a Discussion Forum was created, members of that Forum could leave any number of replies. As the number of replies in any one Discussion Forum increased, retrieval of specific replies became more difficult and students be-came lost in the quantity and complexity of how the information appeared.
169
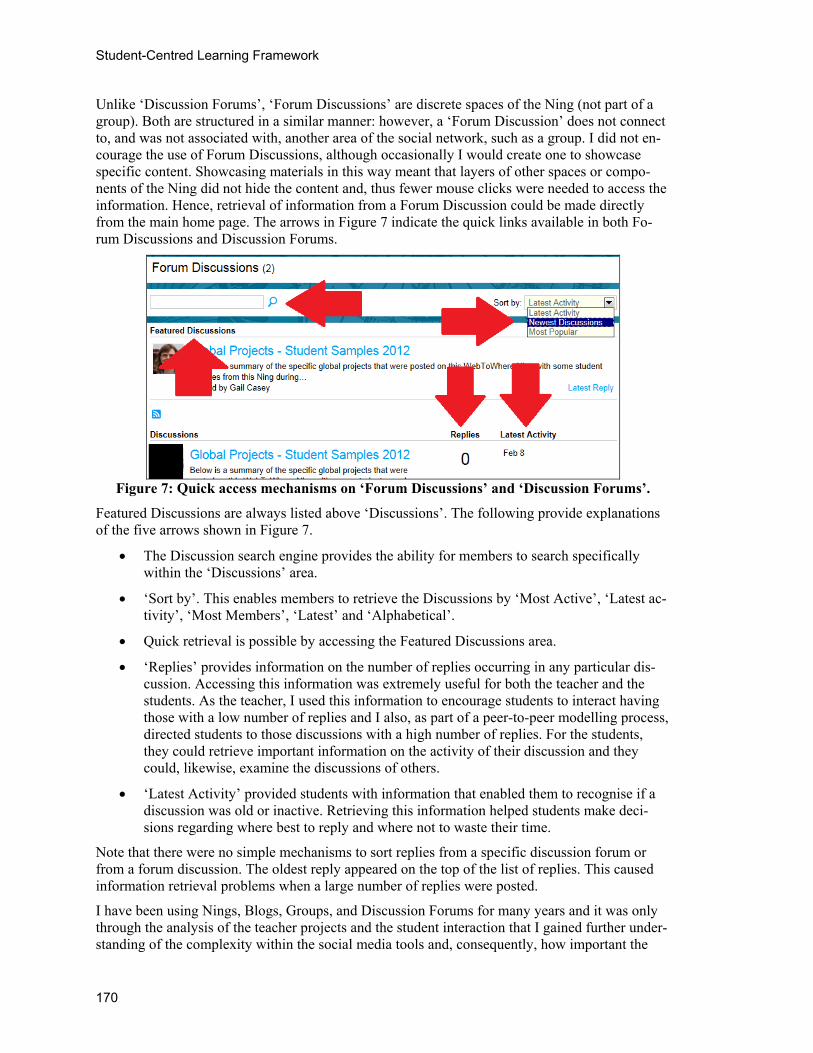
Student-Centred Learning Framework
Unlike ‘Discussion Forums’, ‘Forum Discussions’ are discrete spaces of the Ning (not part of a group). Both are structured in a similar manner: however, a ‘Forum Discussion’ does not connect to, and was not associated with, another area of the social network, such as a group. I did not en-courage the use of Forum Discussions, although occasionally I would create one to showcase specific content. Showcasing materials in this way meant that layers of other spaces or compo-nents of the Ning did not hide the content and, thus fewer mouse clicks were needed to access the information. Hence, retrieval of information from a Forum Discussion could be made directly from the main home page. The arrows in Figure 7 indicate the quick links available in both Fo-rum Discussions and Discussion Forums.
Figure 7: Quick access mechanisms on ‘Forum Discussions’ and ‘Discussion Forums’.
Featured Discussions are always listed above ‘Discussions’. The following provide explanations of the five arrows shown in Figure 7.
The Discussion search engine provides the ability for members to search specifically within the ‘Discussions’ area.
‘Sort by’. This enables members to retrieve the Discussions by ‘Most Active’, ‘Latest ac-tivity’, ‘Most Members’, ‘Latest’ and ‘Alphabetical’.
Quick retrieval is possible by accessing the Featured Discussions area.
‘Replies’ provides information on the number of replies occurring in any particular dis-cussion. Accessing this information was extremely useful for both the teacher and the students. As the teacher, I used this information to encourage students to interact having those with a low number of replies and I also, as part of a peer-to-peer modelling process, directed students to those discussions with a high number of replies. For the students, they could retrieve important information on the activity of their discussion and they could, likewise, examine the discussions of others.
‘Latest Activity’ provided students with information that enabled them to recognise if a discussion was old or inactive. Retrieving this information helped students make deci-sions regarding where best to reply and where not to waste their time.
Note that there were no simple mechanisms to sort replies from a specific discussion forum or from a forum discussion. The oldest reply appeared on the top of the list of replies. This caused information retrieval problems when a large number of replies were posted.
I have been using Nings, Blogs, Groups, and Discussion Forums for many years and it was only through the analysis of the teacher projects and the student interaction that I gained further under-standing of the complexity within the social media tools and, consequently, how important the
170
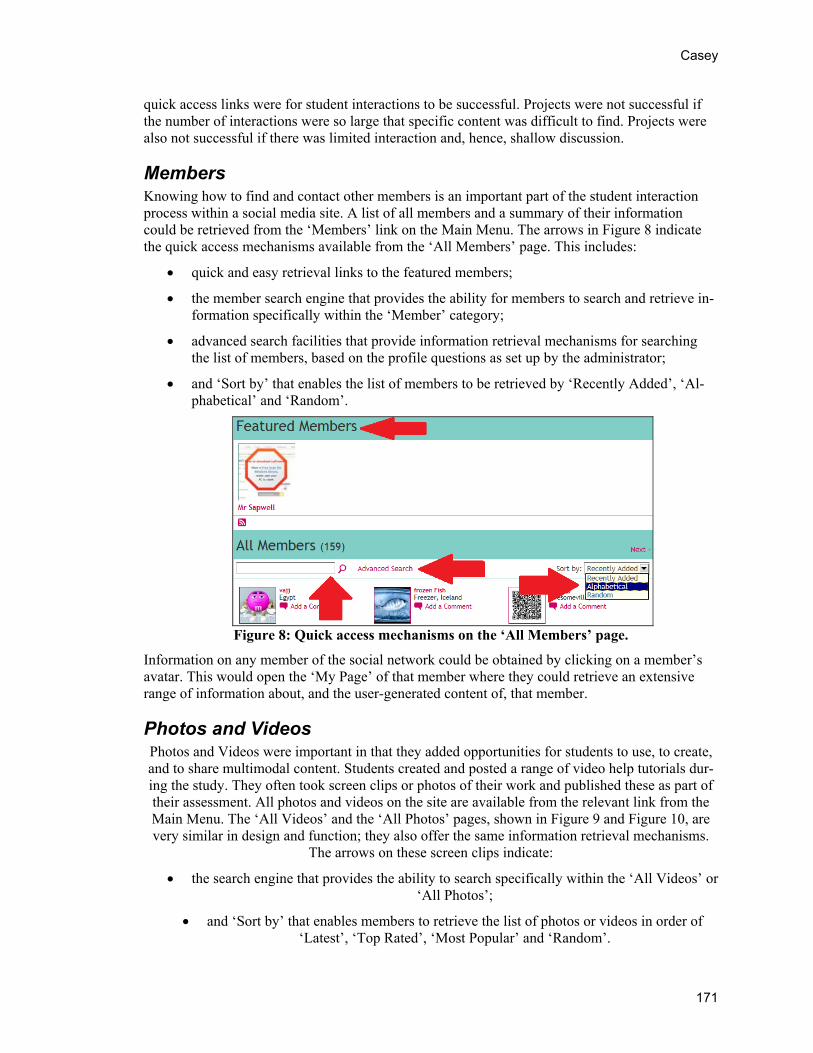
Casey
quick access links were for student interactions to be successful. Projects were not successful if the number of interactions were so large that specific content was difficult to find. Projects were also not successful if there was limited interaction and, hence, shallow discussion.
Members Knowing how to find and contact other members is an important part of the student interaction process within a social media site. A list of all members and a summary of their information could be retrieved from the ‘Members’ link on the Main Menu. The arrows in Figure 8 indicate the quick access mechanisms available from the ‘All Members’ page. This includes:
quick and easy retrieval links to the featured members;
the member search engine that provides the ability for members to search and retrieve in-formation specifically within the ‘Member’ category;
advanced search facilities that provide information retrieval mechanisms for searching the list of members, based on the profile questions as set up by the administrator;
and ‘Sort by’ that enables the list of members to be retrieved by ‘Recently Added’, ‘Al-phabetical’ and ‘Random’.
Figure 8: Quick access mechanisms on the ‘All Members’ page.
Information on any member of the social network could be obtained by clicking on a member’s avatar. This would open the ‘My Page’ of that member where they could retrieve an extensive range of information about, and the user-generated content of, that member.
Photos and Videos Photos and Videos were important in that they added opportunities for students to use, to create, and to share multimodal content. Students created and posted a range of video help tutorials dur-ing the study. They often took screen clips or photos of their work and published these as part of their assessment. All photos and videos on the site are available from the relevant link from the Main Menu. The ‘All Videos’ and the ‘All Photos’ pages, shown in Figure 9 and Figure 10, are very similar in design and function; they also offer the same information retrieval mechanisms.
The arrows on these screen clips indicate:
the search engine that provides the ability to search specifically within the ‘All Videos’ or ‘All Photos’;
and ‘Sort by’ that enables members to retrieve the list of photos or videos in order of ‘Latest’, ‘Top Rated’, ‘Most Popular’ and ‘Random’.
171
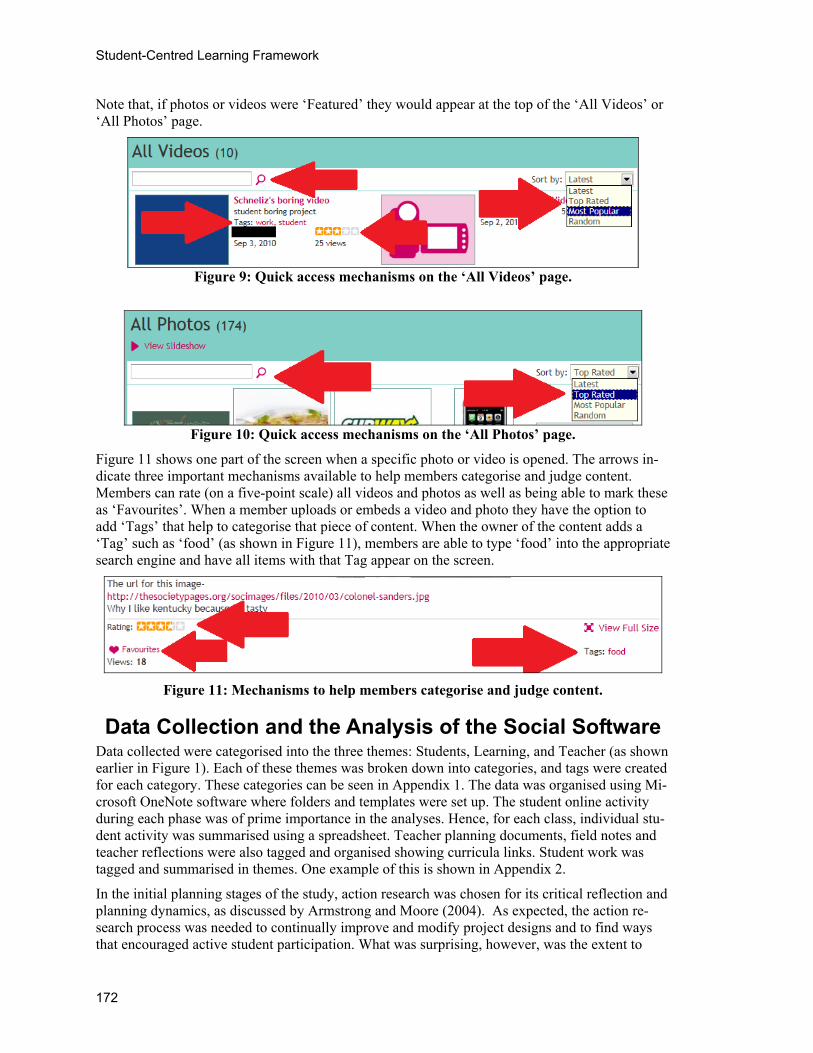
Student-Centred Learning Framework
Note that, if photos or videos were ‘Featured’ they would appear at the top of the ‘All Videos’ or ‘All Photos’ page.
Figure 9: Quick access mechanisms on the ‘All Videos’ page.
Figure 10: Quick access mechanisms on the ‘All Photos’ page.
Figure 11 shows one part of the screen when a specific photo or video is opened. The arrows in-dicate three important mechanisms available to help members categorise and judge content. Members can rate (on a five-point scale) all videos and photos as well as being able to mark these as ‘Favourites’. When a member uploads or embeds a video and photo they have the option to add ‘Tags’ that help to categorise that piece of content. When the owner of the content adds a ‘Tag’ such as ‘food’ (as shown in Figure 11), members are able to type ‘food’ into the appropriate search engine and have all items with that Tag appear on the screen.
Figure 11: Mechanisms to help members categorise and judge content.
Data Collection and the Analysis of the Social Software Data collected were categorised into the three themes: Students, Learning, and Teacher (as shown earlier in Figure 1). Each of these themes was broken down into categories, and tags were created for each category. These categories can be seen in Appendix 1. The data was organised using Mi-crosoft OneNote software where folders and templates were set up. The student online activity during each phase was of prime importance in the analyses. Hence, for each class, individual stu-dent activity was summarised using a spreadsheet. Teacher planning documents, field notes and teacher reflections were also tagged and organised showing curricula links. Student work was tagged and summarised in themes. One example of this is shown in Appendix 2.
In the initial planning stages of the study, action research was chosen for its critical reflection and planning dynamics, as discussed by Armstrong and Moore (2004). As expected, the action re-search process was needed to continually improve and modify project designs and to find ways that encouraged active student participation. What was surprising, however, was the extent to
172
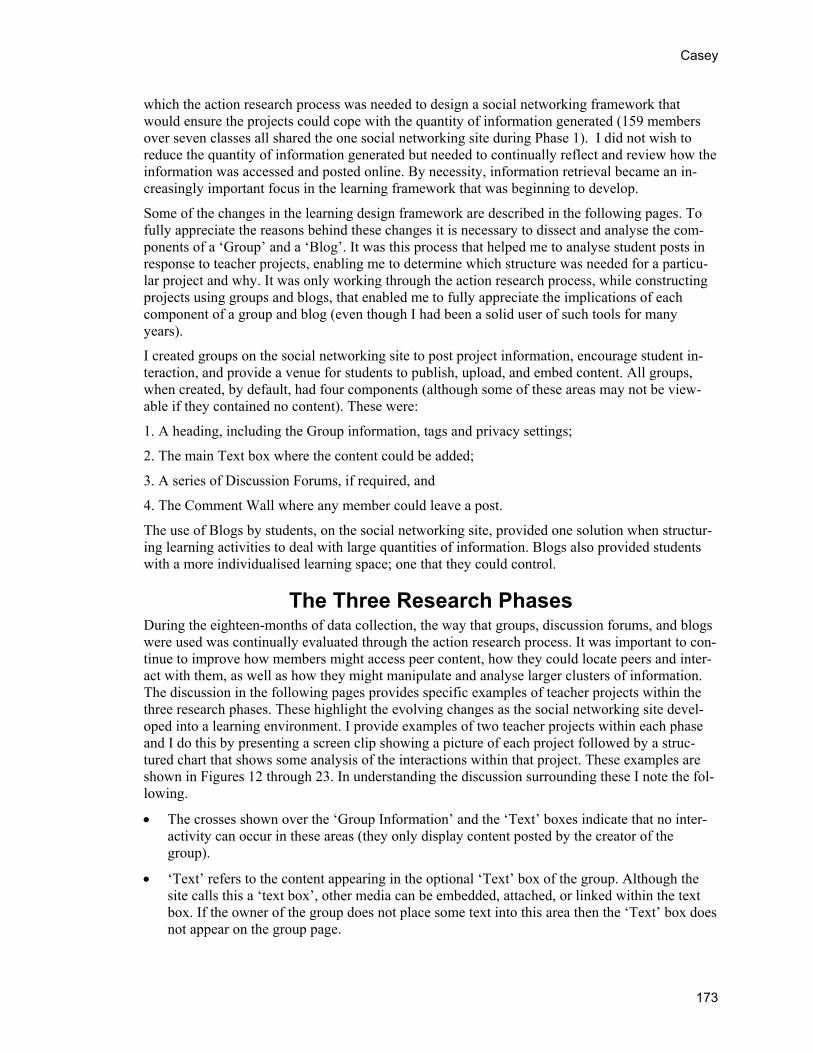
Casey
which the action research process was needed to design a social networking framework that would ensure the projects could cope with the quantity of information generated (159 members over seven classes all shared the one social networking site during Phase 1). I did not wish to reduce the quantity of information generated but needed to continually reflect and review how the information was accessed and posted online. By necessity, information retrieval became an in-creasingly important focus in the learning framework that was beginning to develop.
Some of the changes in the learning design framework are described in the following pages. To fully appreciate the reasons behind these changes it is necessary to dissect and analyse the com-ponents of a ‘Group’ and a ‘Blog’. It was this process that helped me to analyse student posts in response to teacher projects, enabling me to determine which structure was needed for a particu-lar project and why. It was only working through the action research process, while constructing projects using groups and blogs, that enabled me to fully appreciate the implications of each component of a group and blog (even though I had been a solid user of such tools for many years).
I created groups on the social networking site to post project information, encourage student in-teraction, and provide a venue for students to publish, upload, and embed content. All groups, when created, by default, had four components (although some of these areas may not be view-able if they contained no content). These were:
1. A heading, including the Group information, tags and privacy settings;
2. The main Text box where the content could be added;
3. A series of Discussion Forums, if required, and
4. The Comment Wall where any member could leave a post.
The use of Blogs by students, on the social networking site, provided one solution when structur-ing learning activities to deal with large quantities of information. Blogs also provided students with a more individualised learning space; one that they could control.
The Three Research Phases During the eighteen-months of data collection, the way that groups, discussion forums, and blogs were used was continually evaluated through the action research process. It was important to con-tinue to improve how members might access peer content, how they could locate peers and inter-act with them, as well as how they might manipulate and analyse larger clusters of information. The discussion in the following pages provides specific examples of teacher projects within the three research phases. These highlight the evolving changes as the social networking site devel-oped into a learning environment. I provide examples of two teacher projects within each phase and I do this by presenting a screen clip showing a picture of each project followed by a struc-tured chart that shows some analysis of the interactions within that project. These examples are shown in Figures 12 through 23. In understanding the discussion surrounding these I note the fol-lowing.
The crosses shown over the ‘Group Information’ and the ‘Text’ boxes indicate that no inter-activity can occur in these areas (they only display content posted by the creator of the group).
‘Text’ refers to the content appearing in the optional ‘Text’ box of the group. Although the site calls this a ‘text box’, other media can be embedded, attached, or linked within the text box. If the owner of the group does not place some text into this area then the ‘Text’ box does not appear on the group page.
173
Student-Centred Learning Framework
Any number of discussion forums may be created in a group and each discussion forum has the facility for members to post replies to that specific discussion. Any number of replies may be posted to a particular discussion. Similarly any number of comments may be posted on a group’s comment wall and these are usually comments specific to that group (not a particular discussion forum within that group).
The cross that is shown over the ‘Replies’ box indicates that, although members may post to this area, the messages, here, are expected to be responses only to the specific content ini-tially posted by the owner of the Discussion Forum. Confusion is caused when replies are made to previous replies. The ability to have one-to-one replies is very limited and it was found that as the quantity of replies increased, the interactivity of discussion became difficult for members to manage and understand. (This is because all replies are in date stamp order, as is the case with most site activity.) The cross over the ‘Comments on CW’ box similarly indicates that comments are not expected to be made in response to earlier comments.
Phase 1 of the Action Research Cycle – Semester 2, 2010 In the following two examples, from Phase 1, I highlight the complexities in using ‘Groups’ to post project work and the difficulties found when retrieving content and following student inter-actions as the level of online activity increased. The examples also point out the problems, when content was difficult to find, in finalising assessment at the end of the semester.
In Phase 1, I often created an online group to post my teacher project instructions. Students ini-tially retrieved these from a discussion forum that I had created within the particular group. I would then ‘Feature’ this discussion forum to ensure that it appeared at the top of the discussion list. However, students struggled with this for various reasons including the excessive number of mouse clicks, from the main home page, required to retrieve the information. As the first phase progressed, I modified this process, using the action research cycle, by analysing and altering dif-ferent organisational structures. I found that project instructions were more quickly retrieved by students if I posted them in a group text box, rather than a discussion forum within a group. Pro-ject instructions remained more visible, to students, when I placed the instructions in a group text box. This also required one less mouse click from the main page.
Phase 1 - Example 1 Figure 12 shows a screen clip of one of the early Phase 1 teacher project groups; the project was called ‘I can’t believe my eyes’. This example shows that once the number of discussion forum replies or comments flowed beyond one page (10 items can usually fit on one page) the informa-tion retrieval processes for students became more difficult and I needed to spend more time help-ing students find the information and to stay on task.
The heading in the text box is ‘Week 4 – Instructions’. A breakdown of the components for this group is shown in the structured diagram in Figure 13. This structured diagram provides the number of comments on the comment wall, of the group, and the number of discussion forums as well as the total number of replies on each page of the discussion forum. (Note that this group contained two pages of discussion forums.)
174
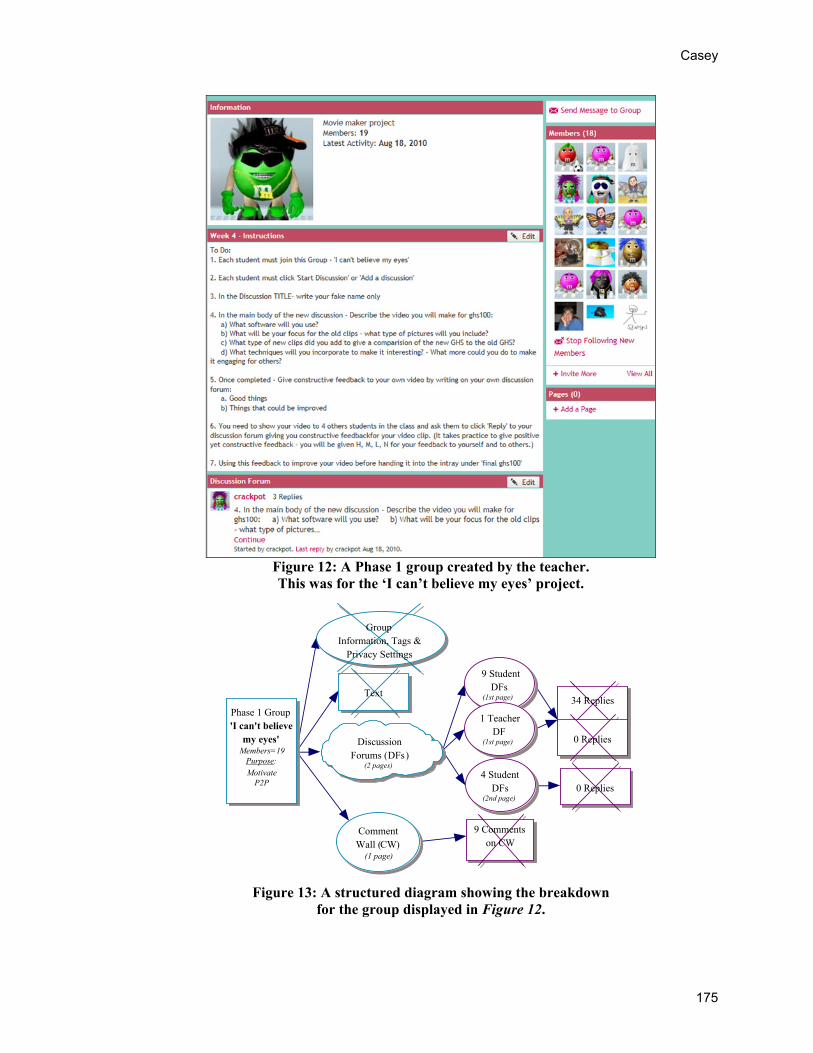
Casey
Figure 12: A Phase 1 group created by the teacher. This was for the ‘I can’t believe my eyes’ project.
Phase 1 Group'I can't believe
my eyes'Members=19
Purpose:
MotivateP2P
Comment Wall (CW)
(1 page)
DiscussionForums (DFs)
(2 pages)
9 Student DFs
(1st page)
1 Teacher DF
(1st page)
4 Student DFs
(2nd page)
34 Replies
0 Replies
0 Replies
9 Commentson CW
Text
GroupInformation, Tags &
Privacy Settings
Figure 13: A structured diagram showing the breakdown for the group displayed in Figure 12.
175
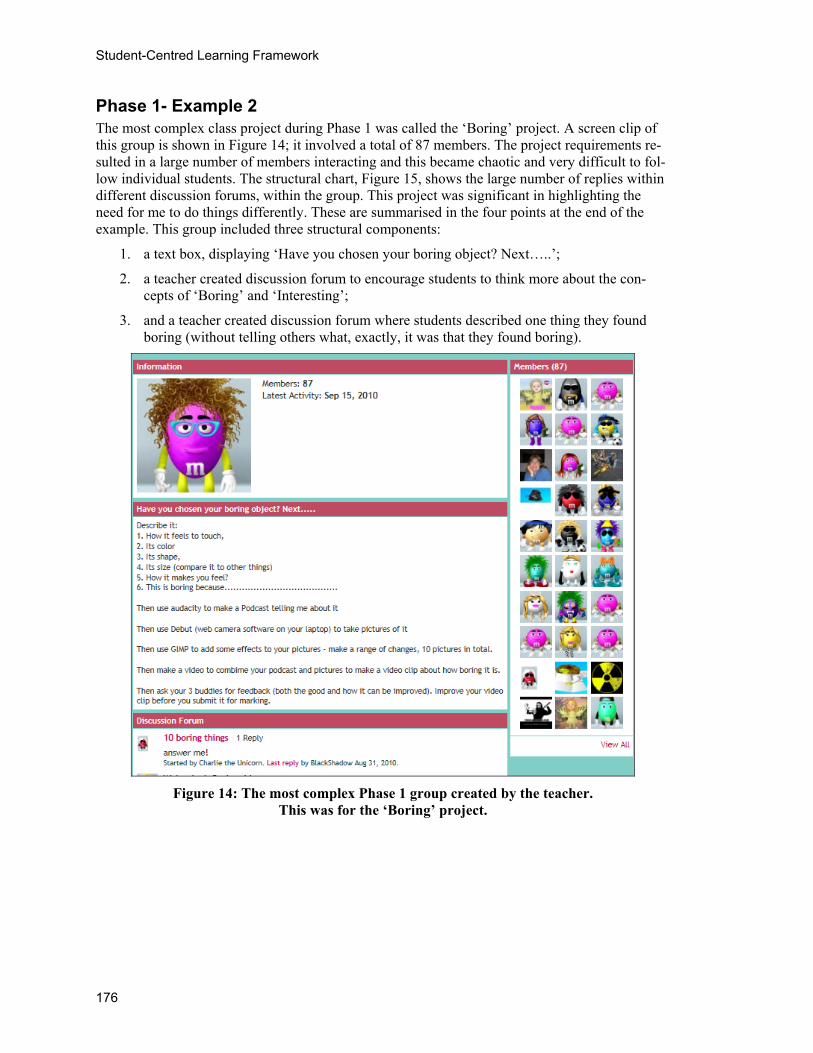
Student-Centred Learning Framework
Phase 1- Example 2 The most complex class project during Phase 1 was called the ‘Boring’ project. A screen clip of this group is shown in Figure 14; it involved a total of 87 members. The project requirements re-sulted in a large number of members interacting and this became chaotic and very difficult to fol-low individual students. The structural chart, Figure 15, shows the large number of replies within different discussion forums, within the group. This project was significant in highlighting the need for me to do things differently. These are summarised in the four points at the end of the example. This group included three structural components:
1. a text box, displaying ‘Have you chosen your boring object? Next…..’;
2. a teacher created discussion forum to encourage students to think more about the con-cepts of ‘Boring’ and ‘Interesting’;
3. and a teacher created discussion forum where students described one thing they found boring (without telling others what, exactly, it was that they found boring).
Figure 14: The most complex Phase 1 group created by the teacher. This was for the ‘Boring’ project.
176
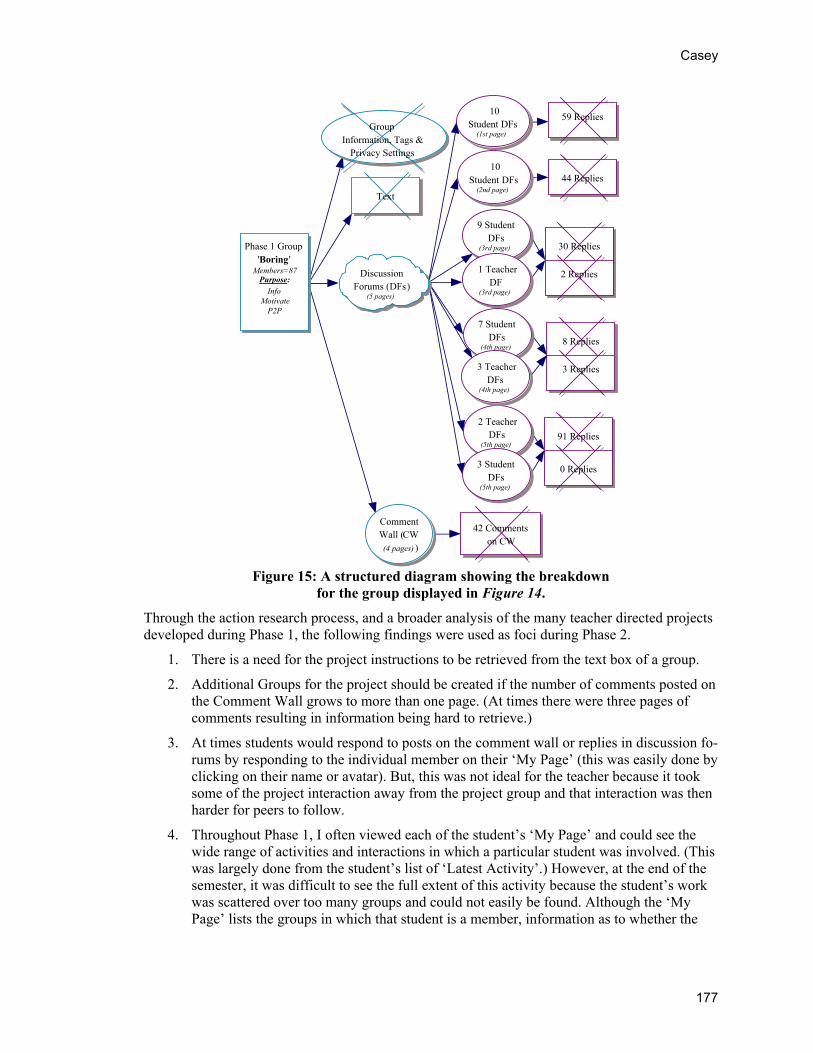
Casey
Phase 1 Group'Boring '
Members=87Purpose:
Info Motivate
P2P
Comment Wall (CW (4 pages) )
DiscussionForums (DFs)
(5 pages)
10 Student DFs
(1st page)
9 Student DFs
(3rd page)
59 Replies
44 Replies
30 Replies
42 Commentson CW
Text
1 Teacher DF
(3rd page)
2 Replies
2 Teacher DFs
(5th page)
3 Student DFs
(5th page)
91 Replies
0 Replies
7 Student DFs
(4th page)8 Replies
3 Teacher DFs
(4th page)
3 Replies
10 Student DFs
(2nd page)
GroupInformation, Tags &
Privacy Settings
Figure 15: A structured diagram showing the breakdown
for the group displayed in Figure 14.
Through the action research process, and a broader analysis of the many teacher directed projects developed during Phase 1, the following findings were used as foci during Phase 2.
1. There is a need for the project instructions to be retrieved from the text box of a group.
2. Additional Groups for the project should be created if the number of comments posted on the Comment Wall grows to more than one page. (At times there were three pages of comments resulting in information being hard to retrieve.)
3. At times students would respond to posts on the comment wall or replies in discussion fo-rums by responding to the individual member on their ‘My Page’ (this was easily done by clicking on their name or avatar). But, this was not ideal for the teacher because it took some of the project interaction away from the project group and that interaction was then harder for peers to follow.
4. Throughout Phase 1, I often viewed each of the student’s ‘My Page’ and could see the wide range of activities and interactions in which a particular student was involved. (This was largely done from the student’s list of ‘Latest Activity’.) However, at the end of the semester, it was difficult to see the full extent of this activity because the student’s work was scattered over too many groups and could not easily be found. Although the ‘My Page’ lists the groups in which that student is a member, information as to whether the
177
Student-Centred Learning Framework
student actively contributed to that group was not available without actually going into the particular group page. This was a concern when wanting to finalise assessment.
Phase 2 of the Action Research Cycle – Semester 1, 2011 As Phase 2 progressed, I began to realise that the decisions I was making within the action re-search cycle were growing in complexity, and the significant quantity of student interaction oc-curring within project work was also providing complex pictures of interaction and learning. I began to make connections with the work of Brent Davis and Dennis Sumara (2006) published in their book ‘Complexity and Education’. I gained confidence from the work of Sumara and Davis (2009) as well as Hayles (1990, 1991) and Doll (2005, 2012). The Chaos and Complexity within this study is discussed further and documented in Casey and Evans (2011). During Phase 2, it became clear that the way in which knowledge was being provided and structured on the online social site was achieving a more student-centred environment than in my previous teaching ex-perience. An increasing number of students were interacting and sharing their ideas. From this sharing, the data showed that students were able to be the providers of some types of knowledge for their peers. The words of Ravenscroft and Cook provide a central pedagogical idea that sup-ports the type of learning that I valued through this student interaction, “…students should learn to think and to think together” (Ravenscroft & Cook, 2007). I called this approach ‘knowledge-building’ and connections to this type of pedagogy, for this study, are discussed further in Casey (2011).
Data from Phase 2 highlights the development of a knowledge-building priority within the action research process. During this phase students were not always asked to join the teacher project groups and were often encouraged to view the project instructions without joining the group and, hence, often did not post comments or interact on the group page. As will be explained in the ex-amples, this helped to relieve the congestion of student interaction in discussion forums and groups.
Phase 2 - Example 1 One teacher project group, within Phase 2, was called ‘Data Visualisation’, shown in Figure 16. This group was created to encourage students to connect mathematics with real world concepts such as earthquakes and floods. Membership to the group was optional and I note that the group only had three members. This was because students could engage with the activity by using the websites and information provided on the group, but they were not required to post comments or content with the group online page. The absence of interaction within the group page can be seen in the structured chart of the group, shown in Figure 17.
178
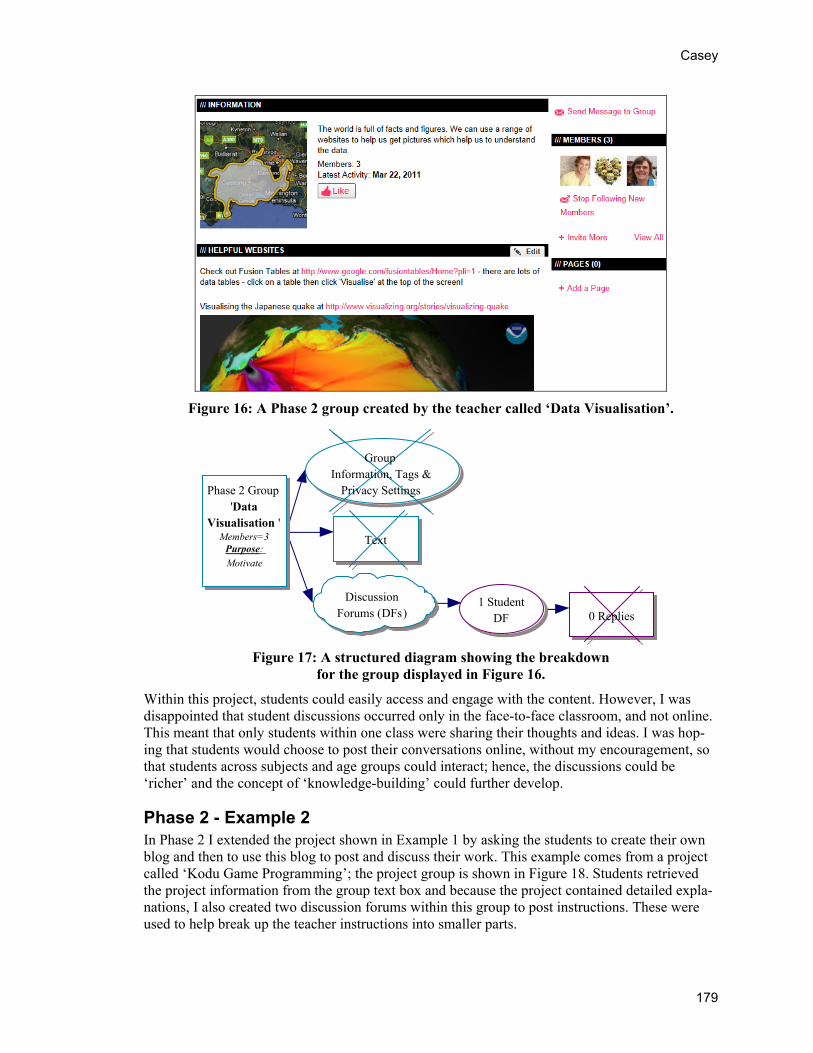
Casey
Figure 16: A Phase 2 group created by the teacher called ‘Data Visualisation’.
Phase 2 Group'Data
Visualisation 'Members=3
Purpose:
Motivate
Text
DiscussionForums (DFs)
1 StudentDF 0 Replies
GroupInformation, Tags &
Privacy Settings
Figure 17: A structured diagram showing the breakdown
for the group displayed in Figure 16.
Within this project, students could easily access and engage with the content. However, I was disappointed that student discussions occurred only in the face-to-face classroom, and not online. This meant that only students within one class were sharing their thoughts and ideas. I was hop-ing that students would choose to post their conversations online, without my encouragement, so that students across subjects and age groups could interact; hence, the discussions could be ‘richer’ and the concept of ‘knowledge-building’ could further develop.
Phase 2 - Example 2 In Phase 2 I extended the project shown in Example 1 by asking the students to create their own blog and then to use this blog to post and discuss their work. This example comes from a project called ‘Kodu Game Programming’; the project group is shown in Figure 18. Students retrieved the project information from the group text box and because the project contained detailed expla-nations, I also created two discussion forums within this group to post instructions. These were used to help break up the teacher instructions into smaller parts.
179
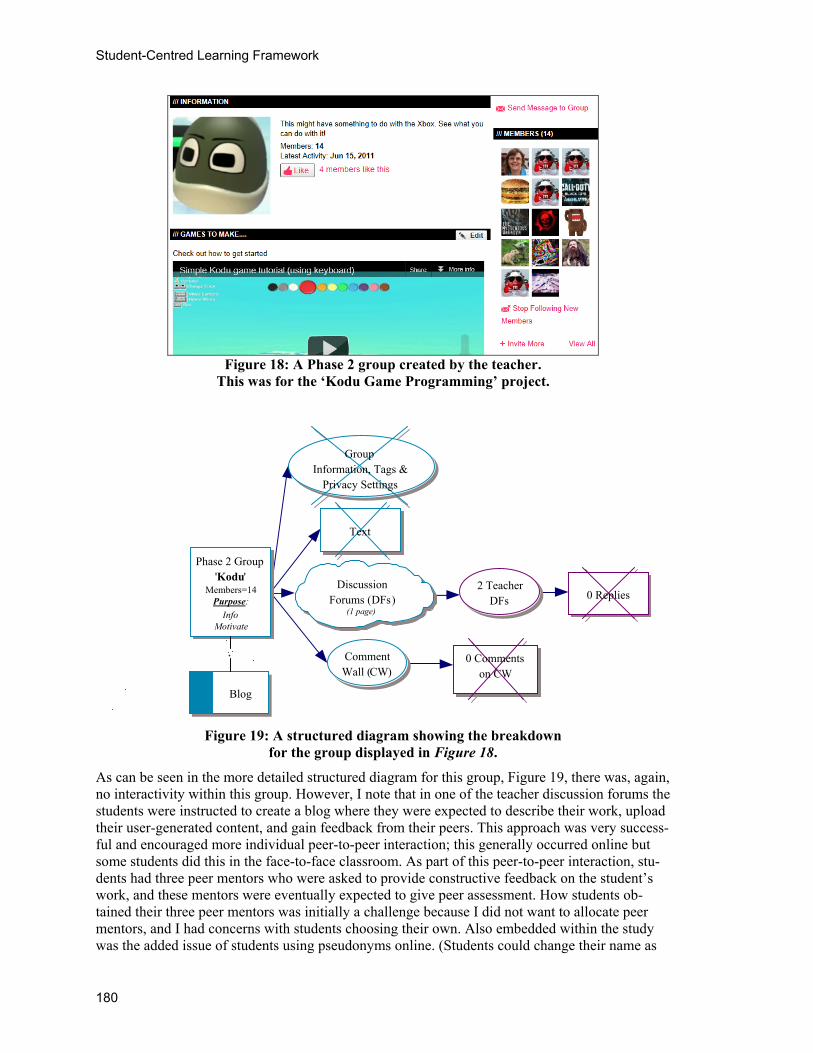
Student-Centred Learning Framework
Figure 18: A Phase 2 group created by the teacher.
This was for the ‘Kodu Game Programming’ project.
Phase 2 Group'Kodu'
Members=14Purpose:
InfoMotivate
Comment Wall (CW)
DiscussionForums (DFs)
(1 page)
2 Teacher DFs 0 Replies
0 Commentson CW
Text
Blog
GroupInformation, Tags &
Privacy Settings
Figure 19: A structured diagram showing the breakdown for the group displayed in Figure 18.
As can be seen in the more detailed structured diagram for this group, Figure 19, there was, again, no interactivity within this group. However, I note that in one of the teacher discussion forums the students were instructed to create a blog where they were expected to describe their work, upload their user-generated content, and gain feedback from their peers. This approach was very success-ful and encouraged more individual peer-to-peer interaction; this generally occurred online but some students did this in the face-to-face classroom. As part of this peer-to-peer interaction, stu-dents had three peer mentors who were asked to provide constructive feedback on the student’s work, and these mentors were eventually expected to give peer assessment. How students ob-tained their three peer mentors was initially a challenge because I did not want to allocate peer mentors, and I had concerns with students choosing their own. Also embedded within the study was the added issue of students using pseudonyms online. (Students could change their name as
180
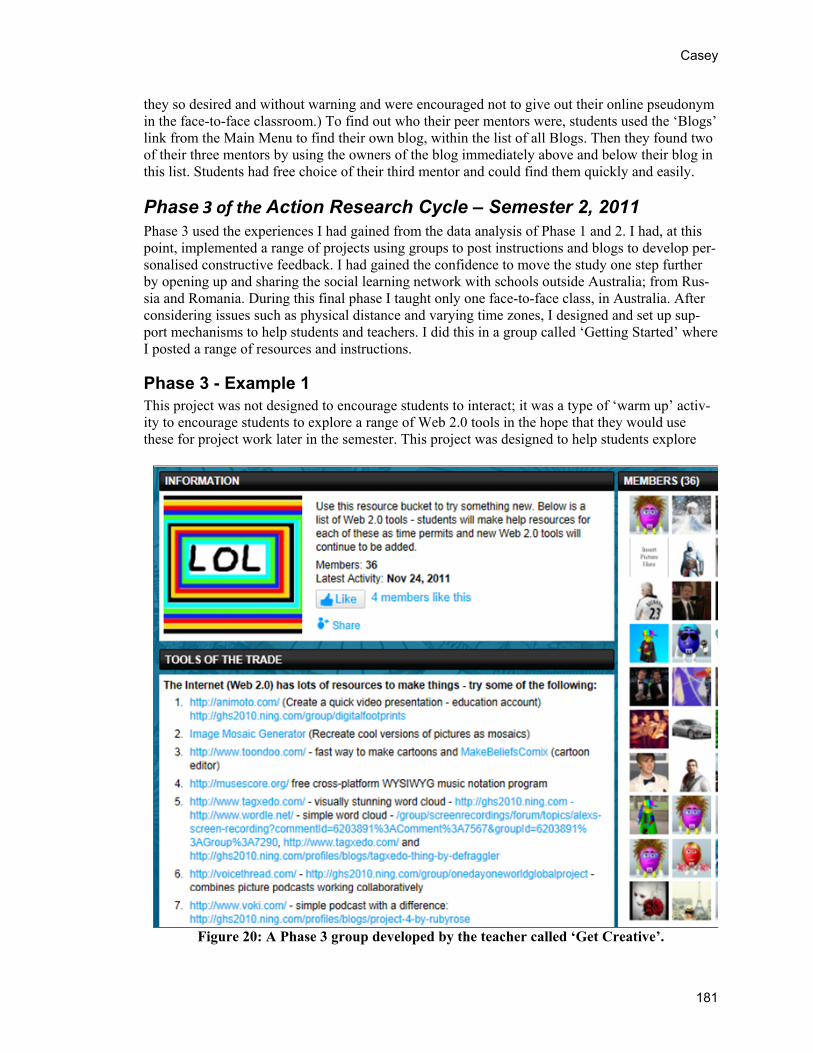
Casey
they so desired and without warning and were encouraged not to give out their online pseudonym in the face-to-face classroom.) To find out who their peer mentors were, students used the ‘Blogs’ link from the Main Menu to find their own blog, within the list of all Blogs. Then they found two of their three mentors by using the owners of the blog immediately above and below their blog in this list. Students had free choice of their third mentor and could find them quickly and easily.
Phase 3 of the Action Research Cycle – Semester 2, 2011 Phase 3 used the experiences I had gained from the data analysis of Phase 1 and 2. I had, at this point, implemented a range of projects using groups to post instructions and blogs to develop per-sonalised constructive feedback. I had gained the confidence to move the study one step further by opening up and sharing the social learning network with schools outside Australia; from Rus-sia and Romania. During this final phase I taught only one face-to-face class, in Australia. After considering issues such as physical distance and varying time zones, I designed and set up sup-port mechanisms to help students and teachers. I did this in a group called ‘Getting Started’ where I posted a range of resources and instructions.
Phase 3 - Example 1 This project was not designed to encourage students to interact; it was a type of ‘warm up’ activ-ity to encourage students to explore a range of Web 2.0 tools in the hope that they would use these for project work later in the semester. This project was designed to help students explore
Figure 20: A Phase 3 group developed by the teacher called ‘Get Creative’.
181
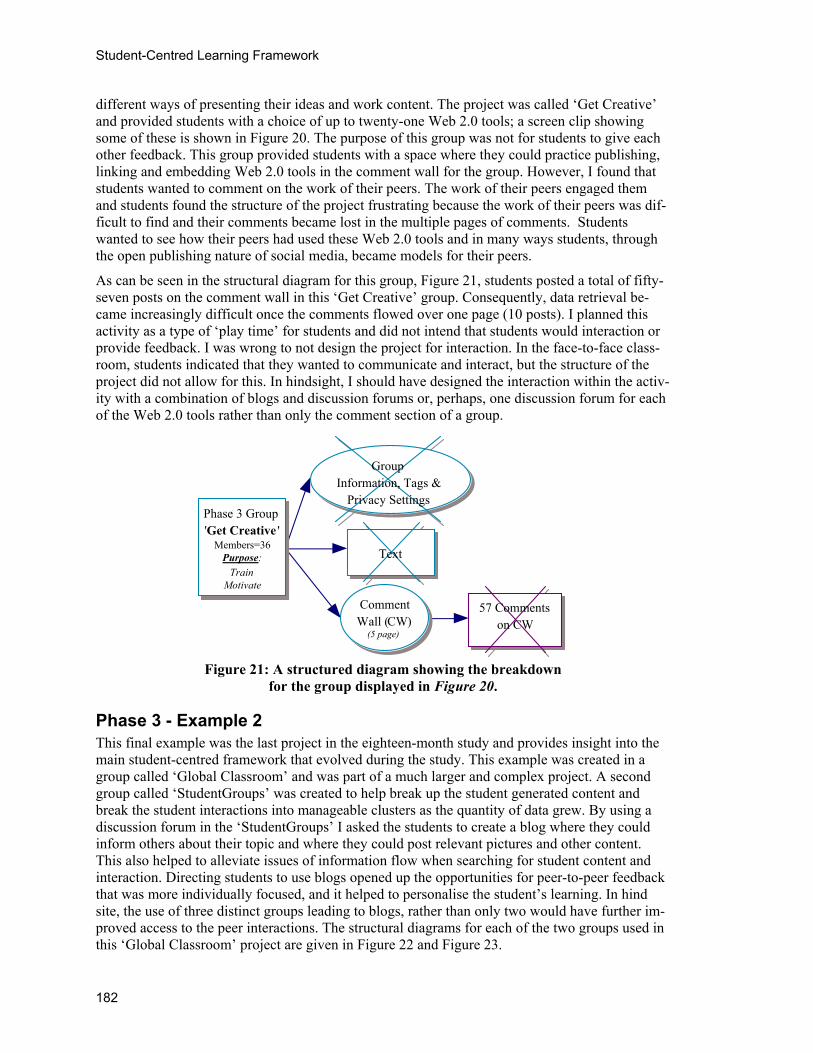
Student-Centred Learning Framework
different ways of presenting their ideas and work content. The project was called ‘Get Creative’ and provided students with a choice of up to twenty-one Web 2.0 tools; a screen clip showing some of these is shown in Figure 20. The purpose of this group was not for students to give each other feedback. This group provided students with a space where they could practice publishing, linking and embedding Web 2.0 tools in the comment wall for the group. However, I found that students wanted to comment on the work of their peers. The work of their peers engaged them and students found the structure of the project frustrating because the work of their peers was dif-ficult to find and their comments became lost in the multiple pages of comments. Students wanted to see how their peers had used these Web 2.0 tools and in many ways students, through the open publishing nature of social media, became models for their peers.
As can be seen in the structural diagram for this group, Figure 21, students posted a total of fifty-seven posts on the comment wall in this ‘Get Creative’ group. Consequently, data retrieval be-came increasingly difficult once the comments flowed over one page (10 posts). I planned this activity as a type of ‘play time’ for students and did not intend that students would interaction or provide feedback. I was wrong to not design the project for interaction. In the face-to-face class-room, students indicated that they wanted to communicate and interact, but the structure of the project did not allow for this. In hindsight, I should have designed the interaction within the activ-ity with a combination of blogs and discussion forums or, perhaps, one discussion forum for each of the Web 2.0 tools rather than only the comment section of a group.
Phase 3 Group'Get Creative '
Members=36Purpose:
TrainMotivate
Comment Wall (CW)
(5 page)
57 Commentson CW
Text
GroupInformation, Tags &
Privacy Settings
Figure 21: A structured diagram showing the breakdown
for the group displayed in Figure 20.
Phase 3 - Example 2 This final example was the last project in the eighteen-month study and provides insight into the main student-centred framework that evolved during the study. This example was created in a group called ‘Global Classroom’ and was part of a much larger and complex project. A second group called ‘StudentGroups’ was created to help break up the student generated content and break the student interactions into manageable clusters as the quantity of data grew. By using a discussion forum in the ‘StudentGroups’ I asked the students to create a blog where they could inform others about their topic and where they could post relevant pictures and other content. This also helped to alleviate issues of information flow when searching for student content and interaction. Directing students to use blogs opened up the opportunities for peer-to-peer feedback that was more individually focused, and it helped to personalise the student’s learning. In hind site, the use of three distinct groups leading to blogs, rather than only two would have further im-proved access to the peer interactions. The structural diagrams for each of the two groups used in this ‘Global Classroom’ project are given in Figure 22 and Figure 23.
182
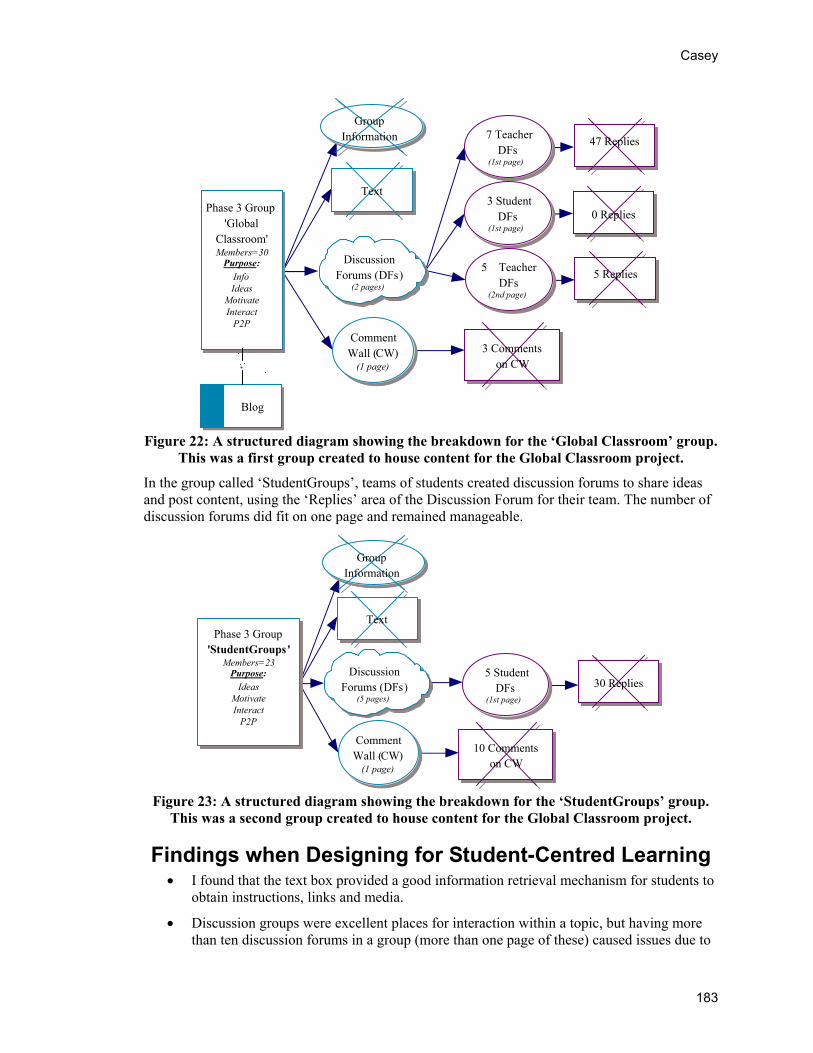
Casey
Phase 3 Group'Global
Classroom'Members=30
Purpose:
InfoIdeas
MotivateInteract
P2P
Comment Wall (CW)
(1 page)
DiscussionForums (DFs)
(2 pages)
7 Teacher DFs
(1st page)
47 Replies
0 Replies
3 Commentson CW
Text
GroupInformation
3 Student DFs
(1st page)
5 Teacher DFs
(2nd page)
5 Replies
Blog
Figure 22: A structured diagram showing the breakdown for the ‘Global Classroom’ group.
This was a first group created to house content for the Global Classroom project.
In the group called ‘StudentGroups’, teams of students created discussion forums to share ideas and post content, using the ‘Replies’ area of the Discussion Forum for their team. The number of discussion forums did fit on one page and remained manageable.
Phase 3 Group'StudentGroups'
Members=23Purpose:
IdeasMotivateInteract
P2P
Comment Wall (CW)
(1 page)
DiscussionForums (DFs)
(5 pages)
30 Replies
10 Commentson CW
Text
GroupInformation
5 Student DFs
(1st page)
Figure 23: A structured diagram showing the breakdown for the ‘StudentGroups’ group.
This was a second group created to house content for the Global Classroom project.
Findings when Designing for Student-Centred Learning I found that the text box provided a good information retrieval mechanism for students to
obtain instructions, links and media.
Discussion groups were excellent places for interaction within a topic, but having more than ten discussion forums in a group (more than one page of these) caused issues due to
183

Student-Centred Learning Framework
the difficulty in managing the number of student interactions and in finding content. (It was not possible to automatically set the maximum number of Discussion Forums to ten.)
Groups were helpful in gaining an overview of the student’s interests and broader activ-ity.
Using blogs rather than discussion forums for students to publish their work was beneficial in numerous ways. Four of the most significant of these are listed below.
Although assessment occurred throughout the semester, using blogs greatly assisted the teacher at the end of the semester to view the student’s progress of content, interaction and communication.
The blog comments were usually easily accessible and, hence more manageable.
Students could at any time click on their own ‘Blog Posts’ from their ‘My Page’ to view all of their work and feedback. They could also view any other member’s blog from that member’s ‘My Page’.
Conclusion Initially, I did not consider that analysing each of the online spaces within the social media site in such detail would be such a key foci for this study. The dynamic nature of the site and its ability to encourage new ways of interactivity forced this structural thinking and analysis. The quick ac-cess links, such as those on the main menu and the main page, were vital in channelling the stu-dent interaction quickly into the desired pathways. The effective search mechanism was also very useful in finding members and student content. The design structure of teacher projects changed, depending on the project aims, but an efficient and effective structure was important to ensure that student feedback and interaction did not become congested and that students did not become distracted or overloaded with information. Through this research study, a learning framework that valued the unique attributes of social media evolved. The action research cycle, including the process of dissecting each of the online spaces, as discussed in this article, was a core component in the study.
Like Luckin et al. (2009), I found that the use of the online spaces and tools were complex. The manner in which social and participatory media were used in the learning design of this study draws on the new sciences of chaos and complexity to develop a different sense of instruction, as explained by Doll (2012). He describes this new type of instruction as open, dynamic, relational, creative, and systems oriented. In this study, the teacher projects were only one of the many ave-nues of learning that were created in the social software framework. Opportunities to provide learners with a more individualised learning space than the face-to-face classroom were achieved though the student ‘My Page’, individual blogs, and student directed groups. Students were able to obtain personalised feedback (from peers and teacher) and could create their own groups and discussion forums to share and build knowledge based on their interests. Students could also learn and interact with those from different subjects and age levels as well as with schools internation-ally. Through the interactivity and the open publishing nature of the social software, students were able to be models for their peers.
It is now common for many learning management systems to offer a range of social spaces such as blogs, groups, and discussion forums. This article focused on building a student-centred learn-ing environment and provided a discussion on the issues, choices, and complexity when design-ing learning with such spaces. Thomas and Brown (2011) point out that these environments are enabling our students to learn in new ways, sometimes called “hanging out”, “messing around” and “geeking out”. But, as I found, hidden in the shadows of these new ways are the quick access links and pathways that enable efficient and effective interaction and information flow.
184
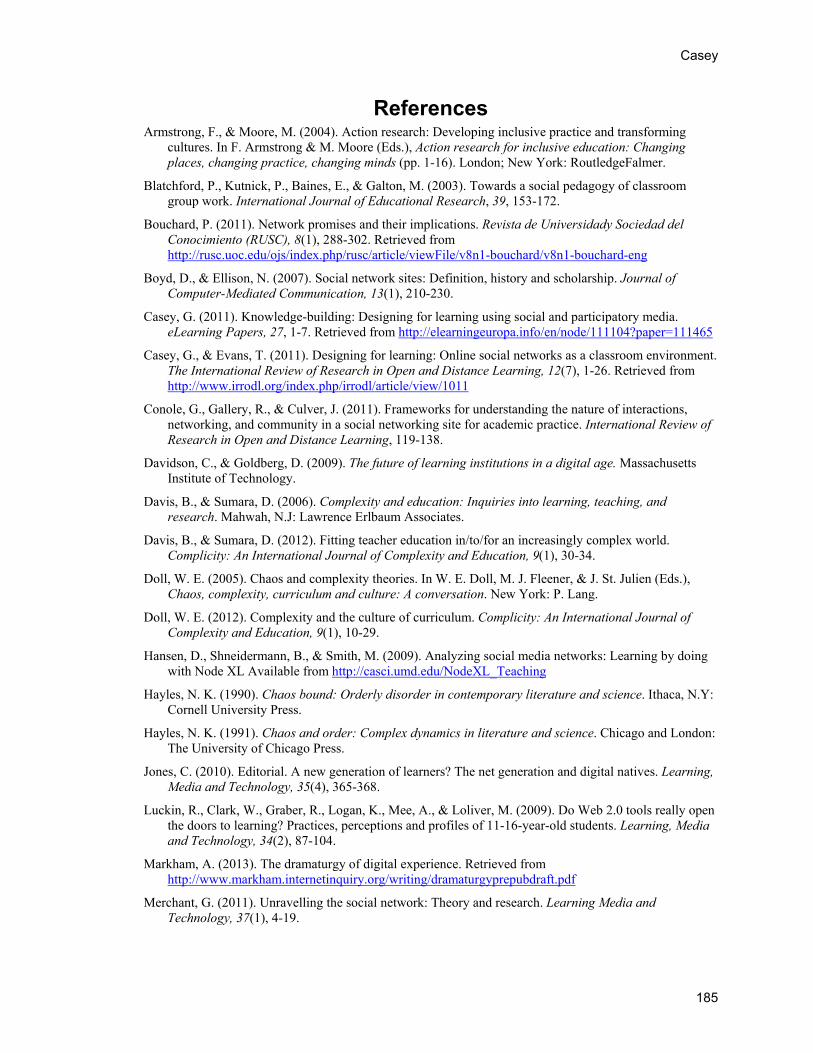
Casey
References Armstrong, F., & Moore, M. (2004). Action research: Developing inclusive practice and transforming
cultures. In F. Armstrong & M. Moore (Eds.), Action research for inclusive education: Changing places, changing practice, changing minds (pp. 1-16). London; New York: RoutledgeFalmer.
Blatchford, P., Kutnick, P., Baines, E., & Galton, M. (2003). Towards a social pedagogy of classroom group work. International Journal of Educational Research, 39, 153-172.
Bouchard, P. (2011). Network promises and their implications. Revista de Universidady Sociedad del Conocimiento (RUSC), 8(1), 288-302. Retrieved from http://rusc.uoc.edu/ojs/index.php/rusc/article/viewFile/v8n1-bouchard/v8n1-bouchard-eng
Boyd, D., & Ellison, N. (2007). Social network sites: Definition, history and scholarship. Journal of Computer-Mediated Communication, 13(1), 210-230.
Casey, G. (2011). Knowledge-building: Designing for learning using social and participatory media. eLearning Papers, 27, 1-7. Retrieved from http://elearningeuropa.info/en/node/111104?paper=111465
Casey, G., & Evans, T. (2011). Designing for learning: Online social networks as a classroom environment. The International Review of Research in Open and Distance Learning, 12(7), 1-26. Retrieved from http://www.irrodl.org/index.php/irrodl/article/view/1011
Conole, G., Gallery, R., & Culver, J. (2011). Frameworks for understanding the nature of interactions, networking, and community in a social networking site for academic practice. International Review of Research in Open and Distance Learning, 119-138.
Davidson, C., & Goldberg, D. (2009). The future of learning institutions in a digital age. Massachusetts Institute of Technology.
Davis, B., & Sumara, D. (2006). Complexity and education: Inquiries into learning, teaching, and research. Mahwah, N.J: Lawrence Erlbaum Associates.
Davis, B., & Sumara, D. (2012). Fitting teacher education in/to/for an increasingly complex world. Complicity: An International Journal of Complexity and Education, 9(1), 30-34.
Doll, W. E. (2005). Chaos and complexity theories. In W. E. Doll, M. J. Fleener, & J. St. Julien (Eds.), Chaos, complexity, curriculum and culture: A conversation. New York: P. Lang.
Doll, W. E. (2012). Complexity and the culture of curriculum. Complicity: An International Journal of Complexity and Education, 9(1), 10-29.
Hansen, D., Shneidermann, B., & Smith, M. (2009). Analyzing social media networks: Learning by doing with Node XL Available from http://casci.umd.edu/NodeXL_Teaching
Hayles, N. K. (1990). Chaos bound: Orderly disorder in contemporary literature and science. Ithaca, N.Y: Cornell University Press.
Hayles, N. K. (1991). Chaos and order: Complex dynamics in literature and science. Chicago and London: The University of Chicago Press.
Jones, C. (2010). Editorial. A new generation of learners? The net generation and digital natives. Learning, Media and Technology, 35(4), 365-368.
Luckin, R., Clark, W., Graber, R., Logan, K., Mee, A., & Loliver, M. (2009). Do Web 2.0 tools really open the doors to learning? Practices, perceptions and profiles of 11-16-year-old students. Learning, Media and Technology, 34(2), 87-104.
Markham, A. (2013). The dramaturgy of digital experience. Retrieved from http://www.markham.internetinquiry.org/writing/dramaturgyprepubdraft.pdf
Merchant, G. (2011). Unravelling the social network: Theory and research. Learning Media and Technology, 37(1), 4-19.
185
Student-Centred Learning Framework
Nuthall, G. (2007). The hidden lives of learners. Wellington, N.Z: New Zealand Council for Educational Research.
Ravenscroft, A., & Cook, J. (2007). New horizons in learning design. In H. Beetham & R. Sharpe (Eds.), Rethinking pedagogy for a digital age (pp. 207-218). New York Routledge.
Ryan, S., Magro, M., & Sharp, J. (2011). Exploring educational and cultural adaption through social networking sites. Journal of Information Technolgy Education: Innovations in Practice, 10, 1-16. Retrieved from http://www.jite.org/documents/Vol10/JITEv10IIPp001-016Ryan883.pdf
Selwyn, N. (2008). From state-of-the-art to state-of-the-actural? Introduction to a special issue. Technology, Pedagogy and Education, 17(2), 83-87.
Selwyn, N., & Grant, L. (2009). Researching the realities of social software use - An introduction. Learning Media and Technology, 34(2), 79-86.
Siemens, G. (2008). Learning and knowing in networks: Changing roles for educators and designers. Paper 105: University of Georgia IT Forum. Retrieved from http://it.coe.uga.edu/itforum/Paper105/Siemens.pdf
Sumara, D., & Davis, B. (2009). Complexity theory and action research. In S. Nofftke & B. Somekh (Eds.), The Sage handbook of educational action research (pp. 358-369). London: Sage.
Thomas, D., & Brown, J., S. (2011). A new culture of learning : Cultivating the imagination for a world of constant change. Charleston, USA: Amazon.com.
186
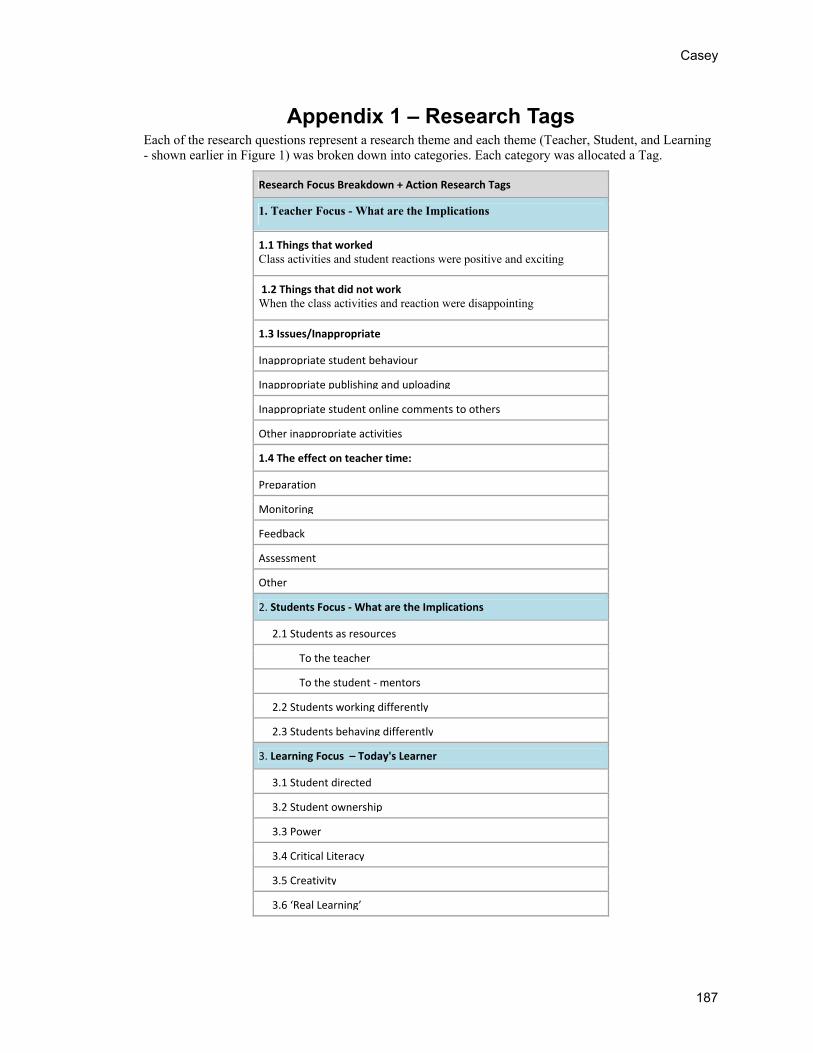
Casey
Appendix 1 – Research Tags Each of the research questions represent a research theme and each theme (Teacher, Student, and Learning - shown earlier in Figure 1) was broken down into categories. Each category was allocated a Tag.
Research Focus Breakdown + Action Research Tags
1. Teacher Focus - What are the Implications
1.1 Things that worked Class activities and student reactions were positive and exciting
1.2 Things that did not work When the class activities and reaction were disappointing
1.3 Issues/Inappropriate
Inappropriate student behaviour
Inappropriate publishing and uploading
Inappropriate student online comments to others
Other inappropriate activities
1.4 The effect on teacher time:
Preparation
Monitoring
Feedback
Assessment
Other
2. Students Focus ‐ What are the Implications
2.1 Students as resources
To the teacher
To the student ‐ mentors
2.2 Students working differently
2.3 Students behaving differently
3. Learning Focus – Today's Learner
3.1 Student directed
3.2 Student ownership
3.3 Power
3.4 Critical Literacy
3.5 Creativity
3.6 ‘Real Learning’
187
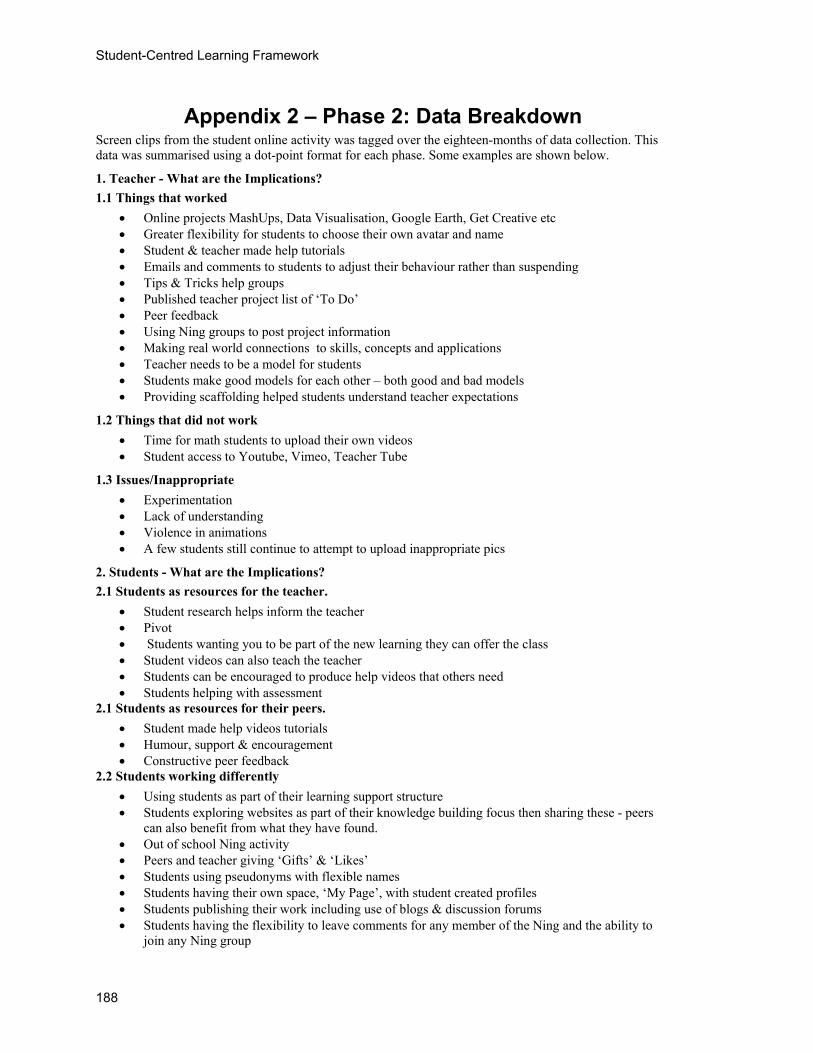
Student-Centred Learning Framework
Appendix 2 – Phase 2: Data Breakdown Screen clips from the student online activity was tagged over the eighteen-months of data collection. This data was summarised using a dot-point format for each phase. Some examples are shown below.
1. Teacher - What are the Implications?
1.1 Things that worked
Online projects MashUps, Data Visualisation, Google Earth, Get Creative etc Greater flexibility for students to choose their own avatar and name Student & teacher made help tutorials Emails and comments to students to adjust their behaviour rather than suspending Tips & Tricks help groups Published teacher project list of ‘To Do’ Peer feedback Using Ning groups to post project information Making real world connections to skills, concepts and applications Teacher needs to be a model for students Students make good models for each other – both good and bad models Providing scaffolding helped students understand teacher expectations
1.2 Things that did not work
Time for math students to upload their own videos Student access to Youtube, Vimeo, Teacher Tube
1.3 Issues/Inappropriate
Experimentation Lack of understanding Violence in animations A few students still continue to attempt to upload inappropriate pics
2. Students - What are the Implications?
2.1 Students as resources for the teacher.
Student research helps inform the teacher Pivot Students wanting you to be part of the new learning they can offer the class Student videos can also teach the teacher Students can be encouraged to produce help videos that others need Students helping with assessment
2.1 Students as resources for their peers.
Student made help videos tutorials Humour, support & encouragement Constructive peer feedback
2.2 Students working differently
Using students as part of their learning support structure Students exploring websites as part of their knowledge building focus then sharing these - peers
can also benefit from what they have found. Out of school Ning activity Peers and teacher giving ‘Gifts’ & ‘Likes’ Students using pseudonyms with flexible names Students having their own space, ‘My Page’, with student created profiles Students publishing their work including use of blogs & discussion forums Students having the flexibility to leave comments for any member of the Ning and the ability to
join any Ning group
188

Casey
189
g
tions
Acknowledgement I would like to acknowledge my doctorial supervisors Professor Terry Evans and Dr Muriel Wells, Deakin University, Australia, for their continued advice and support throughout this doc-toral research study.
Biography As this article was finalised, Gail Casey was in the examination phase of her doctorate of education through Deakin University, Australia. Her doctoral research has now been published in five peer reviewed journals. In 2012, Gail presented at two peer reviewed conferences in the USA (EdMedia, Denver and ISTE, San Diego) and was awarded, by ISTE, first place in the SIGOL Online Learning Awards for the in-novative contribution her research has made. She is a currently writinas part of a publication scholarship and is in search of a postdoctoral research position to further her work on how educators may take ad-vantage of the unique qualities of social and participatory media. Her work can be found at http://gcasey.wikispaces.com/Presenta

This page left blank intentionally
Journal of Information Technology Education: Research Volume 12, 2013
Integrating Online Assignments Checking in Introductory Courses
David Pundak Web Learning Unit,
ORT Braude Engineering College; Engineering School
Kinneret College, Israel
Miri Shacham Teaching Dept.,
ORT Braude Engineering College,
Israel
Orit Herscovitz Teaching
Technology and Science Dept.,
Technion Science University, Israel
Executive Summary Web technology offers lecturers the option of checking students’ assignments online. Several sys-tems have evolved to deliver personal assignments to each student in a multi-participant course. These systems provide students with immediate feedback, allowing them to correct erroneous answers and referring them to relevant literary sources that can assist them with their assign-ments. These strategies influence the lecturers’ teaching and their ability to respond to students’ difficulties in real-time. The study examines student attitudes concerning the integration of the WebAssign (WA) Online Assignment Checker (OAC) in the teaching of academic courses. An on-line questionnaire investigated attitudes of 75 engineering students studying introductory aca-demic courses assisted by OAC. The questionnaire included the following six dimensions: in-volvement and interest, understanding the studied material, lecturers’ consideration of students’ difficulties, importance of the course, tutorial methods and dishonest assignment submission. Significant findings emerged for attitudes in three dimensions. The students think that OAC assist lecturers to relate to their difficulties, contribute to their success in the course, and do not encour-age cheating such as copying. No preference was found between submitting homework in hard-copy or online.
Keywords: Online assignment Checker - OAC, Student Attitudes, Understanding, Involvement, dishonest learner behavior.
Introduction In recent years various strategies have developed to practice and evaluate students’ learning mate-rial through online data bases including: online questions, tasks, learning classes, and up-to-date
reports of student achievements. This paper examines the use of an Online Assignment Checker (OAC) in web en-vironment. The OAC allows academic or teaching staff to construct online as-signments where each assignment is composed of series of questions dealing with issues studied in the course, or to present preparatory questions before the next lesson. The OAC allows students to cope with weekly assignments
Material published as part of this publication, either on-line or in print, is copyrighted by the Informing Science Institute. Permission to make digital or paper copy of part or all of these works for personal or classroom use is granted without fee provided that the copies are not made or distributed for profit or commercial advantage AND that copies 1) bear this notice in full and 2) give the full citation on the first page. It is per-missible to abstract these works so long as credit is given. To copy in all other cases or to republish or to post on a server or to redistribute to lists requires specific permission and payment of a fee. Contact [email protected] to request redistribution permission.
Editor: Lorraine Staehr
Integrating Online Assignments Checking
throughout the semester. On submission of the assignment, students receive immediate feedback for their responses through the OAC. In many cases the OAC allows additional opportunities to try again and correct mistaken responses (Bonham, Beichner, & Deardorff, 2001; Brewer, 2009; Cuadros, Yaron, Leinhardt, 2007; Freasier, 2003; Liberatore, 2011; Pundak, Maharshak, & Rozner, 2004).
The decision to integrate the OAC in introductory courses at the engineering college was based on the following aspects:
1. Improvement of assignment checking – providing a methodical weekly response to as-signments for large groups of students.
2. Providing feedback to students – in the absence of orderly response, many students find it difficult to assess their status in relation to the course goals during the course. Using the OAC, students can follow their achievements throughout the course, and improve their performances.
3. Providing feedback to the lecturer – the system enables the lecturer to read the stu-dents’ responses and grade each of the questions, to use statistical tools to assess each student’s success and to obtain a comprehensive picture of the performances of the entire class. This information allows the lecturer to adapt the next lesson in consideration of the students’ difficulties.
4. Improvement of student involvement – students’ active participation in the perform-ance of online assignments facilitates their greater involvement and responsibility throughout the learning process. This system complies with the “Just-in-Time teaching” approach (Mazur, 1997; Novak, Patterson, & Gavrin, 2000), since the OAC allows the lecturer to provide continuous consideration of students’ difficulties during the lesson (Redish, Steinberg, & Saul, 1998).
Integrating the OAC in Teaching There are various online assignment checkers: WA, LON-CAPA, Sapling Learning, Mastering-Chemistry, OWL – Online Web Learning, ALEKS and WileyPLUS. They can be classified into three main categories:
1. Tools in learning systems – these OACs are part of Leaning Management Systems (LMS). The LMS provide tools for the construction of online questions, the composition of questions for online assignments, management of grades, and reporting. For example, the Moodle environment facilitates the management of online assignments. The disad-vantage is that the lecturer must construct the questions.
2. Open code systems – for example, LON-CAPA. The system is based on the use of an open code and can be downloaded and installed without fee. The responsibility for the in-tegration of the system is imposed on the institution that uses it. These systems have sites that allow files of questions and assignments prepared by lecturers in other educational institutions to be downloaded. The lecturers who want to adopt the questions must check the appropriateness of the assignments for their own goals.
3. Commercial systems – such as ALEKS, OWL, WA, and WileyPLUS – allow questions to be mined from textbooks. After the lecturers have chosen an appropriate textbook, they can obtain the questions that appear in the online book approved by quality assurance. The advantage of these systems is that they offer a large variety of contents. The main disadvantage is the cost of the service.
The OAC system offers the lecturer new options that did not exist in traditional exercises, such as (a) random numbers– each student can be given similar questions, but the data that each one sees will be different, (b) immediate feedback – after the student answers, the system immediately re-
192
Pundak, Shacham, & Herscovitz
sponds and indicates whether the answer is correct or incorrect, (c) if the answer was incorrect the student is given an opportunity to submit another answer. In many cases hints or reading texts from textbooks are provided, (d) planning the assignments – questions can be chosen from a very large reservoir, and the average time that it takes a student to answer a question is known in ad-vance, (e) mixing questions – the computerized system allows different questions or a different order of questions to be given to each student.
Lecturers’ Attitudes Concerning OAC In traditional teaching where lecturers are required to check homework they usually use one of three methods: (1) giving homework without any checking, (2) random checking of a limited number of answers, or (3) employing teaching assistants to check homework (Bonham et al., 2001). In many cases no grade is given for the assignments or the grade given constitutes only a relatively small part in the final course grade. Research has indicated the following advantages for computerized systems for the checking of assignments:
1. A significant reduction in the time needed by the lecturer to prepare assignments, and re-lief from the burden of checking, collecting, and organizing grades (Freasier et al., 2003; Pundak et al., 2004).
2. The computerized system provides the lecturer with a broad collection of questions at dif-ferent levels and different learning methods for each basic course.
3. The lecturer is able to construct a unique personal assignment for each student by random choice from a selection of questions.
Using this strategy, problems of automatic copying of solutions can be overcome. The lecturers’ attitudes towards OAC oscillate between enthusiasm and a sense that learning processes and stu-dent achievements have improved immensely on the one hand (Harris, 2009; Liberatore, 2011) and reluctance to innovate with adherence to traditional teaching methods on the other hand (Pundak, Herscovitz, Shacham, & Weizer-Biton). In recent years with the increasing use of LMS there is a decrease in lecturers’ reticence to use computerized checking systems (Richards-Babb, Drelick, Henry, & Robertson-Honecker, 2011).
Students Attitudes toward OAC Most of the students today belong to a generation that has grown up in a Cyber environment and are used to functioning with it. For them, working on an OAC is activity in their natural learning environment. Students’ attitudes towards learning with an OAC were described in several studies (Bonham et al., 2001; Liberatore, 2011; Pundak & Rozner, 2004). In studies that compared stu-dents' attitudes towards OAC submission of assignments as opposed to non-computerized sub-mission, it was found that most students enjoyed the use of computerized systems. The out-standing advantage of the computerized system, in the students’ view, is that they can receive immediate feedback after presenting the answer. A further advantage is the opportunity provided by the system for re-submission when the first answer is incorrect. There are conflicting findings with regard to the potential contribution of the system to the students’ achievements at the end of the course. Some studies found no significant difference in final exam results between those who had used different styles of submission. Contrastingly, other studies indicate a tight correlation between the time invested by students in learning the material for an introductory course and their achievements at the end of the course (Cuadros et al., 2007; Richards-Babb et al., 2011). The adoption of an OAC may increase the students’ learning time, without the lecturer correspond-ingly increasing the time required for their follow-up after the assignments’ preparation.
A study including 163 students in a general chemistry course (Liberatore, 2011) examined stu-dents’ attitudes concerning the submission of homework in an online system. The research find-
193
Integrating Online Assignments Checking
ings indicated that (a) the system enabled learning without punishment for mistakes, (b) hints, explanations, and instructions for solution were provided for difficult questions, (c) the detailed feedback for the students’ incorrect answers enabled improvement of understanding, and (d) online questions enabled stage-by-stage learning, facilitating deeper understanding of the studied subjects.
Problems of Integrity in Online and Regular Courses Many lecturers worry that online courses provide students with additional opportunities for inap-propriate behavior including cheating. Studies that have investigated this issue produced conflict-ing results concerning the students’ tendency to cheat when working on online systems in contrast to their behavior in regular courses. In a study by King, Guyette, and Pitrowski (2009) it was found that 73.8% of students who participated in the survey felt that it was easier to cheat in online courses. Contrarily, a study by Grijalva, Nowell, and Kerkvliet (2006) found no significant difference in the students’ tendency to cheat between the online and regular assignments. An-other study of 635 first degree and graduate students in several universities and colleges in the USA (Watson & Sotille, 2010) surprisingly found that there was actually a higher percentage of dishonest events in traditional courses in comparison to online courses. This finding may be ex-plained by social support/familiarity with friends in the class during collaborative work on as-signments, which may remove moral obstacles against copying. This complex situation merits further investigation of students’ attitudes concerning the tendency to cheat when using OAC.
The Research Aim The research aim was to examine students’ attitudes concerning the integration of an OAC in academic courses. The study examined students’ attitudes regarding the following dimensions:
1. Understanding the material taught in the course 2. Involvement and interest in learning 3. The lecturers’ consideration of students’ learning difficulties 4. Traditional exercises versus online exercises 5. Lack of integrity (tendency to cheat) 6. Presenting homework through an OAC in comparison to hardcopy submission.
Research Design
The Research Tool The research tool consisted of a specially designed questionnaire developed in our previous re-search (Pundak et al., 2004) to examine attitudes of students studying introductory courses as-sisted by an OAC. The questionnaire was adapted to meet the aim of the current research (see Appendix). The questionnaire was administered online. It included 28 statements sorted accord-ing to six dimensions shown in Table 1. The questionnaire was based on the ‘Active Learning’ approach and developed by Novak and Redish (Novak et al., 2000; Redish et al., 1998).
194
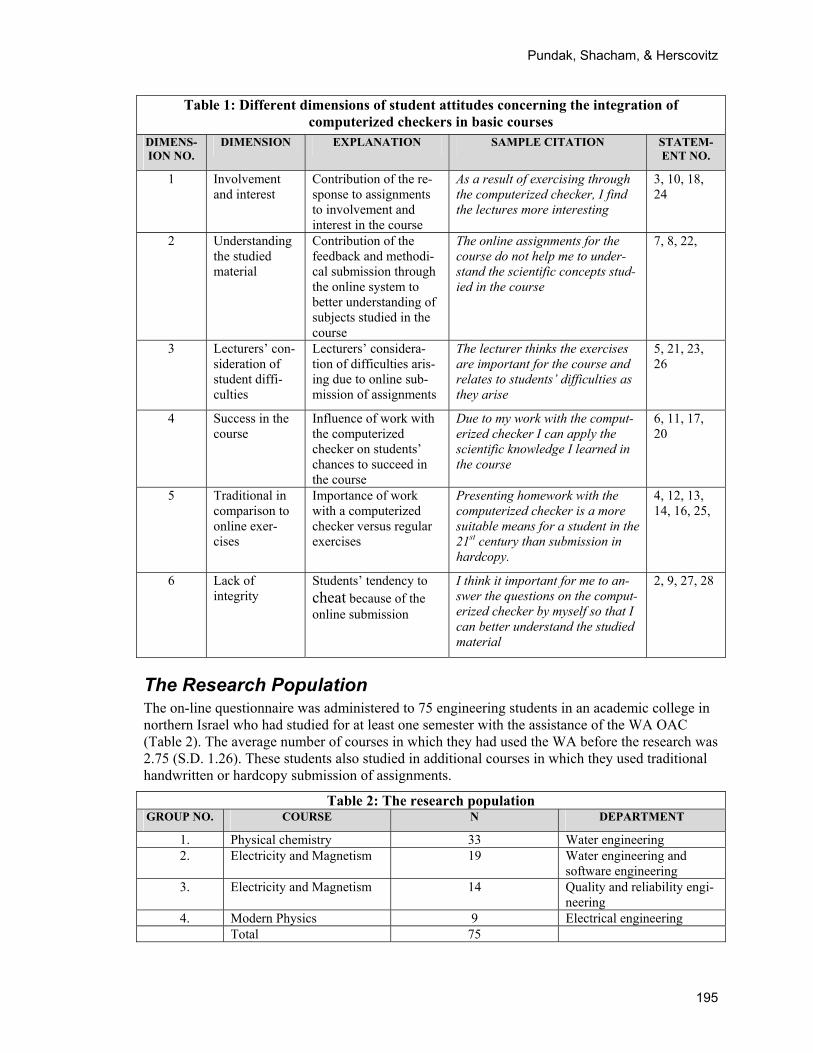
Pundak, Shacham, & Herscovitz
Table 1: Different dimensions of student attitudes concerning the integration of computerized checkers in basic courses
DIMENS-ION NO.
DIMENSION EXPLANATION SAMPLE CITATION STATEM-ENT NO.
1 Involvement and interest
Contribution of the re-sponse to assignments to involvement and interest in the course
As a result of exercising through the computerized checker, I find the lectures more interesting
3, 10, 18, 24
2 Understanding the studied material
Contribution of the feedback and methodi-cal submission through the online system to better understanding of subjects studied in the course
The online assignments for the course do not help me to under-stand the scientific concepts stud-ied in the course
7, 8, 22,
3 Lecturers’ con-sideration of student diffi-culties
Lecturers’ considera-tion of difficulties aris-ing due to online sub-mission of assignments
The lecturer thinks the exercises are important for the course and relates to students’ difficulties as they arise
5, 21, 23, 26
4 Success in the course
Influence of work with the computerized checker on students’ chances to succeed in the course
Due to my work with the comput-erized checker I can apply the scientific knowledge I learned in the course
6, 11, 17, 20
5 Traditional in comparison to online exer-cises
Importance of work with a computerized checker versus regular exercises
Presenting homework with the computerized checker is a more suitable means for a student in the 21st century than submission in hardcopy.
4, 12, 13, 14, 16, 25,
6 Lack of integrity
Students’ tendency to cheat because of the online submission
I think it important for me to an-swer the questions on the comput-erized checker by myself so that I can better understand the studied material
2, 9, 27, 28
The Research Population The on-line questionnaire was administered to 75 engineering students in an academic college in northern Israel who had studied for at least one semester with the assistance of the WA OAC (Table 2). The average number of courses in which they had used the WA before the research was 2.75 (S.D. 1.26). These students also studied in additional courses in which they used traditional handwritten or hardcopy submission of assignments.
Table 2: The research population GROUP NO. COURSE N DEPARTMENT
1. Physical chemistry 33 Water engineering 2. Electricity and Magnetism 19 Water engineering and
software engineering 3. Electricity and Magnetism 14 Quality and reliability engi-
neering 4. Modern Physics 9 Electrical engineering Total 75
195
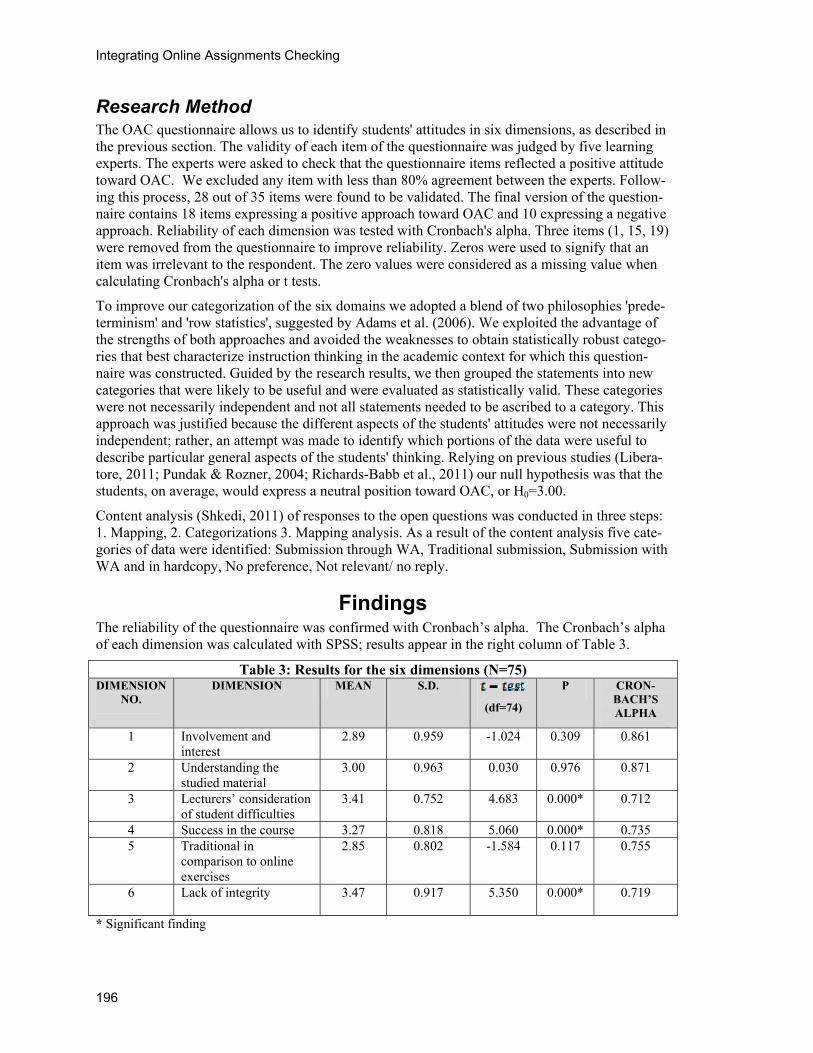
Integrating Online Assignments Checking
Research Method The OAC questionnaire allows us to identify students' attitudes in six dimensions, as described in the previous section. The validity of each item of the questionnaire was judged by five learning experts. The experts were asked to check that the questionnaire items reflected a positive attitude toward OAC. We excluded any item with less than 80% agreement between the experts. Follow-ing this process, 28 out of 35 items were found to be validated. The final version of the question-naire contains 18 items expressing a positive approach toward OAC and 10 expressing a negative approach. Reliability of each dimension was tested with Cronbach's alpha. Three items (1, 15, 19) were removed from the questionnaire to improve reliability. Zeros were used to signify that an item was irrelevant to the respondent. The zero values were considered as a missing value when calculating Cronbach's alpha or t tests.
To improve our categorization of the six domains we adopted a blend of two philosophies 'prede-terminism' and 'row statistics', suggested by Adams et al. (2006). We exploited the advantage of the strengths of both approaches and avoided the weaknesses to obtain statistically robust catego-ries that best characterize instruction thinking in the academic context for which this question-naire was constructed. Guided by the research results, we then grouped the statements into new categories that were likely to be useful and were evaluated as statistically valid. These categories were not necessarily independent and not all statements needed to be ascribed to a category. This approach was justified because the different aspects of the students' attitudes were not necessarily independent; rather, an attempt was made to identify which portions of the data were useful to describe particular general aspects of the students' thinking. Relying on previous studies (Libera-tore, 2011; Pundak & Rozner, 2004; Richards-Babb et al., 2011) our null hypothesis was that the students, on average, would express a neutral position toward OAC, or H0=3.00.
Content analysis (Shkedi, 2011) of responses to the open questions was conducted in three steps: 1. Mapping, 2. Categorizations 3. Mapping analysis. As a result of the content analysis five cate-gories of data were identified: Submission through WA, Traditional submission, Submission with WA and in hardcopy, No preference, Not relevant/ no reply.
Findings The reliability of the questionnaire was confirmed with Cronbach’s alpha. The Cronbach’s alpha of each dimension was calculated with SPSS; results appear in the right column of Table 3.
Table 3: Results for the six dimensions (N=75) CRON-BACH’S ALPHA
P
(df=74)
S.D. MEAN DIMENSION DIMENSION NO.
0.861 0.309 1.024- 2.89 Involvement and interest
0.959 1
Understanding the studied material
3.00 0.871 0.976 0.030 0.963 2
3.41 0.712 0.000* 4.683 0.752 Lecturers’ consideration of student difficulties
3
0.735 0.000* 5.060 0.818 3.27 Success in the course 4 0.755 0.117 -1.584 0.802 2.85 Traditional in
comparison to online exercises
5
0.719 0.000* 5.350 0.917 3.47 Lack of integrity
6
* Significant finding
196
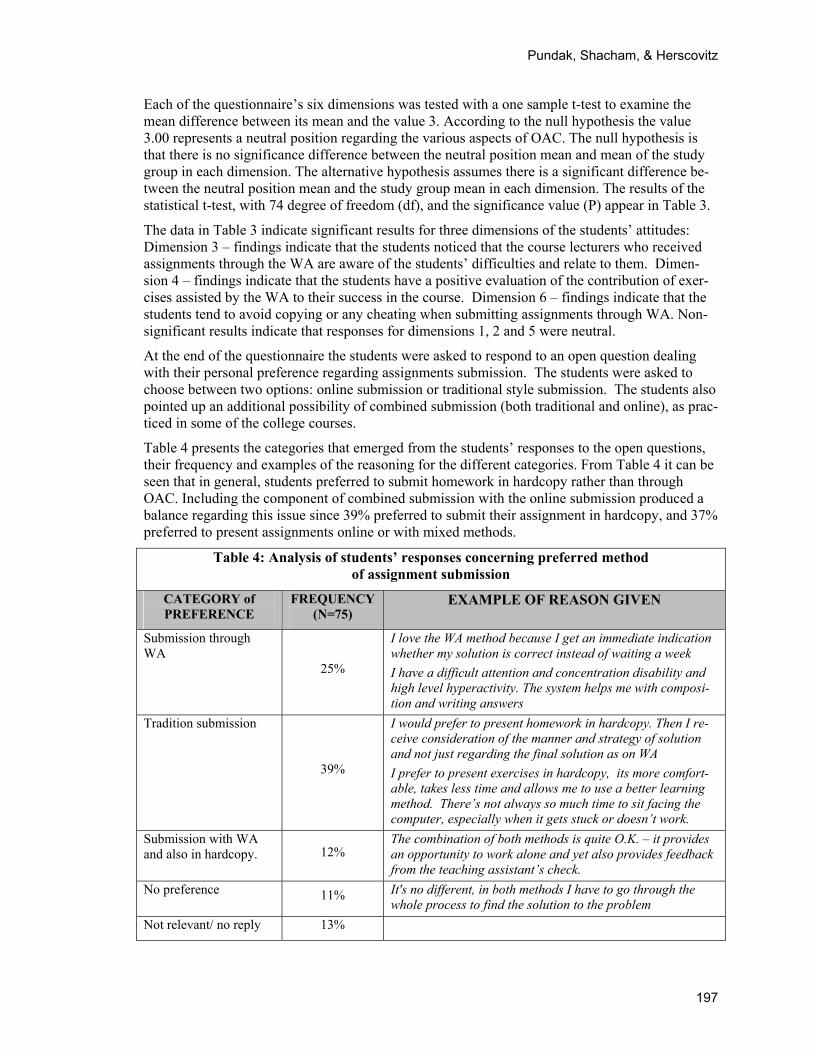
Pundak, Shacham, & Herscovitz
Each of the questionnaire’s six dimensions was tested with a one sample t-test to examine the mean difference between its mean and the value 3. According to the null hypothesis the value 3.00 represents a neutral position regarding the various aspects of OAC. The null hypothesis is that there is no significance difference between the neutral position mean and mean of the study group in each dimension. The alternative hypothesis assumes there is a significant difference be-tween the neutral position mean and the study group mean in each dimension. The results of the statistical t-test, with 74 degree of freedom (df), and the significance value (P) appear in Table 3.
The data in Table 3 indicate significant results for three dimensions of the students’ attitudes: Dimension 3 – findings indicate that the students noticed that the course lecturers who received assignments through the WA are aware of the students’ difficulties and relate to them. Dimen-sion 4 – findings indicate that the students have a positive evaluation of the contribution of exer-cises assisted by the WA to their success in the course. Dimension 6 – findings indicate that the students tend to avoid copying or any cheating when submitting assignments through WA. Non-significant results indicate that responses for dimensions 1, 2 and 5 were neutral.
At the end of the questionnaire the students were asked to respond to an open question dealing with their personal preference regarding assignments submission. The students were asked to choose between two options: online submission or traditional style submission. The students also pointed up an additional possibility of combined submission (both traditional and online), as prac-ticed in some of the college courses.
Table 4 presents the categories that emerged from the students’ responses to the open questions, their frequency and examples of the reasoning for the different categories. From Table 4 it can be seen that in general, students preferred to submit homework in hardcopy rather than through OAC. Including the component of combined submission with the online submission produced a balance regarding this issue since 39% preferred to submit their assignment in hardcopy, and 37% preferred to present assignments online or with mixed methods.
Table 4: Analysis of students’ responses concerning preferred method of assignment submission
CATEGORY of PREFERENCE
FREQUENCY (N=75)
EXAMPLE OF REASON GIVEN
Submission through WA
25%
I love the WA method because I get an immediate indication whether my solution is correct instead of waiting a week
I have a difficult attention and concentration disability and high level hyperactivity. The system helps me with composi-tion and writing answers
Tradition submission
39%
I would prefer to present homework in hardcopy. Then I re-ceive consideration of the manner and strategy of solution and not just regarding the final solution as on WA
I prefer to present exercises in hardcopy, its more comfort-able, takes less time and allows me to use a better learning method. There’s not always so much time to sit facing the computer, especially when it gets stuck or doesn’t work.
Submission with WA and also in hardcopy. 12%
The combination of both methods is quite O.K. – it provides an opportunity to work alone and yet also provides feedback from the teaching assistant’s check.
No preference 11% It's no different, in both methods I have to go through the whole process to find the solution to the problem
Not relevant/ no reply 13%
197
Integrating Online Assignments Checking
Analysis of the reasons for the students’ choices indicated that some of the reasons related to the technical aspect of computer use in contrast to submission in hardcopy. It seems that the choice depends on the student’s learning style and which method feels more comfortable for the student when coping with assignments – either hardcopy, which should receive detailed personal feed-back from the teaching assistant, or through the OAC, which provides immediate feedback which only relates to the final results.
Discussion and Conclusions This study examined students' attitudes in an introductory engineering course, relating to six di-mensions concerning the submission of online assignments. The research findings indicate pos-sible directions for the improvement of the use of the WA:
1. Despite the submission of weekly assignments through the WA, students only expressed a neutral attitude toward its contribution to their understanding of the studied material. A possible important reason is the fact that in many cases the WA only checks the final so-lution but not the way in which the question was solved. Other studies indicate that it is desirable to add components to the OAC, which can help students with the path to the so-lution as well, for example: hints, structured exercises, exercises including conceptual understanding.
2. The OAC contributes to the lecturers’ consideration of students’ difficulties during the course. This attitude is explained due to the tools that the WA provides, helping the lec-turer to identify difficulties and to react to them in real-time.
3. Students feel that online submission helps them to succeed in the course. This finding can be explained in several ways:
a. The students were asked many questions every week through the WA at different levels of difficulty and with different representations. This exposes them to dif-ferent aspects of the studied subjects.
b. Submission of online assignments is awarded a weight of 10% in the final grade for the course. This component usually contributes to the improvement of the fi-nal course grade.
4. In contrast to previous findings concerning the students’ tendency to cheat when present-ing assignments online, in this study most students actually indicated that they did not try to cheat when using the WA. This finding should be investigated further.
5. There was no significant finding regarding which method of exercises was preferred by the students either in the statistical analysis or in the content analysis. It was found that 39% preferred to submit their assignment in hardcopy, while 37% preferred to present as-signments online or with mixed methods.
Despite the limitation of this study due to the fact that it was limited to a single college, the find-ings of this study as well as previous similar studies (Beichner , 2006) may help lecturers to con-sider integrating online submission and checking of assignments in introductory academic courses.
References Adams, W. K., Perkins, K. K., Podolefsky, N. S., Dubson, M., Finkelstein, N. D., & Wieman, C. E. (2006).
New instrument for measuring student beliefs about physics and learning physics: The Colorado Learning Attitudes about Science Survey. Physical Review Special Topics – Physics Education Re-search, 2, (1). Retrieved from http://prst-per.aps.org/abstract/PRSTPER/v2/i1/e010101
198
Pundak, Shacham, & Herscovitz
Beichner, R. J. (2006). Instructional technology research and development in a U.S. physics education group. European Journal of Engineering Education 31(4), 383–393.
Bonham, S., Beichner, R. J., & Deardorff, D. (2001). Online homework: Does it make a difference? The Physics Teacher, 39(5), 293–296.
Brewer, D. S. (2009). The effects of online homework on achievement and self-efficacy of college algebra students. Utah State University. Retrieved from: http://digitalcommons.usu.edu/etd/407
Cuadros, J., Yaron, D., & Leinhardt, G. (2007). “One firm spot”: The role of homework as lever in acquir-ing conceptual and performance competence in college chemistry. Journal of Chemical Education 84(6),1047–1052.
Freasier, B., Collins, G., & Newitt, P. (2003). A web-based interactive homework quiz and tutorial package to motivate undergraduate chemistry students and improve learning. Journal of Chemical Education, 80(11), 1344–1347.
Harris, H. (2009). Electronic homework management systems: Reviews of popular systems. Journal of Chemical Education, 86(6), 691.
Grijalva, T., Nowell, C., & Kerkvliet, J. (2006). Academic honesty and online courses. College Student Journal, 40(1), 180-185.
King, C., Guyette, R., & Piotrowski, C. (2009). Online exams and cheating: An empirical analysis of busi-ness students’ views. The Journal of Educators Online, 6(1), 1-11.
Liberatore, M. W. (2011). Improved student achievement using personalized online homework for a course in material and energy balance. Chemical Engineering Education, 45(3), 184-190.
Mazur, E. (1997). Peer instruction. Upper Saddle River, NJ: Prentice-Hall.
Novak, G. M., Patterson, E. T., & Gavrin, A. D. (2000). Just in time teaching: Blending active learning with web technology. Upper Saddle River, NJ: Prentice-Hall.
Pundak, D., Herscovitz, O., Shacham, M., & Weizer-Biton, R. (2010). Attitudes of face-to-face and e-learning instructors toward 'active learning'. European Journal of Open and Distance Learning. Re-trieved from: http://www.eurodl.org/?p=current&article=412
Pundak, D., Maharshak, A., & Rozner, S. (2004). Successful pedagogy with Web Assignments Checker. Journal of Educational Technology Systems, 33(1), 67-80.
Pundak, D., & Rosner, S. (2004). Computerized exercising in academic courses. Al Hagova – Magazine for Teaching in Higher Education, 3, 52-56. [Hebrew]
Pundak, D., Herscovitz, O., Shacham, M., & Weizer-Biton, R. (2010). Attitudes of Face-to-Face and e-Learning Instructors toward 'Active Learning'. European Journal of Open and Distance Learning. Retrieved from: http://www.eurodl.org/?p=current&article=412
Redish, E. F., Steinberg, R. N., & Saul, J. M. (1998). Student expectations in introductory physics. Ameri-can Journal of Physics, 66, 212-224.
Richards-Babb, M., Drelick, J., Henry, Z., & Robertson-Honecker, J. (2011). Online homework, help or hindrance: What students think and how they perform. Journal of College Science Teaching, 40(4), 81-93.
Shkedi, A. (2011). The meaning behind the words - Methodologies of qualitative research: Theory and practice. Tel Aviv: Ramot. (Hebrew).
Watson, G., & Sotille, J. (2010). Cheating in the digital age: Do students cheat more in online courses? Online Journal of Distance Learning Administration, XIII, I.
199
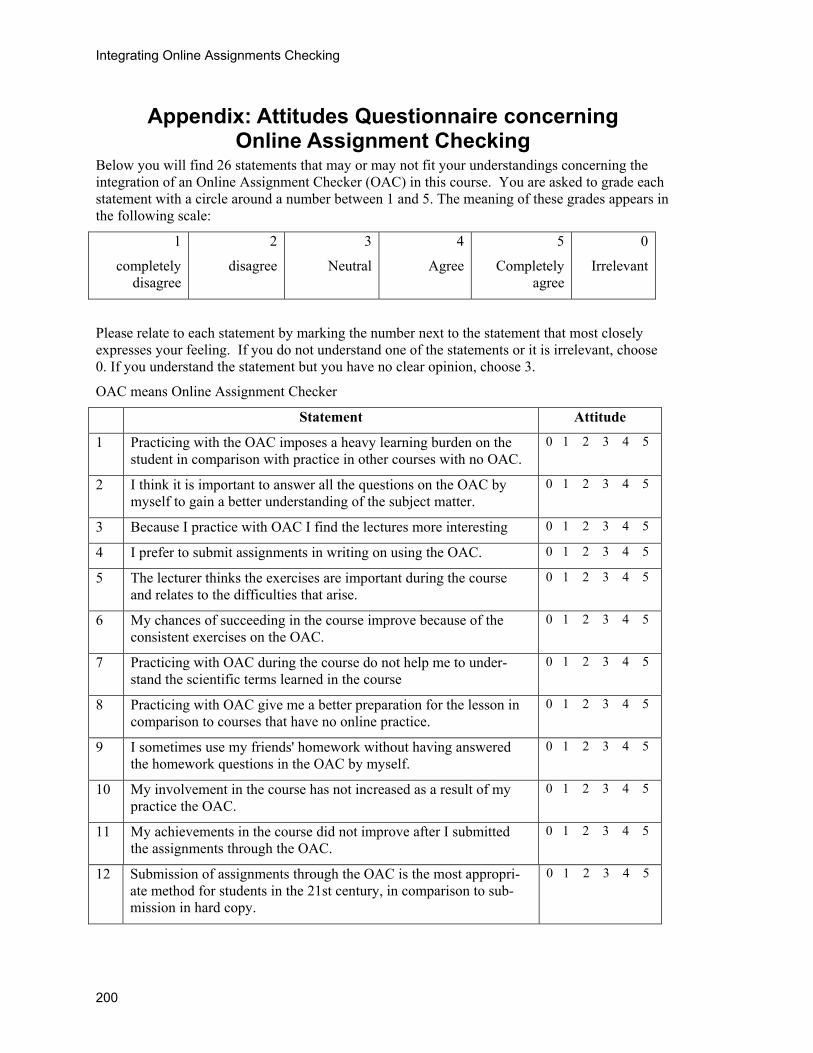
Integrating Online Assignments Checking
Appendix: Attitudes Questionnaire concerning Online Assignment Checking
Below you will find 26 statements that may or may not fit your understandings concerning the integration of an Online Assignment Checker (OAC) in this course. You are asked to grade each statement with a circle around a number between 1 and 5. The meaning of these grades appears in the following scale:
1
completely disagree
2
disagree
3
Neutral
4
Agree
5
Completely agree
0
Irrelevant
Please relate to each statement by marking the number next to the statement that most closely expresses your feeling. If you do not understand one of the statements or it is irrelevant, choose 0. If you understand the statement but you have no clear opinion, choose 3.
OAC means Online Assignment Checker
Statement Attitude
1 Practicing with the OAC imposes a heavy learning burden on the student in comparison with practice in other courses with no OAC.
0 1 2 3 4 5
2 I think it is important to answer all the questions on the OAC by myself to gain a better understanding of the subject matter.
0 1 2 3 4 5
3 Because I practice with OAC I find the lectures more interesting 0 1 2 3 4 5
4 I prefer to submit assignments in writing on using the OAC. 0 1 2 3 4 5
5 The lecturer thinks the exercises are important during the course and relates to the difficulties that arise.
0 1 2 3 4 5
6 My chances of succeeding in the course improve because of the consistent exercises on the OAC.
0 1 2 3 4 5
7 Practicing with OAC during the course do not help me to under-stand the scientific terms learned in the course
0 1 2 3 4 5
8 Practicing with OAC give me a better preparation for the lesson in comparison to courses that have no online practice.
0 1 2 3 4 5
9 I sometimes use my friends' homework without having answered the homework questions in the OAC by myself.
0 1 2 3 4 5
10 My involvement in the course has not increased as a result of my practice the OAC.
0 1 2 3 4 5
11 My achievements in the course did not improve after I submitted the assignments through the OAC.
0 1 2 3 4 5
12 Submission of assignments through the OAC is the most appropri-ate method for students in the 21st century, in comparison to sub-mission in hard copy.
0 1 2 3 4 5
200
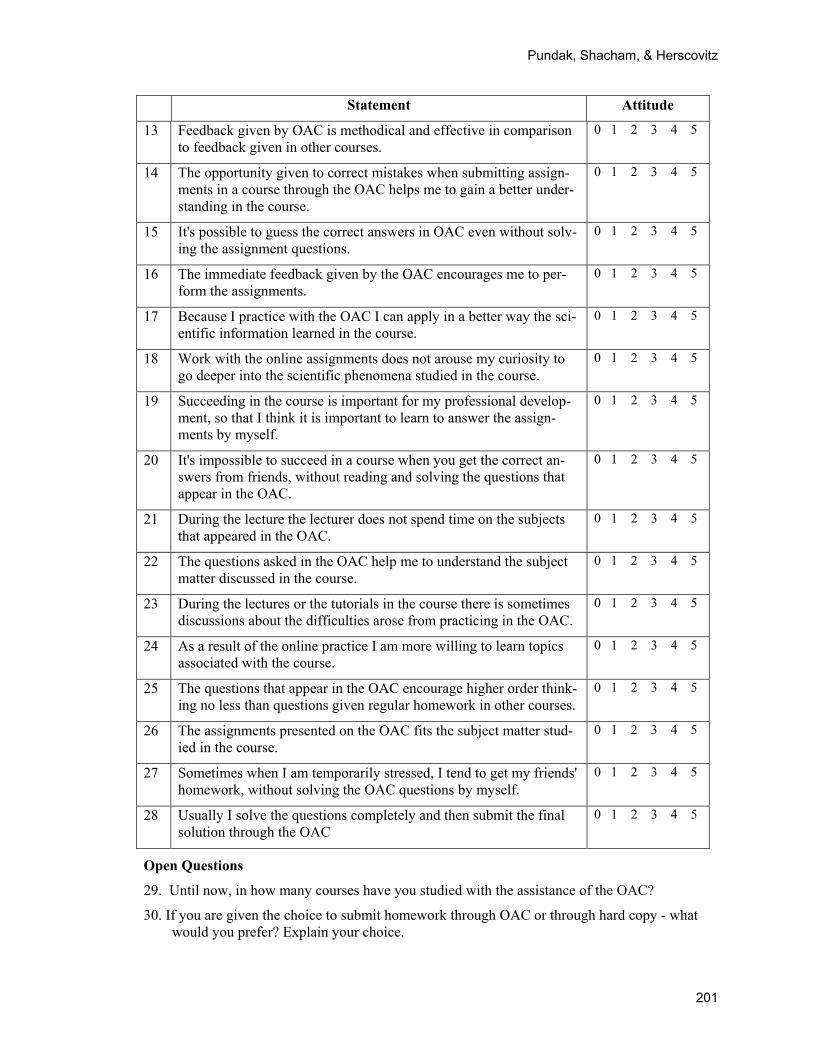
Pundak, Shacham, & Herscovitz
Statement Attitude
13 Feedback given by OAC is methodical and effective in comparison to feedback given in other courses.
0 1 2 3 4 5
14 The opportunity given to correct mistakes when submitting assign-ments in a course through the OAC helps me to gain a better under-standing in the course.
0 1 2 3 4 5
15 It's possible to guess the correct answers in OAC even without solv-ing the assignment questions.
0 1 2 3 4 5
16 The immediate feedback given by the OAC encourages me to per-form the assignments.
0 1 2 3 4 5
17 Because I practice with the OAC I can apply in a better way the sci-entific information learned in the course.
0 1 2 3 4 5
18 Work with the online assignments does not arouse my curiosity to go deeper into the scientific phenomena studied in the course.
0 1 2 3 4 5
19 Succeeding in the course is important for my professional develop-ment, so that I think it is important to learn to answer the assign-ments by myself.
0 1 2 3 4 5
20 It's impossible to succeed in a course when you get the correct an-swers from friends, without reading and solving the questions that appear in the OAC.
0 1 2 3 4 5
21 During the lecture the lecturer does not spend time on the subjects that appeared in the OAC.
0 1 2 3 4 5
22 The questions asked in the OAC help me to understand the subject matter discussed in the course.
0 1 2 3 4 5
23 During the lectures or the tutorials in the course there is sometimes discussions about the difficulties arose from practicing in the OAC.
0 1 2 3 4 5
24 As a result of the online practice I am more willing to learn topics associated with the course.
0 1 2 3 4 5
25 The questions that appear in the OAC encourage higher order think-ing no less than questions given regular homework in other courses.
0 1 2 3 4 5
26 The assignments presented on the OAC fits the subject matter stud-ied in the course.
0 1 2 3 4 5
27 Sometimes when I am temporarily stressed, I tend to get my friends' homework, without solving the OAC questions by myself.
0 1 2 3 4 5
28 Usually I solve the questions completely and then submit the final solution through the OAC
0 1 2 3 4 5
Open Questions
29. Until now, in how many courses have you studied with the assistance of the OAC?
30. If you are given the choice to submit homework through OAC or through hard copy - what would you prefer? Explain your choice.
201

Integrating Online Assignments Checking
202
David P rand it in ORT Braude College (OBC).
he past n scie o
u d ation ssoms e
u ior-d hig Oearn othrough the Internet. The dev
works as a lecturer and researcher in the Teaching n
eaventi
is S
er majencecati
ra
Biographies Dr. in Physics and faculty in Kinneret College For t involved in research and develop-ment in n. Having set the goal to advancescience ed ed the center for science educ- "Blo ret College. The center integrated research do iry projects conducted by junhigh an BC Dr. Pundak founded and heads the E-L n the development of courses learned eloped web sites enable students
and instructors to take advantage of web technology and to enrich the social activities and the knowledge resources of the courses. At the same time, he studies the influence of Web technol-ogy on instruction and learning. Instructors' Attitudes toward Active Learning.
Dr. Miri Shacham
undak - Senior Lecture Head of E-Learning Un twenty years he has beence and physics educatication,. Dr. Pundak foun of Science" at the Kinn
ne by scientists with enqh schools students. At ing Unit which focuses
Department and in the Centre for Teaching and LearAcademic College in Israel. She also works as a resStress and Trauma in the Community Stress PreCollege in Israel. She is working in The Israeli Minan Organizational Counselor for school principals.an English-Israeli Team that developed a special intgram in Anglia Ruskin University in the UK. Herpublications are in these areas: Innovation in SciEducation, Learning and Teaching in Higher EduWeb technology on instruction and learning, Docto
and Resilience in war times.
ing of Ort Braude rcher in the field of
on Centre of Tel Hai try of Education as
he was a member of national PhD Pro-or researches and and Technology
on, the influence of l Education, Trauma
Dr. Orit Herscovitz is a Senior Researcher and Lecturer of graduate and undergraduate courses and advisor of graduate students in the De-partment of Education in Technology and Science, at the Technion, Israel Institute of Technology. She is also the director of the Israeli Na-tional Center for "Science for All" teachers. Her activities during the last 15 years at the Technion include developing and assessing case-based science curricula and promoting professional development of pre- and in-service science and technology teachers. In these two re-search fields she has been promoting the enhancement of constructivist learning environments via advanced educational technologies. Her pub-
lications include articles and book chapters in science education and educational technology. She has also written four learning units for high school students as first author together with col-leagues.
Journal of Information Technology Education: Research Volume 12, 2013
Student Adoption & Development of Digital Learning Media:
Action Research and Recommended Practices
Sharon W. Tabor and Robert P. Minch Boise State University, Boise, Idaho, USA
[email protected] [email protected]
Executive Summary Digital technologies offer many opportunities for creating engaging course content. In this study we captured student perceptions and adoption choices related to creating and using digital media as learning tools. Podcasts, video and other media were integrated in a variety of contexts and tasks in two undergraduate information technology (IT) courses in a college of business.
During the fall semesters of 2009 and 2010, faculty members teaching a junior-level IT and net-working concepts course and a senior-level information security course, produced video-captured lectures, recorded fine-grained conceptual tutorials and podcasts, developed software simulations, and provided media for ad-hoc learning assistance. Students produced video for several class as-signments. They also had the option of replacing a typical written semester report with a video project. Student satisfaction with the various forms of digital learning media, perceptions of learning, and intention to adopt for future courses were measured in a series of surveys and com-pared to self-reported learning styles. Of particular interest was how students would perform and respond to the higher order learning activity of creating digital output. Outcomes were generally positive, and in some cases, students reported that access to digital media positively changed the way they prepared for class and studied for exams. While students reported that developing digi-tal media was preferable to traditional projects and felt they learned more about their topics dur-ing the process of developing a video or simulation, they noted the time commitment was high. They are not yet ready to see digital media used exclusively for content delivery and expressed a preference for a mix of media and traditional classroom lectures. The paper concludes with sug-gestions for introducing digital learning media into an IT curriculum.
Keywords: IT education, digital media, podcasting, video production, Bloom’s Taxonomy, con-structivist learning theory, learning styles.
Introduction Teaching in the IT discipline offers many opportunities to incorporate tech-nology into the classroom. While we are challenging our students to learn about technology, we also want to help them build useful business skills and an inter-est in life-long learning. A major chal-lenge in IT education is to develop learning experiences that contribute to-ward skills development while expand-ing the foundations of known pedagogi-
Material published as part of this publication, either on-line or in print, is copyrighted by the Informing Science Institute. Permission to make digital or paper copy of part or all of these works for personal or classroom use is granted without fee provided that the copies are not made or distributed for profit or commercial advantage AND that copies 1) bear this notice in full and 2) give the full citation on the first page. It is per-missible to abstract these works so long as credit is given. To copy in all other cases or to republish or to post on a server or to redistribute to lists requires specific permission and payment of a fee. Contact [email protected] to request redistribution permission.
Editor: John Beachboard
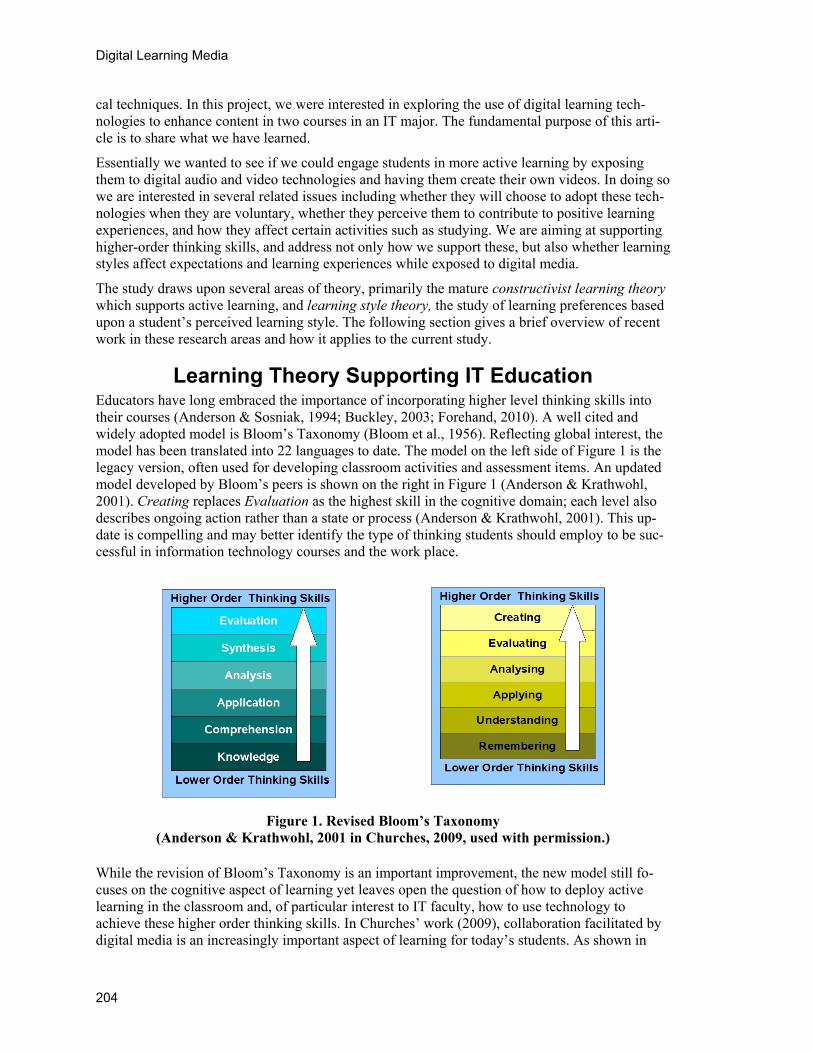
Digital Learning Media
cal techniques. In this project, we were interested in exploring the use of digital learning tech-nologies to enhance content in two courses in an IT major. The fundamental purpose of this arti-cle is to share what we have learned.
Essentially we wanted to see if we could engage students in more active learning by exposing them to digital audio and video technologies and having them create their own videos. In doing so we are interested in several related issues including whether they will choose to adopt these tech-nologies when they are voluntary, whether they perceive them to contribute to positive learning experiences, and how they affect certain activities such as studying. We are aiming at supporting higher-order thinking skills, and address not only how we support these, but also whether learning styles affect expectations and learning experiences while exposed to digital media.
The study draws upon several areas of theory, primarily the mature constructivist learning theory which supports active learning, and learning style theory, the study of learning preferences based upon a student’s perceived learning style. The following section gives a brief overview of recent work in these research areas and how it applies to the current study.
Learning Theory Supporting IT Education Educators have long embraced the importance of incorporating higher level thinking skills into their courses (Anderson & Sosniak, 1994; Buckley, 2003; Forehand, 2010). A well cited and widely adopted model is Bloom’s Taxonomy (Bloom et al., 1956). Reflecting global interest, the model has been translated into 22 languages to date. The model on the left side of Figure 1 is the legacy version, often used for developing classroom activities and assessment items. An updated model developed by Bloom’s peers is shown on the right in Figure 1 (Anderson & Krathwohl, 2001). Creating replaces Evaluation as the highest skill in the cognitive domain; each level also describes ongoing action rather than a state or process (Anderson & Krathwohl, 2001). This up-date is compelling and may better identify the type of thinking students should employ to be suc-cessful in information technology courses and the work place.
Figure 1. Revised Bloom’s Taxonomy (Anderson & Krathwohl, 2001 in Churches, 2009, used with permission.)
While the revision of Bloom’s Taxonomy is an important improvement, the new model still fo-cuses on the cognitive aspect of learning yet leaves open the question of how to deploy active learning in the classroom and, of particular interest to IT faculty, how to use technology to achieve these higher order thinking skills. In Churches’ work (2009), collaboration facilitated by digital media is an increasingly important aspect of learning for today’s students. As shown in
204
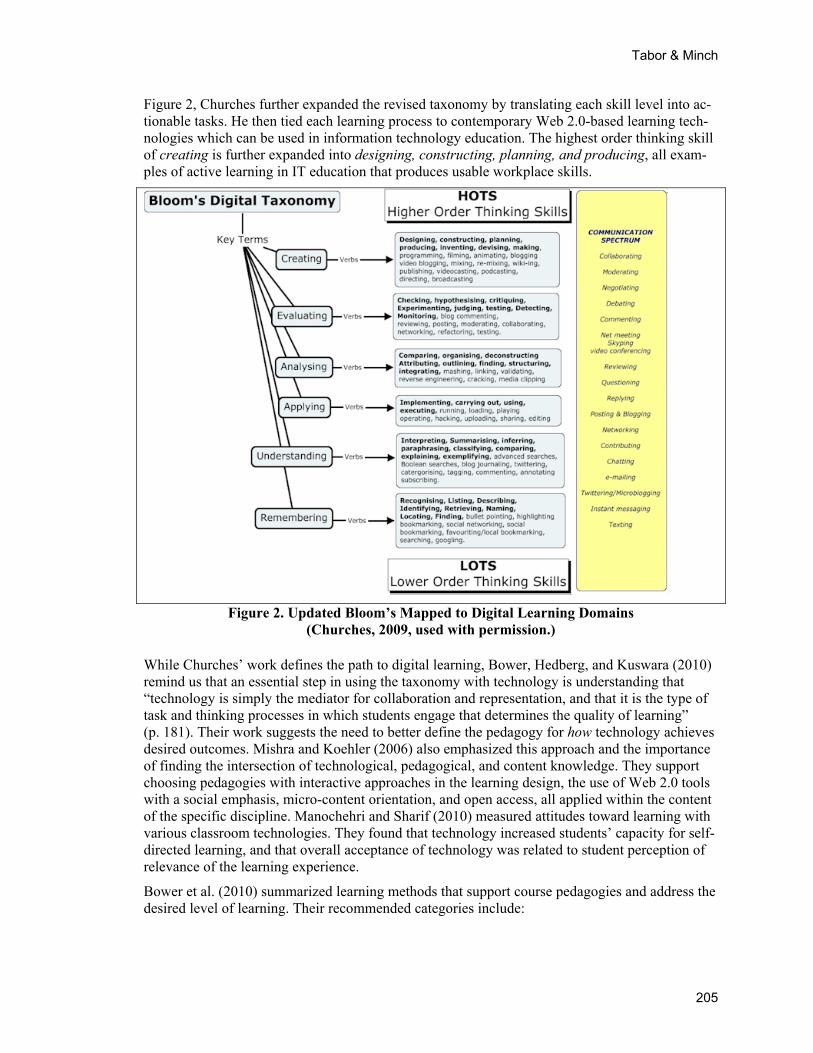
Tabor & Minch
Figure 2, Churches further expanded the revised taxonomy by translating each skill level into ac-tionable tasks. He then tied each learning process to contemporary Web 2.0-based learning tech-nologies which can be used in information technology education. The highest order thinking skill of creating is further expanded into designing, constructing, planning, and producing, all exam-ples of active learning in IT education that produces usable workplace skills.
Figure 2. Updated Bloom’s Mapped to Digital Learning Domains (Churches, 2009, used with permission.)
While Churches’ work defines the path to digital learning, Bower, Hedberg, and Kuswara (2010) remind us that an essential step in using the taxonomy with technology is understanding that “technology is simply the mediator for collaboration and representation, and that it is the type of task and thinking processes in which students engage that determines the quality of learning” (p. 181). Their work suggests the need to better define the pedagogy for how technology achieves desired outcomes. Mishra and Koehler (2006) also emphasized this approach and the importance of finding the intersection of technological, pedagogical, and content knowledge. They support choosing pedagogies with interactive approaches in the learning design, the use of Web 2.0 tools with a social emphasis, micro-content orientation, and open access, all applied within the content of the specific discipline. Manochehri and Sharif (2010) measured attitudes toward learning with various classroom technologies. They found that technology increased students’ capacity for self-directed learning, and that overall acceptance of technology was related to student perception of relevance of the learning experience.
Bower et al. (2010) summarized learning methods that support course pedagogies and address the desired level of learning. Their recommended categories include:
205
Digital Learning Media
Transmissive – content delivered to learners (lecture) Dialogic – exchange between participants, with activity and feedback (discussion) Constructionist – learning by developing output (blogs, journals, targeted activity) Co-constructionist – team-based, goal related tasks leading to some output
When planning for learning in a new knowledge domain, all four levels might be useful as part of a learning cycle. For example, transmissive methods may be used at the beginning of the learning cycle introducing new concepts, building up to constructionist methods as learners understand foundation topics. The philosophy of constructionist pedagogy, originally described by Papert (1986), assumes that students learn most effectively when they are creating a meaningful product, such as our goal of student-created digital output. Team based learning fits within the co-constructionist category, where groups of learners benefit from peer learning along with the end goal of creating a defined output (Bower et al., 2010).
Papert’s conceptual model is more about the art of learning, or learning to learn (Ackermann, n.d.). Each student constructs their own meaning and understanding of what they learn, and “this happens especially felicitously in a context where the learner is consciously engaged in construct-ing a public entity, whether it’s a sand castle on the beach or a theory of the universe” (Papert, 1991, p.1 as cited in Ackermann, n.d.). In other words, Papert recognized the individual learner’s interpretation and understanding of the content as well as the style with which they processed new knowledge. In his later work, he focused on digital media and computer-based technology as well as the type of initiative the learner displays (Ackermann, n.d.). While his theories are differ-ent, yet compatible, with his mentor, Piaget, constructivism today relates directly to applied or hands-on learning that leads to the delivery of student output.
Both constructionist theory and Bloom’s higher order learning skills are demonstrated in this study through student development of digital learning media in teams. During the process of de-veloping podcasts, simulations, or videos, students had to research their chosen topics, plan their delivery medium and outcomes, learn and use a variety of technical tools with minimal training, and also understand the material well enough to explain it to their peers. This technique further supports our college goal of emphasizing problem-based learning, by moving thought and analy-sis into action.
Learning Style Instruments Building upon the foundation work of Papert (1986) and others (Bower et al., 2010), studies on learning styles and preferences led to the development of several important instruments. These self reporting instruments attempt to identify characteristics or traits that impact learning, with the desired outcome that a better understanding of student learning will help us design courses that better meet learner needs. Table 1 shows four of the best known learning styles instruments along with key characteristics measured.
206
Tabor & Minch
Table 1. Summary of Major Instruments Measuring Learning Styles
Instrument, Developer, Timeframe Key Characteristics Measured
Kolb’s Learning Style Inventory – LSI (1976, 1981, 1984, 1993, 1999) – Theory of Experi-ential Learning
Concrete experience (CE) - feeling, reflective obser-vation (RO) - watching, abstract conceptualization (AC) - thinking, active experimentation (AE) – do-ing (4 types)
Myers-Briggs Type Indicator (1921, 1971) – based on Jung’s personality types – MBTI (1921/1951)
Extrovert/introvert (EI), thinking/feeling (TF), judg-ing/perceiving (JP) - (16 learning type combina-tions)
Herrmann Brain Dominance Instrument – HBDI (1990)
Left brain, cerebral; left brain, limbic; right brain, limbic; right brain, cerebral (4 types)
Felder and Soloman’s Index of Learning Styles - ILS (1999, 2005)
Sensing/intuitive; visual/verbal; active/reflective; sequential/global (4 types)
Kolb’s Learning Style Inventory (LSI) is one of the most widely used instruments, followed closely by the Myers-Briggs Type Indicator (MBTI), based on Jung’s work with personality types. The Herrman Brain Dominance instrument, while not a measure of learning styles on the scope of the others, can explain success with various subjects. Felder and Soloman’s Index of Learning Styles (ILS) is a newer entrant, based upon a model developed for engineering students by Felder and Silverman in 1988 and later expanded to other disciplines. The ILS’s dimensions of active/reflective are comparable to the same dimension on the Kolb’s LSI, and the ac-tive/reflective dimension is related to the Myers-Briggs extravert/introvert. The sequential/global dimension is based upon the Hermann Brain Dominance view of left-brain/right-brain (Felder & Spurlin, 2005; Rosati & Felder, 1995).
While commonly used in a wide of range of research studies, all of these instruments are self-reporting devices, and each has noted limitations. The LSI has been challenged for its construct validity although showing strong internal reliability, while the ILS as the newest entrant is still being examined and has both supporters and detractors (Platsidou & Metallidou, 2009). Addition-ally, learner preference on the four scales of the ILS fits within a range and may vary over time, subject, or learning environment (Platsidou & Metallidou, 2009). Research data supports con-struct validity in the ILS, along with convergent and discriminant validity across different sub-jects (Felder & Brent, 2005; Felder & Spurlin, 2005 in Platsidou & Metallidou, 2009).
Key to the successful use of learning styles is the assumption that learning style is a “stable and predictable characteristic” (Salter, Evan, & Forney, 2006, p.173). Slater et al. performed a longi-tudinal study to test stability in learning styles as measured by the MBTI and Kolb’s LSI. In their study, thirteen cohorts of graduate students from 1987 through 2001, including 222 total subjects, completed a single version of both instruments three times over the course of their studies. The MBTI results showed reasonably strong consistency over time, while more variation was ob-served with the LSI. According to Salter et al. (2006), one limitation of the study was that it only observed change and not the reason for the change. An additional line of research postulated that cognitive complexity is likely to increase over time, as students mature and gradually encounter more complicated content and scenarios during their education process.
Sardone (2011) examined various learning characteristics (math background, math ability, cumu-lative GPA, and learning style) and their relationship to learning environment (traditional or con-structivist), course satisfaction, and IT fluency (learning to learn about IT) using the Kolb’s LSI. In her study, GPA and math ability as measured by SAT scores were more significant indicators of IT fluency than was learning style. However, students with an assimilating learning style
207
Digital Learning Media
scored better on the final exam in a traditionally taught environment, with few other notable rela-tionships viewed other than course satisfaction. While IT fluency was not significantly different related to learning environment, Sardone found that instructional methods could increase satisfac-tion.
Platsidou and Metallidou (2009) studied and compared validity and reliability for the LSI and ISL. In their study, 340 primary school teachers and undergraduate university students from sev-eral departments completed the two instruments. Kolb’s LSI model again proved to have satisfac-tory reliability but lower than desired construct validity. No significant differences were found in learning style profiles across four discipline groups. This is contrary to other findings which found the LSI able to discriminate learning styles relative to their discipline (Clump & Skogs-berg, 2003; Jones, Reichard, & Mokhtari, 2003). The ILS analysis revealed good construct valid-ity but low reliability indices (Platsidou & Metallidou, 2009).
Clearly there are weaknesses and limitations in each of the currently available learning styles in-struments and they should be used with that understanding. They may still be considered a useful communication tool between student and teacher, and may help students understand more about their own learning experiences. Felder and Spurlin (2005) suggest two specific uses of such in-struments:
1. Provide guidance to instructors on the diversity of learning styles within their classes & to help them design instructional methods that appeal to a variety of styles
2. Give individual students insights into their possible learning strengths and weaknesses and to take ownership for their own learning (p. 110-111)
Cegielski, Kazen, and Rainer (2011) note that learning styles are notably absent in information systems development research. They chose the ILS for their research in teaching object oriented development based upon its successful use in several technology related studies. Over their four year study they found student preferred learning styles did not vary over the semester. Their work supports positive performance outcomes when using teaching techniques related to student vis-ual-verbal attributes of learning styles. Ahmed, Campbell, Jaffar, Alkobaisi, and Campbell (2010) used the MBTI to explore success in a software engineering course. While previous research showed good developers to be highly introverted individuals, the Ahmed et al. study showed ex-troverted students could also demonstrate high performance, although with a wider range of per-formance variance. While many successful students in their study demonstrated an introverted personality, they found the thinking/judging dimension was more significant for performance out-comes than the introvert/extrovert characteristic.
Research Goals As noted in the previous section, there is substantial support for the identification of learning styles and the ability to improve learning outcomes through appropriate modifications to course design. In this study, we began with the specific goals listed below and compared outcomes to student self-reported learning style preference:
1. Enhance student engagement and learning with course concepts and activities by using digital media produced both by students and faculty.
2. Evaluate student perceptions, adoption choices, and satisfaction both with studying and creating digital media as part of the learning process.
3. Determine whether certain learning styles are related to the above perceptions, adop-tion choices, and satisfaction measures.
4. Develop a set of good practices for future courses and to share with others.
208
Tabor & Minch
Methodology This study was conducted over two fall semesters in 2009 and 2010. The target population in-cluded undergraduate juniors and seniors in an Information Technology Management (ITM) pro-gram at an urban university. The ITM program is part of a college of business and includes a mix-ture of traditional college aged students, returning military personnel, and second degree/career changing students with varying levels of work experience. In the first year of the study, 88 stu-dents participated, including 60 students from two sections of a junior level networking course, and 28 students from a senior information security course. In the second year of the study, 86 stu-dents participated; 51 students participated in the networking class, where the majority of students were exposed to digital course content and activities for the first time. The majority of the 35 stu-dents in information security in year two had previously completed the networking class and, therefore, had some experience in using and developing digital media.
Data Collection We collected data from students three times during the semester in which they were involved in the study. During the first week, students in each course section completed the Index of Learning Style Inventory (Felder, 1996) and a pre-course technology experience survey. The ILS was cho-sen because it is a well validated instrument that measures student preference for specific learning styles in various situations and majors. It incorporates key components of prior instruments, is freely available to researchers, and can be administered either on paper or via the online version (http://www.engr.ncsu.edu/learningstyles/ilsweb.html). The pre-course technology survey, devel-oped by the instructors, has been used over several years to identify student strengths and experi-ences with technology at the start of a semester. Two additional survey instruments, also devel-oped by the instructors, were used across all sections: a mid-term assessment survey measured to what extent students were using the course materials and for what purposes, and the final media survey requested feedback on student use and preferences for the various learning media avail-able to them. As it was important to compare results across the instruments with each student’s learning style, we followed all university polices related to human subjects and confidentiality of data collected (see the Appendix for survey instruments).
Study Overview The first year of the experiment was a learning process for both faculty and students. We started with a review of resources and technologies available and selected the courses in which we would be applying these new pedagogical techniques. The two courses selected were: IT and Network-ing Essentials and Information Security. We identified, selected, and experimented with appropri-ate production tools, and modified course flow and content to incorporate the new technologies. We then developed plans to include media in the selected courses during the summer of the first year, reviewed and acquired software tools to support the plan, and revised existing course syllabi and activities to include a variety of digital tools and development activities. We also sought out campus resources already acquainted with or using some of the tools we targeted, and took ad-vantage of this expertise both to reduce our own learning curve and to help instruct students on the technologies chosen. These initial plans varied as determined by student experience levels and upon mid-term use and feedback.
Course Redesign and Content Creation There were two fundamental elements to this initiative. As described below, the instructors em-ployed a variety of techniques to incorporate digital content into the course design. Additionally, student selected assignments were created that required student production and submission of
209
Digital Learning Media
digital artifacts in lieu of traditional written assignments. Additional description of these efforts follows below.
IT and Networking Essentials is a technical course that introduces students to the underlying net-working concepts and standards that drive the networking technology they use every day. The course includes a 1-credit lab with hands on activities that reinforce classroom learning. This course emphasized a lecture capture approach. Selected lectures of the course used the Echo360TM platform for recordings, in both a regular classroom and dedicated facilities in an In-structional Technology Center. In the classroom and dedicated facilities the classroom capture version of the system recorded the full class sessions. In addition, while the professor was out of town attending a professional conference, the personal capture version was used from a laptop computer in a distance learning approach. The broad objective was to use a variety of venues, modes, and contexts to assess the feasibility and effectiveness of each.
Information Security is a senior-level course that builds upon technology concepts that students have worked with in their program by looking at the need and justification for security in organi-zations. It uses a problem solving approach to IT security at each level of the OSI model and within all business processes touched by IT.
In year 1 of the study this course was redesigned using an inverted classroom model. The profes-sor developed digital podcasts for each weekly topic and made them available to students on iTunes University for preview before each class meeting. A set of eleven podcasts introduced and clarified weekly topics and reading materials, replacing much of the typical classroom lecture component. Available in both MP3 audio and MP4 movie formats, students had the option of lis-tening and/or viewing the media on various technology platforms. Podcast notes were posted on the course management site for each of the digital recordings. The use of the digital "pre-lecture" material allowed more class time for interactive discussion, hands-on labs, and team activities, while quizzes assessed student preparation and learning.
For both courses, we searched for short videos from a number of sources including aggregators who specialize in the content area of the course (e.g., Google’s “Tech Talk” series). Ideal choices included networking videos that covered basic, reusable content. Security oriented webcasts and tutorials that supported topics covered in podcasts or for in-class presentation and discussion were available from both academic-oriented sites, such as Merlot, and industry-oriented webcasts. Ex-amples include CSO.com, Network World, SANS Institute, and presentations from the local chapter of the ISSA (Information Systems Security Association).
We found one challenge with public media is not an absence of material, but an overabundance; all of it needed curation to determine relevance and timeliness to course content. For both courses, we emphasized reuse for future semesters.
Content Created by Students Students in the networking course created videos for two assignments. One was a relatively sim-ple homework assignment early in the course, designed to familiarize students with basic tools and techniques of video creation. Before this assignment students attended a hands-on training session in a campus facility supporting student technology needs. The second assignment was the class project, where a 20-minute video produced by student project groups was an optional substi-tute for a traditional written report and presentation. A majority of project groups opted for the video format and later completed a survey about their experiences and satisfaction with this form of class project and their resultant learning.
Students in the security course also completed two digital media projects. Prior to the first pro-ject, security students also attended a training and demo session conducted by technology support
210
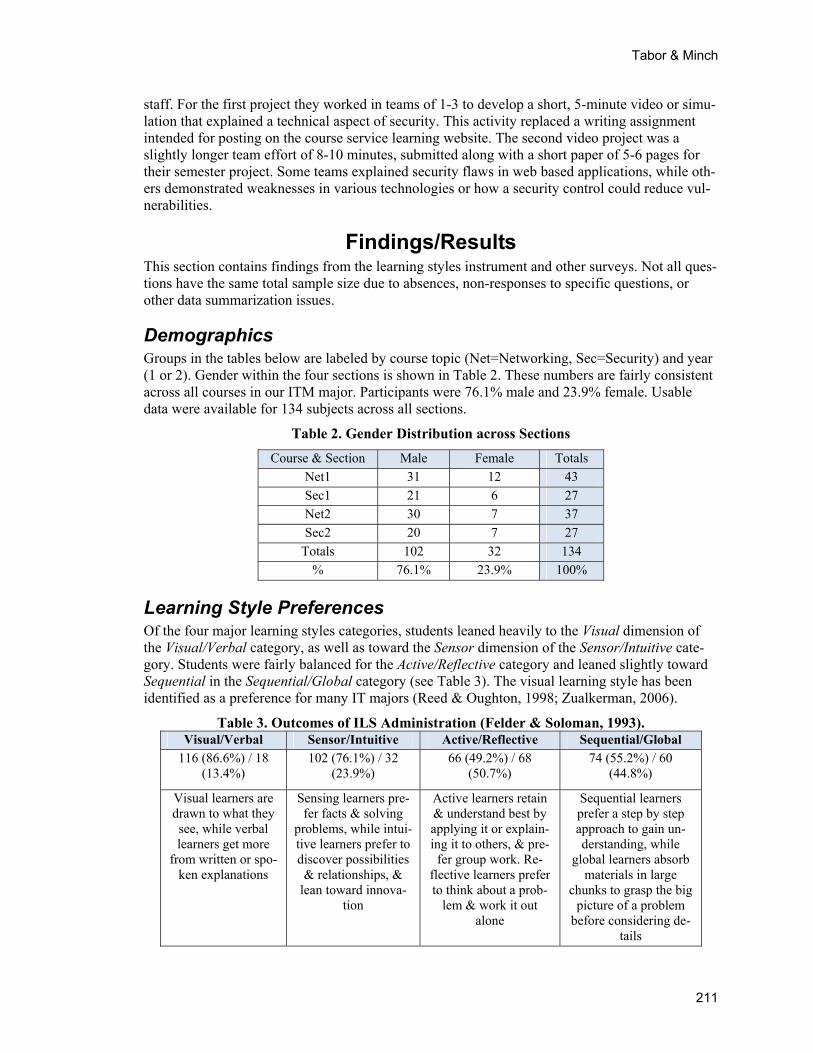
Tabor & Minch
staff. For the first project they worked in teams of 1-3 to develop a short, 5-minute video or simu-lation that explained a technical aspect of security. This activity replaced a writing assignment intended for posting on the course service learning website. The second video project was a slightly longer team effort of 8-10 minutes, submitted along with a short paper of 5-6 pages for their semester project. Some teams explained security flaws in web based applications, while oth-ers demonstrated weaknesses in various technologies or how a security control could reduce vul-nerabilities.
Findings/Results This section contains findings from the learning styles instrument and other surveys. Not all ques-tions have the same total sample size due to absences, non-responses to specific questions, or other data summarization issues.
Demographics Groups in the tables below are labeled by course topic (Net=Networking, Sec=Security) and year (1 or 2). Gender within the four sections is shown in Table 2. These numbers are fairly consistent across all courses in our ITM major. Participants were 76.1% male and 23.9% female. Usable data were available for 134 subjects across all sections.
Table 2. Gender Distribution across Sections
Course & Section Male Female Totals
Net1 31 12 43
Sec1 21 6 27
Net2 30 7 37
Sec2 20 7 27
Totals 102 32 134
% 76.1% 23.9% 100%
Learning Style Preferences Of the four major learning styles categories, students leaned heavily to the Visual dimension of the Visual/Verbal category, as well as toward the Sensor dimension of the Sensor/Intuitive cate-gory. Students were fairly balanced for the Active/Reflective category and leaned slightly toward Sequential in the Sequential/Global category (see Table 3). The visual learning style has been identified as a preference for many IT majors (Reed & Oughton, 1998; Zualkerman, 2006).
Table 3. Outcomes of ILS Administration (Felder & Soloman, 1993). Visual/Verbal Sensor/Intuitive Active/Reflective Sequential/Global
116 (86.6%) / 18 (13.4%)
102 (76.1%) / 32 (23.9%)
66 (49.2%) / 68 (50.7%)
74 (55.2%) / 60 (44.8%)
Visual learners are drawn to what they see, while verbal learners get more
from written or spo-ken explanations
Sensing learners pre-fer facts & solving
problems, while intui-tive learners prefer to discover possibilities & relationships, &
lean toward innova-tion
Active learners retain & understand best by applying it or explain-ing it to others, & pre-fer group work. Re-
flective learners prefer to think about a prob-
lem & work it out alone
Sequential learners prefer a step by step approach to gain un-derstanding, while
global learners absorb materials in large
chunks to grasp the big picture of a problem
before considering de-tails
211
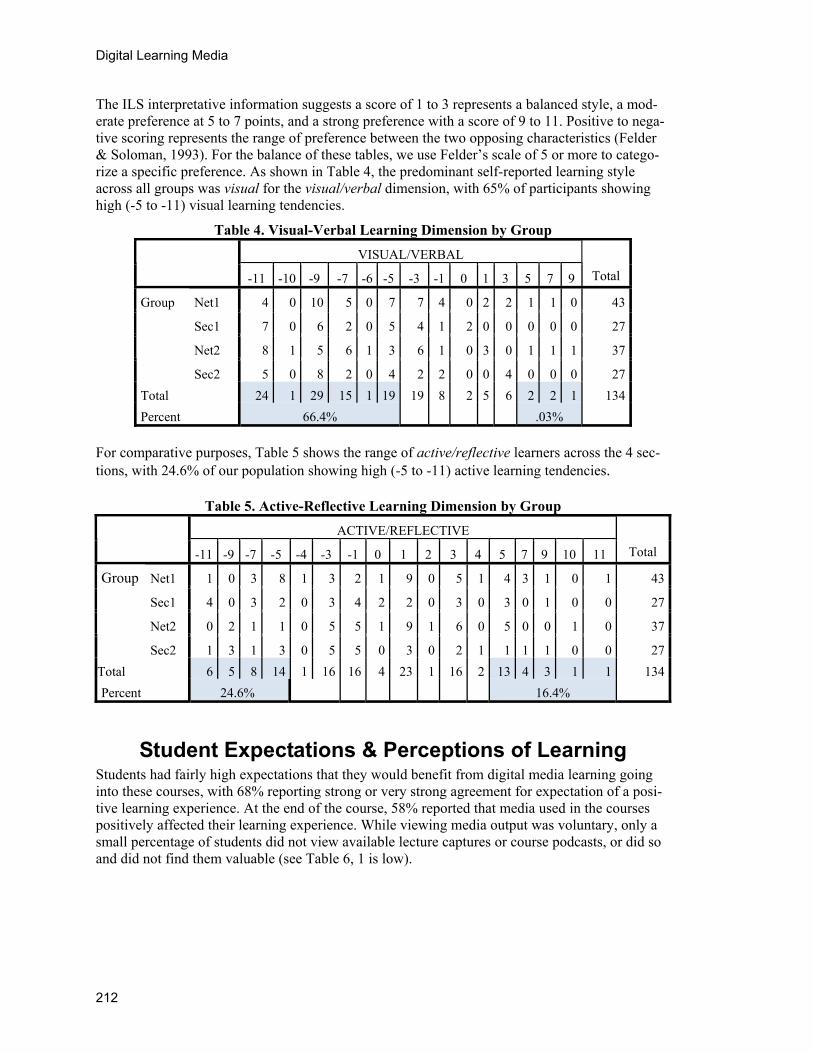
Digital Learning Media
The ILS interpretative information suggests a score of 1 to 3 represents a balanced style, a mod-erate preference at 5 to 7 points, and a strong preference with a score of 9 to 11. Positive to nega-tive scoring represents the range of preference between the two opposing characteristics (Felder & Soloman, 1993). For the balance of these tables, we use Felder’s scale of 5 or more to catego-rize a specific preference. As shown in Table 4, the predominant self-reported learning style across all groups was visual for the visual/verbal dimension, with 65% of participants showing high (-5 to -11) visual learning tendencies.
Table 4. Visual-Verbal Learning Dimension by Group
VISUAL/VERBAL
-11 -10 -9 -7 -6 -5 -3 -1 0 1 3 5 7 9 Total
Net1 4 0 10 5 0 7 7 4 0 2 2 1 1 0 43
Sec1 7 0 6 2 0 5 4 1 2 0 0 0 0 0 27
Net2 8 1 5 6 1 3 6 1 0 3 0 1 1 1 37
Group
Sec2 5 0 8 2 0 4 2 2 0 0 4 0 0 0 27
Total 24 1 29 15 1 19 19 8 2 5 6 2 2 1 134
Percent 66.4% .03%
For comparative purposes, Table 5 shows the range of active/reflective learners across the 4 sec-tions, with 24.6% of our population showing high (-5 to -11) active learning tendencies.
Table 5. Active-Reflective Learning Dimension by Group
ACTIVE/REFLECTIVE
-11 -9 -7 -5 -4 -3 -1 0 1 2 3 4 5 7 9 10 11 Total
Net1 1 0 3 8 1 3 2 1 9 0 5 1 4 3 1 0 1 43
Sec1 4 0 3 2 0 3 4 2 2 0 3 0 3 0 1 0 0 27
Net2 0 2 1 1 0 5 5 1 9 1 6 0 5 0 0 1 0 37
Group
Sec2 1 3 1 3 0 5 5 0 3 0 2 1 1 1 1 0 0 27
Total 6 5 8 14 1 16 16 4 23 1 16 2 13 4 3 1 1 134
Percent 24.6% 16.4%
Student Expectations & Perceptions of Learning Students had fairly high expectations that they would benefit from digital media learning going into these courses, with 68% reporting strong or very strong agreement for expectation of a posi-tive learning experience. At the end of the course, 58% reported that media used in the courses positively affected their learning experience. While viewing media output was voluntary, only a small percentage of students did not view available lecture captures or course podcasts, or did so and did not find them valuable (see Table 6, 1 is low).
212
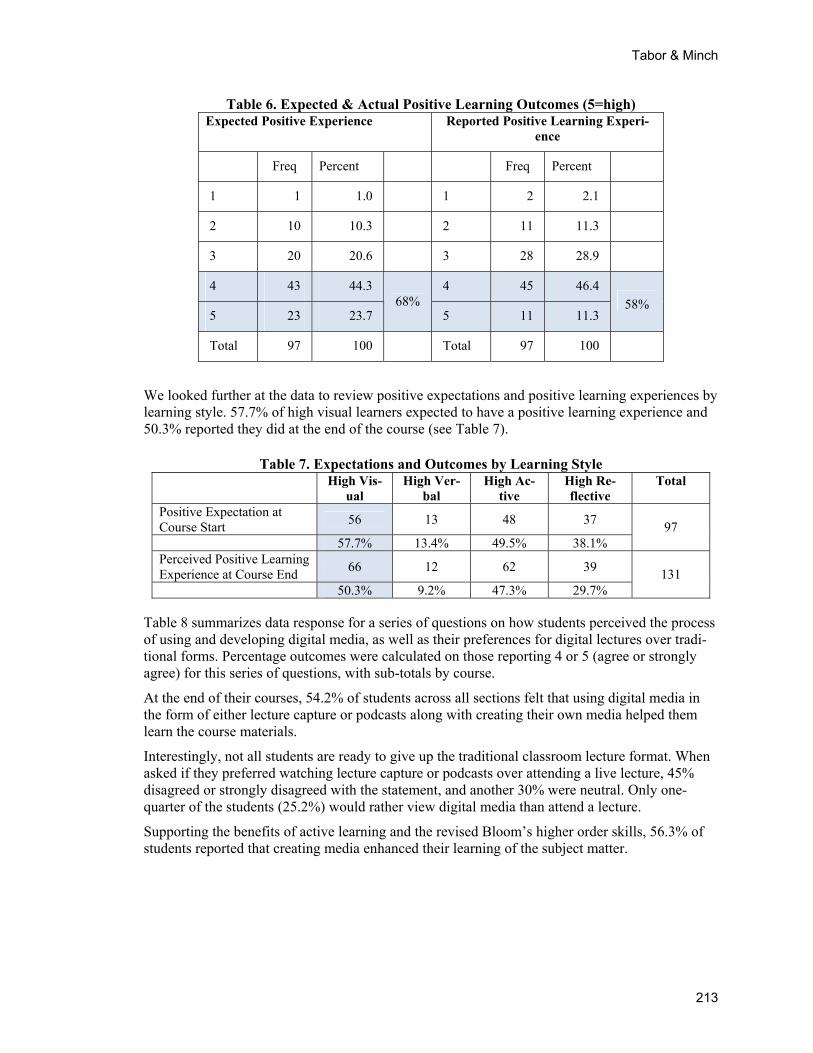
Tabor & Minch
Table 6. Expected & Actual Positive Learning Outcomes (5=high) Expected Positive Experience Reported Positive Learning Experi-
ence
Freq Percent Freq Percent
1 1 1.0 1 2 2.1
2 10 10.3 2 11 11.3
3 20 20.6 3 28 28.9
4 43 44.3 4 45 46.4
5 23 23.7 68%
5 11 11.3 58%
Total 97 100 Total 97 100
We looked further at the data to review positive expectations and positive learning experiences by learning style. 57.7% of high visual learners expected to have a positive learning experience and 50.3% reported they did at the end of the course (see Table 7).
Table 7. Expectations and Outcomes by Learning Style High Vis-
ual High Ver-
bal High Ac-
tive High Re-flective
Total
Positive Expectation at Course Start
56 13 48 37
57.7% 13.4% 49.5% 38.1% 97
Perceived Positive Learning Experience at Course End
66 12 62 39
50.3% 9.2% 47.3% 29.7% 131
Table 8 summarizes data response for a series of questions on how students perceived the process of using and developing digital media, as well as their preferences for digital lectures over tradi-tional forms. Percentage outcomes were calculated on those reporting 4 or 5 (agree or strongly agree) for this series of questions, with sub-totals by course.
At the end of their courses, 54.2% of students across all sections felt that using digital media in the form of either lecture capture or podcasts along with creating their own media helped them learn the course materials.
Interestingly, not all students are ready to give up the traditional classroom lecture format. When asked if they preferred watching lecture capture or podcasts over attending a live lecture, 45% disagreed or strongly disagreed with the statement, and another 30% were neutral. Only one-quarter of the students (25.2%) would rather view digital media than attend a lecture.
Supporting the benefits of active learning and the revised Bloom’s higher order skills, 56.3% of students reported that creating media enhanced their learning of the subject matter.
213
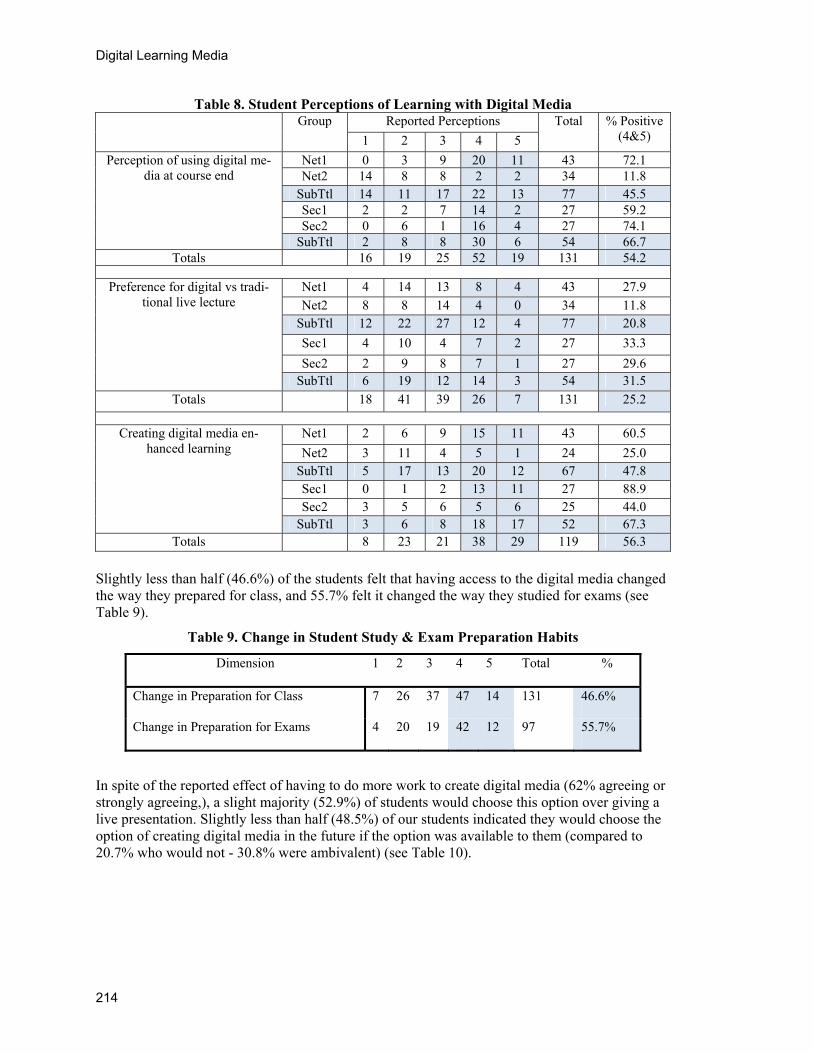
Digital Learning Media
Table 8. Student Perceptions of Learning with Digital Media Reported Perceptions Group
1 2 3 4 5
Total % Positive (4&5)
Net1 0 3 9 20 11 43 72.1 Net2 14 8 8 2 2 34 11.8
SubTtl 14 11 17 22 13 77 45.5 Sec1 2 2 7 14 2 27 59.2 Sec2 0 6 1 16 4 27 74.1
Perception of using digital me-dia at course end
SubTtl 2 8 8 30 6 54 66.7 Totals 16 19 25 52 19 131 54.2
Net1 4 14 13 8 4 43 27.9
Net2 8 8 14 4 0 34 11.8 SubTtl 12 22 27 12 4 77 20.8
Sec1 4 10 4 7 2 27 33.3
Sec2 2 9 8 7 1 27 29.6
Preference for digital vs tradi-tional live lecture
SubTtl 6 19 12 14 3 54 31.5
Totals 18 41 39 26 7 131 25.2
Net1 2 6 9 15 11 43 60.5
Net2 3 11 4 5 1 24 25.0 SubTtl 5 17 13 20 12 67 47.8 Sec1 0 1 2 13 11 27 88.9 Sec2 3 5 6 5 6 25 44.0
Creating digital media en-hanced learning
SubTtl 3 6 8 18 17 52 67.3 Totals 8 23 21 38 29 119 56.3
Slightly less than half (46.6%) of the students felt that having access to the digital media changed the way they prepared for class, and 55.7% felt it changed the way they studied for exams (see Table 9).
Table 9. Change in Student Study & Exam Preparation Habits
Dimension 1 2 3 4 5 Total %
Change in Preparation for Class 7 26 37 47 14 131 46.6%
Change in Preparation for Exams 4 20 19 42 12 97 55.7%
In spite of the reported effect of having to do more work to create digital media (62% agreeing or strongly agreeing,), a slight majority (52.9%) of students would choose this option over giving a live presentation. Slightly less than half (48.5%) of our students indicated they would choose the option of creating digital media in the future if the option was available to them (compared to 20.7% who would not - 30.8% were ambivalent) (see Table 10).
214
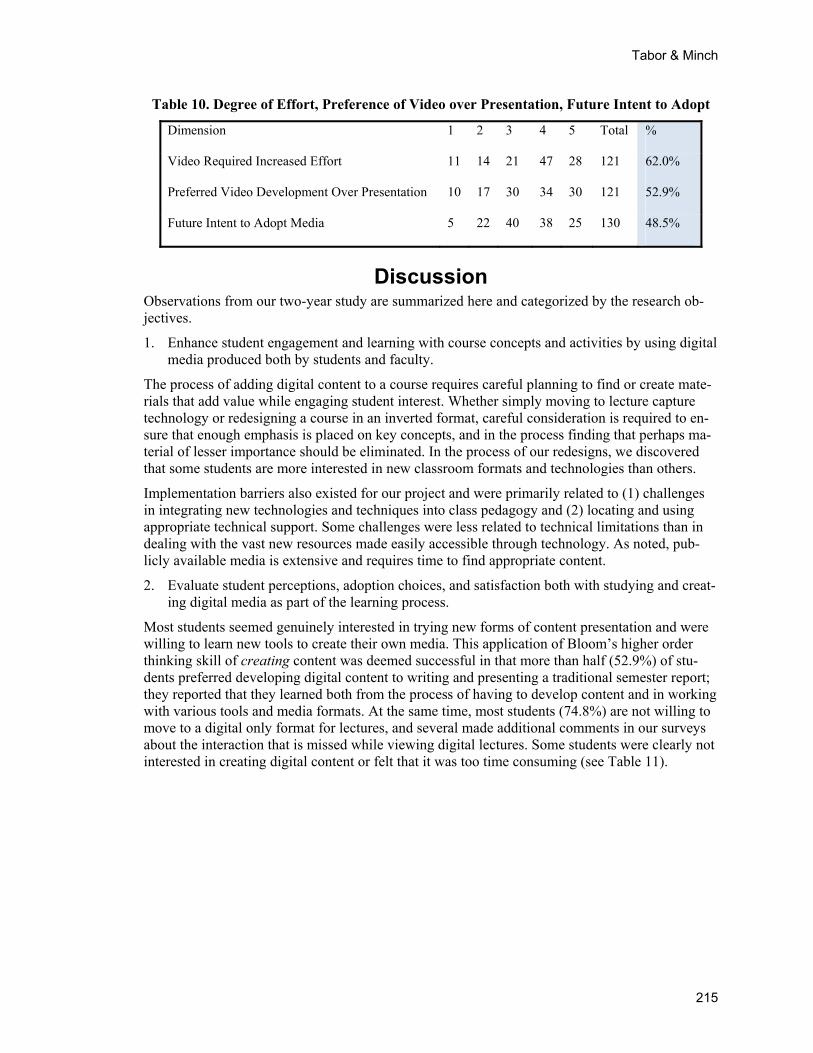
Tabor & Minch
Table 10. Degree of Effort, Preference of Video over Presentation, Future Intent to Adopt
Dimension 1 2 3 4 5 Total %
Video Required Increased Effort 11 14 21 47 28 121 62.0%
Preferred Video Development Over Presentation 10 17 30 34 30 121 52.9%
Future Intent to Adopt Media 5 22 40 38 25 130 48.5%
Discussion Observations from our two-year study are summarized here and categorized by the research ob-jectives.
1. Enhance student engagement and learning with course concepts and activities by using digital media produced both by students and faculty.
The process of adding digital content to a course requires careful planning to find or create mate-rials that add value while engaging student interest. Whether simply moving to lecture capture technology or redesigning a course in an inverted format, careful consideration is required to en-sure that enough emphasis is placed on key concepts, and in the process finding that perhaps ma-terial of lesser importance should be eliminated. In the process of our redesigns, we discovered that some students are more interested in new classroom formats and technologies than others.
Implementation barriers also existed for our project and were primarily related to (1) challenges in integrating new technologies and techniques into class pedagogy and (2) locating and using appropriate technical support. Some challenges were less related to technical limitations than in dealing with the vast new resources made easily accessible through technology. As noted, pub-licly available media is extensive and requires time to find appropriate content.
2. Evaluate student perceptions, adoption choices, and satisfaction both with studying and creat-ing digital media as part of the learning process.
Most students seemed genuinely interested in trying new forms of content presentation and were willing to learn new tools to create their own media. This application of Bloom’s higher order thinking skill of creating content was deemed successful in that more than half (52.9%) of stu-dents preferred developing digital content to writing and presenting a traditional semester report; they reported that they learned both from the process of having to develop content and in working with various tools and media formats. At the same time, most students (74.8%) are not willing to move to a digital only format for lectures, and several made additional comments in our surveys about the interaction that is missed while viewing digital lectures. Some students were clearly not interested in creating digital content or felt that it was too time consuming (see Table 11).
215
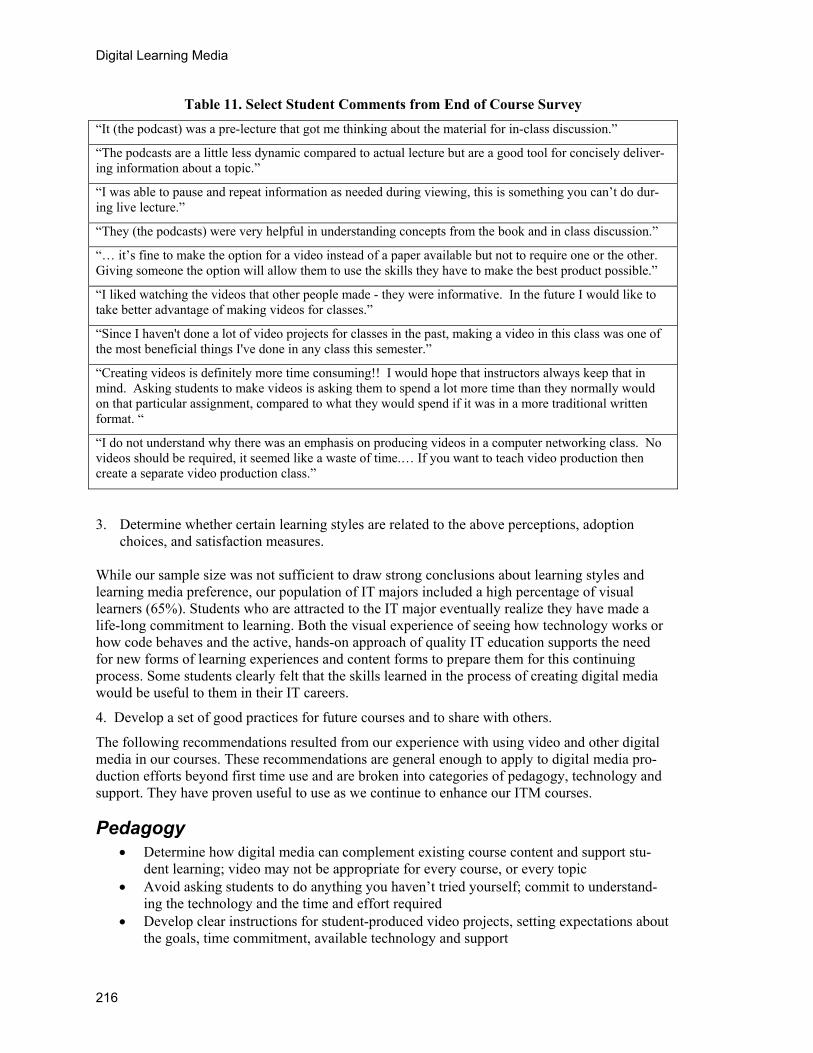
Digital Learning Media
Table 11. Select Student Comments from End of Course Survey
“It (the podcast) was a pre-lecture that got me thinking about the material for in-class discussion.”
“The podcasts are a little less dynamic compared to actual lecture but are a good tool for concisely deliver-ing information about a topic.”
“I was able to pause and repeat information as needed during viewing, this is something you can’t do dur-ing live lecture.”
“They (the podcasts) were very helpful in understanding concepts from the book and in class discussion.”
“… it’s fine to make the option for a video instead of a paper available but not to require one or the other. Giving someone the option will allow them to use the skills they have to make the best product possible.”
“I liked watching the videos that other people made - they were informative. In the future I would like to take better advantage of making videos for classes.”
“Since I haven't done a lot of video projects for classes in the past, making a video in this class was one of the most beneficial things I've done in any class this semester.”
“Creating videos is definitely more time consuming!! I would hope that instructors always keep that in mind. Asking students to make videos is asking them to spend a lot more time than they normally would on that particular assignment, compared to what they would spend if it was in a more traditional written format. “
“I do not understand why there was an emphasis on producing videos in a computer networking class. No videos should be required, it seemed like a waste of time.… If you want to teach video production then create a separate video production class.”
3. Determine whether certain learning styles are related to the above perceptions, adoption choices, and satisfaction measures.
While our sample size was not sufficient to draw strong conclusions about learning styles and learning media preference, our population of IT majors included a high percentage of visual learners (65%). Students who are attracted to the IT major eventually realize they have made a life-long commitment to learning. Both the visual experience of seeing how technology works or how code behaves and the active, hands-on approach of quality IT education supports the need for new forms of learning experiences and content forms to prepare them for this continuing process. Some students clearly felt that the skills learned in the process of creating digital media would be useful to them in their IT careers.
4. Develop a set of good practices for future courses and to share with others.
The following recommendations resulted from our experience with using video and other digital media in our courses. These recommendations are general enough to apply to digital media pro-duction efforts beyond first time use and are broken into categories of pedagogy, technology and support. They have proven useful to use as we continue to enhance our ITM courses.
Pedagogy Determine how digital media can complement existing course content and support stu-
dent learning; video may not be appropriate for every course, or every topic Avoid asking students to do anything you haven’t tried yourself; commit to understand-
ing the technology and the time and effort required Develop clear instructions for student-produced video projects, setting expectations about
the goals, time commitment, available technology and support
216
Tabor & Minch
Assign at least one project in small groups to allow students to learn from each other and share the time commitment
Allow sufficient time to review publicly available media for appropriateness and reus-ability relevant to course content
Carefully cover the use of intellectual property and web resources & determine how such content should be cited (i.e., credits page with numbered references throughout)
Develop grading rubrics to establish expectations for student output and to translate exist-ing project guidelines to digital media output
Determine campus resources for course development
Technology Start small and early; choose a small number of software tools and spend time upfront
learning features and capabilities; determine campus resources for tool and course sup-port
Choose a limited number of software features and become familiar with them; add more advanced features as experience grows, possibly in second year
Allow time to produce good quality output, at least double or more time over traditional lecture development, and strive for reusability
Understand the hardware requirements of the software tools selected, that audio editing may consume considerable system resources, and output will require reliable storage space
Be aware that everything will take longer than planned
Training & Support Give students general tutorials on the tools available to them even though they feel they
can handle any technology Develop reusable tutorials and tips, and seek available campus resources to assist with
training and ongoing support Work with other faculty to share experiences and successes without having to learn eve-
rything alone
Conclusion This study advances research into IT education in several ways. First it helps demonstrate the value of applying constructionist learning theory from other disciplines to IT education. Our ex-perience also supports the benefits of using the revised Bloom’s Taxonomy framework for active learning with technology in the classroom. Additionally, with this rich framework at hand we are justified in letting students explore and create their own learning objects, therefore enhancing stu-dent engagement and achieving the higher level thinking skills that comes with creating their own learning content.
Strategies for increasing the successful adoption of digital media into the curriculum must revolve around support from university technology departments. Without adequate sources and training resources, the time commitment can easily become excessive, discouraging many faculty mem-bers from trying new tools and technology. Most schools are supportive of new technology adop-tion, but technology groups organized by specialty can make it challenging to find the right help on a timely basis.
217
Digital Learning Media
Acknowledgement This work was funded by an Idaho Technology grant which is invaluable in helping faculty try new things with technology and providing support for pioneering efforts.
References Ackerman, E. (n.d.). Piaget’s constructivism, Papert’s constructionism: What’s the Difference? MIT Publi-
cations. Retrieved from: http://learning.media.mit.edu/content/publications/EA.Piaget%20_%20Papert.pdf
Ahmed, F., Campbell, P., Jaffar, A. Alkobaisi, S., & Campbell, J. (2010). Learning & personality types: A case study of a software design course. Journal of Information Technology Education: Innovations in Practice, 9, 237-252. Retrieved from http://www.jite.org/documents/Vol9/JITEv9IIPp237-252Ahmed823.pdf
Anderson, L. W., & Krathwohl, D. R. (Eds.) (2001). A taxonomy for learning, teaching, and assessing: A revision of Bloom’s taxonomy of educational objectives. New York: Addison Wesley Longman.
Anderson, L. W., & Sosniak, L. A. (Eds.) (1994). Bloom’s taxonomy: A forty-year retrospective. 93rd Year-book of the Society for the Study of Education. Chicago, Il: University of Chicago Press.
Bloom, B. S. (Ed.), Engelhart, M. D., Furst, E. J., Hill, W. H., & Krathwohl, D. R. (1956). Taxonomy of educational objectives: Handbook I: Cognitive domain. New York. David McKay.
Bower, M., Hedberg, J., & Kuswara, A. (2010). A framework for Web 2.0 learning design, Educational Media International, 47(3), 177-198.
Buckley, J. (2003). Bloom’s taxonomy: A framework for assessing programmers’ knowledge of software systems. 11th IEEE International Workshop on Program Comprehension, Dublin, Ireland, p. 165-174.
Cegielski, C., Kazen, B., & Rainer, R. (2011). Teach them how they learn: Learning styles and information systems education. Journal of Information Systems Education, 22(2), 135-146.
Churches, Andrew. (2009). Bloom’s digital taxonomy. Retrieved from: http://edorigami.wikispaces.com
Clump, M., & Skogsberg, K. (2003). Differences in learning styles of college students attending similar universities in different geographic locations. College Student Journal, 37(4), 501-509.
Felder, R. (1996). Matters of style. ASEE Prism, 6(4), 18-23.
Felder, R., & Brent, R. (2005). Understanding student differences. Journal of Engineering Education, 94(1), 57-72.
Felder, R., & Silverman, L. K. (1988). Learning and teaching styles in engineering education. Engineering Education, 78(7), 674-681.
Felder, R., & Soloman, B. (1993). Learning styles and strategies. North Carolina State University. Re-trieved 7/2009 from: http://www4.ncsu.edu/unity/lockers/users/f/felder/public/ILSdir/styles.htm
Felder, R., & Soloman, B. (1999, 2005). Index of Learning Styles (ILS). Available at: http://www4.ncsu.edu/unity/lockers/users/f/felder/public/ILSpage.html
Felder, R., & Spurlin, J. (2005). Applications, reliability and validity of the index of learning styles. Jour-nal of Engineering Education, 21(1), 103-112.
Forehand, M. (2010). Bloom’s taxonomy: From emerging perspectives on learning, teaching, and technol-ogy. Retrieved from: http://www.roe11.k12.il.us/GES%20Stuff/Day%204/Process/Blooms/Mary%20Forehand%20discussion-Bloom%27s%20Taxonomy.pdf
Hermann, N. (1990). The creative brain (Hermann Brain Dominance Instrument). N. Carolina, USA: Brain Books.
218
Tabor & Minch
Jones, C., Reichard, C., & Mokhtari, K. (2003). Are students’ learning styles discipline specific? Commu-nity College Journal of Research and Practice, 27(5), 363-375.
Kolb, D. (1984). Learning Style Inventory (LSI). Experiential learning: Experience as the Source of Learning and Development. Englewood Cliffs, NJ: Prentice-Hall.
Manochehri, N. and Sharif, K. (2010). A model-based investigation of learner attitudes towards recently introduced classroom technology. Journal of Information Technology Education, v9, 31-52.
Mishra, P., & Koehler, M. J. (2006). Technological, pedagogical, content knowledge: A framework for teacher knowledge. Teachers College Record, 108(6), 1017-1054.
Myers-Briggs, I. McCaulley, M. Quenk, N., & Hammer, A. (1998). Manual: A guide to the development and use of the Myers-Briggs Type Indicator (3rd ed.). Consulting Psychologist Press.
Papert, S. (1986). Constructionism: A new opportunity for elementary science education. Unpublished pro-posal to the National Science Foundation (in Bower et al., 2010).
Platsidou, M., & Metallidou, P. (2009). Validity and reliability issues of two learning style inventories in a Greek sample: Kolb’s Learning Style Inventory and Felder & Soloman’s Index of Learning Styles. In-ternational Journal of Teaching and Learning in Higher Education, 20(3), 324-335.
Reed, W., & Oughton, J. (1998). The effects of hypermedia knowledge and learning styles on the construc-tion of group concept maps. Computers in Human Behavior, 14(1), 1-22.
Rosati, P., & Felder, R. (1995). Engineering student responses to an index of learning styles. Proceedings of the 1995 ASEE Annual Conference, Washington, DC, ASEE.
Salter, D., Evan, N., & Forney, D. (2006). A longitudinal study of learning style preferences on the Myers-Briggs Type Indicator and Learning Style Inventory. Journal of College Student Development, March/April 47(2), 173-184.
Sardone, N. (2011). Developing information technology fluency in college students: An investigation of learning environments and learner characteristics. Journal of Information Technology Education, 10, 101-122. Retrieved from http://www.jite.org/documents/Vol10/JITEv10p101-122Sardone846.pdf
Zualkerman, I. A. (2006). Learning styles of computer programming students: A Middle Eastern and American comparison. IEEE Transactions on Education, 49(4), 443-450.
219
Digital Learning Media
Appendix Instruments Used in this Study
I. Pre-Course: Technology Experience Survey Please answer the following questions about the technology you regularly use:
1. I have a computer at home 2. I have broadband Internet access at home (Quest DSL, CableOne, etc.) 3. If you have a fast Internet connection, what is your download speed in Mbps? 4. I have a laptop or netbook computer 5. I have a mobile device that plays audio files (MP3) 6. If you have a mobile audio device, what kind/model? 7. I have a mobile device that plays video files (MP4) 8. If you have a mobile device that plays video, what kind/model? 9. What make and model of mobile phone do you use? 10. Do you have a 3G or better data plan with your phone? 11. Do you have an unlimited texting plan with your phone? 12. Does your phone have a web browser? 13. If yes to above, what operating system is on your phone? (Android, 14. Windows Mobile, IOS, Blackberry, etc)
Please indicate your level of experience with the following technologies: (1=none, 5=a lot)
15. Watching videos on public Internet sites such as YouTube 16. Listening to audio from public sites such as Internet radio. 17. Subscribing and listening to podcasts from any source 18. Subscribing and listening to podcasts from iTunes 19. Subscribing and listening to podcasts from iTunesU (educational materials) 20. Contributing to a wiki 21. Receiving tweets on Twitter 22. Sending your own tweets on your own Twitter account 23. Maintaining your own Facebook page 24. Maintaining your own LinkedIn presence 25. Maintaining your own blog 26. Maintaining your own web site (other than those mentioned already) 27. Doing your own digital audio recording 28. Using any audio editor such as Audacity 29. Doing your own video recording 30. Using any video editor such as Windows Movie Maker 31. Uploading your videos to YouTube or another public site 32. Doing screen recordings with a tool such as Camtesia that adds audio to PowerPoint, or
captures screen content 33. In addition to what was asked about already, do you use any other hardware or software to
listen to, watch, create, edit, or publish digital audio or video materials? If so, please list what you use and what you use it for.
34. In addition to what was asked about already, do you use any other social networking tools or sites? If so, please list what you use and what you use it for.
220
Tabor & Minch
35. Do you have a job that involves extensive work with or support of computers or informa-tion technologies? If so, please explain what you do.
36. Do you have any other experience with computers or IT you’d like to mention? 37. Please enter your name. 38. Please enter your student ID. Thanks for your assistance!
II. Mid-Term Course Survey
1. Compared to your other classes, the workload for this class so far is (1= Much lower; 2 =
Somewhat lower; 3= About the same; 4 = Somewhat higher; 5= Much higher). 2. How many of the PowerPoint podcasts have you listened to? 3. How many of the Audio only podcasts have you listened to 4. How many of the posted notes pages have you studied? 5. Which media has been your preferred choice for: (a. Preparing for class; b. Studying for
exams; c. Clarifying a specific topic) a. Powerpoint Podcasts b. Audio Podcasts c. Posted Notes d. N/A
Please answer the following questions using this scale: (1. I learn much less; 2. I learn a little less; 3. I learn about the same; 4. I learn a little more; 5. I learn much more).
6. Compared to conventional in-class lectures, what value do PPT Podcasts have? 7. Compared to conventional in-class lectures, what value do Audio Podcasts have? 8. Compared to conventional in-class lectures, what value do the hands-on labs offer? 9. Compared to conventional in-class lectures, what value do the in-class activities offer? 10. What value did the video assignment have compared to writing a paper? 11. If I were given the choice of semester class project formats: (1) a conventional written pro-
ject report (typically 10-15 pages, with references); or (2) a video project report (typically 10 to 15 minutes, with a short paper and references); I would: (1.Strongly prefer a conven-tional written project report; 2. Slightly prefer a conventional written project report; 3. Not have a preference either way; 4. Slightly prefer a video project report; 5. Strongly prefer a video project report.
12. Any comments on the class format to this point? (use reverse side if needed)
III. End of Course Media Survey A. All questions in this section relate to course podcasts. Please respond using the following
scale: (1. Strongly disagree; 2. Disagree; 3. Neutral;. 4. Agree; 5. Strongly Agree)
1. At the beginning of the semester, the idea of using podcasts to learn course materials ap-pealed to me.
2. At the end of the semester, I feel using podcasts did help me learn the course materials. 3. The availability of course podcasts changed my study habits when preparing for class. 4. The availability of course podcasts changed my study habits when studying for exams. 5. The podcast delivery format enhanced my learning experience. 6. Podcast delivery format make learning more enjoyable.
221
Digital Learning Media
7. I prefer the flexibility that podcasts provides. 8. I prefer podcasts for course delivery to attending lectures. 9. I did not use the podcasts at all because I learn better from face-to-face classroom experi-
ence. 10. I prefer the combination of podcast course delivery with the face-to-face classroom ex-
perience. 11. My reading time decreased with the addition of podcasts. 12. My study time increased with the addition of podcasts. 13. I viewed podcast course materials for the following reasons (choose all that apply):
a. Required content in other formats b. Missed lectures c. Making up notes from class d. Course content preview e. Course content review f. Convenient access g. Flexibility h. Portability i. Ease of use j. I did not view any podcasts
14. Which of the following features of podcasts did you find most valuable? a. I could review materials wherever I wanted b. I could review materials whenever I wanted c. I could review materials at my own pace d. I felt the materials were covered more clearly e. I learned the material better f. I felt more involved with the material g. I did not find podcasts valuable
15. Do you have any other comments about our use of podcasts this semester? B. All questions in this section relate to video projects. Please respond with the following scale:
(1. Strongly disagree; 2. Disagree; 3. Neutral; 4. Agree; 5. Strongly Agree.)
1. At the beginning of the semester, I already had prior experience creating my own videos. 2. At the end of the semester, I now feel confident that I can create my own videos. 3. I find it easy to create videos. 4. There is adequate hardware and software available for me to create videos. 5. There is adequate technical assistance to help me create videos. 6. I feel the video I created for my project is more effective in communicating the results of
my work than a paper would have been. 7. Creating a video for my project enhanced my learning experience. 8. Creating a video for my project made learning more enjoyable. 9. I prefer delivering my project results in the form of a pre-recorded video rather than a live
presentation. 10. I spent more effort creating video than I would have with a conventional paper project re-
port. 11. My effectiveness as a student/learner would be improved if video were more integrated
into the curriculum. 12. I think it would be a good idea for instructors to offer the video format as an option to pa-
per project reports.
222
Tabor & Minch
223
13. I think it would be a good idea for instructors to require the use of video instead of paper project reports.
14. The experience and skills I gained creating videos will help me in my career. 15. If future classes offer the option of creating videos for projects, I will take that option. 16. Preparing a video topic helped me understand the topic better than traditional course mate-
rials. 17. Watching a video presented by students helped me understand the topics better than tradi-
tional course materials.
C. Do you have any other comments about our use of videos for projects this semester?
Biographies Sharon W. Tabor is Professor of Information Technology Manage-ment at Boise State University, College of Business and Economics. She received her Ph.D. from the University of North Texas following a lengthy management career. Dr. Tabor’s current teaching and research interests include information security, business intelligence, IT service management, and mobile learning. She has published in various jour-nals including Communications of the ACM, Decision Science Journal of Innovative Education, Journal of Information Technology Educa-tion, Journal of Information Technology Cases and Applications, and the Quarterly Review of Distance Education.
Dr. Robert Minch is Professor of Information Technology Manage-ment in the College of Business and Economics at Boise State Univer-sity. His PhD in Management Information Systems was earned at Texas Tech University in 1982. Dr. Minch has published several dozen research articles in academic journals and the proceedings of national and international conferences, including MISQ, JMIS, CACM, ICIS, and HICSS. He currently teaches classes in computer networking, and conducts research on topics such as privacy implications of location-aware mobile computing d
-evices.

This page left blank intentionally
Journal of Information Technology Education: Research Volume 12, 2013
Cite as: Silveira et al. (2013). A digital ecosystem for the collaborative production of open textbooks: The LATIn methodology. Journal of Information Technology Education: Research, 12, 225-249. Retrieved from http://www.jite.org/documents/Vol12/JITEv12ResearchP225-246SilveiraFT89.pdf
A Digital Ecosystem for the Collaborative Production of Open Textbooks: The LATIn Methodology
Ismar Frango Silveira3, Xavier Ochôa6, Alex Cuadros-Vargas7, Alén Pérez Casas8, Ana Casali1, Andre Ortega6, Antonio Silva
Sprock2, Carlos Henrique Alves3, Cesar Alberto Collazos Ordoñez10, Claudia Deco1, Ernesto Cuadros-Vargas7, Everton
Knihs3, Gonzalo Parra9, Jaime Muñoz-Arteaga4, Jéssica Gomes dos Santos3, Julien Broisin5, Nizam Omar³, Regina Motz8,
Virginia Rodés8, and Yosly Hernández C. Bieliukas2 1Universidad Nacional de Rosario (UNR), Planta Baja, Rosario, Argentina
2Universidad Central de Venezuela (UCV), Los Charaguamos, Caracas, Venezuela 3Universidade Presbiteriana Mackenzie (UPM), São Paulo, Brazil
4Universidad Autónoma de Aguascalientes (UAA), Aguascalientes, Mexico 5Université Toulouse III - Paul Sabatier (UPS), Toulouse, France
6Escuela Superior Politécnica del Litoral (ESPOL), Campus Gustavo Galindo - CTI, Guayaquil, Ecuador
7Universidad Catolica San Pablo (UCSP), Campus Campiña Paisajista s/n Quinta Vivanco, Arequipa, Peru
8Universidad de la República (UdelaR), Montevideo, Uruguay 9University of Leuven (KU Leuven), Leuven, Belgium
10Universidad del Cauca (Unicauca) FIET, Setor Tulcan, Popayán, Colombia
Executive Summary Access to books in higher education is an issue to be addressed, especially in the context of un-derdeveloped countries, such as those in Latin America. More than just financial issues, cultural aspects and need for adaptation must be considered. The present conceptual paper proposes a methodology framework that would support collaborative open textbook initiatives. This meth-odology intends to be the main guideline for a digital ecosystem for the collaborative production of open textbooks and has the potential to solve standing methodological problems of current ini-tiatives, such as Wikibooks and Connexions. The system's architecture and construction will be
guided by six collaborative writing di-mensions: process, roles, timing, con-trolling, granularity, and writing groups. Each dimension will coordinate an as-pect of the collaborative work and is detailed in the methodology proposed in this paper.
This paper is divided in the following parts: the first part introduces the sub-ject, being followed by an analysis of
Material published as part of this publication, either on-line or in print, is copyrighted by the Informing Science Institute. Permission to make digital or paper copy of part or all of these works for personal or classroom use is granted without fee provided that the copies are not made or distributed for profit or commercial advantage AND that copies 1) bear this notice in full and 2) give the full citation on the first page. It is per-missible to abstract these works so long as credit is given. To copy in all other cases or to republish or to post on a server or to redistribute to lists requires specific permission and payment of a fee. Contact [email protected] to request redistribution permission.
Editor: Linda Knight
Digital Ecosystem for the Collaborative Production of Open Textbooks
related works about collaboration and Computer-Supported Cooperative Work; in this section, some authors, ideas, and methodological aspects of collaborative writing are also discussed. Next, the paper shows the proposal of a Digital Ecosystem for the collaborative creation of open text-books, the six dimensions of this Ecosystem, and its respective descriptions. The work finishes with some conclusions about the proposal and the next steps needed to implement it in the real world.
Keywords: collaborative writing, textbooks, LATIn project, Latin America, universities, digital ecosystem, Wikibooks, Connexions, Open textbooks, Open license, Copyleft, Creative Commons
Introduction The regular process for book production is often regarded as a set of procedures with a well-defined, ordered progression from beginning to ending. Content producers following different strategies can write, edit, and publish books. The product of this activity is the final textbook in a largely fixed form. This model for textbook production is heavily based on historical copyright practices and writing tools available when it was first implemented.
New approaches to content licensing and sharing, as well as new collaboration tools, have opened opportunities for new ways of producing collaborative textbooks. Previously, standard copyright rules forbade the copying of any part of a book, forcing authors of textbooks to find different ways to express the same ideas, even if they were writing about widely known topics, in order to avoid infringing these rules. On the other hand, new open licenses, such as Copyleft or Creative Commons, permit the reuse and adaptation of parts or even complete books. This means that if a textbook with an open license contains a good explanation of a topic, it can be reused in other textbooks. Furthermore, if that explanation is not good enough for the new content producers, they are allowed to change it without asking for permission to the original producer.
One of the causes of the low adoption of collaborative writing is the fact that, some years ago, the technology available was limited. It was hard to find textbooks produced by more than 4 or 5 au-thors. Usually, each author contributed his or her part, an editor checked for consistency and co-herence, and the final version was produced. This writing strategy is known as "Separate Writers" and it was widely used, due to the nature of the tools available. Most of these tools were simple word processors, making truly collaborative writing impracticable, since it would be impossible to have everyone working in all parts of the document at the same time and still maintain both thematic coherence and version management of the different writings. The development of more sophisticated collaborative writing tools, such as wikis, and synchronous applications like Google Docs, allows seamless collaboration on long documents, where every author can contribute in throughout the document without losing reference versions. The use of these more sophisticated tools increases the number of potential contributors without turning collaboration management into a complex activity. Both types of innovations described here, legal and technological, have the potential to revolutionize the way in which textbooks are produced.
One characteristic of the traditional textbook production model is that the only acceptable final product is a complete book. If a content producer had materials and ideas for a single chapter or section, this producer would not be able to publish them. The talent of these small producers is not leveraged in the process, thus diminishing the potential quality of the resulting textbooks. Consider the possibility of having textbooks created by a large group of authors, each one special-izing in one or more topics. The consistency and coherence of collaborative textbooks could be managed not only by an editor, but also through peer-reviews and continuous cross-evaluation. This new approach also has the potential to produce higher quality textbooks than the traditional model does.
226
Frango Silveira et al.
However, adding open licenses and new technologies is not enough to bootstrap a different proc-ess of textbook production. Collaboration strategies and methodologies should be in place, in or-der to guide the textbook production groups. However, after an exhaustive literature review, no conceptual frameworks were found to support collaborative writing processes, especially when dealing with open textbooks as the main products of such processes. This is the knowledge gap that this paper proposes to fill. This work is a conceptual paper, and as such it does not aim to present any results of empirical studies or experiments. Instead, our major goal is to propose a framework of collaboration strategies and methodologies, describing the concept of a digital eco-system for collaborative open textbook production.
Related Work In this section, Collaboration and Computer-Supported Cooperative Work (CSCW) is introduced. Then we focus on analysis of the literature relating to experiences with collaborative writing of textbooks.
Collaboration has been a way for humans to do things from ancient times. Technology advances facilitate communication and information sharing in digital formats and seem to have a positive impact on our tendency to collaborate, probably because it is cheaper and faster for us to commu-nicate now than it was before, and it is much easier to share digital objects than physical ones. From software freedom initiatives to more recent movements towards freedom of other digital artifacts, and nowadays Web 2.0 phenomena, people have met in digital spaces and have used digital tools and media to create digital materials that can be shared among themselves and with others. The literature provides many definitions for collaboration, but we restrict ourselves to Patel, Pettitt, and Wilson (2012), which describes collaboration as a community activity that co-ordinates itself to communicate and achieve common goals.
Computer-Supported Cooperative Work is a computer-assisted coordinated activity carried out by groups of collaborating individuals (Baecker, Grudin, Buxton, & Greenberg, 1995). CSCW is a very broad interdisciplinary area, where we can find different software available to support col-laboration. One type of such software is groupware, computer-based systems that provide an in-terface to a shared environment in order to support groups of people working on a common task. The collaborative creation of open textbooks falls into the realm of study of CSCW and more specifically makes use of collaborative writing groupware tools.
We primarily are interested here in such topics as how the team in charge of a book creation is formed, the different roles in the group, how the work is distributed, how different versions are managed, and what authoring policies are used. Unfortunately, there is sparse literature in this area. However, we have reviewed different successful projects and experiences related to the col-laborative creation of books, and, below, we present a brief description of the most relevant works for our purpose. We begin by considering the two most important initiatives that propose tools and methodologies to enable authors to produce books: Wikibooks and Connexions.
Wikiboooks Wikibooks is a Wikipedia project that started in 2003. It presents the same editing interface than Wikipedia (Ravid, Kalman, & Rafaeli, 2008). According to Frith (2009), Wikibooks has four key problems related to the methodology used:
Accuracy: Any author could modify the textbook created by the original author without creating a new version of it. This allows the possibility that good content could be re-placed by bad content.
227
Digital Ecosystem for the Collaborative Production of Open Textbooks
Collaboration: There is much less collaboration than in Wikipedia. The books are mainly the product of one author or a small number of authors.
Length: The article format that works well for Wikipedia does not adjust to the length of a complete textbook.
Attribution: There is little recognition for the authorship and it is not explicit. The au-thors in this system do not have any control over their content and do not receive specific credit for their work.
Despite these limitations, the wiki format has been used in valuable projects. Hohne, Fu, Barkel, and Woolf (2007) present an approach to teaching whereby students and faculty collaborate to explore subject matter through the creation of articles for an open-source textbook viewable using the wiki format. In this approach, teams of students wrote sections of a new textbook for a senior level Chemical Engineering Process Controls course. The writing and presenting of articles pro-vide opportunities for students to learn by teaching. Each article was formally reviewed by other students in the class to give suggestions and correct errors. Throughout this process, the instruc-tors acted as advisors, gave the general topic outlines, provided reference material and made con-nections between various student topics. Hohne et al.'s paper presents evidence of the good re-sults of this approach in the form of standard course evaluations. Another similar experience is detailed in Ravid et al. (2008), where wiki technology was applied to the development of an in-troductory academic textbook on information systems, which was written collaboratively by fac-ulty and students and was made available online free of charge. After about two years of activity, the wikitextbook accumulated 564 sub-chapters, co-authored by undergraduate and graduate stu-dents in more than 20 classes offered by Israeli universities. Authors of this research discuss the potential of wiki textbooks as vehicles of empowerment to students, teachers, and the discipline.
Connexions Unlike Wikibooks, Connexions is a collaborative writing platform and a repository at the same time. In Connexions, users are free to create educational materials and contribute to the reposi-tory; copy and customize materials; mix them together to produce new books and courses; and to create finished products like e-learning web courses or printed books (Dholakia, King, & Bara-niuk, 2006). The production of content in Connexions has a modular format where the user needs to register to be able to create a module. In order to modify one of these units created by another user, the author needs permission of the original writer, or they must split off a new version. The authors of a module are always mentioned at its beginning. The main limitations found in Con-nexions for the production of Collaborative Textbooks are:
The Connexions community is driven by modules, not entire books. While having loose materials is beneficial for the creation of textbooks, often this material remains loose and is not ultimately coordinated with other modules to produce a cohesive book.
Collaboration: While modules are created collaboratively, most of the books that are cre-ated (called collections) have a single author.
Edition: When books are created that include work by diverse authors, those books are often just a collection of modules, without continuity.
Concurrency: There is no control for the concurrency. If two authors open the same part of the text, the changes preserved are only from the one that saved last.
Baker, Thierstein, Fletcher, Kaur, and Emmons (2009) present a proof-of-concept via Connex-ions. Their research shows the feedback returned by professors and students explaining each of the lessons learned about open textbook production. Challenges to the production and adoption of
228
Frango Silveira et al.
open textbooks include (1) faculty members’ and students’ expectations of high production qual-ity, (2) the need for methods for documenting and maintaining control over various versions, and (3) the need for better processes for converting existing open content to digital and accessible formats. Baker et al. identified lessons learned about open textbook production, emphasizing the importance of interactivity, assembly-line workflow, a style guide and naming conventions, and standard mathematical authoring tools.
Additional Relevant Work Horner and Blyth (2008) present a project to address the massive shortage of accessible and af-fordable educational resources in South Africa. The vision of the project's founders was to write textbooks in a collaborative way using contributions from many volunteers. They describe at-tempting to get a core multi-skilled team following cohesion-oriented guidelines, and the need for clear role definition. These authors also emphasize the importance of open and regular communi-cation between team members. During the main content creation phase of the project, they held weekly meetings among team members. These meetings were always run with an agenda and in-cluded feedback sessions as well as team brainstorming sessions.
Henderson and Nelson (2011) describe Orange Grove Text Plus, a joint initiative of the Univer-sity Press of Florida and the Orange Grove repository. This article presents a detailed plan to promote open access textbooks and their use in Florida. This plan addresses six essential compo-nents: strategies for production and distribution, Open Textbook production and review protocols, awareness campaign, adoption and use, system security, and sustainability. In particular, the two first components are related to methodologies. The authors found that the factors involved in the development of open materials were, in order of priority: 1) time to review, find, select materials; 2) hardware and software to facilitate development; 3) desire to reduce student costs; 4) assurance that their materials are peer-reviewed and edited; 5) availability of the review criteria to the au-thors; and 6) administrative support for efforts.
Issues Raised by Past Work From the literature analysis, it can be concluded that collaborative writing is still a process being rediscovered by each group involved in the task. There are some guidelines, such as the ones presented by Posner and Baecker (1992), but their general nature makes them more useful to ana-lyze existing collaboration than to guide the development of a methodological strategy. The ad-vent of whole new ways to communicate and interact, brought by the advent of Web 2.0 tech-nologies, reopens the discussion about how to organize successful collaborative writing groups. From the experiences mentioned above, we can recognize that the first task to face in the collabo-rative writing of open textbooks is to establish the working group. Some authors recommend a small core team of well-motivated persons, where the different roles and responsibilities can be defined clearly. Fluent communication between participants is one of the main factors cited for success. Besides, some standardization may be defined, as, for example, a style guide and the use of specific math authoring tools. It can be concluded that the range of strategies varies accord-ingly to the needs and context of each initiative. There is at present no overall methodology that could be useful in every case and situation.
Goals of the Current Paper Our proposal of a digital ecosystem for the collaborative creation of open textbooks is designed to be adaptable to different working groups, incorporate recent collaboration types derived from new Internet technologies, and address the limitations and recommendations of prior researchers. We now present our guidelines for the collaborative work of content and book creation groups.
229
Digital Ecosystem for the Collaborative Production of Open Textbooks
An Ecosystem for the Collaborative Creation of Open Textbook
This work proposes the idea of a digital ecosystem to help to model and guide the collaborative creation of open textbooks. An ecosystem is a community of organisms in conjunction with envi-ronmental components interacting as a (semi-) closed system. These interactions form a network of interchanges of resources and energy that define such an ecosystem. The adaptation of the ecosystem concept to collaborative networks in the digital world has produced the term digital ecosystem.
A digital ecosystem is an artificial system that aims to harness the dynamics that underlie the complex and diverse adaptations of living organisms in biological ecosystems (Briscoe & De Wilde, 2006). A digital ecosystem transcends the traditional rigorously defined collaborative en-vironments from centralized or distributed or hybrid models into an open, flexible, domain clus-ter, demand-driven, interactive environment (Chang & West, 2006). A digital ecosystem is an open community, and there is no permanent need for centralized or distributed control or for sin-gle-role behavior. In a Digital Ecosystem, a leadership structure may be formed (and dissolved) in response to the dynamic needs of the environment (Boley & Chang, 2007).
The first component of any ecosystem is the environment and its inert components. In this anal-ogy the producers and the content are the main resources that form the environment. The produc-ers are the individuals that are able to transform ideas into multimedia elements. Content is any digital construct that could be used to teach or learn an idea or concept.
The second component of the ecosystem is the living organisms, grouped in species. These organ-isms take energy and resources from the environment and use them to grow and live. These or-ganisms could also produce or transform the resources that can later be the input for other organ-isms. For this analogy, we have two main species in the collaborative creation of open textbooks ecosystem: the book producing group and the content producing group. The groups are an aggre-gation of producers working on an idea. If the idea is the creation of a book, the group is usually large and the desired output will be a complete book on a given topic. If the idea is the creation of an individual piece of content, as in coverage of one topic, then the group usually will be small and the output will be simply discrete learning materials. It is interesting to note that content-driven organisms could live inside book-driven organisms or by themselves in the environment.
The cycle of this book-creation ecosystem starts when a number of producers in the environment decide to come together to create a book on a given topic. These producers bring to life the book-driven group that, if succeeds, will produce a book. Another way in which the cycle could start is when an individual producer (or a small group of producers) decides to create a discrete learning content. In this case, a content-driven organism is created with the goal of producing such learn-ing material.
The book-driven organism will be the main consumer of this ecosystem. It will integrate new producers that want to contribute and also will use existing content in order to produce the book. To assimilate the existing content, the book-driven organism will rely on a smaller content-driven organism to adapt this content to the needs of the book. Also the content-driven organisms inside the book-driven one will be able to create new content that is given back to the environment. The book-driven organism, when the initial idea has been fulfilled, will generate a book. Figure 1 shows the collaborative writing process, beginning with the group formation and ending with writing the textbook. Any group could create new versions of the book.
230
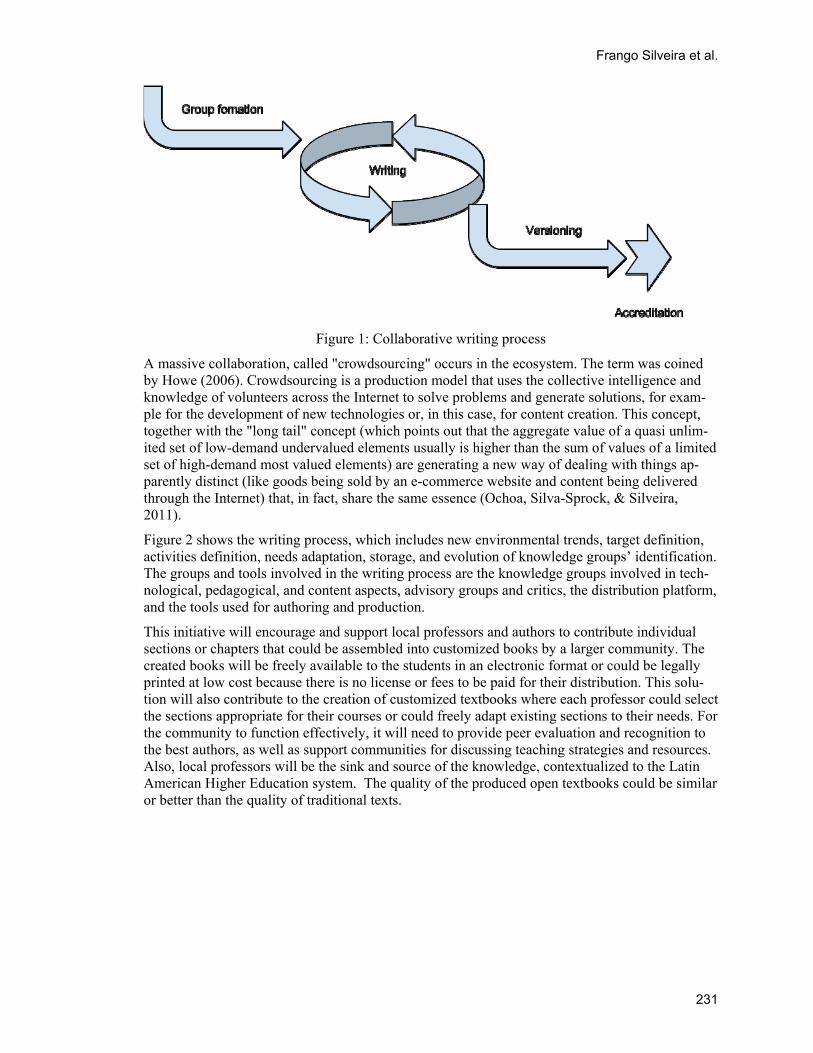
Frango Silveira et al.
Figure 1: Collaborative writing process
A massive collaboration, called "crowdsourcing" occurs in the ecosystem. The term was coined by Howe (2006). Crowdsourcing is a production model that uses the collective intelligence and knowledge of volunteers across the Internet to solve problems and generate solutions, for exam-ple for the development of new technologies or, in this case, for content creation. This concept, together with the "long tail" concept (which points out that the aggregate value of a quasi unlim-ited set of low-demand undervalued elements usually is higher than the sum of values of a limited set of high-demand most valued elements) are generating a new way of dealing with things ap-parently distinct (like goods being sold by an e-commerce website and content being delivered through the Internet) that, in fact, share the same essence (Ochoa, Silva-Sprock, & Silveira, 2011).
Figure 2 shows the writing process, which includes new environmental trends, target definition, activities definition, needs adaptation, storage, and evolution of knowledge groups’ identification. The groups and tools involved in the writing process are the knowledge groups involved in tech-nological, pedagogical, and content aspects, advisory groups and critics, the distribution platform, and the tools used for authoring and production.
This initiative will encourage and support local professors and authors to contribute individual sections or chapters that could be assembled into customized books by a larger community. The created books will be freely available to the students in an electronic format or could be legally printed at low cost because there is no license or fees to be paid for their distribution. This solu-tion will also contribute to the creation of customized textbooks where each professor could select the sections appropriate for their courses or could freely adapt existing sections to their needs. For the community to function effectively, it will need to provide peer evaluation and recognition to the best authors, as well as support communities for discussing teaching strategies and resources. Also, local professors will be the sink and source of the knowledge, contextualized to the Latin American Higher Education system. The quality of the produced open textbooks could be similar or better than the quality of traditional texts.
231
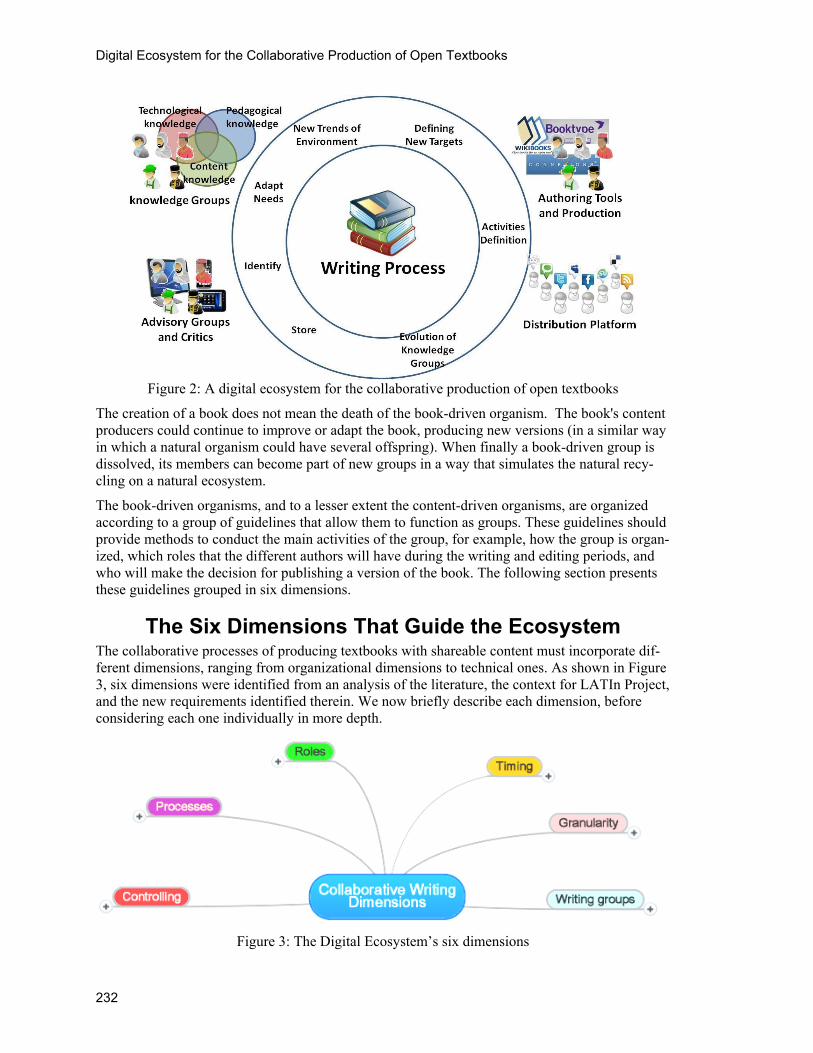
Digital Ecosystem for the Collaborative Production of Open Textbooks
Figure 2: A digital ecosystem for the collaborative production of open textbooks
The creation of a book does not mean the death of the book-driven organism. The book's content producers could continue to improve or adapt the book, producing new versions (in a similar way in which a natural organism could have several offspring). When finally a book-driven group is dissolved, its members can become part of new groups in a way that simulates the natural recy-cling on a natural ecosystem.
The book-driven organisms, and to a lesser extent the content-driven organisms, are organized according to a group of guidelines that allow them to function as groups. These guidelines should provide methods to conduct the main activities of the group, for example, how the group is organ-ized, which roles that the different authors will have during the writing and editing periods, and who will make the decision for publishing a version of the book. The following section presents these guidelines grouped in six dimensions.
The Six Dimensions That Guide the Ecosystem The collaborative processes of producing textbooks with shareable content must incorporate dif-ferent dimensions, ranging from organizational dimensions to technical ones. As shown in Figure 3, six dimensions were identified from an analysis of the literature, the context for LATIn Project, and the new requirements identified therein. We now briefly describe each dimension, before considering each one individually in more depth.
Figure 3: The Digital Ecosystem’s six dimensions
232
Frango Silveira et al.
Processes: This dimension embraces the set of activities that are meant to be developed when creating, reusing, or remixing separated content or entire books. Group-organizing, producing, publishing, accreditation, and Content-driven activities are the sub-categories of this dimension. The latter sub-category includes specific activities related to textbook writing, such as brainstorming, planning, researching and finding content, content pro-ducing, reusing and remixing, content organization, reviewing, releasing, and templating.
Roles: By allowing reusing and remixing, the producing process goes beyond traditional writing process, which means that traditional roles – like writers, reviewers, editors, and authors – must be reconsidered. New roles, together with some traditional ones, are pre-sent in this dimension, such as Content Producers; Idea Generators; different types of Re-viewers according to the contents or aspects such as, Technical, Pedagogical and Lan-guage; Organizers; Template Designers (Interface and Pedagogical), Accreditators, and Translators.
Timing: This dimension concerns the time when new content is meant to be produced or remixed/reused. Since these are two different processes, the timing dimension is majorly divided into two branches: writing time and remixing time.
Control: This dimension is already well-defined in literature and fits to the project’s needs. It deals with the controlling mechanisms of the writing process, which are the same for the create/reuse/remix triad. The different types of controls considered are cen-tralized control, relay, independent, and shared. Control could be assumed by some roles and could change in different process phases.
Granularity: Refers to the amount of information on a content topic. More information inside some piece of content leads to more coarse granular elements, while a little amount of information encapsulated by content elements brings more reusable, fine granular ob-jects, whilst they tend to be less context-aware. This dimension is extremely important in the domain of open books.
Writing groups: This sixth dimension recognizes the way people are organized, or or-ganize themselves, to collaboratively produce content. The organization for this dimen-sion proposed here adapts a previously presented organization scheme, adjusting it to the needs of the present project.
Processes Dimension More than just a simple aggregate of rich media content, book production involves a wider spec-trum of processes, from group-related activities (group formation, task and roles assignation), to publishing and accreditation, as well as the creative processes themselves. Allowing the creation and management of separated, fine-granular pieces of context, the main process proposed by LATIn ecosystem is undoubtedly book-driven. Thus, all content-related activities are also en-closed in book-related ones. Figure 4 shows this dimension.
233

Digital Ecosystem for the Collaborative Production of Open Textbooks
Figure 4: Process dimension
The so-called Book-driven activities include:
Group-related activities, including group formation strategies (by invitation, auto-invitation, open groups, and so on) and the assignment of tasks and roles (which could be auto-assigned or assigned by persons with coordinating roles). Roles, tasks, and the group itself could be changeable during the book production process.
Publishing, with the meaning of creating “frozen” versions of the books and dealing with its distribution.
Accreditation, referring to the process of certifying and approval of a version of the book. This process could be administered by a person or an organization, being done in a man-ual way, which means that each book version must be under a dedicate accreditation process, or (semi) automatic, when accreditations are given according to the author’s pro-file and previous accreditation.
As noted earlier, content-driven activities are enclosed in book-driven ones. They include:
Brainstorming: more than a group dynamics technique, brainstorming in the current con-text is a process that must be undertaken to explore the creativity of a person or a group.
Planning is one of the most important processes, since it is essential to decide characteris-tics of the content that will be covered, such as aspects, approach, information that are vi-tal for the purpose of the book.
234
Frango Silveira et al.
Research and finding content: once the planning process is done, the person (or group) involved in this task has to conduct a research on the content, taking into account what was previously decided.
Content producing could be realized in some different ways such as writing entirely new content based on the person's (or group's) previous knowledge and/or the research that was done, reusing some content that matches the objective of the book or remixing this content by adding information, or changing the structure in which the content was origi-nally created.
Content organization gives cohesion, in other words, organizes the different pieces of content produced for the book and puts it into an understandable form, since the content was collaboratively written by people with different writing styles.
Reviewing can be done from different perspectives and at different times: content re-views determine whether the content covers the objectives; technical reviews focus on the text, graphics and images; pedagogical reviews consider whether the content is structured in a sound pedagogical manner; language reviews check spelling and grammar.
Versioning refers to the process of “freezing” the content and organization of a book to release it. Professors will be able to establish their own book versions in order to use them in their syllabus, for instance.
Templating covers the creation, reusing, and remixing of interface templates for applying to individual content or the entire book. This process is related to a specific role, the Template Designer (see next section), and this task can be accomplished in two different ways: interface templating deals with aesthetic features of text and rich media presenta-tion; pedagogical templating refers to the ways the content is organized and exposed to readers. This last type of templating is extremely important to establishing good peda-gogical practices. Pedagogical practices generally can be shared among Latin American countries, whose pedagogical context already has some important similarities.
Roles Dimension In order to promote efficiency and allow people to take initiative in the core team, it is important to have clearly defined roles in a multi-skilled team. In this section, we propose a set of roles for collaborative writing. Some of them are taken from the production of traditional books and are adapted to this new context. Others are defined to include the different roles in the whole process, from group creation to accreditation, for book-driven and content driven activities. The roles re-quired to make a successful core team are shown in Figure 5 and include the following:
Content Producer: this role represents a person or a group that uses various methodolo-gies stemming from collaborative writing to create content about a specific topic.
Idea Generator: this person (or group of people) identifies the big picture of the project, leads the others towards the main objective, and keeps the momentum of the project mov-ing forward.
Reviewer: there are four major types of reviewer:
o Content Reviewer: this role is in charge of reviewing the content about a specific subject. This person (or group) must work closely with the Content Organizer, proposing the appropriate modifications.
235
Digital Ecosystem for the Collaborative Production of Open Textbooks
o Technical Reviewer: this role has the function of checking all the technical as-pects of the book or content, for example, checking the consistency of the links, revising the formulas, etc.
o Pedagogical Reviewer: this person ensures that the organization of the content (see below) will make sense from a pedagogical point of view, hence, works closely with the content organizer in order to identify missing contents or ele-ments that must be investigated more deeply.
o Language Reviewer: a native speaker has to review the book in order to ensure that its spelling, syntax, and grammar conform to the target language.
Organizer: having someone on the team who is a good organizer is very useful since things always arise that need to be done and for which details and planning are important. We consider two roles:
o Content Organizer: a person able to guide the creation of a book, who has clear insights into curriculum needs, while providing swift feedback on all aspects of the contents. Also, he/she proposes the table of contents and will define the col-laborative writing strategy for the group.
o Group Organizer: this role is vital in order to organize the team that works on the project. The person in charge of this role should be characterized by various competencies, including project management, relationship management, experi-ence within the field of collaboration, and basic knowledge regarding the topic of the book. Since managing the entire team can be very time consuming, we rec-ommend one full-time coordinator per book.
Template Designer: Again, we consider two roles:
o Interface: this designer develops and maintains the template of each book to make sure that the content produced by the various collaborators (content pro-ducers) match in terms of look-and-feel. This person also is responsible for de-signing and implementing any required improvements in a short period of time.
o Pedagogical: the pedagogical template designer offers a uniform way to fill the table of contents established by the content organizer and ensures that the content of the various chapters is organized according to a common structure that follows a pedagogical strategy.
Accreditator: This is a person or an organization that validates each book against a given level of quality assurance. In our context, the accreditator validates the quality of the book according to the content, technical, pedagogical, and language points of view. Ac-creditation includes a peer review process to guarantee that the books meet the needs of Latin American students and takes place after the work of the reviewers described above. Once the accreditation has been established, the books can be disseminated to the target audience.
Translator: when the native language of the content producer does not match with the language of the intended audience, the translator ensures appropriate translation of the content into the target language. After this process, the translation still has to be validated by the language reviewer. This role is crucial for the Latin American context, with its two major languages: Spanish (around 360 million native speakers in the region) and Portu-guese (circa 200 million native speakers in Brazil).
236
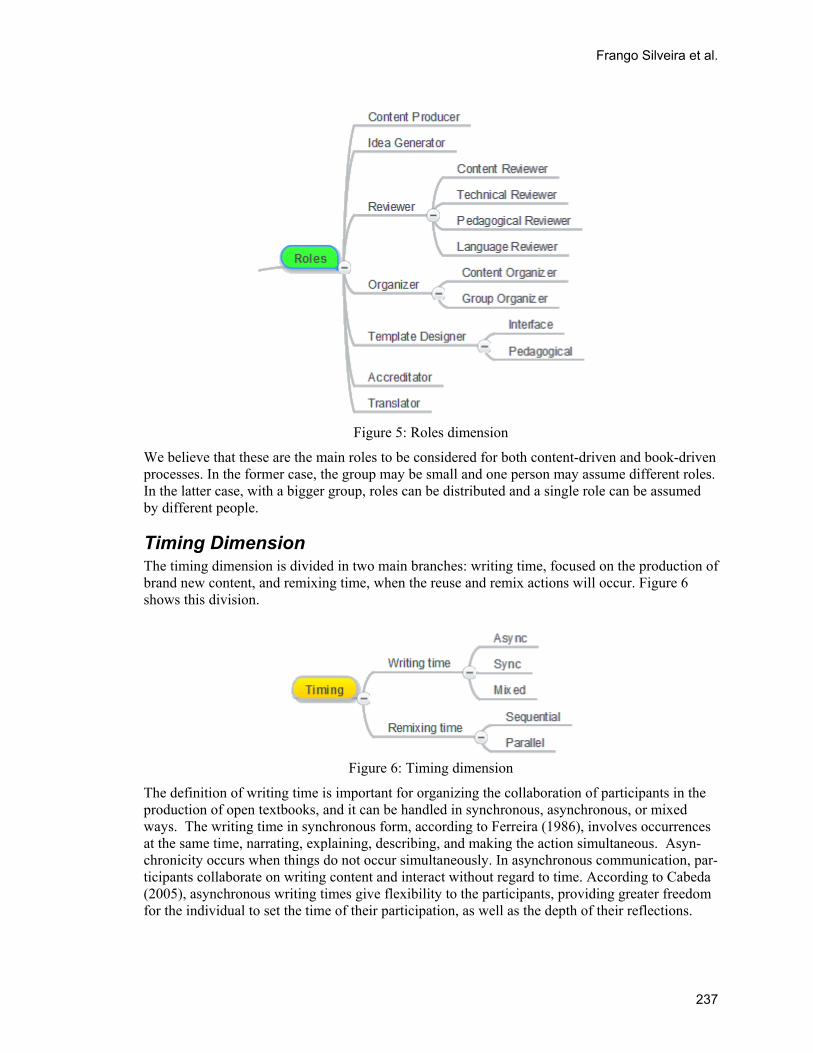
Frango Silveira et al.
Figure 5: Roles dimension
We believe that these are the main roles to be considered for both content-driven and book-driven processes. In the former case, the group may be small and one person may assume different roles. In the latter case, with a bigger group, roles can be distributed and a single role can be assumed by different people.
Timing Dimension The timing dimension is divided in two main branches: writing time, focused on the production of brand new content, and remixing time, when the reuse and remix actions will occur. Figure 6 shows this division.
Figure 6: Timing dimension
The definition of writing time is important for organizing the collaboration of participants in the production of open textbooks, and it can be handled in synchronous, asynchronous, or mixed ways. The writing time in synchronous form, according to Ferreira (1986), involves occurrences at the same time, narrating, explaining, describing, and making the action simultaneous. Asyn-chronicity occurs when things do not occur simultaneously. In asynchronous communication, par-ticipants collaborate on writing content and interact without regard to time. According to Cabeda (2005), asynchronous writing times give flexibility to the participants, providing greater freedom for the individual to set the time of their participation, as well as the depth of their reflections.
237
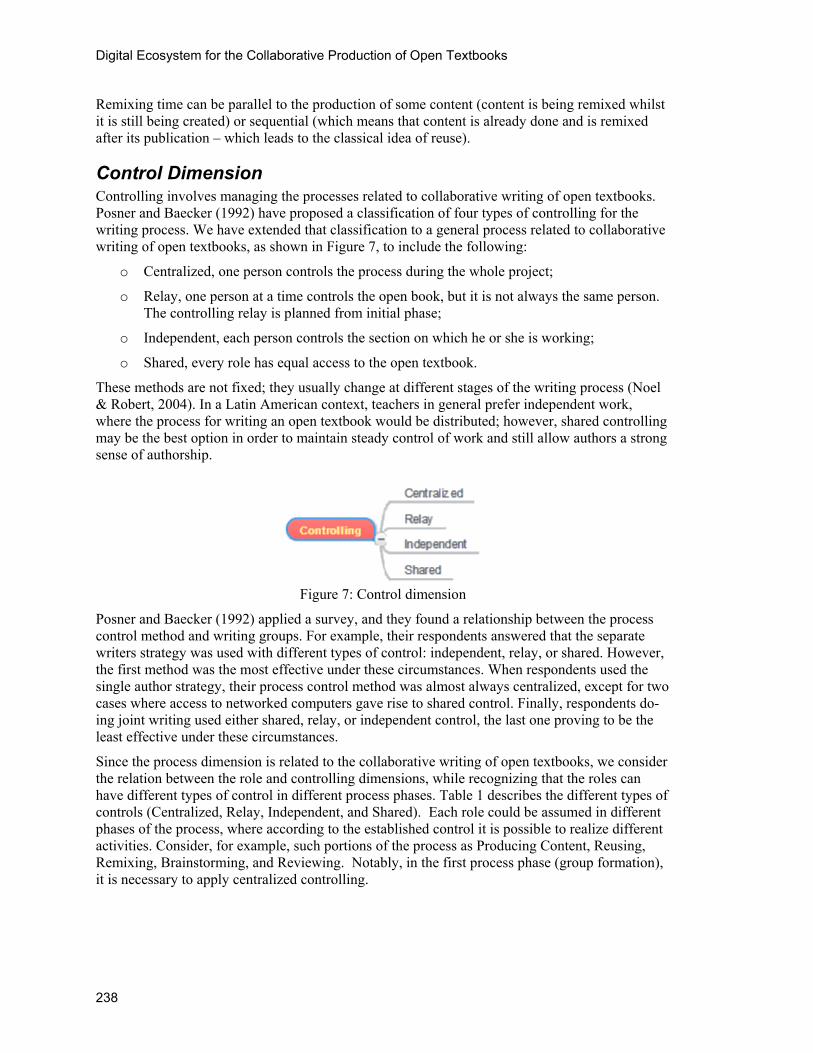
Digital Ecosystem for the Collaborative Production of Open Textbooks
Remixing time can be parallel to the production of some content (content is being remixed whilst it is still being created) or sequential (which means that content is already done and is remixed after its publication – which leads to the classical idea of reuse).
Control Dimension Controlling involves managing the processes related to collaborative writing of open textbooks. Posner and Baecker (1992) have proposed a classification of four types of controlling for the writing process. We have extended that classification to a general process related to collaborative writing of open textbooks, as shown in Figure 7, to include the following:
o Centralized, one person controls the process during the whole project;
o Relay, one person at a time controls the open book, but it is not always the same person. The controlling relay is planned from initial phase;
o Independent, each person controls the section on which he or she is working;
o Shared, every role has equal access to the open textbook.
These methods are not fixed; they usually change at different stages of the writing process (Noel & Robert, 2004). In a Latin American context, teachers in general prefer independent work, where the process for writing an open textbook would be distributed; however, shared controlling may be the best option in order to maintain steady control of work and still allow authors a strong sense of authorship.
Figure 7: Control dimension
Posner and Baecker (1992) applied a survey, and they found a relationship between the process control method and writing groups. For example, their respondents answered that the separate writers strategy was used with different types of control: independent, relay, or shared. However, the first method was the most effective under these circumstances. When respondents used the single author strategy, their process control method was almost always centralized, except for two cases where access to networked computers gave rise to shared control. Finally, respondents do-ing joint writing used either shared, relay, or independent control, the last one proving to be the least effective under these circumstances.
Since the process dimension is related to the collaborative writing of open textbooks, we consider the relation between the role and controlling dimensions, while recognizing that the roles can have different types of control in different process phases. Table 1 describes the different types of controls (Centralized, Relay, Independent, and Shared). Each role could be assumed in different phases of the process, where according to the established control it is possible to realize different activities. Consider, for example, such portions of the process as Producing Content, Reusing, Remixing, Brainstorming, and Reviewing. Notably, in the first process phase (group formation), it is necessary to apply centralized controlling.
238

Frango Silveira et al.
Table 1: The Relationships between Roles, Control and Processes
Role / Control-ling
Centralized Relay Independent Shared
Content Pro-ducer
CRAContent/ Producing ,reusing & remixing
CRA/Researchin & gFinding Content; CRA/Content Producing, reusing & remixing
CRA/Researching & Finding Content; CRA/Content Producing, reusing & remixing
GRA/Grou pFormation; CRA/Brainstorming;CRA/Researching & Finding Content; CRA/Content Producing, reusing & remixing
Idea Generator GRA/Grou pFormation
CRA/Brainstorming; CRA/Researc bins & Finding Content
CRA/Brainstorming; CRA/Researching & Finding Content
CRA/Brainstorming;CRA/Researching & Finding Content
Reviewer
Content CRA/Reviewing/ Content
CRA/Reviewing/ Content
CRA/Reviewing/ Content
CRA/Reviewing/ Content; CRA/Releasing a version
Technical CRA/Revi wing/ eTechnical
CRA/Reviewing/ Technical
CRA/Revi wing/ eTechnical
CRA/Reviewing/ Technical; CRA/Releasing a version
Pedagogical CRA/Review ng/ iPedagogical
CRA/Review ng/ iPedagogical
CRA/Review ng/ iPedagogical
CRA/Reviewi g/ nPedagogical; CRA/Releasing a version
Language
CRA/Reviewing/ Lan-guage
CRA/Revi wing/ eLanguage
CRA/Revi wing/ eLanguage
CRA/Revie ing/ wLanguage; CRA/Releasing a version
Organizer
Content CRA/Conten torganization; CRA/Researching & Findin gContent; CRA/Releasing a version
CRA/Releasing a version
Group GRA/Grou pFormation ;GRA/Task assignments and changes; GRA/Role assigments and
Template De-signer
Interface CRA/Templating CRA/Templating CRA/Teinplating CRA/Templating
239
Digital Ecosystem for the Collaborative Production of Open Textbooks
Centralized Relay Independent Shared Role / Control-ling
Pedagogical CRA/Templating CRA/Templating CRA/Templating CRA/Templating
Accreditator Accreditation Accreditation Accreditation
Translator CRA/Translating CRA/Translating CRA/Translating CRA/Translating
CRA= Content-Related Activities, GRA = Group-Related Activities
Granularity According to the Webster’s Dictionary’s etymology of the term granularity, “granule” comes from Late Latin granulum, diminutive of Latin granum (grain): a small particle, especially one of numerous particles forming a larger unit. Discussions about granularity arose when first dealing with Learning Objects (LO). LO granularity would refer to the degree of detail or precision con-tained in a LO, as well as its size, decomposability, and potential for reuse (Silveira et al, 2007). This dimension is considered in the scope of this project, as shown in Figure 8:
Figure 8. Granularity Dimension
Metadata standards consider different levels of granularity, called Aggregation Level. This term is used in IEEE Learning Object Metadata (IEEE-Standards Association, 2002) to describe “the functional granularity” of a learning object, classifying it in a four-stepped scale for aggregation level:
1. The smallest level of aggregation, e.g. raw media data or fragments.
2. A collection of level 1 learning objects, e.g. a lesson.
3. A collection of level 2 learning objects, e.g. a course.
4. The largest level of granularity, e.g. a set of courses that lead to a certificate
CISCO (Cisco Systems, 2003) identifies Reusable Learning Objects (RLOs) and Reusable Infor-mation Objects (RIOs). In its strategy, a RLO consist of an overview, a set of RIOs, a summary, or a practice. This view maps the terms “lesson” for a RLO and “topic” for a RIO (however, in the RLO’s definition it says that many RLOs can be combined to form a lesson). A RIO is classi-fied based on instructional purpose: concept, fact, process, principle, or procedure. Alternatively, Learnativity’s Content Ecosystem is a hierarchy of Educational Objects, in which the Learning Objects are one specific type of Educational Objects. This hierarchy suggests four types of Edu-cational Objects: Content Assets, Information Objects, Learning Objects, and Learning Compo-nents. A Content Asset can be any digital resource. With a little more context, an Information Object can be composed of several Content Assets, but its distinctive feature is that it must have an Instructional Type (e.g., exercise, example, simulation, or question). A Learning Object, in turn, may be composed of several Information Objects, but will only be a Learning Object if it has one Educational Objective. An Educational Objective consists of two parts: a verb and a noun (e.g., “motivate concerning the need for referential integrity”, “understand the X algorithm”, “measure the skills in conceptual modeling”). A Learning Component has several Learning Ob-
240
Frango Silveira et al.
jects, but its distinctive feature is that it follows an Instructional Strategy and has more than one Educational Objective. Thus, the main distinction between Educational Objects is not the aggre-gation level, nor the size in bytes, nor the duration; it is semantics. Semantics from an instruc-tional point of view could be something like “1) Review for previous knowledge, 2) Motivate, 3) Understand, 4) Practice, and 5) Evaluate”.
Following these considerations, we observe that the method to Content Generation in a textbook must be guided by the following point: Objects must be aggregated with an "instructional sense", which imposes restrictions on the way to generate content. In this sense, regarding the main con-text, which deals with open textbooks as the focus point of this methodology, the diverse levels of granularity proposed by Learnativity’s Content Ecosystem could be, at the same time, resumed and expanded in order to support a theoretically infinite number of granularity levels, as well as to change the focus from the Learning Objects / Open Educational resources point of view to a more book-oriented, versioning-driven one. Figure 9 shows a UML Class Diagram that briefly presents this idea.
Figure 9. UML Class Diagram of LATIn supporting structure for open textbooks with heterogeneously-granular content
As seen in the diagram, metadata is an important part of any content. These metadata (which are meant to be distinct for contents and the books themselves) will be useful to manage adaptation to the different contexts of the Latin American Region.
Writing Groups Writing groups are the different ways in which the members of the group cooperate together in the writing process. These three approaches are seen in Figure 10.
A more detailed description is added below.
o Single writer: In this strategy, one person writes and the rest play other roles in the group. There is only one content producer.
o Separate writers: In this strategy, the document is divided into parts and different indi-viduals write the various parts. Here we have several content producers.
o Joint writing: In this strategy, several group members compose the text together, either synchronously or asynchronously. Even minute components of the text are decided by a group effort.
241
Digital Ecosystem for the Collaborative Production of Open Textbooks
Figure 10. Writing groups Dimension
For our ecosystem of collaborative production, the three strategies are valid. Even in single writer, collaboration is incorporated. In a study by Posner and Baecker (1992), the single writer strategy was very popular. When used, a hierarchical difference among participants of the writing process was observed. A lower status member played the content producer role, while the higher status member would play the role of idea generator. The single writer role was also assigned to the individual most familiar with the required format or the structure of the final document. Some groups of the study use the single writer in order to have a uniformly written document. As men-tioned before, the writing strategy is closely related with the process control. Use of the single writer strategy usually implies the use of centralized process control method. According to the same study, the separate writers strategy is also very popular in joint projects. By partitioning the document, the group can work in parallel, thereby speeding up the writing process. The study re-vealed time pressure was responsible for the use of the separate writers approach. Following the separate work, in most cases there still remains the need to unite the resulting segments in order to create a uniform style. That is why writing strategy is closely related with the different stages of writing process. Joint writing can have different effects on group cohesion and it depends on the maturity of the working group. An experienced group is able to work together more smoothly than a new group. Another important aspect leading to the success of the joint writing strategy is the document control method that is used with it. The respondents in the study used either shared, relay or independent control, the last proving to be the least successful combination.
Conclusions This conceptual work describes and systematizes a methodology that consists of a digital ecosys-tem for the collaborative production of open textbooks. This approach has the potential to solve standing methodological problems with current initiatives such as Wikibooks and Connexions. The conceptualization of the collaborative environment as a digital ecosystem provides a fruitful analogy for the sharing and reusing of content by different book-creating and content-creating groups. It also promotes the idea of book production as a non-ending endeavor. This concept could result in higher quality and updated textbooks.
Group organization and productivity may be facilitated by providing content produced through collaboration models. This work presents six methodological dimensions. These dimensions, when combined, provide a flexible framework. Each writing group can select the combination of methodological dimensions that best fits their context.
In order for this suggested methodology to be tested, it needs to be fleshed out in a technological platform. This platform is planned to be built by the LATIn project for the collaborative creation of open textbooks in the Latin American region. To validate the efficacy of the proposed meth-odology framework, the platform and the implementation strategies, 144 Open textbooks will be collaboratively created by professors from each of the nine partner institutions. 16 books about different topics will be used by each one of the Latin American partners of the LATIn project. This pilot will be conducted to evaluate the proposed collaborative methodology for the creation of books.
The final test for this initiative will be its deployment in higher educational institutions. This adoption will be supported by a strategy that promotes the digital ecosystem and its benefits for institutions, professors, teachers, content producers, and students.
242
Frango Silveira et al.
Acknowledgements The authors acknowledge for the support by the European Union through project Alfa III: DCI-ALA/19.09.01/11/21526/279-155/ALFA III (2011)-52.
References Baecker, R. M., Grudin, J., Buxton, W. A. S., & Greenberg, S. (1995). Readings in human-computer inte
action: Towards the year 2000 (2nd ed.). San Francisco, Cr-
alifornia: Morgan Kaufmann Publishers.
Baker, J., Thierstein, J., Fletcher, K., Kaur 9). Open textbook proof-of-concept via Connexions. Connexions, USA. Intern rch i
, M., & Emmons, J. (200ational Review of Resea n Open and Distance Learning,
10(5). Retrieved from http://www.irrodl.org/index.php/irrodl/article/viewArticle/633
& Chang, E. (2007). Digital ecosystems: Principles and semantics. IEEE International ConferBoley, H., -
Brisof Network, In-
Cabeda nica -f
2005. Educação à Distância e a Inte-
ence on Digital Ecosystems and Technologies. Cairns, Australia. February 2007. NRC 48813.
coe, G., & De Wilde, P. (2006). Digital ecosystems: Evolving service-orientated architectures. Pro-ceedings of BIONETICS '06 the 1st International Conference on Bio Inspired Models formation and Computing Systems. ACM New York, NY, USA.
, M. (2005). O chat-fórum: uma idéia de uso híbrido, síncrono e assíncrono, através de uma úferramenta normalmente assíncrona, o fórum virtual [The chat-forum: An idea to use hybrid, synchronous and asynchronous, through a single tool usually asynchronous, the virtual forum]. Proceedings oCongresso Internacional de Educação à Distância, 12, 18-22 set.gração das Américas. Retrieved Nov 5th 2012 from http://www.abed.org.br/congresso2005/por/pdf/121tcc3.pdf
o Systems. (2003). Reusable learning object strategy: Designing and developing learning objects for multiple learning approaches. Retrieved April 5, 2011 from
Cischttp://www.e-
novalia.com/materiales/RLOW__07_03.pdf
g, E., & West, M. (Chan
Dhol . What makes an open education program sustainable?
2006). Digital ecosystems: A next generation of the collaborative environment. Proceedings of the Eighth International Conference on Information Integration and Web-based Appli-cations & Services. December 2006, Yogyakarta Indonesia.
akia, U. M., King J. W., & Baraniuk R. (2006)The case of Connexions. Organisation for Economic Co-operation and Development. Retrieved from http://www.oecd.org/dataoecd/3/6/36781781.pdf
eira, A. B. H. (1986). Novo dicionário da língua PortFerr
Frith Center.
sstextbooks.org
uguesa [New dictionary of the Portuguese lan-guage] (2nd ed.). Rio de Janeiro: Nova Fronteira.
, J. (2009). The open revolution: An environmental scan of the open textbook landscape. Raleigh, NC: NCSU Libraries Digital Scholarship & Publishing
Henderson, S. (Project Director), & Nelson, D. (Project Manager). (2011). The promise of open access text-books: A model for success. Available from http://www.openacce
extbook. University of Michigan: American
Horn in hindsight!). Free
Hohne, D., Fu, L., Barkel, B., & Woolf, P. (2007) AC 2007-2074: The Wiki approach to teaching: Using student collaboration to create an up-to-date open-source tSociety for Engineering Education.
er, M., & Blyth, S. (2008). How to collaboratively develop open-source textbooks (High School Science Texts. Available from www.fhsst.org
e, J. (2006). The rise of crowdsourcing. Wired, 14(6). Retrieved from http://www.wired.com/wired
How/archive/14.06/crowds.html
IEEE-Standards Association. (2002). Draft standard for learning object metadata. Retrieved from http://ltsc.ieee.org/wg12/20020612-Final-LOM-Draft.html
243
Digital Ecosystem for the Collaborative Production of Open Textbooks
Noel, S., & Robert, J. (2004). Empirical study on collaborative writing: What do co-authors do, uselike? Computer Supported Cooperative Work, 13, 63–89.
, and
he ociety (i-Society), pp.398-403, 27-29 June
Patemodel. Applied Ergonomics, 43(1), 1–26. doi:10.1016/j.apergo.2011.04.009
Human Behavior, 24(5), 1913-1928.
ohang & K. Har-ing
Biographies Ismar Fran is PhD in Electrical Engineering at the Univers , his MSc. degree in Computer Sci-
Ochoa, X.; Silva-Sprock, A.; & Silveira, I. F. (2011). Collaborative open textbooks for Latin America - TLATIn project. International Conference on Information S2011
l, H., Pettitt, M., & Wilson, J. R. (2012). Factors of collaborative working: A framework for a collabo-ration
Posner, I., & Baecker, R. (1992). How people write together. Proceedings of the 25th Hawaii International Conference on System Sciences, IV, 127-137.
Ravid, G., Kalman, Y. M., & Rafaeli, S. (2008). Wikibooks in higher education: Empowerment through online distributed collaboration. Computers in
Silveira, I. F., de Araújo, C. F., Amaral, L. H., de Oliveria, I. C. A., Schimiguel, J., Ledón, M. F-P., & Ferreira, M. A. G. V. (2007) Granularity and reusability of learning objects. In A. Koman (Eds.). Learning objects and instructional design (pp. 139-170). Santa Rosa, CA, USA: InformScience Institute.
go Silveira received hity of São Paulo (USP)
ences at Technological Institute of Aeronautics (ITA), and his BSc. inMathematics at Federal University of Juiz de For a (UFJF), all in Bra-zil. Nowadays he is a Professor at Mackenzie Presbyterian University and Cruzeiro do Sul University, both in São Paulo, Brazil, teaching in CS and Digital Games undergraduate courses and MSc. and PhD. pro-grams on Math & Sciences Teaching and Electrical Engineering. Cur-rently, he is the national coordinator of Computers in Education Co-mission of Brazilian Computer Society (SBC). Email: [email protected]
Xavier Ochoa is a Principal Professor a
t the Faculty of Electrical and Computer Engineering at Escuela Superior Politécnica del Litoral
(ESPOL) in Guayaquil, Ecuador. He coordinates the research group onTeaching and Learning Technologies at the Information Technology Center (CTI) at ESPOL. He is also involved in the coordination of the Latin American Community on Learning Objects (LACLO), the ARIADNE Foundation, and several regional projects. His main re-search interests revolve around Learning Technologies, Learning Ana-lytics and Infometrics. Email: [email protected]
244
Frango Silveira et al.
Alex J. Cuadros-Vargas received the degree of PhD. [2002-2006] and Master [2000-2001] in Mathematics and Computer Science at the Uni-versity of Sao Paulo, Brazil. He conducted a Post-Doctoral program [2007-2008], researching mesh generation from images, also at the University of Sao Paulo. Alex was a visiting scholar [February-March 2009] in Department of Radiology, University of Pennsylvania (UPENN), USA. He was also a visiting professor [in December 2009, February-2010] in Scientific Computing and Imaging Institute (SCI) at Utah State University, USA. He is a research professor at San Pablo Catholic University in Arequipa, Peru [from February 2009] and coor-
dinator of the Center for Research in Computer Science [since March 2013]. Alex is a founding member of the Peruvian Society of Computing (SPC). Email: [email protected]
Alén Humberto Pérez Casas received his Master degree in Sociology in 2004 at UdelaR – Universidad de la República, Uruguay, the same place where he completed his undergraduate course in 1992. Currently, he is a PhD student in the same area and university, where he also works as coordinator of the Department of IT applied to Education, being responsible for all learning platforms of such University. Email: [email protected]
Ana Casali received her PhD and her Master degree in Information Technologies at the University of Girona, Spain, and she obtained her degree in Mathematics at the Universidad Nacional de Rosario (UNR), Argentina. She is Head of the Computer Science Department since 2007 and Professor at the Facultad de Ciencias Exactas, Ingeniería y Agrimensura, UNR since 1991. Also, she is researcher in the Centro Internacional Franco Argentino de Ciencias de la Información y de Sistemas (CIFASIS). She has worked in several international coopera-tion research projects and her research interest includes agent architec-tures, knowledge representation, approximate reasoning, and recom-
mender systems and its applications to education. She also is author of many research articles mainly in the field of Artificial Intelligence and its applications. Email: [email protected]
André Ortega is a Computer Engineer and holds a Master degree in Information Technologies from the Polytechnic University of Madrid. She is currently working as project leader in the research group on Teaching and Learning Technologies at the Information Technology Center (CTI) at ESPOL. Her main research interests revolve around Information Security, High Performance Computing, and Learning Technologies. Email: [email protected]
245
Digital Ecosystem for the Collaborative Production of Open Textbooks
Antonio Silva Sprock is a PhD student of Computer Science of the Universidad Central de Venezuela and MSc in Knowledge Engineering from the Polytechnic University of Madrid. He is also a professor and researcher at the School of Computer in Science Faculty in the Univer-sidad Central de Venezuela. From 2010-2012 he was coordinator of the Latin American Community of Learning Objects (LACLO) in the RedCLARA. Since 2012, he coordinates locally the LATIn project (Latin American Open Textbook Initiative), ALFA III project, funded by the European Union. His research areas include DataBase, Informa-tion System, and Learning Objects. He is author of many research pub-
lications in conferences and journals. Email: [email protected]
Carlos Henrique Alves Silva is an English teacher, a Computer Pro-gramming Technician, and an undergraduate student attending the Computer Information Systems course at Mackenzie Presbyterian Uni-versity in São Paulo, Brazil. Currently, he is enrolled in an interchange undergraduate program at Goldsmiths, University of London. Email: [email protected]
Cesar Alberto Collazos Ordoñez is a Full Professor at University of Cauca-Colombia. PhD in Computer Science, his research areas include HCI, CSCL, and CSCW. He is the author of many research publica-tions in conferences and journals. Email: [email protected]
Claudia Deco is Doctor in Engineering, Universidad Nacional de Rosario, and she has a Master Degree in Computer Science, Universi-dad de la República, Montevideo, Uruguay. She obtained her degree in Mathematics at the Universidad Nacional de Rosario. She is also a pro-fessor and researcher at the Research Department, Facultad de Química e Ingeniería, Rosario, Universidad Católica Argentina. Furthermore, she coordinates the Research Group of Databases at the Facultad de Ingeniería, Universidad Nacional de Rosario. Her research interest in-cludes Databases Technologies and Information Retrieval. She partici-pates in scientific events as a member of the conference program
committee and as a reviewer of some papers and journals. She also is author of many research articles, mainly in this area. Email: [email protected]
246
Frango Silveira et al.
Ernesto Cuadros-Vargas earned his PhD degree in Computer Sci-ence, University of Sao Paulo 2004 in joint projects with Carnegie Mellon University 2001 and the Technische Universitat Berlin in Ger-many. Currently he is Executive Secretary of the Latin American Studies in Informatics (CLEI), being the unique Latin American member othe world team IEEE / ACM that proposes regulations for Compucourses (CS2013). He also is Dean of the Faculty of Engineering and Computing of San Pablo Catholic University at Arequipa, Peru. He was President of the Peruvian Society of Computing (SPC) from 2001-2008 and 2010. Email:
-f
ter
Everton Knihs is a PhD student in Electrical Engineering at Universi-dade Prebisteriana Mackenzie, Brazil and also has Law studies at Faculdades Metropolitanas Unidas. He has a Master degree in Mathe-matics Teaching, earned at Cruzeiro do Sul University, in Brazil. Email: [email protected]
Gonzalo Parra is a researcher at the Human-Computer Interaction group from the Computer Science department of the Katholieke Uni-versiteit Leuven, Belgium. His research interests include metadata gen-eration and manipulation, flexible access to information based on open standards, mobile technologies, user experience and personalization. Parra has been involved in different EU projects, such as: MACE, AS-PECT, ICOPER and STELLAR. Email: [email protected]
Jaime Muñoz-Arteaga is a professor at the Universidad Autónoma de Aguascalientes in Aguascalientes México. He holds a Ph.D. in Com-puter Science at the University Toulouse 1, Toulouse, France. He has reported his work in several journals, books, and conference papers. His current research interests include topics such as Human-Computer Interaction, e-learning, and Software Engineering. Email: [email protected]
247

Digital Ecosystem for the Collaborative Production of Open Textbooks
Jessica Gomes dos Santos is a Computer Programming Technician and an undergraduate student attending the Computer Information Sys-tems course at Mackenzie Presbyterian University in São Paulo, Brazil. Currently, she is enrolled in an interchange undergraduate program at Brunel University, in United Kingdom. Email: [email protected]
Julien Broisin is an Assistant Professor at the Toulouse University, France. He leads his research activities at the Computer Science Re-search Institute of Toulouse (http://www.irit.fr), and is particularly in-terested in the design and management of personalized and adaptive web-based learning environments. Email: [email protected]
Nizam Omar holds the degrees of BSc in Mechanical Engineering (1974) and MSc in Applied Mathematics (1979), both at the Techno-logical Institute of Aeronautics – ITA and Ph.D. in Computer Science at Pontifical Catholic University of Rio de Janeiro (1989). Professor of ITA (retired), he is currently Professor at the University Mackenzie. He has experience in the area of Computer Science, with an emphasis on Computer Theory, Artificial Intelligence, Formal Languages, anAutomata, acting on the following topics: intelligent tutors, adaptive didactics, expert systems, neural networks and learning environments. Email:
d
Regina Motz received her PhD in Computer Science at University of Darmstadt, Germany, her MSc. degree in Computer Sciences at Fed-eral University of Pernambuco, Brazil, and her BSc. in Computergeneering at Universidad de la República, Uruguay. Nowadays, she is Full Professor at Universidad de la República, Uruguay, teaching in CS undergraduate courses and MSc. and PhD. programs on Computer Sci-ences. Email:
En-
248

Frango Silveira et al.
249
Virginia Rodés is Bachelor in Communication Sciences, University of the Republic, UdelaR, Uruguay. She is specializes in Virtual Learning Environments at OEI / Virtual Educa. She is currently is finishing her MSc in Education at University of the Republic, where she works as a Professor. She has worked as a university lecturer in different areas (Bachelor of Communication Studies, Faculty of Engineering, Faculty of Law, Faculty of Economics and Administration, Training Unit of UdelaR officials), being responsible for training and advising teachers in the pedagogical design of educational materials and communication courses, development of technology integration in teaching and incor-porating blended and distance education quality. She has also worked
in institutions and organizations related to environment, health and education, like IMM, MEF, and acted as a consultant for IDB, UNDP and UNESCO. She has authored papers and publica-tions in her areas of interest (education, technology-enhanced education, distance education, sci-ence, technology and society, and gender issues). Email: [email protected]
Yosly C. Hernandez Bieliuskas is a PhD Student in Education, Uni-versity of Los Andes (ULA), Venezuela; MSc and BSc in Computer Sciences, Central University of Venezuela (UCV), Venezuela. She is a senior Professor and Researcher, Distance Education Unit and Com-puter Sciences School, Central University of Venezuela. She currently teaches in Undergraduate and Graduate Programs, as well as Distance Teachers Formation Programs and Courses. She is an Active Re-searcher in B Cathegory, accredited in the Program of Research Stimu-lation from National Observatory of Science, Technology and Innova-tion of the Ministry of People's Power of Science, Technology and In-termediate Industries. Email: [email protected]

This page left blank intentionally
Journal of Information Technology Education: Research Volume 12, 2013
Cite as: Sorden. S. D., & Munene, I. I. (2013). Constructs related to community college student satisfaction in blended learning. Journal of Information Technology Education: Research, 12, 251-270. Retrieved from http://www.jite.org/documents/Vol12/JITEv12ResearchP251-270Sorden1206.pdf
Constructs Related to Community College Student Satisfaction in Blended Learning
Stephen D. Sorden Chinle Unified School District,
Chinle, Arizona, USA
Ishmael I. Munene Northern Arizona University,
Flagstaff, Arizona, USA
Executive Summary This paper discusses the constructs of social presence, collaborative learning, computer-supported collaborative learning, and satisfaction in blended learning environments. It presents the results of a study that used the Collaborative Learning, Social Presence, and Satisfaction (CLSS) question-naire, which was conducted on one campus in a multi-campus community college system. The CLSS questionnaire measured the amount of perceived collaborative learning, perceived social presence, and reported satisfaction in a blended course. The sample of participants was drawn from students enrolled in one or more blended courses on one campus in a multi-campus, com-munity-college system in the southwestern United States.
The study posed four questions, accompanied by four related hypotheses. Does perceived social presence in a blended, community-college course correlate with reported student satisfaction? Does perceived collaborative learning in a blended, community-college course correlate with re-ported student satisfaction? Does perceived social presence in a blended, community-college course correlate with perceived collaborative learning? How do age, gender, ethnicity, computer expertise, and number of distance courses previously taken correlate with perceived social pres-ence, perceived collaborative learning, and reported course satisfaction in a blended, community-college course?
The data analysis consisted mainly of a descriptive analysis and correlational analysis using the Pearson Product Moment Correlation Coefficient (Pearson’s r). In addition, a Mann Whitney U test was run separately on the nominal variables for Caucasian and Latino ethnicity, which found a significant, higher perception of social presence for the Latino participants. The descriptive analysis showed that the sample roughly mirrored the general population of the college. The cor-relational analysis resulted in the rejection of the first three null hypotheses, while the fourth was retained. The study found a moderate, positive relationship between social presence and student
satisfaction, and the constructs of per-ceived collaboration and student satis-faction appeared to be highly related. The study also confirmed that there ap-pears to be a link between rising levels of perceived collaboration and rising levels of perceived social presence. With the exception of a relationship be-tween Latinos and higher self-reported perceptions of social presence, the study did not find a significant correlation be-
Material published as part of this publication, either on-line or in print, is copyrighted by the Informing Science Institute. Permission to make digital or paper copy of part or all of these works for personal or classroom use is granted without fee provided that the copies are not made or distributed for profit or commercial advantage AND that copies 1) bear this notice in full and 2) give the full citation on the first page. It is per-missible to abstract these works so long as credit is given. To copy in all other cases or to republish or to post on a server or to redistribute to lists requires specific permission and payment of a fee. Contact [email protected] to request redistribution permission.
Editor: Thomas Connolly
Community College Student Satisfaction in Blended Learning
tween any of the demographic variables and the three constructs that were measured. While there is as yet no strong evidence, this may be the first study to suggest a higher relationship between Latinos/Hispanics and perceived social presence in blended learning.
One major conclusion that can be drawn from this study is to confirm that there does indeed ap-pear to be a strong link between the amount of social presence and collaborative activities that a student perceives in a blended course and that student’s self-reported satisfaction in the course. This study suggests that blended learning featuring collaboration and social presence can help institutions create better programs and support services that may lead to more effective learning environments. The authors conclude with a discussion of the result implications for education and blended learning, and they make recommendations for future research.
Keywords: collaboration, collaborative learning, social presence, student satisfaction, blended learning, hybrid course
Introduction In order to attract and retain students, institutions and educators must continue to look for innova-tive ways to meet evolving student learning needs. Blended learning may represent one such edu-cational innovation. Students in blended-learning environments have reported increased satisfac-tion with the blended model over either face-to-face or online learning environments, even though, according to Clusky, Hodges, and Smith (2006), learning effectiveness appears to be roughly equal. Albrecht (2006) also reports increased student satisfaction with blended learning. Means, Toyama, Murphy, Bakia, and Jones (2009) found that blended instruction was generally more effective when various forms of blended learning were compared with conventional face-to-face classes. After controlling for the instructor, exams, and number of students, Cluskey et al. (2006) found significantly improved student performance and course-pass rates after transitioning from a traditional face-to-face (f2f) course to a hybrid online accounting class. Martin and Trig-well (2005) have attributed this advantage to variation theory which explains the increase in learning as resulting from the blending of instructional approaches.
This study explored how the three constructs of social presence, collaborative learning, and stu-dent satisfaction correlate to each other in blended-learning environments. While the topics of social presence and collaborative learning have been studied in online education (Gunawardena & Zittle, 1997; So & Brush, 2008), little research has been done on how collaborative learning and social presence affect student satisfaction in a blended-learning environment, especially at the community-college level. If it can be demonstrated that there is a positive correlation in a blended course between collaborative-learning activities and social presence with student course satisfac-tion, then it would merit continuing to focus on approaches that strengthen these constructs in a blended, community-college environment.
Social Presence Social presence helps learners to project themselves online and feel a sense of community. Garri-son (2009) further suggested that social presence occurs when learners are able to identify with a community, communicate within that community, and develop relationships by projecting their personalities. Social presence has been well-documented as an important construct in online learning environments (Gunawardena, 1995; Gunawardena & Zittle, 1997; Liu, Gomez, Khan, & Yen, 2007; Richardson & Swan, 2003; Tu, 2002; Tu & McIsaac, 2002). Tu (1999) stated that so-cial presence is a significant factor in distance education and that it is one of the most important factors for social learning in computer-mediated environments. A general finding from this body of research is that when information is presented in a manner that increases the perception of so-cial presence, the learner becomes more engaged and retains the information better (Homer,
252

Sorden & Munene
Plass, & Blake, 2008; Richardson & Swan, 2003). Liu, Gomez, and Yen (2009) found that social presence is also a predictor of course retention and the final grade in online environments at community colleges, and they recommend two specific actions: early identification and effective intervention.
There is a strong correlation between social presence and student satisfaction (Gunawardena, 1995; Gunawardena & Zittle, 1997; Richardson & Swan, 2003). Both Rourke, Anderson, Garri-son, and Archer (2001) and Rovai (2002) stated that this correlation is important in the develop-ment of a community of learners. So and Brush (2008) found that student perception of social presence correlates to perception of collaborative learning and overall satisfaction. Weinel, Ban-nert, Zumbach, Malzahn, and Hoppe (2011) found that while social presence does not cause col-laboration, it can affect the attitude of participants towards collaborating on a particular task.
Other researchers have also found a connection between social presence and blended learning (Jusoff & Khodabandelou, 2009; Kang & Kang, 2008; So & Brush, 2008). Because a blended course may have both online and face-to-face activities, identifying the cause of social presence becomes a little more complicated. Does the social presence result from the face-to-face meet-ings, or does it develop because of interactive online activities?
Collaborative Learning Collaborative learning occurs when learners interact to construct common meaning and knowl-edge. The importance of learning through social interaction and collaboration has been confirmed repeatedly (Bandura, 1985; Roschelle, 1992; Tu & Corry, 2003; Wenger, 1999). Tu (2004) stated that it is an essential component for creating online learning communities.
Roschelle (1992) argued that the main point of collaboration is convergence, or the mutual crea-tion of understanding and knowledge. Jeong & Chi (2007) later confirmed Roschelle’s findings that knowledge convergence did occur during collaborative learning. Recently, researchers such as Jarvela and Jarvenoja (2011) are beginning to explore how individuals can direct their own learning within a social-learning environment while simultaneously affecting and being affected by that environment.
Several studies have linked increased satisfaction in an online course to increased collaboration (Ferguson & DeFelice, 2010). Jung, Choi, Lim, and Leem (2002) found that students who re-ported a high level of collaboration with others in the course also expressed a higher level of sat-isfaction than those who engaged solely in task-oriented interaction with the instructor. Num-menmaa and Nummenmaa (2008) found that those who interacted collaboratively had a more positive reaction to a course.
Computer-Supported Collaborative Learning While collaborative learning should be a strong component of both online and face-to-face envi-ronments, computer-supported collaborative learning (CSLC) has emerged as a separate field of research (Resta & Laferriere, 2007). CSLC is concerned with how we interactively learn together using computer-mediated communication (Stahl, Koschmann, & Suthers, 2006), and it is charac-terized by the sharing and construction of knowledge among participants using synchronous or asynchronous communication as their primary means of communication. CSCL research adds a rich dimension of understanding and effective practices to blended learning.
As technology becomes more user-friendly, the division between face-to-face and online envi-ronments will likely fade, and the technology will cease to be the demarcation in blended learning (Osguthorpe & Graham, 2003). Dommel (2005) introduced a concept known as ambient collabo-ration where computer technology is no longer central to online collaboration. Instead, the tech-
253
Community College Student Satisfaction in Blended Learning
nology sits unobtrusively in the background, allowing users to synergistically move between face-to-face and virtual workspaces, concentrating on presence and collaboration rather than on tools or the technology. As our understanding of blended theory develops, the idea of blending may be more about collaborative learning and individual reflection than a blending of technology or location (Garrison & Vaughan, 2007).
Satisfaction in Blended-Learning Environments A major goal of a learning-centered strategy should be student satisfaction with the learning ex-perience. If students feel that they have learned the material—that they have a deep understanding of it—and that the learning experience was positive, then they will have a strong sense of satis-faction at the end of the course (Martin & Reigeluth, 1999). Satisfaction is an affective construct that is often considered to be a predictor of learning outcomes (LaPointe & Gunawardena, 2004). Stein (2004) found that satisfaction is determined by the degree of structure in the course. Ele-ments that defined structure include clearly defined objectives, assignments, and deadlines.
Richardson and Swan (2003) studied learners’ perceived social presence and its relationship to perceived learning and satisfaction with instructors. They found that all the variables correlated and that social presence was a good predictor of student satisfaction. Beyond being important from the learner’s perspective, student satisfaction is important to the institution because it has been shown to be an important factor in student retention (Liu et al., 2007; Liu et al., 2009).
Research Questions and Hypotheses This study examined the relationships between perceived collaborative learning and social pres-ence with student satisfaction in blended courses on one campus in a community-college system. The following research questions and hypotheses were posed:
1. Question 1: Does perceived social presence in a blended, community-college course cor-relate with reported student satisfaction?
Hypothesis 1 (H1): There will be no significant correlation between the constructs of per-ceived social presence and reported course satisfaction as measured by the Collaborative Learning, Social Presence, and Satisfaction (CLSS) Questionnaire in a blended course at one community college campus.
2. Question 2: Does perceived collaborative learning in a blended, community-college course correlate with reported student satisfaction?
Hypothesis 2 (H2): There will be no significant correlation between the constructs of per-ceived collaborative learning and reported course satisfaction as measured by the Col-laborative Learning, Social Presence, and Satisfaction (CLSS) Questionnaire in a blended course at one community college campus.
3. Question 3: Does perceived social presence in a blended, community-college course cor-relate with perceived collaborative learning?
Hypothesis 3 (H3): There will be no significant correlation between the constructs of per-ceived social presence and perceived collaborative learning as measured by the Collabo-rative Learning, Social Presence, and Satisfaction (CLSS) Questionnaire in a blended course at one community college campus.
4. Question 4: How do age, gender, ethnicity, computer expertise, and number of distance courses previously taken correlate with perceived social presence, perceived collaborative learning, and reported course satisfaction in a blended, community-college course?
254
Sorden & Munene
Hypothesis 4 (H4): There will be no significant correlation between student demographic data (gender, age, ethnicity, computer expertise, and number of distance courses previ-ously taken) and the constructs of perceived social presence, perceived collaborative learning, and reported course satisfaction as measured by the Collaborative Learning, So-cial Presence, and Satisfaction (CLSS) Questionnaire at one community college campus.
Study Design This study used a quantitative correlational design that allowed for the analysis of student demo-graphic data and the relationships between the two independent variables (social presence and collaboration) and a dependent variable (student satisfaction) in a blended course. This design was selected because of its robustness in the analysis of several variables in a single study as well as its ability to determine the strength of any significant relationships between the variables.
Population and Sample The sample of participants was drawn from students enrolled in one or more blended courses on one campus in a multi-campus, community-college system in the southwestern United States. Students in the sample were not randomly selected; rather, they were part of a canvass sample in the spring of 2011 that invited all blended classes at one campus to participate in the study. Most courses at this campus were not blended, but 12 blended courses were identified. Of these 12, one course was treated as a pilot course. The researchers received permission to access the remaining 11 courses for approximately 30 minutes to request voluntary participation, and all blended courses were included in the study.
Ultimately, a sample size of 108 participants was achieved, which yielded a confidence interval of 6.95 with a confidence level of 95%. The response rates ranged from a low of 33% to 100%, with an overall average of 77%, or 108 students out of a possible 140. The sample consisted of 71% Caucasian and 15% Latino, with exactly half of the participants being 25 years old or younger, and half being 26 years old or older.
Instrumentation/Sources of Information The instrument used in this study, the Collaborative Learning, Social Presence, and Satisfaction (CLSS) Questionnaire, measures perceived collaboration, social presence, and satisfaction (So & Brush, 2008). The questionnaire has four sections: demographics, satisfaction, collaborative learning, and social presence. As addressed by So and Brush (2008, p. 324), the validity of the instrument was tested by using an exploratory factor analysis.
A small pilot group of five students in one course answered the questionnaire before it was ad-ministered to students in the other eleven blended courses. As a result of this pilot, one ambigu-ous question was slightly altered for clarity. In addition, a committee of experts, consisting of three colleagues, was consulted to determine if any ambiguous questions or other issues existed with the questionnaire. Other than the one question that had to be slightly rewritten as a result of the pilot, no questions were determined to be ambiguous, and none were removed from the origi-nal questionnaire developed by So and Brush (2008).
Data Analysis Data analysis took place in four steps: data screening, tests for normality, descriptive statistics of the sample, and a correlational analysis. After reviewing each of the 108 questionnaires by hand, six questionnaires were discarded because they were assessed to not have honest response pat-terns. Three more questionnaires were discarded for not being complete and having excessive missing data.
255
Community College Student Satisfaction in Blended Learning
The mean was calculated for each section in each record and saved as satisfaction, collaboration, and social presence. The z scores were calculated on each of those means; we looked for z-scores beyond plus or minus 3.29. After reviewing the z scores, one additional questionnaire was elimi-nated because it had an unacceptably low z score (-3.57) in the social-presence section. The data-screening process left a final total of 98 questionnaires (from the original 108) for subsequent data analysis.
Before looking at the descriptive statistics of the demographic variables, a descriptive analysis for normality was performed on the section mean scores. Tests included an analysis for skewness and kurtosis, the Kolmogorov-Smirnov goodness-of-fit test, the Shapiro-Wilk test for normality with the standard alpha of .05, and a visual inspection of Q-Q plots to provide adequate evidence that the distributions approximated normality. Based on this analysis and the calculated indicators of normality, we determined that the variables sufficiently approximated normality and that we could continue with an analysis of the descriptive statistics for the demographic variables as well as with the correlational analysis.
Around 62 % (61) of the respondents were female while about 38 % (37) were male. This sug-gests that the students taking blended courses did not differ in makeup from the general popula-tion of the college as reported in the latest statistics provided by the college’s department for planning and institutional research. In other words, the gender of the participants reflected the overall campus population.
Two interesting characteristics surfaced from the statistic on age. One was the large number of older students (45 years old or older) who were taking a blended course (16% or 16 participants), and the second was that the sample was almost evenly divided between traditional students 25 years old or younger (46% or 45 participants) and nontraditional students who were 26 years old or older (54% or 55 participants).
Table 1 discloses data about the ethnicity of the participants. As with the other demographic in-formation, the breakdown of ethnicity mirrored the overall population of the college. Caucasians and Latinos were the largest ethnic groups, comprising 72 % (71 participants) and 14 % (14 par-ticipants), respectively. About 6% (6) of the participants identified themselves as “other.” This could be accounted for by the fact that there was no category for Native American, and there are several Native American reservations near the college campus. One possible flaw in the study may have been to allow a category for “Not Applicable,” which may not have been an appropri-ate category to self-report for ethnicity. This value was kept in the results, however, and reported.
Participants were asked to estimate their level of experience with computers. The number of par-ticipants identifying themselves at either extreme was nearly evenly divided—eighteen percent (18) of participants said they were novice; sixteen percent (16) of participants said they were ex-pert. A surprisingly large number of the participants placed themselves in the middle: Sixty four
256
Sorden & Munene
percent (63 participants) reported that they had an intermediate amount of experience with com-puters. It would warrant additional research to try to determine if this statistic mirrors the general college population or whether students with an intermediate or expert amount of experience were more likely to take blended courses.
In terms of distance-education courses taken prior to enrolling in the current blended course, most of the participants—60% (59 individuals)—had only taken one or no distance- education courses prior to enrolling in the current blended course. Around 45% (29 participants) had taken three or more such classes.
Findings
Questionnaire Statements by Ranked Mean To provide a good overview of the questionnaire, all statements from the questionnaire are re-ported in Tables 2, 3, and 4. They are ranked from the highest mean to the lowest mean as re-ported by the 98 participants in Likert-type scales where a “5” means “strongly agree.” It is worth noting that the statement that reported the lowest mean was related to whether collaborative ac-tivities were better in an online environment than in a face-to-face environment. This seems to indicate that students feel that collaboration is better when it occurs in a face-to-face situation.
257

Community College Student Satisfaction in Blended Learning
It is worth noting, as displayed in Table 2, that the highest-ranked statements in the “satisfaction” section, as well as the survey taken as a whole, focused on satisfaction with the instructors and the courses. This suggests that students in the study did like the blended format. Indeed, students ranked the statement “As a result of my experience with this course, I would like to take another blended course in the future” very high. Another point worth noting is that students ranked the statement about learning from discussions relatively low. Since engaging in online discussions is often an important characteristic of blended learning, this is somewhat of concern and warrants further study. Finally, there is an interesting pattern in this set of questions that merits further in-vestigation in a future study: As the mean decreases, the standard deviation generally increases.
In Table 3, the highest-ranked item again reflected general satisfaction with an aspect of the course—in this case, collaboration. However, statements about collaboration were generally ranked lower than statements reflecting satisfaction with the courses. This could be because the collaborative experiences were not satisfactory or possibly didn’t take place as much as they could have. It is also important to note that the lowest-ranked item in this section suggests that students prefer collaborating in face-to-face (f2f) environments rather than online, which actually supports the flipped classroom theory that advocates having students watch lectures and learn the material in advance, and then focus on problem solving and collaboration in the classroom.
258
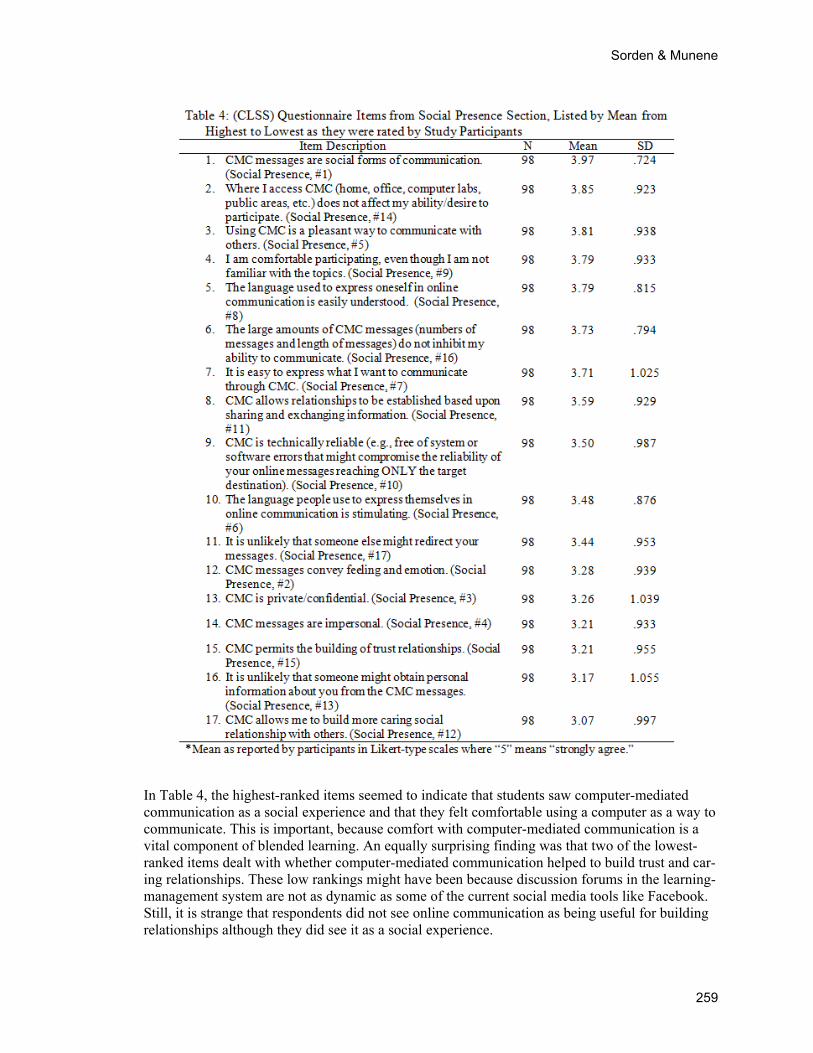
Sorden & Munene
In Table 4, the highest-ranked items seemed to indicate that students saw computer-mediated communication as a social experience and that they felt comfortable using a computer as a way to communicate. This is important, because comfort with computer-mediated communication is a vital component of blended learning. An equally surprising finding was that two of the lowest-ranked items dealt with whether computer-mediated communication helped to build trust and car-ing relationships. These low rankings might have been because discussion forums in the learning-management system are not as dynamic as some of the current social media tools like Facebook. Still, it is strange that respondents did not see online communication as being useful for building relationships although they did see it as a social experience.
259
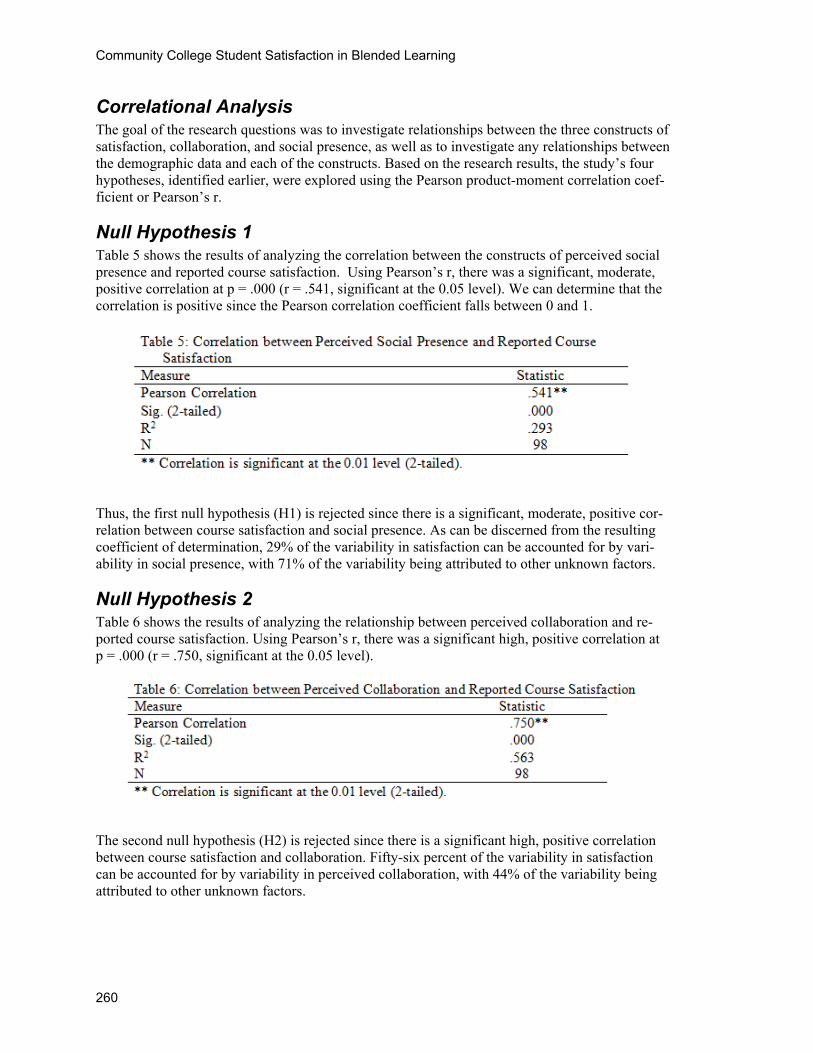
Community College Student Satisfaction in Blended Learning
Correlational Analysis The goal of the research questions was to investigate relationships between the three constructs of satisfaction, collaboration, and social presence, as well as to investigate any relationships between the demographic data and each of the constructs. Based on the research results, the study’s four hypotheses, identified earlier, were explored using the Pearson product-moment correlation coef-ficient or Pearson’s r.
Null Hypothesis 1 Table 5 shows the results of analyzing the correlation between the constructs of perceived social presence and reported course satisfaction. Using Pearson’s r, there was a significant, moderate, positive correlation at p = .000 (r = .541, significant at the 0.05 level). We can determine that the correlation is positive since the Pearson correlation coefficient falls between 0 and 1.
Thus, the first null hypothesis (H1) is rejected since there is a significant, moderate, positive cor-relation between course satisfaction and social presence. As can be discerned from the resulting coefficient of determination, 29% of the variability in satisfaction can be accounted for by vari-ability in social presence, with 71% of the variability being attributed to other unknown factors.
Null Hypothesis 2 Table 6 shows the results of analyzing the relationship between perceived collaboration and re-ported course satisfaction. Using Pearson’s r, there was a significant high, positive correlation at p = .000 (r = .750, significant at the 0.05 level).
The second null hypothesis (H2) is rejected since there is a significant high, positive correlation between course satisfaction and collaboration. Fifty-six percent of the variability in satisfaction can be accounted for by variability in perceived collaboration, with 44% of the variability being attributed to other unknown factors.
260
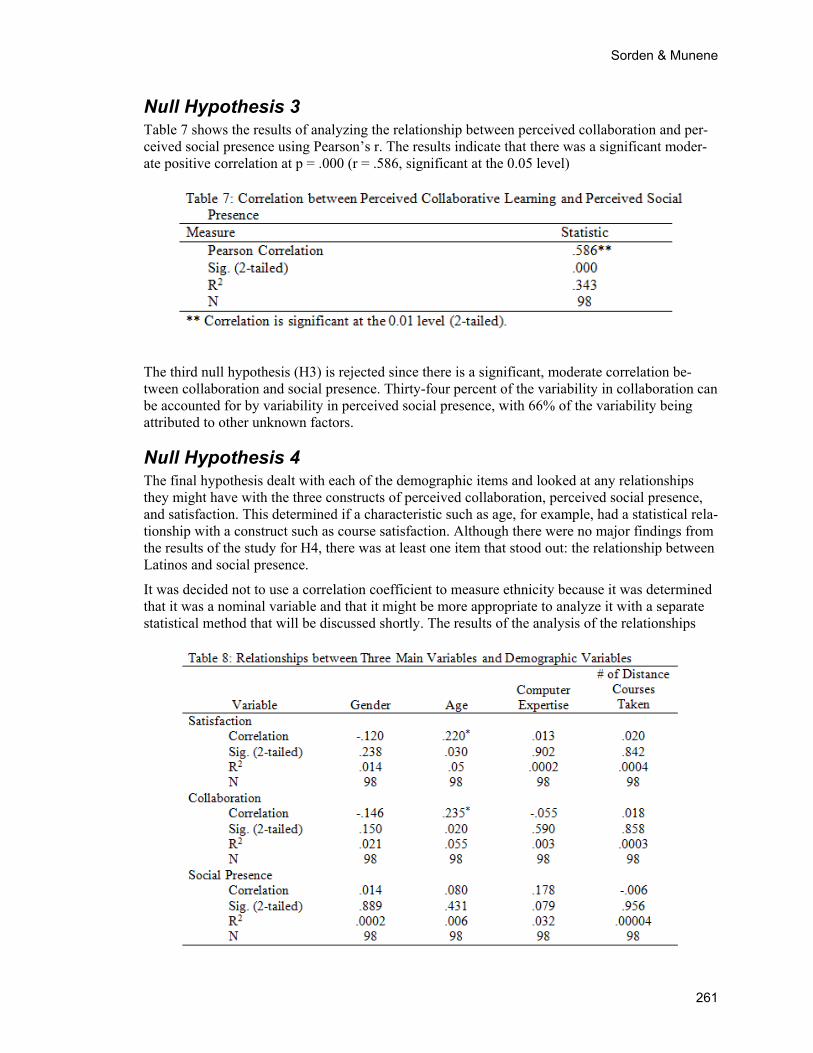
Sorden & Munene
Null Hypothesis 3 Table 7 shows the results of analyzing the relationship between perceived collaboration and per-ceived social presence using Pearson’s r. The results indicate that there was a significant moder-ate positive correlation at p = .000 (r = .586, significant at the 0.05 level)
The third null hypothesis (H3) is rejected since there is a significant, moderate correlation be-tween collaboration and social presence. Thirty-four percent of the variability in collaboration can be accounted for by variability in perceived social presence, with 66% of the variability being attributed to other unknown factors.
Null Hypothesis 4 The final hypothesis dealt with each of the demographic items and looked at any relationships they might have with the three constructs of perceived collaboration, perceived social presence, and satisfaction. This determined if a characteristic such as age, for example, had a statistical rela-tionship with a construct such as course satisfaction. Although there were no major findings from the results of the study for H4, there was at least one item that stood out: the relationship between Latinos and social presence.
It was decided not to use a correlation coefficient to measure ethnicity because it was determined that it was a nominal variable and that it might be more appropriate to analyze it with a separate statistical method that will be discussed shortly. The results of the analysis of the relationships
261
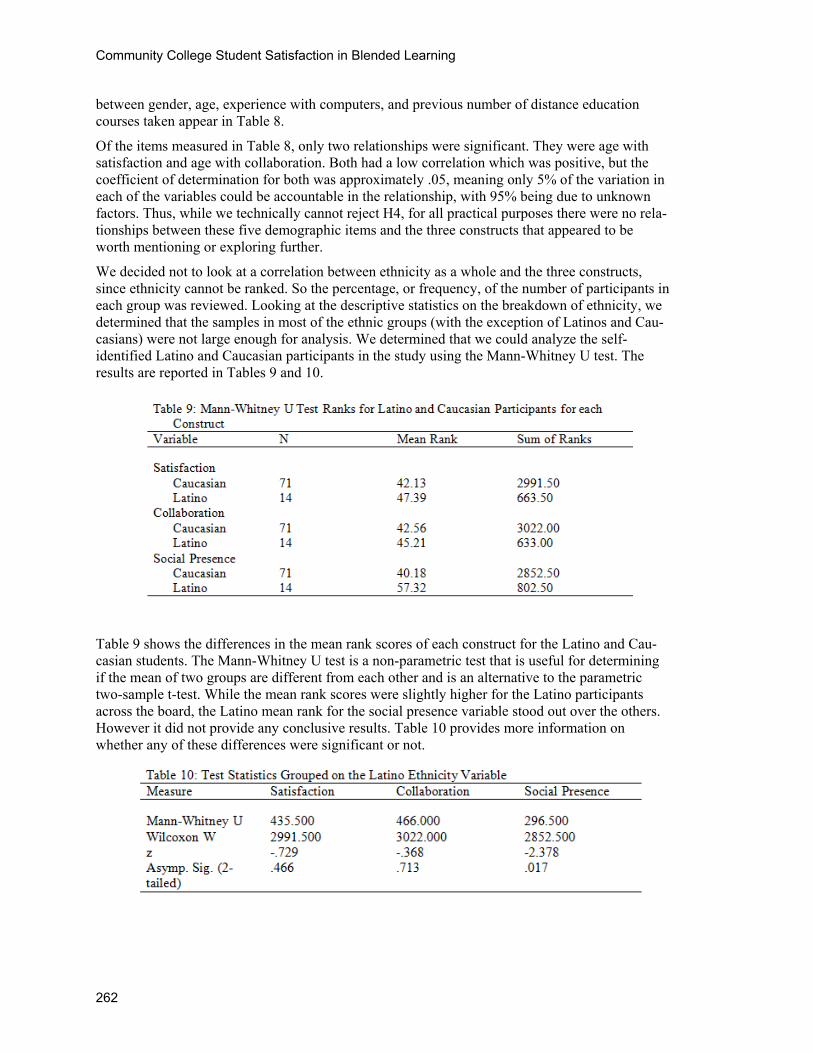
Community College Student Satisfaction in Blended Learning
between gender, age, experience with computers, and previous number of distance education courses taken appear in Table 8.
Of the items measured in Table 8, only two relationships were significant. They were age with satisfaction and age with collaboration. Both had a low correlation which was positive, but the coefficient of determination for both was approximately .05, meaning only 5% of the variation in each of the variables could be accountable in the relationship, with 95% being due to unknown factors. Thus, while we technically cannot reject H4, for all practical purposes there were no rela-tionships between these five demographic items and the three constructs that appeared to be worth mentioning or exploring further.
We decided not to look at a correlation between ethnicity as a whole and the three constructs, since ethnicity cannot be ranked. So the percentage, or frequency, of the number of participants in each group was reviewed. Looking at the descriptive statistics on the breakdown of ethnicity, we determined that the samples in most of the ethnic groups (with the exception of Latinos and Cau-casians) were not large enough for analysis. We determined that we could analyze the self-identified Latino and Caucasian participants in the study using the Mann-Whitney U test. The results are reported in Tables 9 and 10.
Table 9 shows the differences in the mean rank scores of each construct for the Latino and Cau-casian students. The Mann-Whitney U test is a non-parametric test that is useful for determining if the mean of two groups are different from each other and is an alternative to the parametric two-sample t-test. While the mean rank scores were slightly higher for the Latino participants across the board, the Latino mean rank for the social presence variable stood out over the others. However it did not provide any conclusive results. Table 10 provides more information on whether any of these differences were significant or not.
262
Sorden & Munene
Table 10 shows that the variables for satisfaction and collaboration were not significant in their relationship with the Latino ethnic group. However, there is enough evidence to conclude that there is a difference in the mean ranks of the two ethnic groups in relationship to social presence. A significantly higher score by the Latino participants for perceived social presence appears to have been identified by the study, thus for Latino participants, we fail to reject H4 only in one specific situation: There is a relationship between Latino participants and a higher score in per-ceived social presence. Thus, the fourth null hypothesis (H4) is retained, and there is no correla-tion overall between the demographic variables (excluding ethnicity) and the three constructs.
Discussion The findings of this study generally reflected expected outcomes and were similar to those of So & Brush (2008), who used the same instrument as we did in this study. However there were some unexpected results, which will be discussed below.
Limitations This study was limited to a small rural campus located in an economically depressed section of the desert Southwest, so its findings may not be widely transferable to other communities whose members are more privileged with a variety of options for access to technology. Also, the campus is part of a college system that is not known for being a leader in technology integration or for providing the latest technology to its students. But the college does provide all of the essential elements required for a blended classroom.
The study limits its focus to three constructs: the two independent variables of perceived collabo-rative learning and social presence, and the dependent variable of self-reported student satisfac-tion with a blended course. It then examines the relationship between them. There is likely a much richer set of factors influencing student behavior and satisfaction, so this study is a prelimi-nary, limited look at a very small set of constructs in a very dynamic learning situation. The in-strument used to measure the constructs of collaborative learning, social presence, and student satisfaction may also be somewhat dated in light of the evolving fields of collaboration theory, Community of Inquiry theory, and blended learning theory.
Because the study focuses on correlation between variables, it will not prove causality. Similarly, finding a correlation between social presence or collaborative learning and student satisfaction will not allow us to state that these two variables predict student satisfaction.
Conclusions from the Findings The finding of a moderate, positive relationship between social presence and student satisfaction mirrors other research suggesting a relationship between social presence and student satisfaction in online learning and blended learning (Gunawardena, 1995; Gunawardena & Zittle, 1997; Ju-soff & Khodabandelou, 2009; Kang & Kang, 2008; Liu et al., 2007; Richardson & Swan, 2003; Tu, 2002; Tu & McIsaac, 2002).
The two constructs of perceived collaboration and student satisfaction appeared to be highly re-lated. This finding also mirrors research that suggests a relationship between collaboration and student satisfaction in online learning and blended-learning environments (Conrad & Donaldson, 2004; Ferguson & DeFelice, 2010; Garrison & Vaughan, 2007; Jung et al., 2002; Nummenmaa & Nummenmaa, 2008; Palloff & Pratt, 2007; So & Brush, 2008).
It is interesting that the relationship appeared to be much stronger between collaboration and stu-dent satisfaction than it appeared to be between social presence and student satisfaction, which is not necessarily what we expected due to the perception that collaborative activities can elicit
263
Community College Student Satisfaction in Blended Learning
negative reactions in some learners (Barkley, Cross, & Major, 2004; Kirschner, Sweller, & Clark, 2006).
The study confirmed that there appears to be a link between rising levels of perceived collabora-tion and rising levels of perceived social presence. While collaboration and social presence are theoretically independent variables that affect the dependent variable of self-reported student course satisfaction, there does appear to be a moderate relationship between the amount of per-ceived collaboration in a blended course and the amount of perceived social presence in a blended course. This should not be surprising since research has suggested that interactivity is an essential component of social presence (Tu, 2002), and we can safely state that interactivity is increased as a result of collaborative activities. It is important to note, however, that interactivity and collabo-ration is not the same thing. Vesely, Bloom, and Sherlock (2007) defined collaboration as mem-bers of a community interacting to achieve a common learning goal. Other researchers have sug-gested that while social presence may not cause collaboration, it can affect the attitudes of par-ticipants about collaborating on a particular task (Kehrwald, 2007; Weinel et al., 2011; Wise, Chang, Duffy, & del Valle, 2004). Rourke et al., (2001) and Rovai (2002) said they believe that social presence is also important in the development of a community of learners.
With the exception of a relationship between Latinos and higher self-reported perceptions of so-cial presence, the study did not find a significant correlation between any of the demographic variables and the three constructs that were measured. This appears to be somewhat in-line with previous research that did not show any correlation between student satisfaction and student background characteristics such as age, gender, grade level, and computer expertise (Kitchen & McDougall, 1999; Yaverbaum & Ocker, 1998).
The finding that suggested a possibly higher rate of perceived social presence for Latino students than for Caucasian students is intriguing, though it is difficult to draw any hard conclusions since there were only 14 participants in the group of self-identified Latino students. We found this to be very interesting because while no study could be identified that specifically dealt with connec-tions between social presence and Latinos/Hispanics, it is our suspicion that there may be cultural characteristics that might cause Latinos to perceive more social presence than their Caucasian counterparts, or to actually create it as a result of the dynamics of their culture.
While there is as yet no strong evidence, this may be the first study to suggest a higher relation-ship between Latinos/Hispanics and perceived social presence in blended learning. This could be a very important finding and a very beneficial future direction to take this research as the La-tino/Hispanic population continues to increase in the United States and there is a sustained focus on ways to help Latino/Hispanic students succeed in learning environments like blended learning.
If this finding of an increased importance of social presence for a specific cultural group can be repeated with a larger sample, then we might be able to explore whether there are significant de-sign issues that could enhance student completion when designing blended courses for popula-tions that are dominated by one or two cultural groups. It also opens the door to the possibility that there may be all sorts of culture-related factors that blended-course designers should be aware of when creating a blended course for a targeted cultural group (Asunka, 2008; Hall & Herrington, 2010; Jusoff & Khodabandelou, 2009, Teng, 2005; Tu, 2001; Yen & Tu, 2011; Yildiz, 2009).
The finding that no significant relationships existed between any of the other demographic vari-ables and the three constructs may also be important because it suggests that social presence and collaboration equally correlate positively to course satisfaction in blended learning, regardless of variations in demographic variables such as gender, age, or computer expertise.
264
Sorden & Munene
One major conclusion that can be drawn from this study is to confirm that there does indeed ap-pear to be a strong link between the amount of social presence and collaborative activities that a student perceives in a blended course and that student’s self-reported satisfaction in the course. The other major conclusion that can be drawn from this study is that blended learning is an attrac-tive instructional approach that holds promise for increasing student satisfaction and engagement, which should lead to increased course completion and program retention.
Implications This study has several implications for educators, instructional designers, administrators, and pol-icy makers. While we cannot draw any implications based on causality in this study, we can say that it appears that blended learning may indeed be a suitable approach for community colleges, based on the high levels of self-reported student satisfaction. It suggests that the use of blended learning should be encouraged by policy makers. It also appears that if student satisfaction is one goal of an institution or community-college system, then policy makers should encourage educa-tional programs that feature collaborative activities and social presence in blended learning.
Data from this study can be used to suggest that blended learning which features collaboration and social presence can help institutions create better programs and support services that may lead to more effective learning environments. The evolution of these highly-effective, blended-learning environments would happen through iterative cycles of implementation, followed by student evaluations, assessment, action research, and program reviews. As new research clarifies the value of the three constructs of social presence, collaboration, and satisfaction, as well as pos-sibly additional constructs, it should help institutions and educators to create environments that assist students with developing the skills and aptitudes necessary to successfully complete a blended course.
One recommendation, then, is to not only offer blended learning, but also to build more effective blended courses using constantly improving technologies and learning-centered instructional methodologies (Liu et al. 2009). Blended-learning courses might include a variety of learning tools such as real-time virtual/collaboration software, self-paced learning materials, and social media; in addition to face-to-face (f2f) sessions in a classroom or other meeting area.
We also recommend that instruments similar to the CLSS Questionnaire be included in blended-learning programs to support the use of data-driven decision-making and learning analytics in learning-centered environments. Learning analytics will play an increasingly important role in education as administrators and teachers begin to use technology and blended-learning ap-proaches to personalize education for every student—not just students who are struggling.
One particularly promising strategy might be to focus on networked learning and object-oriented sociality within the blended environment (Cetina, 2001; Conole et al., 2008; Engeström, 2005). The theory of object-oriented sociality maintains that successful social networks aren’t really cen-tered on relationships or connections, but rather on the value held by learners for certain social objects. Rogers and Lea (2005) echo a similar idea when they state that in group collaboration, social identity—rather than interpersonal bonds—is the basis upon which social presence is built. The practical implication for this line of thought is that blended learning should attempt to build social networks around social objects that hold value and interest for the intended audience. The more interest a social object or idea holds for a group of learners, the more that group may ex-perience increased social presence and collaboration.
Additionally, Liu et al. (2007) and Horton (2011) suggested that learners can be motivated to col-laborate and stay engaged in a course by incorporating techniques such as setting clear expecta-tions, requiring commitment, making online courses fun and interesting, providing encouraging feedback, building a learning community, and intervening early with unmotivated learners.
265
Community College Student Satisfaction in Blended Learning
Kehrwald (2007) asserted that in order to build these connections of collaboration and social presence, an online facilitator must build a strong presence in the course, the presence-building tasks should be included in early course activities, supportive activities should be included for novice online learners, and activities for interpersonal interaction should be required rather than suggested.
Further Research Because our study focused on a relatively new instructional approach, more research is needed on blended learning—possibly including research on the combination of self-directed/independent and collaborative activities. While self-directed/independent activities weren’t explored in this study, they should be contrasted with collaborative activities to see how each correlates to student satisfaction. Also, as the use of blended learning begins to grow in high schools, similar research might be pursued at the secondary level.
This study would likely have yielded a much fuller perspective if qualitative data had been in-cluded and the study had a mixed-method research design. Further research should include quali-tative research so that we can begin to properly interpret the quantitative data and the interesting trends that we have seen in this study.
There is also not a great deal of social-presence research with Hispanic/Latino students or other specific cultural groups. This should be an area that is explored to see how collaboration and so-cial presence might improve learning opportunities for various cultural groups. Further research might be conducted on whether blended learning improves the success rate of particular cultural groups of students when appropriate collaborative and social presence activities are promoted.
Finally, further research is warranted to determine if the constructs explored in this study go be-yond a positive correlation with student satisfaction in blended learning and can be identified as predicting student satisfaction. To further this research, a brief overview of this study was pre-sented at an international conference in order to get feedback and disseminate its principal con-cepts and initial findings (Sorden & Ramirez, 2012).
Summary Although this study did not compare student satisfaction or completion rates of blended learning with the same metrics in face-to-face or online environments, it does ultimately suggest that blended learning is a viable alternative approach to these two traditional approaches in commu-nity colleges. Many administrators, instructors, and instructional designers do not know how to approach blended-learning from an instructional-design perspective and simply view it as a divi-sion between face-to-face and online learning spaces. This will undoubtedly improve as more people experiment with blended learning and conduct research that is focused on this approach.
Beyond determining whether blended learning is successful as an instructional approach, part of this blended-learning research agenda will be to determine which characteristics make blended-learning designs more successful in respect to student satisfaction, completion rates, and perform-ance. This study demonstrated that there is a relationship between the three constructs of per-ceived collaboration, perceived social presence, and self-reported student satisfaction in blended-learning courses. Its main significance is to show that these constructs are important for blended-learning design and should be promoted in learning environments. In addition to these three con-structs, there may be many more constructs which promote successful learning environments that will surface in future studies.
While the study focused on a small sample at one community college, it invites further research into whether similar results can be found at other community colleges around the country and
266
Sorden & Munene
whether other factors can be shown to have a relationship with student satisfaction and, ulti-mately, student-completion rates. The focus on blended-learning methods will likely increase as community colleges are pressured to improve completion rates and prove that their programs are effective in preparing students for the workforce and for transfer to four-year universities.
References Albrecht, B. (2006). Enriching student experience through blended learning. Research Bulletin, 12, EDU-
CAUSE Center for Applied Research. Retrieved from http://net.educause.edu/ir/library/pdf/ERB0612.pdf
Asunka, S. (2008). Online learning in higher education in sub-Saharan Africa: Ghanaian university stu-dents' experiences and perceptions. The International Review of Research in Open and Distance Learning, 9(3), 1-23.
Bandura, A. (1985). Social foundations of thought and action: A social cognitive theory. Upper Saddle River, NJ: Prentice-Hall.
Barkley, E. F., Cross, K. P., & Major, C. H. (2004) Collaborative learning techniques: A handbook for college faculty. Hoboken, N.J.: John Wiley & Sons/Jossey-Bass.
Cetina, K. K. (2001). Objectual practice. In T. R. Schatzki, K. K. Cetina, & E. von Savigny (Eds.), The practice turn in contemporary theory (pp.175-188). Abignon, Oxon, UK: Taylor & Francis Group Ltd./Routledge.
Clusky, G. R., Jr., Hodges, C. W., & Smith, S. (2006). The impact of online quizzing on student success in an introductory financial accounting class. Journal of College Teaching & Learning, 3(7), 13-18.
Conole, G., Culver, J., Weller, M., Williams, P., Cross, S., Clark, P., & Brasher, A.. (2008). Cloudworks: Social networking for learning design. In Hello! Where are you in the landscape of educational tech-nology? Proceedings ASCILITE Melbourne 2008.
Conrad, R. M., & Donaldson, J. A. (2004). Engaging the online learner: Activities and resources for crea-tive instruction. San Francisco: John Wiley & Sons/Jossey-Bass.
Dommel, H. P. (2005). The challenges of ambient collaboration. Proceedings of the Richard Tapia celebra-tion of diversity in computing conference (pp. 10-13). Albuquerque, NM.
Engeström, J. (2005, April 13). Why some social network services work and others don't — or: the case for object centered sociality (blog posting). Retrieved from http://www.zengestrom.com/blog/2005/04/why_some_social.html
Ferguson, J. M., & DeFelice, A. E. (2010). Length of online course and student satisfaction, perceived learning, and academic performance. The International Review of Research in Open and Distance Learning, 11(2), 73-84.
Garrison, D. R. (2009). Communities of inquiry in online learning. In P. L. Rogers, G. A. Berg, J. V. Boet-tcher, C. Howard, L. Justice, & K. D. Shenk (Eds.), Encyclopedia of distance learning (2nd ed.) (pp. 352–355). Hershey, PA: IGI Global.
Garrison, D. R., & Vaughan, N. D. (2007). Blended learning in higher education: Framework, principles, and guidelines. San Francisco: John Wiley & Sons/Jossey-Bass.
Gunawardena, C. N. (1995). Social presence theory and implications for interaction and collaborative learning in computer conferences. International Journal of Educational Telecommunications. 1(2), 147-166.
Gunawardena, C. N., & Zittle, F. J. (1997). Social presence as a predictor of satisfaction within a computer-mediated conferencing environment. American Journal of Distance Education, 11(3), 8-26.
Hall, A., & Herrington, J. (2010). The development of social presence in online Arabic learning communi-ties. Australasian Journal of Educational Technology, 26(7), 1012-1027.
267
Community College Student Satisfaction in Blended Learning
Homer, B. D., Plass, J. L., & Blake, L. (2008). The effects of video on cognitive load and social presence in multimedia-learning. Computers in Human Behavior, 24(3), 786-797.
Horton, W. (2011) e-Learning by Design (2nd ed.). Hoboken, NJ: John Wiley and Sons/Pfeiffer.
Jarvela, S., & Jarvenoja, H. (2011). Socially constructed self-regulated learning and motivation regulation in collaborative learning groups. Teachers College Record, 113(2), 350-374.
Jeong, H., & Chi, M. T. H. (2007). Knowledge convergence during collaborative learning. Instructional Science, 35, 287-315.
Jung, I, Choi, S., Lim, C., & Leem, J. (2002). Effects of different types of interaction on learning achieve-ment, satisfaction, and participation in web-based instruction. Innovations in Education and Teaching International, 39(2), 153-162.
Jusoff, K., & Khodabandelou, R. (2009). Preliminary study on the role of social presence in blended-learning environment in higher education. International Education Studies, 2(4), 79-83.
Kang, M., & Kang, J. (2008). Investigating the relationships of social presence, satisfaction, and learning achievement in the blended-learning environment. In J. Luca & E. Weippl (Eds.), Proceedings of World Conference on Educational Multimedia, Hypermedia, and Telecommunications 2008 (pp. 717-720). Chesapeake, VA: AACE.
Kehrwald, B. (2007). The ties that bind: Social presence, relations, and productive collaboration in online learning environments. In ICT: Providing choices for learners and learning. Proceedings ASCILITE Singapore 2007. Retrieved from http://www.ascilite.org.au/conferences/singapore07/procs/kehrwald.pdf
Kirschner, P. A., Sweller, J., & Clark, R. E. (2006). Why minimal guidance during instruction does not work: An analysis of the failure of constructivist, discovery, problem-based, experiential, and inquiry-based teaching. Educational Psychologist, 41(2), 75-86.
Kitchen, D., & McDougall, D. (1999). Collaborative learning on the internet. Journal of Educational Tech-nology Systems, 27(3), 245-258.
LaPointe, D. K., & Gunawardena, C. N. (2004). Developing, testing and refining of a model to understand the relationship between peer interaction and learning outcomes in computer-mediated conferencing. Distance Education, 25(1), 83-106.
Liu, S., Gomez, J., Khan, B., & Yen, C-J. (2007). Toward a learner-oriented community college online course dropout framework. International Journal on E-Learning, 6(4), 519-542.
Liu, S. Y., Gomez, J., & Yen, C-J. (2009). Community college online course retention and final grade: Pre-dictability of social presence. Journal of Interactive Online Learning, 8(2), 165-182.
Martin, B. L., & Reigeluth, C. M. (1999). Affective education and the affective domain: Implications for instructional-design theories and models. In C. M. Reigeluth (Ed.), Instructional-design theories and models: A new paradigm of instructional theory (Vol. 2, pp. 485-509). Mahwah, NJ: Lawrence Erl-baum Associates.
Martin, O., & Trigwell, K. (2005). Can 'blended learning' be redeemed? E-Learning and Digital Media, 2(1), 17-26.
Means, B., Toyama, Y., Murphy. R., Bakia, M., & Jones, K. (2009). Evaluation of evidence-based prac-tices in online learning: A meta-analysis and review of online-learning studies. Washington, D.C.: U.S. Department of Education.
Nummenmaa, M., & Nummenmaa, L. (2008). University students’ emotions, interests, and activities and a web-based learning environment. The British Journal of Educational Psychology, 78(Pt1), 163-178.
Osguthorpe, R. T., & Graham, C. R. (2003). Blended learning environments: Definitions and directions. Quarterly Review of Distance Education, 4(3), 227–233.
Palloff, R. M., & Pratt, K. (2007). Online learning communities in perspective. In R. Luppicini (Ed.), Online learning communities (pp. 3-16). Charlotte, NC: Information Age Publishing.
268
Sorden & Munene
Resta, P., & Laferrière, T. (2007). Technology in support of collaborative learning. Educational Psychol-ogy Review, 19(1), 65–83.
Richardson, J. C., & Swan, K. (2003). Examining social presence in online courses in relation to students' perceived learning and satisfaction. Journal of Asynchronous Learning Networks, 7(1), 68-88.
Rogers, P., & Lea, M. (2005). Social presence in distributed group environments: The role of social iden-tity. Behaviour & Information Technology, 24(2), 151-158.
Roschelle, J. (1992). Learning by collaborating: Convergent conceptual change. The Journal of the Learn-ing Sciences 2(3), 235–276.
Rourke, L., Anderson, T., Garrison, D. R., & Archer, W. (2001). Assessing social presence in asynchro-nous text-based computer conferencing. Journal of Distance Education, 14, 50-71.
Rovai, A. (2002). Building a sense of community at a distance. International Review of Research in Open and Distance Learning, 3(1), 1-16. Retrieved from http://www.irrodl.org/index.php/irrodl/article/view/79/152
So, H-J., & Brush, T. A. (2008). Student perceptions of collaborative learning, social presence, and satis-faction in a blended-learning environment: Relationships and critical factors. Computers & Education, 51(1), 318-336.
Sorden, S. D., & Ramirez, J. L. (2012). Collaborative learning, social presence and student satisfaction in a blended learning environment. Proceedings of 2012 IEEE 12th International Conference on Advanced Learning Technologies (pp.129-133). Rome: ICALT2012.
Stahl, G., Koschmann, T., & Suthers, D. D. (2006). Computer-supported collaborative learning. In R. K. Sawyer (Ed.), Cambridge handbook of the learning sciences (pp. 409-426). Cambridge, UK: Cam-bridge University Press.
Stein, D. (2004). Student satisfaction depends on course structure. Online Classroom, Feb.: 4-5.
Teng, Y. (2005). An examination of social presence in online learning through the eyes of native and non-native English speakers. State University of New York at Albany. Retrieved from ProQuest Disserta-tions and Theses. (Order No. 3181793)
Tu, C-H. (1999). Reconstructing the social learning theory: Social presence theory in online learning. Pro-ceedings of WebNet World Conference on the WWW and Internet 1999, 1082-1087. Chesapeake, VA:AACE.
Tu, C-H. (2001). How Chinese perceive social presence: An examination of interaction in online learning environment. Educational Media International, 38(1), 45-60.
Tu, C-H. (2002). The measurement of social presence in an online learning environment. International Journal on E-Learning, 1(2), 34-45.
Tu, C-H. (2004). Online collaborative learning communities: Twenty-one designs to building an online collaborative learning community. Engelwood, CO: Libraries Unlimited.
Tu, C-H., & Corry, M. (2003). Building active online interaction via a collaborative learning community. Computers in the Schools, 20(3), 51-59.
Tu, C-H., & McIsaac, M. (2002). The relationship of social presence and interaction in online classes. American Journal of Distance Education. 16(3), 131-150.
Vesely, P., Bloom, L., & Sherlock, J. (2007). Key elements of building online community: Comparing fac-ulty and student perceptions. Journal of Online Learning and Teaching, 3(3), 234-246. Retrieved from http://jolt.merlot.org/vol3no3/vesely.htm
Weinel, M., Bannert, M., Zumbach, J., Malzahn, N., & Hoppe, H. (2011). A closer look on social presence as a causing factor in computer-mediated collaboration. Computers in Human Behavior, 27(1), 513-521.
Wenger, E. (1999). Communities of practice: Learning, meaning, and identity. Cambridge, UK: Cambridge University Press.
269
Community College Student Satisfaction in Blended Learning
270
ools.
University in Kenya.
Wise, A., Chang, J., Duffy, T., del Valle, R. (2004). The effects of teacher social presence on student satis-faction, engagement, and learning. Journal of Educational Computing Research 31(3), 247-271.
Yaverbaum, G. J., & Ocker, R. J. (1998). Problem solving in the virtual classroom: A study of student per-ceptions related to collaborative learning techniques. Paper presented at the WebNet 98 World confer-ence of the WWW, Internet and Intranet, Orlando, FL.
Yen, C-J. & Tu, C-H. (2011). A multiple-group confirmatory factor analysis of the scores for online social presence: Do they measure the same thing across cultural groups? Journal of Educational Computing Research, 44(2), 219-242.
Yildiz, S. (2009). Social presence in the web-based classroom: Implications for intercultural communica-tion. Journal of Studies in International Education. 13(1), 46-65.
Biographies Dr. Stephen D. Sorden has a doctorate in Educational Leadership with an emphasis in Instructional Technologies, as well as a M.Ed. in Educational Technology. He currently serves as the Director of Career and Technical Education for the Chinle Unified School District in the center of the Navajo Nation, where he is focused on school improve-ment, technology in education, and coordinating dual enrollment pro-grams with regional community colleges. His research interests includeteaching and learning with technology, using data for school improve-ment, and technology adoption/diffusion of innovations in sch
Prior to returning to his passion of K-12 education where he began his career as a computer teacher and principal, he served as the Director of the Center for Teaching and Learning at Embry-Riddle Aeronautical University, Academic Chair for a ground campus and the distance education campus at Mohave Community College, and the Manager of Learning and Professional Development for Information Technology Services at Northern Arizona Univer-sity. He continues to teach courses as an adjunct and is currently working on a project to create a blended course on Navajo Government for high school students who are interested in pursuing the Chief Manuelito scholarship.
Dr. Ishmael I. Munene is an associate professor in the College of Education at Northern Arizona University. Ishmael I. Munene is an associate professor of educational research, higher education and foun-dations in the Department of Educational Leadership, College of Edu-cation at Northern Arizona University. He obtained his PhD in Higher Education Administration and Policy studies at the State University of New York at Albany, in the Department of Education Administration and Policy Studies. He also holds M.Ed in Comparative and Interna-tional Education and a B.Ed in English and Literature from Kenyatta
Munene’s research interests center on African higher education, private higher education, higher education governance as well as foreign aid and Africa’s educational development. He has re-searched and published widely in these areas, in addition to giving numerous academic presenta-tions. His doctoral work focused on Kenya’s higher education as it relates to issues of equity and merit in the admission of students.