A survey for nanodiamond features in the 3 micron spectra of Herbig Ae/Be stars
22
arXiv:astro-ph/0606650v1 27 Jun 2006 Astronomy & Astrophysics manuscript no. nano c ESO 2008 February 5, 2008 A survey for nanodiamond features in the 3 micron spectra of Herbig Ae/Be stars ⋆ B. Acke 1,⋆⋆ and M. E. van den Ancker 2 1 Instituut voor Sterrenkunde, KULeuven, Celestijnenlaan 200B, 3001 Leuven, Belgium e-mail: [email protected] 2 European Southern Observatory, Karl-Schwarzschild Strasse 2, D-85748 Garching bei M¨ unchen, Germany DRAFT, February 5, 2008 ABSTRACT Aims. We have carried out a survey of 60 Herbig Ae/Be stars in the 3 micron wavelength region in search for the rare spectral features at 3.43 and 3.53 micron. These features have been attributed to the presence of large, hot, hydrogen-terminated nanodiamonds. Only two Herbig Ae/Be stars, HD 97048 and Elias 3−1 are known to display both these features. Methods. We have obtained medium-resolution spectra (R ∼ 2500) with the ESO near-IR instrument ISAAC in the 3.15−3.65 micron range. Results. In our sample, no new examples of sources with prominent nanodiamond features in their 3 micron spectra were discovered. Less than 4% of the Herbig targets show the prominent emission features at 3.43 and/or 3.53 μm. Both features are detected in our spectrum of HD 97048. We confirm the detection of the 3.53 μm feature and the non-detection of the 3.43 μm feature in MWC 297. Furthermore, we report tentative 3.53 μm detections in V921 Sco, HD 163296 and T CrA. The sources which display the nanodiamond features are not exceptional in the group of Herbig stars with respect to disk properties, stellar characteristics, or disk and stellar activity. Moreover, the nanodiamond sources are very different from each other in terms of these parameters. We do not find evidence for a recent supernova in the vicinity of any of the nanodiamond sources. We have analyzed the PAH 3.3 μm feature and the Pfund δ hydrogen emission line, two other spectral features which occur in the 3 micron wavelength range. We reinforce the conclusion of previous authors that flared-disk systems display significantly more PAH emission than self- shadowed-disk sources. The Pf δ line detection rate is higher in self-shadowed-disk sources than in the flared-disk systems. Conclusions. We discuss the possible origin and paucity of the (nano)diamond features in Herbig stars. Different creation mechanisms have been proposed in the literature, amongst others in-situ and supernova-induced formation. Our data set is inconclusive in proving or disproving either formation mechanism. Key words. circumstellar matter — stars: pre-main-sequence — planetary systems: protoplanetary disks 1. Introduction Herbig Ae/Be (HAEBE) stars are pre-main-sequence objects of intermediate (1.5–8 M ⊙ ) mass. These sources exhibit large infrared (IR) excesses, for the greater part due to thermal emis- sion of circumstellar dust. The geometry of this dust surround- ing the late-B, A and F-type members of this class is disklike (e.g. Mannings & Sargent 1997; Testi et al. 2003; Pi´ etu et al. 2003; Fuente et al. 2003; Natta et al. 2004). Also for early-B- type stars, evidence for disks has been found (e.g. Vink et al. 2002). However, there is growing evidence that the structure of the circumstellar matter in early-type B stars is fundamentally different from Herbig Ae and T Tauri stars (e.g. Fuente et al. 2003; Bik & Thi 2004). ⋆ Based on observations collected at the European Southern Observatory, La Silla, Chile (program numbers 071.C-0653, 072.C- 0648, 073.C-0245 and 074.C-0248). ⋆⋆ Postdoctoral researcher of the Research Fund KULeuven. The chemistry and mineralogy of the dust component of circumstellar disks around HAEBE stars has been studied with unprecedented precision based on near-to-mid-IR spectra (2– 200 μm) provided by the Infrared Space Observatory (ISO, Kessler et al. 1996). The launch of this satellite in 1995 was the start of a brand-new era for the research of protoplane- tary disks. The spectra revealed a large variety in dust prop- erties and species, from small carbonaceous molecules like polycyclic aromatic hydrocarbon molecules (PAHs) to silicate dust. Moreover, some sources were shown to contain crys- talline grains, similar to those found in comets in our own so- lar system (Waelkens et al. 1996; Malfait et al. 1998a, 1999; van den Ancker et al. 2000a,b; Meeus et al. 2001). All avail- able ISO 2–15 μm spectra of HAEBE stars have been studied as a whole by Acke & van den Ancker (2004, hereafter AV04). A handful of HAEBE sources (HD 97048 and Elias 3−1, Van Kerckhoven et al. 2002, and references therein) and the post-AGB binary HR 4049 (Geballe et al. 1989) display pecu-
-
Upload
natuurwetenschappen -
Category
Documents
-
view
2 -
download
0
Transcript of A survey for nanodiamond features in the 3 micron spectra of Herbig Ae/Be stars
arX
iv:a
stro
-ph/
0606
650v
1 2
7 Ju
n 20
06
Astronomy & Astrophysicsmanuscript no. nano c© ESO 2008February 5, 2008
A survey for nanodiamond featuresin the 3 micron spectra of Herbig Ae/Be stars⋆
B. Acke1,⋆⋆ and M. E. van den Ancker2
1 Instituut voor Sterrenkunde, KULeuven, Celestijnenlaan 200B, 3001 Leuven, Belgiume-mail:[email protected]
2 European Southern Observatory, Karl-Schwarzschild Strasse 2, D-85748 Garching bei Munchen, Germany
DRAFT, February 5, 2008
ABSTRACT
Aims. We have carried out a survey of 60 Herbig Ae/Be stars in the 3 micron wavelength region in search for the rare spectral features at 3.43and 3.53 micron. These features have been attributed to the presence of large, hot, hydrogen-terminated nanodiamonds.Only two Herbig Ae/Bestars, HD 97048 and Elias 3−1 are known to display both these features.Methods. We have obtained medium-resolution spectra (R ∼ 2500) with the ESO near-IR instrument ISAAC in the 3.15−3.65 micron range.Results. In our sample, no new examples of sources with prominent nanodiamond features in their 3 micron spectra were discovered.Lessthan 4% of the Herbig targets show the prominent emission features at 3.43 and/or 3.53µm. Both features are detected in our spectrum ofHD 97048. We confirm the detection of the 3.53µm feature and the non-detection of the 3.43µm feature in MWC 297. Furthermore, we reporttentative 3.53µm detections in V921 Sco, HD 163296 and T CrA. The sources which display the nanodiamond features are not exceptional inthe group of Herbig stars with respect to disk properties, stellar characteristics, or disk and stellar activity. Moreover, the nanodiamond sourcesare very different from each other in terms of these parameters. We do not find evidence for a recent supernova in the vicinity of any of thenanodiamond sources.We have analyzed the PAH 3.3µm feature and the Pfundδ hydrogen emission line, two other spectral features which occur in the 3 micronwavelength range. We reinforce the conclusion of previous authors that flared-disk systems display significantly more PAH emission than self-shadowed-disk sources. The Pfδ line detection rate is higher in self-shadowed-disk sources than in the flared-disk systems.Conclusions. We discuss the possible origin and paucity of the (nano)diamond features in Herbig stars. Different creation mechanisms havebeen proposed in the literature, amongst others in-situ andsupernova-induced formation. Our data set is inconclusivein proving or disprovingeither formation mechanism.
Key words. circumstellar matter — stars: pre-main-sequence — planetary systems: protoplanetary disks
1. Introduction
Herbig Ae/Be (HAEBE) stars are pre-main-sequence objectsof intermediate (1.5–8 M⊙) mass. These sources exhibit largeinfrared (IR) excesses, for the greater part due to thermal emis-sion of circumstellar dust. The geometry of this dust surround-ing the late-B, A and F-type members of this class is disklike(e.g. Mannings & Sargent 1997; Testi et al. 2003; Pietu et al.2003; Fuente et al. 2003; Natta et al. 2004). Also for early-B-type stars, evidence for disks has been found (e.g. Vink et al.2002). However, there is growing evidence that the structure ofthe circumstellar matter in early-type B stars is fundamentallydifferent from Herbig Ae and T Tauri stars (e.g. Fuente et al.2003; Bik & Thi 2004).
⋆ Based on observations collected at the European SouthernObservatory, La Silla, Chile (program numbers 071.C-0653,072.C-0648, 073.C-0245 and 074.C-0248).⋆⋆ Postdoctoral researcher of the Research Fund KULeuven.
The chemistry and mineralogy of the dust component ofcircumstellar disks around HAEBE stars has been studied withunprecedented precision based on near-to-mid-IR spectra (2–200 µm) provided by theInfrared Space Observatory (ISO,Kessler et al. 1996). The launch of this satellite in 1995 wasthe start of a brand-new era for the research of protoplane-tary disks. The spectra revealed a large variety in dust prop-erties and species, from small carbonaceous molecules likepolycyclic aromatic hydrocarbon molecules (PAHs) to silicatedust. Moreover, some sources were shown to contain crys-talline grains, similar to those found in comets in our own so-lar system (Waelkens et al. 1996; Malfait et al. 1998a, 1999;van den Ancker et al. 2000a,b; Meeus et al. 2001). All avail-able ISO 2–15µm spectra of HAEBE stars have been studiedas a whole by Acke & van den Ancker (2004, hereafter AV04).
A handful of HAEBE sources (HD 97048 and Elias 3−1,Van Kerckhoven et al. 2002, and references therein) and thepost-AGB binary HR 4049 (Geballe et al. 1989) display pecu-
2 Acke & van den Ancker: Diamonds in Herbig Ae/Be systems
liar spectral features at 3.43 and 3.53µm. Comparison withlaboratory spectra has convincingly shown that the carriers ofthese features are hydrogen-terminated nanometer-sized dia-monds (hereafter nanodiamonds, Guillois et al. 1999). Near-IR observations of HD 97048 by Habart et al. (2004b) havespatially resolved the emission region of the strong 3.43 and3.53 µm features on a scale of 0.18′′ × 0.18′′. The obser-vations prove beyong doubt that the emission region is con-fined to the inner 15 AU of the circumstellardisk. More tenta-tive detections of the features were reported in the literature(e.g. in HD 142527 and HD 100546, Waelkens et al. 1996;Malfait et al. 1998b, respectively), but only one additional3.53 µm feature was discovered persuasively (in MWC 297,Terada et al. 2001). Summing up, only two HAEBE stars dis-play both the 3.43 and the 3.53µm feature, and one HAEBEobject shows the 3.53µm feature. Considering that the ISOsample contains 45 targets, only a minor fraction of theHAEBE stars appear to have such a spectacular 3 micron spec-trum (AV04).
The currently operating successor to the ISO satellite,Spitzer, is not equipped with a spectrograph which can observein the 3 micron region of the spectrum. Ground-based obser-vations are therefore the only alternative. With the present pa-per, we intend to enlarge the sample of HAEBE stars that areobserved in the 3 micron region and possibly identify new tar-gets which display nanodiamond emission. Therefore, we haveemployed the near-IR ISAAC instrument (ESO−VLT) and fo-cused on the wavelength region around 3.3 (polycyclic aro-matic hydrocarbons, hereafter PAHs), 3.43 and 3.53µm (nan-odiamonds). In Sect. 2, we present the sample and the datareduction procedure. The detected features are discussed inSect. 3.
2. The data set
2.1. The sample stars
The sample of HAEBE stars compiled for this survey has beenbased on Table 1 and 2 in the paper of The et al. (1994) andon the list published by Malfait et al. (1998a). For 19 of the 60observed targets, including HD 97048, spectroscopic data inthe 3 micron region are present in the ISO data archive (AV04).The overlap between the two samples guarantees the continuitybetween the two data sets. This survey enlarges the number ofhigh-quality 3 micron spectra of Herbig stars available to usfrom 45 (ISO) to 82 (ISO+new observations).
2.2. Observations and data reduction
The observations in the 3 micron region of the spectrum wereperformed using the medium-resolution spectroscopic modeofthe ESO−VLT instrument ISAAC1, mounted on UT1 (ANTU).For each target two wavelength regions were recorded: the firstis centered around 3.3 and the second around 3.5µm. Thewavelength coverage of each spectrum is about 0.25µm. Thewidth of the unresolved telluric lines in the spectra is a measure
1 http://www.eso.org/instruments/isaac/
for the resolution of the spectra. This value is approximately15Å, corresponding to a spectral resolution of 2300. The spec-tra are oversampled with a pixel-to-pixel wavelength step of2.5Å. The width of the slit is 1′′, needed to achieve the mediumspectral resolution. The sky background subtraction is done bychopping/nodding with a throw of 20′′ in the direction of theslit.
The 3 micron region is heavily affected by atmospheric ab-sorption features. Standard stars (STDs) have been measuredin order to correct for this effect. The straightforward data re-duction procedure consists of a flatfield correction, wavelengthcalibration and multiplication with a responsivity curve.Thelatter is deduced from the STD spectrum, scaled to the rightflux values using an appropriate Kurucz model. It was notedthat the wavelength calibration of the target and standard staris never exactly the same. The offset, a fraction of a pixel up toa few pixels large, leads to artefacts in the resulting spectrum.We have applied a relative shift to the extracted STD spectrumto correct for this effect, in an attempt to reduce the residualsof atmospheric features.
During a few nights, no STD measurements were availableto correct for the telluric line absorption. Some more nights,flatfield and/or wavelength calibration files were lacking2. Inthese cases, STD and calibration measurements from othernights were used. This increases the problem of wavelengthcalibration significantly, introducing second-order differencesbetween the target and the STD spectrum. Furthermore, theassumption that the atmospheric conditions are approximatelythe same when observing target and standard star through thesame airmass is not valid at all in these cases. We have tried tocorrect for the first order effect of this problem by applying anadditional factor (∼0.8–1.2) to the airmass ratio of target andstandard star. This cosmetic surgery can of course not compen-sate for night-to-night differences in e.g. humidity.
The 3.3 and 3.5 micron spectra were reduced indepen-dently. When comparing the flux levels in the overlap region,flux-level jumps occur for a few sources. This is probably dueto slit losses: the slit width is only a fraction of the atmosphericseeing. Variations in seeing between the observations of stan-dard star and target make that a different fraction of the source’sflux is captured. This effect translates to a multiplicative factorin the resulting spectrum. Other possible causes for the flux-level jumps include errors in background subtraction or dif-ferences in atmospheric conditions between the observationsat 3.3 and 3.5 micron. We have corrected the jump betweenthe two resulting spectra by applying a multiplicative factor toboth spectra and scale them to the mean value in the overlapregion. In most cases, this factor is of the order of 0.6–1.5.Wenote that, since the PAH 3.3 micron and nanodiamond 3.53 mi-cron feature are both included within one spectrum, their shapeis insensitive to offsets in absolute flux level. The strength ofthese features is of course altered due to the application ofthemultiplicative factor.
2 No STD in the 3.3µm region on 04–05/09/2003 and 06–07/10/2004; no STD in both the 3.3 and 3.5µm regions on 18–19/11/2003 and 17–18/07/2004; no calibration files on 04–05/11/2003and 20–21/10/2004
Acke & van den Ancker: Diamonds in Herbig Ae/Be systems 3
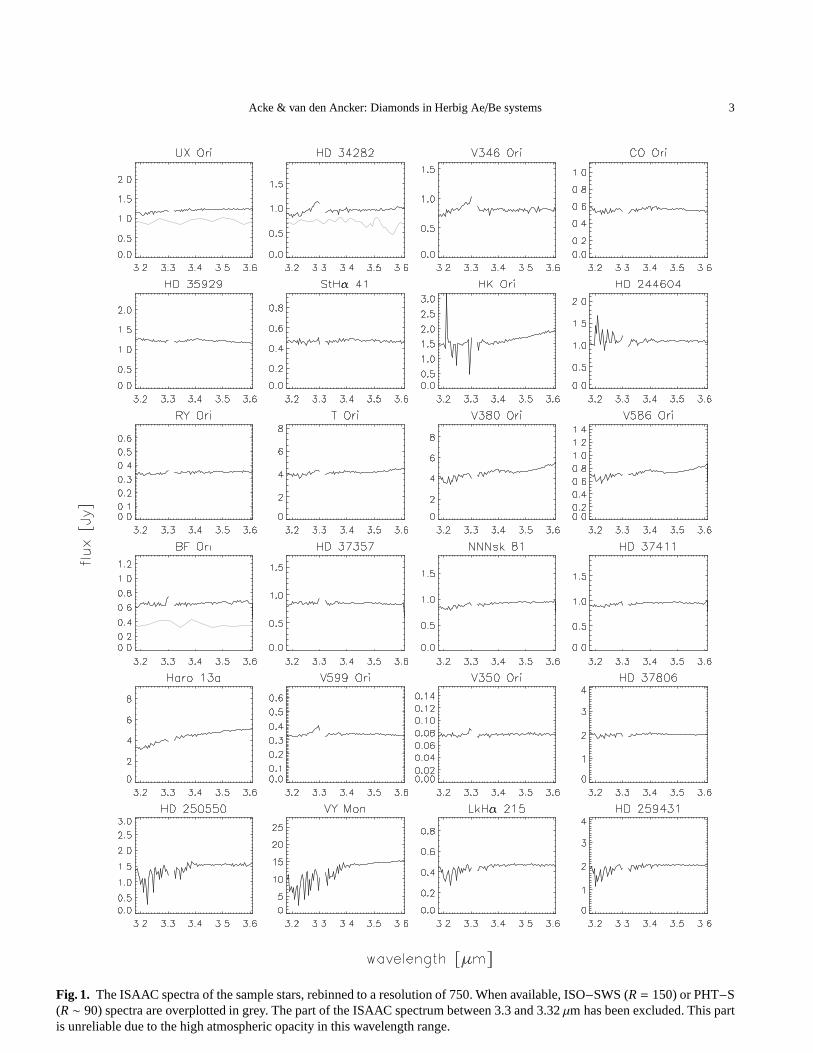
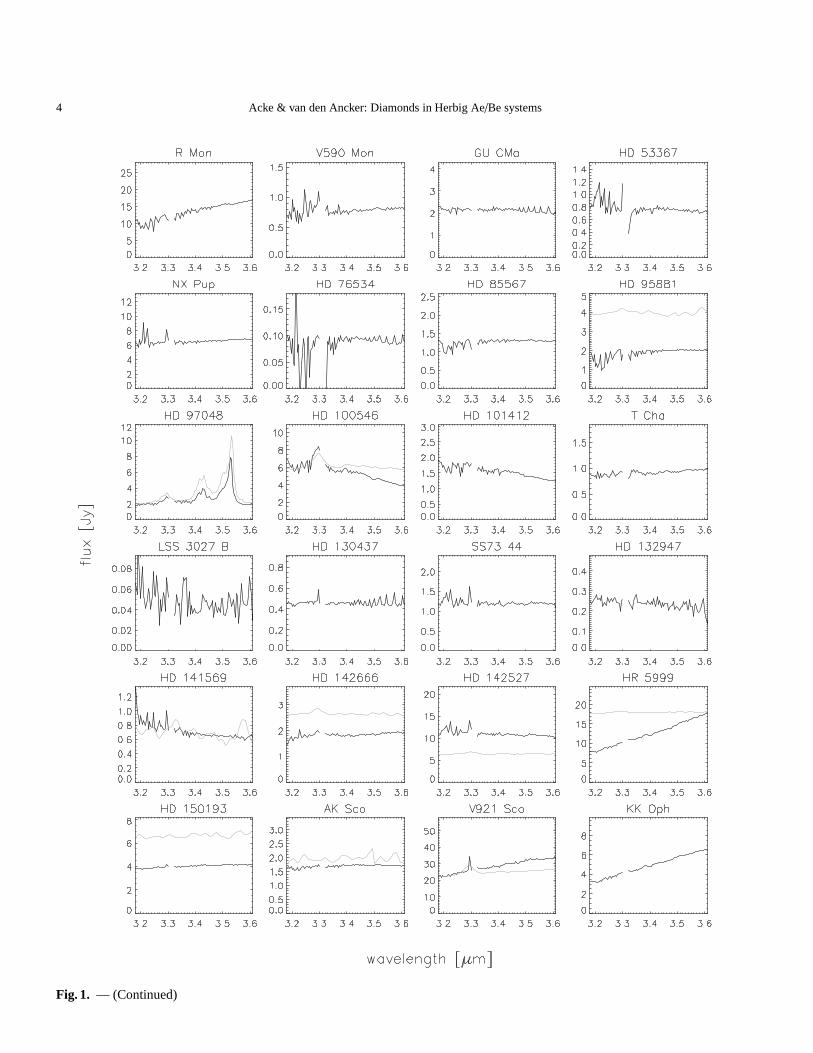
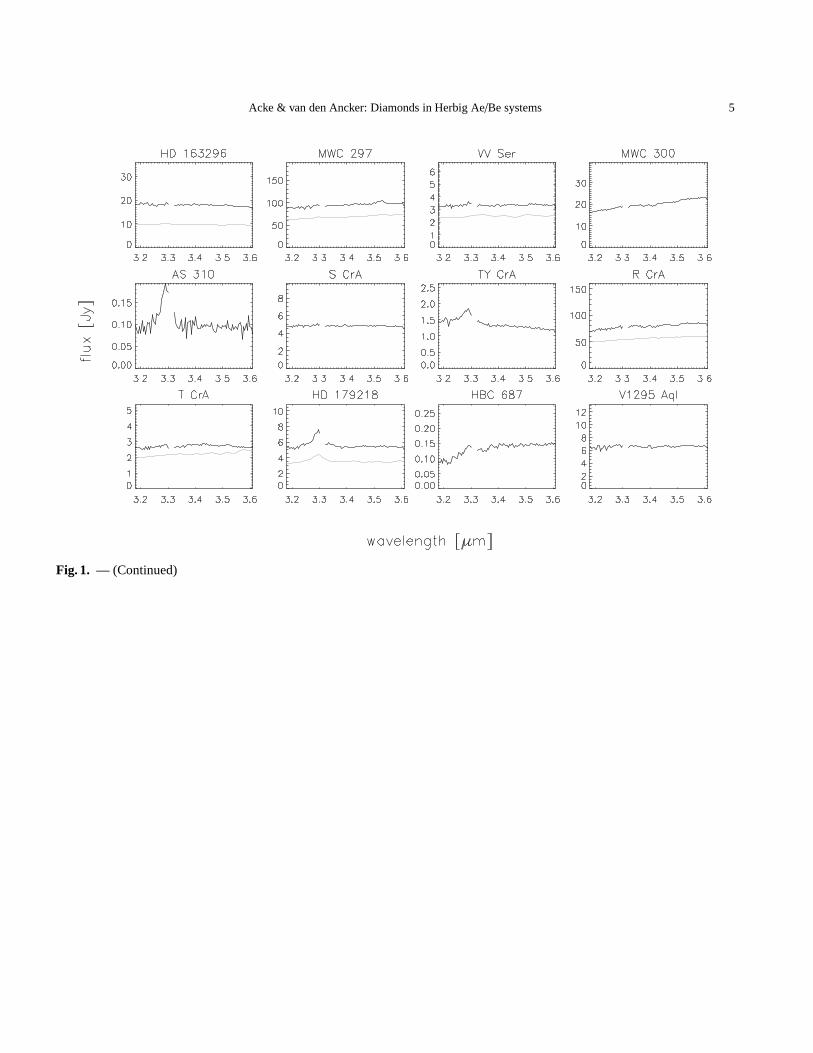
Fig. 1. The ISAAC spectra of the sample stars, rebinned to a resolution of 750. When available, ISO−SWS (R = 150) or PHT−S(R ∼ 90) spectra are overplotted in grey. The part of the ISAAC spectrum between 3.3 and 3.32µm has been excluded. This partis unreliable due to the high atmospheric opacity in this wavelength range.
4 Acke & van den Ancker: Diamonds in Herbig Ae/Be systems
Fig. 1. — (Continued)
Acke & van den Ancker: Diamonds in Herbig Ae/Be systems 5
Fig. 1. — (Continued)
6 Acke & van den Ancker: Diamonds in Herbig Ae/Be systems
Inherent to the reduction method, some residuals of tel-luric lines remain present in the final spectra. This is never-theless not dramatic for our survey. Because of the mediumspectral resolution of our ISAAC spectra (∼2300), the telluric-line residuals are very narrow compared to the typical width(FWHM∼0.03µm) of the PAH and nanodiamond features.Furthermore a bright 3.53µm source similar to HD 97048would be easily recognized, even without atmospheric correc-tions, due to the strength of the nanodiamond features.
The reduced ISAAC 3 micron spectra of the sample sourcesare presented in Fig. 1. We have rebinned the spectra to a spec-tral resolution of 750 for the sake of clarity. The broad PAH anddiamond features remain clearly visible. The sharp, unresolvedPfundδ line on the other hand is spread out over 20 pixels andis therefore undetectable in most of the spectra shown in thefigure. The smooth+rebin procedure makes that also the unre-solved telluric-line residuals are spread out. In regions whichare rich in telluric absorption lines, this may cause problems:the lines are overlapping each other and form absorptionbandsin the rebinned spectrum. This induces “absorption features”. Itis clear that, of the two wavelength regions, the 3.3µm spectrasuffer the most from telluric line absorption. The region be-tween 3.3 and 3.32µm has been cut out. The measured fluxin this region is close to zero in both science and standard-starobservations, due to strong telluric absorption. Divisionby theSTD spectrum induces a strong artefact in this wavelength in-terval. Note however that the PAH 3.3µm feature can still bediscerned, since the onset and peak position of its spectralsig-nature are located at shorter wavelengths.
When available, the ISO spectrum is overplotted in Fig. 1.The continuum flux levels of the ISAAC and ISO data arewithin a 30% error bar of the mean value of both for most tar-gets. The experimental error bar on the ratio of the ISAAC con-tinuum flux and the L-band magnitude —converted to the rightunits— is about 60%. The latter indicates the poor absolute fluxcalibration quality of the ISAAC spectra.
2.3. Characterizing the spectral features
Spectral features that appear in the 3 micron spectra are in thisanalysis characterized with a few parameters. The integratedline flux (in W m−2), full width at half maximum (FWHM, inµm), the peak flux (in Jy) and peak position (inµm) are de-termined. We have estimated the statistical error on these mea-surements based on the noise on the spectra. The error on theline fluxes due to uncertainties on the absolute flux level cal-ibration is estimated to be 60%. This error is not included inthe figures and tables presented in this paper. Note that theshape and the peak-over-continuum ratio of the detected fea-tures is not affected by the absolute calibration of the spectra.In Sect. 3 we discuss the observed spectral features and includea comparison with the ISO measurements described in AV04.
2.4. Classifying the spectral energy distributions
We have classified the sample targets into the two Meeus et al.(2001) groups based on the shape of the spectral energy dis-
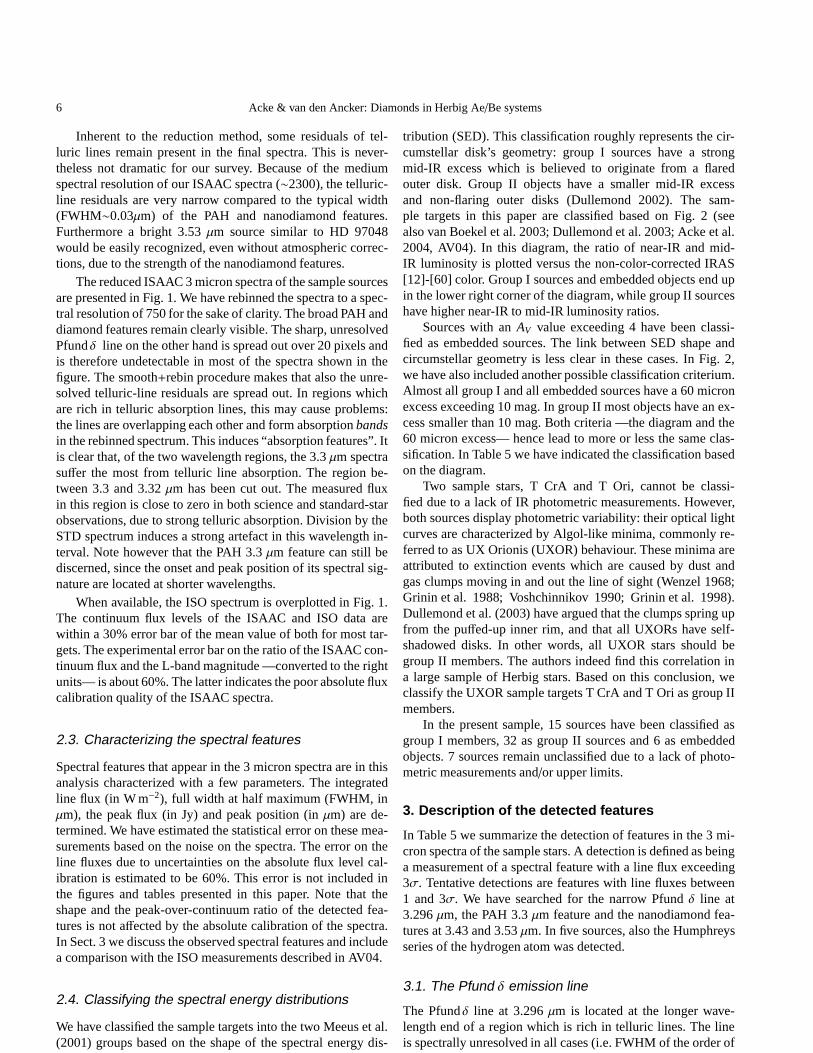
tribution (SED). This classification roughly represents the cir-cumstellar disk’s geometry: group I sources have a strongmid-IR excess which is believed to originate from a flaredouter disk. Group II objects have a smaller mid-IR excessand non-flaring outer disks (Dullemond 2002). The sam-ple targets in this paper are classified based on Fig. 2 (seealso van Boekel et al. 2003; Dullemond et al. 2003; Acke et al.2004, AV04). In this diagram, the ratio of near-IR and mid-IR luminosity is plotted versus the non-color-corrected IRAS[12]-[60] color. Group I sources and embedded objects end upin the lower right corner of the diagram, while group II sourceshave higher near-IR to mid-IR luminosity ratios.
Sources with anAV value exceeding 4 have been classi-fied as embedded sources. The link between SED shape andcircumstellar geometry is less clear in these cases. In Fig.2,we have also included another possible classification criterium.Almost all group I and all embedded sources have a 60 micronexcess exceeding 10 mag. In group II most objects have an ex-cess smaller than 10 mag. Both criteria —the diagram and the60 micron excess— hence lead to more or less the same clas-sification. In Table 5 we have indicated the classification basedon the diagram.
Two sample stars, T CrA and T Ori, cannot be classi-fied due to a lack of IR photometric measurements. However,both sources display photometric variability: their optical lightcurves are characterized by Algol-like minima, commonly re-ferred to as UX Orionis (UXOR) behaviour. These minima areattributed to extinction events which are caused by dust andgas clumps moving in and out the line of sight (Wenzel 1968;Grinin et al. 1988; Voshchinnikov 1990; Grinin et al. 1998).Dullemond et al. (2003) have argued that the clumps spring upfrom the puffed-up inner rim, and that all UXORs have self-shadowed disks. In other words, all UXOR stars should begroup II members. The authors indeed find this correlation ina large sample of Herbig stars. Based on this conclusion, weclassify the UXOR sample targets T CrA and T Ori as group IImembers.
In the present sample, 15 sources have been classified asgroup I members, 32 as group II sources and 6 as embeddedobjects. 7 sources remain unclassified due to a lack of photo-metric measurements and/or upper limits.
3. Description of the detected features
In Table 5 we summarize the detection of features in the 3 mi-cron spectra of the sample stars. A detection is defined as beinga measurement of a spectral feature with a line flux exceeding3σ. Tentative detections are features with line fluxes between1 and 3σ. We have searched for the narrow Pfundδ line at3.296µm, the PAH 3.3µm feature and the nanodiamond fea-tures at 3.43 and 3.53µm. In five sources, also the Humphreysseries of the hydrogen atom was detected.
3.1. The Pfund δ emission line
The Pfundδ line at 3.296µm is located at the longer wave-length end of a region which is rich in telluric lines. The lineis spectrally unresolved in all cases (i.e. FWHM of the orderof
Acke & van den Ancker: Diamonds in Herbig Ae/Be systems 7
Fig. 2. The classification diagram of the sample targets.Sources withAV values above 4 are definied to be embeddedsources (grey squares). Objects on the left side of the empiricalseparation line (dashed line) are group II members, on the rightside group I. A classification solely based on the 60 micronexcess gives almost equal results. Objects with a 60 micron ex-cess exceeding 10 mag (black diamonds) are almost all group Isources, while targets with an excess below 10 mag (grey di-amonds) belong mostly to group II. Some targets have beenmarked with their sequence number (see Table 5); those are the(tentative) nanodiamond sources (see Sect. 3.4).
15Å or equivalently 130 km s−1). We have determined the char-acterizing parameters of the Pfδ line at the full resolution of theISAAC spectra (R=2300). The error bars on the line flux areconsequently rather large. They are calculated from the noisein the 3.3 micron region of the reduced spectrum. The error in-cludes the photon noise, as well as the noise induced by telluricline residuals. The latter is by far more important.
In the ISAAC sample of 60 sources, we detected thePfδ emission line in 16 targets or 27%. Four more objects ten-tatively display this feature, which adds up to a detection rateof 33% in this sample.
The Pfundδ line has been (tentatively) detected inonly three group I sources (HD 259431, HD 100546 andHD 142527). The detection rate in this group hence is 13−20%.In group II, 10−13 sources (tentatively) display the feature(31−41%), while half of the six embedded sample stars showthe emission line (50%). In the group of unclassified samplestars, the detection rate is 14%. The Pfundδ line is more de-tected in group II and in the embedded sources, than in group I.This difference is not statistically significant on a 5% level.
3.2. The Humphreys series
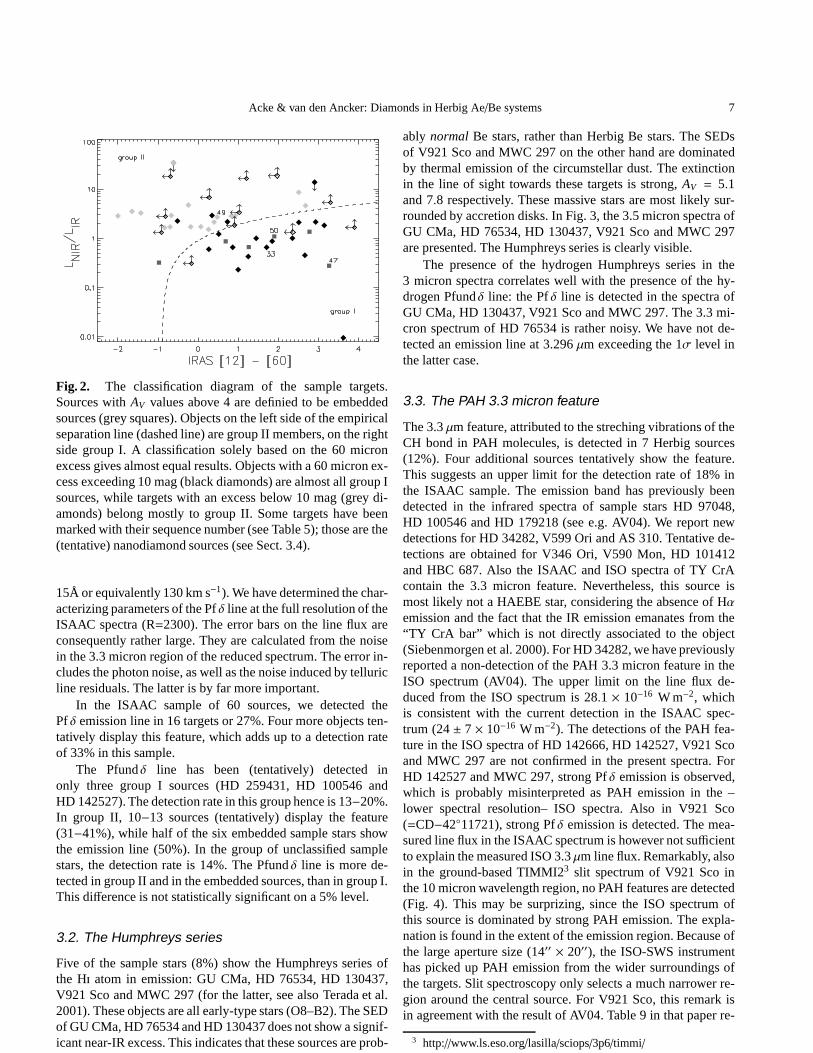
Five of the sample stars (8%) show the Humphreys series ofthe H atom in emission: GU CMa, HD 76534, HD 130437,V921 Sco and MWC 297 (for the latter, see also Terada et al.2001). These objects are all early-type stars (O8–B2). The SEDof GU CMa, HD 76534 and HD 130437 does not show a signif-icant near-IR excess. This indicates that these sources areprob-
ably normal Be stars, rather than Herbig Be stars. The SEDsof V921 Sco and MWC 297 on the other hand are dominatedby thermal emission of the circumstellar dust. The extinctionin the line of sight towards these targets is strong,AV = 5.1and 7.8 respectively. These massive stars are most likely sur-rounded by accretion disks. In Fig. 3, the 3.5 micron spectraofGU CMa, HD 76534, HD 130437, V921 Sco and MWC 297are presented. The Humphreys series is clearly visible.
The presence of the hydrogen Humphreys series in the3 micron spectra correlates well with the presence of the hy-drogen Pfundδ line: the Pfδ line is detected in the spectra ofGU CMa, HD 130437, V921 Sco and MWC 297. The 3.3 mi-cron spectrum of HD 76534 is rather noisy. We have not de-tected an emission line at 3.296µm exceeding the 1σ level inthe latter case.
3.3. The PAH 3.3 micron feature
The 3.3µm feature, attributed to the streching vibrations of theCH bond in PAH molecules, is detected in 7 Herbig sources(12%). Four additional sources tentatively show the feature.This suggests an upper limit for the detection rate of 18% inthe ISAAC sample. The emission band has previously beendetected in the infrared spectra of sample stars HD 97048,HD 100546 and HD 179218 (see e.g. AV04). We report newdetections for HD 34282, V599 Ori and AS 310. Tentative de-tections are obtained for V346 Ori, V590 Mon, HD 101412and HBC 687. Also the ISAAC and ISO spectra of TY CrAcontain the 3.3 micron feature. Nevertheless, this source ismost likely not a HAEBE star, considering the absence of Hαemission and the fact that the IR emission emanates from the“TY CrA bar” which is not directly associated to the object(Siebenmorgen et al. 2000). For HD 34282, we have previouslyreported a non-detection of the PAH 3.3 micron feature in theISO spectrum (AV04). The upper limit on the line flux de-duced from the ISO spectrum is 28.1 × 10⁻¹⁶ W m−2, whichis consistent with the current detection in the ISAAC spec-trum (24± 7 × 10⁻¹⁶ W m−2). The detections of the PAH fea-ture in the ISO spectra of HD 142666, HD 142527, V921 Scoand MWC 297 are not confirmed in the present spectra. ForHD 142527 and MWC 297, strong Pfδ emission is observed,which is probably misinterpreted as PAH emission in the –lower spectral resolution– ISO spectra. Also in V921 Sco(=CD−42◦11721), strong Pfδ emission is detected. The mea-sured line flux in the ISAAC spectrum is however not sufficientto explain the measured ISO 3.3µm line flux. Remarkably, alsoin the ground-based TIMMI23 slit spectrum of V921 Sco inthe 10 micron wavelength region, no PAH features are detected(Fig. 4). This may be surprizing, since the ISO spectrum ofthis source is dominated by strong PAH emission. The expla-nation is found in the extent of the emission region. Becauseofthe large aperture size (14′′ × 20′′), the ISO-SWS instrumenthas picked up PAH emission from the wider surroundings ofthe targets. Slit spectroscopy only selects a much narrowerre-gion around the central source. For V921 Sco, this remark isin agreement with the result of AV04. Table 9 in that paper re-
3 http://www.ls.eso.org/lasilla/sciops/3p6/timmi/
8 Acke & van den Ancker: Diamonds in Herbig Ae/Be systems
Fig. 3. The ISAAC 3.5 micron spectra of GU CMa, HD 76534, HD 130437, V921 Sco and MWC 297. The Humphreys series ofthe H atom are indicated with vertical lines. The spectra in the top panels are clearly different from the spectra in the bottom pan-els. The first 3 targets are most likely normal Be stars, with the 3 micron continuum flux emanating from the stellar photosphere.The latter two are early-type accretion-disk systems. The near-IR continuum is due to hot circumstellar dust.
veals that the luminosity of the observed PAH emission in thissource roughly corresponds to what one may expect from a ten-uous halo. No emission features are detected in the 3.3 micronregion of the ISAAC spectrum of HD 142666, possibly indi-cating that also in this case, the PAH emission is extended.
In Fig. 5 we have compared the peak-over-continuum ratioof the PAH 3.3 micron feature measured in the ISO and ISAACspectrum. The measurements/upper limits of HD 34282 (#2),HD 100546 (#34) and HD 179218 (#58) agree within the er-ror bars. For HD 142527 (#43) and MWC 297 (#50), strongPfundδ emission led to a false PAH 3.3µm detection in the ISOspectrum. In the previous paragraph we argued that the PAHemission in HD 142666 (#42) and V921 Sco (#47) is likelyextended, and therefore not detected in the ISAAC spectrum.The ISO spectra of HD 97048 show significantly stronger PAH3.3, NANO 3.4 and NANO 3.5µm features than the ISAACspectrum. The relative ratios between the ISO and ISAAC linefluxes are 2.9±0.7, 2.4±0.2 and 1.65±0.02 respectively. TheISO aperture is many times larger than the slit width of ISAAC.The PAH and nanodiamond emission emanates from the cir-cumstellar disk’s surface. The estimated extent is of the order ofa few tens of an arcsecond (van Boekel et al. 2004; Habart et al.2004a,b). This extent, smeared out by the atmospheric seeing,could lead to a loss of PAH and NANO emission in the ISAAC
spectrum, relative to the ISO spectrum. The underlying con-tinuum flux, which originates from the very inner parts of thedisk, is less sensitive to this effect. This potentially explains theweakness of the features in the ISAAC spectrum. Alternatively,the PAH and NANO features might display temporal variabil-ity. This variability has not been noted in the five ISO 3 micronspectra which are available for this source, however. TheseISOobservations span about one year and a half (AV04).
The ISAAC detection rate of the PAH 3.3µm feature in thegroup I sources is 36% (50% including tentative detections).The rate in group II is much lower (0−3% respectively). APAH 3.3µm feature was detected in the spectrum of the em-bedded source V599 Ori (17%). In the computation of thesenumbers, we have excluded GU CMa, HD 76534, HD 130437and TY CrA, which are most likely no Herbig stars. The highand very low detection rate in respectively group I and II con-firms the main conclusion of AV04. The PAH features emanatefrom the surface of a flared circumstellar disk. Only group Isources have a flared disk and are expected to display strongPAH features (Habart et al. 2004a, AV04). In Table 1 we com-pare the detection rates of the PAH 3.3 micron feature in theISO sample to the rates in the present ISAAC sample. TheISO sample contains 16 group I, 22 group II and 7 embed-
Acke & van den Ancker: Diamonds in Herbig Ae/Be systems 9
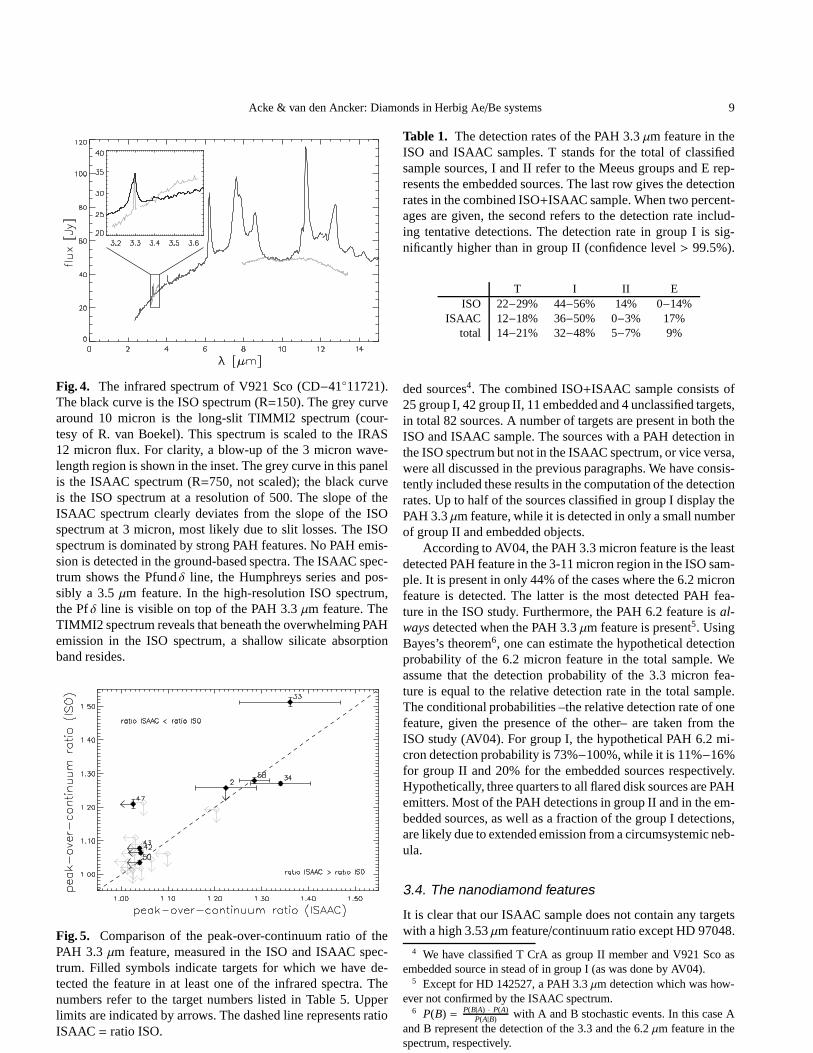
Fig. 4. The infrared spectrum of V921 Sco (CD−41◦11721).The black curve is the ISO spectrum (R=150). The grey curvearound 10 micron is the long-slit TIMMI2 spectrum (cour-tesy of R. van Boekel). This spectrum is scaled to the IRAS12 micron flux. For clarity, a blow-up of the 3 micron wave-length region is shown in the inset. The grey curve in this panelis the ISAAC spectrum (R=750, not scaled); the black curveis the ISO spectrum at a resolution of 500. The slope of theISAAC spectrum clearly deviates from the slope of the ISOspectrum at 3 micron, most likely due to slit losses. The ISOspectrum is dominated by strong PAH features. No PAH emis-sion is detected in the ground-based spectra. The ISAAC spec-trum shows the Pfundδ line, the Humphreys series and pos-sibly a 3.5µm feature. In the high-resolution ISO spectrum,the Pfδ line is visible on top of the PAH 3.3µm feature. TheTIMMI2 spectrum reveals that beneath the overwhelming PAHemission in the ISO spectrum, a shallow silicate absorptionband resides.
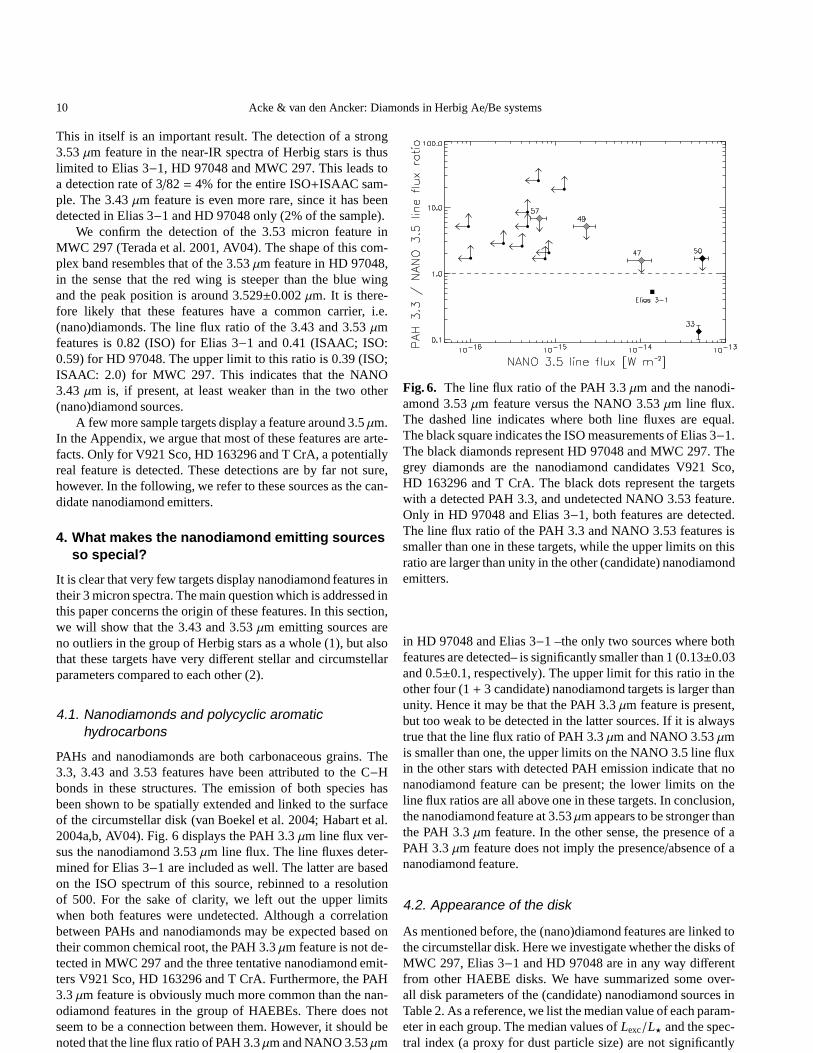
Fig. 5. Comparison of the peak-over-continuum ratio of thePAH 3.3µm feature, measured in the ISO and ISAAC spec-trum. Filled symbols indicate targets for which we have de-tected the feature in at least one of the infrared spectra. Thenumbers refer to the target numbers listed in Table 5. Upperlimits are indicated by arrows. The dashed line represents ratioISAAC = ratio ISO.
Table 1. The detection rates of the PAH 3.3µm feature in theISO and ISAAC samples. T stands for the total of classifiedsample sources, I and II refer to the Meeus groups and E rep-resents the embedded sources. The last row gives the detectionrates in the combined ISO+ISAAC sample. When two percent-ages are given, the second refers to the detection rate includ-ing tentative detections. The detection rate in group I is sig-nificantly higher than in group II (confidence level> 99.5%).
T I II EISO 22−29% 44−56% 14% 0−14%
ISAAC 12−18% 36−50% 0−3% 17%total 14−21% 32−48% 5−7% 9%
ded sources4. The combined ISO+ISAAC sample consists of25 group I, 42 group II, 11 embedded and 4 unclassified targets,in total 82 sources. A number of targets are present in both theISO and ISAAC sample. The sources with a PAH detection inthe ISO spectrum but not in the ISAAC spectrum, or vice versa,were all discussed in the previous paragraphs. We have consis-tently included these results in the computation of the detectionrates. Up to half of the sources classified in group I display thePAH 3.3µm feature, while it is detected in only a small numberof group II and embedded objects.
According to AV04, the PAH 3.3 micron feature is the leastdetected PAH feature in the 3-11 micron region in the ISO sam-ple. It is present in only 44% of the cases where the 6.2 micronfeature is detected. The latter is the most detected PAH fea-ture in the ISO study. Furthermore, the PAH 6.2 feature isal-ways detected when the PAH 3.3µm feature is present5. UsingBayes’s theorem6, one can estimate the hypothetical detectionprobability of the 6.2 micron feature in the total sample. Weassume that the detection probability of the 3.3 micron fea-ture is equal to the relative detection rate in the total sample.The conditional probabilities –the relative detection rate of onefeature, given the presence of the other– are taken from theISO study (AV04). For group I, the hypothetical PAH 6.2 mi-cron detection probability is 73%−100%, while it is 11%−16%for group II and 20% for the embedded sources respectively.Hypothetically, three quarters to all flared disk sources are PAHemitters. Most of the PAH detections in group II and in the em-bedded sources, as well as a fraction of the group I detections,are likely due to extended emission from a circumsystemic neb-ula.
3.4. The nanodiamond features
It is clear that our ISAAC sample does not contain any targetswith a high 3.53µm feature/continuum ratio except HD 97048.
4 We have classified T CrA as group II member and V921 Sco asembedded source in stead of in group I (as was done by AV04).
5 Except for HD 142527, a PAH 3.3µm detection which was how-ever not confirmed by the ISAAC spectrum.
6 P(B) = P(B|A) · P(A)P(A|B) with A and B stochastic events. In this case A
and B represent the detection of the 3.3 and the 6.2µm feature in thespectrum, respectively.
10 Acke & van den Ancker: Diamonds in Herbig Ae/Be systems
This in itself is an important result. The detection of a strong3.53µm feature in the near-IR spectra of Herbig stars is thuslimited to Elias 3−1, HD 97048 and MWC 297. This leads toa detection rate of 3/82= 4% for the entire ISO+ISAAC sam-ple. The 3.43µm feature is even more rare, since it has beendetected in Elias 3−1 and HD 97048 only (2% of the sample).
We confirm the detection of the 3.53 micron feature inMWC 297 (Terada et al. 2001, AV04). The shape of this com-plex band resembles that of the 3.53µm feature in HD 97048,in the sense that the red wing is steeper than the blue wingand the peak position is around 3.529±0.002µm. It is there-fore likely that these features have a common carrier, i.e.(nano)diamonds. The line flux ratio of the 3.43 and 3.53µmfeatures is 0.82 (ISO) for Elias 3−1 and 0.41 (ISAAC; ISO:0.59) for HD 97048. The upper limit to this ratio is 0.39 (ISO;ISAAC: 2.0) for MWC 297. This indicates that the NANO3.43 µm is, if present, at least weaker than in the two other(nano)diamond sources.
A few more sample targets display a feature around 3.5µm.In the Appendix, we argue that most of these features are arte-facts. Only for V921 Sco, HD 163296 and T CrA, a potentiallyreal feature is detected. These detections are by far not sure,however. In the following, we refer to these sources as the can-didate nanodiamond emitters.
4. What makes the nanodiamond emitting sourcesso special?
It is clear that very few targets display nanodiamond features intheir 3 micron spectra. The main question which is addressedinthis paper concerns the origin of these features. In this section,we will show that the 3.43 and 3.53µm emitting sources areno outliers in the group of Herbig stars as a whole (1), but alsothat these targets have very different stellar and circumstellarparameters compared to each other (2).
4.1. Nanodiamonds and polycyclic aromatichydrocarbons
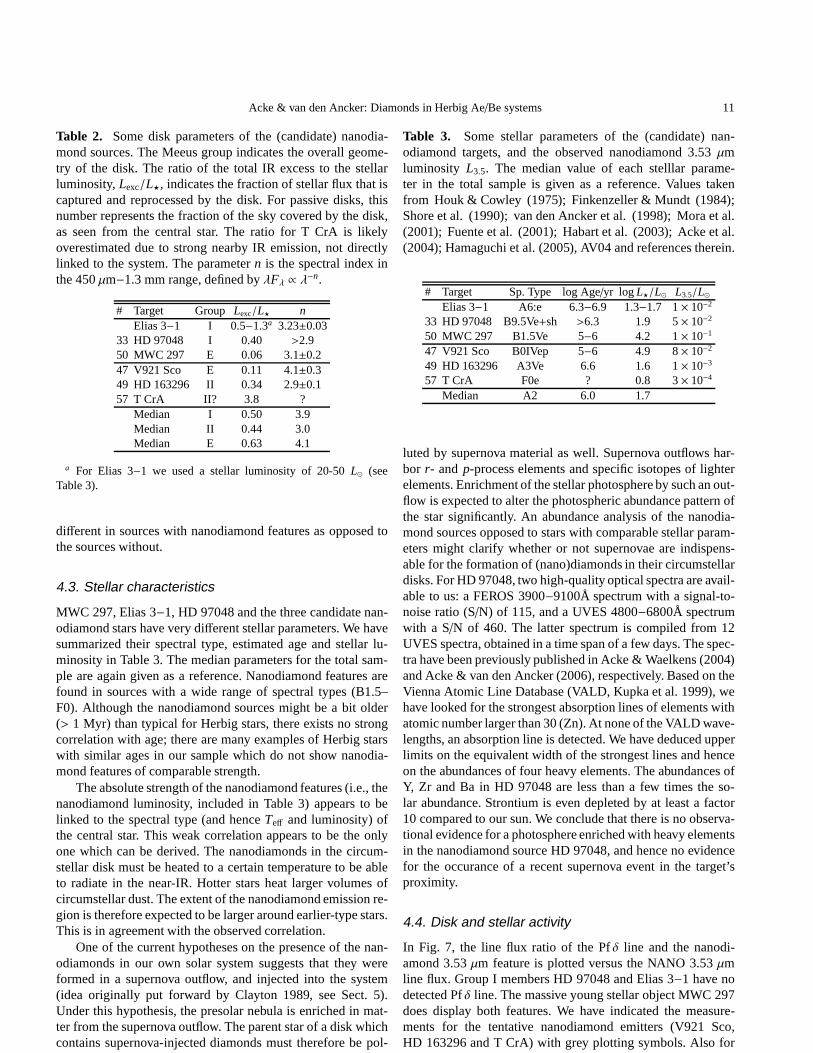
PAHs and nanodiamonds are both carbonaceous grains. The3.3, 3.43 and 3.53 features have been attributed to the C−Hbonds in these structures. The emission of both species hasbeen shown to be spatially extended and linked to the surfaceof the circumstellar disk (van Boekel et al. 2004; Habart et al.2004a,b, AV04). Fig. 6 displays the PAH 3.3µm line flux ver-sus the nanodiamond 3.53µm line flux. The line fluxes deter-mined for Elias 3−1 are included as well. The latter are basedon the ISO spectrum of this source, rebinned to a resolutionof 500. For the sake of clarity, we left out the upper limitswhen both features were undetected. Although a correlationbetween PAHs and nanodiamonds may be expected based ontheir common chemical root, the PAH 3.3µm feature is not de-tected in MWC 297 and the three tentative nanodiamond emit-ters V921 Sco, HD 163296 and T CrA. Furthermore, the PAH3.3µm feature is obviously much more common than the nan-odiamond features in the group of HAEBEs. There does notseem to be a connection between them. However, it should benoted that the line flux ratio of PAH 3.3µm and NANO 3.53µm
Fig. 6. The line flux ratio of the PAH 3.3µm and the nanodi-amond 3.53µm feature versus the NANO 3.53µm line flux.The dashed line indicates where both line fluxes are equal.The black square indicates the ISO measurements of Elias 3−1.The black diamonds represent HD 97048 and MWC 297. Thegrey diamonds are the nanodiamond candidates V921 Sco,HD 163296 and T CrA. The black dots represent the targetswith a detected PAH 3.3, and undetected NANO 3.53 feature.Only in HD 97048 and Elias 3−1, both features are detected.The line flux ratio of the PAH 3.3 and NANO 3.53 features issmaller than one in these targets, while the upper limits on thisratio are larger than unity in the other (candidate) nanodiamondemitters.
in HD 97048 and Elias 3−1 –the only two sources where bothfeatures are detected– is significantly smaller than 1 (0.13±0.03and 0.5±0.1, respectively). The upper limit for this ratio in theother four (1+ 3 candidate) nanodiamond targets is larger thanunity. Hence it may be that the PAH 3.3µm feature is present,but too weak to be detected in the latter sources. If it is alwaystrue that the line flux ratio of PAH 3.3µm and NANO 3.53µmis smaller than one, the upper limits on the NANO 3.5 line fluxin the other stars with detected PAH emission indicate that nonanodiamond feature can be present; the lower limits on theline flux ratios are all above one in these targets. In conclusion,the nanodiamond feature at 3.53µm appears to be stronger thanthe PAH 3.3µm feature. In the other sense, the presence of aPAH 3.3µm feature does not imply the presence/absence of ananodiamond feature.
4.2. Appearance of the disk
As mentioned before, the (nano)diamond features are linkedtothe circumstellar disk. Here we investigate whether the disks ofMWC 297, Elias 3−1 and HD 97048 are in any way differentfrom other HAEBE disks. We have summarized some over-all disk parameters of the (candidate) nanodiamond sourcesinTable 2. As a reference, we list the median value of each param-eter in each group. The median values ofLexc/L⋆ and the spec-tral index (a proxy for dust particle size) are not significantly
Acke & van den Ancker: Diamonds in Herbig Ae/Be systems 11
Table 2. Some disk parameters of the (candidate) nanodia-mond sources. The Meeus group indicates the overall geome-try of the disk. The ratio of the total IR excess to the stellarluminosity,Lexc/L⋆, indicates the fraction of stellar flux that iscaptured and reprocessed by the disk. For passive disks, thisnumber represents the fraction of the sky covered by the disk,as seen from the central star. The ratio for T CrA is likelyoverestimated due to strong nearby IR emission, not directlylinked to the system. The parametern is the spectral index inthe 450µm−1.3 mm range, defined byλFλ ∝ λ−n.
# Target Group Lexc/L⋆ nElias 3−1 I 0.5−1.3a 3.23±0.03
33 HD 97048 I 0.40 >2.950 MWC 297 E 0.06 3.1±0.247 V921 Sco E 0.11 4.1±0.349 HD 163296 II 0.34 2.9±0.157 T CrA II? 3.8 ?
Median I 0.50 3.9Median II 0.44 3.0Median E 0.63 4.1
a For Elias 3−1 we used a stellar luminosity of 20-50L⊙ (seeTable 3).
different in sources with nanodiamond features as opposed tothe sources without.
4.3. Stellar characteristics
MWC 297, Elias 3−1, HD 97048 and the three candidate nan-odiamond stars have very different stellar parameters. We havesummarized their spectral type, estimated age and stellar lu-minosity in Table 3. The median parameters for the total sam-ple are again given as a reference. Nanodiamond features arefound in sources with a wide range of spectral types (B1.5–F0). Although the nanodiamond sources might be a bit older(> 1 Myr) than typical for Herbig stars, there exists no strongcorrelation with age; there are many examples of Herbig starswith similar ages in our sample which do not show nanodia-mond features of comparable strength.
The absolute strength of the nanodiamond features (i.e., thenanodiamond luminosity, included in Table 3) appears to belinked to the spectral type (and henceTeff and luminosity) ofthe central star. This weak correlation appears to be the onlyone which can be derived. The nanodiamonds in the circum-stellar disk must be heated to a certain temperature to be ableto radiate in the near-IR. Hotter stars heat larger volumes ofcircumstellar dust. The extent of the nanodiamond emissionre-gion is therefore expected to be larger around earlier-typestars.This is in agreement with the observed correlation.
One of the current hypotheses on the presence of the nan-odiamonds in our own solar system suggests that they wereformed in a supernova outflow, and injected into the system(idea originally put forward by Clayton 1989, see Sect. 5).Under this hypothesis, the presolar nebula is enriched in mat-ter from the supernova outflow. The parent star of a disk whichcontains supernova-injected diamonds must therefore be pol-
Table 3. Some stellar parameters of the (candidate) nan-odiamond targets, and the observed nanodiamond 3.53µmluminosity L3.5. The median value of each stelllar parame-ter in the total sample is given as a reference. Values takenfrom Houk & Cowley (1975); Finkenzeller & Mundt (1984);Shore et al. (1990); van den Ancker et al. (1998); Mora et al.(2001); Fuente et al. (2001); Habart et al. (2003); Acke et al.(2004); Hamaguchi et al. (2005), AV04 and references therein.
# Target Sp. Type log Age/yr log L⋆/L⊙ L3.5/L⊙Elias 3−1 A6:e 6.3−6.9 1.3−1.7 1× 10⁻²
33 HD 97048 B9.5Ve+sh >6.3 1.9 5× 10⁻²
50 MWC 297 B1.5Ve 5−6 4.2 1× 10⁻¹
47 V921 Sco B0IVep 5−6 4.9 8× 10⁻²
49 HD 163296 A3Ve 6.6 1.6 1× 10⁻³
57 T CrA F0e ? 0.8 3× 10⁻⁴
Median A2 6.0 1.7
luted by supernova material as well. Supernova outflows har-bor r- and p-process elements and specific isotopes of lighterelements. Enrichment of the stellar photosphere by such an out-flow is expected to alter the photospheric abundance patternofthe star significantly. An abundance analysis of the nanodia-mond sources opposed to stars with comparable stellar param-eters might clarify whether or not supernovae are indispens-able for the formation of (nano)diamonds in their circumstellardisks. For HD 97048, two high-quality optical spectra are avail-able to us: a FEROS 3900−9100Å spectrum with a signal-to-noise ratio (S/N) of 115, and a UVES 4800−6800Å spectrumwith a S/N of 460. The latter spectrum is compiled from 12UVES spectra, obtained in a time span of a few days. The spec-tra have been previously published in Acke & Waelkens (2004)and Acke & van den Ancker (2006), respectively. Based on theVienna Atomic Line Database (VALD, Kupka et al. 1999), wehave looked for the strongest absorption lines of elements withatomic number larger than 30 (Zn). At none of the VALD wave-lengths, an absorption line is detected. We have deduced upperlimits on the equivalent width of the strongest lines and henceon the abundances of four heavy elements. The abundances ofY, Zr and Ba in HD 97048 are less than a few times the so-lar abundance. Strontium is even depleted by at least a factor10 compared to our sun. We conclude that there is no observa-tional evidence for a photosphere enriched with heavy elementsin the nanodiamond source HD 97048, and hence no evidencefor the occurance of a recent supernova event in the target’sproximity.
4.4. Disk and stellar activity
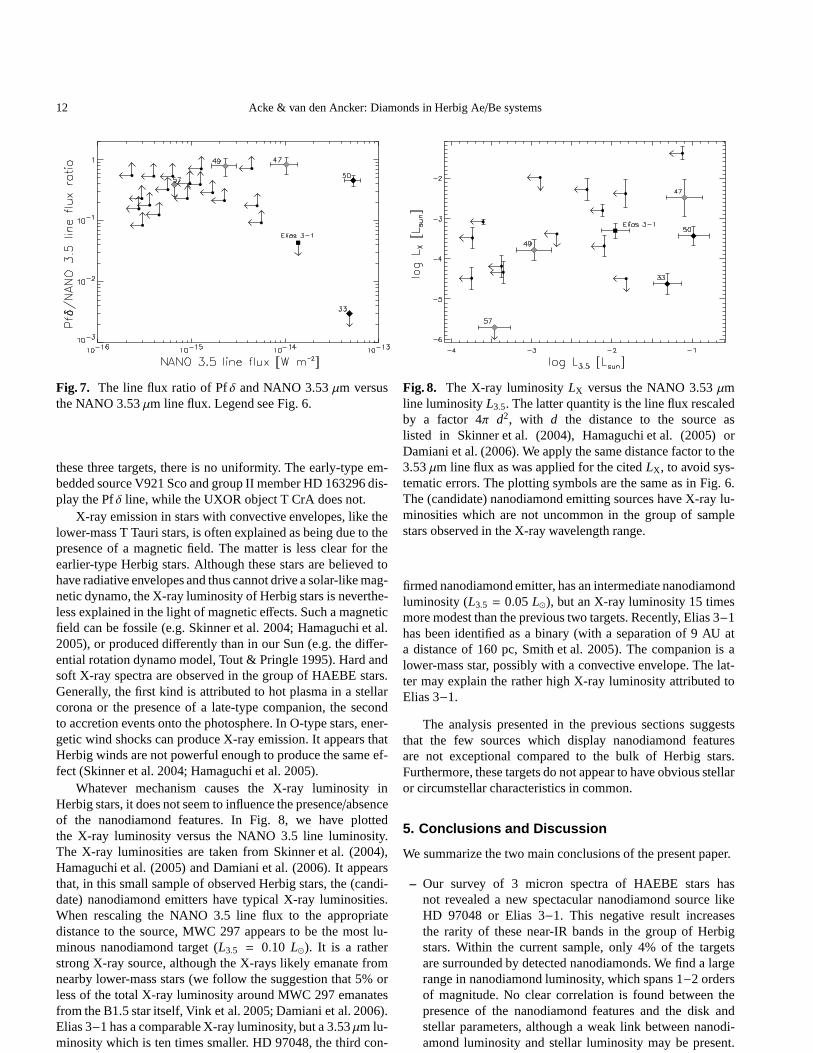
In Fig. 7, the line flux ratio of the Pfδ line and the nanodi-amond 3.53µm feature is plotted versus the NANO 3.53µmline flux. Group I members HD 97048 and Elias 3−1 have nodetected Pfδ line. The massive young stellar object MWC 297does display both features. We have indicated the measure-ments for the tentative nanodiamond emitters (V921 Sco,HD 163296 and T CrA) with grey plotting symbols. Also for
12 Acke & van den Ancker: Diamonds in Herbig Ae/Be systems
Fig. 7. The line flux ratio of Pfδ and NANO 3.53µm versusthe NANO 3.53µm line flux. Legend see Fig. 6.
these three targets, there is no uniformity. The early-typeem-bedded source V921 Sco and group II member HD 163296 dis-play the Pfδ line, while the UXOR object T CrA does not.
X-ray emission in stars with convective envelopes, like thelower-mass T Tauri stars, is often explained as being due to thepresence of a magnetic field. The matter is less clear for theearlier-type Herbig stars. Although these stars are believed tohave radiative envelopes and thus cannot drive a solar-likemag-netic dynamo, the X-ray luminosity of Herbig stars is neverthe-less explained in the light of magnetic effects. Such a magneticfield can be fossile (e.g. Skinner et al. 2004; Hamaguchi et al.2005), or produced differently than in our Sun (e.g. the differ-ential rotation dynamo model, Tout & Pringle 1995). Hard andsoft X-ray spectra are observed in the group of HAEBE stars.Generally, the first kind is attributed to hot plasma in a stellarcorona or the presence of a late-type companion, the secondto accretion events onto the photosphere. In O-type stars, ener-getic wind shocks can produce X-ray emission. It appears thatHerbig winds are not powerful enough to produce the same ef-fect (Skinner et al. 2004; Hamaguchi et al. 2005).
Whatever mechanism causes the X-ray luminosity inHerbig stars, it does not seem to influence the presence/absenceof the nanodiamond features. In Fig. 8, we have plottedthe X-ray luminosity versus the NANO 3.5 line luminosity.The X-ray luminosities are taken from Skinner et al. (2004),Hamaguchi et al. (2005) and Damiani et al. (2006). It appearsthat, in this small sample of observed Herbig stars, the (candi-date) nanodiamond emitters have typical X-ray luminosities.When rescaling the NANO 3.5 line flux to the appropriatedistance to the source, MWC 297 appears to be the most lu-minous nanodiamond target (L3.5 = 0.10 L⊙). It is a ratherstrong X-ray source, although the X-rays likely emanate fromnearby lower-mass stars (we follow the suggestion that 5% orless of the total X-ray luminosity around MWC 297 emanatesfrom the B1.5 star itself, Vink et al. 2005; Damiani et al. 2006).Elias 3−1 has a comparable X-ray luminosity, but a 3.53µm lu-minosity which is ten times smaller. HD 97048, the third con-
Fig. 8. The X-ray luminosityLX versus the NANO 3.53µmline luminosityL3.5. The latter quantity is the line flux rescaledby a factor 4π d2, with d the distance to the source aslisted in Skinner et al. (2004), Hamaguchi et al. (2005) orDamiani et al. (2006). We apply the same distance factor to the3.53µm line flux as was applied for the citedLX , to avoid sys-tematic errors. The plotting symbols are the same as in Fig. 6.The (candidate) nanodiamond emitting sources have X-ray lu-minosities which are not uncommon in the group of samplestars observed in the X-ray wavelength range.
firmed nanodiamond emitter, has an intermediate nanodiamondluminosity (L3.5 = 0.05 L⊙), but an X-ray luminosity 15 timesmore modest than the previous two targets. Recently, Elias 3−1has been identified as a binary (with a separation of 9 AU ata distance of 160 pc, Smith et al. 2005). The companion is alower-mass star, possibly with a convective envelope. The lat-ter may explain the rather high X-ray luminosity attributedtoElias 3−1.
The analysis presented in the previous sections suggeststhat the few sources which display nanodiamond featuresare not exceptional compared to the bulk of Herbig stars.Furthermore, these targets do not appear to have obvious stellaror circumstellar characteristics in common.
5. Conclusions and Discussion
We summarize the two main conclusions of the present paper.
– Our survey of 3 micron spectra of HAEBE stars hasnot revealed a new spectacular nanodiamond source likeHD 97048 or Elias 3−1. This negative result increasesthe rarity of these near-IR bands in the group of Herbigstars. Within the current sample, only 4% of the targetsare surrounded by detected nanodiamonds. We find a largerange in nanodiamond luminosity, which spans 1−2 ordersof magnitude. No clear correlation is found between thepresence of the nanodiamond features and the disk andstellar parameters, although a weak link between nanodi-amond luminosity and stellar luminosity may be present.
Acke & van den Ancker: Diamonds in Herbig Ae/Be systems 13
Furthermore, there does not appear to be a specific disk/starproperty which the nanodiamond sources have in common.We have shown that our findings are inconclusive with re-spect to the influence of the surroundings of the targets. Wedo not find any evidence for a correlation of nanodiamondemitters with the locations of known recent supernova rem-nants, nor do we find evidence for an enrichment in heavyelements of the photosphere of the system with the mostprominent nano-diamond features, HD 97048.
– Most to all Herbig stars with a flared disk are PAH emit-ters. This conclusion once again confirms the suggestionof Meeus et al. (2001) that PAH molecules can only be ex-cited in systems where they can capture direct stellar UVphotons. In the case of self-shadowed disks, the puffed-upinner rim casts a shadow over the outer disk, preventingthe PAH molecules from being heated by the central star.Our findings reinforce the results of AV04 and Habart et al.(2004a). The latter studies were based on ISO data. Dueto the large aperture sizes of the ISO instruments, it is diffi-cult to differentiate between PAH emission emanating fromthe disk surface, and contamination from the wider sur-roundings of the target. The present ISAAC data set, whichclearly confirms the correlation, is considerably more re-liable in this sense: both the narrow slit and the chop-nodtechnique, which allows for an efficient subtraction of con-stant background emission, reduce the possibility of confu-sion with extended PAH emission drastically.
Laboratory experiments have been instrumental in theidentification of the carriers of the 3 micron features(e.g. Guillois et al. 1999; Sheu et al. 2002; Jones et al. 2004;Mutschke et al. 2004). Currently, the astronomical spectracan be reproduced from the absorption spectra of films ofhydrogen-terminateddiamonds (Sheu et al. 2002). The spectralfeatures in the 3 micron range are due to CH-bond stretches (asis the PAH 3.3µm feature). The prominent peaks around 3.43and 3.53µm observed in HAEBE spectra can only be repro-duced when the diamonds are sufficiently large. Typical sizesfor the diamonds in HAEBE stars (∼50-100 nm) are 2 orders ofmagnitude larger than the nanodiamonds found in our solar sys-tem (e.g. Jones et al. 2004). The spectral features hence indi-cate the presence of large, hot hydrogen-terminated diamonds.
The question remains whether there are indeed no di-amonds in the majority of disks. It may be possible thatnanodiamonds of small sizes are present, but remain unde-tected, because their spectral signature is less pronounced (e.g.Sheu et al. 2002). Also diamonds which are not hydrogen-terminated are not detectable in the 3 micron region. Diamondsthat are stripped from hydrogen atoms are hence overlooked byour survey. A third possibility why (nano)diamonds can remainundetected is their exact location —and hence temperature—in the disk. Cool hydrogen-terminated diamonds will not radi-ate significantly in the near-IR. The absence of the 3 micronfeatures in the spectrum of a HAEBE system hence does notnecessarily mean that no (nano)diamonds are present.
In-situ formation or extraneous origin?
Diamond was the first presolar mineral to be identified in me-teorites (Lewis et al. 1987) and it has the highest relative abun-dance among carbonaceous grains. The diamond has been clas-sified as presolar based on the presence of a significant over-abundance of very heavy (Xe-H)and very light (Xe-L) Xeisotopes (together Xe-HL). The overabundance of this noble-gas carrier is expected to be produced byr- andp-process nu-cleosynthesis in supernovae. The link between the presenceofnanodiamonds and the xenon overabundance led to the hypoth-esis that the diamonds are formed in, and injected into the sys-tem by a supernova outflow (Clayton 1989). Isotope anomalieson other heavy elements such as Te and Pd also point to super-nova nucleosynthesis (Richter et al. 1998; Maas et al. 2001).
Recent analysis of60Fe isotopes in chondrites has clearlydemonstrated that a nearby type II supernova has contributedmaterial to the natal cloud from which our own solar systemformed (Mostefaoui et al. 2005; Tachibana et al. 2006). Thisprocess may have been important for planet formation, as thethe radioactive decay of60Fe into60Ni was an important heatsource for the early planetary melting and differentiation andkeeping asteroids thermally active for much longer than wouldbe possible from the decay of26Al alone.
Infrared spectroscopy has shown that solar-system dia-monds contain N and O, probably in chemical functionalgroups on their surfaces (Lewis et al. 1989; Mutschke et al.1995; Andersen et al. 1998; Jones et al. 2004). However, thesimilarity of C- and N-isotopes of these diamonds and the solarsystem as a whole supports the idea that not all solar-systemdi-amonds originate from supernovae and that the supernova con-tribution to the diamonds in our own solar system is probablynot very large. It thus remains unclear how the majority of thesolar-system diamonds has formed.
Although advocated by several recent studies (Kouchi et al.2005; Binette et al. 2005), the presence of nanodiamonds inthe interstellar medium remains controversial. The absence ofobservable 3.43 and 3.53µm features in the ISM suggeststhat hydrogenated hydrocarbons cannot be more abundant than≈ 0.1 ppm in the interstellar medium (Tielens et al. 1987).Van Kerckhoven et al. (2002) showed that in HD 97048 andElias 3−1, 1 nanodiamond part per billion relative to hydrogenis required to reproduce the 3 micron spectra observed by ISO,making an ISM origin of nanodiamonds in principle a viableoption. This hypothesis has problems in explaining the paucityof detections of the 3.43 and 3.53µm feature in Herbig starswithin our sample, however.
We found no evidence for the presence of a supernova rem-nant (SNR) in the proximity of any of our sample sources. Wemade use of the catalog of galactic SNRs published by Green(2004). Only R Mon and V590 Mon are potentially locatedclose to a SNR; the Monoceros Nebula (G205.5+0.5). Thesesources display no detected nanodiamond features, however.We note that the absence of a SNR in the vicinity of our samplestars in the above-mentioned catalog does not necessarily im-ply that no supernova has actually occured. Most of the sampletargets are located in massive-star-forming regions. It may verywell be that the most massive members in such a region have
14 Acke & van den Ancker: Diamonds in Herbig Ae/Be systems
recently gone off as a supernova. In a relatively crowded starforming region, the ejecta of such an event likely affect a num-ber of surrounding young stellar objects or molecular clouds.In this scenario, the presence of diamonds in the circumstellardisk is expected to be common to all disk systems in the vicin-ity of the supernova. Unfortunately, we have no spectra of disksources close to Elias 3−1, HD 97048 or MWC 297 to checkthis hypothesis.
The parent star of a disk which contains supernova-injecteddiamonds must be be polluted by supernova material as well,under the supernova hypothesis. Enrichment of the stellar pho-tosphere by a supernova outflow is expected to alter the pho-tospheric abundance pattern of the star significantly. An abun-dance analysis of the strongest diamond source HD 97048 hasproduced upper limits on the abundances of a few heavy el-ements. The Sr abundance is at least one order of magnitudeless than the solar abundance of this element. No evidence sup-porting the supernova hypothesis is found.
Except for HD 97048 and Elias 3−1, both nanodiamondfeatures have also been observed in the post-AGB binaryHR 4049 (Geballe et al. 1989). The post-AGB phase is veryshort (∼10,000 yr) compared to the lifetime of an intermediate-mass pre-main-sequence star. Due to the short timescales, itis unlikely that a nearby supernova is the cause of the pres-ence of nanodiamonds in this system. However, the oxygenisotopes in the circumbinary disk of HR 4049 display pecu-liar behaviour: the relative17O and18O abundances are twoorders of magnitude larger than the surface abundances inother evolved stars (16O/17O= 8.3±2.3 and16O/18O= 6.9±0.9,Cami & Yamamura 2001). These exceptional values are mostlikely related to the binary nature of HR 4049, and possibly toa nova outburst. The presence of nanodiamonds in the circum-stellar environment may be related to such an event as well.
The extraneous origin of the circumstellar diamonds is dis-puted, however. Dai et al. (2002) have stated that, if the super-nova hypothesis is true, nanodiamonds should be abundant insolar-system comets as well. These objects are believed to haveformed further out in the early solar system and are likely morepristine than meteorites. The authors have investigated fragile,carbon-rich IPD particles which enter the Earth’s atmospherewith speeds in the range of cometary bodies, which suggeststhat the grains originate from these objects. Nanodiamondsareabsent or strongly depleted in such IPD grains, which indicatesthat diamonds are not uniformly abundant in the solar system.This may support the hypothesis that the detected meteoriticnanodiamonds have formedin situ, and are not of presolar ori-gin.
Goto et al. (2000) has suggested that the X-ray hardness ofthe radiation field of the central star may play a decisive role inthe formation of diamond. However, our analysis has shown noobvious link between the source’s X-ray luminosity and pres-ence/absence of nanodiamonds. Furthermore, the strength ofthe few detected diamond features appears to be independentfrom the X-ray strength of the central star as well.
The extraneous origin of nanodiamonds is an attractive hy-pothesis, because it naturally explains the paucity of nanodi-amond sources and the seemingly very different properties ofthese targets. No evidence was found, however, to substanti-
ate the claim of an external triggering source in the vicinity ofthe targets. In-situ formation of nanodiamonds is a viable al-ternative. However, it remains unclear why only very few diskscan/could provide the specific conditions needed to produce di-amond. The disk and stellar parameters of the diamond sourcesare not uncommon, nor do the targets form a consistent groupwithin the Herbig stars. Selection effects in terms of the size,temperature or hydrogenation of the diamonds may nonethe-less be present. Such effects could prevent the detection of fea-tures in the 3 micron region in spectra of the majority of cir-cumstellar disks. A larger sample of systems displaying dia-mond emission is needed to distinguish between in-situ forma-tion and an extraneous origin of the (nano)diamonds in HerbigAe/Be stars and in our own solar system.
Appendix
Apart from HD 97048 and MWC 297, a few other targets dis-play a feature in the 3.5 micron region. Due to their low fea-ture/continuum ratio, however, it is difficult to discern themfrom data reduction artefacts. In this Appendix we will try toclarify which features are astrophysical, and which are not.
In our opinion, the main source of data reduction artefactsis the correction procedure for atmospheric absorption lines.Assume thatS λ is the flux emitted by the standard star (STD),andτλ the atmospheric optical depth at a certain airmass and atthe time of the STD observation. Define the scientific target’sflux as Tλ and the corresponding atmospheric optical depthasσλ. We assume that the airmasses at the time of both ob-servations are the same. Note however that even in this caseτλ andσλ are not necessarily the same, since the atmosphericconditions (e.g. air density, humidity) may differ between thetwo observations. The STD’s flux can be approximated by aphotospheric model. IfFλ is the measured STD flux, theneτλ = S λ,model/Fλ can be estimated. This atmospheric correc-tion factor is then applied to the target measurement, whichleads to an estimate of the target’s flux,Tλ = (Tλ e−σλ) eτλ =Tλ e(τλ−σλ) ≈ Tλ. Slight differences betweenτλ andσλ intro-duce artefacts in the reduced spectrum of the science target.As a first order approach, we assume that the main differencein telluric extinction occurs due to a geometrical and/or atmo-spheric density effect. Such an effect is linear inτλ. Hencee(τλ−σλ) is proportional toeCτλ , with C a constant. The bottomtwo spectra in Fig. 9 show the influence ofover- andundercor-rection on a flat continuum. The artefacts that are relevant inthis discussion are the “emission features” at 3.505µm in thecase of undercorrection (∝ e−τλ), and 3.54µm in the case ofovercorrection (∝ eτλ).
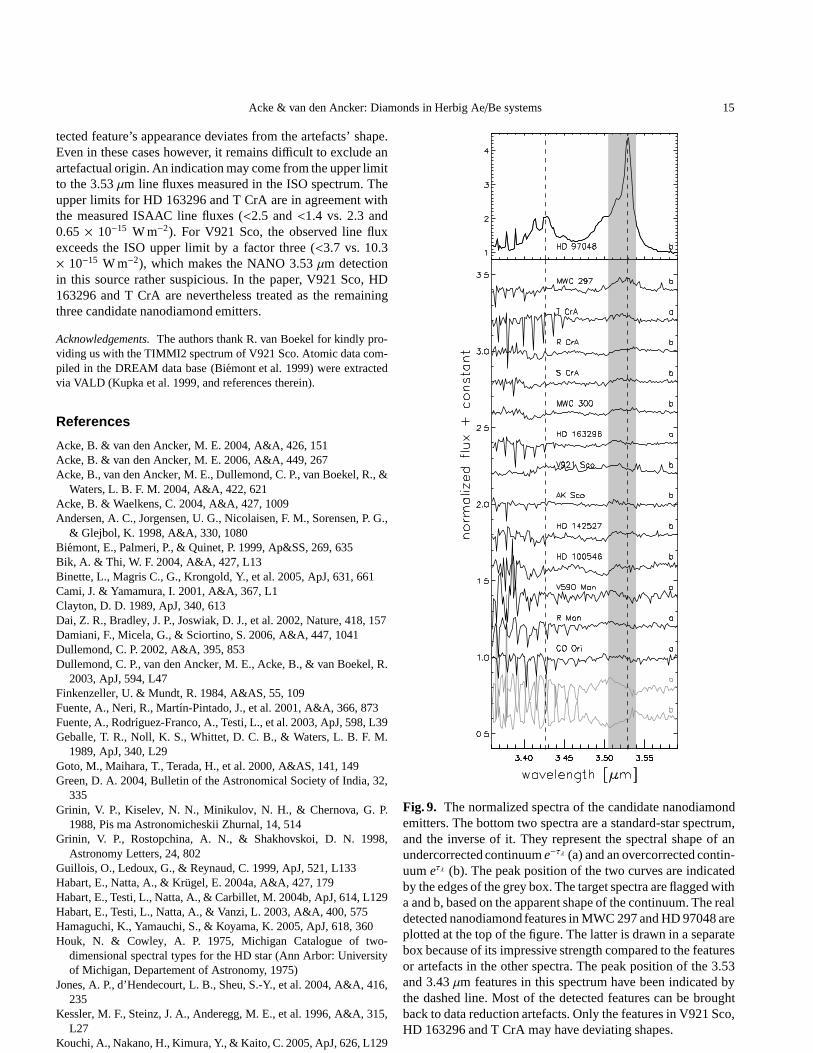
We will try to separate the real spectral features from theartefacts in the 14 candidate nanodiamond emitters listed inTable 5. Two of them, HD 97048 and MWC 297, are known todisplay the 3.53µm feature and will serve as a reference. Thevast majority of the other 12 detected features is most likely dueto the data reduction procedure. In Fig. 9, the normalized spec-tra of the candidate nanodiamond emitters have been displayed.We have indicated which spectra appear to be over- and under-corrected. Most of the features follow the spectral shape ofeτλ
or e−τλ . Only for V921 Sco, HD 163296 and T CrA, the de-
Acke & van den Ancker: Diamonds in Herbig Ae/Be systems 15
tected feature’s appearance deviates from the artefacts’ shape.Even in these cases however, it remains difficult to exclude anartefactual origin. An indication may come from the upper limitto the 3.53µm line fluxes measured in the ISO spectrum. Theupper limits for HD 163296 and T CrA are in agreement withthe measured ISAAC line fluxes (<2.5 and<1.4 vs. 2.3 and0.65× 10−15 W m−2). For V921 Sco, the observed line fluxexceeds the ISO upper limit by a factor three (<3.7 vs. 10.3× 10⁻¹⁵ W m−2), which makes the NANO 3.53µm detectionin this source rather suspicious. In the paper, V921 Sco, HD163296 and T CrA are nevertheless treated as the remainingthree candidate nanodiamond emitters.
Acknowledgements. The authors thank R. van Boekel for kindly pro-viding us with the TIMMI2 spectrum of V921 Sco. Atomic data com-piled in the DREAM data base (Biemont et al. 1999) were extractedvia VALD (Kupka et al. 1999, and references therein).
References
Acke, B. & van den Ancker, M. E. 2004, A&A, 426, 151Acke, B. & van den Ancker, M. E. 2006, A&A, 449, 267Acke, B., van den Ancker, M. E., Dullemond, C. P., van Boekel,R., &
Waters, L. B. F. M. 2004, A&A, 422, 621Acke, B. & Waelkens, C. 2004, A&A, 427, 1009Andersen, A. C., Jorgensen, U. G., Nicolaisen, F. M., Sorensen, P. G.,
& Glejbol, K. 1998, A&A, 330, 1080Biemont, E., Palmeri, P., & Quinet, P. 1999, Ap&SS, 269, 635Bik, A. & Thi, W. F. 2004, A&A, 427, L13Binette, L., Magris C., G., Krongold, Y., et al. 2005, ApJ, 631, 661Cami, J. & Yamamura, I. 2001, A&A, 367, L1Clayton, D. D. 1989, ApJ, 340, 613Dai, Z. R., Bradley, J. P., Joswiak, D. J., et al. 2002, Nature, 418, 157Damiani, F., Micela, G., & Sciortino, S. 2006, A&A, 447, 1041Dullemond, C. P. 2002, A&A, 395, 853Dullemond, C. P., van den Ancker, M. E., Acke, B., & van Boekel, R.
2003, ApJ, 594, L47Finkenzeller, U. & Mundt, R. 1984, A&AS, 55, 109Fuente, A., Neri, R., Martın-Pintado, J., et al. 2001, A&A,366, 873Fuente, A., Rodrıguez-Franco, A., Testi, L., et al. 2003, ApJ, 598, L39Geballe, T. R., Noll, K. S., Whittet, D. C. B., & Waters, L. B. F. M.
1989, ApJ, 340, L29Goto, M., Maihara, T., Terada, H., et al. 2000, A&AS, 141, 149Green, D. A. 2004, Bulletin of the Astronomical Society of India, 32,
335Grinin, V. P., Kiselev, N. N., Minikulov, N. H., & Chernova, G. P.
1988, Pis ma Astronomicheskii Zhurnal, 14, 514Grinin, V. P., Rostopchina, A. N., & Shakhovskoi, D. N. 1998,
Astronomy Letters, 24, 802Guillois, O., Ledoux, G., & Reynaud, C. 1999, ApJ, 521, L133Habart, E., Natta, A., & Krugel, E. 2004a, A&A, 427, 179Habart, E., Testi, L., Natta, A., & Carbillet, M. 2004b, ApJ,614, L129Habart, E., Testi, L., Natta, A., & Vanzi, L. 2003, A&A, 400, 575Hamaguchi, K., Yamauchi, S., & Koyama, K. 2005, ApJ, 618, 360Houk, N. & Cowley, A. P. 1975, Michigan Catalogue of two-
dimensional spectral types for the HD star (Ann Arbor: Universityof Michigan, Departement of Astronomy, 1975)
Jones, A. P., d’Hendecourt, L. B., Sheu, S.-Y., et al. 2004, A&A, 416,235
Kessler, M. F., Steinz, J. A., Anderegg, M. E., et al. 1996, A&A, 315,L27
Kouchi, A., Nakano, H., Kimura, Y., & Kaito, C. 2005, ApJ, 626, L129
Fig. 9. The normalized spectra of the candidate nanodiamondemitters. The bottom two spectra are a standard-star spectrum,and the inverse of it. They represent the spectral shape of anundercorrected continuume−τλ (a) and an overcorrected contin-uumeτλ (b). The peak position of the two curves are indicatedby the edges of the grey box. The target spectra are flagged witha and b, based on the apparent shape of the continuum. The realdetected nanodiamond features in MWC 297 and HD 97048 areplotted at the top of the figure. The latter is drawn in a separatebox because of its impressive strength compared to the featuresor artefacts in the other spectra. The peak position of the 3.53and 3.43µm features in this spectrum have been indicated bythe dashed line. Most of the detected features can be broughtback to data reduction artefacts. Only the features in V921 Sco,HD 163296 and T CrA may have deviating shapes.
16 Acke & van den Ancker: Diamonds in Herbig Ae/Be systems
Kupka, F., Piskunov, N., Ryabchikova, T. A., Stempels, H. C., &Weiss, W. W. 1999, A&AS, 138, 119
Lewis, R. S., Anders, E., & Draine, B. T. 1989, Nature, 339, 117Lewis, R. S., Ming, T., Wacker, J. F., Anders, E., & Steel, E. 1987,
Nature, 326, 160Maas, R., Loss, R. D., Rosman, K. J. R., et al. 2001, Meteoritics and
Planetary Science, 36, 849Malfait, K., Bogaert, E., & Waelkens, C. 1998a, A&A, 331, 211Malfait, K., Waelkens, C., Bouwman, J., de Koter, A., & Waters,
L. B. F. M. 1999, A&A, 345, 181Malfait, K., Waelkens, C., Waters, L. B. F. M., et al. 1998b, A&A,
332, L25Mannings, V. & Sargent, A. I. 1997, ApJ, 490, 792Meeus, G., Waters, L. B. F. M., Bouwman, J., et al. 2001, A&A, 365,
476Mora, A., Merın, B., Solano, E., et al. 2001, A&A, 378, 116Mostefaoui, S., Lugmair, G. W., & Hoppe, P. 2005, ApJ, 625, 271Mutschke, H., Andersen, A. C., Jager, C., Henning, T., & Braatz, A.
2004, A&A, 423, 983Mutschke, H., Dorschner, J., Henning, T., Jager, C., & Ott, U. 1995,
ApJ, 454, L157+Natta, A., Testi, L., Neri, R., Shepherd, D. S., & Wilner, D. J. 2004,
A&A, 416, 179Pietu, V., Dutrey, A., & Kahane, C. 2003, A&A, 398, 565Richter, S., Ott, U., & Begemann, F. 1998, Nature, 391, 261Sheu, S.-Y., Lee, I.-P., Lee, Y. T., & Chang, H.-C. 2002, ApJ,581, L55Shore, S. N., Brown, D. N., Bopp, B. W., et al. 1990, ApJS, 73, 461Siebenmorgen, R., Prusti, T., Natta, A., & Muller, T. G. 2000, A&A,
361, 258Skinner, S. L., Gudel, M., Audard, M., & Smith, K. 2004, ApJ,614,
221Smith, K. W., Balega, Y. Y., Duschl, W. J., et al. 2005, A&A, 431, 307Tachibana, S., Huss, G. R., Kita, N. T., Shimoda, G., & Morishita, Y.
2006, ApJ, 639, L87Terada, H., Imanishi, M., Goto, M., & Maihara, T. 2001, A&A, 377,
994Testi, L., Natta, A., Shepherd, D. S., & Wilner, D. J. 2003, A&A, 403,
323The, P. S., de Winter, D., & Perez, M. R. 1994, A&AS, 104, 315Tielens, A. G. G. M., Seab, C. G., Hollenbach, D. J., & McKee, C. F.
1987, ApJ, 319, L109Tout, C. A. & Pringle, J. E. 1995, MNRAS, 272, 528van Boekel, R., Waters, L. B. F. M., Dominik, C., et al. 2003, A&A,
400, L21van Boekel, R., Waters, L. B. F. M., Dominik, C., et al. 2004, A&A,
418, 177van den Ancker, M. E., Bouwman, J., Wesselius, P. R., et al. 2000a,
A&A, 357, 325van den Ancker, M. E., de Winter, D., & Tjin A Djie, H. R. E. 1998,
A&A, 330, 145van den Ancker, M. E., Wesselius, P. R., & Tielens, A. G. G. M. 2000b,
A&A, 355, 194Van Kerckhoven, C., Tielens, A. G. G. M., & Waelkens, C. 2002,
A&A, 384, 568Vink, J. S., Drew, J. E., Harries, T. J., & Oudmaijer, R. D. 2002,
MNRAS, 337, 356Vink, J. S., O’Neill, P. M., Els, S. G., & Drew, J. E. 2005, A&A,438,
L21Voshchinnikov, N. V. 1990, Astrophysics, 30, 309Waelkens, C., Waters, L. B. F. M., de Graauw, M. S., et al. 1996, A&A,
315, L245Wenzel, W. 1968, InNon-Periodic Phenomena in Variable Stars, ed.
L. Detre,IAU Colloq., 4, 61
Acke & van den Ancker: Diamonds in Herbig Ae/Be systems 17
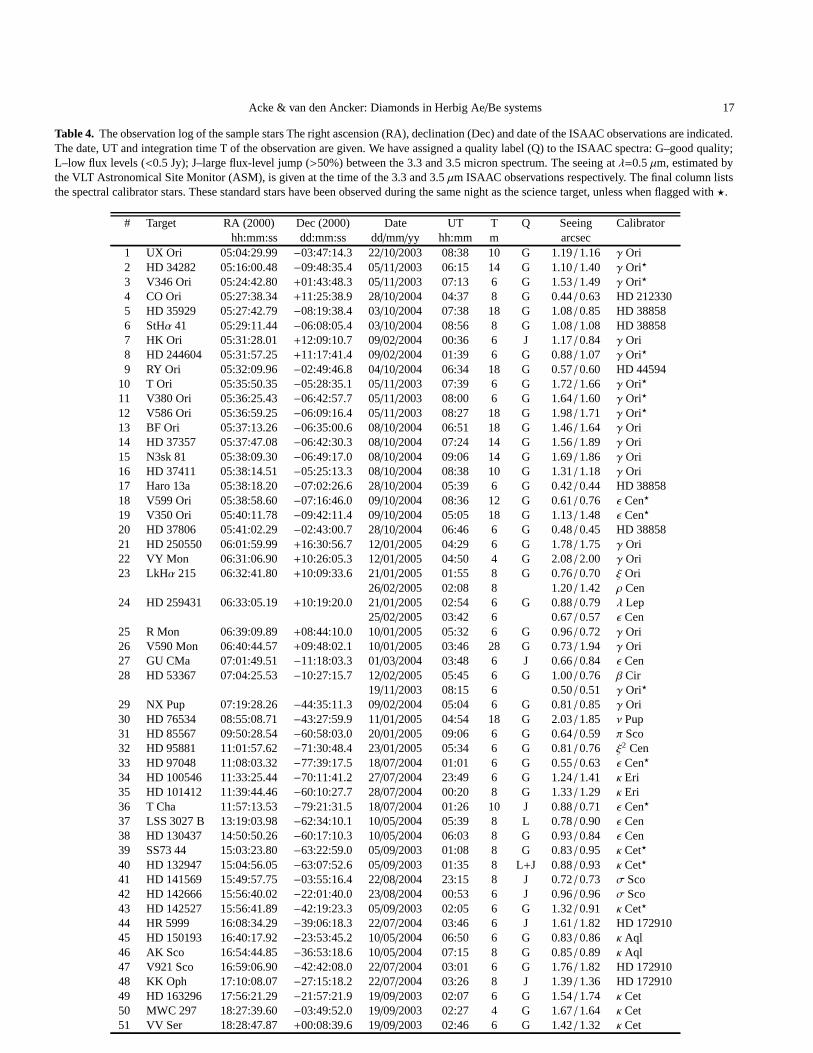
Table 4. The observation log of the sample stars The right ascension (RA), declination (Dec) and date of the ISAAC observations are indicated.The date, UT and integration time T of the observation are given. We have assigned a quality label (Q) to the ISAAC spectra:G–good quality;L–low flux levels (<0.5 Jy); J–large flux-level jump (>50%) between the 3.3 and 3.5 micron spectrum. The seeing atλ=0.5µm, estimated bythe VLT Astronomical Site Monitor (ASM), is given at the timeof the 3.3 and 3.5µm ISAAC observations respectively. The final column liststhe spectral calibrator stars. These standard stars have been observed during the same night as the science target, unless when flagged with⋆.
# Target RA (2000) Dec (2000) Date UT T Q Seeing Calibratorhh:mm:ss dd:mm:ss dd/mm/yy hh:mm m arcsec
1 UX Ori 05:04:29.99 −03:47:14.3 22/10/2003 08:38 10 G 1.19/ 1.16 γ Ori2 HD 34282 05:16:00.48 −09:48:35.4 05/11/2003 06:15 14 G 1.10/ 1.40 γ Ori⋆
3 V346 Ori 05:24:42.80 +01:43:48.3 05/11/2003 07:13 6 G 1.53/ 1.49 γ Ori⋆
4 CO Ori 05:27:38.34 +11:25:38.9 28/10/2004 04:37 8 G 0.44/ 0.63 HD 2123305 HD 35929 05:27:42.79 −08:19:38.4 03/10/2004 07:38 18 G 1.08/ 0.85 HD 388586 StHα 41 05:29:11.44 −06:08:05.4 03/10/2004 08:56 8 G 1.08/ 1.08 HD 388587 HK Ori 05:31:28.01 +12:09:10.7 09/02/2004 00:36 6 J 1.17/ 0.84 γ Ori8 HD 244604 05:31:57.25 +11:17:41.4 09/02/2004 01:39 6 G 0.88/ 1.07 γ Ori⋆
9 RY Ori 05:32:09.96 −02:49:46.8 04/10/2004 06:34 18 G 0.57/ 0.60 HD 4459410 T Ori 05:35:50.35 −05:28:35.1 05/11/2003 07:39 6 G 1.72/ 1.66 γ Ori⋆
11 V380 Ori 05:36:25.43 −06:42:57.7 05/11/2003 08:00 6 G 1.64/ 1.60 γ Ori⋆
12 V586 Ori 05:36:59.25 −06:09:16.4 05/11/2003 08:27 18 G 1.98/ 1.71 γ Ori⋆
13 BF Ori 05:37:13.26 −06:35:00.6 08/10/2004 06:51 18 G 1.46/ 1.64 γ Ori14 HD 37357 05:37:47.08 −06:42:30.3 08/10/2004 07:24 14 G 1.56/ 1.89 γ Ori15 N3sk 81 05:38:09.30 −06:49:17.0 08/10/2004 09:06 14 G 1.69/ 1.86 γ Ori16 HD 37411 05:38:14.51 −05:25:13.3 08/10/2004 08:38 10 G 1.31/ 1.18 γ Ori17 Haro 13a 05:38:18.20 −07:02:26.6 28/10/2004 05:39 6 G 0.42/ 0.44 HD 3885818 V599 Ori 05:38:58.60 −07:16:46.0 09/10/2004 08:36 12 G 0.61/ 0.76 ǫ Cen⋆
19 V350 Ori 05:40:11.78 −09:42:11.4 09/10/2004 05:05 18 G 1.13/ 1.48 ǫ Cen⋆
20 HD 37806 05:41:02.29 −02:43:00.7 28/10/2004 06:46 6 G 0.48/ 0.45 HD 3885821 HD 250550 06:01:59.99 +16:30:56.7 12/01/2005 04:29 6 G 1.78/ 1.75 γ Ori22 VY Mon 06:31:06.90 +10:26:05.3 12/01/2005 04:50 4 G 2.08/ 2.00 γ Ori23 LkHα 215 06:32:41.80 +10:09:33.6 21/01/2005 01:55 8 G 0.76/ 0.70 ξ Ori
26/02/2005 02:08 8 1.20/ 1.42 ρ Cen24 HD 259431 06:33:05.19 +10:19:20.0 21/01/2005 02:54 6 G 0.88/ 0.79 λ Lep
25/02/2005 03:42 6 0.67/ 0.57 ǫ Cen25 R Mon 06:39:09.89 +08:44:10.0 10/01/2005 05:32 6 G 0.96/ 0.72 γ Ori26 V590 Mon 06:40:44.57 +09:48:02.1 10/01/2005 03:46 28 G 0.73/ 1.94 γ Ori27 GU CMa 07:01:49.51 −11:18:03.3 01/03/2004 03:48 6 J 0.66/ 0.84 ǫ Cen28 HD 53367 07:04:25.53 −10:27:15.7 12/02/2005 05:45 6 G 1.00/ 0.76 β Cir
19/11/2003 08:15 6 0.50/ 0.51 γ Ori⋆
29 NX Pup 07:19:28.26 −44:35:11.3 09/02/2004 05:04 6 G 0.81/ 0.85 γ Ori30 HD 76534 08:55:08.71 −43:27:59.9 11/01/2005 04:54 18 G 2.03/ 1.85 ν Pup31 HD 85567 09:50:28.54 −60:58:03.0 20/01/2005 09:06 6 G 0.64/ 0.59 π Sco32 HD 95881 11:01:57.62 −71:30:48.4 23/01/2005 05:34 6 G 0.81/ 0.76 ξ2 Cen33 HD 97048 11:08:03.32 −77:39:17.5 18/07/2004 01:01 6 G 0.55/ 0.63 ǫ Cen⋆
34 HD 100546 11:33:25.44 −70:11:41.2 27/07/2004 23:49 6 G 1.24/ 1.41 κ Eri35 HD 101412 11:39:44.46 −60:10:27.7 28/07/2004 00:20 8 G 1.33/ 1.29 κ Eri36 T Cha 11:57:13.53 −79:21:31.5 18/07/2004 01:26 10 J 0.88/ 0.71 ǫ Cen⋆
37 LSS 3027 B 13:19:03.98 −62:34:10.1 10/05/2004 05:39 8 L 0.78/ 0.90 ǫ Cen38 HD 130437 14:50:50.26 −60:17:10.3 10/05/2004 06:03 8 G 0.93/ 0.84 ǫ Cen39 SS73 44 15:03:23.80 −63:22:59.0 05/09/2003 01:08 8 G 0.83/ 0.95 κ Cet⋆
40 HD 132947 15:04:56.05 −63:07:52.6 05/09/2003 01:35 8 L+J 0.88/ 0.93 κ Cet⋆
41 HD 141569 15:49:57.75 −03:55:16.4 22/08/2004 23:15 8 J 0.72/ 0.73 σ Sco42 HD 142666 15:56:40.02 −22:01:40.0 23/08/2004 00:53 6 J 0.96/ 0.96 σ Sco43 HD 142527 15:56:41.89 −42:19:23.3 05/09/2003 02:05 6 G 1.32/ 0.91 κ Cet⋆
44 HR 5999 16:08:34.29 −39:06:18.3 22/07/2004 03:46 6 J 1.61/ 1.82 HD 17291045 HD 150193 16:40:17.92 −23:53:45.2 10/05/2004 06:50 6 G 0.83/ 0.86 κ Aql46 AK Sco 16:54:44.85 −36:53:18.6 10/05/2004 07:15 8 G 0.85/ 0.89 κ Aql47 V921 Sco 16:59:06.90 −42:42:08.0 22/07/2004 03:01 6 G 1.76/ 1.82 HD 17291048 KK Oph 17:10:08.07 −27:15:18.2 22/07/2004 03:26 8 J 1.39/ 1.36 HD 17291049 HD 163296 17:56:21.29 −21:57:21.9 19/09/2003 02:07 6 G 1.54/ 1.74 κ Cet50 MWC 297 18:27:39.60 −03:49:52.0 19/09/2003 02:27 4 G 1.67/ 1.64 κ Cet51 VV Ser 18:28:47.87 +00:08:39.6 19/09/2003 02:46 6 G 1.42/ 1.32 κ Cet
18 Acke & van den Ancker: Diamonds in Herbig Ae/Be systems
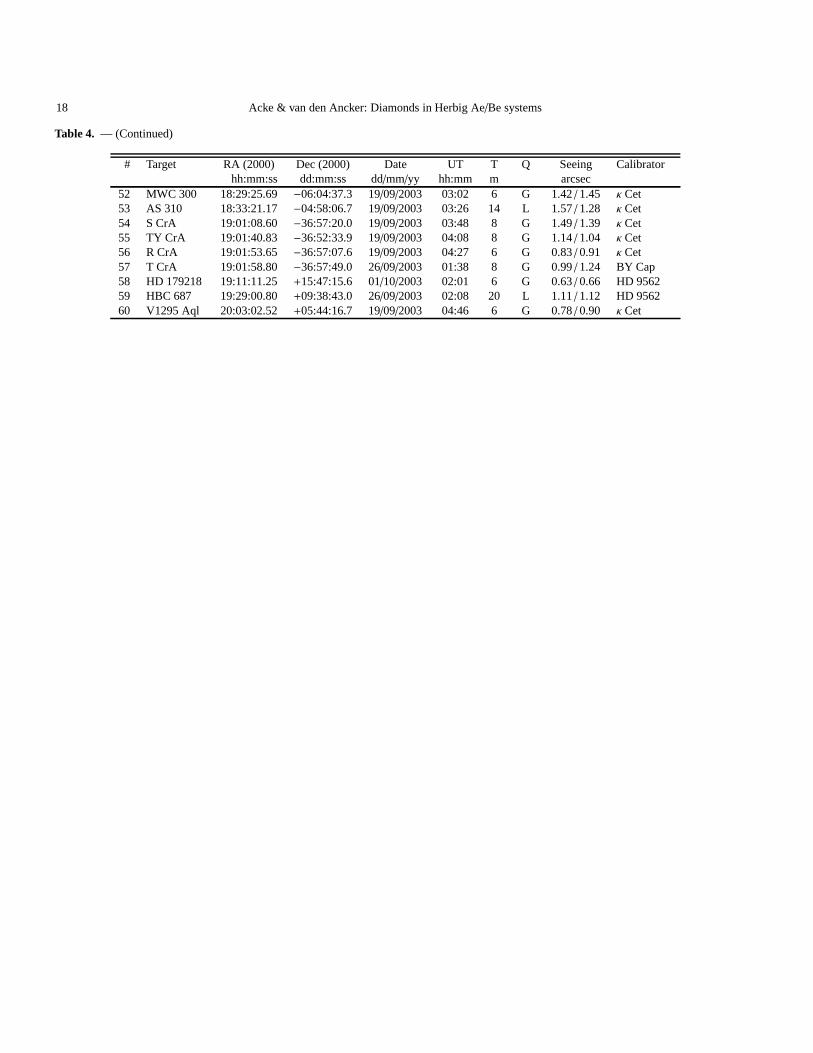
Table 4. — (Continued)
# Target RA (2000) Dec (2000) Date UT T Q Seeing Calibratorhh:mm:ss dd:mm:ss dd/mm/yy hh:mm m arcsec
52 MWC 300 18:29:25.69 −06:04:37.3 19/09/2003 03:02 6 G 1.42/ 1.45 κ Cet53 AS 310 18:33:21.17 −04:58:06.7 19/09/2003 03:26 14 L 1.57/ 1.28 κ Cet54 S CrA 19:01:08.60 −36:57:20.0 19/09/2003 03:48 8 G 1.49/ 1.39 κ Cet55 TY CrA 19:01:40.83 −36:52:33.9 19/09/2003 04:08 8 G 1.14/ 1.04 κ Cet56 R CrA 19:01:53.65 −36:57:07.6 19/09/2003 04:27 6 G 0.83/ 0.91 κ Cet57 T CrA 19:01:58.80 −36:57:49.0 26/09/2003 01:38 8 G 0.99/ 1.24 BY Cap58 HD 179218 19:11:11.25 +15:47:15.6 01/10/2003 02:01 6 G 0.63/ 0.66 HD 956259 HBC 687 19:29:00.80 +09:38:43.0 26/09/2003 02:08 20 L 1.11/ 1.12 HD 956260 V1295 Aql 20:03:02.52 +05:44:16.7 19/09/2003 04:46 6 G 0.78/ 0.90 κ Cet
Acke & van den Ancker: Diamonds in Herbig Ae/Be systems 19
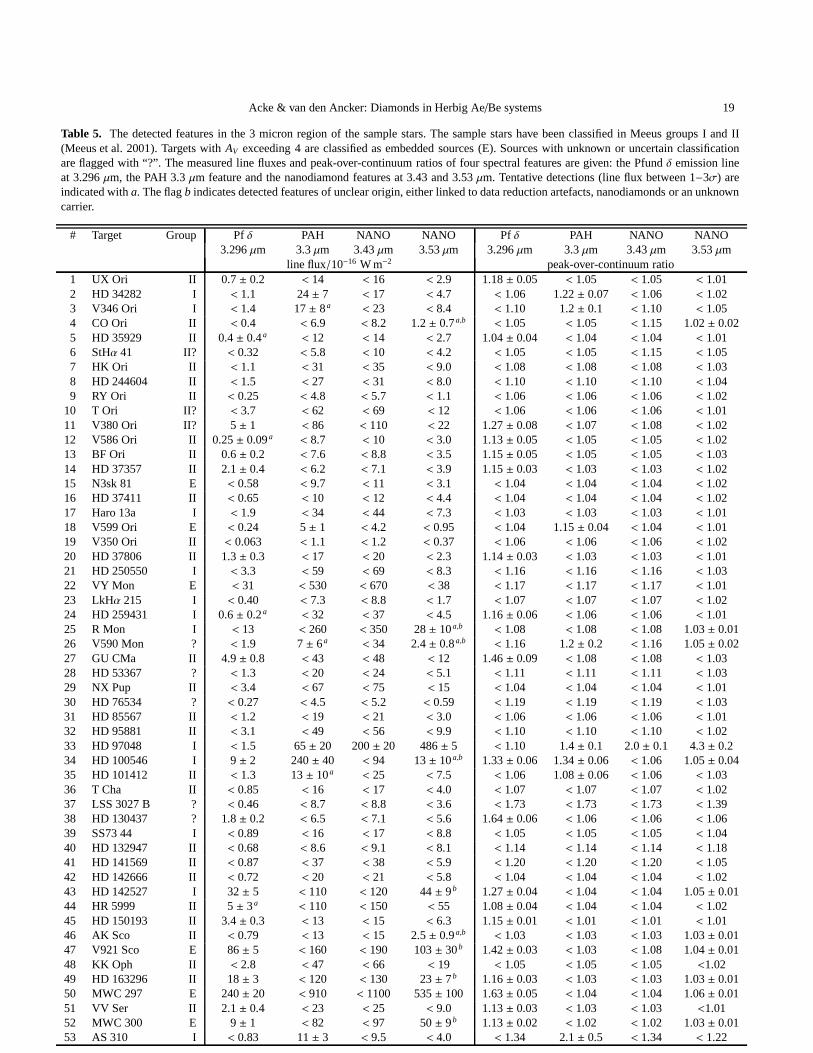
Table 5. The detected features in the 3 micron region of the sample stars. The sample stars have been classified in Meeus groups I andII(Meeus et al. 2001). Targets withAV exceeding 4 are classified as embedded sources (E). Sources with unknown or uncertain classificationare flagged with “?”. The measured line fluxes and peak-over-continuum ratios of four spectral features are given: the Pfund δ emission lineat 3.296µm, the PAH 3.3µm feature and the nanodiamond features at 3.43 and 3.53µm. Tentative detections (line flux between 1−3σ) areindicated witha. The flagb indicates detected features of unclear origin, either linked to data reduction artefacts, nanodiamonds or an unknowncarrier.
# Target Group Pf δ PAH NANO NANO Pf δ PAH NANO NANO3.296µm 3.3µm 3.43µm 3.53µm 3.296µm 3.3µm 3.43µm 3.53µm
line flux/10−16 W m−2 peak-over-continuum ratio1 UX Ori II 0.7± 0.2 < 14 < 16 < 2.9 1.18± 0.05 < 1.05 < 1.05 < 1.012 HD 34282 I < 1.1 24± 7 < 17 < 4.7 < 1.06 1.22± 0.07 < 1.06 < 1.023 V346 Ori I < 1.4 17± 8a < 23 < 8.4 < 1.10 1.2± 0.1 < 1.10 < 1.054 CO Ori II < 0.4 < 6.9 < 8.2 1.2± 0.7a,b < 1.05 < 1.05 < 1.15 1.02± 0.025 HD 35929 II 0.4± 0.4a < 12 < 14 < 2.7 1.04± 0.04 < 1.04 < 1.04 < 1.016 StHα 41 II? < 0.32 < 5.8 < 10 < 4.2 < 1.05 < 1.05 < 1.15 < 1.057 HK Ori II < 1.1 < 31 < 35 < 9.0 < 1.08 < 1.08 < 1.08 < 1.038 HD 244604 II < 1.5 < 27 < 31 < 8.0 < 1.10 < 1.10 < 1.10 < 1.049 RY Ori II < 0.25 < 4.8 < 5.7 < 1.1 < 1.06 < 1.06 < 1.06 < 1.02
10 T Ori II? < 3.7 < 62 < 69 < 12 < 1.06 < 1.06 < 1.06 < 1.0111 V380 Ori II? 5 ± 1 < 86 < 110 < 22 1.27± 0.08 < 1.07 < 1.08 < 1.0212 V586 Ori II 0.25± 0.09a < 8.7 < 10 < 3.0 1.13± 0.05 < 1.05 < 1.05 < 1.0213 BF Ori II 0.6± 0.2 < 7.6 < 8.8 < 3.5 1.15± 0.05 < 1.05 < 1.05 < 1.0314 HD 37357 II 2.1± 0.4 < 6.2 < 7.1 < 3.9 1.15± 0.03 < 1.03 < 1.03 < 1.0215 N3sk 81 E < 0.58 < 9.7 < 11 < 3.1 < 1.04 < 1.04 < 1.04 < 1.0216 HD 37411 II < 0.65 < 10 < 12 < 4.4 < 1.04 < 1.04 < 1.04 < 1.0217 Haro 13a I < 1.9 < 34 < 44 < 7.3 < 1.03 < 1.03 < 1.03 < 1.0118 V599 Ori E < 0.24 5± 1 < 4.2 < 0.95 < 1.04 1.15± 0.04 < 1.04 < 1.0119 V350 Ori II < 0.063 < 1.1 < 1.2 < 0.37 < 1.06 < 1.06 < 1.06 < 1.0220 HD 37806 II 1.3± 0.3 < 17 < 20 < 2.3 1.14± 0.03 < 1.03 < 1.03 < 1.0121 HD 250550 I < 3.3 < 59 < 69 < 8.3 < 1.16 < 1.16 < 1.16 < 1.0322 VY Mon E < 31 < 530 < 670 < 38 < 1.17 < 1.17 < 1.17 < 1.0123 LkHα 215 I < 0.40 < 7.3 < 8.8 < 1.7 < 1.07 < 1.07 < 1.07 < 1.0224 HD 259431 I 0.6± 0.2a < 32 < 37 < 4.5 1.16± 0.06 < 1.06 < 1.06 < 1.0125 R Mon I < 13 < 260 < 350 28± 10a,b < 1.08 < 1.08 < 1.08 1.03± 0.0126 V590 Mon ? < 1.9 7± 6a < 34 2.4± 0.8a,b < 1.16 1.2± 0.2 < 1.16 1.05± 0.0227 GU CMa II 4.9± 0.8 < 43 < 48 < 12 1.46± 0.09 < 1.08 < 1.08 < 1.0328 HD 53367 ? < 1.3 < 20 < 24 < 5.1 < 1.11 < 1.11 < 1.11 < 1.0329 NX Pup II < 3.4 < 67 < 75 < 15 < 1.04 < 1.04 < 1.04 < 1.0130 HD 76534 ? < 0.27 < 4.5 < 5.2 < 0.59 < 1.19 < 1.19 < 1.19 < 1.0331 HD 85567 II < 1.2 < 19 < 21 < 3.0 < 1.06 < 1.06 < 1.06 < 1.0132 HD 95881 II < 3.1 < 49 < 56 < 9.9 < 1.10 < 1.10 < 1.10 < 1.0233 HD 97048 I < 1.5 65± 20 200± 20 486± 5 < 1.10 1.4± 0.1 2.0± 0.1 4.3± 0.234 HD 100546 I 9 ± 2 240± 40 < 94 13± 10a,b 1.33± 0.06 1.34± 0.06 < 1.06 1.05± 0.0435 HD 101412 II < 1.3 13± 10a < 25 < 7.5 < 1.06 1.08± 0.06 < 1.06 < 1.0336 T Cha II < 0.85 < 16 < 17 < 4.0 < 1.07 < 1.07 < 1.07 < 1.0237 LSS 3027 B ? < 0.46 < 8.7 < 8.8 < 3.6 < 1.73 < 1.73 < 1.73 < 1.3938 HD 130437 ? 1.8± 0.2 < 6.5 < 7.1 < 5.6 1.64± 0.06 < 1.06 < 1.06 < 1.0639 SS73 44 I < 0.89 < 16 < 17 < 8.8 < 1.05 < 1.05 < 1.05 < 1.0440 HD 132947 II < 0.68 < 8.6 < 9.1 < 8.1 < 1.14 < 1.14 < 1.14 < 1.1841 HD 141569 II < 0.87 < 37 < 38 < 5.9 < 1.20 < 1.20 < 1.20 < 1.0542 HD 142666 II < 0.72 < 20 < 21 < 5.8 < 1.04 < 1.04 < 1.04 < 1.0243 HD 142527 I 32± 5 < 110 < 120 44± 9b 1.27± 0.04 < 1.04 < 1.04 1.05± 0.0144 HR 5999 II 5 ± 3a < 110 < 150 < 55 1.08± 0.04 < 1.04 < 1.04 < 1.0245 HD 150193 II 3.4± 0.3 < 13 < 15 < 6.3 1.15± 0.01 < 1.01 < 1.01 < 1.0146 AK Sco II < 0.79 < 13 < 15 2.5± 0.9a,b < 1.03 < 1.03 < 1.03 1.03± 0.0147 V921 Sco E 86± 5 < 160 < 190 103± 30b 1.42± 0.03 < 1.03 < 1.08 1.04± 0.0148 KK Oph II < 2.8 < 47 < 66 < 19 < 1.05 < 1.05 < 1.05 <1.0249 HD 163296 II 18± 3 < 120 < 130 23± 7b 1.16± 0.03 < 1.03 < 1.03 1.03± 0.0150 MWC 297 E 240± 20 < 910 < 1100 535± 100 1.63± 0.05 < 1.04 < 1.04 1.06± 0.0151 VV Ser II 2.1± 0.4 < 23 < 25 < 9.0 1.13± 0.03 < 1.03 < 1.03 <1.0152 MWC 300 E 9 ± 1 < 82 < 97 50± 9b 1.13± 0.02 < 1.02 < 1.02 1.03± 0.0153 AS 310 I < 0.83 11± 3 < 9.5 < 4.0 < 1.34 2.1± 0.5 < 1.34 < 1.22
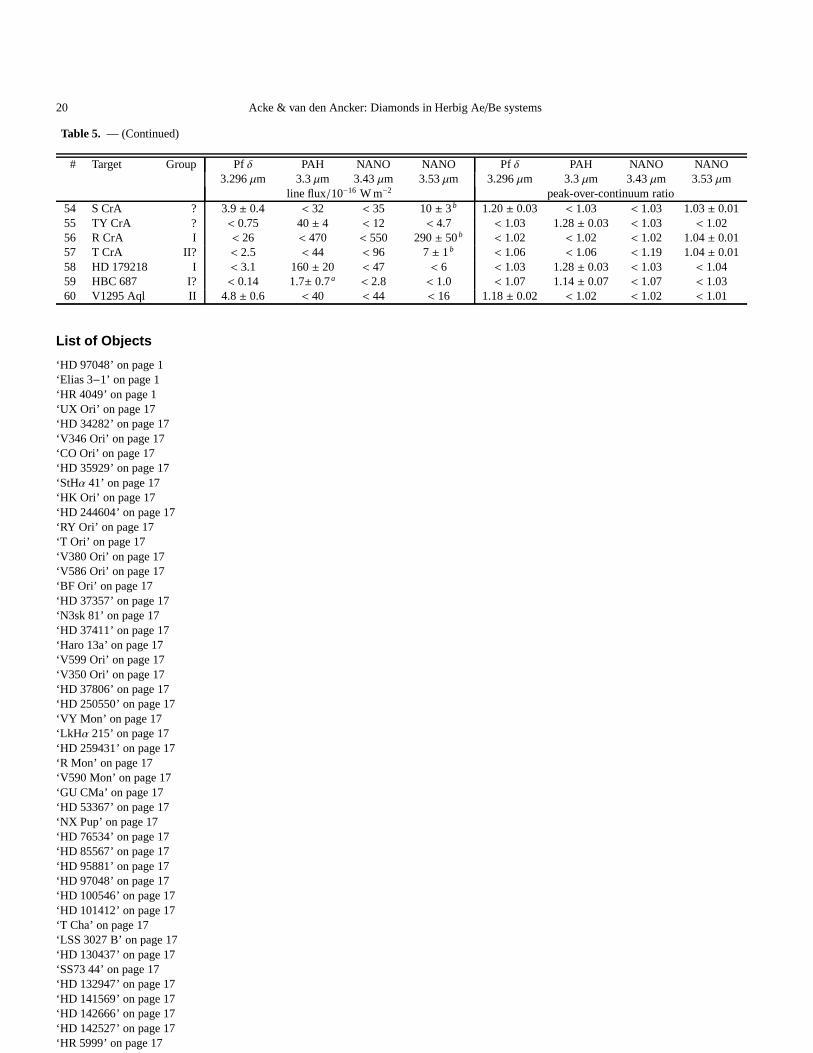
20 Acke & van den Ancker: Diamonds in Herbig Ae/Be systems
Table 5. — (Continued)
# Target Group Pf δ PAH NANO NANO Pf δ PAH NANO NANO3.296µm 3.3µm 3.43µm 3.53µm 3.296µm 3.3µm 3.43µm 3.53µm
line flux/10−16 W m−2 peak-over-continuum ratio54 S CrA ? 3.9± 0.4 < 32 < 35 10± 3b 1.20± 0.03 < 1.03 < 1.03 1.03± 0.0155 TY CrA ? < 0.75 40± 4 < 12 < 4.7 < 1.03 1.28± 0.03 < 1.03 < 1.0256 R CrA I < 26 < 470 < 550 290± 50b < 1.02 < 1.02 < 1.02 1.04± 0.0157 T CrA II? < 2.5 < 44 < 96 7± 1b < 1.06 < 1.06 < 1.19 1.04± 0.0158 HD 179218 I < 3.1 160± 20 < 47 < 6 < 1.03 1.28± 0.03 < 1.03 < 1.0459 HBC 687 I? < 0.14 1.7± 0.7a < 2.8 < 1.0 < 1.07 1.14± 0.07 < 1.07 < 1.0360 V1295 Aql II 4.8± 0.6 < 40 < 44 < 16 1.18± 0.02 < 1.02 < 1.02 < 1.01
List of Objects
‘HD 97048’ on page 1‘Elias 3−1’ on page 1‘HR 4049’ on page 1‘UX Ori’ on page 17‘HD 34282’ on page 17‘V346 Ori’ on page 17‘CO Ori’ on page 17‘HD 35929’ on page 17‘StHα 41’ on page 17‘HK Ori’ on page 17‘HD 244604’ on page 17‘RY Ori’ on page 17‘T Ori’ on page 17‘V380 Ori’ on page 17‘V586 Ori’ on page 17‘BF Ori’ on page 17‘HD 37357’ on page 17‘N3sk 81’ on page 17‘HD 37411’ on page 17‘Haro 13a’ on page 17‘V599 Ori’ on page 17‘V350 Ori’ on page 17‘HD 37806’ on page 17‘HD 250550’ on page 17‘VY Mon’ on page 17‘LkHα 215’ on page 17‘HD 259431’ on page 17‘R Mon’ on page 17‘V590 Mon’ on page 17‘GU CMa’ on page 17‘HD 53367’ on page 17‘NX Pup’ on page 17‘HD 76534’ on page 17‘HD 85567’ on page 17‘HD 95881’ on page 17‘HD 97048’ on page 17‘HD 100546’ on page 17‘HD 101412’ on page 17‘T Cha’ on page 17‘LSS 3027 B’ on page 17‘HD 130437’ on page 17‘SS73 44’ on page 17‘HD 132947’ on page 17‘HD 141569’ on page 17‘HD 142666’ on page 17‘HD 142527’ on page 17‘HR 5999’ on page 17
Acke & van den Ancker: Diamonds in Herbig Ae/Be systems 21
‘HD 150193’ on page 17‘AK Sco’ on page 17‘V921 Sco’ on page 17‘KK Oph’ on page 17‘HD 163296’ on page 17‘MWC 297’ on page 17‘VV Ser’ on page 17‘MWC 300’ on page 18‘AS 310’ on page 18‘S CrA’ on page 18‘TY CrA’ on page 18‘R CrA’ on page 18‘T CrA’ on page 18‘HD 179218’ on page 18‘HBC 687’ on page 18‘V1295 Aql’ on page 18‘UX Ori’ on page 19‘HD 34282’ on page 19‘V346 Ori’ on page 19‘CO Ori’ on page 19‘HD 35929’ on page 19‘StHα 41’ on page 19‘HK Ori’ on page 19‘HD 244604’ on page 19‘RY Ori’ on page 19‘T Ori’ on page 19‘V380 Ori’ on page 19‘V586 Ori’ on page 19‘BF Ori’ on page 19‘HD 37357’ on page 19‘N3sk 81’ on page 19‘HD 37411’ on page 19‘Haro 13a’ on page 19‘V599 Ori’ on page 19‘V350 Ori’ on page 19‘HD 37806’ on page 19‘HD 250550’ on page 19‘VY Mon’ on page 19‘LkHα 215’ on page 19‘HD 259431’ on page 19‘R Mon’ on page 19‘V590 Mon’ on page 19‘GU CMa’ on page 19‘HD 53367’ on page 19‘NX Pup’ on page 19‘HD 76534’ on page 19‘HD 85567’ on page 19‘HD 95881’ on page 19‘HD 97048’ on page 19‘HD 100546’ on page 19‘HD 101412’ on page 19‘T Cha’ on page 19‘LSS 3027 B’ on page 19‘HD 130437’ on page 19‘SS73 44’ on page 19‘HD 132947’ on page 19‘HD 141569’ on page 19‘HD 142666’ on page 19‘HD 142527’ on page 19‘HR 5999’ on page 19‘HD 150193’ on page 19‘AK Sco’ on page 19‘V921 Sco’ on page 19
22 Acke & van den Ancker: Diamonds in Herbig Ae/Be systems
‘KK Oph’ on page 19‘HD 163296’ on page 19‘MWC 297’ on page 19‘VV Ser’ on page 19‘MWC 300’ on page 19‘AS 310’ on page 19‘S CrA’ on page 20‘TY CrA’ on page 20‘R CrA’ on page 20‘T CrA’ on page 20‘HD 179218’ on page 20‘HBC 687’ on page 20‘V1295 Aql’ on page 20