A supply chain improvement methodology for the process ...
220
University of Wollongong Research Online University of Wollongong esis Collection University of Wollongong esis Collections 2007 A supply chain improvement methodology for the process industries Mahew P. J Pepper University of Wollongong Research Online is the open access institutional repository for the University of Wollongong. For further information contact the UOW Library: [email protected] Recommended Citation Pepper, Mahew P. J, A supply chain improvement methodology for the process industries, Doctor of Philosophy thesis, School of Management and Marketing, University of Wollongong, 2007. hp://ro.uow.edu.au/theses/2028
-
Upload
khangminh22 -
Category
Documents
-
view
1 -
download
0
Transcript of A supply chain improvement methodology for the process ...

University of WollongongResearch Online
University of Wollongong Thesis Collection University of Wollongong Thesis Collections
2007
A supply chain improvement methodology for theprocess industriesMatthew P. J PepperUniversity of Wollongong
Research Online is the open access institutional repository for theUniversity of Wollongong. For further information contact the UOWLibrary: [email protected]
Recommended CitationPepper, Matthew P. J, A supply chain improvement methodology for the process industries, Doctor of Philosophy thesis, School ofManagement and Marketing, University of Wollongong, 2007. http://ro.uow.edu.au/theses/2028
A SUPPLY CHAIN IMPROVEMENT METHODOLOGY
FOR THE PROCESS INDUSTRIES
A thesis submitted in fulfilment of the
requirements for the award of the degree
DOCTOR OF PHILOSOPHY
from
THE UNIVERSITY OF WOLLONGONG
by
MATTHEW P. J. PEPPER, BEng (Hons), MSc.
School of Management and Marketing
(2007)

ii
CERTIFICATION
I, Matthew P. J. Pepper, declare that this thesis, submitted in fulfilment of the
requirements for the award of Doctor of Philosophy, in the School of Management and
Marketing, University of Wollongong, is wholly my own work unless otherwise
referenced or acknowledged. The document has not been submitted for qualifications at
any other academic institution.
Matthew P. J. Pepper
iii
ACKNOWLEDGEMENTS
First of all, special thanks must be given to my supervisor, Professor Trevor Spedding,
for his seemingly endless help, guidance, encouragement and most importantly
patience. I thank him for believing in me and giving me the confidence to pursue this
research.
I would like to thank the industrial partners for allowing me to be part of their
organisations while undertaking this research. They have provided their help, precious
time, and resources. I would especially like to thank George Bull, from AB Paper for
his efforts, and John Weir from AB Steel, for welcoming me as part of his team, and
providing active support and interest.
I would like to offer a big thank you to my family for their love and continual support
throughout my education, and to my extended family for their support throughout this
journey.
My heartfelt thanks go to Alison. The love, support, understanding and patience that
she has given me has been beyond the call of duty. This journey would have been
impossible without her, and I am very much grateful for her strength (and proof
reading).
Finally, this thesis is dedicated to Paul D. Pepper, father and friend.

iv
ABSTRACT
Over the last few decades, approaches to continuous improvement have evolved,
undergoing several transformations. Each transformation has built upon strengths of a
previous approach, while also shifting the emphasis between the use of a scientific and
cultural underpinning necessary to achieve “quality” within an organisation.
In order to achieve the correct alignment between the scientific and cultural aspects
necessary for a comprehensive improvement approach, the critical elements necessary
for sustainable change must be identified and understood. This research identifies and
examines the critical elements in the literature, culminating in the creation of a generic
framework of the elements for continuous improvement. This framework identifies two
key stages of knowledge transformation (Foundation Knowledge and Dynamic
Knowledge) that must take place within an organisation if sustainable changes are to be
implemented.
The literature surrounding the application of continuous improvement initiatives is well
established; however the application of such techniques is less well defined in the
process industries, presenting opportunity and scope for the application of continuous
improvement techniques.
The application of improvement techniques in discrete or mass production
environments is well established. However, the process industries present new
opportunities and scope for the exploration and application of such approaches. In
response to this, the generic framework for continuous improvement has then been used
as a platform for the derivation of an industry specific lean six sigma methodology,
referred to as the Supply Chain Improvement Methodology for the Process Industries
(the SCIMPI model).
This thesis demonstrates the application of the proposed SCIMPI model in three
separate case studies, each within a different sector of the process industry, and
designed to explore a different aspect of the SCIMPI model.

v
The first case study considers a lead refinery plant, and serves as a preliminary study,
exploring the feasibility of the SCIMPI model. From this, it is shown that batch-flow
process facilities are well suited to continuous improvement techniques and the use of
simulation.
The second case study considers a newsprint manufacture facility, successfully
highlighting opportunities for improvement that had not been identified or addressed in
previous improvement initiatives.
The final case study looks at an internal supply chain in the steel industry.
Demonstrating the use of the SCIMPI model in a supply chain context, the case study
highlights the interface of hard and soft systems approaches to drive continuous
improvement initiatives.
The three case studies illustrate that the proposed SCIMPI model represents a unified,
industry specific methodology, scientifically underpinned to effectively integrate the
lean and six sigma approaches, in order to address the cultural and operational needs of
a sustainable improvement approach.
vi
TABLE OF CONTENTS
CERTIFICATION .........................................................................................................II
ACKNOWLEDGEMENTS......................................................................................... III
ABSTRACT.................................................................................................................. IV
TABLE OF CONTENTS............................................................................................. VI
LIST OF FIGURES .......................................................................................................X
LIST OF TABLES .....................................................................................................XIV
ABBREVIATIONS ..................................................................................................... XV
1.0 INTRODUCTION.....................................................................................................1
1.1 Background .............................................................................................................1
1.2 Aims and Objectives ...............................................................................................5
1.3 Philosophy...............................................................................................................6
1.4 Scope.......................................................................................................................7
1.5 Layout of Thesis......................................................................................................8
2.0 LITERATURE REVIEW.......................................................................................10
2.1 Introduction...........................................................................................................10
2.2 The Toyota Production System (TPS) ..................................................................10
2.3 Lean Philosophy and Principles ............................................................................15
2.3.1 Lean Tools......................................................................................................20
2.3.2 Simulation as a Lean Tool .................................................................................27
2.4 Successful Lean Efforts ........................................................................................29
2.5 Lean Supply Chains ..............................................................................................32
vii
2.6 Limited Success of Lean .......................................................................................37
2.7 Current Lean Direction (Broadening Scope of Lean)...........................................42
2.8 Continuous Process Lean ......................................................................................45
2.9 Six Sigma ..............................................................................................................54
2.9.1 Six Sigma in Practice .....................................................................................62
2.10 Integration of Lean and Six Sigma......................................................................67
2.11 Characteristics of Change ...................................................................................75
2.12 Summary .............................................................................................................84
3.0 METHODOLOGY..................................................................................................85
3.1 Introduction...........................................................................................................85
3.2 Generic Framework for Continuous Improvement ...............................................85
3.3 Supply Chain Improvement Methodology for the Process Industry (SCIMPI)..101
Stage 0...................................................................................................................111
Stage 1...................................................................................................................112
Stage 2...................................................................................................................115
Stage 3...................................................................................................................119
Stage 4...................................................................................................................125
Stage 5...................................................................................................................126
Stage 6...................................................................................................................128
Stage 7...................................................................................................................129
3.4 Scope of Implementation ....................................................................................132
3.5 Existing Lean Six Sigma Frameworks................................................................136
3.6 Aligning SCIMPI with Soft Systems and Sustainability ....................................139
3.6.1 Comparison of SCIMPI and Soft Systems Methodology..............................140

viii
3.6.2 Comparison of SCIMPI and the Sustainable High Performance Culture
Model............. .......................................................................................................145
3.7 Discussion ...........................................................................................................147
3.8 Summary .............................................................................................................149
4.0 CASE STUDY 1 PRELIMINARY TESTING OF SCIMPI MODEL .............150
4.1 Introduction.........................................................................................................150
4.2 The Refinery Plant ..............................................................................................151
4.3 SCIMPI Implementation .....................................................................................153
4.3.1 Stage 1 Lead and Learn ...............................................................................153
4.3.2 Stage 2 Define ..............................................................................................153
4.4.3 Stage 3 Measure...........................................................................................159
4.4.4 Stage 4 Analyse ............................................................................................162
4.4.5 Stage 5 Improve............................................................................................163
4.4.6 Stage 6 Control ............................................................................................166
4.4.7 Stage 7 Enterprise ........................................................................................167
4.4 Summary .............................................................................................................167
5.0 CASE STUDY 2 NEWSPRINT MANUFACTURE SUPPLY CHAIN............169
5.1 Introduction.........................................................................................................169
5.1.1 Waste Paper Supply .....................................................................................170
5.1.2 Paper Manufacture ......................................................................................170
5.1.3 Printing ........................................................................................................172
5.2 SCIMPI Implementation .....................................................................................173
5.2.1 Stage 1 Lead and Learn ...............................................................................173
5.2.2 Stage 2 Define ..............................................................................................174
5.2.3 Stage 3 Measure...........................................................................................181

ix
5.3 Quality Analysis and Improvement ....................................................................185
5.3.1 Measurement of Luminance .........................................................................185
5.3.2 Analysis of Luminance .................................................................................188
5.3.3 Improvement of Quality Strategy .................................................................190
5.4 Overproduction ...................................................................................................204
5.4.1 Measuring Overproduction Losses ..............................................................204
5.4.2 Analysing the Loss .......................................................................................205
5.4.3 Improving Efficiency ....................................................................................207
5.5 Other Opportunities for Improvement ................................................................210
5.6 Stage 6 Control....................................................................................................212
5.7 Stage 7 Enterprise ...............................................................................................213
5.8 Summary .............................................................................................................214
6.0 CASE STUDY 3 STEEL MANUFACTURE SUPPLY CHAIN.......................217
6.1 Introduction.........................................................................................................217
6.1.2 AB Steel Ltd.....................................................................................................222
6.2 Supply Chain Overview ......................................................................................224
6.3 SCIMPI Implementation .....................................................................................227
6.3.1 Stage 1 Lead and Learn ...............................................................................227
6.3.2 Stage 2 Define ..............................................................................................230
6.3.3 Stage 3 Measure...........................................................................................239
6.3.4 Stage 4 Analyse ............................................................................................251
6.3.5 Stage 5 Improve............................................................................................262
6.3.6 Stage 6 Control ............................................................................................265
6.3.7 Stage 7 Enterprise ........................................................................................266
6.4 Summary .............................................................................................................267

x
7.0 CONCLUSIONS ...................................................................................................269
7.1 Contributions to Knowledge ...............................................................................275
7.2 Future Research...................................................................................................276
8.0 REFERENCES......................................................................................................279
APPENDICES .............................................................................................................298
Appendix 1 X Bar and R Charts for AB Paper .........................................................298
Appendix 2 New Control Limits for AB Paper ........................................................302
Appendix 3 Bottom Loss Data for Jumbo Newsprint Reels .....................................306
Appendix 4 Standardised Customer Reel Sizes ........................................................313
Appendix 5 Visual Basic Code – Reel Scheduling...................................................314
Appendix 6 Wagon Availability at HCPD Plant.......................................................316
List of Figures
2.1 The Lean Cycle………………………………………………………………...…..18
2.2 Value Stream Scope………………………………………………………………..34
2.3 Leagile Map………………………………………………………………………..35
2.4 The Joiner Triangle………………………………………………………….……..59
2.5 The Shift in Focus of TQM…...................................................................................60
2.6 The Shift in Focus of Six Sigma……………………………………….…………..60
2.7 The Desired Holistic Focus for Continuous Improvement……………….………..61
2.8 Competitive Advantage of Lean, six Sigma and Lean Six Sigma…………….…...71
2.9 Phases of Employee Engagement…………………………………………….……82
2.10 Sustainable High Performance Culture Model (SHPCM)…………………….….83

xi
3.1 Simplified View of Continuous Improvement……………………………………..88
3.2 The System in Context………………………………………………………….….91
3.3 Path to Continuous Improvement………………………………………………….93
3.4 Strategic Path for Breakthrough Improvement…………………………………….94
3.5 Generic Framework for Continuous Improvement………………………………...99
3.6 Integrating Lean and Six Sigma…………………………………………………..107
3.7 The Supply Chain Improvement Methodology for the Process Industries……….110
3.8 Stages to Improvement…………………………………………………………...131
3.9 Scope of SCIMPI Approach……………………………………………………...134
3.10 Soft Systems Methodology……………………………………………………...140
3.11 SSM, SCIMPI and SHPCM Interactions………………………………………..146
3.12 Sustainability vs. Complexity…………………………………………………...147
4.1 The Refinery Process……………………………………………………………..152
4.2 Refinery Current State Map………………………………………………...…….155
4.3 Refinery Future State Map………………………………………………………..156
4.4 Crane Allocation………………………………………………………………….157
4.5 Current State Model in Arena…………………………………………………….161
4.6 Future State Model in Arena……………………………………………………...164
4.7 Re-allocation of Cranes…………………………………………………………...165
5.1 Case Study Scope…………………………………………………………………169
5.2 Newsprint Supply Chain………………………………………………………….174
5.3 AB Paper Current State Map……………………………………………………..176
5.4 Key Process Groups………………………………………………………………177
5.5 Post-bleaching Luminance………………………………………………………..186
5.6 Range Chart, Post-bleaching……………………………………………………...187

xii
5.7 Consequences of Misplaced Control Limits……………………………………...191
5.8 Post-bleaching Partial ACF……………………………………………………….191
5.9 X Bar Chart for Post-bleaching with Extended Control Limits…………………..194
5.10 Validation of R Chart for Post-bleaching……………………………………….197
5.11 Neural Network Diagram…………………………………………………….....199
5.12 Post-bleaching & Dump Tank Inputs………………………....………………...202
5.13 Contour Plot Showing Optimum Settings Range for Luminance…….……....…203
5.14 Rationalised Data………………………………………………………….……..206
5.15 Reel Allocation Program………………………………………………….…….208
6.1 Supply Chain Scope………………………………………………………….…...225
6.2 Current State Map…………………………………………………………….…..232
6.3 Future State Value Stream Map……………………………………….………….236
6.4 iThink Simulation Model of Supply Chain…………………………………........241
6.5 Wagon Capacity at HCPD………………………………………………………..242
6.6 Production of Coil (Tonnes/Hr)……………………………………………….....242
6.7 Time between Switch and Pull Operations……………………………………....247
6.8 Shunt Time Variation – Day Shift…………………………………………….....248
6.9 Shunt Time Variation – Night Shift…………………………………..………….249
6.10 Wagon Availability……………………………………………………….…......251
6.11 Batch Size for CPCM…………………………………………………………....253
6.12 Time Taken for Phone to Switch – Day Shift……………….…………….....….254
6.13 Time Taken for Phone to Switch – Night Shift………………………….………254
6.14 Time Taken for Switch to Pull – Day Shift……………………………….……..255
6.15 Time Taken for Switch to Pull – Night Shift……………………………….…....255
6.16 Revised Day Shift Phone to Switch…………………………………….……......261

xiii
6.17 Revised Night Shift Phone to Switch…………………………………………....261
6.18 Revised Night Shift Switch to Pull........................................................................262
A1.1 X bar Chart of Dump Tank Process......................................................................298
A1.2 R Chart for Dump Tank Process...........................................................................298
A1.3 R Chart for Post-bleaching Process......................................................................299
A1.4 X bar Chart for De-inking Process.......................................................................299
A1.5 R Chart for De-inking Process..............................................................................300
A1.6 X bar Chart for PM14 Process........................................................... ..................300
A1.7 R Chart for PM14 Process....................................................................................301
A2.1 X bar Chart for PM14 - Independent Data...........................................................302
A2.2 R Chart for PM14 - Independent Data.................................................................302
A2.3 R Chart for De-inking Process - Independent Data..............................................303
A2.4 X bar Chart for De-inking Process - Independent Data........................................303
A2.5 R Chart for Post-bleaching Process - Independent Data......................................304
A2.6 X bar Chart for Post-bleaching - Independent Data.............................................304
A2.7 X bar Chart for Dump Tank Process - Independent Data....................................305
A2.8 R Chart for Dump Tank Process - Independent Data..........................................305

xiv
List of Tables
2.1 Process Flow/Batch Flow Characteristics................................................................48
2.2 Synergies between lean and Six Sigma....................................................................69
3.1 Aligning Tools to Generic Framework..................................................................106
3.2 Strengths and Weaknesses of Existing Lean Six Sigma Frameworks...................136
4.1 Balanced Scorecard Drivers...................................................................................158
5.1 Balanced Scorecard Drivers...................................................................................179
5.2 Newsprint Luminance Levels.................................................................................180
5.3 Cost of Manufacture...............................................................................................183
5.4 Value Velocity Indices...........................................................................................183
5.5 Summary of Control Limit Changes......................................................................195
5.6 Summary of Out of Control Conditions.................................................................196
5.7 Accuracy of NN Model..........................................................................................200
5.8 NN Output Matrix..................................................................................................201
5.9 Jumbo Reel Bottom Loss.......................................................................................204
6.1 Cross-functional Team Roles.................................................................................229
6.2 Balanced Scorecard Drivers...................................................................................237
6.3 Cost Data for Supply Chain Nodes........................................................................243
6.4 Value Velocity Measures........................................................................................245
A3.1 Bottom Loss Data for Newsprint Reels ...............................................................306
A4.1 Standardised Customer Reel Sizes.......................................................................313
A6.1 Wagon Availability at HCPD Plant.....................................................................316

xv
ABBREVIATIONS
Abbreviation Meaning
5S Sort, Simplify, Sweep, Standardise and
Sustain
ABC Activity Based Costing
ABM Activity Based Management
ACF Autocorrelation Function
AR(1) First order Autoregressive Process
BBC British Broadcasting Corporation
BOS Basic Oxygen Steelmaking
BSC Balanced Scorecard
CANDO Cleanup, Arrange, Neatness, Discipline
and Ongoing Improvement
CEO Chief Executive Officer
CI Continuous Improvement
CPCM Coupled Pickle Cold Mill
CT or C/T Cycle Time
DIP De-inking Process
DOE Design of Experiments
DMAIC Define, Measure, Analyse, Improve,
Control
DT Dump Tank
ERP Enterprise Resource Planning

xvi
FPP Fibre Preparation Plant
GE General Electric
HCPD Hot Coil Processing Despatch
HSM Hot Strip Mill
IMVP International Motor Vehicle Program
IT Information Technology
JIT Just in Time
LDMAICE Lead & Learn, Define, Measure, Analyse,
Improve, Control, Enterprise
M/MC Moulding Machine
MIT Massachusetts Institute of Technology
MRP Materials Requirement Planning
NHS National Health Service
NN Neural Network
NUMMI New United Manufacturing Incorporated
OTIF On Time In Full
PB Post-bleaching
PIVOT Paper Industry Value Optimisation Tool
PPC Production Planning and Control
QFD Quality Function Deployment
SCIMPI Supply Chain Improvement Methodology
for the Process Industries
SCM Supply Chain Management
SCOR Supply Chain Operations Reference Model
SCV2 Supply Chain Velocity Project

xvii
SHPCM Sustainable High Performance Culture
Model
SMED Single Minute Exchange of Die
SPC Statistical Process Control
SPM Skin Pass Mill
SSM Soft Systems Methodology
TPM Total Productive Maintenance
TPS Toyota Production System
TQM Total Quality Management
UK United Kingdom
US United States
VSM Value Stream Map(ping)
VV Value Velocity
WIP Work In Progress

1
1.0 Introduction
1.1 Background
In the last fifty to sixty years, a myriad of approaches, techniques and philosophies for
continuous improvement have been (and continue to be) developed, in an attempt to
address the efficiency, quality and cultural concerns of industry. Each one of these
approaches seems to have a brief shelf-life before being replaced by an updated version
or opinion. As each of these approaches, or ‘fads’ (as they might popularly be known)
is replaced, or fades from view, it leaves behind a legacy of core strengths and
weaknesses, which in turn form the foundation for the next wave of improvement
initiatives.
However, with each new fad or wave of philosophies that become part of everyday
business language, a shifting focus between philosophical, cultural concepts and a data
driven scientific approach can be found. This skewed development over time could be
attributed to the loose associations between quality, the scientific approach, and the
cultural aspects inherent in any system. To achieve sustainable continuous
improvement, a balance between these elements must be attained.
Lean and six sigma are two of the most widely used and discussed improvement
paradigms to emerge in recent times. However, the concept of lean six sigma as a
conjoined approach to process improvement has yet to fully mature into a specific area
of academic research (Bendell, 2006). Furthering this point, it can be said that in
practice the majority of efforts to fully and comprehensively implement a lean six sigma

2
initiative to its full potential have not been realised (Smith, 2003). The two approaches
have often been implemented in isolation (Smith, 2003), creating lean and six sigma
sub-cultures to emerge within the organisation. This can cause conflicts of interest,
drain resources (Bendell, 2006), or even competition for the same resources (Smith,
2003).
Bendell (2006) suggests that it would be beneficial for all if a single approach that
effectively brought the two philosophies together was available. Although there appears
to be a number of consultancy models for lean six sigma freely available on the internet
by consultants, the presented methodologies are put together without logical explanation
(Bendell, 2006) and more importantly, with no theoretical underpinning or explanation
for the choice of techniques.
Improvement efforts need to be directed by a strong approach that is capable of
maintaining direction and focus within the business. Both lean and six sigma have the
same end objective, to achieve quality throughout, whether it is customer service, the
product, the process or training and education of the workforce. They are effective on
their own, but organisations may well find that after initial improvement, they reach a
plateau; and find it difficult to create an ongoing culture of continuous improvement
(Arnheiter and Maleyeff, 2005). To overcome this, the lean approach must integrate
the use of targeted data to make decisions and also adopt a more scientific approach to
quality within the system. Six sigma on the other hand needs to adopt a wider systems
approach, considering the effects of muda on the system as a whole; and therefore
quality and variation levels (Arnheiter and Maleyeff, 2005).
3
A state of equilibrium needs to be achieved between the two, moving away from a fixed
approach in any one direction. The balance lies in creating sufficient value from the
customer’s viewpoint, so that market share is maintained, while at the same time,
reducing variation to acceptable levels so as to lower costs incurred, without over-
engineering the processes.
In order to meet the requirements of today’s businesses, an improvement framework
needs to be effective on two levels, providing strategic direction while also considering
the process level improvements to achieve the strategic goals. Equilibrium between
complexity and sustainability must be found, balancing the two philosophies of lean and
six sigma, so that the advantages of both can be realised. Finally, the framework should
be structured around the type of problem experienced. These points present key
questions to be answered when considering the construction of an effective lean six
sigma framework. Taking this a stage further, is to develop an industry specific
framework.
Continuous improvement techniques such as lean have had success in a number of
industry sectors and experienced limited success in others. The implementation of lean
techniques within the process industry continues to present new scope for the
application of continuous improvement approaches.
Traditionally successful, with easily made profits, the process industry experienced
significant growth up until the 1960s (Anderson, 1997). Facilities were designed with
huge storage capabilities (Anderson, 1997), a legacy which has left many of today’s
businesses in the sector with inflexible facilities. If the contribution of the process

4
industries to national economies is considered (Burgess et al., 2002), and in the face of
increased competition through globalisation, then the importance of maximising value
added activities and ensuring durable market presence in the global arena is critical.
Although the literature describes a number of improvement efforts within the process
industry sector, it is suggested that an industry specific lean six sigma framework will
further these efforts, highlighting the benefits of a customised approach, derived from
the critical elements necessary for sustained improvement, so that process industries
may remain competitive and overcome the legacy of inefficiency and mass storage.

5
1.2 Aims and Objectives
This aim of this research is to identify and address the need for sustainable
improvement archetypes. The following objectives have been developed to address the
perceived gaps in the literature and provide industry with a solution to sustainable
continuous improvement:
1) Review the literature surrounding the strengths and weaknesses of the lean
manufacturing philosophy, the evolution of the six sigma paradigm, and the
characteristics of change. The purpose being to identify the key elements
required for a generic framework for continuous improvement.
2) In response to the findings of the literature review, develop a generic framework
for continuous improvement, to guide the creation of an industry specific lean
six sigma methodology for the process sector.
3) Test the efficacy of the proposed methodology using three industry based case
studies. The case studies will be based in different process industry
environments to analyse their responses to the proposed methodology.

6
1.3 Philosophy
Based on the objectives established in section 1.2, a comprehensive literature review
will be conducted on the area of lean and six sigma. The findings from this review of
the literature will be used to derive a generic framework, comprising of the perceived
critical elements that are necessary for a sustainable continuous improvement initiative.
This generic framework is then used as a platform for the creation of a lean six sigma
methodology, designed specifically for the process industry sector, the SCIMPI
methodology. Different aspects of the SCIMPI methodology are then explored through
its application to three case studies, each within a different sector of the process
industry, to illustrate the potential of the SCIMPI methodology.

7
1.4 Scope
This research emphasises the criteria essential for sustainable continuous improvement.
Focussing on the integration of lean and six sigma techniques, this thesis concentrates
on the application of a proposed and scientifically underpinned lean six sigma
methodology within the process industry. The efficacy of the proposed methodology is
considered through the use of three individual case studies, each based in a different
sector of the process industry. The scope of this thesis does not extend to a full
longitudinal investigation of the cultural implications of continuous improvement within
these case studies due to the obvious time constraints. However, the thesis does provide
a basis for instigating such change in the organisations. This thesis solely deals with
retrospective redesign of current process industry organisations. It is considered beyond
the scope of this thesis to address original system design, as this is a vast area of
research in its own right, and would require a different approach to retrospective
redesign. However, in principle, similar methodologies can be adopted to achieve this.

8
1.5 Layout of Thesis
Chapter two presents a literature review of the lean manufacturing philosophy, six
sigma methodology, and the integration of lean and six sigma techniques. The
application of lean techniques in the process industry sector is reviewed, before the
characteristics of change are explored.
Chapter three discusses the creation of a generic framework for continuous
improvement, derived from the literature analysed in chapter two. This framework is
then used to construct an industry specific lean six sigma framework for application to
the process industry sector, the Supply Chain Improvement Model for Process
Industries (SCIMPI). The scope of the framework is discussed, before a comparative
study between the SCIMPI model and existing lean six sigma frameworks is put
forward. The SCIMPI model is then discussed further, in relation to Soft Systems
Methodology.
Chapter four presents the first of three case studies. Each case study is specifically
designed to highlight different aspects of the proposed framework. This case study
follows a straight forward application of the SCIMPI methodology in a European lead
refinery, and provides an exploratory investigation using simulation.
Chapter five discusses the more detailed application of the SCIMPI methodology, using
a paper making facility in Europe as the focus of the initiative. This case study
highlights the use of value stream mapping to leverage soft computing techniques for

9
the analysis of variation. The implementation path is discussed, followed by the results
and conclusions.
Chapter six details the application of the proposed methodology in a steel
manufacturing supply chain, and is designed to highlight the SCIMPI methodology in a
larger, supply chain context. The application of SCIMPI in this instance explores the
interface of hard and soft systems as part of the journey towards continuous
improvement. Conclusions are then brought together from the findings of the project.
Chapter seven draws together the findings of the three case studies, providing
discussion and conclusions on the implementation and testing of the SCIMPI
methodology in practice, before discussing potential aspects of the research suitable for
future consideration.
10
2.0 Literature Review
2.1 Introduction The lean philosophy is an established concept that due to its very nature is continuously
evolving with applications in new areas. Although research has been undertaken on the
implementation of lean within various industries, the many tools and techniques that
form the ‘tool box’, and it’s integration with six sigma, there is no definitive
implementation guide that informs which parts of this tool box should be used, when
and how, via industry specific methodologies. This chapter provides a review of the
literature, through the discussion of successful lean implementations and its expansion
into supply chain management; followed by the examination of areas where lean
initiatives have had limited success. The current direction of lean research is addressed,
culminating in its application in one of the less travelled paths, the continuous process
industry. The integration of lean principles with six sigma methodology is examined,
and in response to this, the chapter attempts to identify the scope of a specific
methodology for the continuous process industry, with key lean and six sigma tools at
its foundation.
2.2 The Toyota Production System (TPS)
The Toyota Production System (TPS) provided the basis for what is now known as
Lean Thinking, as coined by Womack and Jones (1996). The development of this
approach to manufacturing began shortly after World War II, pioneered by Taiichi
Ohno and associates, while employed by the Toyota motor company. Forced by

11
shortages in both capital and resources (such as storage) Eiji Toyoda, the then president
of Toyota, instructed his workers to eliminate all waste. Waste was defined, as
“anything other than the minimum amount of equipment, materials, parts, space and
time which are absolutely essential to add value to the product” (Russell and Taylor,
2000, p. 737). Working to this brief through a process of trial and error, Ohno would go
on to develop the philosophy known as the Toyota Production System (TPS).
Bicheno (2000), outlines Ohno’s five Lean Principles:
1. Specify what does and does not create value from the customers’ perspective.
2. Identify all the steps necessary to design, order and produce across the whole
value stream to highlight waste.
3. Make those actions that create value flow without interruption.
4. Only make what is pulled by the customer.
5. Strive for perfection by continuous improvement.
The philosophy behind the Toyota Production principles, as noted by Balakrishnan
(2002) is to maintain the continuous flow of products in systems, so that demand
changes will not cause disruption to the system. Established production management
methods were followed, ultimately leading to the elimination of all unnecessary
inventories, of both finished and unfinished goods within the production line.
Following from the refined and methodical integration of these practices, the Japanese
went on to achieve a total, new manufacturing paradigm, as discussed by White and
Prybutok (2001), which as Bartezzaghi (1999) examines, became the dominant
production model to emerge from a number of concepts around at the time (Katayama

12
and Bennett, 1996). As a result of this, today, Toyota manufacturing facilities remain
the benchmark when considering the lean transition.
Through their participation in the International Motor Vehicle Program (IMVP), which
analysed the performance differences between the Japanese and Western automotive
industries, Womack et al. (1990) marked the beginning of the realisation that becoming
a global company was crucial if organisations wanted to remain in business and
maintain existing (or identify new) areas of competitive advantage. Able to see the
increasingly competitive stance Japan’s manufacturing industry was taking, Western
industry had no choice but to try and adopt this new, sometimes counter-intuitive way
of thinking. The TPS was adapted and under the title of Just-In-Time (JIT)
manufacturing, US and European companies began their lean journey.
As suggested in the name, JIT requires only necessary products to be provided in
necessary quantities at necessary times. As discussed by Russell and Taylor (2000) “if
you produce only what you need when you need it, then there is no room for error”
(Russell and Taylor, 2000, p. 737). White and Prybutok (2001) outline the key factors
of the JIT methodology as follows:
JIT is an integrated management system that consists of the following ten elements:
Flexible resources
Cellular layout
Pull production system
Quick set-up times (to reduce overall lead time)
13
Kanban production control
Quality at the source (so that nothing of poor quality is passed on to the next
process)
Small-lot production
Total productive maintenance
Uniform production levels (in order to react to changes in demand)
Supplier networks
Svensson (2001) argues that while Ohno and associates of Toyota are widely regarded
as establishing the JIT theory through the TPS approach, many of the key concepts have
been around since the beginning of the twentieth century. Peterson (2002) also points
out that JIT ideologies were founded in part through the work of Ernest Kanzler and
Henry Ford, and the key success factors for JIT production, such as manageable
supplier networks; efficient transportation and materials handling have long been in the
minds of manufacturers. However, while these key concepts and techniques have been
adapted from the early figures of manufacturing, they have evolved and adapted to
modern society through the pioneering work of Ohno and others.
Storhagen (1995) discusses the transition of JIT principles from East to West and the
different perspectives encountered when looking at the initial divide in manufacturing
industries between them. The differing results between Japanese implementation
projects and those undertaken in the West have provided useful insight into the reasons
behind the success of JIT in the respective countries, proving that cultural changes are
essential for a successful transition. The Japanese have long understood that

14
empowerment, involvement and working as a team in order to achieve the same goal
goes hand in hand with success.
Furthering this perspective, Stewart (1998) goes on to provide a comprehensive
summary of the cultural benefits that entail the implementation of a lean culture:
(1) Lean production allows workers to work “smarter not harder”.
(2) Lean production creates a safer work place through increased
investment and an increase in skilled workers.
(3) Accordingly, lean production increases job satisfaction.
(4) Lean production creates a new industrial democracy whereby employees
have a mutual share in the success of the company – trade unions are
thus irrelevant where they pursue a traditional Anglo-Saxon agenda.
(5) While lean production may have begun in Japan, it is now no more
Japanese than is Fordism any longer American.
(6) There is one best way to promote business success.
Point 5 is especially useful in illustrating just how much other countries have embraced
lean methods, and by being recognised as an essential path to tread, it has become part
of the everyday language within the manufacturing organisations throughout the World.

15
2.3 Lean Philosophy and Principles
Lean manufacturing is the next stage of the Toyota Production philosophy, using many
of its techniques and tools. The foundation of the lean vision is still a focus on the
individual product and its value stream, identifying which activities and processes are
value added and non-value added, and to enhance the value and eliminate all waste, or
muda, in all areas and functions within the system (Womack and Jones, 1996).
In order to implement lean, it is important to understand what the customer is prepared
to pay for (i.e. value added processes). A comprehensive strategy needs to be
implemented, incorporating benchmarks, so that any changes within the system can be
quantified.
The main target of lean thinking is the elimination of waste that isn’t always apparent
when first considering a system. Seven forms of waste have been identified; over-
production, defects, unnecessary inventory, inappropriate processing, excessive
transportation, waiting, and unnecessary motion. These wastes have been thoroughly
discussed in literature surrounding lean research. The following summarises Ohno’s
seven wastes:
Overproduction. In other words making too much too soon. This is generally seen as
the most significant of all the wastes due to the fact that it can cause any number of
potential problems and other wastes.
Waiting. This is in direct conflict with the third lean principle, flow.

16
Unnecessary motion. This refers to the excess turning, bending, stretching etc. of
operators within the workplace in order to do their job.
Any movement of material around a factory is not a value added activity therefore it is
waste, referred to as unnecessary transportation.
Inappropriate processing brings attention to the employment of a sophisticated
machine to carry out a number of processes when one or two more simple machines
would achieve the task, or the use of machines that are not capable of producing
sufficient quality.
Defects are products or components that do not match customer specifications.
(External defects can encompass warranty, repairs, and even lost custom (Womack et
al., 1990)).
The driving force behind the JIT and lean ideals is the waste represented by
unnecessary inventory. This can cause long lead times, hides problems and uses more
space. Many people believe lean to be a counter intuitive methodology, as it lends itself
to getting rid of safety buffers of inventory (Bicheno, 2004). However, any reduction in
inventory should be underpinned by a comprehensive strategy of incremental reductions
that eventually lead the way to minimal inventory levels within the system (be it a
facility or supply chain). While being the overall goal, ‘zero inventory’ is not practical
in many situations. The lean philosophy emphasises flow, therefore the minimum
inventory that enables or encourages flow is the objective. Buffer inventories may be
necessary to achieve this, but again, a strategic approach must be taken so that inventory

17
may be reduced to these optimum levels in a controlled manner, with minimum
disturbance to the system.
Every level within the organisation, from top management down to shop-floor workers
must make a concerted effort to commit to lean in order to complete a full
implementation. This commitment from employees must be used in conjunction with a
comprehensive strategy for analysis and implementation; otherwise management can
become distant from the shop-floor and drift away from the lean change.
Ahlstrom (1998) identifies these issues through an implementation study, and discovers
that there are optimal sequences for the implementation of lean techniques, which can
be sub-divided according to the amount of effort and resources management supply.
This commitment must also come from the shop floor employees, who of course are just
as important as management to any implementation or change of strategy. It is essential
that sufficient training, empowerment, and motivation is given to these employees to
make a lean transition a successful venture.
A true lean initiative will give the employees the power to stop production flow
whenever a problem is encountered, and promote the concept of helping each other out
in times of difficulty. In turn, employees become multi-skilled, and provide a real
commitment to the continuous improvement of every stage of production within their
facility (Forza, 1996).
18
In today’s ever more competitive environment, the idea of lean thinking, as popularised
by Womack et al. (1990) has become a staple for the manufacturing industry, where
being flexible to constantly changing and more demanding customers has become
essential for survival and growth, rather than an option. Since its rapid spread among
the manufacturing community from the 90s onwards a myriad of diverse industries are
having to challenge their thinking (Katayama and Bennett, 1996), and constantly
question every process. Management now not only need to manage effective budgets
and deliver quality to the customer, they should also develop and sustain a culture of
continuous improvement within their organisation. This creates opportunity to identify
paths to long term strategic advantage.
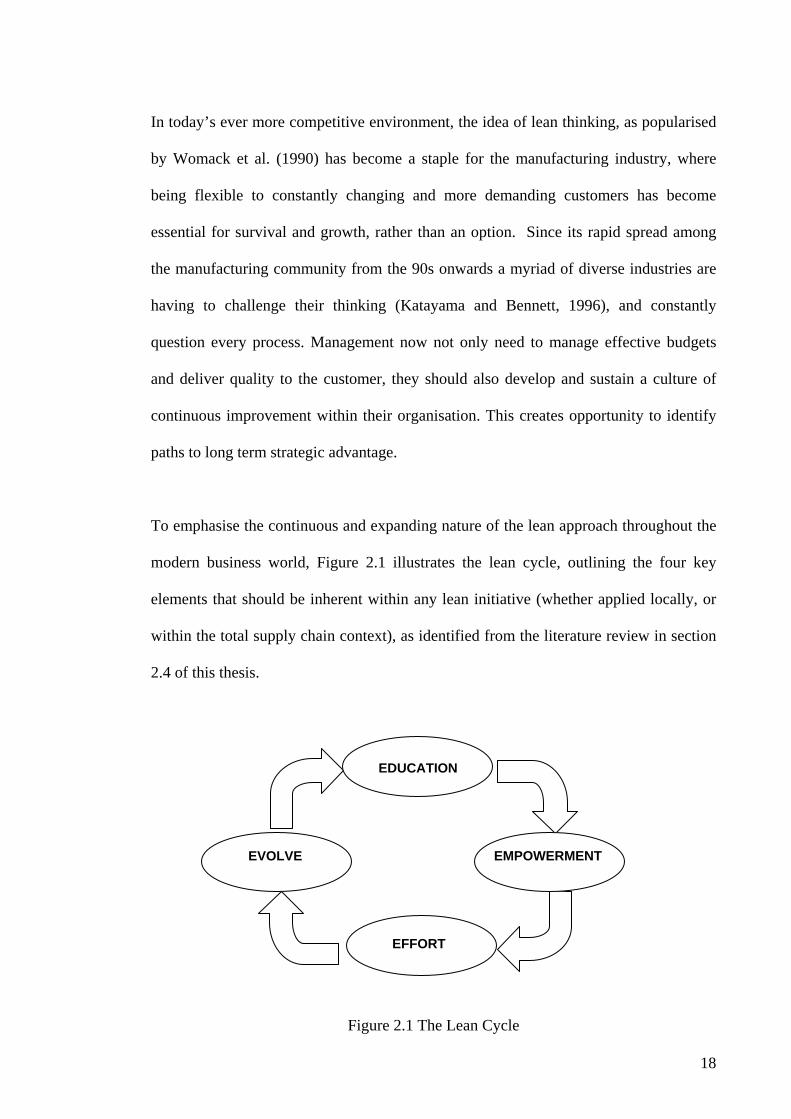
To emphasise the continuous and expanding nature of the lean approach throughout the
modern business world, Figure 2.1 illustrates the lean cycle, outlining the four key
elements that should be inherent within any lean initiative (whether applied locally, or
within the total supply chain context), as identified from the literature review in section
2.4 of this thesis.
Figure 2.1 The Lean Cycle
EMPOWERMENT
EFFORT
EVOLVE
EDUCATION

19
Education refers to the culture change necessary for a lean initiative to work. It also
refers to teaching employees how to ‘think lean’, i.e. what the seven forms of waste are,
and how to tackle them.
Empowerment refers to the power and authority given to employees to identify
problems and solve issues within the organisation. In other words, ownership of the
process, and how it is managed. Knowing that their voice will be heard, and their
opinion discussed rather than dismissed.
Empowerment and education work hand in hand through the use of kaizen events where
the mapping and analysis of a process leads to physical changes being made.
Effort describes the work put in to identify opportunities for improvement, and kaizen
events – the need to constantly be aware of the work environment and how it can be
changed for the better.
Evolve emphasises the cyclical nature of continuous process improvement, and also the
need to consider the environment outside of the facility. Extending lean thoughts
throughout the supply chain, is the only way to fully implement lean successfully
without its suppliers and customers adhering to the same working principles.

20
2.3.1 Lean Tools
There are a number of tools that can be used in order to identify and eradicate sources of
muda within any particular system, for example, Value Stream Mapping, Total
Preventative Maintenance and SMED among others. The following section discusses
these tools and the part they play in the transition to Lean status.
“Whenever there is a product for a customer,
there is a value stream.
The challenge lies in seeing it.”
(Rother and Shook, 1999, p. ii)
The most important step at the beginning of a continuous improvement effort is the
mapping of the facility. This is so the current state of operations can be identified, and
the resulting map can be used as a platform for analysis. Value Stream Mapping (VSM)
is an approach used to differentiate between value added and non-value added processes
in material and information flow within a system. The current state system is defined,
followed by a perceived/desired future state process. This future state map is then used
to develop strategies to implement lean manufacturing philosophies and concepts.
VSM is concerned with three types of flow: materials, information and people.
Obvious areas for improvement, which can be implemented with minimal expenditure
by the company, can be identified, such as parallel working, and flexibility through
multi-skilling on the shop floor. As discussed by Rother and Shook (1999), value stream

21
mapping provides a common language when talking about manufacturing processes. It
also ties together all of the lean techniques, which avoids the temptation to cherry pick
just one or two of the easiest to implement. No other tool depicts the linkages between
information flow and material flow, and it is a qualitative technique that is used to
describe how an organisation should ideally operate for continuous flow to be achieved.
It should be noted here that the book “Learning to See”, written by Rother and Shook
(1999) has become the definitive text for any organisation wishing to start the lean
journey.
VSM is commonly applied independently without any other tools or techniques, under
the misconception that this is lean. In fact, this is not the case, as a whole strategic
philosophy is needed in order for a system to be running at a truly lean level. To
achieve this, VSM needs to be methodically applied before any other tools such as
Single Minute Exchange of Die (SMED) and 5S is implemented to achieve a fully
comprehensive approach. Some would argue that 5S is or should be done first, so that
any ‘low-hanging fruit’ may be picked. However, implementing 5S before anything
else is done may well lead to the organisation stumbling when it comes to implementing
other, more involved or technical tools and techniques. VSM must be the starting point
for a lean/six sigma/lean six sigma initiative. By highlighting opportunities for
improvement, VSM provides direction for the application of specific tools and
techniques. When used as part of an effective methodology, a comprehensive strategy
for improvement can be drawn from the current state map produced. Without this
direction, it is difficult to define the scope of the project. This may result in tools such
as 5S being implemented in every situation, whereby the focus of overall improvement

22
is consumed with 5S, detracting from the rest of the viable techniques that will lead to
sustainable changes within the system. This is not to say that 5S is not a powerful
approach, rather that to be effective as part of a whole initiative, it needs to be directed
and managed appropriately, so that the most can be gained from it’s use.
Sheridan (2000) puts forward the theory that the practical nature of VSM (i.e. the paper
and pencil approach) limits the amount of detail collected and also detracts from the
actual system workings (the action of using pencil and paper to draw the map may
remove focus fropm the actual system being analysed). This dynamic view looks
beyond VSM as giving a quick, succinct overview of where “muda” is present, and
develops the idea of the mapping process itself becoming a continuous tool, constantly
being updated via software (Sheridan, 2000). Although designed to be a snap-shot of
the overall system, when constructing a VSM in the traditional manner, it is limited in
the data that it can represent. Academics such as McDonald et al. (2002), Lian and
Landeghem (2002) and Abdulmalek and Rajgopal (2007) have explored the integration
of VSM with a simulation approach, while a multitude of VSM software has become
available over the internet. The introduction of such software to the market has
provided users with the ability to create functional VSMs that include significantly
more data than the traditional approach. The software also presents the user with a
dynamic view of the value stream, rather than a static picture, providing valuable insight
through the exploration of potential improvements and their implications on the system,
and as a result, will play an important part in the formation and focus of implementation
strategies for continuous improvement. VSMs will become a powerful aid for
continuous improvement initiatives, driven by the flexibility and increased information

23
made available to improvement teams, coupled with the ability to observe the ‘real-
time’ impact of proposed improvements.
While VSM provides direction, scope and information for a lean initiative, using the
key techniques of 5S and SMED as foundation blocks for improvement, simulation,
TPM and six sigma take the initiative further still, targeting the opportunities for
improvement brought to light by the foundation block tools. Six sigma addresses
specific quality issues, by introducing statistical monitoring of the system. In order to
get an efficient process, it is necessary to adopt lean ideas. Six sigma can be used in
conjunction with lean to reduce the variation. If six sigma was the sole improvement
methodology used, the variation would be minimised, but on generally wasteful
processes (Dahlgaard and Dahlgaard-Park, 2006).
Developed by Shigeo Shingo in the 1950’s, the Single Minute Exchange of Die
(SMED) approach has had particular focus, selected in order to banish the high volumes
of inventory that has long been necessary due to the lengthy set-up times of machines
on the shop floor (Dailida, 2000).
SMED is concerned with the reduction of the time taken for a machine to change from
producing one product to another. Historically, long set-up times have forced
companies to manufacture components and products in large quantities. In contrast,
lean philosophy directs production in small batch sizes, to ensure that customers can be
supplied in required quantities without the holding of large stocks. As part of this lean
view, SMED is viewed as a “key pre-requisite for increased flexibility” (Mileham et al.,
1999, p. 785). Mileham et al. (1999) further this concept through their action research

24
approach to the creation and application of “Design for Changeover” (Mileham et al.,
1999, p. 785), experiencing positive results from a number of applications. Moxham
and Greatbanks (2001) discuss the initial thoughts surrounding SMED, mainly that
limitations are found outside of traditional press manufacture. However, as is outlined
in their writings, work has been done to adapt and add to SMED techniques in order to
provide a universally relevant tool.
Total Productive Maintenance (TPM) is another tool integral to lean. It is concerned
with prevention of anything that causes an interruption to the system – such as machine
breakdowns, instead of “fire-fighting” problems when they occur. There are seven TPM
pillars, as discussed by Ireland and Dale (2001), which consolidate the focus of TPM
implementation: Focussed improvements, autonomous maintenance, planned
maintenance, quality maintenance, education and training, early equipment
maintenance, and safety and the environment.
A system cannot be flexible and responsive to customer demands if the reliability of any
section of that system can be brought into question.
Closely linked with Total Quality Management (TQM), the scope of TPM covers issues
resulting from breakdowns, to machine/process performance and quality. (Yamashina,
2000, p. 139) illustrates the synergies between TPM and TQM and JIT in the following
statement:

25
“In Japan it is said that in order to be strong enough in manufacturing one has to have
good brains which require total quality management (TQM), but one also needs to have
strong muscles or, in other words, strong manufacturing capability which requires total
productive maintenance (TPM). Moreover, one has to have a good nervous system to
connect the brains with the muscles, which means just-in-time production.”
This summary clearly explains the interactions and needs of the three techniques. A
system cannot be flexible and responsive to customer demands if the reliability of any
section of that system can be brought into question. Essentially, the integration of lean
or JIT thinking provides cohesion TQM and TPM, bringing together the concept of
management commitment, teamwork and a scientific approach underpinned by a
reliable system and the strategies necessary to achieve this.
Willmott (1994) emphasises the need for constant awareness training sessions in order
for a successful culture change into TPM. A comprehensive approach covering the
ongoing training and inclusion of all employees, is key to success, and should be used in
conjunction with measures to quantify the results in order to present the management
with proof of the ongoing gains witnessed. Lean philosophy assumes sufficient machine
availability and reliability (Smalley, 2005), which is where TPM provides the support
for lean through scheduled maintenance etc., ensuring no equipment failures and
maximum reliability – essential for a lean culture to function properly.
As perceived by Ravishankar et al. (1992), TPM (as with any initiative) cannot be
expected to produce great results overnight. Bamber et al. (1999) go on to discuss how
many organisations fail to successfully implement TPM, citing reasons such as lack of

26
management support, and insufficient time allowed for the evolution of a TPM culture.
Due to the nature of the approach (a cultural change), many of the issues encountered
when implementing TPM are echoed in lean implementation efforts. This underlines
the synergies between the two philosophies, as being culture driven approaches that rely
on one another to be fully comprehensive.
As can be seen from the literature, both TPM and lean have common themes and
approaches to implementation, as well as cultural change. To this end, Cua et al. (2001)
suggest a case for the joint application of TPM, and JIT, and highlight the compatibility
of these philosophies, continuing on to investigate the manufacturing performance
associated with the level of implementation. The synergies between TPM and lean
make them prime candidates for providing a comprehensive approach to continuous
improvement activities. Yamashina (2000) adds weight to this by dealing with the
benefits and necessity of looking at JIT in conjunction with TPM to achieve world-class
manufacturing status.
The installation of a TPM system is crucial to maintain the flexibility and dynamism
within a lean environment, while six sigma focuses on a data driven approach to target
variation within a system. Simulation provides dynamic views and analyses of
proposed improvements from all angles, such as; inventory tracking, economic
justification and data, and the effects of physical layout alterations. All of these
parameters are targeted by lean, but are not interpreted on the traditional static Value
Stream Map, constructed with pencil and paper.

27
Perhaps the most widely used of the lean tools is 5S, or the good housekeeping
approach. 5S itself refers to; Sort, Straighten, Shine, Systemise and Sustain. Also
known as CANDO, as outlined by Bicheno (2000), it is concerned with changing the
mindset of the organisation and making ordered and standardised processes normal
routine instead of an exception. It drives the need for pride in the workplace or ‘good
housekeeping’. 5S is fundamental to achieving a lean business and is equally at place
on the shop floor, or in the office.
Sort refers to throwing out what is not used – categorise everything into sections
depending on how often they are used. Straighten directs the employee to locate
everything that is used in the best relevant place for it to be easily reached or seen. This
can be summarised as, if something needs to be seen, put it where it can be looked at,
while if something needs to be used, put it where it can be picked up etc.
Shine describes the action of physically tidying up the work area, and constantly
keeping check for things that are out of their correct place.
Once all of the first three “Ss” are in place, the fourth S, Standardise, can be introduced,
and finally Sustain this by committing to a continuous improvement workplace ethic.
2.3.2 Simulation as a Lean Tool
Variation within a system is not specifically targeted by lean tools such as value stream
mapping. Simulation models allow the user to analyse this variation by modelling the
interactions between the entities, resources and activities within the system. Through
the application of random distributions, complex systems and their inherent variation

28
can be understood. Once the complexity and variation of the existing system has been
accurately modelled, this can then be used to predict the effect that potential changes to
the system will have on the behaviour of the variation and interactions.
At present, a number of software companies are employing initiatives trying to develop
software that can be used for the implementation of lean tools and methods. Griner and
Hanson (2001) discuss the application of fully integrated Windows based Enterprise
Resource Planning (ERP) software to automate job-shops and connect the information
flow to the shop floor. However, ERP systems are expensive and time consuming to
implement and are better suited to much larger organisations.
Simulation mapping of lean tools, such as Kanban allocation and just-in-time methods,
are also beginning to produce interesting innovations, as suggested by Savsar and
Choueiki (2000).
The most recent step towards the implementation of software to ease this problem of
value stream mapping is the utilisation of simulation tools to enhance the capability and
ease of implementation to various production settings, as investigated by McDonald et
al. (2002). Conversely, simulation can be viewed as being contradictory to the lean
approach; in as much as it is a lengthy and expensive process. It should be noted that
simulation packages are a tool used to aid decisions, not solve problems. Researchers
such as Donatelli and Harris (2001) introduce simulation as the movie to value stream
mapping’s snapshot. It could be said that this detracts from some key lean principles,
such as going to the shop-floor for yourself and viewing the action (such as the gemba
approach). However, the simulation approach could form an extremely powerful tool

29
for gaining the co-operation and involvement of all employees, and the formation of
cross-functional teams, enabling employees to analyse, reflect upon and change their
own working environment through hands on discussions covering the current state
system and also potential future state scenarios.
Leading on from this, simulation can also be used to great advantage for certain higher
level lean or six sigma techniques, such as Statistical Process Control (SPC) (Spedding
and Chan, 2001), where control charts may be constructed, showing tool wear etc, so
that when the information is fed into a simulation engine, a comprehensive Total
Productive Maintenance (TPM) schedule may be configured for the whole system.
Schroer (2004) goes on to discuss the benefits of simulation as a learning aid for lean
through the use of a simulated manufacturing set-up to lead the user through continuous
improvement concepts. This approach has a lot of potential for the training of
employees in a lean deployment, and could be used as an effective off-line
demonstration tool, illustrating the effect of cell redesigns and other lean tools that
would temporarily effect production.
2.4 Successful Lean Efforts
Originally, lean philosophies were applied to large manufacturing operations, in high
volume, low variety facilities, to continuously improve efficiency in production. Not
surprisingly, following its inception at Toyota, some of the first western companies to
consider the transition to a lean culture were US automotive manufacturers. The reason
for this is twofold. Firstly, these companies were in direct competition with Toyota, and
were watching from a distance as their market share shrank to Toyotas emerging
30
dominance. Secondly, the market was becoming increasingly demanding for greater
choice in the product portfolios. It was no longer a case of merely selling the customer
what you made (and told them they wanted); companies had to start listening to the
customers and responding to their newfound perception of, and demand for value. This
situation, coupled with the strong possibility of an economic crisis if they remained
stagnant in their production philosophies, presented no choice but to radically change
current manufacturing techniques. Japanese managed plants were continuously
outperforming their American counterparts. Between the years of 1968-78, US
productivity increased by 23.6%, but the Japanese experienced an impressive 89.1%
increase (Teresko, 2005). Their response was to negotiate strategic partnerships between
themselves (major US) and Japanese car manufacturers, such as Mazda and Ford (Chan
and Wong, 1994), and the New United Motor Manufacturing Inc (NUMMI) set up
between General Motors and Toyota (Chan and Wong, 1994, Waurzyniak, 2005). This
enabled the West to take advantage of the TPS paradigm, producing more variety at
minimal cost, supplying downstream customers with only what they require, when
required, in the correct volume. Additionally, these alliances provided a safety net of
reduced risk for the Japanese partners (Chan and Wong, 1994), normally associated
with the development of overseas facilities.
Numerous examples of successful lean initiatives exist within the automotive and
aerospace sectors. Mitsubishi started a joint venture with Volvo (NedCar) that saw the
same advantages experienced through the NUMMI initiative. By using IT to underpin
the monitoring of production, and focussed efforts on the reduction of down-time, real
time data was used effectively to increase the visibility of information within the
organisation, resulting in increases in morale and efficiency (Anon., 2004). Chrysler

31
used resources to extend in house training of lean philosophy to its major suppliers,
emphasising the commitment needed from all parties in order to establish lean, and
realise the full potential for everyone involved (Anon., 1997a). Delphi took a multi-
pronged approach, looking at supplier development, cost management, strategic
sourcing and quality issues (among others), led by top management, again emphasising
the long term commitment needed, and highlighting the importance of knowledge
management provide clear examples for the automotive sector (Nelson, 2004).
Boeing and Lockheed Martin (Blake and Eash, 2003, Olexa, 2003) offer examples of
success within aerospace manufacture. Through directed efforts concentrating on
education and demonstration of improvement tactics, and developing in-house expertise
to manage and continue implementation projects (Blake and Eash, 2003), Boeing
successfully cultivated a continuous improvement culture and in turn passed on their
knowledge to suppliers through a Supplier Management Lean Integration Team. Such
efforts led to the halving of lead time on the delivery of 737s and consolidating factory
space by some 30% (Park, 2004). Lockheed Martin took advantage of being able to
start with a fresh canvas, designing operations before manufacturing began. From
design for rapid assembly, utilising common parts wherever possible, to mistake
proofing assembly processes and using cellular design, final assembly now takes 2
hours for the F-35, as opposed to six days for its predecessor (Olexa, 2003).
Lynds (2002) recognises the importance of leadership and commitment needed by top
management to embrace the lean approach and share their experiences company wide,
so that communication barriers are overcome, and experiences are shared. In this
example, floor space is reduced, resulting in more cash for the company after being able
to sell off excess space. Although labelled ‘common sense’ in this article, it can be said

32
that this is one of the barriers to lean implementation, as some key elements of lean,
such as reducing inventory as much as possible, is counter intuitive, as any work in
progress has traditionally been thought of as a safety net helpful to ride out any
problems in the system.
2.5 Lean Supply Chains
It is possible for an organisation to implement lean without its suppliers adhering to the
same working principles, but the result is a fractured pull system that does not adhere to
the true ideals of lean. Moving towards one piece flow is impossible, while many forms
of waste are present. It is evident that to become truly flexible and responsive to
customer demand, lean principles must extend along the supply chain. The emergence
of globalisation and its resulting international competition is driving organisations to
examine the efficiency of the total supply chain in order to retain a competitive edge. In
other words, when applied locally, a lean philosophy itself isn’t enough to guarantee
sustained market share, and does not automatically lead to the lowest cost solution
(Jones et al., 1997).
One notable scenario that emerges in supply chains is that any larger organisation
within it will rely on the flexibility of their suppliers in order to fulfil customer demand,
and because of their dominance, can afford to be inflexible and demanding themselves
(Bamber and Dale, 2000). To improve this situation, total visibility is required between
suppliers and their customers, in order to break the cycle of reactive fulfilment of
orders, and create a truly lean enterprise (Tinham, 2005b).

33
The essence of lean supply was first put forward by (Lamming, 1993):
“The state of business in which there is dynamic competition and collaboration of
equals in the supply chain, aimed at adding value at minimum total cost, while
maximising end customer service and product quality.”
Although not easy (Anon., 1997b), the journey towards becoming a lean supply chain
must be first based upon a good level of cooperation and understanding between the
final assembly plant and the first tier suppliers. This in turn should lead to supplier
associations evolving, creating an environment where all parties undertake research and
development for the greater good – creating a knowledge bank of information that is
available to all, enabling the production of superior products. Once on its way to being
established, this culture can then lead to all nodes within the supply chain driving
towards cost reduction objectives. As noted by Srinivasan et al. (2005, p. 21) “properly
executed, lean is an effective growth strategy”.
However, to achieve this, the differing interests and attitudes of all parties involved
within any supply chain must be understood to be successful (Lamming, 1996). The
comprehensive implementation of lean is certainly not an easy one to extend along the
chain. The research of Hines et al. (1998) explores the development of lean supplier
networks and the structure of supplier associations necessary to develop a lean supply
chain, while Kale et al.(2001) examine the benefits that can be achieved through the
integration of strategic alliances. Langfield-Smith and Greenwood (1998) provide
further insight into the development of supplier relationships, emphasising the fact that

34
if each partner within the supply chain comes to some sort of long term commitment to
the other parties involved, it would be mutually beneficial to everyone.
Visibility is key to the establishment of effective supplier networks and strategic
alliances, and trust is critical to establish this visibility (Kwon and Suh, 2005). Due to
the vast amounts of data involved in the creation of a ‘transparent’ supply chain, the role
of information technology is imperative to establish real-time supply chain visibility,
replacing material flow with information flow (Gort, 2005, Tinham, 2005a).
On a micro level, examining the value stream of a product within a system can achieve
a certain degree of improved efficiency, but in order to comprehensively address the
value added activities from procurement of raw materials through manufacture, to
delivery to customer, it is necessary to consider the macro level operations, or in other
words the total value stream. This extends in both directions along the supply chain,
and considers every activity that the product or service encounters. Taylor and Brunt
(2000) consider the importance of the total value stream of a product family, and
illustrate the true scope of a value stream below:
TOTAL VALUE STREAM
Figure 2.2 Value Stream Scope
(Taylor and Brunt, 2000)
SUPPLIER FACTORY CUSTOMER/ END USER
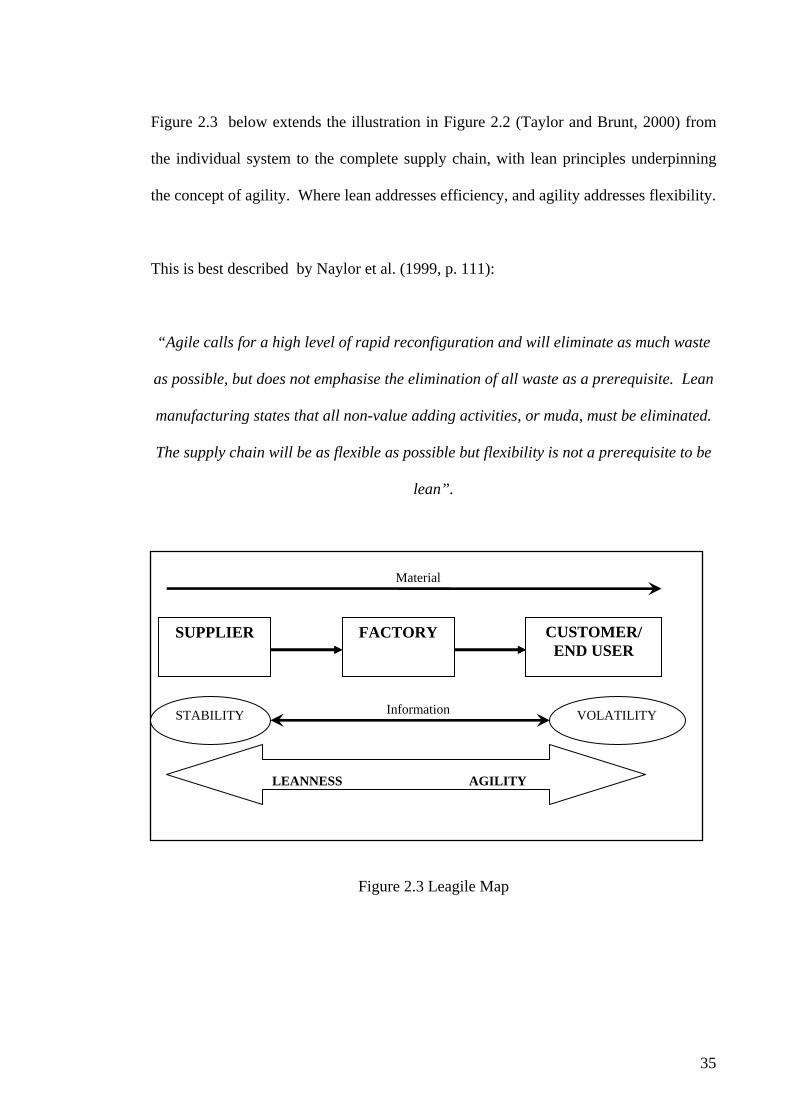
35
Figure 2.3 below extends the illustration in Figure 2.2 (Taylor and Brunt, 2000) from
the individual system to the complete supply chain, with lean principles underpinning
the concept of agility. Where lean addresses efficiency, and agility addresses flexibility.
This is best described by Naylor et al. (1999, p. 111):
“Agile calls for a high level of rapid reconfiguration and will eliminate as much waste
as possible, but does not emphasise the elimination of all waste as a prerequisite. Lean
manufacturing states that all non-value adding activities, or muda, must be eliminated.
The supply chain will be as flexible as possible but flexibility is not a prerequisite to be
lean”.
Figure 2.3 Leagile Map
SUPPLIER FACTORY CUSTOMER/ END USER
SUPPLIER FACTORY
Information
Material
LEANNESS AGILITY
STABILITY VOLATILITY

36
The concept of agility centres on four key points outlined below:
1) Delivering value to customer
2) Being ready for change
3) Valuing human knowledge and skills
4) Forming virtual partnerships
(Katayama and Bennett, 1999)
As Kidd (1994) points out in his extensive work on the concept, lean is necessary but in
itself not sufficient to achieve agility. McCullen and Towill (2001) provide insight into
the synergies of agility and leanness, and suggest that leanness is achieved through the
application of agility. It can be discerned from this that a system must be operating
efficiently before it can be aligned to enter niche markets and cater for ever more
demanding customers (Robertson and Jones, 1999).
Instead of regarding lean and agility as individual philosophies, it has been discussed
most notably by Naylor et al. (1999), Prince and Kay (2003), and Huang et al. (2002)
among others; that the two approaches in fact compliment each other, forming the new
paradigm of ‘leagility’ (Naylor et al., 1999).
When only lean techniques are applied, they will lend themselves to functional,
predictable markets (low variety high volume) (Childerhouse and Towill, 2000).
Conversely, when the concept of agility is also introduced, the two tools together will
lend themselves to both the functional, predictable markets, and the volatile and niche
37
markets (low volume high variety). These volatile markets had not yet been able to
fully realise the potential gains from lean.
Both lean and agile paradigms need to be part of a total supply chain strategy (Naylor et
al., 1999). The key to the alignment of lean and agile paradigms revolves around
achieving the correct balance of the two throughout the supply chain. Figure 2.3 also
shows how the balance between the two concepts varies along the supply chain
structure.
2.6 Limited Success of Lean
The automotive industry’s adoption of lean does not escape without criticism, with not
every attempt at becoming lean proving beneficial for the employees or successful for
the overall company (Parker and Slaughter, 1994, Rinehart et al., 1997). This seems to
stem from a lack of understanding, direction and/or commitment from management
(Hancock and Zayko, 1998), not helped by the heavily unionised culture of the majority
of industrial workers (Hall, 1992). The following reveals the importance of changing
the existing organisational culture within a company for the purpose of lean
implementation. Namely that the management and their communications are the most
critical part of the transition to lean thinking, and provide the backbone of any
continuous improvement effort, while employees require transparency from
management and their own education and empowerment in the change process.
In a development beyond lean’s initial application to low variety, high volume facilities,
some attention has been given to the viability of applying lean principles to ‘job-shop’

38
companies, i.e. high variety, low volume (Winter, 1983, Jina et al., 1997, Hendry, 1998,
Irani, 2001). In fact, research (Boughton and Arokiam, 2000) suggests that lean
applications are essential for survival and growth in today’s job-shop industry.
However, the relevancy of lean manufacturing in these operations has been brought into
question through the suggestion that value-added activities do not take into account the
size, complexity or manufacturability of a product. Therefore if the theory behind lean
is flawed, then the [sic] universality of lean must clearly be questionable (James-Moore
and Gibbons, 1997). As discussed by Irani (2001), job-shops face the toughest obstacle
when trying to map and analyse the flow of approximately 100-2000 plus product routes
through their manufacturing facility. Complicated and in depth algorithms and often
prohibitively expensive IT solutions are needed to overcome this difficult scheduling
task.
Ultimately, lean implementation has not been as successful here as in their mass
producing counterparts for three main reasons. Firstly, huge product portfolios mean
that each ‘job’ is likely to be different and therefore production approaches cannot be
standardised. Secondly, the products’ characteristics create production constraints.
Thirdly, the job-shops or smaller firms simply cannot match the dominance or resources
that the larger firms enjoy, allowing them to be inflexible along their supply chains
(Bamber and Dale, 2000).
This is not to say that the implementation of lean has always been successful in the low
variety, high volume environments. Rinehart et al. (1997) provide perhaps the most
well documented account of how lean can fail, through a detailed account of the
consequences brought about through inappropriate management of continuous

39
improvement, and the reaction of disillusioned union members associated with the
plant. It is suggested in this work that although the management of the situation was
inappropriate, ultimately the employees were disillusioned with the lean production
philosophy itself. Staff became offended by the reduction of everyday operations to
repetitive and relatively easy tasks, along with the lack of collaboration and
communication from management, resulting in directed orders, rather than a cooperative
step forward. However, if correctly structured and communicated, sustainable inclusion
of the employees in the lean movement would be obtained, and issues arising from any
changes made would be feedback to the system and managed accordingly. If this does
not happen, it has to be a fault of the management and driving force behind the
implementation effort.
Building on this, the suggestion that lean is pro company, not pro employee has some
validity, and cannot be dismissed. For example, it is said that, employees feel a sense of
insecurity, perceiving lean as a threat, i.e. a method for reducing staff numbers. The
opinion is also held that management avoid accountability when problems arise, letting
it filter downwards onto the lower levels of hierarchy (Parker and Slaughter, 1994).
This is to miss the fundamental underpinning that is empowerment and cultural change,
resulting from a failure by management to approach lean with the correct goals.
Instead, it should be remembered that lean requires and relies on a review of
organisational values, which in itself is key to the long term development of an
organisations’ lean efforts. From this we learn that if an appropriate strategy is not
planned and managed for the existing organisation (in terms of culture), the desired
cultural change will not be achieved. Instead there results an adverse affect on morale,

40
increasing levels of worker unhappiness and withdrawal, ultimately leading to
operational failures (Hines et al., 2004).
The lack of employee education and empowerment, when coupled with the resistance of
management to invest in relatively cheap mechanisms for waste reduction and quality
improvement, can have a devastating effect on the chances of lean success throughout
the facility. This highlights the need for a total and long term commitment from
management to complete the internal culture change, so as to become a lean enterprise.
Management tend to concentrate on tools and practices, rather than viewing lean as a
philosophy, aiming to teach new improvement tools to employees, rather than
immersing them in the practical side of solving opportunities for improvement with a
lean approach (Spear, 2004).
If the “pro company” attitude is present within an organisation, it has the potential to
not only damage the existing improvement efforts, but also any future efforts as well. If
appropriate leadership is lacking, and the company culture is not already one of
continuous improvement, it is likely that a new initiative such as lean will be adopted by
the organisation and used in name only. This new initiative will then be used as an
excuse to cut back jobs, because the company is ‘improving’ or ‘going lean’. The
whole organisation and its operating culture will be affected by such a move, leaving a
legacy of mistrust.
Further, even if the people responsible for the situation and/or top management were
replaced by fresh, effective leaders of change, it will prove difficult if not impossible to
41
obtain any employee trust and therefore participation and cooperation for any new move
towards change.
The memory of the failed improvement ingrained in the organisation’s psyche will
present huge resistance to any further attempts at implementing improvement initiatives.
In this case, it will take years to overcome the barriers caused by the incorrect
management practices that occurred previously. This is why it is so important to take
the correct approach and communicate clearly the reason for change, and why the
improvement initiatives are being adopted, laying the foundation for a positive
“learning culture”.
The legacy of using lean, or any other improvement approach as an excuse for reducing
numbers is long standing and will dictate how the organisation responds and evolves for
at least the next generation of employees.
In summary, the reasons for the unsuccessful attempts to adopt a lean philosophy can be
separated into two categories:
1) The lack of management understanding and/or involvement in a top down
approach and a lack of attention given to the organisational culture change
required from the very beginning, resulting in an incorrect approach to
implementation.
2) Failure by operative staff to perceive the value of adopting a new working
paradigm.

42
Koenigsaecker (2005) explores how the lack of senior management involvement can
detrimentally affect the organisation, while the incorrect approach, an example of which
is given by Plankey Videla (2004), saw supplier forced organisational change, totally
lacking in support and resulting in the company making promises of higher wages and
financial incentives that couldn’t be met, in turn leading to strike action.
2.7 Current Lean Direction (Broadening Scope of Lean)
The scope of lean is broadening as it is recognised by new fields. As more information
becomes readily available through sources such as the internet, peer reviewed journals
and magazine articles, which effectively market lean as a solution for improving
business operations; it is becoming increasingly easy for management to access material
that will help them on their journey of continuous improvement. One successful
adoption is the application of lean principles to the construction sector. Ballard et al.
(2003) provide an example of lean techniques including 5S, cellular design, work flow
and standardised design being used in pre-cast concrete fabrication, that led to a
reduction in lead times, and increases in factory throughput and productivity. Dunlop
and Smith (2004) have demonstrated how the identification of waste and efficient
scheduling within concrete pour can lead to increased productivity.
‘Transactional lean’ is the label given to lean’s presence in service industries and office
environments, where information and not manufactured products, are the commodity.
Examples of this being Straker (2004) and Ehrlich (2006) among others. Research has
begun to take the direction of proposing ‘lean academia’, where standardised
coursework, and activities such as the value stream mapping of administration processes

43
in order to reduce student waiting time (i.e. for examination results etc) (Comm and
Mathaisel, 2003) can all be implemented in a value driven, customer focussed
environment. Emiliani (2004) proposes the use of focussed, shorter reading lists, along
with regular student feedback (so as to keep the customer in mind) and the use of
shorter, regular examinations, rather than long, bi-semester assessments, effectively
bringing load levelling principles to academia. The same common theme runs
throughout these different applications of lean - certain tools and techniques from the
lean philosophy are being cherry-picked, either on their own or with a select few other
management techniques (Beachum, 2005). There is finally a start to the development of
a whole multi-industry appreciation of the benefits, and need for a shift into customer
driven supply, be it a service or a manufactured product. It appears that all industries are
being forced to take on these techniques due to the competitive global market, and
adapting what they can now see, are an effective set of tools in order for survival and
growth.
Areas of high innovation, for example, telecommunications (Robertson and Jones,
1999), and personal computer manufacture show how lean is critical to achieving
flexibility and quality in sectors where rapid technological advances are inherent within
the nature of the product. A key example being Dell Computer Corporation (Pritchard,
2002). The need for synergy between the manufacturing and marketing functions
within such applications are critical, as the service dimension is brought to
manufacturing in order to remain competitive in situations where as soon as a product
rolls out, the technology behind it is obsolete (Fynes, 1994).

44
Since adopting lean philosophy, Pulte Homes Inc., have seen profits increase by up to
61% through cherry-picking lean ideas like the standardisation of better quality fixtures
in their homes, centralising their approach (Kerwin, 2005).
The application of lean in the healthcare industry is considered the current direction of
lean efforts to date, with objectives in place to reduce waiting time on the NHS in the
UK (Jones and Mitchell, 2006), through the mapping of variation with capacity usage,
leading to its eventual reduction (Silvester et al., 2004). Daniel (2005) describes how
the processes involved in seeing a patient (waiting times etc) can be streamlined through
the analysis of value added activities.
In the literature there appears to be three key areas of discussion surrounding lean.
Namely the:
• Successful implementation, for example (Anon., 2005)
• Examination of key elements or techniques that have been used in such applications,
for example (Kasul and Motwani, 1997)
• Enabling power of IT within an organisation implementing such philosophies
(Anon., 2005, Tinham, 2005b)
While providing useful commentary on the scope and direction that lean initiatives
should take, the need or identification of specific industry dependent methodologies has
so far remained an area of relatively minimal investigation.
45
2.8 Continuous Process Lean As examined in the previous sections of this chapter, the lean approach to continuous
improvement has had success in a number of diverse industries and encountered limited
success in others. The transfer of lean techniques to the process industry sector
continues to present new scope for the implementation of continuous improvement
techniques.
A member of the process industry may be defined as:
“A manufacturer who produces with minimal interruptions in any one production run
or between production runs of products which exhibit process characteristics such as
liquids, fibres, powders, gases”
(Fransoo and Rutten, 1994, p. 47)
The process industry sector enjoyed considerable growth up until the late 1960s
(Anderson, 1997). Due to the fact that profits were easily made, it can be argued that a
certain amount of complacency became embedded in the manufacturing culture of these
organisations. Throughout these boom years, facilities were designed with significant
storage capacities, but issues of efficiency were not addressed (Anderson, 1997). As a
consequence of this, a number of today’s process industries are left with inflexible
facilities due to their original setup and ingrained mindset that holding inventory is a
positive attribute in the supply chain, due to uncertainty in demand. However, if this
uncertainty is identified and managed in the correct manner, significant savings, along
with increased efficiency and flexibility to demand can be achieved.

46
When considering the contribution made by process industries to national economies
(Burgess et al., 2002, Van Donk, 2005), the importance of maintaining existing market
share, as well as seeking growth cannot be underestimated. Anderson (1997) addresses
this issue in his work, and also emphasises that this sector must look to technology to
help improve process measurement and control. For example, management need to
harness soft computing techniques such as neural networks to help underpin process
measurement and control. These and other emerging technologies must be embraced
not avoided. Such tools are cost effective, providing significant economic savings
necessary for sustainability and growth. As put forward by Anderson, “the return on
investment of the innovative application of control and measurement technologies is
very large” (Anderson, 1997, p. 161).
This is not to say that every business operating within the sector must solely rely on
technology to remain competitive. The relevancy of utilising technological solutions
must be carefully assessed for applicability. This is a view presented by Jones (2005),
when considering the increasing scale of the global industrial arena, created by the
emergence of economies such as China. “The initial reaction of western firms and
policy makers to the Chinese threat is to increase spending on technology and
innovation…..those with responsive lean processes will win…..technology is not
enough” (Jones, 2005, p. 5) This is how technology should be integrated. It must be
applied to process control, so that manufacturing systems can be made manageable and
flexible; through continuous improvement, driven by a scientific approach in alignment
with the philosophical ideas of lean thinking.

47
The process industry differs from discrete manufacturing in a number of ways. For
example, it can be said that there is relatively little opportunity for WIP to accumulate,
as there are no discrete processes in which inventory can queue between or act as a
buffer. Winters et al.(p. 1) provide the following statement regarding the characteristics
of the process industry:
“Process industries are typically characterized by very high fixed capital, concentrated
in a small number of workstations. The production equipment is often physically large,
and relatively fixed in nature. In most discrete manufacturing operations, the capital
investment is smaller and spread across many workstations. As a result, continuous
process manufacturing operations are less flexible to change than discrete
manufacturing operations.”
(Winter et al., p. 1)
The work of Fransoo and Rutten (1994) considers the differences inherent in various
process industries, leading to the identification of two key groupings: flow process and
batch process industries. A summary of the characteristics of both groups can be found
in Table 2.1 (adapted from Fransoo and Rutten, 1994).

48
Table 2.1 Process Flow/Batch Flow Characteristics (Fransoo and Rutten, 1994)
Flow Process Industries Batch Process Industries
High production speed, short throughput time Long lead time, high Work In Progress (WIP)
Clear determination of capacity, one routing for
all products, no volume flexibility
Capacity not well defined (different
configurations, complex routings)
Low product complexity More complex products
Low added value High added value
Strong impact of changeover times Less impact of changeover times
Small no. of production steps Large no. production steps
Limited no. of products Large no. of products
Furthering this work, Dennis and Meredith (2000) decompose the characteristics of the
process industry even further, identifying four different dimensions of production and
inventory management in the process industry through detailed studies of nineteen
process facilities: simple, common, WIP-controlled and computerised.
Van Donk and Fransoo (2006), go on to categorise the literature and research
surrounding the process industry into three key areas: Production Planning and Control
(PPC), empirical studies, and research into the characteristics of process industries.
From this, there appears to be a shift in the literature, with more attention being paid to
the diversity within the sector from the early 1990’s, rather than comparative studies
contrasting continuous processing against discrete manufacturing (Van Donk and
Fransoo, 2006). However, there is a thread of discussion surrounding the transferability
of techniques and approaches from the world of discrete manufacturing to the process
industry. Cooke and Rohleder (2005) advocate this transferability of methods to handle
the demands of process facilities. This is characterised by capital intensive machinery
working at high utilisation levels. On reflection, this situation would benefit from
49
having a responsive planning schedule, driven by strategic leadership and continuous
improvement strategy.
This can be said to build on the work of Billesbach (1994) who considers the use of JIT
principles within the textile industry, through their application to the discrete parts of
manufacture, utilising a kanban solution for the materials handling within the facility.
Cook and Rogowski (1996) have extended this view along the supply chain, and
illustrating the point with a successful implementation of JIT philosophy in Dow
Chemical North America, quoting improvements such as 25% increase in demand
forecast accuracy, lead time reduced by 25%, and lead time variability reduced by 50%.
Loos and Allweyer (1998), Philpott and Everett (2001), Berning et al. (2004), Cooke
and Rohleder (2005), and Appelqvist and Lehtonen (2005), all consider scheduling
problems within the process sector. Loos and Allweyer (1998) emphasise the
importance of the full integration of all logistics systems within an organisation, and
conveys the belief that the design and management of lean business processes and their
support by integrated IT systems is a critical success factor. Philpott and Everett (2001)
developed the PIVOT optimisation model to address scheduling difficulties in the paper
industry. Although it encompasses the whole supply chain, the complexity of the model
could be seen as a barrier for timely adoption and comprehensive understanding.
Berning et al. (2004) propose the configuration of a fully customised optimisation
algorithm that addresses the scheduling of production on a multi-plant level. Although
a comprehensive approach to the problem of scheduling production on a macro scale, it
needs to be embedded in the culture of the organisation through a philosophy of
50
continuous improvement; in order to make an ongoing enhancement of production
processes. Otherwise it runs the risk of becoming an expensive tool that is restricting
due to its technicality.
Hameri and Lehtonen (2001) examine the paper process industry. Here it is suggested
that due to a limited number of specialist suppliers of large scale machinery,
sustainability has to be created through strategic market acquisitions.
Simulation as a tool for the analysis and optimisation of process industries is a well
explored theme. The work of Lehtonen and Holmstrom (1998) uses simulation, and
discusses the suitability of JIT within paper industry logistics, outlining the benefits that
can be achieved through a comprehensive implementation of lean tools, with JIT as a
platform. The applicability of the lean philosophy is addressed, with Lehtonen (2000)
demonstrating the benefits of adopting lean manufacturing principles through
simulation. Appelqvist and Lehtonen (2005) take a simulation approach to validate a
scheduling algorithm for the steel industry, but as with the previous simulation studies,
the cultural aspects of continuous improvement have not been given any significance in
the literature.
Although Hameri and Lehtonen (2001) suggest that optimisation through the
application of lean thinking is rare, where it has been used, it has achieved its aim. Roy
and Guin (1999) discuss the successful application of JIT purchasing in an Indian case
study, and Brunt (2000) discusses a successful example of value stream mapping and
other lean techniques in the steel industry. Through a comparative investigation of the
UK’s printing industry against the performance of “Britain’s Best Factories”, Benson

51
(2005) notes that the printing industry sector displays a certain amount of lean success,
if only limited. Although safety levels within the industry are above average, other
business metrics such as the “added value per employee” and the On Time and In Full
(OTIF) order figure are lower than expected, which is especially surprising “given the
customer service nature of the industry” (Benson, 2005, p. 2). Perhaps this can be
attributed to the level of training within the organisations being insufficient for any
transition to World Class performance. Again, this is essential if any attempt at
continuous improvement is to be sustained. Continuous training must be an inherent
part of the journey to continuous improvement, and be constantly revised for relevancy.
Drawing on his experience as a judge for the UK’s Best Factory Award, Benson (2005)
notes that the leaders, or ‘winning industries’ “are responding to these pressures by
delivering lean manufacturing, by proving outstanding customer service and quality to
their customers and by continuously innovating in their products, manufacturing and
office processes” (Benson, 2005, p. 2).
Moving on from this, and as an effective solution, Ahmad et al. (2005) discuss the
impact of using lean in conjunction with benchmarking and performance measurement
to create manufacturing strategy on an operational level. This approach could equally
apply to the training and continuous feedback needed to sustain levels of improvement
within a facility. However, a step-by-step guide to mapping, improvement and
benchmarking should be in place to ensure that any performance measurement and
control of a system binds together the scientific approach and cultural inclusion
necessary for such an initiative.

52
Recently, the work of Abdulmalek (2006) has focussed on the application of the lean
philosophy and tools within the steel industry. Abdulmalek et al. (2006) provide a
comprehensive overview of the implementation of lean tools in the process sector, and
argues for a classification scheme which considers lean techniques on an individual
basis. It aims to provide direction for engineers, attempting to select the most
appropriate tools for their organisation through the consideration of material flow and
product characteristics. This work leads the way in supporting the idea that process
industries “share characteristics with discrete industries that make it possible to
implement lean techniques, but in varying degrees according to the specific industry”
(Abdulmalek, 2006, p. 24). It also provides evidence that if a framework for specific
industries were to be designed, the organisation would benefit from a customised step-
by-step guide, not to mention the resulting economic benefits.
Abdulmalek and Rajgopal (2007), go on to illustrate the benefits, through the use of
simulation to model the improvements possible in the future state scenarios in order to
inform the decision to move to lean philosophy, while providing a transparency of ideas
to the lean team. Sustaining motivation when implementing change of any sort within
an organisation is critical if it is to fully realised. It is believed that simulation, where
resources allow, helps the case for change through dynamic views of current state and
what-if scenarios. It also helps to provide a results orientated and total systems view of
the improvement initiative and scope of the project, giving the opportunity to
demonstrate to the entire organisation positive impact the improvement actions are
having along the way.
53
As stated before, the need for a whole supply chain view is crucial when introducing the
lean philosophy, or any continuous improvement initiative. Zhou et al. (2000)
highlights how trust between suppliers and the building of strategic relationships are
essential if a business is to compete and grow. Shah (2005) suggests that in terms of
WIP, efficiency and supply chain cycle times, process industry benchmarks perform
poorly when compared to the automotive sector. Conceivably, this could be due to the
inflexibility inherent in the original facility design constraints, as previously discussed
by Anderson (1997). However, strategic decisions and solutions must be found for these
constraints, as “it is often difficult to effect large improvements simply by changing
logistics and transactional processes – fundamental changes at the process and plant
level and at the interfaces between …….the value chain……are often required” (Shah,
2005, p. 1225)
In summary, if continuous process industries are to remain competitive and achieve
sustainable improvements, business strategies must be aligned with operational
improvement objectives and process measurement and control. Taking a broader
perspective, as part of these strategic decisions, it will also be opportune to extend the
service provided to the customer, for example, “looking to provide extra value….by
improving customer service or providing additional services” (Potter et al., 2004, p.
208). Shah (2005) describes this as moving from a product orientated focus, to service
orientated focus, with life cycle solutions being offered in conjunction with already
value efficient products.

54
2.9 Six Sigma
It can be said that the six sigma approach was born out of the Total Quality Control
philosophy, a phrase coined by quality management guru Feigenbaum (1991), but
conceived and conceptualised through the work of Deming (2000) and Juran (1999).
Under the moniker of Total Quality Management (TQM), Deming introduced the then
revolutionary theory that the people element had a place in process improvement, which
must be aligned and managed along with technical knowledge and process data, to
achieve true continuous improvement. Through this work, Deming brought worldwide
exposure and recognition to the philosophy. Provokingly, TQM was as successful in it’s
time as six sigma is at present, but it is not around in its entirety today, and has
somewhat faded from view. Due to the fact that the TQM movement was
predominantly led by consultants, this meant that the fundamental concepts were not
ingrained in the organisations that adopted the approach. The skill base was external
from the organisation, with the consequence that once newer management concepts
(lean, six sigma) started to gather more publicity, TQM had not taken root sufficiently
to survive completely. The basic premise behind the six sigma approach is essentially
the same as TQM – the concept that if continuous improvement is to be realised, the
support of the whole organisation is essential, with a push from top-down, and a
continuous training and development program must be sustained to drive change
forward (Black and Revere, 2006).
To fully appreciate the strengths of the six sigma approach and its fierce and widespread
adoption in today’s business arena, it is important to explore the reasons behind the
failures of TQM, once a profound paradigm in the evolution of management science,
but now somewhat superseded by six sigma. TQM presented an all encompassing,

55
comprehensive philosophy to the management of quality and continuous improvement.
Numerous reasons for, and reflections on its failures can be found in the literature.
Examples cited include the lack of continuous training and education within the
organisation (Masters, 1996), failure of management to properly lead the change
initiative (Curry and Kadasah, 2002, Sebastianelli and Tamimi, 2003), and what the
author believes to be the most significant reason, the fact that “TQM systems are not
designed to fit the cultural circumstances of the organisation” (Sebastianelli and
Tamimi, 2003, p. 3).
This is a view supported by Blackiston (1996), who suggests that companies may
choose the wrong techniques, strategy or tools for their specific environment. This
misdirection of appropriate strategy and/or tools could also result in the project focus
being concentrated on non-value added areas of the business, as suggested by Black and
Revere (2006, p. 259) “quality efforts were sometimes aimed at processes or operations
not critical to the customer”. This resulted in TQM efforts no being aligned to the
business case of the organisation, and therefore it proved difficult to quantify
improvements in terms of key performance metrics that the organisation could relate to.
This issue has been compounded by the fact that TQM was embraced as a “cure-all”
business elixir by a myriad of management consultants, consequently the driving force
and leadership came from outside influences rather than within the organisation itself.
Much like the approach of many continuous improvement consultants today, generic
improvement models were being applied to vastly different situations, with a belief that
“a set of general concepts and generic principles could be applied in all circumstances”
(Micklethwait and Wooldridge, 1997, p. 62). In most cases this led to suboptimal

56
performance improvements, despite organisations having invested significant sums of
money.
Six sigma as recognised today was developed at Motorola through the efforts of Bill
Smith, a reliability engineer in the 1980s (Brady and Allen, 2006). However, the real
turning point in six sigma’s shift in popularity came with the attention of Jack Welch,
the then CEO of General Electric in 1995. Welch had observed the success experienced
through Bill Smith’s approach and intensely championed the six sigma methodology in
GE through effective leadership (Black and Revere, 2006).
The term ‘six sigma’ refers to a statistical measure of defect rate within a system.
Underpinned by statistical techniques, it presents a structured and systematic approach
to process improvement, aiming for a reduced defect rate of 3.4 defects for every
million opportunities, or six sigma (Brady and Allen, 2006). To help illustrate the
meaning of six sigma defect rates within a system, Pande et al. (2000) provide some
useful examples of working at the rate of 99% quality, or the superior rate of six sigma
quality in a number of different situations. For example, if the post office was working
at a 99% quality rating, for every 300,000 letters delivered; there would be 3,000
misdeliveries, compared to only one misdelivery if they were operating at a six sigma
level. If television stations operated at 99% there would be approximately 1.68 hours of
dead air time experienced per week in comparison to the 1.8 seconds experienced if
working at six sigma levels (Pande et al., 2000).
Six sigma brings structure to process improvement by providing the user with a more
detailed outline of Deming’s Plan-Do-Check-Act cycle by guiding the initiative through
57
a five stage cycle of Define-Measure-Analyse-Improve-Control (DMAIC) (Pande et al.,
2000). Each stage has a number of corresponding tools and techniques such as
Statistical Process Control, Design of Experiments and response surfaces, providing the
user with an extensive tool box of techniques, in order to measure, analyse and improve
critical processes in order to bring the system under control (Keller, 2005).
Andersson et al. (2006) draw from the literature the objectives of each of the DMAIC
stages as follows:
Define: Define which process or product needs improvement. Define the most
suitable team members……..Define the customers of the process, their needs and
requirements, and create a map of the process that should be improved.
Measure: Identify the key factors that have the most influence on the process and
decide upon how to measure them.
Analyse: Analyse the factors that need improvements.
Improve: Design and implement the most effective solution. Cost-benefit analysis
should be used to identify the best solution.
Control: Verify if the implementation was successful and ensure that the
improvement is sustained over time.
(Andersson et al., 2006, p. 287)
Intensive training of key staff is critical in order to follow the DMAIC cycle effectively
and gain significant results, as is the buy-in of senior management if the initiative is to
take root. Management must play an active role in the selection of projects for the
newly trained six sigma teams to focus on, and also ensure that all required resources
are made available (Raisinghani, 2005). From this, the roles required for

58
implementation must be specifically defined and made clear within the organisation
before embarking on the six sigma journey, so that everyone involved knows their
responsibilities, exactly what needs to be done and in what order (Pande et al., 2000).
Emphasising this point, it is essential that six sigma should be understood to be a
philosophy as well as a scientific approach.
Keller (2001) has noted the shift in acceptance of six sigma from a set of tools to an
overall management philosophy. This highlights an important point in the prevention
of six sigma becoming stagnant and coming to the same fate as its TQM predecessor. It
needs to evolve if it is to remain a relevant and sustainable approach for business.
McAdam and Lafferty (2004) suggest it needs to be embraced as a continuous
improvement management philosophy in order to embed itself in the psyche of
organisations. [Six sigma] has “some way to go before it is fully accepted as a broad
change philosophy” (McAdam and Lafferty, 2004, p. 546). The two authors go on to
show that six sigma is not in fact a replacement for TQM, but refocusses the
mechanised side of it, providing important business metrics. This is key when looking
at the broader context of six sigma, and its roots in the TQM approach.
From this, it is useful to illustrate the pioneering work of Joiner (1994), and the Joiner
Triangle (Figure 2.4), representing a distinct shift in how quality management initiatives
have been embraced by business.

59
Figure 2.4 The Joiner Triangle
(Joiner, 1994)
The original Joiner triangle is equilateral in nature, depicting the equally interrelated
core elements of “Fourth Generation Management”.
However, when using the above to reflect upon the evolution of the TQM philosophy,
the Joiner Triangle becomes skewed (Figure 2.5), as management focus became
disproportionately geared towards the organisations people and the philosophical and
cultural concepts behind Total Quality. Quality was still the driving force, but it lost
emphasis on the scientific approach.
Quality
All One Team
Scientific Approach

60
Figure 2.5 The Shift in Focus of TQM
Moving on from this, the six sigma methodology has brought about another change in
focus. This has the result of skewing the Joiner Triangle in the opposite direction, so
that the scientific approach is emphasised (Figure 2.6), at the cost of the critical people
element. However, six sigma continues to be regarded as an overall philosophy for
improvement.
Figure 2.6 The Shift in Focus of Six Sigma
Quality
Scientific Approach
All One Team
TQM
Quality
All One Team Scientific
Approach
Six Sigma

61
The shift in focus depicted between Figures 2.5 and 2.6 is a direct result of the loose
associations between quality, the scientific approach, and the people perspective
inherent in any system. These associations must be tightened and equally managed, if
we are to achieve a sustainable outlook for continuous improvement. In other words,
we need to aim for an equal growth on each side of the triangle, taking a systems view
of the organisation as an organic, complex entity (Figure 2.7).
There have been a number of modifications to the Joiner Triangle including the
placement of Management Commitment at the apex, which is often neglected at all
levels of hierarchy within an organisation. Other incarnations have focussed on the fact
that TQM failed because of the lack of foundation or underpinning of a sound quality
system such as ISO 9000.
Figure 2.7 The Desired Holistic Focus for Continuous Improvement
Quality
Scientific Approach
All One Team

62
Figure 2.7 better represents the objectives of continuous improvement, returning to the
strengths of the original Joiner Triangle. It takes a holistic view that the people, data and
overall goal of improved quality within a system are equally interrelated, and growth
must be even in all directions, a notion somehow lost in translation in previous efforts.
However, the legacies of models such as the Joiner Triangle and the TQM approach
have not been totally lost in management history. As an example, it is well established
in the literature that six sigma has evolved from TQM, offering more to today’s
businesses in terms of tying improvements to business metrics. The fact is that all new
improvement methodologies or approaches are decreed ‘management fads’ by those
expected to use them in industry and academia alike. However, if we look back over
the evolution of these ‘fads’, each one seems to disappear from view, but the essence is
not completely forgotten, and certain parts of that ‘fad’ are carried forward into a new
paradigm. In the eyes of the practitioner, every new improvement approach has a shelf
life. It will only be a matter of time before six sigma is replaced by an updated
methodology that will meet the shifting requirements of industry, but no doubt this will
include some of the DNA left behind from TQM, six sigma, and the myriad of other
approaches that have existed before them.
2.9.1 Six Sigma in Practice
The application of six sigma in a variety of industries is well documented in the
literature. Examples in the manufacturing sector include Knowles, Johnson et al.
(2004), Thomas and Barton (2004), and Motorola and GE (Pande et al., 2000) as
perhaps the most famous. Six sigma has also been used successfully in the construction
63
industry (Stewart and Spencer, 2006) and accounting practices (Brewer and Bagranoff,
2004). The main body of current literature however is focussed on the application of
six sigma principles in the service sector (Sehwail and Deyong, 2003, Antony, 2006,
Chakrabarty and Tan, 2007).
Chakrabarty and Tan (2007) provide a comprehensive review of the literature in service
industries, finding that most applications of six sigma occur in the banking and
healthcare sectors. They go on to highlight that proper identification of key
performance indicators, and success factors critical to quality metrics are essential if
organisations are to succeed. This appears to be one of the major challenges for the
deployment of six sigma in the service industry context. Sehwail and Deyong (2003)
discuss the challenges of six sigma in service industries, with particular emphasis on the
healthcare sector; three key issues arise from their research. Firstly, due to the greater
variability in responses from processes in a service environment, it is difficult for
organisations to identify the equivalent concept of a ‘defect’.
The second issue of creating cultural change by nominating six sigma leaders within the
business is a challenge shared by any organisation implementing change. This is
discussed further in section 2.11 of this chapter. The final issue identified is the failure
of service industries to capture the benefits of any improvements. This is consistent
with the work of Chakrabarty and Tan (2007). They also point out that the failure to
identify key performance metrics will make it impossible to quantify any benefits
gained from the improvement process, and may lead to the approach being abandoned.

64
The importance of identifying key performance metrics is a recurring theme in the
literature. Antony (2006) emphasises the importance of aligning projects to business
objectives, and in agreement with Sehwail and Deyong (2003), reflects that the
definition of six sigma as a quality measure must be taken in context for service
industries. For example, “a defect may be defined as anything which does not meet
customer needs or expectations. It would be illogical to assume that all defects are
equally good when we calculate the sigma capability of a process” (Antony, 2006, p.
246). In other words, there is so much possible variation in the customer response, it is
difficult to fit them in the constraints of whether they are merely a defect or not.
Taking a wider approach to the application of the methodology, Malin and Reichardt
(2005) discuss the use of the Supply Chain Operations Reference (SCOR) methodology
as a means to identify six sigma projects within the supply chain at Flexsys. Here, the
scope of six sigma is broadened, as the SCOR methodology is used as a means to ensure
optimal project selection, providing the in-house six sigma experts with an
understanding of how the business operates when supplying different customers. This
approach gives a more strategic outlook (Malin and Reichardt, 2005).
Yang et al. (2007) take a different approach, by way of an integrated “supply chain
management six sigma” framework specifically designed for Samsung. Experiencing
improvements such as a 37% drop in surplus inventory, the customised integration of
supply chain management theory and six sigma methodology can be said to have been
successful. However, it is important to note that the in-house experts will have been
firstly trained in the generic six sigma framework, and secondly specialise to gain an
understanding of a supply chain view. The cost effectiveness of resourcing and

65
implementing this two stage training must be questioned. It is also important to see six
sigma as a continuous improvement tool for the whole supply chain as it stands, without
separating the two concepts. Continuous improvement in any form must be approached
from a systemic vision, and implemented throughout a supply chain if it is to become a
sustained management philosophy.
On reflection, six sigma as a quality management approach, irrespective of industry or
application, can be seen to have brought many positive elements to continuous
improvement. Factors such as management commitment and open communication are
essential for successful implementation as with any attempt at continuous improvement.
In answer to this, it can be said that six sigma provides a clear focus on measurable
financial returns through a sequential and disciplined manner, and establishes an
“infrastructure of champions” with it’s training style of introducing “belt” qualifications
(green, black, master black belts etc.) within the organisation to lead the way in data
driven decision making for improvement efforts (Antony, 2004).
However, for all of its supposed benefits, there are also a number of disadvantages that
must be addressed for it to become a sustainable improvement technique, and not end
up meeting a similar fate to its predecessors, and becoming just another ‘management
fad’ that fades away when it has grown out of favour. First of all, the training for and
solutions put forward by six sigma can be prohibitively expensive for many businesses,
and the correct selection of improvement projects is critical (Senapati, 2004). Antony
(2004) discusses the non-standardisation of training efforts (in terms of belt rankings
etc.), and how this accreditation system can easily evolve into a bureaucratic menace,
where time and resources are misspent focussing on the number of “belts” within the

66
organisation, and not he performance issues at hand. As with any business
improvement approaches, techniques or philosophies, six sigma also faces a real danger
of becoming lost in a consultancy practice, being oversold and incorrectly used, such as
TQM. The relationship between six sigma and organisational culture has not been
explored in the literature surrounding the subject (Antony, 2004), and it is essential that
this gap is bridged so that the true potential of a comprehensive cultural improvement
philosophy, underpinned by a data driven scientific approach is unlocked.
In summary, TQM was a profound, all-inclusive philosophy that presented huge
potential to transform the way in which businesses of all disciplines were managed.
However, this is also where the inherent weakness of TQM lies – the fact that it is only
a “philosophy”. Six sigma moves beyond this view, and has recognised that
organisations need direction in their efforts to achieve improvements, structuring the
concepts and philosophical ideas provided by Deming into a methodology that can be
followed to obtain process improvements. Six sigma has answered the critics of TQM,
by associating quality improvement with specific business metrics, leading
organisations to quantify any improvement made in performance terms. In conclusion,
six sigma has succeeded in bringing the necessary expertise back into the firm through
its strict accreditation process of sequential “belts” (green, black, master black belt etc.),
and although expensive to train and implement, has at least brought about the
recognition from practitioners that eluded TQM.
As with all avenues of process improvement however, it is critical that philosophy is
aligned with scientific knowledge. Six sigma has long been seen as a statistics heavy,
technical approach to process control. In order to prevent it becoming another ‘myopic
67
revolution’ of improvement approaches, we must learn from our past mistakes, and
ensure that the wider philosophy behind the structured technicalities of six sigma are
recognised and acknowledged. In other words, we must not fail to recognise that
without managing people correctly, or training new recruits, any technical
improvements made to the processes will not be sustained.
2.10 Integration of Lean and Six Sigma
The literature reviewed so far has discussed the implementation of lean within a number
of diverse industries. While the application of specific tools and techniques is present,
there are no attempts to identify a methodology for a specific application or industry.
This section goes on to identify the benefits of combining lean philosophy and six
sigma, exploring what can be achieved through this integration.
The phrase “lean six sigma” is used to describe the integration of lean and six sigma
philosophies (Sheridan, 2000). They share similar features, as they both evolved from
TQM (Dahlgaard and Dahlgaard-Park, 2006). There is little literature available on the
integration of these concepts when looking for a “common model, theoretical
compatibility or mutual content or method”, (Bendell, 2006).
The concept of lean six sigma as an approach to process improvement has yet to fully
mature into a specific area of academic research (Bendell, 2006). It can be said that in
practice the majority of efforts to fully and comprehensively implement a lean six sigma
initiative to its full potential have not been realised (Smith, 2003). This failure to
sustain a change towards continuous improvement can be attributed for one, to the lack

68
of commitment from management (Cusumano, 1994, Kotter, 1995). Specifically, in the
case of fusing lean and six sigma, the two approaches have often been implemented in
isolation (Smith, 2003), creating lean and six sigma sub-cultures to emerge within the
organisation, which can cause conflict of interest and a drain on resources (Bendell,
2006).
Six Sigma complements lean philosophy in as much as providing the tools and know-
how to tackle specific problems that are identified along the lean journey. Where:
“Lean eliminates ‘noise’ and establishes a standard”
(Wheat et al., 2003, p. 44)
Six sigma focuses project work on the identified variation from the proposed standard,
which in itself does not entirely focus on the customer requirements, instead it is
sometimes a cost-reduction exercise (Bendell, 2005) that can lose sight of the customer
if not implemented alongside lean.
Similarities can again be drawn between lean and six sigma, and the need for a culture
of continuous improvement operating at all levels within an organisation. Arnheiter and
Maleyeff (2005) take this discussion further in their work on the integration of lean and
six sigma, and put forward the benefits of such a consolidated approach. For example,
providing lean with a more scientific approach to quality, so that through the use of
control charts, processes can be kept on target, effectively reducing waste incurred
through faulty processing.

69
Table 2.2 summarises the key lean implementation steps, along with the six sigma tool
that can be used as an aid to achieve each task. It can be seen here, that lean and six
sigma are ideally suited to be used in a comprehensive methodology incorporating the
key elements of both, as each stage can gain from the respective techniques, both
following the six sigma road map of Define, Measure, Analyse, Improve, Control.
Table 2.2 Synergies between Lean and Six Sigma, adapted from (Pyzdek, 2000)
LEAN SIX SIGMA
Establish methodology for improvement Policy deployment methodology Focus on customer value stream Customer requirements measurement,
cross-functional management Use a project-based implementation Project management skills Understand current conditions Knowledge discovery Collect product and production data Data collection and analysis tools Document current layout and flow Process mapping and flowcharting Time the process Data collection tools and techniques, SPC Calculate process capacity and Takt time Data collection tools and techniques, SPC Create standard work combination sheets Process control planning Evaluate the options Cause-and-effect, FMEA Plan new layouts Team skills, project management Test to confirm improvement Statistical methods for valid comparison,
SPC Reduce cycle times, product defects, changeover time, equipment failures, etc.
Seven management tools, seven quality control tools, design of experiments
The integration of lean and six sigma aims to target every type of opportunity for
improvement within an organisation. Whereas six sigma is only implemented by a few
specific individuals within a company, lean levels the empowerment and education of
everyone in the organisation to identify and eliminate non value adding activities
(Higgins, 2005). The integration of the two methodologies attempts to provide
empowerment even at the higher level process analysis stages, so that employees have
true ownership of the process.
70
If the two are actually implemented in isolation, the outcome can result in neither being
done effectively; constrained by one another’s needs in the organisation (Harrison,
2006). Again, it could even create 2 sub-cultures within the organisation, competing for
the same resources etc. (Smith, 2003).
When implemented as a stand alone philosophy, there is a limit to the scope and size of
improvements achieved through the application of lean principles. Antony et al. (2003)
suggest that this ‘ceiling’ of improvement is reached because the strategy used for
improvement depends on the problem trying to be solved, and therefore must be aligned
to achieve effective results. Antony et.al (2003) go on to suggest that this is a result of
lean principles lacking a directed, cultural infrastructure as can be seen with the six
sigma approach. This is a theme continued by Sharma (2003), who argues that six
sigma methodologies should be used to help drive the implementation of lean efforts in
an improvement initiative, as it can be difficult to establish any sort of momentum when
attempting to extend the philosophy throughout the organisation or supply chain. Hence,
these efforts need to be directed by a strong approach that is capable of maintaining
direction and focus within the business.
Both approaches have the same end objective, to achieve quality throughout, whether it
is customer service, the product, the process or training and education of the workforce.
They are effective on their own, but organisations may well find that after initial
improvement, they reach a plateau; and find it difficult to create an ongoing culture of
continuous improvement (Arnheiter and Maleyeff, 2005). To overcome this, the lean
approach must integrate the use of targeted data to make decisions and also adopt a
more scientific approach to quality within the system. Six sigma on the other hand

71
needs to adopt a wider systems approach, considering the effects of muda on the system
as a whole; and therefore quality and variation levels (Arnheiter and Maleyeff, 2005).
Figure 2.8 shows how each approach can gain from being seen as a single framework,
and also the balance that may be reached if effectively brought together. This is a key
concept for the integration of the two continuous improvement approaches, as a state of
equilibrium needs to be achieved between the two, moving away from a blinkered
approach in any one direction, risking becoming too lean and therefore rigid in
responses to the market and subsequently impacting on value creation. The other
extreme is to concentrate too much on reducing variation beyond the requirements of
the customer, and therefore wasting unnecessary resources in the pursuit of zero
variation. The balance lies in creating sufficient value from the customer’s viewpoint,
so that market share is maintained, while at the same time, reducing variation to
acceptable levels so as to lower costs incurred, without over-engineering the processes.
Figure 2.8 Competitive Advantage of Lean, Six Sigma and Lean Six Sigma
(Arnheiter and Maleyeff, 2005)
Low Cost
High Cost Low Value High Value
Six sigma Lean Lean & Six sigma
Producer Viewpoint
Customer Viewpoint

72
The integration of lean six sigma is not perceived by everyone to be an effective
meeting of approaches. There is some criticism in the literature regarding the blending
of the two approaches. Perhaps the most critical is Bendell (2006), who has extensive
experience as both practitioner and academic in this field. He argues that lean and six
sigma have become “Ill defined philosophies” (Bendell, 2006, p. 258), resulting in their
dilution as effective tools due to “relatively obscure…company specific training
programmes” (p258), going as far to say that “the alleged combination is no more than
a philosophical or near-religious argument about professed compatibility of
approaches” (p255). Bendell does go on however, to suggest that it would be beneficial
for all if a single approach that effectively brought the two philosophies together was
available.
These views reinforce the fact that although there appears to be a number of consultancy
models for lean six sigma freely available on the internet by consultants, the presented
methodologies are put together without logical explanation (Bendell, 2006) and more
importantly, with no theoretical underpinning or explanation for the choice of
techniques.
Spector and West (2006) take the view of the practitioner, pointing out that when
adopting lean/six sigma, practitioners can find themselves commencing a large number
of projects that yield insufficient results for the amount of time needed to complete
them. In stark contrast, Mika (2006) takes the stance that the two approaches are
completely incompatible with one another because six sigma cannot be embraced by the
“average worker on the floor” (Mika, 2006, p. 1). He argues that lean is accessible by
73
these workers, and encourages effective teamwork through collaboration and
participation through cross functional teams.
The key considerations based on this literature when constructing a new and a
comprehensive framework for lean six sigma, are:
1) It needs to be strategic and process focussed.
2) The framework should be balanced between the two philosophies to harness the
recognised advantages of both.
3) A balance between complexity and sustainability must be reached.
4) It should be structured around the type of problem experienced. Going one stage
further than this is to develop an industry specific framework.
Lean six sigma is applicable to any system that has a series of processes. The next stage
of development is to construct a lean six sigma framework that is geared towards
nurturing the growth of commitment and sustainability. The framework needs to
provide direction for the users, and more importantly results, over a relatively short
timeframe. The author believes this is a particularly important criterion for an
improvement framework, due to the need for quick improvements (i.e. proof of the
value of such initiatives) to be realised in organisations for the benefits discussed
earlier. It is not uncommon for pilot projects to be undertaken in order to demonstrate
such initiatives.

74
In terms of successful lean six sigma efforts, Smith (2003) outlines two case studies that
experienced impressive results from a combined approach to improvement. The first
case study had been practicing lean for approximately 18 months when consultants were
called in to push the improvements further. However, both case studies found that one
of the two approaches became dominant in the improvement process. A fully integrated
framework targeting specific industries will take away any such ambiguity over which
techniques to apply where and in what situations.
Sharma (2003) also describes the benefits of using six sigma techniques in conjunction
with lean, whereby strategic improvement goals are established by the company’s
leaders, and then a process of Quality Function Deployment (QFD) is used to prioritise
the project work. Although effective in this implementation, there is no comprehensive
framework present that specifically integrates lean and six sigma concepts through an
implementation roadmap. The QFD approach can also be viewed as a more
complicated approach to the selection of continuous improvement tools.
The work of George (2002) can be seen to lead the exploration of lean and six sigma
techniques, providing the benchmark work for future researchers. Following on from
this, one of the most comprehensive examples of research into this area is the work of
Kumar et al. (2006), who have integrated some key lean techniques with the six sigma
framework for implementation at an Indian SME. The approach taken was to develop a
lean six sigma framework around the problems identified at the organisation, which
while effective, may well be beyond the reach of most practitioners working under strict
time and other resource constraints as discussed earlier. Some key points are made
from this work as summarised on the following page:

75
1) There is no standard framework for lean six sigma.
2) There is no clear understanding concerning the usage of tools etc. within the
lean six sigma frameworks.
3) With the framework presented, there is no clear direction as to which strategy
should be selected at the early stages of a project.
(Kumar et al., 2006)
These points present key questions to be answered when considering the construction of
an effective lean six sigma framework.
2.11 Characteristics of Change
“It seldom happens that a man changes his life through his habitual reasoning. No
matter how fully he may sense the new plans and aims revealed to him by reason, he
continues to plod along in old paths until his life becomes frustrating and unbearable—
he finally makes the change only when his usual life can no longer be tolerated.”
(Tolstoy, unknown)
Different people experience different emotions when faced with change. As introduced
previously in this chapter, the reality is that today’s businesses need to reflect on how
they can change their approach to the way in which they do business, in order to remain
competitive and gain and sustain market share. Continuous improvement initiatives
have been adopted with varying degrees of success by organisations wishing to gain
advantage in their domestic or international arena. This drive to analyse, reflect and
improve organisations on an operational and more importantly strategic level is littered

76
with obstacles for the manager to effectively implement and sustain change. It is not
only the processes or operations that need long term management interaction, but also
the people directly involved with and surrounding these processes. This is succinctly
put by Dawson (2005) “The shaping and reshaping of technology and workplace
arrangements is as much a social process as it is a technical issue” (Dawson, 2005, p.
386).
To reiterate this point, the implementation of any continuous improvement effort, which
inevitably has the desired result of changing the culture of an organisation to some
degree, cannot be implemented from a purely operational standpoint. Mechanisms or
identified techniques need to be established within the improvement initiative that helps
the existing culture to evolve into one with a foundation of listening and thinking
(Atkinson, 2004). This is a point emphasised by Balle (2005) when discussing the
behavioural and affective aspects of lean, and their importance to successful
implementation. Similarly, Boyer (1996) asserts that embedding the necessary skills
and knowledge required for potential change efforts is crucial for the full adoption of
lean by an organisation.
After an organisation has decided to follow a path of lean or lean six sigma continuous
improvement; the common first stage is to target the most obvious opportunities for
improvement and quick return (Balle, 2005), providing instant, visual improvements.
Targeting the low hanging fruit of wasteful activities or elements of processes with
techniques such as 5S can achieve quick gains that demonstrate the power of continuous
improvement tools (Davies, 2005). The targeted implementation of these tools and
techniques can lead to short, sharp, effective successes, which are key in gaining the
77
trust and “buy-in” of the employees involved (Davies, 2005), and helping lead the way
for a lean culture to evolve.
The positive effect of this is that short term wins can give momentum to the initiative
and motivate, building trust with stakeholders (essential for sustainable change) (Kotter,
1995). Ideally, this type of driving force for change would feature throughout an
initiative; but this “honeymoon period” (Balle, 2005) of visible improvements and gains
is often short-lived.
However, once again, management must fully understand the true scope of such
techniques, and not latch onto them because of their relatively easy execution. The
overuse of such techniques at the cost of ignoring other complimentary tools is in itself
not a lean approach (Atkinson, 2004). This will not address, or even detract from other
potentially fundamental issues that may benefit from lean/lean six sigma techniques to
fully analyse and improve them. Once the scope and constraints of an improvement
initiative have been established by a committed management, progress can then begin to
establish the fundamental team competencies necessary, and select an appropriate
approach for the business type.
After these more obvious opportunities are addressed, only situations that are in need of
more detailed analysis, resources and commitment remain. It is at this point that the
long-term commitment of the team, and more importantly management is put to the test.
Like any project, clear goals and motivation need to be maintained to avoid myopia
setting in.
78
The role and necessity for total managerial commitment to change programs such as
lean six sigma cannot, and must not be underestimated. Literature discussing the
importance of the commitment needed by managers and in turn the leadership skills
required is well established (Kotter, 1995, Boyer, 1996, Brooks, 1996, Atkinson, 2004).
While effective leadership is essential for any organisational shift to a culture of
continuous improvement such as lean/lean six sigma, it is also critical that the correct
infrastructure of skills and knowledge, small working groups etc. is in place for success
(Boyer, 1996). Although Boyer (1996) describes leadership as a supporting mechanism
for a workplace infrastructure, leadership is a requirement for establishing any
infrastructure in the first place. It is expected that the set up of any such business
infrastructure will be a long and multi-faceted process. It is imperative that the leaders
of change (management) are not tempted to skip any of the stages or seek short cuts,
despite possible frustration over the pace of implementation or return. Attempts to
shorten the process will completely undermine the true potential of the initiative
(Kotter, 1995).
A lack of commitment, or unwillingness to commit to change by management could be
attributed to an information overload, due to the amount of literature, consultancies and
other resources available to the business manager. This can make it extremely difficult
to make a decision on any one approach. This is highlighted in the work of Atkinson
(2004), who discusses how information overload can overwhelm management, even
leading to total discouragement from committing to a strategy of continuous
improvement. This could also cause the cherry-picking approach to manifest (as
discussed earlier in the chapter), whereby managers are uncertain which of the

79
numerous approaches, tools or techniques would be the most effective for their
organisation. It is crucial for managers to avoid this mind-set, and any weaknesses in
the handling of the transition, as this will have a huge impact on the culture or thinking
of employees (Kotter, 1995).
Weaknesses can be magnified when time limits are shorter than required. Although the
application of lean techniques will shorten lead times within the system, if structured in
the correct manner, the potential weaknesses identified will be anticipated and managed
by the improvement framework being used by the organisation. The key to success at
this point, is the recognition that the improvement framework must be aligned with the
organisation and its specific objectives and vision.
Atkinson (2004, p. 21) makes an extremely valid point when he says “time is not always
on our side, whereas commitment is”. Furthering this point, it is essential to realise that
a lean six sigma framework or any improvement approach, will not translate directly
from the generalist textbook to specialised practice. Management must accept that lean
six sigma needs to be adapted in order to fit the environment, as the lean, or lean six
sigma “ideal” simply cannot be applied to every situation. If this is not acknowledged
by management, the initiative is left to fade away because it does not follow the book
exactly. As a result, potential cost savings will be missed (Beard and Butler, 2000),
and the cost of the project so far becomes a significant form of ‘muda’ or waste.
In contrast, from the practitioners perspective, Spector and West (2006) note that
“companies invest wanting to see fast and sizable changes…they can’t afford to wait
months or years...when the competitive landscape changes so quickly” (Spector and
80
West, 2006, p. 1). This presents an important consideration when companies are
looking to invest their time and resources into a lean/lean six sigma journey. It is
proposed that targeting the low hanging fruit of wasteful activities with techniques such
as 5S can achieve this when part of a structured plan. The ever-present pressure of
maximising profit margins, compounded by the fire-fighting of smaller issues that
regularly surface, means that a framework for a lean six sigma journey, should be
structured in such a way to guide the improvement team through a series of short, small
scale but effective projects, resulting in significant changes. These (relatively) small
scale projects can then be used to leverage motivation from other’s success, creating
that project momentum within the organisation found in earlier stages of projects
improvements (Shukla, 2006). In other words, lighting a number of carefully sequenced
small lean “fires” within the organisation, will eventually ignite a whole system into
positive change.
Although not all lean concepts can be adapted for every organisation, a well managed
and customised lean approach does bring change, within a relatively short timeframe.
This can contribute substantially to the building of a lean culture without challenging
the culture already embedded in the organisation (Shukla, 2006), paving the way for the
culture of listening and thinking (Atkinson, 2004).

81
The recent work of Bateman (2005) has investigated the enabling mechanisms required
for a sustainable culture of continuous improvement. From this work, three key
enablers were identified:
1) The need to follow the Plan Do Check Act loop in closing out actions.
2) The need for an enabling process to allow CI to take place.
3) A supportive management infrastructure.
The first enabler is of particular interest, as it emphasises the fact that a structured,
planned approach with inherent feedback is needed for teams to follow throughout the
course of an initiative. This provides a safety barrier, whereby each action or stage in
an improvement framework is considered and analysed. The next two stages really
drive home the importance of having a correct and appropriate management
infrastructure so that CI initiatives are effectively led and managed, while not being
constrained by the system itself (this is in agreement with Boyer (1996) as mentioned
previously).
Lucey et al. (2004) have demonstrated this through the application of a 5S initiative,
which not only confirmed that sustained change can be achieved within a relatively
quick time frame (in this case 10 weeks), but also highlighted five major drivers for
sustainable change. These being: enthusiastic leadership, building employee
engagement, using results from employee engagement to maximise lean ambition,
celebrating success and regular communication. The level of employee engagement is
critical for sustained improvement initiatives once effective leadership has been
established, as these are the very people responsible for actioning the strategy put

82
forward by the upper echelons of management. Lucey et al. (2004) summarise the
levels of this employee engagement necessary to undertake specific continuous
improvement activities in Figure 2.9.
Figure 2.9 Phases of Employee Engagement (Lucey et al., 2004)
In order to address these issues of sustainability when implanting change, Owen et al.
(2001) suggest that “the ability of an organisation to sustain quality products and
services……is a learnable organisational competence” (Owen et al., 2001, p. 1). Five
success factors for the creation of sustainable high performance and five gaps in
performance are identified in a model for sustainable high performance culture, as
shown in Figure 2.10.
0
1
2
3
4
5
6LIKERT SCALE
startSophistication of Lean Activity
Lean Sustainability Zone
Lean training
After 5S Cyclic Scheduling SMED TPM Six Sigma
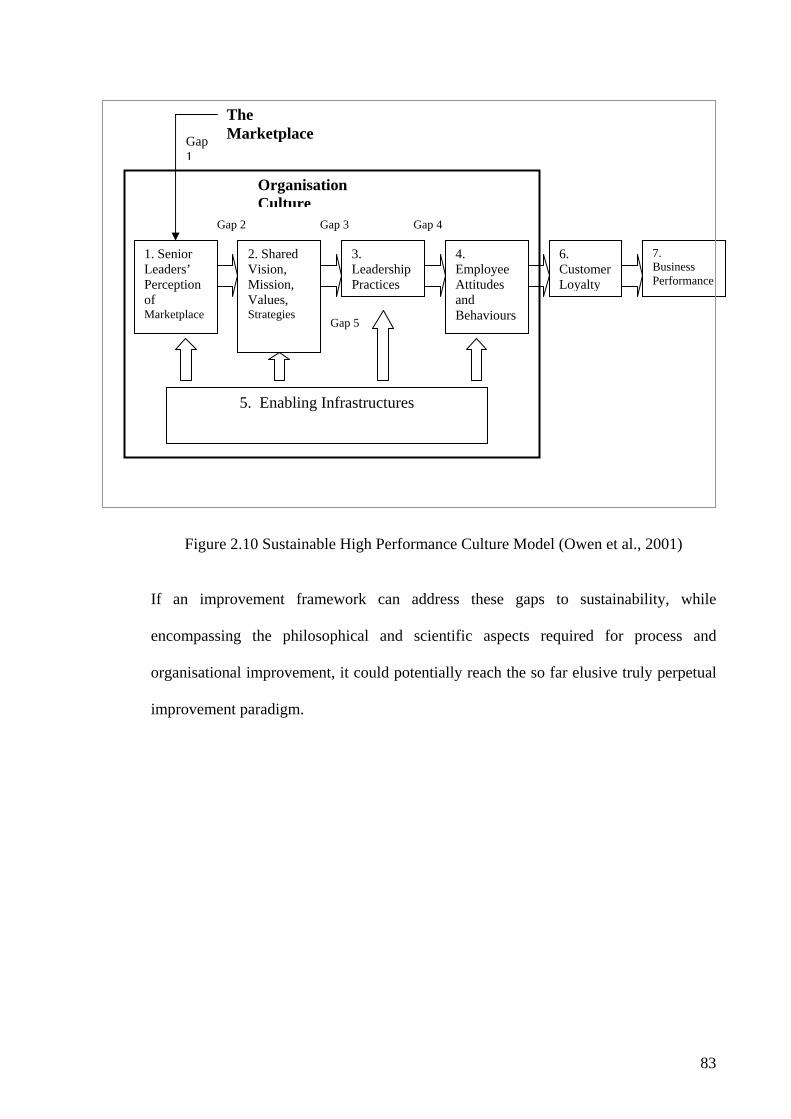
83
Figure 2.10 Sustainable High Performance Culture Model (Owen et al., 2001)
If an improvement framework can address these gaps to sustainability, while
encompassing the philosophical and scientific aspects required for process and
organisational improvement, it could potentially reach the so far elusive truly perpetual
improvement paradigm.
Organisation Culture
The Marketplace Gap
1
Gap 2 Gap 3 Gap 4
Gap 5
1. Senior Leaders’ Perception of Marketplace
7. Business Performance
6. Customer Loyalty
4. Employee Attitudes and Behaviours
3. Leadership Practices
2. Shared Vision, Mission, Values, Strategies
5. Enabling Infrastructures

84
2.12 Summary In summary, it can be seen that the business improvement philosophy of lean thinking
and the more scientific improvement paradigm of six sigma have experienced success in
a wide ranging spectrum of industries. The two paradigms are influential catalysts of
change as stand-alone methods, but more provokingly, if fused together, can potentially
represent an exceptionally powerful tool. Aligning the cultural aspects of lean with the
data driven investigations of six sigma holds huge potential in a bid for a genuine and
sustainable approach to organisational change and process improvement.
Taking this review of literature a stage further, the next chapter proposes a dynamic
generic framework of continuous improvement and the necessary relationships within it.
Using this framework as scientific reference, an industry specific continuous
improvement framework is then developed for the process industry sector.

85
3.0 Methodology
3.1 Introduction
The literature review in the previous chapter established the need for an integrated
approach to continuous improvement based on six sigma and lean manufacturing. This
chapter therefore establishes elements of a generic integrated framework for the purpose
of continuous improvement, and describes how this may be used to construct an
industry or situation specific improvement framework. This industry specific
framework is a focussed and high impact project tool, using an integrated lean six sigma
approach. The methodology is designed specifically for the process industry. The
cultural impact and sustainability of the customised model is then analysed through
comparisons of Soft Systems Methodology (Checkland, 1981), and the Sustainable
High Performance Culture Model (Owen et al., 2001) frameworks.
3.2 Generic Framework for Continuous Improvement
It can be seen from the literature review in chapter 2, that for a continuous improvement
initiative to be successful, it must address a number of vital core elements. These can
be summarised as follows:
1) At first, the organisation (and its supply chain, depending on the scope of the
initiative) must be understood as a system, including its complex interactions,
variability, and their continuous transformation over time.
86
2) There must be an embedded mechanism of continuous feedback, reflection and
action.
3) The cultural, philosophical aspect of the system must be aligned with a
scientific, data driven methodology and change.
Lean in itself does not address all of these criteria. Through the application of lean
techniques, significant changes can be made without this deep understanding of the
system. However, this can lead to instability. If only lean techniques are applied, it
would take too long to develop the necessary depth of understanding to take forward the
improvement initiative, something that can also be viewed as a contributing factor to the
unsustainable nature of many lean initiatives.
Taking a systemic view of the organisation is the backbone to the entire concept of
continuous improvement. An appreciation of the organisation as a social system and
the interactions between individual parts of that system as they work together is critical
(Ackoff, 1999). An organisation must also be regarded as a complex and dynamic
environment, where the modelling of these interactions must be understood (Forrester,
1999) before an organisation can look towards achieving sustainable improvements.

87
A system may be defined as:
“An entity that maintains its existence and functions as a whole through the interaction
of its parts”
(O'Connor and McDermott, 1997, p. 2)
A system can be viewed as a complex set of interactions and variation, so that:
Complexity = variation + interactions
(Harrell et al., 2004, p. 28)
The variation and interactions within any given system are not independent from one
another, but are interrelated and interdependent. It is the understanding and reduction of
variation, along with the understanding and configuration of interactions to best drive
the system which ultimately leads to its improvement. Lean manufacturing principles
are an important first step in the approach to understanding systems, as it simplifies the
system by reducing the complexity within it, therefore leading to a reduction in the
inherent variation and interactions that form part of that system. Statistical process
control is a fundamental technique to attain this thorough understanding and
management of this variation (Wheeler and Chambers, 1990). It is important to note
that not all systems are complex and have variation, an example of this is in practice is
the Beer Game, created by John Sterman at MIT, but in manufacturing in particular this
is almost never the case.
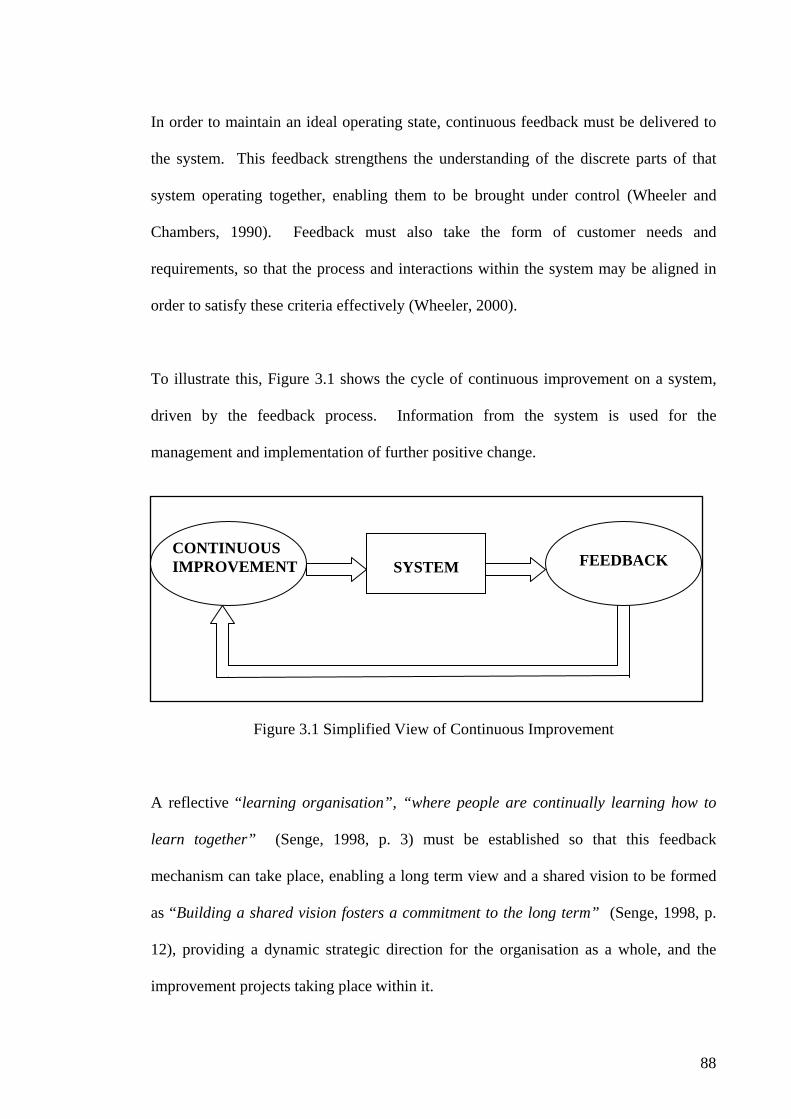
88
In order to maintain an ideal operating state, continuous feedback must be delivered to
the system. This feedback strengthens the understanding of the discrete parts of that
system operating together, enabling them to be brought under control (Wheeler and
Chambers, 1990). Feedback must also take the form of customer needs and
requirements, so that the process and interactions within the system may be aligned in
order to satisfy these criteria effectively (Wheeler, 2000).
To illustrate this, Figure 3.1 shows the cycle of continuous improvement on a system,
driven by the feedback process. Information from the system is used for the
management and implementation of further positive change.
Figure 3.1 Simplified View of Continuous Improvement
A reflective “learning organisation”, “where people are continually learning how to
learn together” (Senge, 1998, p. 3) must be established so that this feedback
mechanism can take place, enabling a long term view and a shared vision to be formed
as “Building a shared vision fosters a commitment to the long term” (Senge, 1998, p.
12), providing a dynamic strategic direction for the organisation as a whole, and the
improvement projects taking place within it.
SYSTEM
CONTINUOUS IMPROVEMENT FEEDBACK

89
Continuous feedback is the second foundation of continuous improvement, stemming
from the work of Deming (2000) and his Plan-Do-Check-Act philosophy, more recently
reflected in the D-M-A-I-C approach of six sigma methodology (Pande et al., 2000).
Building on the work of Forrester (1999), Sterman (2000) introduces “Systems
Dynamics” as a methodology to further map the interactions driving complex feedback
mechanisms within systems, and the corresponding decisions made by management
surrounding these interactions (Sterman, 2000, p. vi).
Once the interactions between different parts of the system have been identified and
understood, along with the information flow surrounding these interactions, it is
possible to manage this information, configuring it to best respond to system
requirements brought about through continuous feedback.
The key relationship in the system is that between productivity, cost and quality. The
interactions between these criteria must be analysed and understood before they can be
managed effectively, with the objective of improving these relationships through
feedback and revised training objectives – following the P-D-C-A/D-M-A-I-C cycle.
The balance between the three variables must be maintained as it is analysed and
improved, so that any action taken to improve one, does not jeopardise the other two.
From this, learning to manage the organisation as a system, understanding variation and
making decisions based on actual data are essential. To do this, it is necessary to align
the organisational culture within that system, and to train and manage the people within
it appropriately. Any journey of continuous improvement must be driven by the people
within the organisation looking to improve. Whether considering a transition to lean

90
thinking, six sigma, or a combination of the two, it is critical for employees to drive the
evolution of change. It is the lack of commitment to provide effective leadership, and
failure to gain the understanding and commitment of the people within the organisation
that cause many improvement initiatives to fail. For this involvement and
empowerment to take place, effective leadership is required to provide the necessary
vision. Once effective leadership has been established, the overall vision can be used to
influence the necessary cultural changes that must happen, and in turn drive this organic
system forward, whilst configuring interactions and value adding activities to achieve a
true state of perpetual improvement.
Figure 3.2 presents a causal loop, providing more context on the role of the system in a
continuous improvement initiative. The system and its complexities need to be
understood and managed so that value adding activities can be created, increased and
strategically implemented so as to improve the system. When these initiatives have
been established, feedback from the implementation should be fed back to the system so
that the creation and sustaining of value can continue. As seen in Figure 3.2 this
process should be a positive cycle, with each step in the process adding to the next, so
as the feedback from any improvements is sent back to the system, the understanding of
the variation, interactions, and the relationship between productivity, quality and cost in
that system is constantly improved. This greater understanding leads to more
opportunities for the creation or enhancement of value adding activities to be recognised
and managed accordingly. It is also important to note that in addition to this, it is
essential to have the appropriate tools and techniques to leverage this understanding,
which the proposed methodology in section 3.3 aims to provide.

91
Figure 3.2 The System in Context
Building on this view of the system improving through time, the journey to
implementing continuous improvement within an organisation is an organic path, where
improvements are experienced as time proceeds, while the system itself evolves on a
holistic level at the same time. However, this journey of change must not be too
organic; instead it must be harnessed and shaped into frameworks that are suitable for
its specific environment.
Figure 3.3 depicts the desired outcome of this organic pathway for the organisation. As
can be seen, the system is acted upon and improved in real time, but at the same time it
strategically evolves on a broader, holistic level. This evolution is not necessarily an
improvement, but it is important, and the responsibility of the management team to
ensure that this evolution is in a positive direction that results from the local
improvements to the system. A strategic linear path to improvement is preferred, so
+
System
+
Value Added Activity
Feedback
Continuous Improvement
+
+

92
that organisations may avoid pitfalls previously experienced with the application of
approaches that involve rapid reconfiguration of the system to gain improvements
which are difficult to susain, such as Business Process Re-engineering, whereby the
problems brought about by such quick action include:
“Lack of sufficient preparation, problems associated with implementation,
organisational weaknesses ...and problems that develop in the aftermath”
(Drago and Geisler, 1997, p. 297)
and
“failing to take a holistic view of the change process”
(Drago and Geisler, 1997, p. 298).
The job of the leader and those involved in the management and deployment of any
improvement initiatives is to ensure that a linear path is maintained in the evolutionary
journey of the organisation, while improvements are being made in real time. An
evolutionary path that is too steep, will result in an unstable foundation for continuing
improvement, leading to instability of any changes made, resulting in an unsustainable
course.
Conversely, if the process of evolution is too slow, then the rate of improvement will
not be sufficient to establish any sustainable changes within the organisation. Sufficient
momentum will not be gathered that invariably leads to the discontinuing of the
initiative.
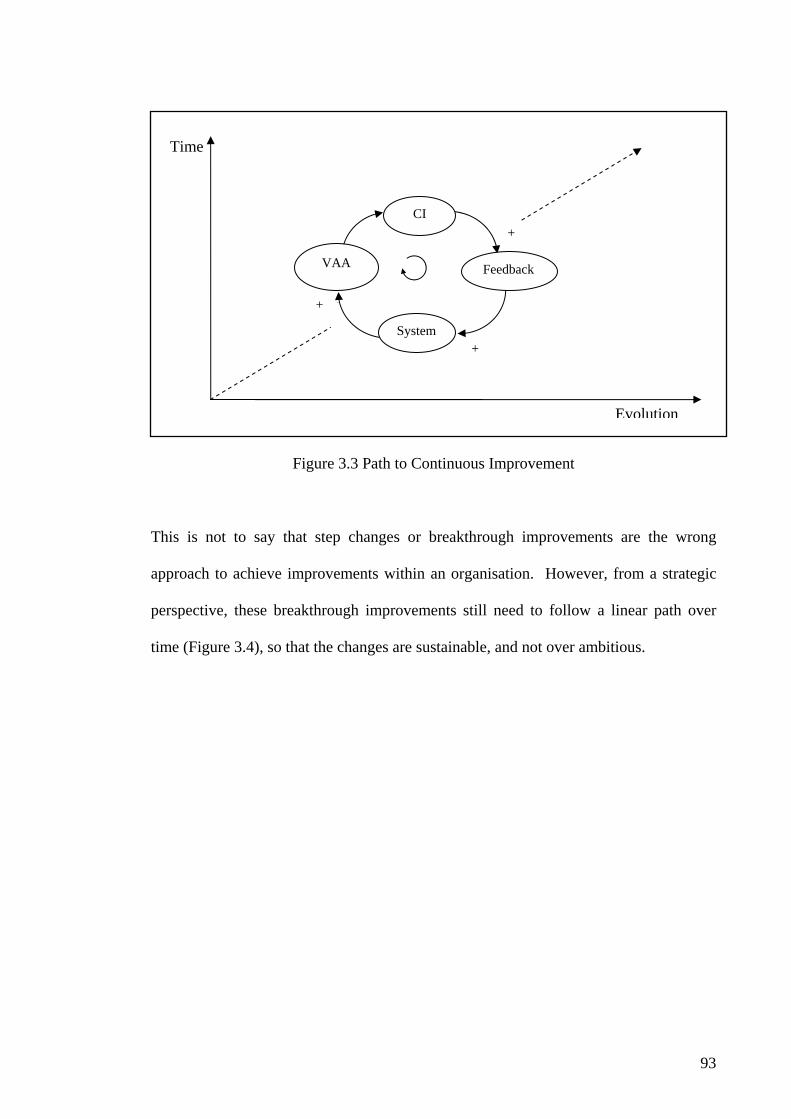
93
Figure 3.3 Path to Continuous Improvement
This is not to say that step changes or breakthrough improvements are the wrong
approach to achieve improvements within an organisation. However, from a strategic
perspective, these breakthrough improvements still need to follow a linear path over
time (Figure 3.4), so that the changes are sustainable, and not over ambitious.
+System
+
VAA Feedback
CI+
+
+
Evolution
Time

94
Figure 3.4 Strategic Path for Breakthrough Improvement
In essence, equilibrium between an operational philosophy and a cultural philosophy,
the data and the people must be achieved. The importance of this is demonstrated in the
Joiner Triangle (Joiner, 1994), which is explained in section 2.9 of this thesis. If we
look towards the most effective improvement philosophies in recent history, lean
thinking and the six sigma methodology are currently regarded as being at the forefront
of improvement paradigms. Although lean thinking can be regarded as a collection of
tools and techniques for process improvement, the foundation principles (outlined in
section 2.2 of this thesis) provide a philosophical element to the pursuit of continuous
improvement. This philosophical underpinning, coupled with the data driven process
improvement of six sigma, are considered to achieve this balance of philosophy and
science. However, to guide this balanced approach, and drive change throughout a
system on any level, effective leadership is again critical, exercising influence over
culture, processes and interactions.
Evolution
Breakthrough Improvements
Time

95
Figure 3.5 brings together the main elements discussed so far in this chapter, resulting
in the creation of a generic framework for continuous improvement. It is believed that
every node depicted in this diagram must be addressed by organisations looking to
embark on the journey of sustainable continuous improvement. Using this holistic view
as an underpinning, it is then possible to extract and focus on each section in order to
create a customised framework for specific application to a given business environment.
In this way, the most suitable techniques may be selected to address the particular
problems experienced by an organisation, resulting in a directed, structured
methodology. This methodology can then be used to guide the organisation through a
stable rate of sustainable improvement, while avoiding the pitfalls of cherry-picking
individual techniques without regard for the implications on the system as a whole.
Authors associated with each section are included on the diagram, in an attempt to show
how each area of the literature is interrelated to one another. Between them, Ackoff
(1999), Checkland (2000, originally published 1981), and Forrester (1999, originally
published 1961) have produced seminal work in the area of systems thinking in all its
forms (social systems, soft systems and systems dynamics respectively), furthered
through the work of Senge (1998) and Sterman (2000). The seminal work of Shewhart
underpins much of the way in which variation is analysed and managed in processes
and systems in industry today. Credited with the creation of control charts and process
quality control, Shewhart recognised that variation may be identified as either special or
common cause, and if the type of variation can be identified, then it can be managed
appropriately. Shewhart also realised that if a process is brought under statistical
control, then the behaviour of that process may be predicted over time.

96
Furthering this, Wheeler has explored variation and contributed significantly to its
understanding, while academics continue to explore the relationship between
productivity, quality and cost (Spedding and Chan, 2001, Voros, 2006). Cooper and
Kaplan (1988) challenged the traditional approach to costing within organisations,
arguing that “virtually all of a company’s activities exist to support the production and
delivery of today’s goods and services. They should therefore all be considered costs”
(Cooper and Kaplan, 1988, p. 96). Developing the Activity Based Costing (ABC)
methodology, a more focused costing tool was delivered to industry. The strategic
penalties of mismanaged accounting are highlighted in their work, making ABC “as
much a tool of corporate strategy as it is a formal accounting system” (Cooper and
Kaplan, 1988, p. 97).
With this use of ABC as a strategic tool, the information provided provides a platform
for Activity Based Management (ABM), which in itself “Refers to the entire set of
actions that can be taken, on a better informed basis, with activity-based cost
information” (Kaplan and Cooper, 1998, p. 137). In other words, ABC links the causes
of any change in the overall cost (increase/decrease) together with the product. This
cause and effect relationship then allows management to differentiate between value
adding and non-value adding activities, providing leverage for strategic decisions to be
formed around the creation of value within the organisation (Kaplan and Cooper, 1998).
These areas are all woven together through the pioneering work of gurus such as
Deming (2000, first published 1982) and Joiner (1994), as depicted in the Figure 3.4.
The work of Shewhart greatly influenced Deming, who studied his theories and brought
exposure to his methods on statistical quality control, and furthering the field with his

97
own thoughts on Profound Knowledge. Following his experiences in Japan in the early
1950’s, Deming realised that a scientific underpinning was required for quality, but
management commitment was the driver, with the focus being on people as the most
important part of an organisation. Deming originally tried to implement a scientific
approach to (statistical process control) quality management; however it did not bring
about the improvements that he anticipated. Deming realised that without the buy-in
and commitment of management and employees, any efforts to improve the system
would ultimately fail. This led to the creation of Deming’s Fourteen Points (Neave,
n.d.).
Lean and six sigma are included on this diagram due to their overwhelming presence
within today’s’ business environment. As previously mentioned in chapter 2 of this
thesis, Womack and Jones (1996) are credited with the popularisation of the Toyota
Production System in the Western World under the moniker of Lean Thinking, and
introducing industry to the concept of value creation and muda. Bateman (2005) has
further investigated the lean perspective, questioning how improvement efforts, and
specifically the lean approach may be made sustainable for those that embark on a
continuous improvement pathway.
When searching for effective improvement techniques, it is the lean philosophy and six
sigma methodology that are at the forefront within industry and the literature. Bringing
these two approaches together in a co-ordinated, structured framework is not possible
without it being driven by the people expected to adopt them in their working lives. As
discussed in section 2.10 of this thesis, Bendell (2006) explores the gap between the
lean approach and six sigma techniques, proposing that a true integration of the

98
approaches, creating one unified culture of improvement within an organisation, needs
to be investigated, and would be beneficial to industry. The work of Dawson (2005)
considers the management of change through a processual approach, drawing together
technological and cultural impacts of change and how to manage it effectively. Bringing
this all together is leadership, as no approach is sustainable, nor the people empowered
without the vision and motivation provided by an effective leader of change. Kotter
(1995) is a thought leader and pioneer in the area of leading change, while many authors
(Boyer, 1996, Brooks, 1996, Atkinson, 2004) discuss the importance of leadership and
the necessary qualities that must be harnessed for effective leadership.
Finally, true continuous improvement cannot be achieved within an organisation if the
culture is not aligned with the strategic objectives. If this cultural change can be guided,
through a specifically configured framework of projects within the system, then as
discussed previously in this section, the very evolution of this organic entity may be
configured and influenced accordingly.
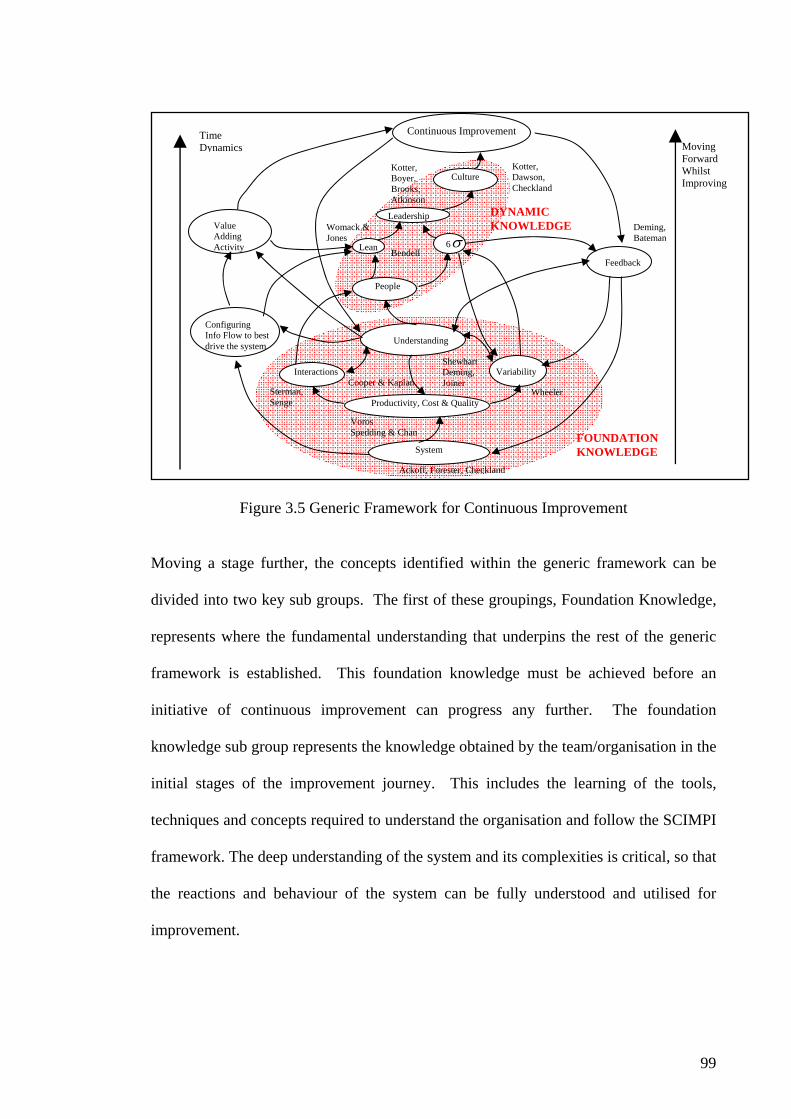
99
Figure 3.5 Generic Framework for Continuous Improvement
Moving a stage further, the concepts identified within the generic framework can be
divided into two key sub groups. The first of these groupings, Foundation Knowledge,
represents where the fundamental understanding that underpins the rest of the generic
framework is established. This foundation knowledge must be achieved before an
initiative of continuous improvement can progress any further. The foundation
knowledge sub group represents the knowledge obtained by the team/organisation in the
initial stages of the improvement journey. This includes the learning of the tools,
techniques and concepts required to understand the organisation and follow the SCIMPI
framework. The deep understanding of the system and its complexities is critical, so that
the reactions and behaviour of the system can be fully understood and utilised for
improvement.
System
Productivity, Cost & Quality
Interactions Variability
Understanding
Configuring Info Flow to best drive the system
Value Adding Activity
People
Lean
Continuous Improvement
Leadership
Culture
Feedback
Moving Forward Whilst Improving
Kotter, Dawson, Checkland
Kotter, Boyer, Brooks, Atkinson
Womack & Jones
Bendell
Deming, Bateman
Shewhart Deming, Joiner
Ackoff, Forester, Checkland
Sterman, Senge
Voros Spedding & Chan
Wheeler
Time Dynamics
Cooper & Kaplan
FOUNDATION KNOWLEDGE
DYNAMIC KNOWLEDGE
6σ

100
The second sub group, Dynamic Knowledge, represents practical application. It
encapsulates the tools, techniques and cultural aspects that must be applied and
developed in practice. The concepts within this group are geared towards the practical
application of improvement techniques and the guidance, development and evolution of
the cultural changes that need to take place before a true continuous improvement
environment is accomplished.
The Dynamic Knowledge sub group represents the practical application of the
Foundation Knowledge principles through lean and six sigma techniques as part of the
improvement initiative. The two stages are linked together, as Dynamic Knowledge
cannot be achieved without first establishing the foundation knowledge. Continuous
feedback further links the two sub groups in the evolutionary path of the improvement
journey.
The SCIMPI methodology guides the organisation through this creation of foundation
knowledge and the transition to dynamic knowledge, delivering a stable underpinning to
a continuous improvement initiative for the organisation in question.

101
3.3 Supply Chain Improvement Methodology for the Process
Industry (SCIMPI)
As explained in chapter 2, we know that different industries have different processes,
and therefore need to find ways to adopt lean and/or six sigma methodologies (Beard
and Butler, 2000). For many organisations which take on a lean initiative, it is the
beginning of a successful journey into an environment of continuous improvement, as
the very nature of lean is iterative. Once an organisation has started to follow the lean
approach, opportunities for improvement should continually present themselves, leading
to a continuous analysis of the material and information operations, which in turn will
lead to an increasing flexibility to respond to customer demand.
When businesses try to extend the lean philosophy throughout their respective supply
chain networks, it can often become problematic; with companies finding that they
grind to a halt after taking the first few critical steps, if the wrong implementation
strategy is followed.
The most common problem when implementing lean within an organisation, is the
tendency of the management to ‘cherry-pick’ a few key lean tools. They implement
lean initiatives, interpreting the methodology how they feel it best suits their facility.
Individual aspects are identified, resulting in one or two lean ideas being implemented,
with the organisation operating under the pretence that they have become ‘lean’, but
find improvements plateau after some initial success. It can be argued that the ‘kaizen
blitz’, or breakthrough improvement is a valid approach to cultural change. However,
the danger of this approach is that it sets up employees for a big improvement that does

102
not happen once the easy pickings have been made, having a detrimental affect on
morale and commitment in future ‘blitzes’. Another common problem is the fact that
the information flow around the system is ignored, while the material flow is constantly
under scrutiny. This is a direct result of organisations becoming too focussed on the
application of ‘lean tools’ instead of a culture driven approach, while management
under utilise their potential influence and neglect the need for total commitment.
This is also a direct result of the misalignment of systems such as Enterprise Resource
Planning (ERP) or Materials Requirement Planning (MRP) packages and the lean
philosophy. For example, if a business has invested in an MRP system, management
may refuse to turn it off and rely solely on the lean infrastructure to take over, because
of the initial outlay on the MRP software. This situation has the result of the
organisation operating with competing systems, and therefore creating more muda, as
value is not created when two systems are carrying the same information and doing the
same job.
Building on the comprehensive work of Abdulmalek et al. (2006) concerning the
application of lean in the steel industry, along with Kumar et al. (2006) and George
(2002) with their work on lean six sigma, the proposed methodology presents a
comprehensive mapping approach. SCIMPI integrates key business indicators with
traditional mapping techniques and quality initiatives, providing a dynamic view and
quantification of the results through models developed in simulation software. This
results in a customised framework for lean six sigma projects specifically for
implementation within the process industry. In other words, a lean six sigma
framework, aimed purely at the process industries that encompasses the highest impact
lean and six sigma techniques, emphasising the cultural change that must be adopted by
103
any organisation wanting to start and sustain a journey of continuous improvement. As
in discrete manufacturing, in order to realise the full potential of such improvement
methods, it is essential to focus on the whole supply chain.
The Supply Chain Improvement Method for Process Industries (the SCIMPI model) is
developed here in order to provide a comprehensive mapping and analysis framework
within the process industry, facilitating a dynamic approach for both the operational and
business level. Instead of using the cherry-picking approach, which alone can be time
consuming and lead to inappropriate application, the SCIMPI model aims to bring
together the most suitable high-impact techniques which guide strategic direction and
planning.
The generic framework establishes the core elements to arrive at, and sustain a
continuous improvement initiative within an organisation. This provides a baseline
from which more focused continuous improvement methodologies can be designed. In
order to do this, the stages necessary to achieve continuous improvement must first be
established according to the generic framework elements.
Taking the generic framework as a guide, the journey to continuous improvement can
be deconstructed into five key stages that are based on the pioneering Deming Cycle of
Plan-Do-Check-Act, but are considered more appropriate for use as a guide for
organisations to align improvement tools with the Generic Framework of Figure 3.5.
104
Map: To gain a systemic view and understanding of an organisation, and achieve the
elements of the foundation knowledge sub group, it is necessary to map that
organisation. The Value Stream Mapping and/or simulation approaches are seen as the
most appropriate means to achieve this.
Strategy: To aid in the role of leadership, and to ensure that for the duration of the
initiative the system is moving forward whilst improving, strategic direction is needed
to guide the organisation. This strategic direction can be drawn from the Value Stream
Mapping process, and through the application of Balanced Scorecard Drivers (such as
objectives, measures, targets and initiatives).
Centre: Once the strategic direction is established for the journey to continuous
improvement, it is then essential that the initiative is ‘centred’. This stage establishes
how the system operates, providing a base-line measurement from which it can be
improved through the application of appropriate techniques. To achieve this, Value
Stream Mapping is again considered to be a suitable approach, along with simulation in
order to consider the interactions within the system, and to some degree the variation
present. Statistical Process Control is also considered to be an essential tool, furthering
the consideration of variation from the simulation and/or value stream map.
Advance: This stage is concerned with the practical improvement of the system and the
creation of value, once it has been centred. There are two main targets within this stage.
The first target is the reduction of interactions in the system. This is achieved through
increasing value added activity through the application of appropriate lean techniques,
requiring the people in the system to drive the application of foundation knowledge.

105
For this purpose, value stream mapping is once more considered to address the
interactions within the system, while additional lean techniques such as 5S, Single
Minute Exchange of Die and Total Productive Maintenance are also considered suitable.
The second target is the reduction of variation within the system. The application of
lean tools and techniques identifies key areas that can be leveraged by six sigma
techniques. It is also necessary to configure the information flow to best drive the
system, providing continuous feedback. This reduction in variation can be achieved
through the application of techniques such as statistical process control, simulation and
soft computing techniques. The application of these tools depends on the dynamics of
the system; therefore it may be suitable to use SPC in one scenario, but neural networks
in another.
Sustain: The final stage to achieving a state of true continuous improvement is the
cultivation of an appropriate culture, in other words, ensuring that any improvements
made can be sustained by the system. This can be achieved through the use of
simulation as a reference model for feedback on proposed improvements, and the
introduction of standard work practices and documentation. The improvement initiative
must also be communicated to the rest of the supply chain, bringing cohesion to the
improvement effort across business units.
Table 3.1 provides a summary of the five stages outlined above, along with the elements
of the generic framework that they address, and also the tools and techniques required
from the proposed methodology to actually achieve each stage.

106
Table 3.1 Aligning Tools to Generic Framework
Stages to achieve Generic Framework
Generic Framework Elements Addressed
Tools for Proposed Methodology
MAP System, Understanding, Productivity, Cost, Quality, Foundation Knowledge
Value Stream Mapping, Simulation
STRATEGY Leadership, Moving Forward Whilst Improving
Balanced Score Card, Value Stream Mapping
CENTRE Feedback, Foundation Knowledge
Value Stream Mapping, Simulation, Statistical Process Control , Value Velocity
ADVANCE Lean, People, Value Adding Activity, Configure Information Flow, Feedback, Six Sigma
Value Stream Mapping, Simulation, 5S, Single Minute Exchange of Die, Total Productive Maintenance
SUSTAIN Culture, Continuous Improvement
Feedback, Standard Work, Simulation
It should be noted that although the Value Stream Mapping (VSM) approach is used to
address a number of the five stages in Table 3.1, it is not suggested that the actual VSM
exercise is repeated throughout. If VSM is used in the Map stage, then the information
gathered and the value stream maps created should be used for the subsequent stages.
Building on the tools identified above that address the required stages to achieve
continuous improvement, Figure 3.7 is an outline of the SCIMPI approach. The well
established six sigma Define Measure Analyse Improve Control (DMAIC) framework
is used as a platform providing direction for the continuous improvement
implementation. In addition to this, another stage has been added at each end of the
DMAIC cycle. Lead and Learn to launch the initiative, and Enterprise to restart the
cycle of continuous improvement.
The SCIMPI methodology uses the DMAIC approach of six sigma as the baseline
structure for the overall direction of the initiative. Lean techniques are then used within
this framework to benchmark the system and provide strategic direction for the

107
initiative (i.e. identifying desired future state). Lean techniques are also used to
consider and improve the organisation on an operational level, reducing complexity and
interactions within the system, through the targeted removal of non-value adding
activities. From this reduction in complexity, lean identifies opportunities for
improvement that can then be leveraged through the application of high powered, more
focused, six sigma techniques, driving the improvement of the system further towards a
lean environment. Figure 3.6 illustrates this integration of lean and six sigma, and how
both strategic and operational improvement is achieved.
Figure 3.6 Integrating Lean and Six Sigma
Although tools and techniques are listed in each stage of the SCIMPI methodology, it is
not proposed that they are used in this sequence. While VSM and simulation are both
contained in the SCIMPI methodology, it is not intended for both approaches to be used
in every application of SCIMPI. The VSM approach should be used to highlight
opportunities for improvement within the system, and then used to leverage the use of
other tools within the methodology to tackle these opportunities. If VSM highlights that
Lean Thinking
Six Sigma
IMPROVEMENT
STRATEGY OPERATIONS Provides high
powered tools for
leveraging improvement towards lean

108
variation is an issue, then simulation could be used to address this. Simulation as a tool
can be used in two ways. The first is as a mapping tool and as an analysis tool, where it
provides a visual aid that can be used to facilitate communication between members of
the organisation and management (Maani and Cavana, 2004), engaging their interest
(Harrell et al., 2004), making it an effective tool for gaining the quick commitment of
management and employees alike. Simulation models can also deal with complicated
systems (Kelton et al., 2002) that may otherwise be difficult to understand or
communicate to others, with their ability to run in real, delayed or compressed time
(Harrell et al., 2004) providing quick feedback on any possible changes to the system.
Simulation allows the user to explore possible changes to the system without disturbing
the existing set-up, therefore avoiding the expense and time that is required to do so.
However, there are a number of acknowledged disadvantages to the use of simulation.
Special training is required if simulation software is to be used effectively, and once
personnel have been trained, the construction of an accurate simulation model can be
expensive, and time consuming (Banks, 2000). It will take a substantial amount of
time to achieve an accurate simulation model of a system, as the model needs to be
tested and validated before it can be used as a resource. Associated with this, is the risk
that by the time the model has been validated and is ready for use, the dynamics of the
system may well have changed, and improvements could have been implemented
because time was an issue. If any of these disadvantages make the use of simulation
unfeasible for an organisation, then VSM can be used in its place.
The SCIMPI methodology alleviates the disadvantages of using simulation, by using
VSM to identify where simulation can be used to best leverage improvement. With this

109
in mind, the SCIMPI methodology suggests using either, or if feasible, both together,
leaving it to the preference of the organisation to determine which approach would be
more beneficial. As an example of this, larger organisations may well have ready
access to any number of simulation software packages, while smaller businesses may
not have the resources required.
In summary, if lean is implemented without six sigma, then there is a lack of tools to
leverage improvement to its full potential. Conversely, if six sigma is adopted without
lean thinking, then there would be a cache of tools for the improvement team to use, but
no strategy or structure to drive forward their application to the system.

110
STAGE 0 MANAGEMENT COMMITMENT LEAD & LEARN Establish Continuous Improvement fundamentals
with cross-functional teams
DEFINE Value Stream Mapping Balanced Scorecard
MEASURE
Simulation Balanced Scorecard Activity Based Costing Value Velocity Statistical Process Control
ANALYSE Simulation Statistical Process Control
IMPROVE
5S Single Minute Exchange of Die (SMED) Total Productive Maintenance (TPM) Neural Networks
CONTROL Standardised Work Simulation Customer Focus
ENTERPRISE Merge cross-functional teams with supply chain partners, strive to create lean enterprise
Figure 3.7 The Supply Chain Improvement Model for Process Industries
STAGE 1
STAGE 2
STAGE 3
STAGE 4
STAGE 5
STAGE 6
STAGE 7
111
Stage 0
The very first, and most important stage for any organisation wishing to embark on a
journey of continuous improvement (no matter which particular path they wish to
follow), is to gain the commitment of top and middle management. Without this
commitment driving the journey to continuous improvement, the initiative will almost
definitely fail. The path to obtaining this commitment can be fraught with obstacles,
and cannot be rushed. Adequate time and patience must be given so as not to jeopardise
the development of this commitment.
Establishing this commitment is beyond of the case studies in this thesis. As with any
approach to continuous improvement, management commitment should be established,
and then the most appropriate agent of change selected. The SCIMPI methodology is
intended to be the approach adopted by an organisation that already has gained the full
buy-in of management.
The subsequent stages of the SCIMPI methodology present a selection of tools to map,
analyse and improve a system. It is not suggested that all of these tools must be used in
every case, or indeed applied in a particular order. These are the possible tools that
should be used, however, depending on the dynamics of the system in question, it may
be more beneficial to use certain techniques and not use others. For example, in the first
instance, it may be beneficial to use simulation software to map and analyse a system,
where in another situation it may not be necessary. The following stages describe what
each tool or technique provides, where it fits within the methodology, and what is
achieved through their application. The planned time frame of the SCIMPI project and

112
its implementation should be considered, and in the case that all techniques within a
stage are appropriate, then the order of their application should be based on the
available resources.
Stage 1
Lead and Learn is the first step, directing the user to establish cross-functional teams.
The beginning of any improvement initiative needs to centre on the selection of
appropriate team members for the project in question. The team needs to be cross-
functional, comprising of members or representatives from every unit that will be
considered during the project. A team leader, or champion needs to be appointed at this
stage, and their selection must be based on their cognitive skills, technical skills, and
enthusiasm. It is the responsibility of this team leader to make sure that all members of
the team understand the vision and goals of the project. It is essential that the team
leader or facilitator maintains vision and guidance throughout the project, and must be
accessible by all group members.
This approach of having an established Team Leader trained in the SCIMPI
methodology is aimed at bringing the skill base back to the company. This is so that the
organisation does not need to rely on outside consultants to provide the necessary skill
base and expertise, with the people trained in the SCIMPI framework having a vested
interest in the organisation (also an important aspect of the six sigma approach). Over
a period of 1 day or 1 shift, the team leader (a project manager or facilitator) must then
discuss with the team the fundamentals behind the rest of the SCIMPI lean sigma
approach. It is at this first defining moment, that cultural change within the organisation
113
begins, and the realisation of empowerment is introduced. The role of simulation, and
the tools used in all of the following stages should be introduced and understood before
moving on any further with the SCIMPI model. The first stage after bringing the team
members together should adhere to the following typical structure:
• Introduction of all team members, with the facilitator explaining what business
unit they come from and why they are there, relating the explanation to a
systems view and emphasising that everyone has an important role in the supply
chain.
• The aim of the project needs to be clearly stated, along the lines of “this is our
situation as a company, these are some of the perceived problems, and these are
the tools we are going to use to remedy the situation”. It needs to be underlined
to all team members at this stage of the project, that the business is there to make
money, and if some of the problems are not tackled, then it will affect
everybody. This is not to be used as a scare tactic, but it is used as a levelling
statement, so that everybody realises that through a collaborative effort,
management is trying to maximise the efficient operation of the business as a
whole, without compromising on product quality or reducing employee
numbers. The initiative is being undertaken to make sure everybody will keep
their jobs.
• The scope of the project must then be discussed, outlining what section of the
supply chain will be considered, along with the project time frame, and
deliverables to be achieved along the way. Weekly deadlines should be set for

114
specific points of the project, covering points such as mapping and data
collection. The project must also be given context in terms of the whole supply
chain, and how it fits into the overall strategy of continuous improvement. The
expectations of what the successful outcomes will lead to, and how it will
benefit the organisation, and therefore the people involved.
• Resources available to the team, including information, time and money needs to
be made clear, so that there is no confusion over where to go, how to collect
data, what authority is needed and what can be done when a problem is
identified.
• The SCIMPI lean sigma framework, with a brief overview of the LDMAICE
flow, outlining the tools used for each stage. The key areas of lean thinking
must be addressed here, including the main tools and techniques utilised in the
SCIMPI framework, including:
o The 7 wastes. How to spot them and manage them.
o The importance of real data collection.
o An overview of 5S.
o An overview of SMED.
o An overview of TPM.
o Standardised work, and how it is used.
o Customer focus, being careful to highlight that business is there because
customers are there. This needs to be related back to the 7 wastes and
the concept of value.

115
On the second day (or shift), the Value Stream Mapping approach to be used should be
explained, along with how all everything is brought together at this point. An
introduction to the concepts of VSM (including the symbols used, data needed etc.)
should be followed by an introduction to the current state map. The next stage of the
SCIMPI framework follows the VSM techniques in more detail.
This stage serves the purpose of communicating to the team the vision for the
organisation and the journey of improvement, and the dialogue that the leader has with
the team derives from the theories and concepts identified in Figure 3.5. In particular,
the concepts of system, productivity, quality and cost, variability, interactions and
understanding are considered, which together form the ‘Foundation Knowledge’ sub
group within the generic framework (Figure 3.5). This is also the first step in the
encouragement of employee engagement and the starting point for the development of a
continuous improvement culture. Although leadership is essential at every stage in the
journey of continuous improvement, it is at its most critical at this point, together with
clarity. It is at the very beginning that the people involved in the team are influenced
the most – first impressions of the reasoning behind the project will dictate the way in
which the whole initiative is perceived by the employees.
Stage 2
The Define stage of the SCIMPI methodology is perhaps the most enlightening part of
the journey. It is at this point that the team ‘walk along the supply chain’ to create a
current state Value Stream Map, seeing for themselves the interactions and variation
within the system, and seeing how the system works as a whole first hand. An enhanced
116
version of Value Stream Mapping (VSM) is used. The limited technical information
concerning cycle times, changeover time, and so on for each process, leaves the VSM
with a few key indicators of system performance. It was found considering the course
of the mapping phase that different data would be more beneficial when mapping the
operations of process industries.
As it stands, with traditional VSM, the only indicator of quality performance for each
process is the defect rate. However, this only highlights how much of the product is
within the specification limits. The addition of quality data in the form of process
capability, using data from the construction of x-bar charts (i.e. the percentage of data
outside of the control limits) is included in the VSM data-boxes found below each key
process. Along with the down-time, this provides an immediate view of how well the
process is performing at the time of mapping.
This is deemed critical as a benchmarking tool, whereby each process is considered, so
as to highlight areas of high variation to direct the focus of statistical techniques in the
next stage of the framework. It is important to get an early indication of the variation
present within the system, so that if any of the processes are operating out of control,
they are highlighted and managed as soon as possible before moving on to any other
process improvements.
Although this means that the creation of a current state VSM will take longer than the
traditional approach, the result will provide more than just a brief overview of the
system. If data such as control charts or process capability is not available at the time of
mapping, then this should trigger a feedback loop making the collection of this data the

117
very next task, so that it may be added to the current state map at a later date and used to
inform the strategy of improvement. The collection of this data is essential, providing
the improvement team with a comprehensive overview of the system, and how it is
behaving at the key processes. Without this, if any changes were made to the system
while some of the key processes were not in a state of statistical control, then not only
would the improvements be unsustainable, but they would relocate the problem to
another point in the system, perhaps even amplifying the situation.
From this current state VSM, targeted processes can be quickly and effectively
identified by all team members and pursued with subsequent statistical techniques. This
will also act as a visual aid, showing all team members the extent of variation within the
system, and discussion can ensue regarding its effect. There is a need to establish
systems boundaries and interfaces when a systems approach is used. The value steam
mapping exercise carried out in this stage identifies the scope of the system that is to be
improved through subsequent stages of the framework. The boundaries of the
improvement exercise are demonstrated in the resulting current state value stream maps,
with the purpose of providing clear scope and focus for improvement teams when
embarking on an improvement project using the SCIMPI framework.
The scope of the project is experienced directly, and a deeper understanding of the
interactions and variation within the system will be gained, and as a result the
relationship between productivity, quality and cost within the supply chain is further
appreciated. This now brings an understanding of the concepts of the ‘Foundation
Knowledge’ sub group being put into practice.

118
Team members are encouraged to discuss with each other the VSM they are observing
and mapping in relation to the lean tools and six sigma techniques covered in stage 1 of
SCIMPI. Stage 2 provides an inclusive activity, bringing all team members together at
the source of analysis. This in turn provides a platform for acceptance of the continuous
improvement initiative, building on the key concepts identified in the ‘Dynamic
Knowledge’ sub group of Figure 3.5, through communication from management (who
guide the stages set out in the SCIMPI methodology), and also developing some
cohesion between group members. This transition to the “Dynamic Knowledge’ stage
of continuous improvement encourages employees to bring forward their ideas and
develop as a team. Getting everybody involved at the process level has a positive
impact on motivation and focus of the team.
The next key addition to the VSM tool is that of the balanced scorecard approach
(Kaplan and Norton, 1996), so that the “critical success factors considered necessary to
fulfil the corporate goal(s) to ensure future success” (Hepworth, 1998, p. 559) are
identified. Once the current state VSM has been constructed, the map should be divided
into sections, or loops, of key processes, including inventory and storage, so as to
provide focus for each section of the system. For example, one loop could incorporate
the customer end of the supply chain, or the information flow between customer and
producer, or even production control. These sections need to be identified through
focussed discussions between team members, so that a multidimensional approach (i.e.
from different business perspectives provided by a cross-functional team) to
deconstructing the current state VSM into smaller projects or sections can be achieved.
Once the sections have been identified, the identification and quantification of
objectives, measures, targets and initiatives for each stage should be discussed and

119
prioritised in line with the lean six sigma framework. Although not fully utilising the
balanced approach of the BSC, the four criteria are seen as important measures, taken
and used as an integral part of this stage, providing focus on applicable lean six sigma
initiatives that may be pursued.
This process mapping stage also provides the direction and scope for smaller scale, data
intensive projects, which are tackled with six sigma theory. The four key information
points for each loop are used as a platform to keep the initiative focussed on providing
value for the customer. So in effect, they form a micro “customer scorecard” for each
section of the supply chain, asserting the drivers of vision and management strategy in
the initial defining stage of the SCIMPI framework.
The VSM exercise needs to be carried out by the team, as a team, ensuring that every
member has a part to play in the collection of data and drawing of the value stream.
Once this current state stream exercise has been constructed, it is important for the
group to convene and discuss the resulting map.
Effective leadership is essential at this stage, as the drivers for the key process loops are
discussed and linked to the overall vision and strategy, ensuring that all team members
are able to contribute to this.
Stage 3
The Measurement stage introduces a selection of simulation to record the current state
of operations in a dynamic environment. The use of simulation at this point in the

120
SCIMPI model serves a number of purposes. First of all, it reinforces the view of the
organisation(s) from a systems perspective, and therefore the interactions and variation
that take place within that system, drawing from the Foundation Knowledge group in
Figure 3.5. Using the VSM created in the previous stage, the simulation model should
be constructed by the team leader (unless a team member has previous experience of
simulation software). The simulation model must be presented to the team for review at
regular intervals, in order for the team to check its accuracy.
Once the simulation model has been completed, and its accuracy verified by the team, it
can be used as a dynamic visual aid to both demonstrate the problems in the supply
chain, and also model any changes to be made before physically committing to them.
This exercise is essential because it illustrates that the ownership of any problems is not
down to any one individual or department. The team members will of course be picked
for their analytical skills and cooperation, and may well be managers of their own
section. By running the simulation model at this point, it can be clearly demonstrated
how variation effects the system, how logistics impacts lead times and so on. The
model can also be used to show the capacity may well be there, but the variation within
the system is driving poor performance. Such a visual approach, demonstrating how
any bottlenecks or problems will not go away and just transfer to a different section of
the supply chain unless the whole system is considered and the root causes are targeted,
is a powerful tool to bring cohesion to the group and move towards a realisation that
change needs to happen, overcoming any of the ownership issues such as “it’s not in my
department, so it doesn’t effect me”.
121
The SCIMPI framework is aimed at providing these people with the vision, objectives,
motivation and skills for continuous improvement. It is then the responsibility of these
managers or supervisors to implement action down through the hierarchy to an operator
level. This decision has been made to get effective results, quickly. If operators are not
involved from the very beginning, problems with attendance, commitment or unions
may provide more issues than necessary.
Activity Based Costing (ABC) is seen as an important benchmarking data, and also
easily fits into the simulation environment. ABC in itself is an involved and
complicated technique to comprehensively apply to a system. However, when a
simulation approach is used, data required for ABC, such as materials costs, machine
operating expenses, along with other fixed or variable costing data can easily be
included, making the process of ABC far easier to implement. ABC is an intrinsic
function of modern software packages, such as ProModel, Arena, and Witness. This
aspect of simulation modelling is demonstrated in the work of Spedding and Sun
(1999). Therefore, simulation provides a platform for the use of ABC, and this can
provide positive feedback to or about the system in order to configure value adding
activities and strategy accordingly. This can be seen on Figure 3.5. whereby feedback
occurs and filters back to the Foundation Knowledge group concepts, and in practice
activities. As with all stages in continuous improvement, feedback is a recurring theme
in stage 3.
Incorporating cost into the dynamic map of the value stream is aimed at quantifying
both problems and solutions in real terms for all those involved. ABC also helps focus
on what ‘value’ is being used where. In other words, it provides an accurate measure of

122
how much money is being used to process, move and store product or information in the
supply chain. Translating opportunities for improvement into cash figures is universally
understood and brings back the terms of change into a single common ‘currency’. The
introduction of ABC at this point also aids further understanding of the relationship
between productivity, cost and quality within the system, by providing a structured,
traceable account of all product related costs. Any areas of expenditure that are
incurred by non-value adding activities will be highlighted in the simulation model, so
that they may be reviewed and minimised through lean techniques.
In addition to the ABC data, but not used as an inherent part of the simulation, the
Value Velocity (Botha, n.d.) index is used as an indicator of “the rate at which value is
added” throughout the supply chain. This is seen as a valuable indicator of performance
throughout the value stream. The value velocity index is calculated by:
Value Velocity = $K/Day
Eqn. 3.1
Where:
$ = Net income before tax, or profit made.
Day = Inventory days (the average inventory value is averaged over the time period
considered). According to Botha (n.d.), 360 days is typically used for this calculation.
The value velocity measure at this stage is used as a feedback mechanism to the system,
so that the improvement team and wider organisation can see how efficient the supply

123
chain is as a whole. It is perceived to be a valuable leadership tool, providing a
common focus for the supply chain, and therefore strategic vision can also be linked to
this indicator.
Being both a management and data driven costing system, BSC lends itself to such a
methodology, providing key business process strategic data, while ABC is used to
identify indirect and direct costs associated with production, so that an economic break
even point can be drawn upon. When combined with the value velocity index, these
tools can indicate long term strategic direction, which in turn leads to a stronger market
position compared to the competition. ABC lends itself to the continuous process
industry, as errors within a continuous process environment are extremely expensive,
and ABC addresses this through complete traceability of its actions. The Value
Velocity index is used as an indication of supply chain performance and its practical
usage, by benchmarking the amount of profit per day experienced at any point in the
supply chain.
Both of the included costing tools are used to highlight the economic advantages of
change to the various hierarchical levels of management, whose participation provides
the keystone to any such successful program of change, and also presents the long term
strategic needs of the organisation, especially when dealing with the many factions
included in complicated supply chain structures. The methodology has the potential to
fulfil the need for strategic alignment of the many differing interests encountered when
considering total supply chains, and also unify the direction of every node within the
respective chain through its correct use. This is achieved through the use of multi-
disciplinary data, which represents all facets of the supply chain business and

124
operations, such as demand, process times, variation and business data. Statistical
Process Control (SPC) is introduced at this stage as a data driven technique that controls
the variation within any process highlighted as having an incapable process in the
enhanced VSM. More data is recorded at this point, so that analysis can be carried out
in the next stage of the framework.
The SPC used in this third stage is a development of the culture nurturing first and
second stages of the SCIMPI framework. The issue of variation at key processes
necessary to achieve the future state within the system is explored in more detail, so that
team members, and eventually the organisation as a whole gain a deeper knowledge of
how the interactions and value/non-value adding activities influence the behaviour of
the system. The use of SPC encourages the team to observe the behaviour of key
processes within the system through a scientific lens, and should be used to focus
investigation on any anomalies present. It is important that SPC is used as a means for
measurement and feedback within the system. This stage represents the beginning of a
transition from Foundation Knowledge to that of Dynamic Knowledge as seen in Figure
3.5.
Once the Foundation Knowledge has been achieved, the move to Dynamic Knowledge
is formed through the implementation of lean and six sigma techniques, focussed by the
feedback to the system. The Dynamic Knowledge sub group represents a shift to the
application of improvement techniques and the cultural aspects of improvement as a
consequence of these improvements being made.

125
Stage 4
At the Analysis stage of the approach, the current state simulation model developed in
the Measure stage is used, along with SPC techniques to analyse the highlighted
process(es). Here, variation is addressed, as well as information and product flow. Any
anomaly is refined to an optimum situation within the simulation model, allowing off-
line flexibility to the analysis, causing the minimal disturbance to the real system. The
mapping and analysis of variation through the use of SPC techniques will lead to
identifying opportunities for improvement on two levels. First of all, the causes of
variation at a process level will be identified for consideration.
Continuing the SPC from the previous stage of the SCIMPI framework, it is through
this analysis that team members develop a deep understanding of the processes and
behaviour of the system. The people (improvement team, and subsequently the
organisation) are brought together encouraging a cultural development of hard and soft
systems developing and evolving as they interact together. This is also underpinned
through the use of lean thinking and six sigma techniques. It is from this point that the
team start questioning the information flow in more detail, and how the behaviour of the
system reacts to changes influenced upon it. Reflection and feedback from these
behavioural changes of the process is used to guide the next stage of the framework.
Secondly, behaviours that cause variation within the supply chain will also be identified
for consideration. In this way, SCIMPI aims to use a hard systems approach as a driver
for the change in soft systems elements of a system. For example, if a delivery time is
fluctuating over a period of time, after plotting the data and analysing the reasons

126
behind those fluctuations, common reasons will keep occurring for those fluctuations
over a period of time. These regularly occurring causes of variation can then be used to
drive change in the way the deliveries are approached.
Simulation modelling is also used to explore the relationship with productivity; quality
and cost, while considering sources of variation that are demonstrated within the model.
The simulation model should also be used to explore possible improvements to the
system, and their effect on the variation and interactions. Led by the improvement
team, these future-state scenarios must be discussed and fully understood, with any
possible implications explored so as to provide feedback for potential improvements to
be made.
In summary, stage 4 of the SCIMPI methodology represents a full transition from
Foundation Knowledge to Dynamic Knowledge for the team (and subsequently the
organisation). It is at this point that the knowledge from the deep understanding of the
system obtained in the first three stages of the SCIMPI methodology.
Stage 5
The Improve stage guides the implementation team brought together in the Lead and
Learn stage to apply the key tools for the improvement of the system. Building on the
reflection and feedback encouraged in the previous stages of the SCIMPI framework,
stage 5 drives the influence and manipulation of the information and product flow
within the system, with a view to increasing the amount of value adding activities in
accordance with the feedback received in the previous stages. These high impact tools
127
are 5S, also known as Good-Housekeeping, Single Minute Exchange of Die (SMED),
Total Productive Maintenance (TPM), and Design of Experiments (DOE). 5S (which is
covered in stage 1) is used in this case to make everything in the facility standardised
and in the right place, at the right time. It is seen as a key driver for cultural change and
gaining the buy-in necessary from employees, effectively being the catalyst for the
Dynamic Knowledge sub-group.
Due to the very nature of the processes within continuous process industries (that is,
extremely expensive to be off-line) SMED is used to optimise the changeover routine,
so that down-time is minimised. TPM is also used to target any possible downtime by
providing reliable machinery and/or processes, which underpins the efforts made in
obtaining a lean facility. Leading on from this, soft computing techniques (i.e. neural
networks) are applied to any highlighted process (on-line or off-line using the
simulation model, as appropriate), so that the optimum results can be realised for that
given process.
The use of soft computing techniques for improvement is seen by the author to be of
particular importance within the process industry environment. In general, due to the
nature of the industry, techniques such as Design of Experiments (DOE) (an important
aspect of the six sigma approach) are difficult to implement in practice unless it can be
used in a safe operating window (often not the case). This is because of the inherent
constraints (i.e. heavy, expensive machinery may be involved, inflexible processes may
be under consideration, extremely fast or extremely slow cycle times etc.) , so the
system cannot be disturbed. Soft computing techniques do not need a structured
methodology and therefore it is not necessary to run a series of structured experiments,

128
which need specific machine settings, and interfere with the online performance of the
machine. When using neural networks for example, changes in process outputs are
apparent within historical data obtained from the processes, which cannot be done using
DOE. With DOE, specific settings are required, and therefore it is necessary at some
point to go “online” and actually test machine settings, therefore interfering with the
process.
Stage 6
The Control stage is where standardised work is introduced (configured from the
feedback from stage 5), so that the improved procedures and processes that have been
developed in the previous stages are not lost, and any newcomer to the system has a
record of how tasks should be approached to fulfil their potential. In this way, the
knowledge and awareness developed in the two sub groups (Dynamic and Foundation)
is used to influence the information flow to best drive the system. A future state
simulation model will have been developed within the Analysis stage, which is
maintained at this point so that demonstrations can be provided for each process, as well
as a dynamic illustration of the system. Customer focus should be emphasised
throughout the SCIMPI approach, but is mentioned at this stage, because customer
demands on quality and so on are constantly changing. These changes need to become
the driving point for future change. The cultural dynamics of the system/project team
should be at an advanced stage, and well on the way to becoming an environment of
continuous improvement, value creation and customer focus.
129
Stage 6 represents a fully fledged transition to the Dynamic Knowledge stage of the
generic framework in Figure 3.5. It is at this point in the journey that the value creation,
cultural development and feedback are evolving as the system evolves; creating a
flexible, learning environment that responds quickly and effectively to any processual or
cultural changes brought about by improvements made to the system.
Stage 7
The final stage of the SCIMPI approach, Enterprise, depicts the expansion of the
previous stages towards customers and suppliers. Stage 7 also represents the final stage
of the Dynamic Knowledge period represented in Figure 3.5, and is the first stage which
considers engaging the rest of the organisation and subsequently other partners in the
supply chain. It is at this point that the improvement team have established the
Foundation Knowledge of the organisation/supply chain, and have used this
underpinning to leverage the appropriate tools and techniques to create value, while
configuring the information flow around this value creation. This happens in parallel
with the team itself being guided through a micro cultural change as a group, but more
strategically, influencing and guiding the transition of the whole system to one of
continuous improvement, through the application of the SCIMPI methodology.
At this point, relationships need to be started with key suppliers, with a view to
extending the SCIMPI approach throughout the supply chain. It is suggested that key
personnel from the team brought together for the project in stage 1 should become
champions in stage 7. These champions can then lead future collaborative improvement
efforts in their own organisations, as well as downstream to their suppliers, continuing

130
the journey of continuous improvement. In this way, it can be demonstrated to the new
teams by employees who have had experience and success using this model, and go on
instigate cultural change, as it is often difficult for management to get this message
across effectively.
Being continuous in nature, the Supply Chain Improvement Methodology is only the
start of any continuous improvement implementation. When new SCIMPI teams are
nurtured in Stage 7, taking the approach to their own facilities, the process of analysis
starts again within the starting organisation and hence forth, the supply chain in
question will embark on a dynamic journey of change that will transform the way in
which process industry supply chains integrate, resulting in flexible, competitive supply
chains, with the ability to compete in any given market.
Drawing on the necessary elements for continuous improvement suggested in the
generic framework of Figure 3.5, the proposed SCIMPI methodology leads the
organisation through five key phases on the path to continuous improvement. This
pathway is outlined in Figure 3.8 below.
Taking a holistic view of the SCIMPI methodology, the first phase of the journey is to
understand the current state of operations. Once this Foundation Knowledge has been
achieved, the next stage of the journey is to identify areas or opportunities for
improvement through the application of lean principles.
The third phase of the journey is the application of six sigma techniques to the areas
identified in the previous phase. From this, a move to the future state can be made
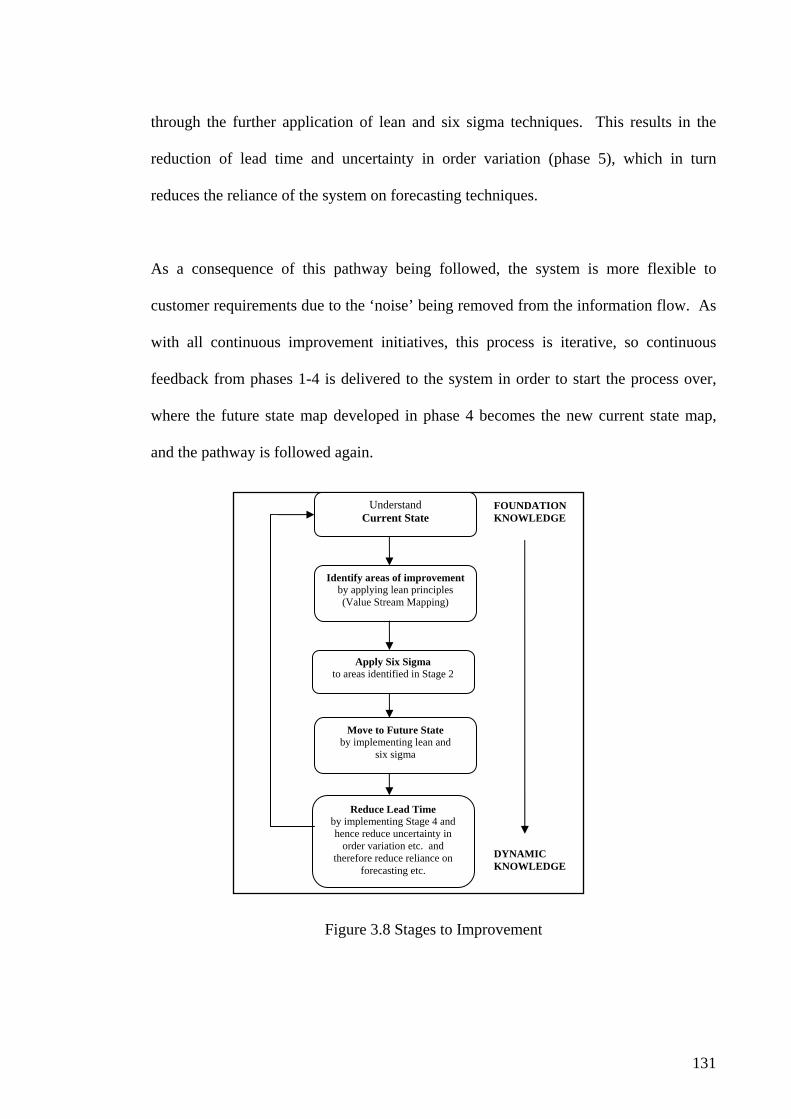
131
Identify areas of improvement by applying lean principles (Value Stream Mapping)
Apply Six Sigma to areas identified in Stage 2
Move to Future State by implementing lean and
six sigma
Reduce Lead Time by implementing Stage 4 and hence reduce uncertainty in
order variation etc. and therefore reduce reliance on
forecasting etc.
Understand Current State
FOUNDATION KNOWLEDGE
DYNAMIC KNOWLEDGE
through the further application of lean and six sigma techniques. This results in the
reduction of lead time and uncertainty in order variation (phase 5), which in turn
reduces the reliance of the system on forecasting techniques.
As a consequence of this pathway being followed, the system is more flexible to
customer requirements due to the ‘noise’ being removed from the information flow. As
with all continuous improvement initiatives, this process is iterative, so continuous
feedback from phases 1-4 is delivered to the system in order to start the process over,
where the future state map developed in phase 4 becomes the new current state map,
and the pathway is followed again.
Figure 3.8 Stages to Improvement

132
The techniques brought together in the formation of the SCIMPI approach have been
chosen in an attempt to provide a comprehensive and focussed analysis tool for
members of the process industry wishing to improve their competitive stance within
their respective industries, and realise the potential of becoming competitive on a supply
chain scale.
The SCIMPI methodology attempts to increase the scope of mapping and analysis, and
target the four key areas of Mapping, Business, Improvement and Variation using
specific tools and techniques. Figure 3.9 in section 3.4 of this chapter depicts the four
key areas addressed, and illustrates the relationships between these and the techniques
used within the SCIMPI model.
3.4 Scope of Implementation
As can be seen in Figure 3.9, the largest concentration of techniques is used to address
the Mapping and Business sections of the SCIMPI model. Value Stream Mapping is
often applied to a manufacturing system on its own, under the misconception that a full
journey of lean continuous improvement has been carried out. VSM is of course a
useful and powerful tool in its own right, but using it in isolation will not achieve a fully
lean organisation. A whole strategic philosophy throughout the supply chain is required
in order for a system to be running at a truly lean level.
In addition to this, while the VSM tool itself does have an impact on variation, achieved
by reducing the complexity of the system and thereby reducing the interactions and

133
variation within it, not all variation is addressed. Lean reduces interaction variation but
not quality variation. When considering a current state VSM, there is also no feedback
indicative of the costs involved at each process. To achieve this, VSM needs to be used
in conjunction with other tools as proposed in stage 2 of the methodology. This view
looks beyond VSM as giving a quick, succinct overview of where waste is present, and
develops the idea of the mapping process itself becoming a continuous tool, constantly
being updated by simulation models. In other words, simulation provides a roadmap for
an evolutionary and dynamic implementation. In this case, VSM underpins the whole
strategy, using the additional data supplied through the addition of the Balanced
Scorecard and Activity Based Costing techniques. Used in conjunction with 5S, a
foundation is made for the Business case to be improved in the subsequent SCIMPI
stages.
Three key lean tools have been used to target process improvement and reliability, and
also have a bearing on the business case itself, by providing a system which is more
flexible to customer demands and changes downstream.
Finally, simulation and six sigma techniques address the variation within highlighted
processes through the construction of control charts, as well as providing a dynamic
vision to the mapping phase. Although simulation could be seen to address the Business
and Improvement case of an organisation or supply chain, this is only the case when
costing techniques etc are applied to the current state model itself. That is, without the
use of artificial intelligence and so on, simulation relies on the input of the user in order
to model the future state – it will not provide a solution of its own accord. SCIMPI
brings together the four key areas necessary for a comprehensive approach to make

134
significant changes and explore opportunities for improvement on all levels, as well as
providing a starting point for an organisation wanting to embark on a journey of
continuous improvement. The enhanced six sigma stages of the proposed framework
(Lead and Learn, Define, Measure, Analyse, Improve, Control and Enterprise) are used
to underpin the approach, providing focus and direction for all involved– a necessity for
any initiative.
Before using simulation software, it is important that the benefits and drawbacks are
understood by the implementation team (as mentioned in section 3.3). Due to the
expense, lack of training in a simulation software, or scope of the project, a simulation
approach may not be justifiable for every project. A series of questions need to be
addressed before the implementation team consider whether or not a simulation model
of the project in question will yield beneficial results that really add value to the
improvement initiative. The SCIMPI methodology suggests using simulation and/or the
VSM approach at the discretion of the organisation, following reasons in section 3.3 for
their choice.
Figure 3.9 Scope of SCIMPI Approach
MAPPING BUSINESS
VARIATION IMPROVEMENT
VSMBSC ABC
5S
5S, SMED, TPM SIM, σ6
σ6
135
However different process industry environments are to discrete process organisations,
the same implementation issues still exist and must be managed correctly – namely the
SCIMPI approach needs to have the backing of everyone from the top management
down within the organisation.
By providing this methodology, the arduous and time consuming task of management
looking at various improvement philosophies, tools and techniques (which may lead to
their commitment being spread too thinly) is reduced. When confronted with a number
of tools and techniques, it is easy to attempt implementation efforts for a few of them,
and see if they happen to work. Unsure of which techniques to follow, inappropriate
efforts may be made, leading to high resource usage only to obtain small incremental
improvements, meaning that economic justification of such tools makes it an unviable
approach.

136
3.5 Existing Lean Six Sigma Frameworks
Table 3.2 shows the strengths and weaknesses of existing lean six sigma models .
Table 3.2 Strengths and Weaknesses of Existing Lean Six Sigma Frameworks
Strengths Weaknesses
Existing Lean Six Sigma
Models
• Value Stream
Mapping
• DMAIC
• Costing
• Complexity
• Roadmap
• Underpinning
• Exhaustion
Existing frameworks available for lean six sigma are available from a number of
consultancy companies (examples being those on offer from companies such as Segla,
and CBIA Training and Consulting). All of these frameworks have two main strengths.
The first one being that the DMAIC progression is used to underpin the main body of
the approach. The second is that the VSM technique is used in the first stage of the
framework to map the operations, providing a comprehensive means to gaining a quick
understanding of the scope and operations of a system. However, there are a number of
weaknesses within these frameworks. The first is an unclear understanding of what
environment or application the frameworks are intended for.

137
Existing frameworks are designed to be generic in nature, and they comprise a vast
number and range of tools and techniques of both a relatively straight forward, and
more complex statistical nature. The frameworks present to the user a complex
gathering of lean and statistical tools, with no particular roadmap identified, in an
attempt to cover ‘every base’, and does not provide a scientific methodology for the
application of these tools. Although this lets the user know what range of tools there
are available to use in a lean six sigma toolbox, it is easy to get overwhelmed by the
presence of so many tools without a scientific methodology to guide the
implementation. This may also result in a ‘scatter gun’ approach, whereby a number of
tools are used, in the hope that one of them may solve a particular problem.
Faced with such choice, management may well find themselves with ‘project
exhaustion’, where people and all other resources are taken to their limit in an attempt to
progress with a larger number of projects, instead of focussing on a single and effective
implementation and analyses. There is also a lack of costing information within such
frameworks, which could replace some of the more specialised tools put forward in
such frameworks, so that the project improvement team will focus on relevant data and
strategy, without becoming saturated in complex matrices or statistics, taking away
focus from the opportunities at hand.
The proposed framework put forward in section 3.3 of this chapter aims to fill in some
of the gaps not addressed by such consultancy models, and provide a roadmap for users.
Firstly, the SCIMPI framework has been constructed with special consideration and
focus on the process industries. Therefore clarity has been provided in terms of tools
and techniques that need to be selected, providing appropriate targets and an accessible

138
roadmap for lean six sigma continuous improvements. The negative effects of cherry-
picking (as discussed in chapter 2) are also minimised. Being aimed at a specific
industry, the framework attempts to make lean six sigma activities both phase and
situation dependent.
In terms of culture in the context of change, the SCIMPI framework aims to engage the
team members throughout the project duration. Three key criteria are addressed in an
attempt to bring about and measure of positive cultural change along with the initiative.
These are:
1) Setting the scene.
2) Measurement of before and after scenarios.
3) Hard systems to drive soft systems thinking.
The first of these is setting the scene whereby the current state environment is mapped
and analysed. This current state situation, when reviewed against the environment post
the improvements, i.e. the before and after will identify if the notion that when faced
with positive results, the employees respond positively to positive change results. The
last important point here is that by providing measurable change (through tools such as
SPC, value velocity and ABC), changes in the soft systems will be focussed by hard
data. In other words, the framework is using hard systems to drive soft systems
thinking. The tools and techniques at each stage of the framework aim to develop and
nurture a change in the culture of the team eventually leading to a company wide shift.
In this way the framework becomes sustainable through commitment from the people
who drive it and operate within it. This is explored in more detail in section 3.6.1 of

139
this chapter, where the SCIMPI model is discussed in context with Soft Systems
Methodology and the Sustainable High Performance Culture Model (SHPCM).
A diagram (Figure 3.11) in section 3.6.2 goes on to summarise how SCIMPI addresses
the stages of Soft Systems Methodology (SSM), and also addresses the gaps identified
in the SHPCM.
The proposed SCIMPI framework is also designed to provide a more manageable and
less overwhelming lean six sigma for the process industries. The author believes that
usability is a prime factor in the effectiveness of any continuous improvement approach,
and this is achieved through maintaining an equitable balance between complexity and
sustainability. A succinct and simplified roadmap is presented, providing a high impact
methodology by way of a project management tool, constructed to address the limited
time and resources available to practitioners.
The next section of this chapter goes onto discuss such a framework that attempts to
bring together both approaches in a succinct and easy to follow methodology that is
designed to have maximum benefit when applied to continuous process industry
applications.
3.6 Aligning SCIMPI with Soft Systems and Sustainability
When applying continuous improvement techniques, productivity, quality and cost
cannot be considered in isolation. There needs to be a complete and open systems view
of the organisation and how actions affect different parts of that system. The SCIMPI
framework aims to bring about this cultural systems view, by tracking each of the seven
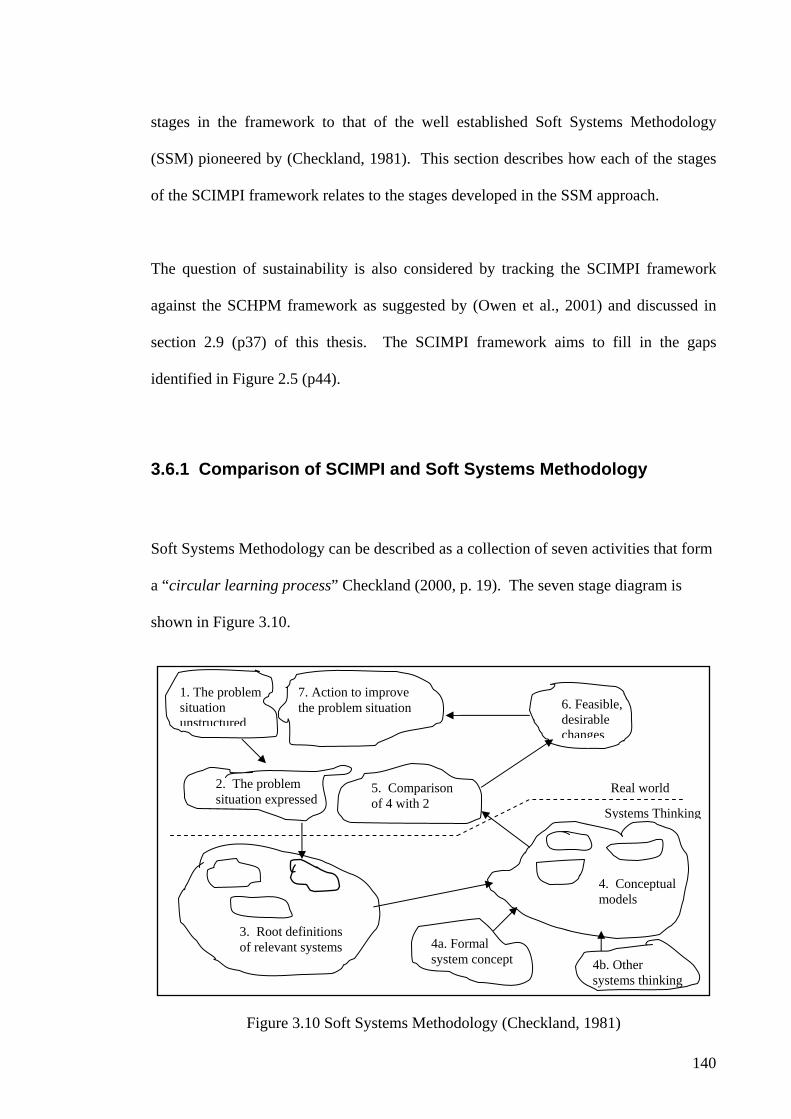
140
stages in the framework to that of the well established Soft Systems Methodology
(SSM) pioneered by (Checkland, 1981). This section describes how each of the stages
of the SCIMPI framework relates to the stages developed in the SSM approach.
The question of sustainability is also considered by tracking the SCIMPI framework
against the SCHPM framework as suggested by (Owen et al., 2001) and discussed in
section 2.9 (p37) of this thesis. The SCIMPI framework aims to fill in the gaps
identified in Figure 2.5 (p44).
3.6.1 Comparison of SCIMPI and Soft Systems Methodology
Soft Systems Methodology can be described as a collection of seven activities that form
a “circular learning process” Checkland (2000, p. 19). The seven stage diagram is
shown in Figure 3.10.
Figure 3.10 Soft Systems Methodology (Checkland, 1981)
Real world
1. The problem situation unstructured
7. Action to improve the problem situation 6. Feasible,
desirable changes
2. The problem situation expressed
5. Comparison of 4 with 2
3. Root definitions of relevant systems
4. Conceptual models
4a. Formal system concept
Systems Thinking
4b. Other systems thinking

141
The first two stages of SSM are concerned with building a “rich picture” of the situation
in which there is a problem. The first stage of the SCIMPI model (Lead and Learn) is
used to create this picture through the training of employees, centred on the scope of the
project – discussing the current operating environment and placing everything in
context for the next stage. The second stage of SCIMPI (Define) uses an enhanced
VSM approach, which provides all team members with an appreciation of the size and
the scope of the project. The environment in which problems are thought to be in is
captured in the VSM, while certain data is present, such as cost and variation provide
more context to the situation, giving a slightly more in depth understanding of the whole
system. The use of Balanced Scorecard criteria in this phase, providing a more strategic
view of the project and also augments the picture created by the team. Once the second
stage of SCIMPI has been achieved, the first two steps of the SMM have been covered,
so that the problem situation and environment surrounding it has been captured, while
the problem situation has been expressed through the addition of data and strategic
indicators such as objectives, measures and vision. This follows Checkland’s guidelines
of “forming a view of how structure and process relate to each other within the
situation being investigated” (Checkland, 1981, p. 164).
The ‘Define” stage of the proposed methodology also fulfils the third step in the SSM,
whereby the root definitions of the relevant systems are recorded. The relevant systems
are highlighted in the VSM, and can be spotted easily, as value stream maps provide
almost a photograph of the current system. Any areas for improvement are highlighted
in conjunction with the general data surrounding them as discussed previously. Again,
the inclusion of the balanced scorecard indicators of objectives, measures, targets and

142
initiatives are included to shape the nature of the systems to be considered. In addition
to this, the more focussed data collected in the Measure stage of SCIMPI also goes
toward shaping the nature of the problem, as a more refined picture of the system can be
seen, as more information is gathered. Statistical Process Control (SPC) techniques
form an important part of this measuring stage, so that the behaviour of the system, in
terms of variation and control can be considered and understood. In this way, a
complete understanding of how the system works, along with the problem area and
processes/people involved can be drawn from the enhanced VSM and the ensuing
discussion of the results. It is essential that after each stage of SCIMPI has been
achieved, team members meet and reflect upon the results obtained so far. Therefore,
any anomalies or questions can be raised and answered by the group.
Stage four of SSM states that conceptual models are to be constructed of the human
activity systems which are named and defined in step three. The root causes in step
three are used to describe the human set of activities that can be thought of as a
transformation process. This is answered by stages three and four of the SCIMPI
methodology, which uses the data previously obtained in the first three stages, along
with simulation modelling, to provide a view of the state of the system as it stands,
enabling the team to explore the interactions between each element within the system,
and how the system is affected by changes to these elements. Along with the VSM, a
conceptual model of interactions and what the system must become, or operate as, is
developed with the simulation environment. As a result, the team members are
presented with both a strategic view of the system as well as a dynamic interpretation of
activities. The information gathered from SPC techniques at this point will also provide
some direction for the model. This is done through the behaviour of specific points

143
within the system being traced by the SPC analysis, which can then aid in the formation
of a desired state operating model in the simulation environment. As mentioned
previously in this chapter, this use of ‘hard’ systems to drive ‘soft’ systems is seen as a
strong addition to the framework, especially when considering the whole supply chain
structure. From these approaches, the system can be described on a number of different
levels, both operational and strategic, while also considering the cultural state and
desired changes to that culture that are necessary for sustained improvement.
From here, SSM suggests that the conceptual model should now be compared with the
actual system. This is so that the conceptual model may be analysed closely with the
issues identified in step two of SSM. Once the simulation model has been established
as an accurate representation of the system, and possible future state scenarios have
been modelled, the team must compare these models with the current state situation, and
all possible changes to be made discussed with reference to the current and proposed
state models. Stage five within the SCIMPI model builds on this reflective step,
because as each improvement technique is considered, it must be discussed in context to
the real system. Through this, each technique should be discussed with reference to the
particular issues identified, and the team must be encouraged to take a holistic view of
the effects of any improvement. Soft computing techniques, as used in this stage of
SCIMPI provide a platform for observing how the system interacts and behaves
according to controlled input factors. In this way, more detailed possible changes in the
system may be considered.
To complete the needs of step five in SSM, the control stage of SCIMPI guides the
implementation team to consider both the current and conceptual states through the

144
creation of standardised working practices. In order to structure these standard
approaches for the system, it is necessary to consider the existing system/environment,
along with the conceptual model, so that the desired state is maintained. Through this
process, areas of the conceptual model may be identified as inappropriate, and therefore
changed as required. However, before this happens, the revised conceptual model
should be simulated, and compared to the current state, so that its applicability can be
discussed. Customer focus is also essential to this reflective step in SSM. By
maintaining customer focus and reminding ourselves of its importance when
implementing standard work (which will have considerable bearing on how the system
ultimately operates). The comparison between current state and proposed system
models must be viewed from the customer’s perspective, and constantly reviewed with
this vision in mind, being careful to consider the implications to the customer resulting
from any changes to the system environment. Discussion around these points must be
encouraged in order to maintain the best possible results from the group.
The discussion of possible or feasible changes to be made to the system (as pursued in
step six of SSM), is addressed through a number of stages in the SCIMPI model. It is
first approached in the lead and learn stage, as this is where the context and scope is
discussed with the team, and they are focussed on what type of improvements are
feasible within the project environment. However, the most focus given to this is
during the ‘Analyse’ and ‘Improve’ stages of SCIMPI. Both stages are focussed on
creating possible solutions that are feasible within the system being considered. It
should be noted that the an inherent part of the SSM approach is to ensure the
sustainability of any action taken to improve the system.
145
3.6.2 Comparison of SCIMPI and the Sustainable High Performance
Culture Model
Figure 3.11 presents a summary of the mapping between SSM, SCIMPI and SHPCM,
providing a graphical representation of sections 3.6.1-3.6.2. The shift in cultural change
from management push to employee pull, as proposed in the work of Shiba and Walden
(2001) is also included to illustrate the shift in thinking as a SCIMPI approach is
progressed. Each numbered square represents a stage within the respective
methodology, while the arrows joining the squares represent the links between the
stages of the three approaches.

146
Figure 3.11 SSM, SCIMPI and SHPCM Interactions
1
2
3
4
5
7
6
1
2
3
4
5
7
6
1
2
3
4
5
7
6
Soft Systems Methodology
SCIMPI Sustainable High Performance Culture
Model
Mgmt push
Employee pull

147
3.7 Discussion
As mentioned previously, improvement initiatives often fail due to management
commitment, cultural change, or the uncertainty brought about though the cherry-
picking approach of tools and techniques, or the shear complexity of the
tools/techniques experienced when using any one approach in depth. The author is
taking this position in developing the SCIMPI model, i.e. achieving a balance between
complexity and sustainability. As seen in Figure 3.12 it is believed that SCIMPI
provides an equitable balance between sustainability and complexity, which is
achievable and realistic in a project time frame, and so has high impact when applied.
This is achieved through the use of specific, high impact tools geared towards having
maximum benefit within the process industry.
Figure 3.12 Sustainability vs. Complexity
Low
High
Low Sustainability
Complexity
High

148
In summary, it is proposed that the SCIMPI model has the following contributions to
the body of research in the field of lean six sigma. Firstly, this is the first time that a
unified methodology incorporating lean philosophy and six sigma has been developed
for the process industry, while it is also the first methodology developed that provides a
sustainable, high impact approach to lean six sigma. Implementation efforts are not
sustainable; due to the fact they are based on a cherry-picking approach, or too
complicated for a comprehensive implementation plan to be followed. While techniques
such as “Learning to See” as developed by Rother and Shook (1999) provide an
excellent, quick and succinct way to identify and manage waste within a system, it also
has some limitations, as there are a number of key criteria that may be included in the
improvement approach, such as variation and cost indicators that could be used for
more comprehensive analysis and decision making.
The Value Stream Mapping technique has been modified to provide a more
comprehensive and focussed tool deemed more appropriate for the process industry. No
other approach has used the VSM technique as a platform in conjunction with other
tools to provide a more comprehensive technique, incorporating costing and process
capability.
Inherent in the roadmap for operational and strategic level improvement of an
organisation, the SCIMPI model provides a model for growth, considering the business
case as well as the usual operational focus by incorporating key business issues within
the methodology, while cultural issues are also addressed. The challenge of
sustainability is also considered by developing the model with reference to the SHPCM
model of (Owen et al., 2001).

149
Finally, the SCIMPI lean six sigma framework provides a more strategic level view of
the organisation, preventing businesses getting overwhelmed in complex detail through
the use of one specific tool.
3.8 Summary
In this chapter, an integrated lean six sigma methodology (the SCIMPI model) is
proposed, derived from an original generic framework for continuous improvement.
The generic framework has been formed from the fundamental elements critical to an
improvement initiative, bringing together the knowledge based attributes in a
Foundation Knowledge sub group, and the practical application of this foundation in a
Dynamic Knowledge sub group.
The next chapter goes on to discuss a preliminary application of the SCIMPI model
within a process industry environment, a lead refinery in Europe. The case study is
designed as an exploratory implementation of SCIMPI before more detailed case studies
are discussed.
The first case study (chapter 4) presents a straight forward application of the SCIMPI
methodology, exploring it’s feasibility within a process environment, using simulation
as the main technique for analysis. The second case study (chapter 5) highlights the use
of lean techniques to leverage the application of statistical tools and soft computing
techniques. The final case study (chapter 6) extends the application of the SCIMPI
methodology to a larger scale improvement project, the scope of which covers the
internal supply chain of Australia’s leading producers of steel.
150
4.0 Case Study 1 Preliminary Testing of SCIMPI Model
This chapter withheld and may only be viewed or copied with the permission of the author or supervisor.

169
5.0 Case Study 2 Newsprint Manufacture Supply Chain
This chapter withheld and may only be viewed or copied with the permission of the author or supervisor.

217
6.0 Case Study 3 Steel Manufacture Supply Chain This chapter withheld and may only be viewed or copied with the permission of the author or
supervisor.

269
7.0 Conclusions
The purpose of this research centred around three objectives. The first concerned the
review of literature surrounding the success and limited success of the lean
manufacturing philosophy, the evolution of six sigma, and the characteristics of change.
The literature reviewed has explored these areas and from this, identified critical
elements for sustainable continuous improvement efforts.
Building on this, the second objective was the creation of a generic framework for
continuous improvement. Using the critical elements identified from the literature
review as a platform, a generic framework was created, identifying two key stages of
knowledge development in an organisation’s transition to continuous improvement.
Bringing together the knowledge based attributes in a Foundation Knowledge sub
group, and the practical application of this foundation in a Dynamic Knowledge sub
group, the framework promotes the deep understanding necessary for sustainable
continuous improvement. This proposed generic framework has then been used to
derive a lean six sigma methodology specifically for the process industry sector, the
SCIMPI methodology.
The third objective concerned testing the efficacy of the SCIMPI methodology through
its application to three case studies based in different process industry sectors. The
proposed Supply Chain Improvement Methodology for Process Industries (SCIMPI
methodology), has been successfully tested in three case studies that were designed to
highlight different elements of the SCIMPI framework. The first two case studies were
developed in the UK, while the third case study was based in Australia.
270
The first case study presented a straight forward, exploratory application of the SCIMPI
methodology within a process industry environment, using simulation as the main
technique for analysis. This case study demonstrated that continuous improvement
techniques were well suited to the batch-flow process industry and simulation
modelling.
The second case study was designed to test the statistical and soft computing techniques
that form part of the SCIMPI methodology, and their applicability in a high technology
process industry environment. It should be noted that although techniques such as
simulation or neural networks are not considered by everybody to be “shop-floor”
techniques, they form an important part of the SCIMPI framework. The proposed
framework is designed to provide long term strategic change, and is not intended to be
taken as an “off-the-shelf” solution by all business. Long term strategic investment is
necessary to effectively implement the SCIMPI framework, and realise the gains of a
comprehensive approach to improvement. The organisations participating in this
research were all familiar with these techniques and had access to a number of different
simulation packages, with dedicated research and development departments, which may
be beyond the reach of smaller facilities. In the future, it may possible for smaller sized
companies to purchase an “off-the-shelf” improvement package designed around the
SCIMPI framework with the necessary software built into its functionality.
The effectiveness of the SCIMPI methodology as a lean six sigma framework for the
process industry has been demonstrated through the identification of opportunities for
improvement that had been overlooked by previous efforts. When following the

271
SCIMPI methodology in this case study, the non-independence of controlled data was
highlighted, something of particular relevance and concern in the process industry
sector. This has led to a different quality management approach being suggested to the
organisation. As a result of this, hard systems techniques have been used to drive a soft
systems approach required to deal with quality management issues. This integrative
view of hard and soft systems is seen as a critical path towards sustainability of
improvement initiatives.
The final case study was designed to extend the application of the SCIMPI methodology
to a larger scale initiative, which considered the internal supply chain operations of
Australia’s leading steel producer. Taking a top-level, rather than operational view of
the organisation, the application of the SCIMPI methodology proved successful,
overcoming the legacy left behind from previous improvement efforts.
The issue of mistaking common cause variation for special cause variation was
highlighted, resulting in a number of improvement stages to minimise the ‘tampering’
effect while a strategy for the re-design of the system is discussed by management. The
work brought forward through the SCIMPI methodology is expected to be sustained in
the organisation, and following this case study, the initiative is being pursued with an
internal customer of the supply chain.
On an operational level, the case studies shared similar characteristics and opportunities
for improvement. However, on a cultural level, it can be said that the Australian based
organisation is faced with different challenges to the UK based companies.
Importantly, AB Steel experiences greater influence from union bodies. It is expected

272
that they will be involved in any continuous improvement process that affects working
practices for the employee. This places certain constraints at the planning stage, for
example, increased time and resources for employee consultation and perhaps a
negative influence on the employees’ perception of the improvement process.
Building on the findings of this thesis, a number of observations can be made in
conclusion. The first, is that much of the inherent mistrust surrounding lean as a
philosophy is due to the limited and myopic way that it has been implemented. For
example, reducing inventory levels cannot be enforced in volatile environments, usually
leading to even greater variability and exposure to risk. Therefore, a systematic
approach needs to be adopted which optimises the whole system and focuses the right
strategies in the correct places.
It is important to recognise that lean has moved away from being a one-stop cure all
philosophy. Instead, lean six sigma should be seen as the platform for the initiation of
cultural and operational change, leading to total supply chain transformation. In other
words, it forms a small but important piece of the jigsaw. When used in combination
with other complimentary continuous improvement techniques such as six sigma, lean
provides leverage for comprehensive strategies and therefore provides a more
integrated, coherent and holistic approach to continuous improvement. Lean must be
viewed, understood, and accepted as a coherent methodology and therefore a step
beyond previous ad hoc continuous improvement strategies.
When combined in a scientifically underpinned framework such as the one resented in
this thesis, lean and six sigma offer organisations a comprehensive approach to

273
identifying and managing opportunities for improvement. The lean approach provides
direction and scope for improvement projects, reducing complexity and interactions by
targeting non value adding activities identified through the value stream mapping
technique, which can then be used to identify key leverage points to be targeted through
six sigma tools (Refer to section 3.3, pages 103 & 106).
Lean six sigma should be seen as a precursor to producing more responsive supply
chains through effective communication leading to strategic alliances and visibility.
Organisations will need to be as lean as possible, providing clarity for the
implementation of six sigma techniques, moving forward to additional concepts such as
agility and total supply chain integration. This is not to say that every element of the
lean philosophy or six sigma approach should be adhered to, as not every lean tool or
technique is suitable for every situation or company. What this does mean, is that it is
critical for management and the wider organisation to achieve the understanding
developed in the Foundation and Dynamic Knowledge sub groups of the generic
framework in Figure 3.5 if they want to pursue sustainable, effective, and meaningful
improvements within their business. It is evident from research that both a hard and
soft approach is necessary for a successful implementation, and the correct
synchronisation is critical. The dynamics of the system must be fully understood before
effective internal relationships can be developed and maintained in order to create a
truly efficient and responsive enterprise able to compete with strong global competitors.
Lastly, organisations must be careful not to remain static once the first iteration of a
continuous improvement approach has been completed. If the improvement efforts do
grind to a halt, under the impression that the system has been improved, then the
274
business will enter a rigidity-sustainability paradox (as discussed in section 2.10 of this
thesis), caused by the misunderstanding that the journey is finite. It is the job of the
leader, along with the management within the organisation to ensure that this is clearly
communicated and understood.
The proposed SCIMPI methodology presents a fully integrated lean six sigma
framework, incorporating the critical elements of sustainable continuous improvement
as identified in the generic framework presented in chapter three (Figure 3.5) of this
thesis. The SCIMPI methodology provides operational focus and strategic direction for
improvement teams, with an equitable balance between sustainability and complexity,
in turn avoiding the pitfalls of the cherry-picking approach to improvement techniques.
This is achieved by guiding project teams, and in turn organisations, through two
critical stages of knowledge development, with focussed tools and techniques.
This thesis provides an industry specific lean six sigma methodology, designed using a
solid scientific underpinning, and based on the critical elements of continuous
improvement and the comprehensive integration of lean manufacturing and six sigma
techniques. The addition of soft computing techniques within the proposed lean six
sigma methodology informs management decisions on improvement approaches to be
made; with minimal disturbance to the system. This is of particular importance in the
process industry sector, where particularly large losses are to be experienced if a process
is taken off-line for any amount of time. The process industries examined in this
research signify new scope for exploration of the application of continuous
improvement, in particular, a specialised integration of lean six sigma techniques.

275
7.1 Contributions to Knowledge
In response to the findings of the literature review, a generic framework has been
derived that identifies the key elements that are essential for sustainable continuous
improvement. Resulting from this, two critical stages of knowledge creation in the
journey towards continuous improvement have been identified.
This generic framework, along with the two stages of knowledge development, have
been used as a platform for the creation of an industry specific lean six sigma
framework (The SCIMPI methodology). This is the first time that a unified
methodology, presenting a true integration of the lean philosophy and six sigma
approach, has been developed with a scientific underpinning. This research also
represents the first time that an industry specific lean six sigma methodology has been
developed.
The SCIMPI methodology proposed in this thesis draws together the need of industry
for an improvement approach that addresses the cultural aspects as well as the business
needs of an organisation. The SCIMPI methodology provides a comprehensive and
integrated model for cultural and business cases, as well as a roadmap for the
operational level improvement of an organisation. The business case (as well as the
usual operational focus) is considered through the incorporation of key business issues
within the methodology.

276
7.2 Future Research
The first stage of future research would be to continue the analysis of the SCIMPI
methodology with the aid of a longitudinal case study spanning perhaps four to five
years in length, so that the cultural change and the true sustainability of the approach
may be explored further. The findings from such a case study would provide a valuable
insight into the effectiveness of the SCIMPI methodology as a long term improvement
approach.
In line with the lean vision, the next stage of development for the SCIMPI approach is
the production of clear, concise, visual instructions so that organisations can follow the
methodology and start the implementation of continuous improvement. An aid to this
would be the design of a tailored simulation package as a decision support mechanism,
similar to that of McDonald, Van Aken et al. (2002), but providing focus on the
business case through the integration of the discussed costing models. Leading from
this, virtual environments for teaching the SCIMPI model could be created, following
on from the work of Chi, Pepper et al. (2004).
In order to extend the scope of the SCIMPI model still further, an examination of the
relationships needed for effective supply chain management could be considered,
leading to commentary on the blend of lean and agile techniques needed within the
process industry, and whether the decoupling point would experience a shift due to the
nature of the sector. Steps to incorporate strategic planning and market analysis would
also be beneficial, to provide a broader scope for organisations once they have started
the SCIMPI cycle. This has potential to lead on from the strategic alliance stage, and
277
develop frameworks such as design for lean six sigma, and provide a design for
continuous improvement, or SCIMPI.
A number of potential limitations for the proposed framework that may be addressed in
future research may also be identified. The first opportunity for further research to
come from this is that comprehensive implementation of the framework is perhaps
dependent on the size of the organisation. For example, only larger organisations (such
as those presented in the three case studies) may have access to those tools not
considered “shop-floor” techniques, such as simulation software or neural networks.
However, each organisation participating in this research was either open to the use of
these techniques, or had already purchased sophisticated analysis software, which is
inherent in the SCIMPI framework, such as simulation software.
The sustainability of improvements made through the SCIMPI approach is dependent
upon management commitment and the legacy of previous organisational change. If
this legacy is negative, then this will prove a barrier to any change within the business.
In an attempt to minimise the impact of such a situation, SCIMPI attempts to guide the
team through a structured roadmap of change.
The proposed SCIMPI framework should not be viewed as a “quick-fix” by
organisations. Instead, it must be considered as a plan for strategic change that requires
investment in a number of areas such as simulation software and other soft computing
techniques, and the ongoing training and development of employees. Due to the
multidimensional nature of the SCIMPI framework, incorporating a number of different
tools and techniques that require training and/or previous knowledge or experience,

278
application will need a truly cross-functional team from the participating organisation if
it is to succeed. Such a team should include representatives from production,
management, accounting and human resources in an effort to deliver a complete
perspective of change to the journey of improvement.
Finally, moving away from the SCIMPI model, the generic framework for continuous
improvement (as defined in section 3.2 of this thesis in figure 3.5), should be used as a
scientific underpinning to explore the development of additional industry, or situation
specific lean six sigma frameworks. Using the five stage approach of Map, Strategy,
Centre, Advance and Sustain (as described in section 3.3 of this thesis), appropriate
tools and techniques may be configured to each application or industry.

279
8.0 References
Abdulmalek, F. A. & Rajgopal, J. (2007) Analyzing the benefits of lean
manufacturing and value stream mapping via simulation: A process sector
case study. International Journal of Production Economics, 107, 223-236.
Abdulmalek, F. A., Rajgopal, J. & LaScola Needy, K. (2006) A Classification
Scheme for the Process Industry to Guide the Implementation of Lean.
Engineering Management Journal, 18, 15-20.
Ackoff, R. L. (1999) Ackoff's Best: His Classic Writings on Management, John Wiley
& Sons, Inc.
Ahlstrom, P. (1998) Sequences in the implementation of lean production. European
Management Journal, 16, 327-334.
Ahmad, M., Dhafr, N., Benson, R. & Burgess, B. (2005) Model for establishing
theoretical targets at the shop floor level in speciality chemicals manufacturing
organizations. Robotics and Computer-Integrated Manufacturing, 21, 391-
400.
Alwan, L. C. & Roberts, H. V. (1995) The Problem of Misplaced Control Limits.
Applied Statistics, 44, 269-278.
Anderson, J. (1997) Future directions of R&D in the process industries. Computers in
Industry, 34, 161-172.
Andersson, R., Eriksson, H. & Torstensson, H. (2006) Similarities and differences
between TQM, six sigma and lean. The TQM Magazine, 18, 282-296.
Anon. (1997a) Chrysler Training Helps Suppliers Trim the Fat, 1997,
www.purchasing.com

280
Anon. (1997b) Lean Production in an International Supply Chain. Management
Research, 8, 17-18.
Anon. (2004) Mitsubishi Goes Beyond MES to Incorporate Lean. Quality, 43, 48-49.
Anon. (2005) Implementing Lean in Tough Times. Quality, 44, 50-52.
Antony, J. (2004) Some pros and cons of six sigma: an academic perspective. The
TQM Magazine, 16, 303-306.
Antony, J. (2006) Six sigma for service processes. Business Process Management, 12,
234-248.
Antony, J., Escamilla, J. L. & Caine, P. (2003) Lean Sigma. Manufacturing Engineer.
Appelqvist, P. & Lehtonen, J.-M. (2005) Combining optimisation and simulation for
steel production scheduling. Journal of Manufacturing Technology, 16, 197-
210.
Arnheiter, E. D. & Maleyeff, J. (2005) The Integration of Lean Management and Six
Sigma. The TQM Magazine, 17, 5-18.
Atkinson, P. (2004) Creating and Implementing Lean Strategies. Management
Services.
Balakrishnan, R. (2002) A Case Study of Creativity and Innovation in Automotive
Engineering.
Ballard, G., Harper, N. & Zabelle, T. (2003) Learning to See Work Flow: An
Application of Lean Concepts to Precast Concrete Fabrication. Engineering,
Construction and Architectural Management, 10, 6-14.
Balle, M. (2005) Lean Enterprise. IEE Manufacturing Engineer.
Bamber, C. J., Sharp, J. M. & Hides, M. T. (1999) Factors Affecting Successful
Implementation of Total Productive Maintenance: A UK Manufacturing Case

281
Study Perspective. Journal of Quality in Manintenance Engineering, 5, 162-
181.
Bamber, L. & Dale, B. G. (2000) Lean Production: A Study of Application in a
Traditional Manufacturing Environment. Production Planning & Control, 11,
291-298.
Banks, J. (2000) Introduction to Simulation. IN JOINES, J. A., BARTON, R. R.,
KANG, K. & FISHWICK, P. A. (Eds.) Winter Simulation Conference.
Bartezzaghi, E. (1999) The Evolution of Production Models: Is a New Paradigm
Emerging? International Journal of Operations & Production Management,
19, 229-250.
Bateman, N. (2005) Sustainability: The Elusive Element of Process Improvement.
International Journal of Operations & Production Management, 25, 261-276.
BBC (2006) Russian Steel Major to Merge with European Giant by End of July. BBC
News Website.
Beachum, D. (2005) Lean Manufacturing Beefs Up Margins,
www.metalfinishing.com
Beard, L. & Butler, S. A. (2000) Introducing JIT Manufacturing: It's Easier Than You
Think. Business Horizons.
Bendell, T. (2005) Structuring Business Process Improvement Methodologies. Total
Quality Management, 16, 969-978.
Bendell, T. (2006) A Review and Comparison of Six Sigma and the Lean
Organisations. The TQM Magazine, 18, 255-262.
Benson, R. S. (2005) Learning from Britain's best factories. Printweek.
Berning, G., Brandenburg, M., Gursoy, K., Kussi, J. S., Mehta, V. & Tolle, F.-J.
(2004) Integrating collaborative planning and supply chain optimization for

282
the chemical process industry (I) - methodology. Computers and Chemical
Engineering, 28, 913-927.
Bicheno, J. (2000) The Lean Toolbox 2nd Edition. 113-116., PICSIE Books,
Buckingham
Bicheno, J. (2004) The New Lean Toolbox., PICSIE Books, Buckingham.
Billesbach, T., J. (1994) Applying Lean Production Principles to a Process Facility.
Production and Inventory Management Journal, 3rd Quarter, 40-44.
Black, K. & Revere, L. (2006) Six Sigma arises from the ashes of TQM with a twist.
International Journal of Health Care Quality Assurance, 19, 259-266.
Blackiston, G. H. (1996) Juran Institute: A Barometer of Trends in Quality
Management. National Productivity Review, Winter, 15-23.
Blake, D. A. & Eash, J. F. (2003) The Boeing Journey to Excellence: Lean Production
Transformation in the Internal and External Supply Chains at Boeing. Quality
Congree. ASQ's Annual Quality Congress Proceedings, 57, 649-660.
Botha, W. (n.d.) Value Velocity or How Do I Know Lean Is Working?
http://www.lean.org/Community/Registered/ShowDocument.cfm?FileName=
Value%20Velocity%20story.doc, accessed October 2004.
Boughton, N. & Arokiam, I. (2000) The Application of Cellular Manufacturing: A
Regional Small to Medium Enterprise Perspective. Proceedings of the
Institution of Mechanical Engineers Part B - Journal of Engineering
Manufacture, 214, 751-754.
Boyer, K. K. (1996) An assessment of managerial commitment to lean production.
International Journal of Operations & Production Management, 16, 48-59.
Boyle, M. (2006) MacArthur Executive Says Steel Consolidation to Change
Australian Industry. Platt's International Coal Report, 1.
283
Brady, J. E. & Allen, T. T. (2006) Six Sigma Literature: A Review and Agenda for
Future Research. Quality and Reliability Engineering International, 22, 335-
367.
Brewer, P. C. & Bagranoff, N. A. (2004) Near zero-defect accounting with Six Sigma.
The Journal of Corporate Accounting & Finance, 15, 67-72.
Brooks, I. (1996) Leadership of a Cultural Change Process. Leadership and
Organization Development Journal, 17, 31-37.
Brunt, D. (2000) From Current State to Future State: Mapping the Steel to Component
Supply Chain. International Journal of Logistics: Research and Applications,
3.
Burgess, T., Hwarng, B., Shaw, N. & Mattos, C. D. (2002) Enhancing Value Stream
Agility: The UK Speciality Chemical Industry. European Management
Journal, 20, 199-212.
Caulcutt, R. (1995) The Rights and Wrongs of Control Charts. Applied Statistics, 44,
279-288.
Chakrabarty, A. & Tan, K. C. (2007) The current state of six sigma application in
services. Managing Service Quality, 17, 194-208.
Chan, P. S. & Wong, A. (1994) Global Strategic Alliances and Organizational
Learning. Leadership & Organization Development Journal, 15, 31-36.
CBIA Training and Consulting Services, www.cbia.com/training/, accessed October
2006.
Checkland, P. (1981) Systems Thinking, Systems Practice, Chichester, Wiley.
Checkland, P. (2000) Soft Systems Methodology: A Thirty Year Retrospective.
Systems Research and Behavioral Science, 17, 11-58.

284
Childerhouse, P. & Towill, D. (2000) Engineering Supply Chains to Match Customer
Requirements. Logistics Information Management, 13, 337-345.
Comm, C. L. & Mathaisel, D. F. X. (2003) Less is More: A Framework for a
Sustainable University. International Journal of Sustainability in Higher
Education, 4, 314-323.
Cook, R. L. & Rogowski, R. A. (1996) Applying JIT Principles to Continuous
Process Manufacturing Supply Chains. Production and Inventory
Management Journal, 1st Quarter, 12-16.
Cooke, D. L. & Rohleder, T. R. (2005) Inventory evaluation and product slate
management in large-scale continuous process industries. Journal of
Operations Management, 24, 235-249.
Cooper, R. & Kaplan, R. S. (1988) Measure Costs Right: Make the Right Decisions.
Harvard Business Review.
Cua, K. O., McKone, K. E. & Schroeder, R. G. (2001) Relationships between
implementation of TQM, JIT, and TPM and manufacturing performance.
Journal of Operations Management 19, 675-694.
Curry, A. & Kadasah, N. (2002) Focusing on key elements of TQM - evaluation for
sustainability. 14, 4.
Cusumano, M. A. (1994) The Limits of "Lean". Sloan Management Review, 35.
Dahlgaard, J. J. & Dahlgaard-Park, S. M. (2006) Lean production, six sigma quality,
TQM and company culture. The TQM Magazine, 18, 263-281.
Dailida, K. J. (2000) A Lean Approach to the Pinion Manufacturing Process at
Morgan Construction Company.
Daniel, D. (2005) In Depth: Health Care. Puget Sound Business Journal.
Davies, S. (2005) The Fabric of Success. IEE Manufacturing Engineer.

285
Dawson, P. (2005) Changing Manufacturing Practices: An Appraisal of the
Processual Approach. Human Factors and Ergonomics in Manufacturing, 15,
385-402.
Deming, W. E. (2000) Out of the Crisis, MIT Press.
Dennis, D. R. & Meredith, J. R. (2000) An analysis of process industry production
and inventory management systems. Journal of Operations Management, 18,
683-699.
Dickey, J. (1997) Tightening the Supply Chain. Iron Age New Steel, 13, 74-76.
Donatelli, A., J. & Harris, G., A. (2001) Combining Value Stream Mapping with
Discrete Event Simulation. Huntsville Simulation Conference. The Society for
Modeling and Simulation International.
Drago, W. & Geisler, E. (1997) Business Process Re-engineering: Lessons from the
past, Industrial Management & Data Systems, 97, 8, 297-303.
Dunlop, P. & Smith, S. D. (2004) Planning, Estimation and Productivity in the Lean
Concrete Pour. Engineering, Construction and Architectural Management, 11,
55-64.
Ehrlich, B. H. (2006) Service with a Smile. Industrial Engineer, 38.
Emiliani, M. L. (2004) Improving Business School Courses by Applying Lean
Principles and Practices. Quality Assurance in Education, 12, 175-187.
Feigenbaum, A. V. (1991) Total Quality Control, McGraw-Hill.
Forrester, J. W. (1999) Industrial Dynamics, Pegasus Communications, Inc.
Forza, C. (1996) Work Organization in Lean Production and Traditional Plants: What
Are the Differences? International Journal of Operations & Production
Management, 16, 42-62.
286
Fransoo, J. C. & Rutten, W. G. M. M. (1994) A Typology of Production Control
Situations in Process Industries. International Journal of Operations &
Production Management, 14, 47-57.
Fynes, B. (1994) From Lean Production to Lean Logistics: The Case of Microsoft
Ireland. European Management Journal, 12, 322-331.
George, M. (2002) Lean Six Sigma: Combining Six Sigma Quality with Lean Speed,
McGraw-Hill, New York.
Gort, A. (2005) Lean: Supply Chain Management and Software. Supply & Demand
Chain Executive, 6, 27.
Griner, H. & Hanson, R. (2001) How to Automate Your Shop, www.production-
machining.com
Hall, R. (1992) Shall We All Hang Separately. Industry Week, 241, 65.
Hameri, A.-P. & Lehtonen, J.-M. (2001) Production and supply management
strategies in Nordic paper mills. Scandinavian Journal of Management, 17,
379-396.
Hancock, W. M. & Zayko, M. J. (1998) Lean Production: Implementation Problems.
IIE Solutions, 30, 38-42.
Harrell, C., Ghosh, B. K. & Bowden, R. O. (2004) Simulation Using ProModel,
McGraw-Hill.
Harrison, J. (2006) Six Sigma vs. Lean Manufacturing: Which is right for your
company? Foundry Management & Technology, 134.
Hendry, L. (1998) Applying World Class Manufacturing to Make-to-order
Companies: Problems and Solutions. International Journal of Operations &
Production Management, 18, 1086-1100.

287
Hepworth, P. (1998) Weighing It Up - A Literature Review for the Balanced
Scorecard. Journal of Management Development, 17, 8, 559-563.
Higgins, K. T. (2005) Lean Builds Steam. Food Engineering: The Magazine for
Operations and Manufacturing Management.
Hines, P., Holweg, M. & Rich, N. (2004) Learning to Evolve: A Review of
Contemporary Lean Thinking. International Journal of Operations &
Production Management, 24, 994-1011.
Hines, P., Rich, N. & Esain, A. (1998) Creating a Lean Supplier Network: A
Distribution Industry Case. European Journal of Purchasing & Supply
Management, 4, 235-246.
Huang, S. H., Uppal, M. & Shi, J. (2002) A Product Driven Approach to
Manufacturing Supply Chain Selection. Supply Chain Management: An
Internatinal Journal, 7, 189-199.
IBISWorld (2005) Basic Iron and Steel manufacturing in Australia C2711. IN
IBISWORLD (Ed.).
Irani, S. A. (2001) Value Stream Mapping in Custom Manufacturing and Assembly
Facilities. Department of Industrial, Welding and Systems Engineering. The
Ohio State University.
Ireland, F. & Dale, B. G. (2001) A Study of Total Productive Maintenance
Implementation. Journal of Quality in Manintenance Engineering, 7, 183-191.
James-Moore, S. M. & Gibbons, A. (1997) Is Lean Manufacture Universally
Relevant? An Investigative Methodology. International Journal of Operations
& Production Management, 17, 899-911.
288
Jina, J., Bhattacharya, A. K. & Walton, A. D. W. (1997) Applying Lean Principles for
High Product Variety and Low Volumes: Some Issues and Propositions.
Logistics Information Management, 10, 5-13.
Joiner, B. L. (1994) Fourth Generation Management, McGraw-Hill.
Jones, D. & Mitchell, A. (2006) Lean thinking for the NHS, A report commisioned
by the NHS confederation. Lean Enterprise Academy UK.
Jones, D. T. (2005) A vision of leaner chemical production. European Chemical
News, 83.
Jones, D. T., Hines, P. & Rich, N. (1997) Lean Logistics. International Journal of
Physical Distribution & Logistics Management, 27, 153-173.
Juran, J. M. & Godfrey, A. B. (1999) Juran's Quality Handbook, McGraw-Hill.
Kale, P., Dyer, J. & Singh, H. (2001) Value Creation and Success in Strategic
Alliances: Alliancing Skills and the Role of Alliance Structure and Systems.
European Management Journal, 19, 463-471.
Kaplan, R. S. & Cooper, R. (1998) Cost and Effect: Using Integrated Cost Systems to
Drive Profitability and Performance, Harvard Business School Press.
Kaplan, R. S. & Norton, D. P. (1996) Balanced Scorecard: Translating Strategy into
Action, Harvard Business School Press.
Kasul, R. A. & Motwani, J. G. (1997) Successful Implementation of TPS in a
Manufacturing Setting: A Case Study. Industrial Management & Data
Systems, 97, 274-279.
Katayama, H. & Bennett, D. (1996) Lean Production in a Changing Competitive
World: A Japanese Perspective. International Journal of Operations &
Production Management, 16, 8-23.

289
Katayama, H. & Bennett, D. (1999) Agility, adaptability and leanness: A comparison
of concepts and a study of practice. International Journal of Production
Economics, 60-61, 43-51.
Keller, P. (2005) Six Sigma Demystified, McGraw-Hill.
Keller, P. A. (2001) Recent Trends in Six Sigma. Annual Quality Congress
Proceedings, 98-102.
Kelton, W. D., Sadowski, R. P. & Sadowski, D. A. (2002) Simulation with Arena,
McGraw-Hill.
Kerwin, K. (2005) BW 50: A New Blueprint at Pulte Homes. Business Week Online.
Kidd, P. T. (1994) Agile Manufacturing: Forging New Frontiers, Addison Wesley.
Knowles, G., Johnson, M. & Warwood, S. (2004) Medicated Sweet variability: A Six
Sigma Application at a UK Food Manufacturer, The TQM Magazine, 16, 4,
284-292.
Koenigsaecker, G. (2005) Leadership and the Lean Transformation. Manufacturing
Engineering, 135, 7-10.
Kotter, J. P. (1995) Leading Change: Why Transformation Efforts Fail. Harvard
Business Review.
Kumar, M., Antony, J., Singh, R. K., Tiwari, M. K. & Perry, D. (2006) Implementing
the Lean Sigma Framework in an Indian SME: a case study. Production
Planning & Control, 17, 407-423.
Kwon, I.-W., G. & Suh, T. (2005) Trust, Commitment and Relationships in Supply
Chain Management: A Path Analysis. Supply Chain Management: An
Internatinal Journal, 10, 26-33.
Lamming, R. (1993) Beyond Partnership: Stategies for Innovation and Lean Supply,
Prentice Hall.

290
Langfield-Smith, K. & Greenwood, M. R. (1998) Developing Co-operative Buyer-
supplier Relationships: A Case Study of Toyota. Journal of Management
Studies, 35.
Lehtonen, J.-M. (2000) Supply Chain Development in Process Industry. Helsinki,
Teknillinen Korkeakoulu.
Lehtonen, J.-M. & Holmstrom, J. (1998) Is Just-in-time Applicable in Paper Industry
Logistics. Supply Chain Management, 3, 21-32.
Li, K. S. (2006) BlueScope Steel in Drive to Break into New Sectors. Business Times.
Kuala Lumpur.
Lian, Y.-H. & Landeghem, H. V. (2002) An Application of Simulation and Value
Stream Mapping in Lean Manufacturing. IN VERBRAECK, A. & KRUG, W.
(Eds.) 14th European Simulation Symposium.
London Metal Exchange, www.lme.co.uk, accessed January 2007.
Loos, P. & Allweyer, T. (1998) Application of production planning and scheduling in
the process industries. Computers in Industry, 36, 199-208.
Lucey, J., Bateman, N. & Hines, P. (2004) Achieving Pace and Sustainability in a
Major Lean Transformation. Management Services, 48, 8-12.
Lynds, C. (2002) Common Sense Evolution: TI Automotive's Company-wide Lean
Strategy Brings Lower Costs by Slashing Waste. Plant, 61, 12.
Maani, K. E. & Cavana, R. Y. (2004) Systems Thinking and Modelling:
Understanding Change and Complexity, Pearson Prentice Hall.
Malin, J. H. & Reichardt, E. (2005) Strengthen the Six SIgma Portfolio. Quality, 44,
40-43.
Masters, R. J. (1996) Overcoming the barriers to TQM's success. Quality Progress,
29.
291
McAdam, R. & Lafferty, B. (2004) A multilevel case study critique of six sigma:
statistical control or strategic change? International Journal of Operations &
Production Management, 24, 530-549.
McCullen, P. & Towill, D. (2001) Achieving Lean Supply Through Agile
Manufacturing. Integrated Manufacturing Systems, 12, 524-533.
McDonald, T., Van Aken, E. M. & Rentes, A. F. (2002) Utilising Simulatin to
Enhance Value Stream Mapping: A Manufacturing Case Application.
International Journal of Logistics, 5, 213-232.
Micklethwait, J. & Wooldridge, A. (1997) The Witch Doctors: Making Sense of the
Management Gurus, Times Business.
Mika, G. (2006) Six Sigma Isn't Lean. Manufacturing Engineering, 137.
Mileham, A. R., Cully, S. J., Owen, G. W. & McIntosh, R. I. (1999) Rapid
changeover - a pre-requisite for responsive manufacture. International Journal
of Operations & Production Management, 19, 785-796.
Moxham, C. & Greatbanks, R. (2001) Prerequisites for the Implementation of the
SMED Methodology: A Study in a Textile Processing Environment.
International Journal of Quality and Reliability Management, 18, 404-414.
Naylor, J. B., Naim, M. M. & Berry, D. (1999) Leagility: Integrating the lean and
agile manufacturing paradigms in the total supply chain. International Journal
of Production Economics, 62, 107-118.
Neave, H. R. (n.d.) The History and Teachings of Dr W. Edwards Deming. British
Deming Association, 75-87.
Nelson, R. D. (2004) How Delphi Went Lean. Supply Chain Management Review, 8,
32-37.

292
O'Connell, J. & Blamey, A. (2006) Delayed Britannia Lead to Firm Premiums;
Ivernia Ramps Up. Platt's Metals Week, 77, 10.
O'Connor, J. & McDermott, I. (1997) The Art of Systems Thinking, Thorsons.
Olexa, R. (2003) Flying Lean. Manufacturing Engineering, 130, 71-77.
Owen, K., Mundy, R., Guild, W. & Guild, R. (2001) Creating and sustaining the high
performance organization. Managing Service Quality, 11, 10-21.
Pande, P. S., Neuman, R. P. & Cavanagh, R. R. (2000) The Six Sigma Way, McGraw-
Hill.
Park, C. (2004) Boeing Executive Commits to Renton. King county journal.
Parker, M. & Slaughter, J. (1994) Lean Production is Mean Production: TQM Equals
Management by Stress. Canadian Dimension, 28, 21.
Peterson, P. B. (2002) The Misplaced Origin of Just-in-time Production Methods.
Management Decision, 40, 82-88.
Philpott, A. & Everett, G. (2001) Supply Chain Optimisation in the Paper Industry.
Annals of operations research, 108, 225.
Plankey Videla, N. (2004) It Cuts Both Ways: The Unintended Consequences of Lean
Production in a Mexican Garment Factory. The University of Winconsin.
Potter, A., Mason, R., Naim, M. & Lalwani, C. (2004) The evolution towards an
integrated steel supply chain: A case from the UK. International Journal of
Production Economics, 89, 207-216.
Prince, J. & Kay, J. M. (2003) Combining lean and agile characteristics: Creation of
virtual groups by enhanced production flow analysis. International Journal of
Production Economics, 85, 305-318.
Pritchard, S. (2002) Inside Dell's Lean Machine. Works Management, 55, 14-16.

293
Pu, Y. & Mesbahi, E. (2006) Application of artificial neural networks to evaluation of
ultimate strength of steel panels. Engineering Structures, 28, 1190-1196.
Pyzdek, T. (2000) Six Sigma and Lean Production. Quality Digest.
Raisinghani, M. S. (2005) Six Sigma: concepts, tools, and applications. Industrial
Management and Data Systems, 105, 491-505.
Ravishankar, G., Burczak, C. & De Vore, R. (1992) Competitive Manufacturing
Through Total Productive Maintenance. International Congress on Plant
Maintenance. Bologna.
Rinehart, J., Huxley, C. & Robertson, D. (1997) Just Another Car Factory?: Lean
Production and Its Discontents, ILR Press.
Robertson, M. & Jones, C. (1999) Application of Lean Production and Agile
Manufacturing Concepts in a Telecommunications Environment. International
Journal of Agile Management Systems, 1, 14-16.
Rother, M. & Shook, J. (1999) Learning to See: Value Stream Mapping to Add Value
and Eliminate Muda, Lean Enterprise Institute (LEI).
Roy, R. N. & Guin, K. K. (1999) A proposed model of JIT purchasing in an integrated
steel plant. International Journal of Production Economics, 59, 179-187.
Russell, R. S. & Taylor, B. W. (2000) Operations Management.
Savsar, M. & Choueiki, M. (2000) A Neural Network Procedure for Kanban
Allocation in JIT Production Control Systems. International Journal of
Production Research, 38, 3247-3265.
Scherkenbach, W. W., (1988) The Deming Route to Quality and Productivity:
Roadmaps and Roadblocks, Mercury Press/Fairchild Publications.
Schroer, B. J. (2004) Simulation as a Tool in Understanding the Concepts of Lean
Manufacturing. Simulation, 80, 171-175.

294
Sebastianelli, R. & Tamimi, N. (2003) Understanding the obstacles to TQM success.
The Quality Management Journal, 10.
Segla International, www.segla.com.au/lean-six-sigma, accessed October 2006.
Sehwail, L. & Deyong, C. (2003) Six Sigma in health care. International Journal of
Health Care Quality Assurance, 16, i-v.
Senapati, N. R. (2004) Six Sigma: myths and realities. International Journal of
Quality & Reliability Management, 21, 683-690.
Senge, P. M. (1998) The Fifth Discipline, Random House Australia.
Shah, N. (2005) Process industry supply chains: Advances and challenges. Computers
and Chemical Engineering, 29, 1225-1235.
Sharma, U. (2003) Implementing Lean Principles with the Six Sigma Advantage:
How a Battery Company Realized Significant Improvements. Journal of
Organizational Excellence, 22, 43-52.
Sheridan, J. H. (2000) 'Lean Sigma' Synergy. Industry Week, 249, 81-82.
Shiba, S. & Walden, D. (2001) Four Practical Revolutions in Management,
Productivity Press.
Shukla, A. (2006) Proactive People Management One Key to Lean Success. Plant
Engineering, 60.
Silvester, K., Lendon, R., Bevan, H., Steyn, R. & Walley, P. (2004) Reducing the
Waiting Times in the NHS: Is LAck of Capacity the Problem? Clinician in
Management, 12.
Smalley, A. (2005) TPM at the Heart of Lean. The Manufacturer.
Smith, B. (2003) Lean and Six Sigma-A One-Two Punch. Quality Progress, 36, 37-
41.
Spear, S. J. (2004) Learning to Lead at Toyota. Harvard Business Review, 82, 78.
295
Spector, R. & West, M. (2006) The Art of Lean Program Management. Supply Chain
Management Review.
Spedding, T. A. & Chan, K. K. (2001) System level improvement using discrete event
simulation. International Journal of Quality & Reliability Management, 18,
84-103.
Spedding, T. A. & Sun, G. Q. (1999) Application of Discrete Event Simulation to the
Activity Based Costing of Manufacturing Systems, International Journal of
Production Economics, 58, 289-301.
Srinivasan, M. M., Srinivasan, T. & Choi, E. W. (2005) Build and Manage a Lean
Supply Chain. Industrial Management, 47, 20-25.
Sterman, J. (2000) Business Dynamics: Systems Thinking and Modeling for a
Complex World, Mcgraw-Hill.
Stevens, G. C. (1989) Integrating the Supply Chain. International Journal of Physical
Distribution & Materials Management, 19, 3-8.
Stewart, P. (1998) Out of Chaos Comes Order: From Japanization to Lean Production,
A Critical Commentary. Employee Relations, 20, 213-223.
Stewart, R. A. & Spencer, C. A. (2006) Six-sigma as a strategy for process
improvement on construction projects: a case study. Construction
Management and Economics, 24, 339-348.
Storhagen, N. G. (1995) The Human Aspects of JIT Implementation. International
Journal of Physical Distribution & Logistics Management, 25, 4-23.
Straker, D. (2004) Value Stream Management for The Lean Office. Quality Progress,
37.
Svensson, G. (2001) Just-in-time: The Reincarnation of Past Theory and Practice.
Management Decision, 39, 866-879.

296
Taylor, D. & Brunt, D. (2000) Manufacturing Operations and Supply Chain
Management: LEAN Approach, Thomson Learning.
Taylor, J. G. (1996) Neural Networks and Their Applications, John Wiley and Sons.
Teresko, J. (2005) It Came From Japan! Industry Week.
Thomas, A. & Barton, R. (2006) Developing an SME Based Six Sigma Strategy,
Journal of Manufacturing Technology Management, 17, 4, 417-434.
Tinham, B. (2005a) How to Make Your Supply Chain Lean. Manufacturing
Computer Solutions, 4-7.
Tinham, B. (2005b) You're Not in Automotive, So Make Lean Work with IT.
Manufacturing Computer Solutions, 24-25.
Tolstoy, L. (unknown).
Van Donk, D. P. (2005) A case of shared resources, uncertainty and suplpy chain
integration in the process industry. International Journal of Production
Economics, 96, 97-108.
Van Donk, D. P. & Fransoo, J. C. (2006) Operations Management Research in
Process Industries. Journal of Operations Management, 24, 211-214.
Voros, J. (2006) The Dynamics of price, quality and productivity improvement
decisions. European Journal of Operational Research, 170, 809-823.
Waurzyniak, P. (2005) Lean at NUMMI. Manufacturing Engineering, 135, 73-81.
Week, P. s. M. (2006) Another Britannia Lead Delay Reported. Platt's Metals Week,
77, 14.
Wheat, B., Mills, C. & Carnell, M. (2003) Leaning into Six Sigma.
Wheeler, D. J. (2000) Understanding variation : the key to managing chaos, SPC
Press.

297
Wheeler, D. J. & Chambers, D. S. (1990) Understanding Statistical Process Control,
Addison-Wesley Publishing.
White, R. E. & Prybutok, V. (2001) The Relationship Between JIT Practices and Type
of Production System. Omega - The International Journal of Management
Science, 113-124.
Willmott, P. (1994) Total Quality With Teeth. The TQM Magazine, 6, 48-50.
Winter, D. (1983) Job Shops Dig in Their Heels. Production, 92, 62-66.
Winters, B., Price, M. & Simonin, K. Lean Implementation in Continuous Process
Manufacturing. IN GROUP, T. G. (Ed.).
Womack, J. & Jones, D. (1996) Lean Thinking: Banish Waste and Create Wealth in
Your Corporation. Simon and Schuster: London UK.
Womack, J., Jones, D. T. & Roos, D. (1990) The Machine that Changed the World,
Rawson Associates, New York.
Xstrata plc., www.xstrata.com. accessed January 2005.
Yamashina, H. (2000) Challenge to World-class Manufacturing. International
Journal of Quality and Reliability Management, 17, 132-143.
Yang, H. M., Choi, B. S., Park, H. J., Suh, M. S. & Chae, B. (2007) Supply chain
management six sigma: a management innovation methodology at the
Samsung Group. Supply Chain Management: An International Journal, 12,
88-95.
Zhou, Z., Cheng, S. & Hua, B. (2000) Supply chain optimization of continuous
process industries with sustainability considerations. Computers and Chemical
Engineering, 24, 1151-1158.

298
APPENDICES
Appendix 1 X Bar and R Charts for AB Paper
Sample
Sam
ple
Mea
n
1351201059075604530151
50
49
48
47
46
45
__X=49.055
UCL=49.755
LCL=48.355
Xbar Chart of Dump Tank
Figure A1.1 X bar Chart of Dump Tank Process
Sample
Sam
ple
Ran
ge
1351201059075604530151
10
8
6
4
2
0
_R=0.96
UCL=2.19
LCL=0
R Chart of Dump Tank
Figure A1.2 R Chart for Dump Tank Process

299
Sample
Sam
ple
Ran
ge
1351201059075604530151
7
6
5
4
3
2
1
0
_R=1.166
UCL=2.660
LCL=0
R Chart of PB
Figure A1.3 R Chart for Post-bleaching Process
Sample
Sam
ple
Mea
n
1351201059075604530151
70.0
67.5
65.0
62.5
60.0
57.5
55.0
__X=67.11
UCL=68.66
LCL=65.55
Xbar Chart of DIP
Figure A1.4 X bar Chart for De-inking Process

300
Sample
Sam
ple
Ran
ge
1351201059075604530151
16
14
12
10
8
6
4
2
0
_R=2.13
UCL=4.87
LCL=0
R Chart of DIP
Figure A1.5 R Chart for De-inking Process
Sample
Sam
ple
Mea
n
1351201059075604530151
65.5
65.0
64.5
64.0
63.5
63.0
62.5
__X=63.753
UCL=64.171
LCL=63.335
Xbar Chart of PM14
Figure A1.6 X bar Chart for PM14 Process

301
Sample
Sam
ple
Ran
ge
1351201059075604530151
2.5
2.0
1.5
1.0
0.5
0.0
_R=0.573
UCL=1.308
LCL=0
R Chart of PM14
Figure A1.7 R Chart for PM14 Process

302
Appendix 2 New Control Limits for AB Paper
Observation
Indi
vidu
al V
alue
1351201059075604530151
9.0
8.5
8.0
7.5
7.0
6.5
_X=7.842
UCL=9.109
LCL=6.576
x bar Chart of Not Correlated PM14
Figure A2.1 X bar Chart for PM14 - Independent Data
Observation
Mov
ing
Ran
ge
1351201059075604530151
1.8
1.6
1.4
1.2
1.0
0.8
0.6
0.4
0.2
0.0
__MR=0.476
UCL=1.556
LCL=0
Moving Range Chart of Not Correlated PM14
Figure A2.2 R Chart for PM14 - Independent Data

303
Observation
Mov
ing
Ran
ge
1351201059075604530151
18
16
14
12
10
8
6
4
2
0
__MR=1.06
UCL=3.45
LCL=0
Moving Range Chart of DIP independent data
Figure A2.3 R Chart for De-inking Process - Independent Data
Observation
Indi
vidu
al V
alue
1351201059075604530151
30
25
20
15
10
_X=18.12
UCL=20.93
LCL=15.31
x bar Chart of DIP independent data
Figure A2.4 X bar Chart for De-inking Process - Independent Data
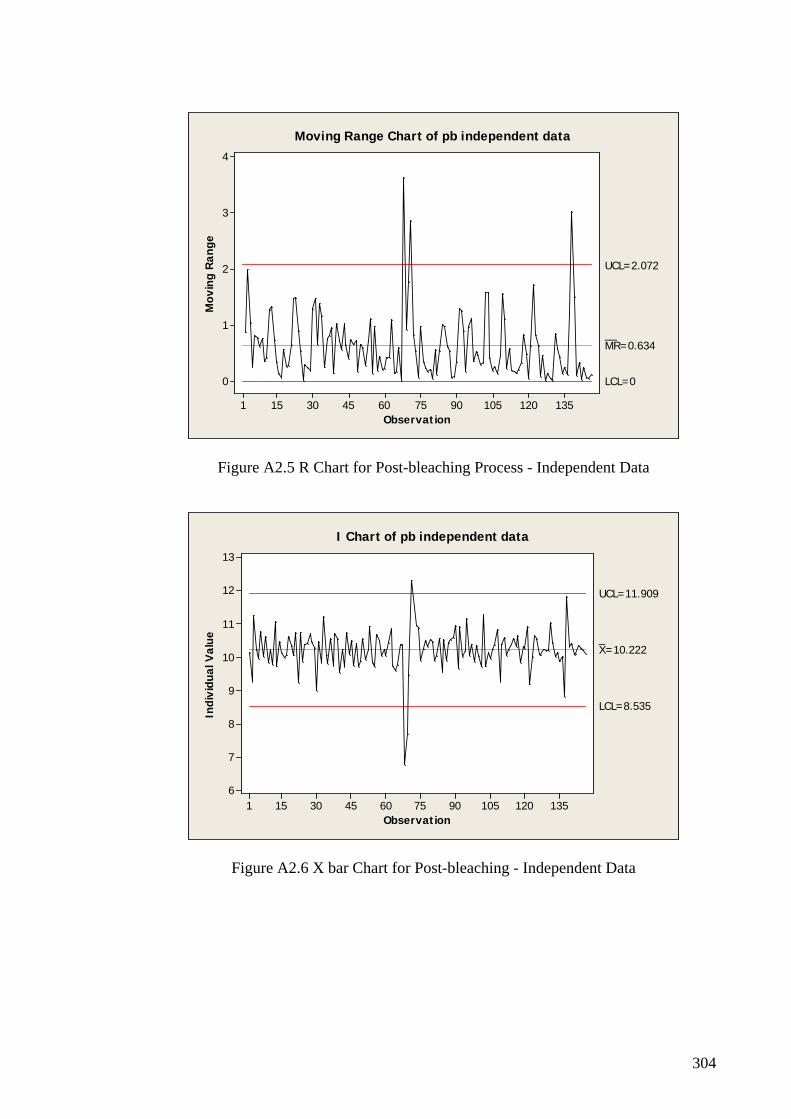
304
Observation
Mov
ing
Ran
ge
1351201059075604530151
4
3
2
1
0
__MR=0.634
UCL=2.072
LCL=0
Moving Range Chart of pb independent data
Figure A2.5 R Chart for Post-bleaching Process - Independent Data
Observation
Indi
vidu
al V
alue
1351201059075604530151
13
12
11
10
9
8
7
6
_X=10.222
UCL=11.909
LCL=8.535
I Chart of pb independent data
Figure A2.6 X bar Chart for Post-bleaching - Independent Data
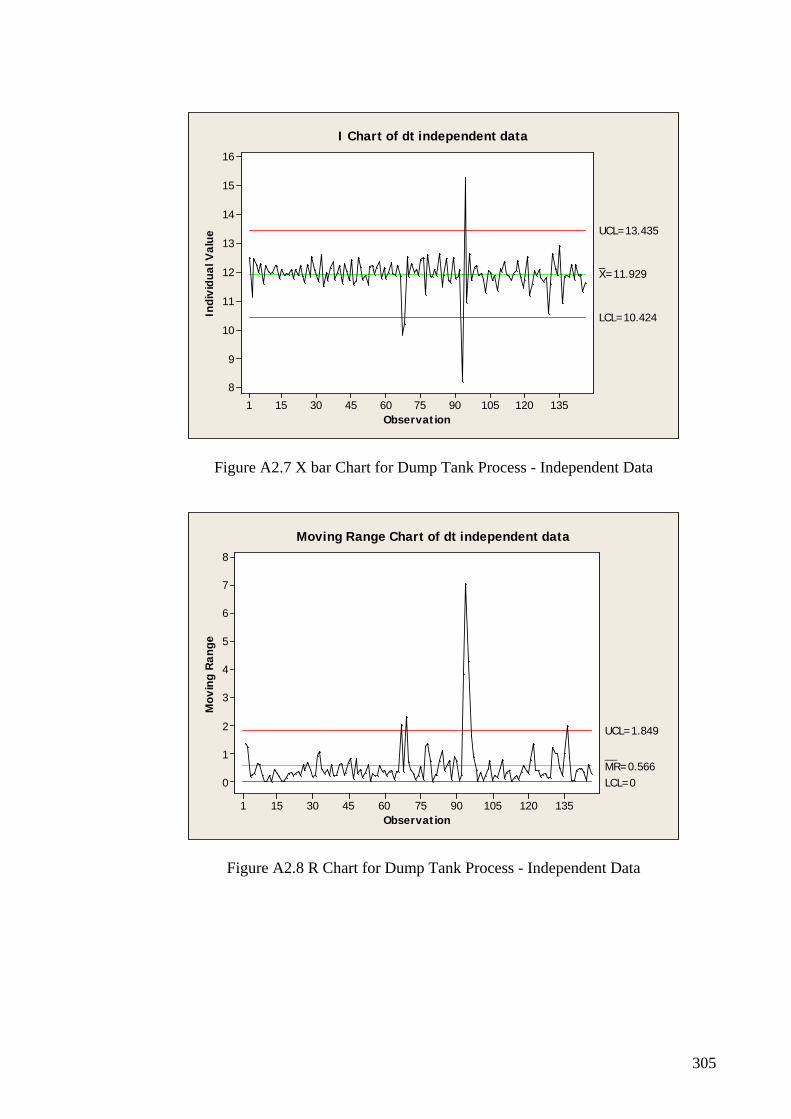
305
Observation
Indi
vidu
al V
alue
1351201059075604530151
16
15
14
13
12
11
10
9
8
_X=11.929
UCL=13.435
LCL=10.424
I Chart of dt independent data
Figure A2.7 X bar Chart for Dump Tank Process - Independent Data
Observation
Mov
ing
Ran
ge
1351201059075604530151
8
7
6
5
4
3
2
1
0
__MR=0.566
UCL=1.849
LCL=0
Moving Range Chart of dt independent data
Figure A2.8 R Chart for Dump Tank Process - Independent Data

306
Appendix 3 Bottom Loss Data for Jumbo Newsprint Reels
Table A3.1 Bottom Loss Data for Newsprint Reels
Length Bottom Loss Length Bottom Loss Length Bottom Loss Length Bottom Loss
84,860 50,487 96,460 1,862 108,100 1,287 103,920 373 93,510 566 96,620 2,236 108,770 521 104,250 627 93,440 570 96,950 1,363 108,610 985 104,420 761 93,220 389 96,490 2,195 108,940 1,367 104,250 513 93,040 -43 95,910 2,798 107,570 -629 104,760 641 92,880 260 102,180 -6 108,760 284 106,100 1,356 92,540 72 102,670 316 108,090 294 80,860 308 93,220 564 92,440 7,312 107,760 144 104,540 -1,069
0 0 108,260 308 0 93,390 93 105,120 2,591 0 106,330 195
0 0 107,080 106 0 93,050 457 95,700 -6,323 0 106,510 330
0 0 108,240 309 0 93,550 641 102,850 800 0 107,000 660
0 0 106,900 599 0 93,390 221 35,910 1,642 0 99,140 -746
0 0 106,900 364 0 93,390 72 103,900 1,738 0 100,790 156
0 0 102,770 2,337 0 93,050 3,793 102,890 87 0 101,260 1,071
0 0 100,600 -52 0 92,890 1,921 102,900 446 0 101,440 988
0 0 101,450 464 0 99,830 -351 102,880 399 0 100,310 344
0 0 100,460 173 0 100,500 320 38,020 3,547 0 22,880 22,880
0 0 101,710 333 0 99,670 178 102,670 1,150 0 92,950 13,722
0 0 100,850 191 0 99,830 326 80,870 12,883 0 68,190 3,916
0 0 100,800 162 0 99,610 311 102,810 1,258 0 25,870 -10,423
0 0 99,640 163 0 99,440 945 91,920 -10,188 0 100,370 1,649
0 0 100,660 238 0 100,280 891 65,180 -5 0 100,630 1,697
0 0 109,760 3,529 0 101,120 1,222 103,140 1,074 0 61,830 11,901
0 0 106,190 139 0 100,620 70 102,700 295 0 65,410 962
0 0 106,710 425 0 101,300 484 107,300 5,304 0 32,759 -12,361

307
0 0 106,380 29 0 101,130 433 106,280 -1,106 0 44,080 10,898
0 0 106,890 699 99,610 221 100,970 817 87,550 1,290 0 0
0 0 90,410 4,985 21,950 1,925 101,140 285 108,770 1,746 0 0
0 0 105,200 -414 46,890 168 104,620 139 106,780 331 0 0
0 0 18,660 -590 27,790 415 106,150 676 106,950 212 0 0
0 107,440 393 100,630 2,602 100,390 3,628 105,980 1,546 0 0 0
0 29,880 -13,476 32,430 12,329 53,990 3,178 105,990 218 0 0 0
0 15,520 15,520 96,870 -9,583 100,570 -317 105,970 1,033 0 0 0
0 86,380 2,096 101,400 607 102,630 3,013 105,300 210 0 0 0
0 28,770 -736 18,300 18,300 100,190 5,270 105,290 854 0 0 0
0 100,780 539 84,750 -15,361 102,540 1,724 104,780 233 0 0 0
0 101,880 274 82,560 2,628 103,280 1,342 104,440 446 0 0 0
0 101,880 1,502 41,290 1,311 104,420 2,131 104,610 437 0 0 0
0 110,510 4,217 112,660 5,448 102,560 198 104,610 922 0 0 0
0 107,530 293 111,230 958 102,150 579 104,090 248 0 0 0
0 107,470 213 19,260 -2,832 101,440 275 23,520 2,579 0 0 0
0 107,670 1,152 88,610 5,712 100,380 448 94,010 0 0 0 0
0 107,550 152 109,180 990 104,320 -206 24,510 8,276 0 0 0
0 108,020 294 109,020 292 104,800 325 92,190 -6,303 0 0 0
0 107,930 460 108,870 846 105,390 544 30,520 263 0 0 0
0 108,090 271 109,040 62 105,820 273 98,654 574 0 0 0
0 108,090 232 108,860 247 44,360 2,138 63,750 1,512 0 0 0
0 108,040 261 109,360 496 106,640 257 81,710 518 0 0 0
0 108,430 4,148 109,540 183 105,400 454 104,470 530 0 0 0 104,310 780 108,160 107 27,380 4,906 105,590 164
0 0 0 0 104,150 145 107,720 489 109,420 488 106,260 155
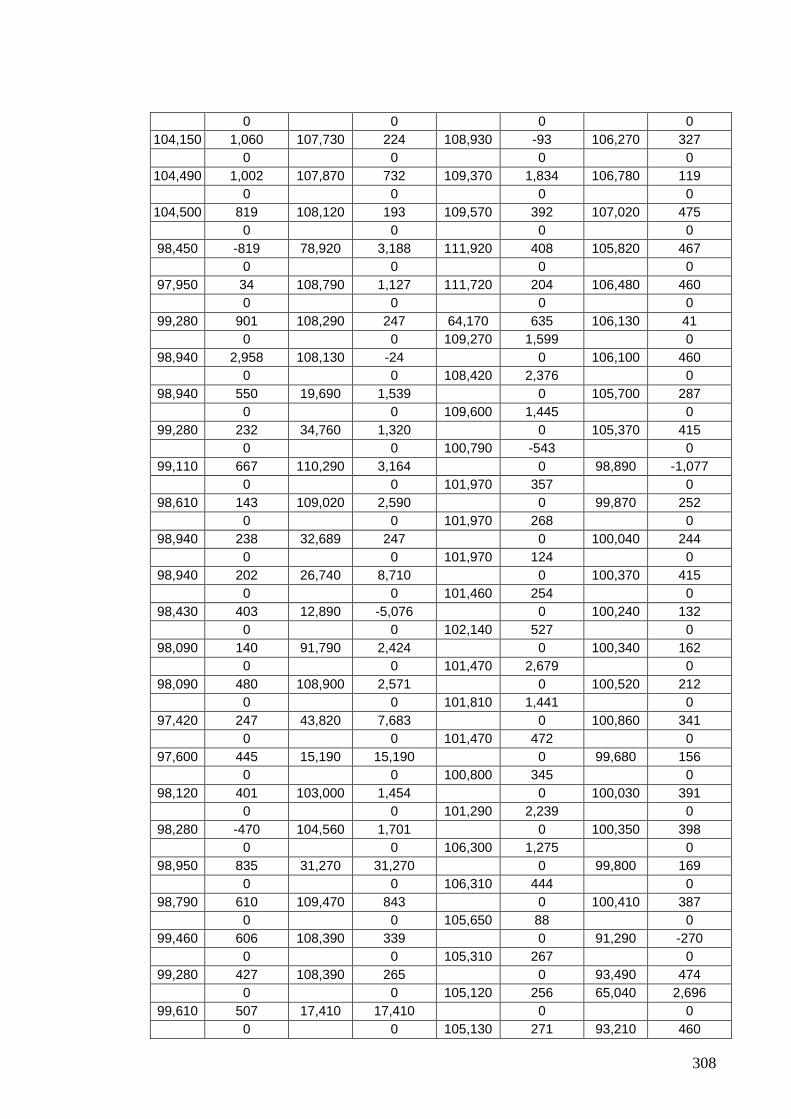
308
0 0 0 0 104,150 1,060 107,730 224 108,930 -93 106,270 327
0 0 0 0 104,490 1,002 107,870 732 109,370 1,834 106,780 119
0 0 0 0 104,500 819 108,120 193 109,570 392 107,020 475
0 0 0 0 98,450 -819 78,920 3,188 111,920 408 105,820 467
0 0 0 0 97,950 34 108,790 1,127 111,720 204 106,480 460
0 0 0 0 99,280 901 108,290 247 64,170 635 106,130 41
0 0 109,270 1,599 0 98,940 2,958 108,130 -24 0 106,100 460
0 0 108,420 2,376 0 98,940 550 19,690 1,539 0 105,700 287
0 0 109,600 1,445 0 99,280 232 34,760 1,320 0 105,370 415
0 0 100,790 -543 0 99,110 667 110,290 3,164 0 98,890 -1,077
0 0 101,970 357 0 98,610 143 109,020 2,590 0 99,870 252
0 0 101,970 268 0 98,940 238 32,689 247 0 100,040 244
0 0 101,970 124 0 98,940 202 26,740 8,710 0 100,370 415
0 0 101,460 254 0 98,430 403 12,890 -5,076 0 100,240 132
0 0 102,140 527 0 98,090 140 91,790 2,424 0 100,340 162
0 0 101,470 2,679 0 98,090 480 108,900 2,571 0 100,520 212
0 0 101,810 1,441 0 97,420 247 43,820 7,683 0 100,860 341
0 0 101,470 472 0 97,600 445 15,190 15,190 0 99,680 156
0 0 100,800 345 0 98,120 401 103,000 1,454 0 100,030 391
0 0 101,290 2,239 0 98,280 -470 104,560 1,701 0 100,350 398
0 0 106,300 1,275 0 98,950 835 31,270 31,270 0 99,800 169
0 0 106,310 444 0 98,790 610 109,470 843 0 100,410 387
0 0 105,650 88 0 99,460 606 108,390 339 0 91,290 -270
0 0 105,310 267 0 99,280 427 108,390 265 0 93,490 474
0 0 105,120 256 65,040 2,696 99,610 507 17,410 17,410 0 0
0 0 105,130 271 93,210 460

309
99,440 554 80,440 8,552 0 0 0 0 104,780 209 94,180 588
99,110 765 108,830 1,020 0 0 0 0 105,800 935 94,830 474
75,850 584 108,340 196 0 0 0 107,880 1,238 105,290 640 94,330 579
98,203 645 0 0 0 0 110,270 4,653 60,650 438 94,000 443
47,425 408 0 0 0 0 109,530 813 97,510 9,398 94,530 934
97,581 325 0 0 0 0 109,440 1,014 101,480 1,977 94,710 313
98,670 484 0 0 0 0 109,440 937 106,410 273 94,730 996
99,010 504 0 0 0 0 109,840 1,464 107,960 1,251 94,390 213
99,010 375 0 0 0 0 109,790 894 108,180 256 94,230 887
99,180 264 0 0 0 0 109,980 818 108,160 1,480 94,720 301
100,020 493 0 0 0 0 78,630 -8,028 107,090 356 94,880 917
99,350 44 0 0 0 0 110,920 1,277 106,990 360 95,060 425
99,530 488 0 0 0 0 109,000 1,005 107,440 350 94,890 648
99,520 -44 0 0 0 0 108,970 143 107,460 291 101,340 3,052
99,190 415 0 0 0 0 109,130 644 108,520 298 102,390 121
98,500 559 0 0 0 0 112,370 1,094 108,130 302 101,870 240
98,670 632 0 0 0 0 111,410 873 107,980 302 102,060 143
101,440 -1,361 0 0 0 0 88,370 217 107,360 443 101,910 232
103,000 547 0 0 0 0 16,180 16,180 107,050 1,135 101,740 354
102,840 237 0 0 0 0 101,910 15,031 106,610 219 101,560 219
95,810 13,672 0 0 0 0 51,280 -13,143 106,690 320 101,790 153
102,850 999 0 0 0 86,770 -12,884 112,040 711 106,700 282 101,210 671
0 0 0 0 103,690 1,144 112,050 1,788 100,530 -274 101,550 299
0 0 0 0 102,850 582 112,550 165 101,100 1,077 80,790 528
0 0 0 0 103,190 248 112,880 1,894 101,050 364 100,560 487
0 0 0 0

310
27,140 137 112,510 910 100,960 550 101,720 813 0 0 0 0
103,340 1,686 112,420 2,488 101,000 230 100,870 826 0 0 0 0
103,830 343 112,410 300 100,720 268 102,050 1,609 0 0 0 0
104,010 456 112,620 1,876 100,810 44 101,220 804 0 0 100,660 304 0
104,020 118 112,650 174 0 101,450 264 0 0 100,660 509 0
104,520 173 113,830 1,657 0 101,800 961 0 0 100,710 555 0
104,690 509 113,560 233 0 101,300 628 0 0 100,660 183 0
104,690 236 113,890 1,688 0 48,600 5,952 0 0 100,670 462 0
105,030 355 113,150 855 0 112,890 9,263 0 0 39,210 211 0
104,170 345 113,630 1,837 0 47,000 4,525 0 0 99,860 -346 0
98,800 178 113,130 402 0 108,570 3,461 0 0 102,250 1,353 0
104,090 2,565 98,030 8,616 0 91,720 8,517 0 0 101,780 1,164 0
104,910 2,314 112,220 -180 0 93,570 9,927 0 0 93,950 747 0
102,720 164 104,770 -7,287 0 9,357 -90,488 0 0 94,400 1,098 0
103,890 329 113,240 654 0 98,000 -7,883 0 0 94,560 1,272 0
103,550 720 112,740 1,016 0 105,040 374 0 0 94,080 1,009 0
104,220 262 107,650 -553 0 45,240 2,936 0 0 94,400 987 0
51,940 71 109,110 1,412 0 18,700 -104 0 0 95,200 900 0
104,130 1,791 107,950 610 0 105,490 2,489 0 0 95,350 949 0
104,450 276 106,950 851 0 106,350 919 0 0 95,020 883 0
78,300 -74 106,940 450 0 45,770 3,479 0 0 95,670 1,624 0
105,380 1,331 107,100 474 0 105,540 1,864 0 0 95,520 1,394 12,450 12,450
104,700 1,237 107,780 323 0 0 0 0 95,860 1,223 95,600 -9,829
104,200 298 108,780 1,605 0 0 0 0 102,030 458 104,520 250
104,340 497 108,310 1,119 0 0 0 0 102,380 17,327 105,540 332
104,730 775 107,670 694 0 0

311
0 107,460 355 102,180 870 105,370 438 105,650 379 0 0 0
0 106,710 976 101,940 -14,542 78,770 16,196 105,350 212 0 0 0
0 107,210 350 101,640 648 106,030 1,561 105,350 2,336 0 0 0
0 107,380 1,262 101,220 253 92,040 -12,503 105,350 122 0 0 0
0 19,370 -2,008 101,340 783 105,520 1,019 105,320 971 0 0 0
0 107,480 1,494 101,250 307 105,520 169 104,310 268 0 0 0
0 27,120 5,872 101,250 877 105,700 1,621 104,660 86 0 0 0
0 107,750 2,590 101,080 417 106,210 520 105,300 808 0 0 0
0 100,830 1,264 101,090 1,195 106,210 644 105,200 118 0 0 0
0 100,770 453 100,780 287 108,410 -1,366 105,540 487 0 0 0
0 101,100 708 101,500 777 110,580 1,052 105,880 178 0 0 0
0 101,460 388 101,150 94 110,750 310 104,700 408 0 0 0
0 101,270 1,181 101,160 707 110,750 801 106,240 885 0 0 0
0 57,990 1,135 101,480 451 69,510 3,639 47,290 13,658 0 0 0
0 100,960 -153 100,640 136 109,690 462 14,710 60 0 0 0
0 93,680 -146 101,150 876 110,010 179 82,930 -11,954 0 0 0
0 94,520 506 101,670 556 110,520 708 35,570 646 0 0 0
0 94,370 839 101,160 936 111,200 269 106,330 2,419 0 0 0
0 93,910 289 100,470 380 103,110 15,093 98,500 -910 0 0 0 99,330 756 95,060 890 100,310 1,102 111,840 2,090
0 0 0 0 85,530 7,025 95,390 581 101,150 466 94,850 -13,824
0 0 0 0 100,660 6,623 95,390 830 100,300 616 48,260 677
0 0 0 0 101,690 2,418 95,720 1,037 100,800 475 47,750 5,856
0 0 0 0 100,140 693 95,390 298 100,810 1,115 46,110 3,903
0 0 0 0 100,450 1,067 95,060 895 100,310 71 113,060 2,197
0 0 0 0 100,110 636 95,230 1,078 100,850 830 109,840 2,288
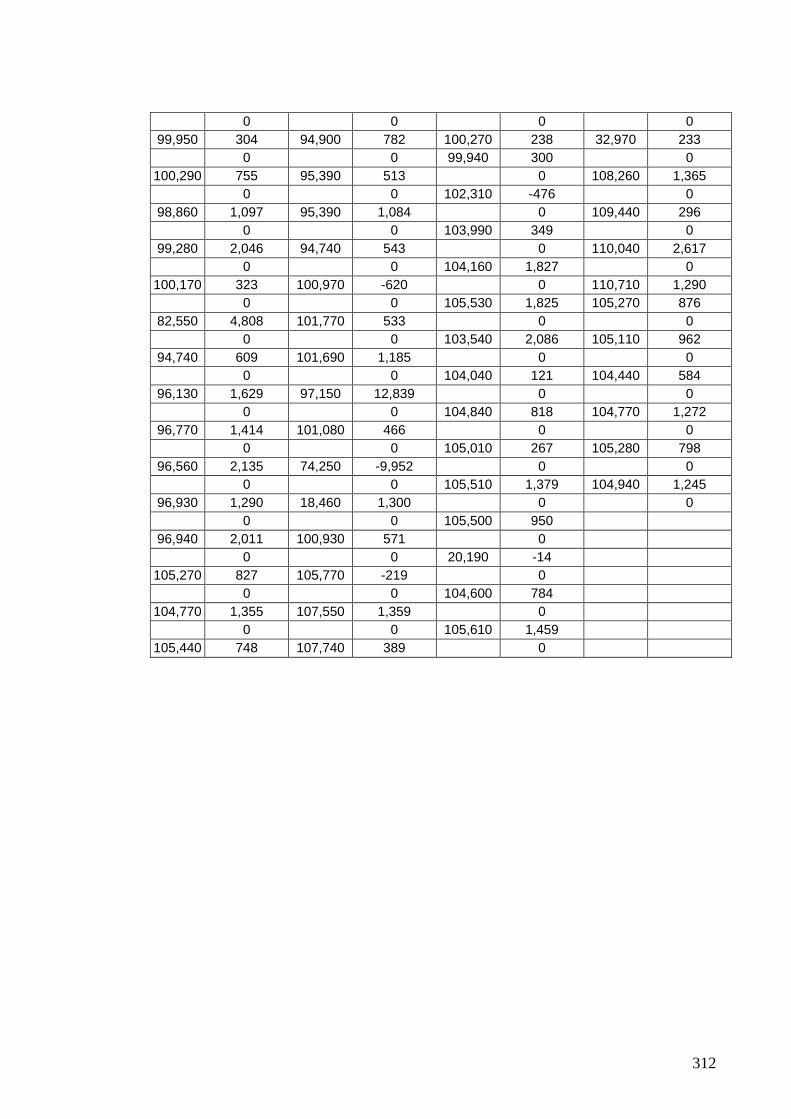
312
0 0 0 0 99,950 304 94,900 782 100,270 238 32,970 233
0 0 99,940 300 0 100,290 755 95,390 513 0 108,260 1,365
0 0 102,310 -476 0 98,860 1,097 95,390 1,084 0 109,440 296
0 0 103,990 349 0 99,280 2,046 94,740 543 0 110,040 2,617
0 0 104,160 1,827 0 100,170 323 100,970 -620 0 110,710 1,290
0 0 105,530 1,825 105,270 876 82,550 4,808 101,770 533 0 0
0 0 103,540 2,086 105,110 962 94,740 609 101,690 1,185 0 0
0 0 104,040 121 104,440 584 96,130 1,629 97,150 12,839 0 0
0 0 104,840 818 104,770 1,272 96,770 1,414 101,080 466 0 0
0 0 105,010 267 105,280 798 96,560 2,135 74,250 -9,952 0 0
0 0 105,510 1,379 104,940 1,245 96,930 1,290 18,460 1,300 0 0
0 0 105,500 950 96,940 2,011 100,930 571 0
0 0 20,190 -14 105,270 827 105,770 -219 0
0 0 104,600 784 104,770 1,355 107,550 1,359 0
0 0 105,610 1,459 105,440 748 107,740 389 0
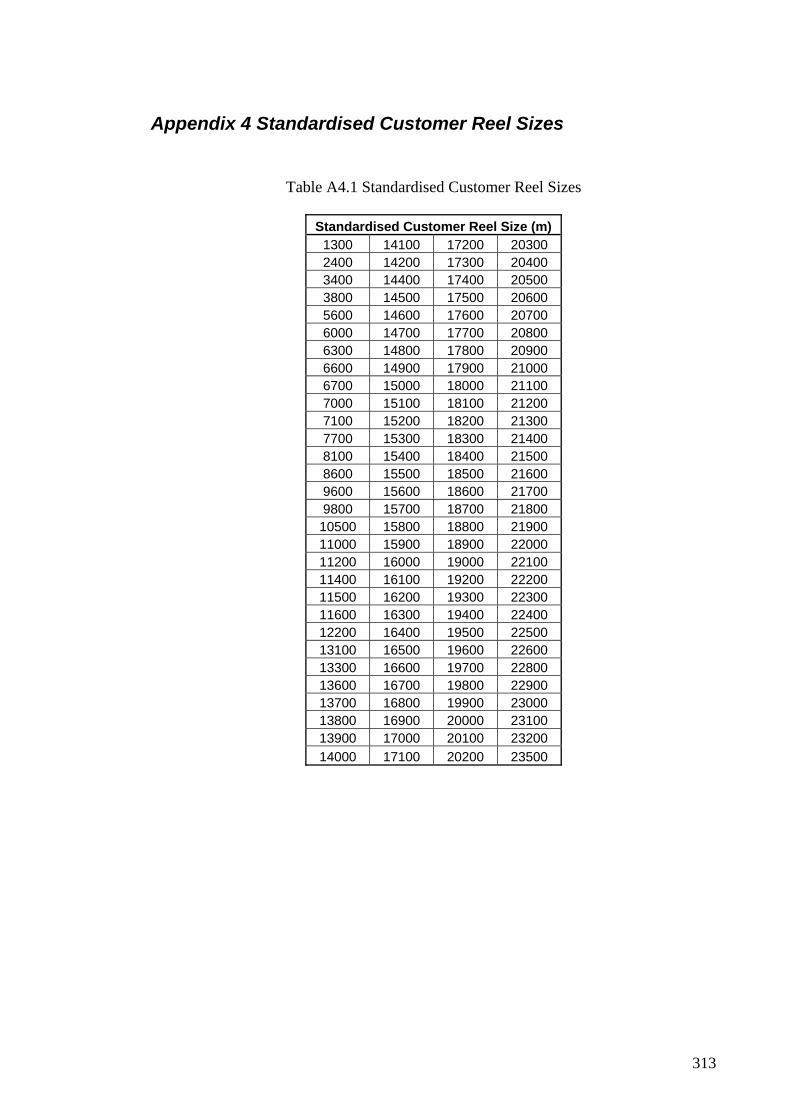
313
Appendix 4 Standardised Customer Reel Sizes
Table A4.1 Standardised Customer Reel Sizes
Standardised Customer Reel Size (m)
1300 14100 17200 20300 2400 14200 17300 20400 3400 14400 17400 20500 3800 14500 17500 20600 5600 14600 17600 20700 6000 14700 17700 20800 6300 14800 17800 20900 6600 14900 17900 21000 6700 15000 18000 21100 7000 15100 18100 21200 7100 15200 18200 21300 7700 15300 18300 21400 8100 15400 18400 21500 8600 15500 18500 21600 9600 15600 18600 21700 9800 15700 18700 21800 10500 15800 18800 21900 11000 15900 18900 22000 11200 16000 19000 22100 11400 16100 19200 22200 11500 16200 19300 22300 11600 16300 19400 22400 12200 16400 19500 22500 13100 16500 19600 22600 13300 16600 19700 22800 13600 16700 19800 22900 13700 16800 19900 23000 13800 16900 20000 23100 13900 17000 20100 23200 14000 17100 20200 23500

314
Appendix 5 Visual Basic Code – Reel Scheduling
<!DOCTYPE HTML PUBLIC "-//W3C//DTD HTML 4.0 Transitional//EN"> <HTML> <HEAD> <TITLE> New Document </TITLE> <META NAME="Generator" CONTENT="EditPlus"> <META NAME="Author" CONTENT=""> <META NAME="Keywords" CONTENT=""> <META NAME="Description" CONTENT=""> </HEAD> <BODY> <% s7=Int(request("T7")) s1=Int(request("T1")) s2=Int(request("T2")) s3=Int(request("T3")) s4=Int(request("T4")) s5=Int(request("T5")) if request("t6")<>empty then s6=Int(request("T6")) end if Set objConn = Server.CreateObject("ADODB.Connection") objConn.ConnectionString = "Provider=Microsoft.Jet.OLEDB.4.0;Data Source=" & Server.MapPath("anl.mdb") objConn.Open Set rs = Server.CreateObject("ADODB.Recordset") LeftLength=s7-(s1+s2+s3+s4+s5+s6) strSQL="select * from reel where [CustomerLength]<="&LeftLength rs.Open strSQL,objConn,1,3 if rs.eof then response.write "what are these sample numbers?? I can't find the rest in the database!" else tempNext=rs("CustomerLength") do while not rs.eof if leftlength>rs("CustomerLength") then tempNext=rs("CustomerLength") end if rs.movenext loop end if %> <form method="POST" action="default.asp"> <p>Total Jumbo <input type="text" name="T7" size="20" value=<%=s7%>><p>spec 1 <input type="text" name="T1" size="20" value=<%=s1%>><br> spec 2 <input type="text" name="T2" size="20" value=<%=s2%>><br> spec 3

315
<input type="text" name="T3" size="20" value=<%=s3%>><br> spec 4 <input type="text" name="T4" size="20" value=<%=s4%>><br> spec 5 <input type="text" name="T5" size="20" value=<%=s5%>><br> spec 6 <input type="text" name="T6" size="20" disabled=true value=<%=s6%>><p><p><input type="submit" value="Submit" name="B1"><input type="reset" value="Reset" name="B2"></p> </form> <% response.write "the left length on this jumbo is: " & int(leftlength) & "<br>" %> Your next avaliable reel size is: <%response.write tempNext%> </BODY> </HTML>
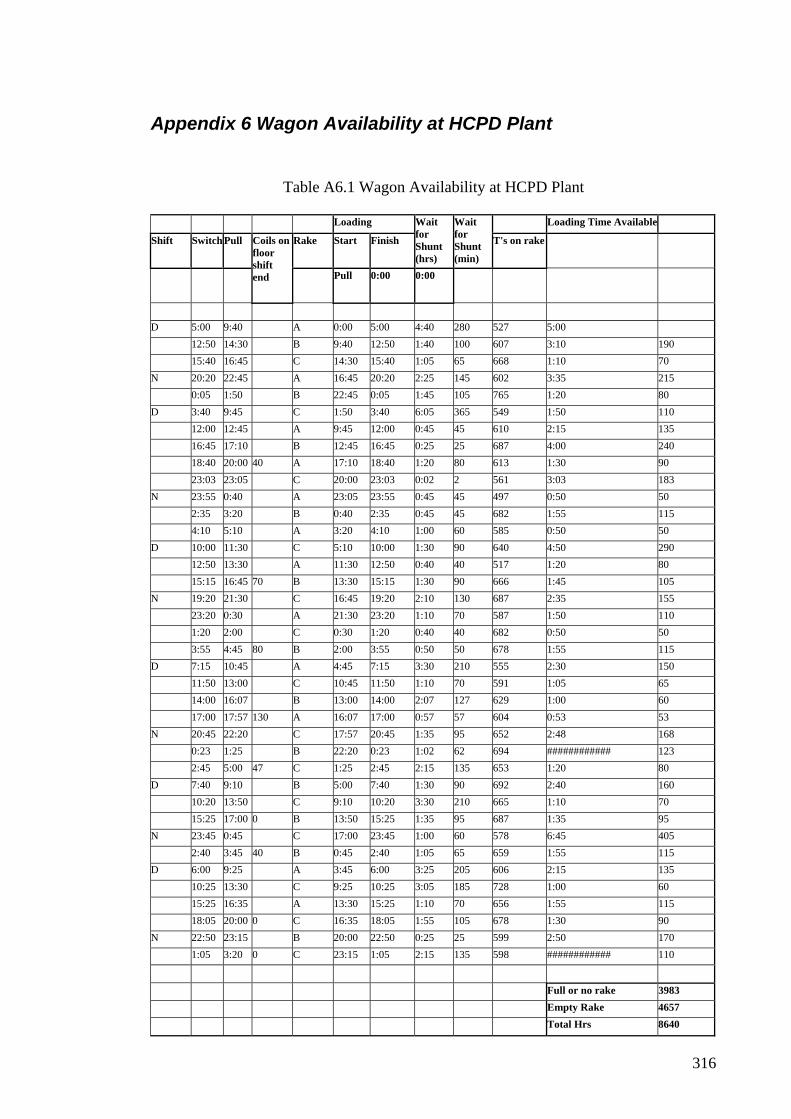
316
Appendix 6 Wagon Availability at HCPD Plant
Table A6.1 Wagon Availability at HCPD Plant
Loading Loading Time Available
Shift Switch Pull Rake Start Finish
Wait for Shunt (hrs)
Wait for Shunt (min)
T's on rake
Coils on floor shift end Pull 0:00 0:00
D 5:00 9:40 A 0:00 5:00 4:40 280 527 5:00 12:50 14:30 B 9:40 12:50 1:40 100 607 3:10 190 15:40 16:45 C 14:30 15:40 1:05 65 668 1:10 70 N 20:20 22:45 A 16:45 20:20 2:25 145 602 3:35 215 0:05 1:50 B 22:45 0:05 1:45 105 765 1:20 80 D 3:40 9:45 C 1:50 3:40 6:05 365 549 1:50 110 12:00 12:45 A 9:45 12:00 0:45 45 610 2:15 135 16:45 17:10 B 12:45 16:45 0:25 25 687 4:00 240 18:40 20:00 40 A 17:10 18:40 1:20 80 613 1:30 90 23:03 23:05 C 20:00 23:03 0:02 2 561 3:03 183 N 23:55 0:40 A 23:05 23:55 0:45 45 497 0:50 50 2:35 3:20 B 0:40 2:35 0:45 45 682 1:55 115 4:10 5:10 A 3:20 4:10 1:00 60 585 0:50 50 D 10:00 11:30 C 5:10 10:00 1:30 90 640 4:50 290 12:50 13:30 A 11:30 12:50 0:40 40 517 1:20 80 15:15 16:45 70 B 13:30 15:15 1:30 90 666 1:45 105 N 19:20 21:30 C 16:45 19:20 2:10 130 687 2:35 155 23:20 0:30 A 21:30 23:20 1:10 70 587 1:50 110 1:20 2:00 C 0:30 1:20 0:40 40 682 0:50 50 3:55 4:45 80 B 2:00 3:55 0:50 50 678 1:55 115 D 7:15 10:45 A 4:45 7:15 3:30 210 555 2:30 150 11:50 13:00 C 10:45 11:50 1:10 70 591 1:05 65 14:00 16:07 B 13:00 14:00 2:07 127 629 1:00 60 17:00 17:57 130 A 16:07 17:00 0:57 57 604 0:53 53 N 20:45 22:20 C 17:57 20:45 1:35 95 652 2:48 168 0:23 1:25 B 22:20 0:23 1:02 62 694 ############ 123 2:45 5:00 47 C 1:25 2:45 2:15 135 653 1:20 80 D 7:40 9:10 B 5:00 7:40 1:30 90 692 2:40 160 10:20 13:50 C 9:10 10:20 3:30 210 665 1:10 70 15:25 17:00 0 B 13:50 15:25 1:35 95 687 1:35 95 N 23:45 0:45 C 17:00 23:45 1:00 60 578 6:45 405 2:40 3:45 40 B 0:45 2:40 1:05 65 659 1:55 115 D 6:00 9:25 A 3:45 6:00 3:25 205 606 2:15 135 10:25 13:30 C 9:25 10:25 3:05 185 728 1:00 60 15:25 16:35 A 13:30 15:25 1:10 70 656 1:55 115 18:05 20:00 0 C 16:35 18:05 1:55 105 678 1:30 90 N 22:50 23:15 B 20:00 22:50 0:25 25 599 2:50 170 1:05 3:20 0 C 23:15 1:05 2:15 135 598 ############ 110
Full or no rake 3983 Empty Rake 4657 Total Hrs 8640

317