Cigarette Smoking and Human Gut Microbiota in Healthy Adults
Upload
independentCategory
view
4download
0
Regulatory Toxicology and Pharmacology 61 (2011) S13–S24
Contents lists available at ScienceDirect
Regulatory Toxicology and Pharmacology
journal homepage: www.elsevier .com/locate /yr tph
A study to evaluate the effect on Mouth Level Exposure and biomarkersof exposure estimates of cigarette smoke exposure following a forced switchto a lower ISO tar yield cigarette
Christopher J. Shepperd a,⇑, Alison C. Eldridge a, Graham Errington a, Michael Dixon b
a British American Tobacco, Group Research and Development, Southampton, UKb Dixon Consultancy, Liphook, UK
a r t i c l e i n f o a b s t r a c t
Article history:Available online 6 June 2011
Keywords:CigaretteSmokeExposureNicotineBiomarkersCarcinogenDoseFilter analysis
0273-2300/$ - see front matter � 2011 Elsevier Inc. Adoi:10.1016/j.yrtph.2011.05.011
⇑ Corresponding author. Address: British AmericanDevelopment, Regents Park Road, Millbrook, Southam(0) 23 8079 3076.
E-mail address: [email protected] (C.J. Shepp
A forced switch to a lower ISO tar yield cigarette was used in a clinical study, conducted in Germany, thatcompared two methods of estimating exposure to cigarette smoke. Pre- and post-switch estimates ofMouth Level Exposure (MLE) to nicotine, 4-(methylnitrosamino)-1-(3-pyridyl)-1-butanone (NNK), pyr-ene and acrolein were obtained by chemical analysis of spent cigarette filters for nicotine content. Sim-ilarly, pre- and post-switch estimates of uptake of these smoke constituents were achieved by analysis ofcorresponding urinary biomarkers of exposure (BoE): total nicotine equivalents; total 4-(methylnitrosa-mino)-1-(3-pyridyl)-1-butanol (NNAL); total 1-hydroxypyrene (1-OHP), and 3-hydroxypropyl-mercaptu-ric acid (3-HPMA), plus the nicotine metabolite cotinine, in plasma and saliva. Three hundred healthyvolunteers were recruited comprising 100 smokers of each of 9–10 and 4–6 mg ISO tar yield cigarettesand 50 smokers of 1–2 mg ISO tar yield cigarettes and 50 non-smokers. Fifty smokers of each of the 9–10 and 4–6 mg ISO tar yield cigarettes took part in the switching aspects of this study whilst the remain-ing smokers formed non-switching control groups who smoked their usual ISO tar yield cigarettethroughout the study. After 5 days, all subjects were admitted into a clinic where baseline measures ofMLE and BoE were obtained. The 10 mg switching group was then switched to the 4 mg ISO tar yield cig-arette and the 4 mg ISO tar yield switching group switched to the 1 mg cigarette. Subjects returned homefor 12 days, continuing to smoke the supplied cigarettes before being readmitted into the clinic wheresamples were collected for MLE and BoE analysis. Changes in daily exposure estimates were determinedon a group and individual basis for both methods. The pre- to post-switch directional changes in MLEsand their corresponding BoEs were generally consistent and the MLE/BoE relationship maintained.Switching to a lower yield cigarette generally resulted in reductions in exposure with the resultant expo-sure level being similar to that seen in regular smokers of the lower yield cigarette.
� 2011 Elsevier Inc. All rights reserved.
1. Introduction
The ability to estimate the exposure of smokers to cigarettesmoke constituents is critical for the assessment of changes in cig-arette design aimed at reducing smokers’ exposure to cigarettesmoke.
Biomarkers of exposure (BoE) to smoke constituents have beendeveloped and used in a number of smoke exposure studies. Theseinclude the measurement of the levels of nicotine in venous blood(Russell et al., 1980, 1986; Ebert et al., 1983; Gori and Lynch, 1985),cotinine in venous blood (Gori and Lynch, 1985; Bridges et al.,1990; Rosa et al., 1992), cotinine in saliva (Jarvis et al., 2001) and
ll rights reserved.
Tobacco, Group Research andpton SO15 8TL, UK. Fax: +44
erd).
multiple nicotine metabolites in urine (Byrd et al., 1998; Uedaet al., 2002). More recently studies have been conducted on themeasurement of BoE to cigarette smoke toxicants such as NNK(4-(methylnitrosamino)-1-(3-pyridyl)-1-butanone) and pyrene(Hecht et al., 2005; Benowitz et al., 2005; Scherer et al., 2007; Men-des et al., 2008, 2009; Shepperd et al., 2009), benzene (Schereret al., 2006, 2007; Mendes et al., 2008), acrolein (Scherer et al.,2006, 2007; Mendes et al., 2008; Shepperd et al., 2009), and 1,3-butadiene (Scherer et al., 2006; Mendes et al., 2009). Most of thebiomarker studies rely on the measurements of metabolites ofthe smoke constituent. Smokers may differ markedly in theirmetabolism of smoke constituents. Additionally, the commonlymeasured biomarkers have different elimination half-lives, somerelatively short e.g., nicotine, others relatively long e.g., NNAL (4-(methylnitrosamino)-1-(3-pyridyl)-1-butanol) (metabolite forNNK). Consequently, metabolism and half-life issues (where timesince exposure would affect biomarker level) may create problems
S14 C.J. Shepperd et al. / Regulatory Toxicology and Pharmacology 61 (2011) S13–S24
in attempting to assess exposure to cigarette smoke from metabo-lites in urine and saliva. However, problems caused by inter-sub-ject variability in metabolism can be minimised by using eachsubject as their own control during a cigarette brand-switch study.Elimination half-life problems can be minimised by providing suf-ficient durations of biomarker monitoring during the smoking ofthe pre- and post-switch cigarettes.
Another approach to estimating exposure to smoke constituentsis based on the analysis of spent cigarette filters. This method relieson the measurement of the nicotine or solanesol content of the fil-ter after smoking, and the relationships between nicotine orsolanesol in the filter and the levels of smoke constituents in main-stream smoke when the cigarette is smoked using a wide range ofmachine-smoking regimes. From these two pieces of information itis possible to estimate the amount of nicotine or other smoke con-stituent that exited the filter and entered the smoker’s mouth –Mouth Level Exposure (MLE). However, filter analysis methodsmay be limited in their ability to predict exposures of smoke con-stituents to, and absorption from, the respiratory tract as they donot take account of non-inhaled puffs, ‘mouth-spill’ post-puff inha-lation, exhalation patterns and differences in the respiratory reten-tion of individual smoke constituents. Filter analysis methods havepreviously been shown by a number of authors to provide goodestimates of MLE (St. Charles et al., 2006, 2010; Polzin et al.,2009; Shepperd et al., 2006, 2009; Ashley et al., 2010). Recently,in their review of cigarette filter based assays as proxies for smokeexposure Pauly et al. (2009) concluded that filter based methodsmay have utility as proxy measures of mouth level exposure inclinical studies.
The findings presented in this manuscript extend those previ-ously reported (Shepperd et al., 2009) which used data derivedfrom the same study. Our earlier paper focused on the primaryobjective of the study, which was to compare smokers’ MLEs andBoEs to specific cigarette smoke constituents as determined bythe use of both the filter analysis method (MLEs) and the analysisof biomarkers of exposure in blood, urine and saliva (BoEs). Wedemonstrated that these two exposure estimates were signifi-cantly correlated and we concluded that the measurement of MLEsby filter analysis may provide a simple and effective alternative toBoEs for estimating smokers’ exposure to smoke constituents. Thisearlier paper (Shepperd et al., 2009) used data from the controlgroups of smokers who smoked a brand of cigarette throughoutthe study with the same or similar ISO tar yield as their usual cig-arette (10, 4 or 1 mg ISO tar yield). However, this current report ad-dresses the data from two additional groups of smokers who wereswitched from their usual yield product (10 or 4 mg ISO tar) to alower ISO tar yield cigarette (4 or 1 mg ISO tar respectively) duringthe study. This switching aspect was incorporated into the studydesign in order to improve our understanding of the relationshipbetween MLEs and BoEs. The hypothesis underlying this approachwas that the switch from one ISO tar yield to a lower ISO tar yieldwould change smoke exposure. Upsetting the equilibrium or stea-dy state of smoke constituent exposure using an ISO tar yieldswitch allows the direction and magnitude of the measured changein exposure estimates from the two methods to be compared; ifthere is a change in exposure as a result of switching, is the direc-tion and magnitude of the change equally demonstrated by bothmethods?
The data presented here, which includes the previously pub-lished findings, allows both an examination of the influence ofISO tar yield on estimated exposure (Shepperd et al., 2009) andthe effect of a switch to lower ISO yield on estimated exposure.Whilst this was not the primary objective of the current study,the inclusion of the control groups means that the study designpermits comparisons to be made that contribute to this discussionon the relationship between ISO tar yield and exposure to cigarette
smoke constituents. In the previously reported aspects of thisstudy (Shepperd et al., 2009), smokers of lower yield cigarettesgenerally had lower levels of MLE and biomarkers than thosesmoking higher yield cigarettes. This second paper not only de-scribes any changes in exposure that might occur following ashort-term switch to a lower ISO yield cigarette but it is also pos-sible to compare levels of exposure seen in those smokers who didnot switch, or those who usually smoke the lower ISO yieldcigarette.
There have been a number of published studies on the effect ofswitching from higher to lower ISO/FTC yield cigarettes on expo-sure to nicotine (see Scherer, 1999). More recently there have beena few brand-switching studies on the exposure to nicotine andsmoke toxicants such as NNK and pyrene (Benowitz et al., 2005,2009; Mendes et al., 2008). Benowitz et al. (2005) reported smallreductions in blood cotinine and carboxyhaemoglobin levels ex-pressed on a per cigarette basis but no changes in the levels of bio-markers for NNK and pyrene when smokers switched from theirregular cigarette to one 50% lower in FTC nicotine yield for a periodof 1 week. A reduction in the levels of urinary nicotine metaboliteswas also reported by Mendes et al. (2008) when smokers switchedfrom their regular to lower yield cigarettes in the short (8 days)and long-term (24 weeks) phases of their study. However, in con-trast to the results of Benowitz et al. (2005), Mendes et al. also re-ported short and long-term reductions in the urinary biomarkersfor NNK and pyrene when smokers switched from a 15 to a 6 mgFTC tar yield cigarette. In their more recent paper, Benowitz et al.(2009) reported significant reductions in the levels of cotinine inplasma and NNAL and 2-naphthol in urine when smokers switchedfrom their usual brand (average yield of 1.05 mg nicotine) to a0.1 mg nicotine yield brand. However, no significant changes wereseen in these biomarkers when smokers switched from their usualbrand to a 0.6 mg nicotine yield brand. The switching aspect of ourstudy provides a source of additional information on the effect ofbrand-switching on smokers exposure to smoke constituents suchas NNK, pyrene and acrolein.
2. Materials and methods
2.1. Study design
Three hundred healthy volunteers were recruited into thestudy: 250 smokers and 50 non-smokers. The 250 smokers wereallocated to one of five groups according to the ISO tar yield of theirusual cigarette brand. Groups 1 and 2 each contained 50 smokersof 9–10 mg ISO tar yield cigarettes; groups 3 and 4 each contained50 smokers of 4–5 mg ISO tar yield cigarettes and group 5 con-tained 50 smokers of 1–2 mg ISO tar yield cigarettes. The 50 nonsmokers were assigned to group 6.
Three commercial brands of cigarettes were used for this study,yielding nominally 10, 4 and 1 mg ISO tar thereby spanning the fullrange of ISO tar yields legally available in Germany at the time ofthe study. Smokers were supplied with cigarettes of the same to-bacco blend style as their normal brand for the duration of thestudy and all smokers began the study on a similar ISO tar and nic-otine yield product to their usual brand. Although smokers wererequired to change to a single brand at the start of the study, inall cases the change was to a cigarette that was very similar inall respects to their usual brand, and subjects were given 5 daysacclimatisation on the supplied cigarettes before baseline mea-sures were taken. Any behavioural changes that may have re-mained would not have influenced the objectives of this studywhich were to determine whether the filter analysis and biomarkermethods would detect the same direction and magnitude of anyresultant change in exposure following a switch to a lower yieldcigarette.
C.J. Shepperd et al. / Regulatory Toxicology and Pharmacology 61 (2011) S13–S24 S15
Subject recruitment and all clinical aspects of this study wereconducted by MDS Pharma Services, Hamburg, Germany. To ensurecompliance, all study samples (biological samples and spent filters)were collected during the clinical periods only. Analyses of urinarybiomarkers were conducted by MDS Pharma Services laboratoriesin Sittingbourne, UK and Zurich, Switzerland. Analyses of plasmaand saliva biomarkers were conducted by Analytisch BiologischesForschungslabor GmbH, Munich, Germany. Cigarette filters wereanalysed by British American Tobacco, Group Research & Develop-ment (BAT GR&D), Southampton, UK.
The study protocol and informed consent forms were approvedby the Ethics Committee of the Ärztekammer Hamburg and theclinical study was conducted in accordance with the World Medi-cal Association Declaration of Helsinki (World Medical Association2004) and International Conference on Harmonisation (ICH)Guidelines for Good Clinical Practice (GCP) (International Confer-ence on Harmonisation 1996), current as at the date of the study.Based on a recommendation by MDS Pharma Services, which wasendorsed by the ethics committee, it was agreed that subjectswould be paid a stipend of 1500 Euros for their participation inthe study.
2.1.1. Control groupsThree of the five smoker subject groups were control groups
who smoked a single brand for the entire study. Group 1 smokedthe 10 mg ISO tar yield cigarette, Group 3 smoked the 4 mg ISOtar yield cigarette and Group 5 smoked the 1 mg ISO tar yield cig-arette. The results from these three groups have been reported anddiscussed previously (Shepperd et al., 2009). Some data from thesegroups are included here where they serve as non-switching con-trol groups and therefore provide a better understanding of anychanges that might occur in the two groups switching from higherto lower ISO tar yield cigarettes.
2.1.2. Switching groupsThe two remaining smoker groups began the study smoking the
supplied brand that was similar to their usual ISO tar and nicotineyield. They were then switched to a lower ISO tar and ISO nicotineyield cigarette for a period of 12 days. Group 2 started the studysmoking the 10 mg ISO tar yield cigarette before switching to the4 mg ISO tar yield cigarette. Group 4 started the study smokingthe 4 mg ISO tar yield cigarette before switching to the 1 mg ISOtar yield cigarette. These two groups of smokers are the main focusof this paper.
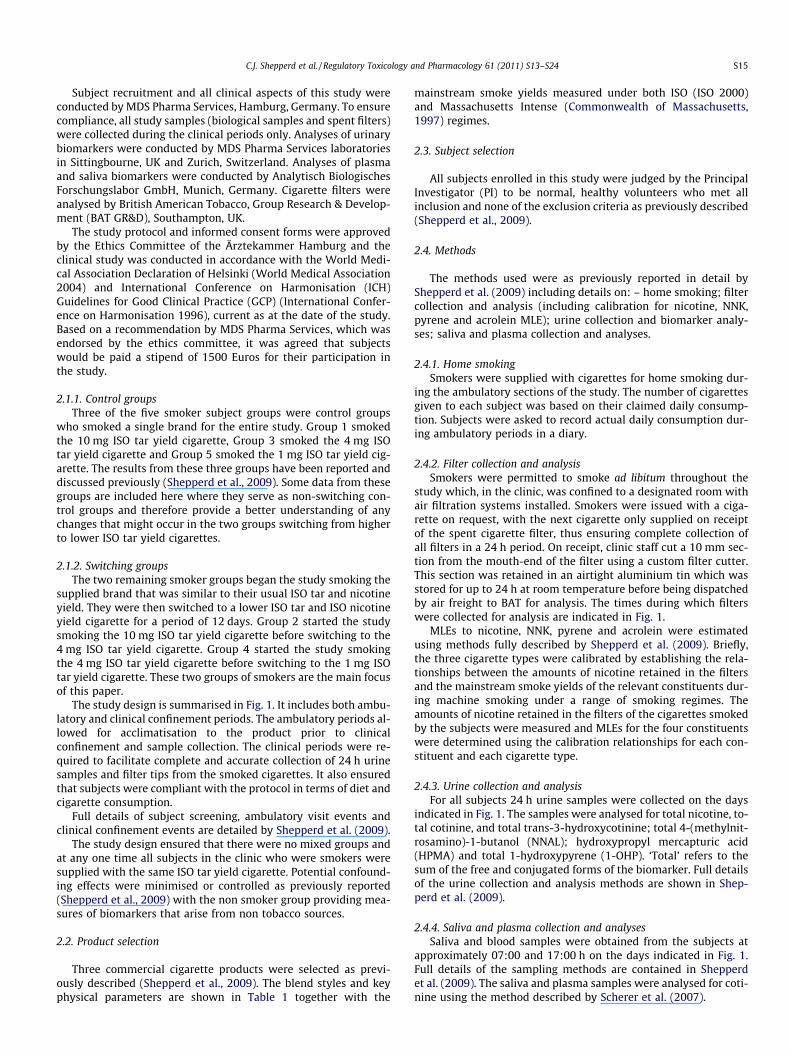
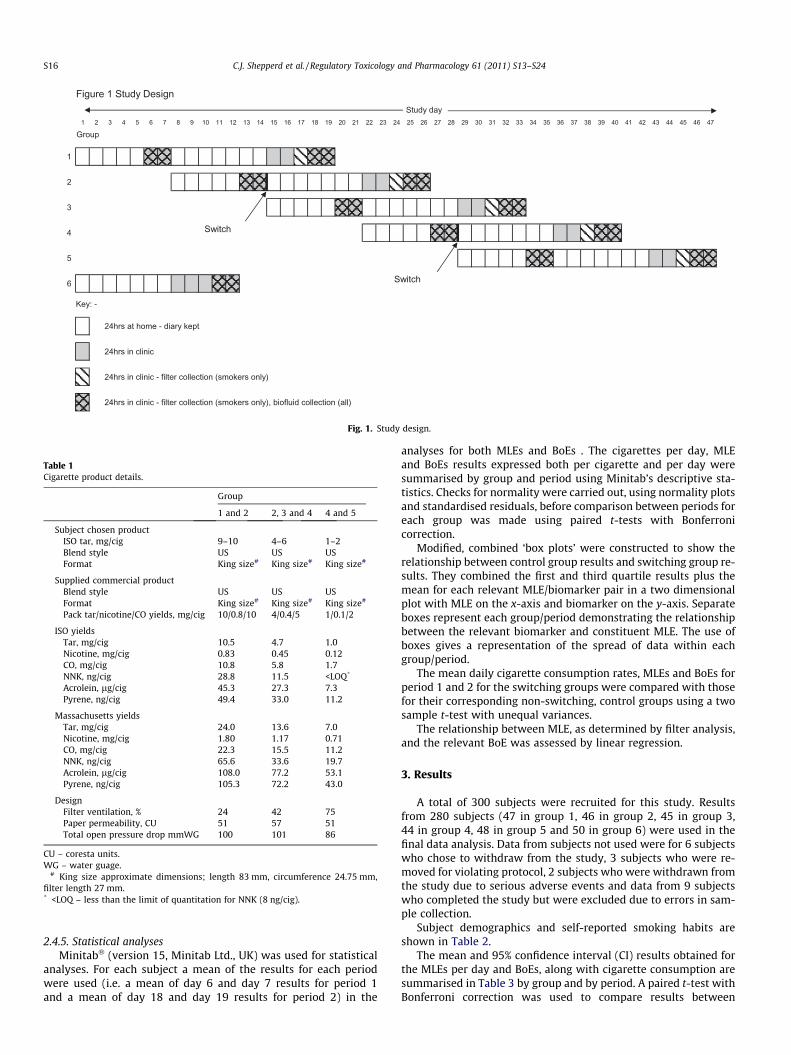
The study design is summarised in Fig. 1. It includes both ambu-latory and clinical confinement periods. The ambulatory periods al-lowed for acclimatisation to the product prior to clinicalconfinement and sample collection. The clinical periods were re-quired to facilitate complete and accurate collection of 24 h urinesamples and filter tips from the smoked cigarettes. It also ensuredthat subjects were compliant with the protocol in terms of diet andcigarette consumption.
Full details of subject screening, ambulatory visit events andclinical confinement events are detailed by Shepperd et al. (2009).
The study design ensured that there were no mixed groups andat any one time all subjects in the clinic who were smokers weresupplied with the same ISO tar yield cigarette. Potential confound-ing effects were minimised or controlled as previously reported(Shepperd et al., 2009) with the non smoker group providing mea-sures of biomarkers that arise from non tobacco sources.
2.2. Product selection
Three commercial cigarette products were selected as previ-ously described (Shepperd et al., 2009). The blend styles and keyphysical parameters are shown in Table 1 together with the
mainstream smoke yields measured under both ISO (ISO 2000)and Massachusetts Intense (Commonwealth of Massachusetts,1997) regimes.
2.3. Subject selection
All subjects enrolled in this study were judged by the PrincipalInvestigator (PI) to be normal, healthy volunteers who met allinclusion and none of the exclusion criteria as previously described(Shepperd et al., 2009).
2.4. Methods
The methods used were as previously reported in detail byShepperd et al. (2009) including details on: – home smoking; filtercollection and analysis (including calibration for nicotine, NNK,pyrene and acrolein MLE); urine collection and biomarker analy-ses; saliva and plasma collection and analyses.
2.4.1. Home smokingSmokers were supplied with cigarettes for home smoking dur-
ing the ambulatory sections of the study. The number of cigarettesgiven to each subject was based on their claimed daily consump-tion. Subjects were asked to record actual daily consumption dur-ing ambulatory periods in a diary.
2.4.2. Filter collection and analysisSmokers were permitted to smoke ad libitum throughout the
study which, in the clinic, was confined to a designated room withair filtration systems installed. Smokers were issued with a ciga-rette on request, with the next cigarette only supplied on receiptof the spent cigarette filter, thus ensuring complete collection ofall filters in a 24 h period. On receipt, clinic staff cut a 10 mm sec-tion from the mouth-end of the filter using a custom filter cutter.This section was retained in an airtight aluminium tin which wasstored for up to 24 h at room temperature before being dispatchedby air freight to BAT for analysis. The times during which filterswere collected for analysis are indicated in Fig. 1.
MLEs to nicotine, NNK, pyrene and acrolein were estimatedusing methods fully described by Shepperd et al. (2009). Briefly,the three cigarette types were calibrated by establishing the rela-tionships between the amounts of nicotine retained in the filtersand the mainstream smoke yields of the relevant constituents dur-ing machine smoking under a range of smoking regimes. Theamounts of nicotine retained in the filters of the cigarettes smokedby the subjects were measured and MLEs for the four constituentswere determined using the calibration relationships for each con-stituent and each cigarette type.
2.4.3. Urine collection and analysisFor all subjects 24 h urine samples were collected on the days
indicated in Fig. 1. The samples were analysed for total nicotine, to-tal cotinine, and total trans-3-hydroxycotinine; total 4-(methylnit-rosamino)-1-butanol (NNAL); hydroxypropyl mercapturic acid(HPMA) and total 1-hydroxypyrene (1-OHP). ‘Total’ refers to thesum of the free and conjugated forms of the biomarker. Full detailsof the urine collection and analysis methods are shown in Shep-perd et al. (2009).
2.4.4. Saliva and plasma collection and analysesSaliva and blood samples were obtained from the subjects at
approximately 07:00 and 17:00 h on the days indicated in Fig. 1.Full details of the sampling methods are contained in Shepperdet al. (2009). The saliva and plasma samples were analysed for coti-nine using the method described by Scherer et al. (2007).
1 2 53 4 6 7 8 9 10 11 12 13 14 15 16 17 18 19 20 21 22 23 24 25 26 27 28 29 30 31 32 33 34 35 36 37 38 39 40 41 42 43 44 45 46 47
Group
1
2
3
4
5
6
Key: -
24hrs at home - diary kept
24hrs in clinic
24hrs in clinic - filter collection (smokers only)
24hrs in clinic - filter collection (smokers only), biofluid collection (all)
Study day
Figure 1 Study Design
Switch
Switch
Fig. 1. Study design.
Table 1Cigarette product details.
Group
1 and 2 2, 3 and 4 4 and 5
Subject chosen productISO tar, mg/cig 9–10 4–6 1–2Blend style US US USFormat King size# King size# King size#
Supplied commercial productBlend style US US USFormat King size# King size# King size#
Pack tar/nicotine/CO yields, mg/cig 10/0.8/10 4/0.4/5 1/0.1/2
ISO yieldsTar, mg/cig 10.5 4.7 1.0Nicotine, mg/cig 0.83 0.45 0.12CO, mg/cig 10.8 5.8 1.7NNK, ng/cig 28.8 11.5 <LOQ*
Acrolein, lg/cig 45.3 27.3 7.3Pyrene, ng/cig 49.4 33.0 11.2
Massachusetts yieldsTar, mg/cig 24.0 13.6 7.0Nicotine, mg/cig 1.80 1.17 0.71CO, mg/cig 22.3 15.5 11.2NNK, ng/cig 65.6 33.6 19.7Acrolein, lg/cig 108.0 77.2 53.1Pyrene, ng/cig 105.3 72.2 43.0
DesignFilter ventilation, % 24 42 75Paper permeability, CU 51 57 51Total open pressure drop mmWG 100 101 86
CU – coresta units.WG – water guage.
# King size approximate dimensions; length 83 mm, circumference 24.75 mm,filter length 27 mm.* <LOQ – less than the limit of quantitation for NNK (8 ng/cig).
S16 C.J. Shepperd et al. / Regulatory Toxicology and Pharmacology 61 (2011) S13–S24
2.4.5. Statistical analysesMinitab� (version 15, Minitab Ltd., UK) was used for statistical
analyses. For each subject a mean of the results for each periodwere used (i.e. a mean of day 6 and day 7 results for period 1and a mean of day 18 and day 19 results for period 2) in the
analyses for both MLEs and BoEs . The cigarettes per day, MLEand BoEs results expressed both per cigarette and per day weresummarised by group and period using Minitab’s descriptive sta-tistics. Checks for normality were carried out, using normality plotsand standardised residuals, before comparison between periods foreach group was made using paired t-tests with Bonferronicorrection.
Modified, combined ‘box plots’ were constructed to show therelationship between control group results and switching group re-sults. They combined the first and third quartile results plus themean for each relevant MLE/biomarker pair in a two dimensionalplot with MLE on the x-axis and biomarker on the y-axis. Separateboxes represent each group/period demonstrating the relationshipbetween the relevant biomarker and constituent MLE. The use ofboxes gives a representation of the spread of data within eachgroup/period.
The mean daily cigarette consumption rates, MLEs and BoEs forperiod 1 and 2 for the switching groups were compared with thosefor their corresponding non-switching, control groups using a twosample t-test with unequal variances.
The relationship between MLE, as determined by filter analysis,and the relevant BoE was assessed by linear regression.
3. Results
A total of 300 subjects were recruited for this study. Resultsfrom 280 subjects (47 in group 1, 46 in group 2, 45 in group 3,44 in group 4, 48 in group 5 and 50 in group 6) were used in thefinal data analysis. Data from subjects not used were for 6 subjectswho chose to withdraw from the study, 3 subjects who were re-moved for violating protocol, 2 subjects who were withdrawn fromthe study due to serious adverse events and data from 9 subjectswho completed the study but were excluded due to errors in sam-ple collection.
Subject demographics and self-reported smoking habits areshown in Table 2.
The mean and 95% confidence interval (CI) results obtained forthe MLEs per day and BoEs, along with cigarette consumption aresummarised in Table 3 by group and by period. A paired t-test withBonferroni correction was used to compare results between
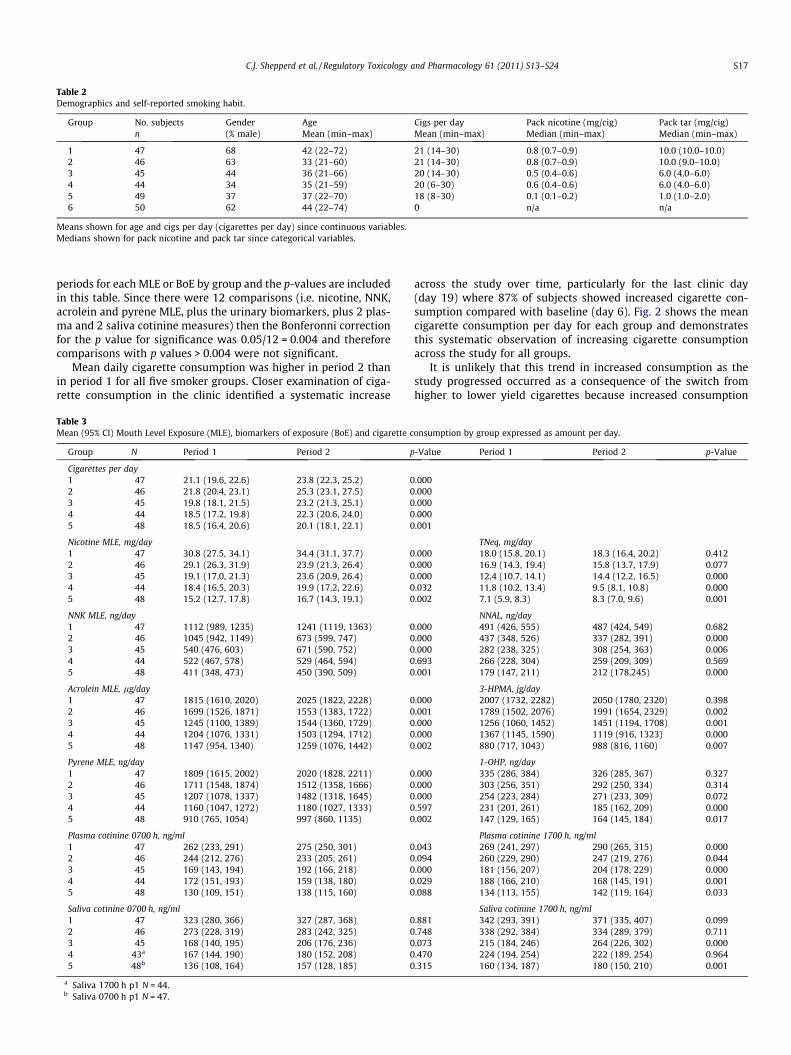
Table 2Demographics and self-reported smoking habit.
Group No. subjects Gender Age Cigs per day Pack nicotine (mg/cig) Pack tar (mg/cig)n (% male) Mean (min–max) Mean (min–max) Median (min–max) Median (min–max)
1 47 68 42 (22–72) 21 (14–30) 0.8 (0.7–0.9) 10.0 (10.0–10.0)2 46 63 33 (21–60) 21 (14–30) 0.8 (0.7–0.9) 10.0 (9.0–10.0)3 45 44 36 (21–66) 20 (14–30) 0.5 (0.4–0.6) 6.0 (4.0–6.0)4 44 34 35 (21–59) 20 (6–30) 0.6 (0.4–0.6) 6.0 (4.0–6.0)5 49 37 37 (22–70) 18 (8–30) 0.1 (0.1–0.2) 1.0 (1.0–2.0)6 50 62 44 (22–74) 0 n/a n/a
Means shown for age and cigs per day (cigarettes per day) since continuous variables.Medians shown for pack nicotine and pack tar since categorical variables.
C.J. Shepperd et al. / Regulatory Toxicology and Pharmacology 61 (2011) S13–S24 S17
periods for each MLE or BoE by group and the p-values are includedin this table. Since there were 12 comparisons (i.e. nicotine, NNK,acrolein and pyrene MLE, plus the urinary biomarkers, plus 2 plas-ma and 2 saliva cotinine measures) then the Bonferonni correctionfor the p value for significance was 0.05/12 = 0.004 and thereforecomparisons with p values > 0.004 were not significant.
Mean daily cigarette consumption was higher in period 2 thanin period 1 for all five smoker groups. Closer examination of ciga-rette consumption in the clinic identified a systematic increase
Table 3Mean (95% CI) Mouth Level Exposure (MLE), biomarkers of exposure (BoE) and cigarette c
Group N Period 1 Period 2 p
Cigarettes per day1 47 21.1 (19.6, 22.6) 23.8 (22.3, 25.2) 02 46 21.8 (20.4, 23.1) 25.3 (23.1, 27.5) 03 45 19.8 (18.1, 21.5) 23.2 (21.3, 25.1) 04 44 18.5 (17.2, 19.8) 22.3 (20.6, 24.0) 05 48 18.5 (16.4, 20.6) 20.1 (18.1, 22.1) 0
Nicotine MLE, mg/day1 47 30.8 (27.5, 34.1) 34.4 (31.1, 37.7) 02 46 29.1 (26.3, 31.9) 23.9 (21.3, 26.4) 03 45 19.1 (17.0, 21.3) 23.6 (20.9, 26.4) 04 44 18.4 (16.5, 20.3) 19.9 (17.2, 22.6) 05 48 15.2 (12.7, 17.8) 16.7 (14.3, 19.1) 0
NNK MLE, ng/day1 47 1112 (989, 1235) 1241 (1119, 1363) 02 46 1045 (942, 1149) 673 (599, 747) 03 45 540 (476, 603) 671 (590, 752) 04 44 522 (467, 578) 529 (464, 594) 05 48 411 (348, 473) 450 (390, 509) 0
Acrolein MLE, lg/day1 47 1815 (1610, 2020) 2025 (1822, 2228) 02 46 1699 (1526, 1871) 1553 (1383, 1722) 03 45 1245 (1100, 1389) 1544 (1360, 1729) 04 44 1204 (1076, 1331) 1503 (1294, 1712) 05 48 1147 (954, 1340) 1259 (1076, 1442) 0
Pyrene MLE, ng/day1 47 1809 (1615, 2002) 2020 (1828, 2211) 02 46 1711 (1548, 1874) 1512 (1358, 1666) 03 45 1207 (1078, 1337) 1482 (1318, 1645) 04 44 1160 (1047, 1272) 1180 (1027, 1333) 05 48 910 (765, 1054) 997 (860, 1135) 0
Plasma cotinine 0700 h, ng/ml1 47 262 (233, 291) 275 (250, 301) 02 46 244 (212, 276) 233 (205, 261) 03 45 169 (143, 194) 192 (166, 218) 04 44 172 (151, 193) 159 (138, 180) 05 48 130 (109, 151) 138 (115, 160) 0
Saliva cotinine 0700 h, ng/ml1 47 323 (280, 366) 327 (287, 368) 02 46 273 (228, 319) 283 (242, 325) 03 45 168 (140, 195) 206 (176, 236) 04 43a 167 (144, 190) 180 (152, 208) 05 48b 136 (108, 164) 157 (128, 185) 0
a Saliva 1700 h p1 N = 44.b Saliva 0700 h p1 N = 47.
across the study over time, particularly for the last clinic day(day 19) where 87% of subjects showed increased cigarette con-sumption compared with baseline (day 6). Fig. 2 shows the meancigarette consumption per day for each group and demonstratesthis systematic observation of increasing cigarette consumptionacross the study for all groups.
It is unlikely that this trend in increased consumption as thestudy progressed occurred as a consequence of the switch fromhigher to lower yield cigarettes because increased consumption
onsumption by group expressed as amount per day.
-Value Period 1 Period 2 p-Value
.000
.000
.000
.000
.001
TNeq, mg/day.000 18.0 (15.8, 20.1) 18.3 (16.4, 20.2) 0.412.000 16.9 (14.3, 19.4) 15.8 (13.7, 17.9) 0.077.000 12.4 (10.7, 14.1) 14.4 (12.2, 16.5) 0.000.032 11.8 (10.2, 13.4) 9.5 (8.1, 10.8) 0.000.002 7.1 (5.9, 8.3) 8.3 (7.0, 9.6) 0.001
NNAL, ng/day.000 491 (426, 555) 487 (424, 549) 0.682.000 437 (348, 526) 337 (282, 391) 0.000.000 282 (238, 325) 308 (254, 363) 0.006.693 266 (228, 304) 259 (209, 309) 0.569.001 179 (147, 211) 212 (178,245) 0.000
3-HPMA, jg/day.000 2007 (1732, 2282) 2050 (1780, 2320) 0.398.001 1789 (1502, 2076) 1991 (1654, 2329) 0.002.000 1256 (1060, 1452) 1451 (1194, 1708) 0.001.000 1367 (1145, 1590) 1119 (916, 1323) 0.000.002 880 (717, 1043) 988 (816, 1160) 0.007
1-OHP, ng/day.000 335 (286, 384) 326 (285, 367) 0.327.000 303 (256, 351) 292 (250, 334) 0.314.000 254 (223, 284) 271 (233, 309) 0.072.597 231 (201, 261) 185 (162, 209) 0.000.002 147 (129, 165) 164 (145, 184) 0.017
Plasma cotinine 1700 h, ng/ml.043 269 (241, 297) 290 (265, 315) 0.000.094 260 (229, 290) 247 (219, 276) 0.044.000 181 (156, 207) 204 (178, 229) 0.000.029 188 (166, 210) 168 (145, 191) 0.001.088 134 (113, 155) 142 (119, 164) 0.033
Saliva cotinine 1700 h, ng/ml.881 342 (293, 391) 371 (335, 407) 0.099.748 338 (292, 384) 334 (289, 379) 0.711.073 215 (184, 246) 264 (226, 302) 0.000.470 224 (194, 254) 222 (189, 254) 0.964.315 160 (134, 187) 180 (150, 210) 0.001
191876
28
26
24
22
20
18
16
DAY
Cigs
per
day
(mea
n)
12345
GroupDaily Cigarette Consumption
Fig. 2. Daily cigarette consumption by group and day.
Table 5A comparison of mean daily exposure data for group 4 (4–1 mg switchers) relative togroup 3 (4 mg control group) before (period 1) and after switching (period 2).
Period 1 (%) Period 2 (%)
Cig consumption �6.6 �3.8Nicotine MLE �3.5 �15.7TNeq �4.8 �34.1***
Plasma cotinine 0700 +2.2 �17.0Plasma cotinine 1700 +3.7 �17.5*
Saliva cotinine 0700 �0.7 �12.5Saliva cotinine 1700 +4.2 �16.2NNK MLE �3.2 �21.2**
NNAL �5.6 �16.0Acrolein MLE �3.3 �2.73-HPMA +8.8 �22.9*
Pyrene MLE �3.9 �20.4**
1-OHP �8.9 �31.6***
Note: Group 4 mean values expressed as a % of group 3 mean values.* p < 0.05 for comparison of group 3 and 4 mean values – two sample t-test
(unequal variances).** p < 0.01 for comparison of group 3 and 4 mean values – two sample t-test
(unequal variances).*** p < 0.001 for comparison of group 3 and 4 mean values – two sample t-test
(unequal variances).
S18 C.J. Shepperd et al. / Regulatory Toxicology and Pharmacology 61 (2011) S13–S24
was also observed in the non-switching groups. It is possible thatthis increase was due to the subjects becoming more at ease withthe experimental procedures as the study progressed. Although notreported, a similar level of increase in cigarette consumptionon the last day was seen in a previous clinical study with a simi-lar experimental design (St. Charles et al., 2006; personalcommunication).
One data analysis approach to minimising the possible effect ofthe experimental conditions causing an increase in daily cigaretteconsumption from the start to the end of the study, thereby influ-encing the mean exposure per day data, is to express mean expo-sure per day data for the switching groups relative to theappropriate control groups for periods 1 and 2 of the study. Thedaily exposures for group 2 relative to group 1 are show in Table4, and those for group 4 relative to group 3 are shown in Table 5.
During period 1 both the control (group 1) and switching group(group 2) smoked the 10 mg tar yield product. The mean dailyexposure levels were marginally lower for group 2 than for group1 during this period. However, none of these differences were sta-tistically significant (p > 0.05 for all comparisons). Switching fromthe 10 to the 4 mg product resulted in mean values for group 2being considerably lower than those for group 1 for most of theexposure parameters. These differences were statistically signifi-cant for nicotine, NNK, acrolein and pyrene MLEs (p < 0.001 in all
Table 4A comparison of mean daily exposure data for group 2 (10–4 mg switchers) relative togroup 1 (10 mg control group) before (period 1) and after switching (period 2).
Period 1 (%) Period 2 (%)
Cig consumption +3.0 +6.2Nicotine MLE �5.6 �30.6***
TNeq �6.1 �13.5Plasma cotinine 0700 �6.8 �15.3*
Plasma cotinine 1700 �3.5 �14.8*
Saliva cotinine 0700 �15.3 �13.4Saliva cotinine 1700 �1.2 �9.9NNK MLE �6.0 �45.8***
NNAL �11.0 �30.8***
Acrolein MLE �6.4 �23.3***
3-HPMA �10.8 �2.9Pyrene MLE �5.4 �25.1***
1-OHP �9.5 �10.5
Note: Group 2 mean values expressed as a % of group 1 mean values.* p < 0.05 for comparison of group 1 and 2 mean values – two sample t-test(unequal variances).*** p < 0.001 for comparison of group 1 and 2 mean values – two sample t-test(unequal variances).
cases), total NNAL (p < 0.001) and both measures of plasma coti-nine (p < 0.05 for both).
A similar pattern to the one described above was observedwhen the group 4 (switchers from 4 to 1 mg product) and group3 (4 mg control group) mean daily exposure data were compared(Table 5). There were marginal and statistically insignificant differ-ences (p > 0.05 for all comparisons) in the MLEs and BoEs betweenthe two groups during period 1 when both groups smoked the4 mg product. However, in period 2 the mean MLEs and BoEs forthe switchers were consistently lower that of the control groupexcept for acrolein MLE. These differences were statistically signif-icant for NNK and pyrene MLEs (p < 0.01 for both), TNeq and 1-OHP(p < 0.001 for both), 3-HPMA and plasma cotinine 1700 h (p < 0.05for both). The difference in nicotine MLE just failed to reach signif-icance at the 95% level.
The exposure data can also be expressed on a per cigarette ba-sis. The MLE data were initially measured on a per cigarette basisand were converted to MLE per day by multiplying with daily cig-arette consumption. However, the urinary biomarker data reflectdaily exposure. Hence exposure per cigarette values were obtainedby simply dividing the BoE values by the corresponding cigaretteconsumption value. The exposure per cigarette data are summa-rised in Table 6 and paired t-tests with Bonferroni correction usedto provide p values. Again, as with Table 3, p < 0.004 are required toindicate a significant difference.
Comparing MLE estimates for periods 1 and 2, there were nosignificant differences (p > 0.004) for the control groups 1 and 5while control group 3 showed barely significant increases (p =0.003) for nicotine, NNK, acrolein and pyrene. Significant reduc-tions in levels of BoEs were found for the 10 mg control group(group 1) for TNeq, NNAL, 3-HPMA and 1-OHP but no change inplasma or saliva cotinine. There were no significant differences inany BoEs for either of the other two control groups.
In contrast, switching from the 10 to the 4 mg cigarette (i.e.group 2) produced significant reductions in all MLEs per cigarettefor nicotine, NNK, acrolein and pyrene. There were also significantreductions in the levels of BoEs per cigarette for TNeq, NNAL, 1-OHP, plasma cotinine, and saliva cotinine 1700 h. There were nosignificant changes in the levels of 3-HPMA or saliva cotinine0700 h.
Switching from the 4 to the 1 mg cigarette (i.e. group 4) pro-duced statistically significant reductions in all the measured MLEsper cigarette except acrolein MLE. Significant reductions following
Table 6Mean (95% CI) Mouth Level Exposure (MLE) and Biomarkers of exposure (BoE) by group and period expressed as amount per cigarette.
Group N Period 1 Period 2 p-Value Period 1 Period 2 p-Value
Nicotine MLE, mg/cig TNeq, mg/cig1 47 1.44 (1.35, 1.54) 1.44 (1.35, 1.52) 0.537 0.84 (0.76, 0.92) 0.77 (0.71, 0.84) 0.0022 46 1.33 (1.24, 1.41) 0.94 (0.89, 1.00) 0.000 0.76 (0.66, 0.85) 0.62 (0.56, 0.68) 0.0003 45 0.95 (0.88, 1.03) 1.00 (0.92, 1.08) 0.003 0.62 (0.54, 0.69) 0.60 (0.54, 0.66) 0.3014 44 0.98 (0.92, 1.04) 0.88 (0.80, 0.95) 0.000 0.62 (0.56, 0.69) 0.42 (0.37, 0.46) 0.0005 48 0.80 (0.73, 0.86) 0.81 (0.74, 0.87) 0.509 0.38 (0.33, 0.43) 0.41 (0.36, 0.45) 0.272
NNK MLE, ng/cig NNAL, ng/cig1 47 52.1 (48.6, 55.6) 51.8 (48.5, 55.0) 0.537 22.9 (20.6, 25.2) 20.3 (18.2, 22.3) 0.0002 46 47.7 (44.5, 50.8) 26.6 (24.8, 28.3) 0.000 19.8 (16.0, 23.6) 13.3 (11.6, 15.0) 0.0003 45 26.9 (24.5, 29.2) 28.4 (25.9, 30.8) 0.003 14.0 (12.1, 16.0) 12.8 (11.1, 14.5) 0.0074 44 27.7 (25.9, 29.5) 23.3 (21.6, 25.0) 0.000 14.0 (12.4, 15.6) 11.3 (9.7, 12.9) 0.0005 48 21.6 (20.1, 23.1) 21.8 (20.4, 23.3) 0.509 9.7 (8.1, 11.3) 10.5 (9.2, 11.8) 0.158
Acrolein MLE, lg/cig 3-HPMA, lg/cig1 47 85.0 (79.0, 91.0) 84.5 (78.9, 90.0) 0.537 92.6 (83.3, 101.9) 85.4 (76.3, 94.5) 0.0032 46 77.4 (72.0, 82.8) 61.3 (57.4, 65.2) 0.000 80.0 (69.3, 90.6) 76.2 (67.7, 84.8) 0.0473 45 62.0 (56.7, 67.2) 65.3 (59.8, 70.9) 0.003 62.5 (54.3, 70.6) 59.3 (51.8, 66.8) 0.0904 44 63.9 (59.7, 68.0) 66.0 (60.1, 71.9) 0.181 71.4 (62.5, 80.3) 48.6 (42.2, 55.0) 0.0005 48 59.9 (54.7, 65.2) 60.7 (55.5, 65.8) 0.509 46.4 (40.6, 52.1) 47.4 (41.6, 53.1) 0.630
Pyrene MLE, ng/cig 1-OHP, ng/cig1 47 84.8 (79.4, 90.2) 84.3 (79.4, 89.3) 0.537 15.6 (13.8, 17.3) 13.8 (12.3, 15.3) 0.0002 46 78.0 (73.2, 82.8) 59.8 (56.7, 62.8) 0.000 13.7 (11.8, 15.6) 11.6 (10.3, 12.9) 0.0003 45 60.3 (56.1, 64.4) 62.9 (58.5, 67.3) 0.003 13.3 (11.5, 15.0) 11.8 (10.6, 13.0) 0.0034 44 61.7 (58.5, 65.0) 51.9 (47.8, 56.0) 0.000 12.5 (11.2, 13.8) 8.4 (7.5, 9.2) 0.0005 48 47.7 (44.1, 51.4) 48.3 (44.7, 51.8) 0.509 8.5 (7.5, 9.5) 8.6 (7.6, 9.6) 0.877
Plasma cotinine 0700 h, ng/ml/cig Plasma cotinine 1700 h, ng/ml/cig1 47 12.4 (11.4, 13.5) 11.7 (10.7, 12.8) 0.032 12.8 (11.8, 13.8) 12.4 (11.4, 13.4) 0.1842 46 11.1 (9.8, 12.4) 9.3 (8.4, 10.3) 0.000 11.8 (10.6, 13.0) 9.9 (9.0, 10.8) 0.0003 45 8.6 (7.3, 9.9) 8.4 (7.3, 9.5) 0.509 9.1 (7.9, 10.3) 8.9 (7.8, 10.0) 0.2484 44 9.3 (8.3, 10.2) 7.2 (6.3, 8.0) 0.000 10.1 (9.1, 11.0) 7.5 (6.7, 8.3) 0.0005 48 6.9 (6.1, 7.7) 6.8 (5.8, 7.8) 0.552 7.1 (6.4, 7.8) 6.9 (6.1, 7.7) 0.317
Saliva cotinine 0700 h, ng/ml/cig Saliva cotinine 1700 h, ng/ml/cig1 47 15.2 (13.5, 16.9) 13.8 (12.3, 15.3) 0.021 16.0 (14.2, 17.7) 15.9 (14.4, 17.4) 0.7862 46 12.3 (10.5, 14.1) 11.2 (9.8, 12.6) 0.009 15.3 (13.5, 17.1) 13.2 (11.7, 14.7) 0.0003 45 8.4 (7.0, 9.7) 9.0 (7.7, 10.2) 0.194 10.8 (9.3, 12.2) 11.5 (10.0, 13.0) 0.0524 43a 8.9 (7.8, 10.0) 8.1 (7.0, 9.1) 0.009 11.9 (10.5, 13.4) 9.9 (8.6, 11.1) 0.0005 48b 7.0 (5.9, 8.1) 7.6 (6.4, 8.8) 0.032 8.4 (7.5, 9.3) 8.8 (7.7, 9.9) 0.221
a Saliva 1700 h p1 N = 44.b Saliva 0700 h p1 N = 47.
C.J. Shepperd et al. / Regulatory Toxicology and Pharmacology 61 (2011) S13–S24 S19
the switch to the 1 mg cigarette were also observed for all of theBoEs per cigarette except salivary cotinine 0700 h.
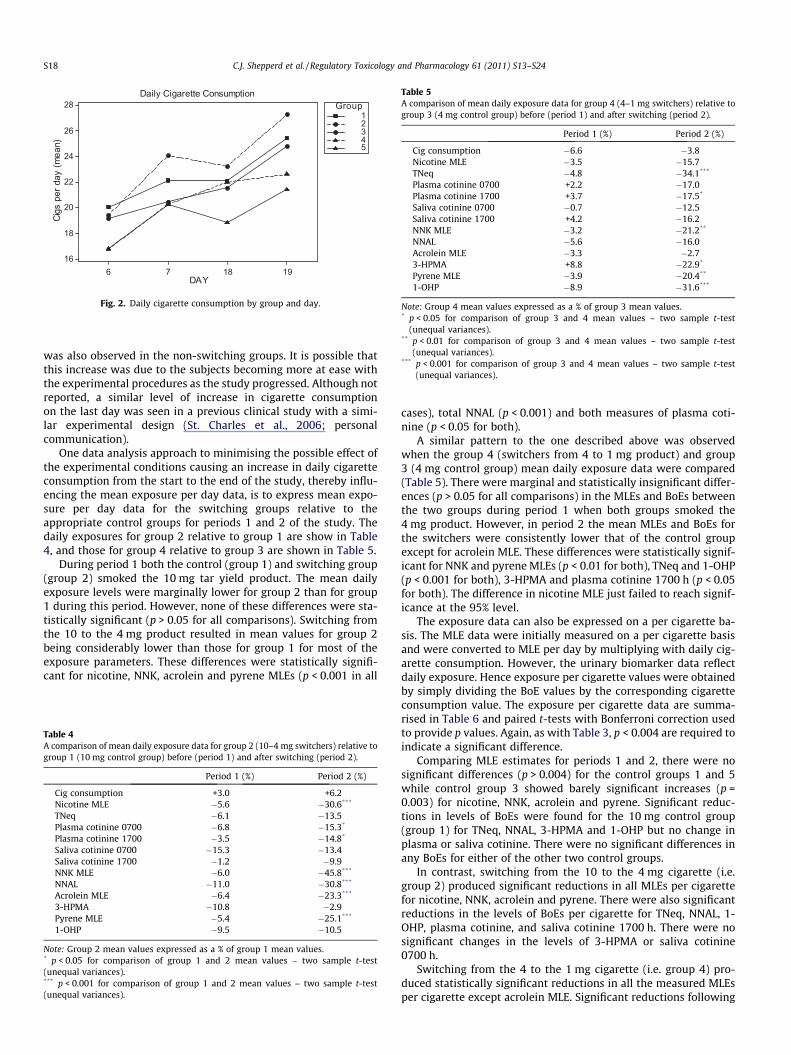
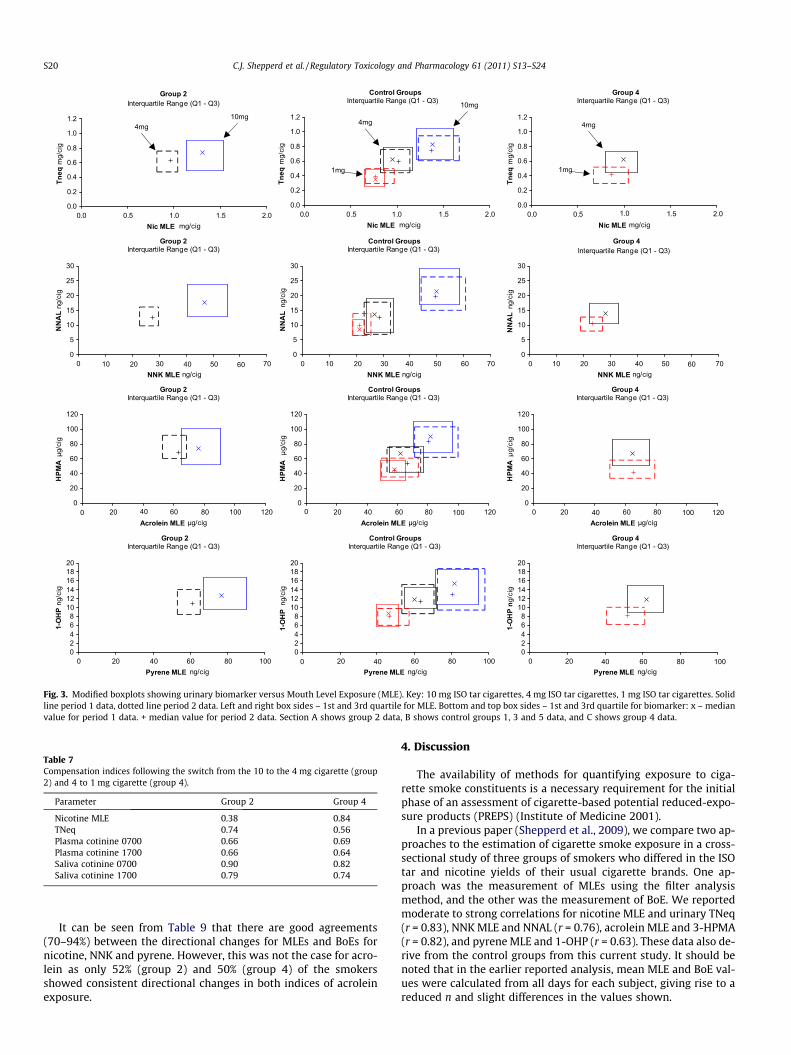
The effects of switching brand on both MLE and BoE results percigarette are also shown in Fig. 3, where modified, 2-dimensional,box plots show the boundaries of the central 50% of data and themedian for each group/period combining relevant MLE and urinaryBoE pairs.
The nicotine MLE and nicotine biomarker data from groups 2and 4 were used to determine the degrees of compensation thatoccurred following the switch from higher to lower ISO yield ciga-rettes. The following equation was used to determine the compen-sation index (CIx) (from Scherer, 1999):
CIx ¼ 1 � ½ð% changeinexposuremarkerfornicotineÞ=ð% changeinnicotineISOyieldÞ�
Nicotine MLE, TNeq, plasma and saliva cotinine values wereused as nicotine exposure markers and % changes in ISO nicotineyields of �45.8% (group 2) and �73.3% (group 4) were used to de-rive the CIx values shown in Table 7.
The calculated CIx values were less than one but greater thanzero in each case indicating partial compensation following thebrand switches in both groups 2 and 4. The degree of partialcompensation differed according to the nicotine exposure markerused in the calculations. For the biomarkers of nicotine exposure,saliva cotinine produced the highest CIx value in both groups. Nic-otine MLE produced a CIx that was lower than those calculated
using the biomarkers of nicotine exposure for the group 2 smokers.However, this was not the case for the group 4 smokers as nicotineMLE produced a higher CIx than the biomarkers of nicotineexposure.
Previously (Shepperd et al., 2009) a regression analysis was usedto assess the correlation between BoE and MLE. The results of a sim-ilar analysis of the per cigarette results comparing control groups toswitching groups and splitting the switching groups into pre-switch(period 1) and post-switch (period 2) are shown in Table 8.
The regression analysis again shows strong positive linear rela-tionships across all comparisons for control groups and switchinggroups, both pre and post-switch, with p < 0.001 for slope in allcases. The slopes and intercepts are similar comparing the sameMLE/biomarker pairs with the slope and confidence interval forthe control groups falling within the confidence interval for theswitching results. The Pearson correlation coefficient, r, is also sim-ilar between control and switching groups for the relevant pairs.The only exception to this is the 3-HPMA/acrolein MLE pair wherethe intercept post-switch has decreased such that the 95% confi-dence intervals for the mean control group slope does not lie en-tirely within the interval for the post-switching results.
A key aspect of the study design is that subjects in groups 2 and4 can be used as their own control by comparing directionalchanges in their MLEs with those of their corresponding BoEs fol-lowing the switch from higher to lower yield cigarettes.
Table 9 summarises the directional changes in each MLE andBoE pair following the switch from higher to lower yield cigarettesin groups 2 and 4.
Group 2Interquartile Range (Q1 - Q3)
0.0
0.2
0.4
0.6
0.8
1.0
1.2
0.0 0.5 1.0 1.5 2.0Nic MLE mg/cig
Tneq
mg/
cig
Control GroupsInterquartile Range (Q1 - Q3)
0.0
0.2
0.4
0.6
0.8
1.0
1.2
0. . .5 2.0Nic MLE mg/cig
Tneq
mg/
cig
Group 4Interquartile Range (Q1 - Q3)
0.0
0.2
0.4
0.6
0.8
1.0
1.2
Nic MLE mg/cig
Tneq
mg/
cig
Group 2Interquartile Range (Q1 - Q3)
0
5
10
15
20
25
30
NNK MLE ng/cig
NN
AL
ng/c
ig
Control GroupsInterquartile Range (Q1 - Q3)
0
5
10
15
20
25
30
NNK MLE ng/cig
NN
AL
ng/c
ig
Group 4Interquartile Range (Q1 - Q3)
0
5
10
15
20
25
30
NNK MLE ng/cig
NN
AL
ng/c
ig
Group 2Interquartile Range (Q1 - Q3)
0
20
40
60
80
100
120
Acrolein MLE µg/cig
HPM
A µ
g/ci
g
Control GroupsInterquartile Range (Q1 - Q3)
0
20
40
60
80
100
120
Acrolein MLE µg/cig
HPM
A µ
g/ci
g
Group 4Interquartile Range (Q1 - Q3)
0
20
40
60
80
100
120
Acrolein MLE µg/cig
HPM
A µ
g/ci
g
Group 2Interquartile Range (Q1 - Q3)
02468
101214161820
Pyrene MLE ng/cig
1-O
HP
ng/c
ig
Control GroupsInterquartile Range (Q1 - Q3)
02468
101214161820
Pyrene MLE ng/cig
1-O
HP
ng/c
ig
Group 4Interquartile Range (Q1 - Q3)
02468
101214161820
0 .5 10 0 1 0.0 0.5 1.0 1.5 2.0
0 10 20 30 40 50 60 70 0 10 20 30 40 50 60 70 0 10 20 30 40 50 60 70
0 20 40 60 80 100 120 0 20 40 60 80 100 120 0 20 40 60 80 100 120
0 20 40 60 80 100 0 20 40 60 80 100 0 20 40 60 80 100Pyrene MLE ng/cig
1-O
HP
n g/c
ig
10mg 10mg
1mg
4mg 4mg 4mg
1mg
Fig. 3. Modified boxplots showing urinary biomarker versus Mouth Level Exposure (MLE). Key: 10 mg ISO tar cigarettes, 4 mg ISO tar cigarettes, 1 mg ISO tar cigarettes. Solidline period 1 data, dotted line period 2 data. Left and right box sides – 1st and 3rd quartile for MLE. Bottom and top box sides – 1st and 3rd quartile for biomarker: x – medianvalue for period 1 data. + median value for period 2 data. Section A shows group 2 data, B shows control groups 1, 3 and 5 data, and C shows group 4 data.
Table 7Compensation indices following the switch from the 10 to the 4 mg cigarette (group2) and 4 to 1 mg cigarette (group 4).
Parameter Group 2 Group 4
Nicotine MLE 0.38 0.84TNeq 0.74 0.56Plasma cotinine 0700 0.66 0.69Plasma cotinine 1700 0.66 0.64Saliva cotinine 0700 0.90 0.82Saliva cotinine 1700 0.79 0.74
S20 C.J. Shepperd et al. / Regulatory Toxicology and Pharmacology 61 (2011) S13–S24
It can be seen from Table 9 that there are good agreements(70–94%) between the directional changes for MLEs and BoEs fornicotine, NNK and pyrene. However, this was not the case for acro-lein as only 52% (group 2) and 50% (group 4) of the smokersshowed consistent directional changes in both indices of acroleinexposure.
4. Discussion
The availability of methods for quantifying exposure to ciga-rette smoke constituents is a necessary requirement for the initialphase of an assessment of cigarette-based potential reduced-expo-sure products (PREPS) (Institute of Medicine 2001).
In a previous paper (Shepperd et al., 2009), we compare two ap-proaches to the estimation of cigarette smoke exposure in a cross-sectional study of three groups of smokers who differed in the ISOtar and nicotine yields of their usual cigarette brands. One ap-proach was the measurement of MLEs using the filter analysismethod, and the other was the measurement of BoE. We reportedmoderate to strong correlations for nicotine MLE and urinary TNeq(r = 0.83), NNK MLE and NNAL (r = 0.76), acrolein MLE and 3-HPMA(r = 0.82), and pyrene MLE and 1-OHP (r = 0.63). These data also de-rive from the control groups from this current study. It should benoted that in the earlier reported analysis, mean MLE and BoE val-ues were calculated from all days for each subject, giving rise to areduced n and slight differences in the values shown.
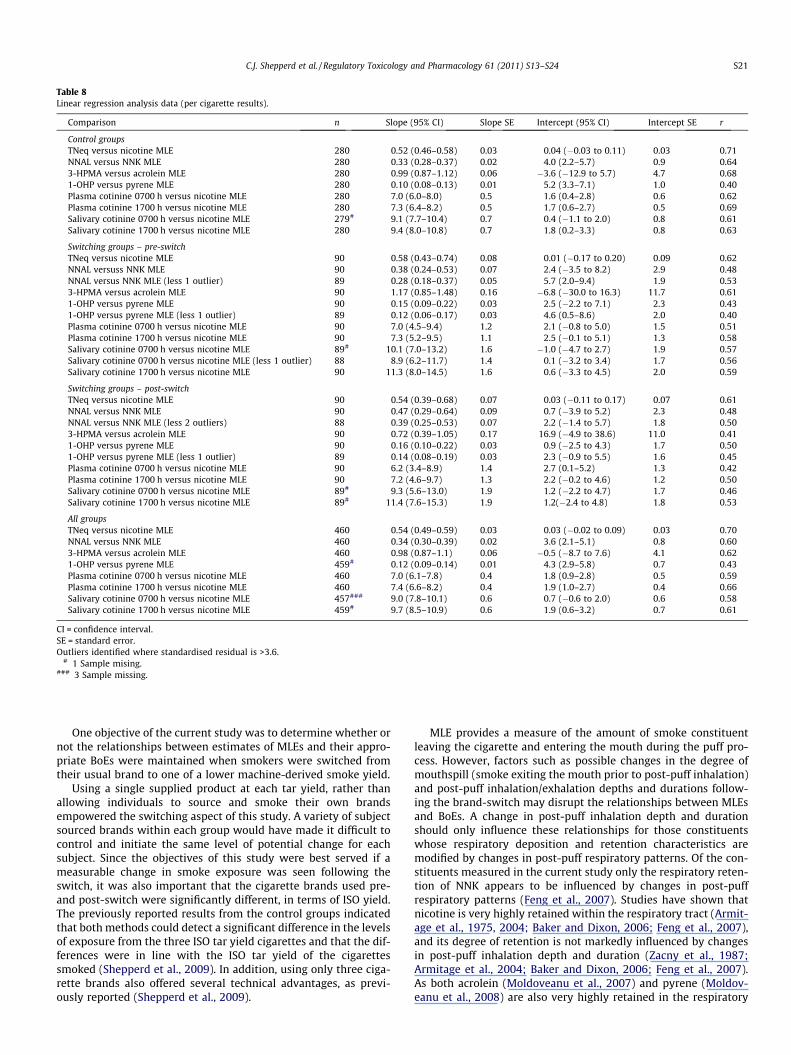
Table 8Linear regression analysis data (per cigarette results).
Comparison n Slope (95% CI) Slope SE Intercept (95% CI) Intercept SE r
Control groupsTNeq versus nicotine MLE 280 0.52 (0.46–0.58) 0.03 0.04 (�0.03 to 0.11) 0.03 0.71NNAL versus NNK MLE 280 0.33 (0.28–0.37) 0.02 4.0 (2.2–5.7) 0.9 0.643-HPMA versus acrolein MLE 280 0.99 (0.87–1.12) 0.06 �3.6 (�12.9 to 5.7) 4.7 0.681-OHP versus pyrene MLE 280 0.10 (0.08–0.13) 0.01 5.2 (3.3–7.1) 1.0 0.40Plasma cotinine 0700 h versus nicotine MLE 280 7.0 (6.0–8.0) 0.5 1.6 (0.4–2.8) 0.6 0.62Plasma cotinine 1700 h versus nicotine MLE 280 7.3 (6.4–8.2) 0.5 1.7 (0.6–2.7) 0.5 0.69Salivary cotinine 0700 h versus nicotine MLE 279# 9.1 (7.7–10.4) 0.7 0.4 (�1.1 to 2.0) 0.8 0.61Salivary cotinine 1700 h versus nicotine MLE 280 9.4 (8.0–10.8) 0.7 1.8 (0.2–3.3) 0.8 0.63
Switching groups – pre-switchTNeq versus nicotine MLE 90 0.58 (0.43–0.74) 0.08 0.01 (�0.17 to 0.20) 0.09 0.62NNAL versuss NNK MLE 90 0.38 (0.24–0.53) 0.07 2.4 (�3.5 to 8.2) 2.9 0.48NNAL versus NNK MLE (less 1 outlier) 89 0.28 (0.18–0.37) 0.05 5.7 (2.0–9.4) 1.9 0.533-HPMA versus acrolein MLE 90 1.17 (0.85–1.48) 0.16 �6.8 (�30.0 to 16.3) 11.7 0.611-OHP versus pyrene MLE 90 0.15 (0.09–0.22) 0.03 2.5 (�2.2 to 7.1) 2.3 0.431-OHP versus pyrene MLE (less 1 outlier) 89 0.12 (0.06–0.17) 0.03 4.6 (0.5–8.6) 2.0 0.40Plasma cotinine 0700 h versus nicotine MLE 90 7.0 (4.5–9.4) 1.2 2.1 (�0.8 to 5.0) 1.5 0.51Plasma cotinine 1700 h versus nicotine MLE 90 7.3 (5.2–9.5) 1.1 2.5 (�0.1 to 5.1) 1.3 0.58Salivary cotinine 0700 h versus nicotine MLE 89# 10.1 (7.0–13.2) 1.6 �1.0 (�4.7 to 2.7) 1.9 0.57Salivary cotinine 0700 h versus nicotine MLE (less 1 outlier) 88 8.9 (6.2–11.7) 1.4 0.1 (�3.2 to 3.4) 1.7 0.56Salivary cotinine 1700 h versus nicotine MLE 90 11.3 (8.0–14.5) 1.6 0.6 (�3.3 to 4.5) 2.0 0.59
Switching groups – post-switchTNeq versus nicotine MLE 90 0.54 (0.39–0.68) 0.07 0.03 (�0.11 to 0.17) 0.07 0.61NNAL versus NNK MLE 90 0.47 (0.29–0.64) 0.09 0.7 (�3.9 to 5.2) 2.3 0.48NNAL versus NNK MLE (less 2 outliers) 88 0.39 (0.25–0.53) 0.07 2.2 (�1.4 to 5.7) 1.8 0.503-HPMA versus acrolein MLE 90 0.72 (0.39–1.05) 0.17 16.9 (�4.9 to 38.6) 11.0 0.411-OHP versus pyrene MLE 90 0.16 (0.10–0.22) 0.03 0.9 (�2.5 to 4.3) 1.7 0.501-OHP versus pyrene MLE (less 1 outlier) 89 0.14 (0.08–0.19) 0.03 2.3 (�0.9 to 5.5) 1.6 0.45Plasma cotinine 0700 h versus nicotine MLE 90 6.2 (3.4–8.9) 1.4 2.7 (0.1–5.2) 1.3 0.42Plasma cotinine 1700 h versus nicotine MLE 90 7.2 (4.6–9.7) 1.3 2.2 (�0.2 to 4.6) 1.2 0.50Salivary cotinine 0700 h versus nicotine MLE 89# 9.3 (5.6–13.0) 1.9 1.2 (�2.2 to 4.7) 1.7 0.46Salivary cotinine 1700 h versus nicotine MLE 89# 11.4 (7.6–15.3) 1.9 1.2(�2.4 to 4.8) 1.8 0.53
All groupsTNeq versus nicotine MLE 460 0.54 (0.49–0.59) 0.03 0.03 (�0.02 to 0.09) 0.03 0.70NNAL versus NNK MLE 460 0.34 (0.30–0.39) 0.02 3.6 (2.1–5.1) 0.8 0.603-HPMA versus acrolein MLE 460 0.98 (0.87–1.1) 0.06 �0.5 (�8.7 to 7.6) 4.1 0.621-OHP versus pyrene MLE 459# 0.12 (0.09–0.14) 0.01 4.3 (2.9–5.8) 0.7 0.43Plasma cotinine 0700 h versus nicotine MLE 460 7.0 (6.1–7.8) 0.4 1.8 (0.9–2.8) 0.5 0.59Plasma cotinine 1700 h versus nicotine MLE 460 7.4 (6.6–8.2) 0.4 1.9 (1.0–2.7) 0.4 0.66Salivary cotinine 0700 h versus nicotine MLE 457### 9.0 (7.8–10.1) 0.6 0.7 (�0.6 to 2.0) 0.6 0.58Salivary cotinine 1700 h versus nicotine MLE 459# 9.7 (8.5–10.9) 0.6 1.9 (0.6–3.2) 0.7 0.61
CI = confidence interval.SE = standard error.Outliers identified where standardised residual is >3.6.
# 1 Sample mising.### 3 Sample missing.
C.J. Shepperd et al. / Regulatory Toxicology and Pharmacology 61 (2011) S13–S24 S21
One objective of the current study was to determine whether ornot the relationships between estimates of MLEs and their appro-priate BoEs were maintained when smokers were switched fromtheir usual brand to one of a lower machine-derived smoke yield.
Using a single supplied product at each tar yield, rather thanallowing individuals to source and smoke their own brandsempowered the switching aspect of this study. A variety of subjectsourced brands within each group would have made it difficult tocontrol and initiate the same level of potential change for eachsubject. Since the objectives of this study were best served if ameasurable change in smoke exposure was seen following theswitch, it was also important that the cigarette brands used pre-and post-switch were significantly different, in terms of ISO yield.The previously reported results from the control groups indicatedthat both methods could detect a significant difference in the levelsof exposure from the three ISO tar yield cigarettes and that the dif-ferences were in line with the ISO tar yield of the cigarettessmoked (Shepperd et al., 2009). In addition, using only three ciga-rette brands also offered several technical advantages, as previ-ously reported (Shepperd et al., 2009).
MLE provides a measure of the amount of smoke constituentleaving the cigarette and entering the mouth during the puff pro-cess. However, factors such as possible changes in the degree ofmouthspill (smoke exiting the mouth prior to post-puff inhalation)and post-puff inhalation/exhalation depths and durations follow-ing the brand-switch may disrupt the relationships between MLEsand BoEs. A change in post-puff inhalation depth and durationshould only influence these relationships for those constituentswhose respiratory deposition and retention characteristics aremodified by changes in post-puff respiratory patterns. Of the con-stituents measured in the current study only the respiratory reten-tion of NNK appears to be influenced by changes in post-puffrespiratory patterns (Feng et al., 2007). Studies have shown thatnicotine is very highly retained within the respiratory tract (Armit-age et al., 1975, 2004; Baker and Dixon, 2006; Feng et al., 2007),and its degree of retention is not markedly influenced by changesin post-puff inhalation depth and duration (Zacny et al., 1987;Armitage et al., 2004; Baker and Dixon, 2006; Feng et al., 2007).As both acrolein (Moldoveanu et al., 2007) and pyrene (Moldov-eanu et al., 2008) are also very highly retained in the respiratory
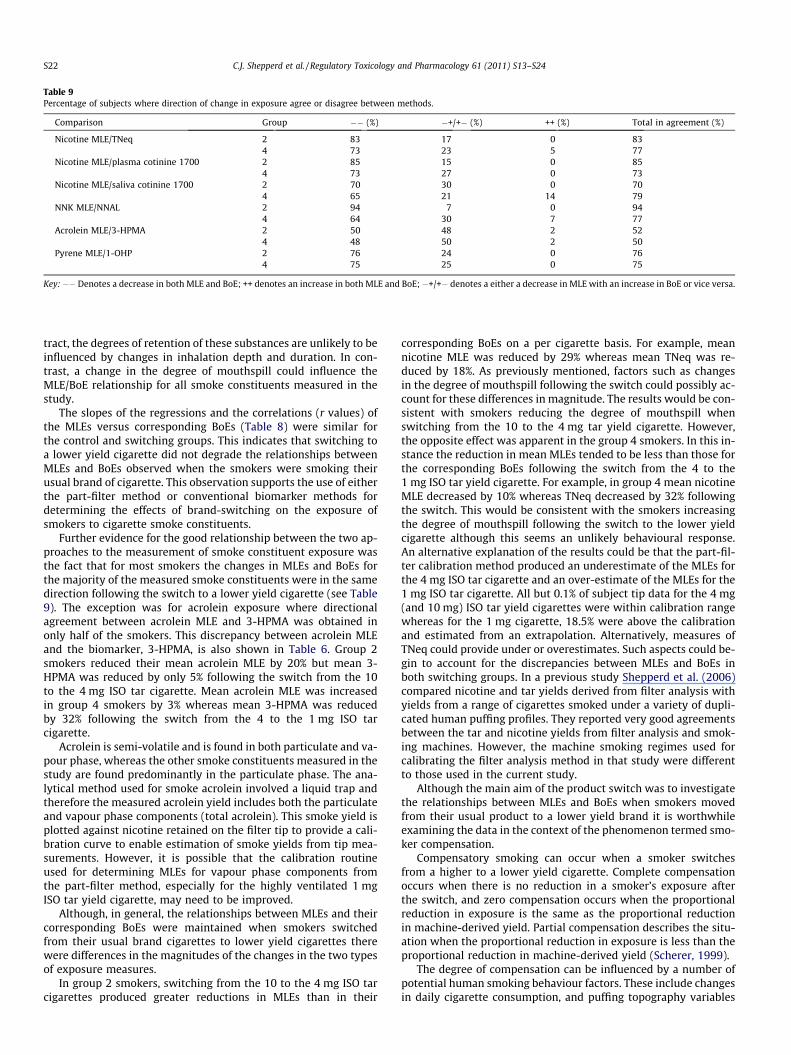
Table 9Percentage of subjects where direction of change in exposure agree or disagree between methods.
Comparison Group �� (%) �+/+� (%) ++ (%) Total in agreement (%)
Nicotine MLE/TNeq 2 83 17 0 834 73 23 5 77
Nicotine MLE/plasma cotinine 1700 2 85 15 0 854 73 27 0 73
Nicotine MLE/saliva cotinine 1700 2 70 30 0 704 65 21 14 79
NNK MLE/NNAL 2 94 7 0 944 64 30 7 77
Acrolein MLE/3-HPMA 2 50 48 2 524 48 50 2 50
Pyrene MLE/1-OHP 2 76 24 0 764 75 25 0 75
Key:�� Denotes a decrease in both MLE and BoE; ++ denotes an increase in both MLE and BoE;�+/+� denotes a either a decrease in MLE with an increase in BoE or vice versa.
S22 C.J. Shepperd et al. / Regulatory Toxicology and Pharmacology 61 (2011) S13–S24
tract, the degrees of retention of these substances are unlikely to beinfluenced by changes in inhalation depth and duration. In con-trast, a change in the degree of mouthspill could influence theMLE/BoE relationship for all smoke constituents measured in thestudy.
The slopes of the regressions and the correlations (r values) ofthe MLEs versus corresponding BoEs (Table 8) were similar forthe control and switching groups. This indicates that switching toa lower yield cigarette did not degrade the relationships betweenMLEs and BoEs observed when the smokers were smoking theirusual brand of cigarette. This observation supports the use of eitherthe part-filter method or conventional biomarker methods fordetermining the effects of brand-switching on the exposure ofsmokers to cigarette smoke constituents.
Further evidence for the good relationship between the two ap-proaches to the measurement of smoke constituent exposure wasthe fact that for most smokers the changes in MLEs and BoEs forthe majority of the measured smoke constituents were in the samedirection following the switch to a lower yield cigarette (see Table9). The exception was for acrolein exposure where directionalagreement between acrolein MLE and 3-HPMA was obtained inonly half of the smokers. This discrepancy between acrolein MLEand the biomarker, 3-HPMA, is also shown in Table 6. Group 2smokers reduced their mean acrolein MLE by 20% but mean 3-HPMA was reduced by only 5% following the switch from the 10to the 4 mg ISO tar cigarette. Mean acrolein MLE was increasedin group 4 smokers by 3% whereas mean 3-HPMA was reducedby 32% following the switch from the 4 to the 1 mg ISO tarcigarette.
Acrolein is semi-volatile and is found in both particulate and va-pour phase, whereas the other smoke constituents measured in thestudy are found predominantly in the particulate phase. The ana-lytical method used for smoke acrolein involved a liquid trap andtherefore the measured acrolein yield includes both the particulateand vapour phase components (total acrolein). This smoke yield isplotted against nicotine retained on the filter tip to provide a cali-bration curve to enable estimation of smoke yields from tip mea-surements. However, it is possible that the calibration routineused for determining MLEs for vapour phase components fromthe part-filter method, especially for the highly ventilated 1 mgISO tar yield cigarette, may need to be improved.
Although, in general, the relationships between MLEs and theircorresponding BoEs were maintained when smokers switchedfrom their usual brand cigarettes to lower yield cigarettes therewere differences in the magnitudes of the changes in the two typesof exposure measures.
In group 2 smokers, switching from the 10 to the 4 mg ISO tarcigarettes produced greater reductions in MLEs than in their
corresponding BoEs on a per cigarette basis. For example, meannicotine MLE was reduced by 29% whereas mean TNeq was re-duced by 18%. As previously mentioned, factors such as changesin the degree of mouthspill following the switch could possibly ac-count for these differences in magnitude. The results would be con-sistent with smokers reducing the degree of mouthspill whenswitching from the 10 to the 4 mg tar yield cigarette. However,the opposite effect was apparent in the group 4 smokers. In this in-stance the reduction in mean MLEs tended to be less than those forthe corresponding BoEs following the switch from the 4 to the1 mg ISO tar yield cigarette. For example, in group 4 mean nicotineMLE decreased by 10% whereas TNeq decreased by 32% followingthe switch. This would be consistent with the smokers increasingthe degree of mouthspill following the switch to the lower yieldcigarette although this seems an unlikely behavioural response.An alternative explanation of the results could be that the part-fil-ter calibration method produced an underestimate of the MLEs forthe 4 mg ISO tar cigarette and an over-estimate of the MLEs for the1 mg ISO tar cigarette. All but 0.1% of subject tip data for the 4 mg(and 10 mg) ISO tar yield cigarettes were within calibration rangewhereas for the 1 mg cigarette, 18.5% were above the calibrationand estimated from an extrapolation. Alternatively, measures ofTNeq could provide under or overestimates. Such aspects could be-gin to account for the discrepancies between MLEs and BoEs inboth switching groups. In a previous study Shepperd et al. (2006)compared nicotine and tar yields derived from filter analysis withyields from a range of cigarettes smoked under a variety of dupli-cated human puffing profiles. They reported very good agreementsbetween the tar and nicotine yields from filter analysis and smok-ing machines. However, the machine smoking regimes used forcalibrating the filter analysis method in that study were differentto those used in the current study.
Although the main aim of the product switch was to investigatethe relationships between MLEs and BoEs when smokers movedfrom their usual product to a lower yield brand it is worthwhileexamining the data in the context of the phenomenon termed smo-ker compensation.
Compensatory smoking can occur when a smoker switchesfrom a higher to a lower yield cigarette. Complete compensationoccurs when there is no reduction in a smoker’s exposure afterthe switch, and zero compensation occurs when the proportionalreduction in exposure is the same as the proportional reductionin machine-derived yield. Partial compensation describes the situ-ation when the proportional reduction in exposure is less than theproportional reduction in machine-derived yield (Scherer, 1999).
The degree of compensation can be influenced by a number ofpotential human smoking behaviour factors. These include changesin daily cigarette consumption, and puffing topography variables
C.J. Shepperd et al. / Regulatory Toxicology and Pharmacology 61 (2011) S13–S24 S23
such as puff number and puff volume (Scherer, 1999). Mean dailycigarette consumption increased when both groups of smokers(group 2 and 4) were switched from the higher to the lower yieldcigarettes. However, daily consumption increases were also seen intheir two non-switching, control groups (groups 1 and 3). As therewere no statistically significant differences in consumption ratesbetween the switching groups and their controls in period 2 ofthe study it is possible that these increases occurred as a resultof the experimental design rather than as a compensatory responseto the reduction in machine-derived yields in groups 2 and 4. Thissuggests that it might be helpful to include non-switching controlgroups in studies on compensatory smoking.
The compensation indices shown in Table 7 were based on nic-otine exposure per cigarette data and thus were not influenced bythe systematic increase in daily cigarette consumption as the studyprogressed. The nicotine BoE results indicated partial compensa-tion occurred following the switches from the 10 to the 4 mg(group 2), and the 4 to the 1 mg (group 4) tar yield cigarettes.These observations are consistent with the partial compensationfindings based on nicotine uptake reported in the review articleson smoker compensation (Stephen et al., 1989; Scherer, 1999)and in more recent switching studies (Mendes et al., 2008; Beno-witz et al., 2005). Our results from the group 4 smokers are alsoin agreement with those of a recent Benowitz et al., (2009) studywhich showed statistically significant reductions in nicotine expo-sure when smokers were progressively switched from their usualbrand (12 mg FTC tar yield) to 2 mg and 1 mg FTC tar yield brands.However, Benowitz et al. (2009) did not observe a significantreduction in nicotine exposure when their subjects were switchedto a 4 mg FTC tar yield brand. Thus our results from the group 2smokers are not consistent with those from the recent Benowitzet al. (2009) study.
The compensation indices based on saliva cotinine were higherthan those based on plasma cotinine for both groups of switchers.We currently have no plausible explanation for these differences.
In addition to the reductions in nicotine MLEs and BoEs, switch-ing from a higher to a lower yield cigarette for a period of 12 daysresulted in statistically significant reductions in MLEs for NNK(both switching groups), pyrene (both switching groups) and acro-lein (group 2) together with statistically significant reductions inthe BoEs, NNAL (both groups), HPMA (group 4) and 1-OHP (group4). Mendes et al. (2008) measured 24 h urinary nicotine equiva-lents, plasma cotinine, NNAL, 1-OHP, 3-HPMA, S-PMA (biomarkerfor benzene) and COHb in smokers in short (8 days) and long-termswitching (24 weeks) from US Marlboro full flavour (MFF �15 mgFTC tar yield) to either Marlboro Lights (ML �11 mg FTC tar yield)or Marlboro Ultra Lights (MUL �6 mg FTC tar yield). They com-pared the results from the two switching groups with those froma control group who smoked MFF throughout the study. Switchingfrom MFF to ML produced small but statistically significant reduc-tions in 24 h urinary nicotine equivalents and 1-OHP but no reduc-tion in the other measured biomarkers following the short-termswitch. Short-term switching from MFF to MUL resulted in statis-tically significant reductions in 24 h urinary nicotine equivalents,plasma cotinine, NNAL and 1-OHP, and non-significant reductionsin the other biomarkers. Our 12-day switching results are broadlyin line with the short-term switching data reported by Mendeset al. (2008).
Benowitz et al. (2005) conducted a short-term switching study(1 week) in which US smokers were switched from their usual cig-arette to one delivering around 50% less nicotine under standardmachine-smoking conditions. The average machine-derived yieldsfor own brand cigarettes were 14.4 mg FTC tar, 1.06 mg FTC nico-tine for the pre-switch brands and 6.1 mg FTC tar, 0.5 mg FTC nic-otine for the post-switch brands. Benowitz et al. (2005) reportedsmall reductions in nicotine BoEs in spot urine samples
(normalised by creatinine) but no reductions in NNAL or biomark-ers of pyrene exposure. They concluded that short-term switchingto lower yield brands produced no significant reduction in carcin-ogen exposure. In a more recent study Benowitz et al. (2009) grad-ually switched smokers from their usual brand (average yields12.1 mg tar, 1.05 mg nicotine) to five brands with progressively re-duced tar and nicotine yields. Each brand was smoked for a periodof 1 week and BoEs for nicotine, NNK, pyrenes (spot urine samples)and CO were measured. They reported no significant reductions inthe various biomarkers for three of the cigarettes (12, 8 and 4 mgtar yield) but significant reductions in the BoEs were obtained forthe 2 and 1 mg tar yield cigarettes compared with the exposuresobtained from the smokers’ usual brands. Our MLE and BoE resultsfollowing the switch from a 4 to a 1 mg ISO tar yield cigarette are inline with those reported by Benowitz et al. (2009). However, wealso observed statistically significant reductions in NNK and pyr-ene MLEs, and NNAL following a switch from a 10 to a 4 mg ISOtar cigarette whereas Benowitz et al. (2009) failed to observe dif-ferences in NNAL or BoEs for pyrene when their subjects switcheddown to a 4 mg FTC tar yield cigarette. Spot urine samples shouldhave higher variability than the 24 h urine samples collected in aclinic. Therefore, this may explain why Benowitz failed to detectdifferences that were detected by both Mendes and the currentstudy. An additional problem with the Benowitz et al. (2009) studyis that the yields of NNK and pyrene were not measured in any ofthe cigarettes used in the study. Thus there is no information toshow the magnitude of the differences in the machine-derivedyields of these constituents between the pre- and post-switch cig-arettes. In contrast, machine-derived yields of the constituentsrelating to the various MLEs and BoEs were measured in our study,and the three products differed markedly in the yields of NNK andpyrene.
Another interesting observation in the data from our study isthat following the switch from the 10 to the 4 mg ISO tar yieldcigarettes the group 2 mean values for nicotine, NNK, acrolein,and pyrene MLEs, and TNeq, NNAL and 1-OHP were very similarto those obtained by the regular smokers of 4–5 mg ISO tar yieldcigarettes (i.e. group 3 smokers). A similar outcome was seenfollowing the switch from the 4 to the 1 mg ISO tar cigarette.In this instance post-switch mean values for nicotine, NNK andpyrene MLEs, NNAL, 3-HPMA and 1-OHP were similar to thosemeasured in the regular 1–2 mg ISO tar yield smokers. Theseobservations are consistent with those published by Mendeset al. (2008) who reported similar levels of nicotine BoEs insmokers who switched from Marlboro full flavour to MarlboroLights in the short-term phase of their study to those obtainedfrom regular smokers of Marlboro Lights measured in an earlierstudy (Roethig et al., 2007). Mendes et al. (2008) reported thatsuch results supported the validity of forced switching studiesto evaluate exposure to different cigarette products. Our resultsare consistent with the work reported by Mendes et al. (2008).These data, of course, provide no information on whether thereductions in MLEs or BoEs are associated with any reductionsin health risks.
In conclusion, our study has demonstrated that MLEs for nico-tine and other smoke constituents derived from the analysis ofspent filters are related to BoEs during short-term brand switchstudies. Although the pre- to post-switch directional changes inMLEs and their corresponding BoEs were consistent for most ofthe smoke constituents measured there were some differences inthe magnitudes of the changes observed using the two methodsof exposure assessment. Further work is required to determinewhether these anomalies occurred as a result of post-puff inhala-tion changes e.g., degree of mouthspill, or as a result of calibrationissues particularly with highly ventilated, very low tar yieldcigarettes.
S24 C.J. Shepperd et al. / Regulatory Toxicology and Pharmacology 61 (2011) S13–S24
Conflict of Interest Statement
This work was funded by British American Tobacco (BAT), andall authors, with the exception of Dr. Mike Dixon, are full timeemployees of BAT. Dr. Mike Dixon’s involvement was in the capac-ity of a paid consultant to BAT.
Acknowledgments
We thank Dr. Gerhard Scherer and Dr. Kelley St. Charles fortheir input into the study design and Pamela Saunders and Made-leine Ashley for their contribution to the filter analysis and Dr.Christopher Proctor for his contribution to the draft manuscript.
References
Armitage, A.K., Dollery, C.T., George, C.F., Houseman, T.H., Lewis, P.J., Turner, D.M.,1975. Absorption and metabolism of nicotine from cigarettes. Br. Med. J. 4(5992), 313–316.
Armitage, A.K., Dixon, M., Frost, B., Mariner, D.C., Sinclair, N.M., 2004. The effect ofinhalation volume and breath-hold on the retention of nicotine and solanesol inthe human respiratory tract and subsequent plasma nicotine concentrationduring cigarette smoking. Beitr. Tabakforsch. Int. 21 (4), 240–249.
Ashley, D.L., O’Connor, R.J., Bernert, J.T., et al., 2010. Effect of differing levels oftobacco specific nitrosamines in cigarette smoke on the levels of biomarkers insmokers. Cancer Epidemiol Biomarkers Prev 19 (6), 1389–1398.
Baker, R.R., Dixon, M., 2006. The retention of tobacco smoke constituents in thehuman respiratory tract. Inhal. Toxicol. 18 (4), 255–294.
Benowitz, N.L., Jacob III, P., Bernert, J., Wilson, M., Wang, L., Allen, F., Dempsy, D.,2005. Carcinogen exposure during short-term switching from regular to lightcigarettes. Cancer Epidemiol Biomarkers Prev 14, 1376–1383.
Benowitz, N.L., Dains, K.M., Hall, S.M., Stewart, S., Wilson, M., Dempsey, D., Jacob III,P., 2009. Progressive commercial cigarette yield reduction: Biochemicalexposure and behavioral assessment. Cancer Epidemiol Biomarkers Prev 18,876–883.
Bridges, R.B., Combs, J.G., Humble, J.W., Turbeck, J.A., Rehms, R., Haley, N.J., 1990.Population characteristics and cigarette yield as determinants of smokeexposure. Pharmacol. Biochem. Behav. 37, 17–28.
Byrd, G.D., Davis, R.A., Caldwell, W.S., Robinson, J.H., deBethizy, J.D., 1998. A furtherstudy of FTC yield and nicotine absorption in smokers. Psychopharmacology134, 291–299.
Commonwealth of Massachusetts 1997. Tobacco disclosure act, General laws ofMassachusetts, Chapter 94, Section 307B, 105 CMR 660.000, Cigarette andsmokeless tobacco products: Reports of added constituents and nicotineratings. <www.mass.gov/Eeohhs2/docs/dph/regs/105cmr660.pdf>.
Ebert, R.V., McNabb, M.E., McCusker, K.T., Snow, S.L., 1983. Amount of nicotine andcarbon monoxide inhaled by smokers of low tar, low nicotine cigarettes. JAMA250, 2840–2842.
Feng, S., Plunkett, S.E., Lam, K., Kapur, S., Muhammad, R., Jin, Y., Zimmermann, M.,Mendes, P., Kinser, R., Roethig, H.J., 2007. A new method for estimating theretention of selected smoke constituents in the respiratory tract of smokersduring cigarette smoking. Inhal. Toxicol. 19, 169–179.
Gori, G.B., Lynch, C., 1985. Analytic cigarette yields as predictors of smokebioavailability. Reg. Toxicol. Pharmacol. 5, 314–326.
Hecht, S.S., Murphy, S.E., Carmella, S.G., Li, S., Jensen, J., Le, C., Joseph, A.M.,Hatsukami, D.K., 2005. Similar uptake of lung carcinogens by smokers ofregular, light, and ultralight cigarettes. Cancer Epidemiol. Biomarkers Prev. 14,693–698.
Jarvis, M., Boreham, P.P., Feyerabend, C., Bryant, A., 2001. Nicotine yield frommachine-smoked cigarettes and nicotine intake from smokers: evidence from arepresentative population survey. J. Nat. Cancer Inst. 93 (2), 134–138.
Mendes, P., Kapur, S., Wang, J., Feng, S., Roethig, H., 2008. A randomized, controlledexposure study in adult smokers of full flavor Marlboro cigarettes switching toMarlboro lights or Marlboro ultra lights cigarettes. Regul. Toxicol. Pharmacol.51 (3), 295–305.
Mendes, P., Liang, Q., Frost-Pineda, K., Munjal, S., Walk, R.A., Roethig, H., 2009. Therelationships between smoking machine derived tar yields and biomarkers ofexposure in adult cigarette smokers in the US. Regul. Toxicol. Pharmacol. 55,17–27.
Moldoveanu, S.C., St. Charles, F.K., 2007. Differences in the chemical composition ofthe particulate phase of inhaled and exhaled cigarette mainstream smoke. Beitr.Tabakforsch. Int. 22, 290–302.
Moldoveanu, S.C., Coleman III, W., Wilkins, J.M., 2008. Determination of polycyclicaromatic hydrocarbons in exhaled cigarette smoke. Beitr. Tabakforsch. Int. 23,85–97.
Pauly, J.L., O’Connor, R.J., Paszkiewicz, M., Cummings, K.M., Djordjevic, M.V., Shields,P.G., 2009. Cigarette filter-based assays as proxies for toxicant exposure andsmoking behavior – A literature review. Cancer Epidemiol. Biomarkers Prev. 18(12), 3321–3333.
Polzin, G.M., Wu, W., Yan, X., McCraw, J.M., Abdul-Salaam, S., Tavakoli, A.D., Zhang,L., Ashley, D.L., Watson, C.H., 2009. Estimating smokers’ mouth level xposures toselect mainstream smoke constituents from discarded cigarette filter butts.Nicotine & Tob. Res. 11, 868–874.
Roethig, H.J., Zedler, B.K., Kinser, R.D., Feng, S., Nelson, B.L., Liang, Q., 2007. Short-term clinical expaoure evaluation of second-generation electrically heatedcigarette smoking system. J. Clin. Pharmacol. 47, 518–530.
Rosa, M., Pacifici, R., Altieri, I., Pichini, S., Ottaviani, G., Zuccaro, P., 1992. How thesteady state cotinine concentration in cigarette smokers is directly related tonicotine intake. Clin. Pharmacol. Ther. 52, 324–329.
Russell, M.A.H., Jarvis, M., Iyer, R., Feyerabend, C., 1980. Relation of nicotine yield ofcigarettes to blood nicotine concentrations in smokers. Br. Med. J. 280, 972–976.
Russell, M.A.H., Jarvis, M.J., Feyerabend, C., Saloojee, Y., 1986. Reduction of tar,nicotine and carbon monoxide intake in low tar smokers. J. Epidemiol.Commun. Health 40, 80–85.
Scherer, G., 1999. Smoking behavior and compensation: a review of the literature.Psychopharmacology 145, 1–20.
Scherer, G., Urban, M., Engl, J., Hagedorn, H.-W., Riedel, K., 2006. Influence ofsmoking charcoal filter tipped cigarettes on various biomarkers of exposure.Inhal. Toxicol. 18, 821–829.
Scherer, G., Engl, J., Urban, M., Gilch, G., Janket, D., Riedel, K., 2007. Relationshipbetween machine-derived smoke yields and biomarkers in cigarette smokers inGermany. Regul. Toxicol. Pharmacol. 47, 171–183.
Shepperd, C.J., St. Charles, F.K., Lien, M., Dixon, M., 2006. Validation of methods fordetermining consumer smoked cigarette yields from cigarette filter analysis.Beitr. Tabakforsch. Int. 22, 176–184.
Shepperd, C.J., Eldridge, A.C., Mariner, D.C., McEwan, M., Errington, G., Dixon, M.,2009. A study to estimate and correlate cigarette smoke exposure in smokers inGermany as determined by filter analysis and biomarkers of exposure. Regul.Toxicol. Pharmacol. 55, 97–109.
St. Charles, F.K., Krautter, G.R., Dixon, M., Mariner, D.C., 2006. A comparison ofnicotine dose estimates in smokers between filter analysis, salivary cotinine,and urinary excretion of nicotine metabolites. Psychopharmacology 189 (3),345–354.
St. Charles, F.K., Kabbani, A.A., Borgerding, M.F., 2010. Estimating tar and nicotineexposure: human smoking versus machine smoking. Regul. Toxicol. Pharmacol.56 (1), 100–110.
Stephen, A., Frost, C., Thompson, S., Wald, N., 1989. Estimating the Extent ofCompensatory Smoking. In: Wald, N., Froggatt, P. (Eds.), Nicotine, Smoking andthe Low Tar Programme. Oxford Medical Publications, Oxford, pp. 100–115.
Ueda, K., Kawach, I., Nakamura, M., Nogami, H., Shirokawa, N., Masui, S., Okayama,A., Oshima, A., 2002. Cigarette nicotine yields and nicotine intake amongJapanese male workers. Tob. Control 11, 55–60.
Zacny, J.P., Stitzer, M.L., Brown, F.J., Yingling, J.E., Griffiths, R.R., 1987. Humancigarette smoking: effects of puff and inhalation parameters on smokeexposure. J. Pharmacol. Exp. Ther. 240, 554–564.
Copyright © 2022 FDOKUMEN