
Hedonic capacity, cigarette craving, and diminished positive mood
A Distinctive Alveolar Macrophage Activation State Induced by Cigarette Smoking
Prescott G. Woodruff*1,3, Laura L. Koth*1,2, Yee Hwa Yang2,4, Madeleine W. Rodriguez2, Silvio
Favoreto1, Gregory M. Dolganov1,3, Agnes C. Paquet2, David J. Erle1,2,3
* These authors contributed equally
1Division of Pulmonary and Critical Care Medicine and 2Lung Biology Center, Department of
Medicine; 3Cardiovascular Research Institute; 4Department of Epidemiology and Biostatistics,
University of California, San Francisco.
Author for correspondence and reprints: Laura L. Koth, MD UCSF-Mission Bay Rock Hall, Rm 545 1550 4th St. San Francisco, CA 94158 Phone: (415) 514-4369 Fax: (415) 514-4278 eMail: [email protected]
Supported by grants from NIH (HL72301, HL56835, HL66564, RR17002 and HL072915) and
the Sandler Family Foundation and by the General Clinical Research Centers of Moffitt Hospital
(RR-00079) and San Francisco General Hospital (RR-00083).
Running Title: Smoke-induced macrophage activation
Descriptor: 53. COPD: pathophysiology Word Count: 4,529
This article has an online data supplement, which is accessible from this issue's table of content
online at www.atsjournals.org
AJRCCM Articles in Press. Published on September 15, 2005 as doi:10.1164/rccm.200505-686OC
Copyright (C) 2005 by the American Thoracic Society.
1
Abstract
Rationale: Macrophages are thought to play a central role in emphysema based largely on data
from mouse models. However, the relevance of these models to smoking-related lung disease in
humans is uncertain.
Objectives: We sought to comprehensively characterize the effects of smoking on gene
expression in human alveolar macrophages and to compare these with effects seen in transgenic
mouse models of emphysema.
Methods: We used DNA microarrays with genome-wide coverage to analyze alveolar
macrophages from 15 smokers, 15 non-smokers, and 15 asthmatics (disease control). Selected
gene expression changes were validated by PCR and ELISA. Expression changes were compared
with those identified by microarray analysis of IL-13 overexpressing and integrin β6-deficient
mice, which both develop emphysema.
Measurements and Main Results: All 15 smokers shared a common pattern of macrophage gene
expression that distinguished them from non-smokers, a finding not observed in asthmatics. We
identified 110 genes as differentially expressed in smokers despite using conservative statistical
methods. MMP-12, a proteinase which plays a critical role in mouse models, was the third most
highly induced gene in smokers (9-fold, p<0.0001). However, most changes in smokers were
not reflected in mouse models. One such finding was increased osteopontin expression in
smokers (4-fold, p=0.006), which was confirmed at the protein level and correlated with the
degree of airway obstruction.
Conclusions: Smoking induces a remarkably consistent and distinctive pattern of alveolar
macrophage activation. These studies identify aspects of mouse models that are directly relevant
to human smokers and also reveal novel potential mediators of smoking-related diseases.

2
Number of words in the abstract: 250
Key words: Gene Expression Profiling; Pulmonary Emphysema; Matrix Metalloproteinases;
Osteopontin.

3
Introduction
There are an estimated 1.3 billion habitual cigarette smokers worldwide (1) and 46 million adult
smokers in the US (2). Smoking-related lung diseases include chronic obstructive pulmonary
disease (COPD), which comprises emphysema, chronic bronchitis and small airway disease (3),
as well as several interstitial lung diseases (4). Cigarette smoke induces inflammation, oxidative
stress and tissue injury in the respiratory tract (5). Among the inflammatory changes observed in
smokers are changes in the number (6) and function (7, 8) of alveolar macrophages.
How human alveolar macrophages may contribute to the development of emphysema in habitual
smokers is a topic of ongoing investigation. The expression and/or function of several
proteinases, including the matrix metalloproteinases (MMP)-1, 2, 9, and 14 (9-15) and cathepsins
L and C (16-18) have been found to be increased in studies of smokers and subjects with COPD,
and polymorphisms in the MMP1 and MMP12 genes have been associated with decline in lung
function in smokers (19). These data suggest that macrophages may contribute to emphysema
through production of these proteinases.
Activated alveolar macrophages clearly contribute to the development of emphysema in several
mouse models including chronic exposure to cigarette smoke (20), airway over-expression of the
cytokine interleukin-13 (IL-13) (21), and deletion of an epithelial integrin subunit (β6) required
for TGF-β1 activation in the lung (22). In each of these models, lung macrophage activation
plays a critical role through the production of MMP-12 and other proteinases that contribute to
the destruction of alveolar walls (20-22). Although MMP-12 is the proteinase that is most
strongly implicated in mouse models of emphysema, studies of MMP-12 expression in humans

4
with COPD have produced inconsistent results (10, 13, 23, 24). These studies have yielded some
uncertainty as to the role of MMP-12 in human emphysema and how the products of activated
alveolar macrophages may contribute to smoking-related lung disease in humans (25).
We hypothesized that habitual cigarette smoking causes a reproducible and characteristic pattern
of macrophage activation in humans. We also hypothesized that the macrophage activation state
in human smokers would be similar to that seen in transgenic mouse models of emphysema. To
test these hypotheses, we performed genome-wide mRNA expression analysis of alveolar
macrophages from smokers and control subjects using DNA microarrays. Our results
demonstrate that human smokers have a strikingly consistent pattern of macrophage activation.
This form of macrophage activation was not seen in healthy non-smokers or in subjects with
asthma, a different cause of airway inflammation and obstructive lung disease. There were some
notable similarities to results obtained in two different transgenic mouse models, such as the
increase in MMP-12 expression seen in all smokers and in both mouse models. However, most
of the macrophage gene expression changes seen in smokers were not seen in the mouse models.
The consequences of some of these changes were detectable at the protein level, correlated with
lung function in smokers and are likely to have important effects on inflammation and the
extracellular matrix. Some of the results of these studies have been reported in abstract form (26).
Methods
Human subjects
The UCSF Committee on Human Research approved this study. Signed informed consent was
obtained from all subjects. We studied 15 current cigarette smokers, 15 healthy non-smoking

5
controls and 15 non-smoking subjects with asthma. Spirometry, methacholine challenge testing,
measurement of diffusing capacity (smokers only) and bronchoscopy with bronchoalveolar
lavage (BAL) were performed as described previously (27). Macrophages were isolated by flow
cytometry using forward scatter and autofluorescence characteristics (28). Macrophage purity
was 98±2% by Diffquik staining, with no difference between groups. Additional information
about inclusion and exclusion criteria, study design, and procedures are provided in an online
data supplement.
Mice
Animal studies were approved by the UCSF Institutional Animal Care and Use Committee.
Integrin β6-deficient (Itgb6-/-) mice (29) on an FVB background were generously provided by
Dean Sheppard. These mice spontaneously develop progressive airspace enlargement over a
period of months. Transgenic mice with CC10 promoter-driven overexpression of IL-13 (30)
were generously provided by Jack Elias. Mice used for these experiments were Tg(CC10-IL-
13)Stat6+/- mice on a Balb/c background (herein referred to as IL-13 tg) (31). These mice (like
Tg(CC10-IL-13)Stat6+/+ mice) develop spontaneous airspace enlargement by 2 months of age
(31). Macrophages were collected from 2-month-old Itgb6-/- mice, IL-13 tg mice, and littermate
control mice by BAL. There were three mice in each group. In addition, macrophages were
collected from three 10-month-old integrin β6-deficient mice to determine the effect of age and
progression of emphysema on macrophage gene expression. As previously reported (22, 31), we
found increased proportions of inflammatory cells other than macrophages in BAL fluid from
IL-13 tg mice (18% lymphocytes, 37% granulocytes) and integrin β6-deficient mice (29%
lymphocytes and <1% granulocytes at 2 months, 24% lymphocytes and <1% granulocytes at 10

6
months). To purify macrophages, BAL fluid cells were plated for 30 min at 37˚C and non-
adherent cells were removed. Adherent cells used for microarray analysis were >97%
macrophages by Diffquik staining for all experimental groups.
Analysis of alveolar macrophage RNA
RNA was extracted from mouse and human alveolar macrophages and DNAse-treated using the
RNeasy kit (Qiagen, Valencia, CA). RNA concentration and quality were assessed using the
Bioanalyzer 2100 (Agilent Technologies, Palo Alto, CA).
For mouse microarray studies, total RNA (250 ng from each mouse) was amplified using one
round of in vitro transcription with incorporation of biotinylated nucleotides (Message Amp II
aRNA kit #1751, Ambion, Austin, TX). Amplified cRNA samples were hybridized to Mouse
Genome 430 2.0 microarrays (Affymetrix, Santa Clara, CA) with each mouse sample run on a
separate array. For human samples, smaller quantities of RNA (50 ng) were available. Therefore,
RNA was amplified by performing 2 rounds of in vitro transcription (Ambion Message Amp
aRNA Kit #1750). Samples were hybridized to Affymetrix Human Genome U133 Plus 2.0
GeneChips.
Microarray data analysis
Array images were analyzed using Affymetrix GeneChip Expression Analysis Software.
Bioconductor (32) was used for quality control (affyPLM algorithm), preprocessing (RMA
algorithm), cluster analysis, and linear modeling (32-34). Hierarchical clustering was performed
using Pearson correlation. Differential gene expression was assessed using linear models
7
(controlling for age and gender in human samples). For each probe set, we computed the fold-
change and p-value, using the Bonferroni adjustment for multiple comparisons. We considered
Bonferroni adjusted p <0.05 as statistically significant. This provides a family-wise type I error
rate <5%, meaning that there was only a 5% chance of falsely identifying any differentially
expressed genes if the null hypothesis were correct (e.g. if smoking has no effect on gene
expression) (35). Gene expression levels were correlated with measures of lung function using
Pearson correlation. Array data are available from the Gene Expression Omnibus public database
(http://www.ncbi.nlm.nih.gov/geo/, accession number GSE2125).
Quantitative Real-time PCR
Transcript copy number for specific genes of interest was measured using an adaptation of a two-
step real time RT-PCR method described previously (36) and in the online data supplement.
Protein assays
BAL fluid was concentrated 5-fold (human samples) or 3.5-fold (mouse samples) using
Microcon filters (Millipore, Bedford, MA). Osteopontin and insulin-like growth factor-I levels
were measured using Quantikine kits (R & D Systems, Minneapolis, MN).
Results
Analysis of alveolar macrophage gene expression in human smokers and asthmatics
We studied alveolar macrophages from 15 habitual cigarette smokers, 15 non-smoking healthy
controls and 15 non-smoking asthmatics. We included the asthmatic group of subjects to assess
whether the changes induced by smoking are distinctive or reflect non-specific airway

8
inflammation. Although all subjects were recruited from the same local population with
standardized inclusion criteria, healthy control subjects differed from smokers with respect to
age and gender (Table 1). Both smokers and asthmatics had lower lung function than healthy
control subjects. Smokers were all currently smoking cigarettes. Smokers were using 1.4±0.7
packs per day (mean ± standard deviation) at the time of enrollment and lifetime smoking
exposure was 47±27 pack-years. Two smokers had mild COPD (as defined by GOLD class 1)
and five subjects had moderate COPD (GOLD class 2). Five smokers had mild reductions in
diffusing capacity for carbon monoxide (60-80% of predicted) suggestive of mild emphysema.
Macrophage RNA was obtained from subjects in all three groups using a standardized approach
and analyzed on microarrays containing 54,675 probe sets. We first used hierarchical clustering
to group macrophage samples based on the pattern of expression of the 200 most variable genes.
These variable genes were selected from the entire set of 30 subjects, without regard to whether
they were differentially expressed in the 15 smokers as compared with the 15 non-smokers.
Nonetheless, we found that samples from all 15 smokers grouped together in one cluster whereas
samples from all 15 non-smokers grouped together in a separate cluster (Figure 1A). Similar
results were obtained when larger numbers of genes were used for clustering: there was complete
segregation of smokers from controls when the 300 most variable genes were used, and only 1
smoker clustered with the controls when the 500 or 1000 most variable genes were used (data not
shown). This indicates that cigarette smoking had robust and consistent effects on gene
expression in human alveolar macrophages. By contrast, when we performed the same analyses
using alveolar macrophages from 15 subjects with asthma and the same healthy controls, we

9
found that hierarchical clustering did not segregate asthmatic samples from healthy non-smoking
control samples (Figure 1B).
We next used linear models that controlled for age and sex to identify statistically significant
gene expression differences between smokers and healthy non-smoking controls. Using the
conservative Bonferroni correction for multiple comparisons, we found differences with 123
probe sets representing 103 named genes (some with duplicate probe sets) and 7 unnamed genes
(Table E1, supplementary data file in online repository). Seventy-two of these genes were
increased and 38 were decreased in smokers compared to healthy non-smoking controls. The
gene most highly induced in smokers (Table 2) was CYP1B1 (99-fold induced by array), a
cytochrome P450 enzyme which is known to be induced by cigarette smoke (37). The gene
which ranked third for fold-induction was MMP-12 (9-fold), the macrophage-specific matrix
metalloproteinase implicated in several mouse models of emphysema (20-22). When we used
linear models to identify statistically significant gene expression changes in macrophages from
asthmatics, we found only 10 genes were differentially expressed between stable asthmatics and
healthy non-smokers, and none of these 10 were among the genes that were differentially
expressed in smokers (Table E2, supplementary data file in online repository). The expression of
12 genes found to be differentially expressed in alveolar macrophages from smokers was further
evaluated by quantitative real-time PCR. Differential expression was confirmed for all 12
transcripts, including MMP-12 (Fig. 2). In some cases, the fold-changes determined by PCR
were larger than those estimated using microarrays, probably due to the greater sensitivity and
dynamic range of PCR.

10
Analysis of alveolar macrophage gene expression in two mouse models of emphysema
In order to determine whether macrophage activation in mouse models of emphysema mirrors
macrophage activation observed in human smokers, we analyzed alveolar macrophages from two
transgenic mouse lines that develop emphysema, IL-13 overexpressing mice and integrin β6-
deficient mice, using DNA microarrays containing 45,101 probe sets. We studied IL-13
transgenic mice at 2 months of age because previous studies indicate that these mice have
emphysema by this age (31). We studied integrin β6-deficient mice at 2 months of age, when
MMP-12 expression in is maximal but emphysema is not yet detectable (22), and also at 10
months, when there is obvious emphysema (Figure 3 and reference (22)). We again began data
analysis by using a hierarchical clustering approach to identify dominant patterns of gene
expression in these two groups of mice and the two littermate control groups (Fig. 4). The
expression of a minority of genes depended principally on the genetic background of the mice
(Balb/c versus FVB). However, most changes related to genes that were increased or decreased
in experimental versus control mice. In these analyses, IL-13 over-expressing and integrin β6-
deficient mice clustered together rather than with their littermate controls. The pattern of gene
expression in macrophages from 2- and 10-month-old integrin β6-deficient mice was remarkably
similar (Figure 4). These results demonstrate that alveolar macrophages from these two mouse
models of emphysema manifest very similar patterns of gene expression changes.
We found a large number of differentially expressed genes in macrophages from IL-13
overexpressing or integrin β6 deficient mice as compared to their littermate controls. In IL-13
overexpressing mice, significant differential expression (Bonferroni adjusted p<0.05) was

11
detected with 2037 probe sets representing ~1098 genes (Table E3, supplementary data file in
online repository). In 2-month-old integrin β6-deficient mice, differential expression was
detected with 2371 probe sets representing ~1215 genes (Table E4, supplementary data file in
online repository). Many genes with known roles in extracellular matrix remodeling and
regulating inflammation had altered expression in macrophages from both models (Table 3).
These included proteinases and proteinase inhibitors, chemokines, and complement components.
A smaller number of genes stood out as highly differentially expressed in only one of the two
models. For example, arginase 1, a well-recognized marker of the alternative macrophage
activation state ascribed to Th2-cytokine stimulation in other systems (38, 39), was the second
most highly induced gene in the IL-13 overexpressing model (370-fold increase, Table E3) but
was not significantly induced in integrin β6-deficient mice. Other genes previously reported to
be characteristic of alternative macrophage activation (40-43) that were also exclusively or
disproportionately elevated in the IL-13 overexpression model included resistin-like α/FIZZ1
(increased 51-fold in IL-13 overexpressing vs. 3.7-fold in integrin β6-deficient), eosinophil-
associated ribonuclease A family member 11 (155-fold vs. 2.8-fold increase), chitinase 3-like
4/Ym2 (6.5-fold increase vs. 4.2-fold decrease), and fibronectin (8.5- vs. 2.6-fold increase).
Genes that were highly induced in integrin β6-deficient mice but were not significantly induced
in IL-13 overexpressing mice included the complement receptor C1qr1 (96-fold), maltase-
glucoamylase (77-fold), interferon induced transmembrane protein 6 (42-fold), and interferon
activated gene 205 (24-fold).
Comparison of humans and mouse models
12
To determine whether the gene expression changes in alveolar macrophages from smokers
mirror those observed in mouse models of emphysema, we identified mouse orthologs for 81 of
the genes differentially expressed in smokers by microarray analysis. For 51 of these 81 genes
(63%) we did not detect significant changes in expression of mouse orthologs in either mouse
model of emphysema at 2 months of age. For 17 of these 81 genes (21%), concordant expression
changes were observed in smokers and one or both of the mouse models (Table 4). For 13 genes
(16%), the expression changes were discordant (in the opposite direction) in smokers and one or
both mouse models (Table 4). Substantial differences in macrophage activation between human
cigarette smokers and the two mouse emphysema models that we studied at 2 months of age are
apparent when the largest gene expression changes in macrophages from smokers are compared
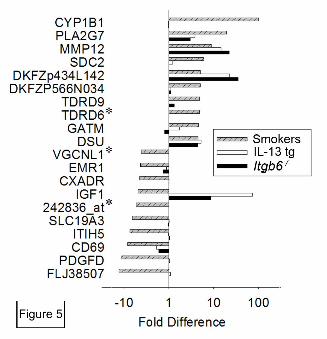
with mouse model results for orthologous genes (Fig. 5). We also examined the expression of
orthologous genes in integrin β6-deficient mice at 10 months of age, when the pathological
changes of emphysema are more evident. We found that 10-month and 2-month-old integrin β6
deficient mice were very similar in the expression of the 81 mouse orthologs of genes that were
altered in human smokers. These analyses yielded only 1 additional gene which overlapped with
the expression changes found in human smokers (Supplemental Table E6). This gene,
phosphodiesterase 4B (PDE4B), was increased in smokers and in 10-month-old β6-deficient
mice. There was a trend toward increased expression in 2-month-old integrin β6-deficient mice
compared with 2-month-old littermate controls, but this did not reach statistical significance after
Bonferroni adjustment. Thus, studying the disease process at a more advanced stage did not
substantially affect the degree of overlap between the mouse model and human smokers.
Protein verification
13
The two most highly differentially expressed transcripts in smokers that give discordant results
in the mouse models encode secreted proteins, insulin-like growth factor 1 (IGF-I) and
osteopontin (Table 4). To determine whether the observed changes in RNA transcript levels were
associated with differences in levels of the corresponding proteins in lung extracellular fluid, we
used ELISA to measure concentrations of osteopontin and IGF-I proteins in bronchoalveolar
fluid (BALF). Macrophage IGF-I mRNA expression was increased in both mouse models (Table
4) and these changes were mirrored by increases in BALF IGF-I protein in both IL-13
overexpressing mice (2,160±560 vs. 160±20 pg/mL in strain-matched controls, p=0.007) and
integrin β6-deficient mice (280±30 vs. 140±10 pg/mL in controls, p=0.002). In contrast, IGF-I
macrophage mRNA was decreased in smokers and there was a trend toward lower IGF-I protein
expression in BALF from smokers as compared to controls (40±40 vs. 260±140 pg/mL, p=0.15).
Macrophage osteopontin mRNA expression was decreased in integrin β6-deficient mice and
unchanged in IL-13 overexpressing mice (Table 4). The change in integrin β6-deficient mice was
mirrored by decreased BALF osteopontin protein levels (Fig. 6A). In contrast, osteopontin
mRNA and protein were both increased in smokers (Table 4 and Fig. 6B). These data indicate
that specific differences in IGF-I and osteopontin transcript expression seen in human smokers
and mouse models are associated with similar changes in levels of the corresponding proteins in
lung epithelial lining fluid.
Gene expression and lung function
Since osteopontin transcript and protein levels were markedly increased in smokers and
osteopontin is known to regulate lung inflammatory responses, we explored the possibility that
osteopontin expression might be associated with impaired lung function in smokers. We found

14
that increased osteopontin expression correlated with decreased lung function within the group of
smokers as measured by post-bronchodilator FEV1/FVC (Fig. 6C) or FEV1 (not shown). No
such relationship was apparent for other differentially expressed genes. For example, MMP-12
expression was elevated in all smokers as compared to healthy controls and MMP-12 levels did
not correlate with lung function in the 15 smokers (Fig. 6D).
Discussion
We used an integrative genomics approach to define the characteristics of macrophage activation
in human smokers and in two transgenic mouse models of emphysema. We found that cigarette
smoking had a remarkably potent and consistent effect on macrophage activation in human
subjects, a finding that was not observed in subjects with asthma. Among the most highly
induced genes in human smokers was MMP12, a proteinase thought to be important in the
pathogenesis of emphysema on the basis of mouse models. However, many of the gene
expression changes seen in smokers would not have been predicted from analyses of the two
mouse models of emphysema. For example, we found that osteopontin was highly induced in
macrophages from smokers but not the mouse models, and that increased expression levels
correlated with lung function impairment in smokers. These analyses indicate that habitual
cigarette smoking has a distinctive and reproducible effect on macrophage activation and identify
specific genes that may contribute to the pathogenesis of COPD.
We found that the effects of cigarette smoking on alveolar macrophage gene expression were
reproducible and distinctive despite a very conservative approach to data analysis. We performed
hierarchical clustering of samples according to expression of the most variable genes to

15
determine the predominant sources of variation in gene expression in an unbiased manner
(without employing information about smoking status). We found that all 15 smokers completely
segregated from all 15 non-smoking controls (Fig. 1A), but that the 15 subjects with asthma
could not be distinguished from controls (Fig 1B). This indicates that smoking status accounted
for much of the observed variation in gene expression and that smoking induces a dramatic and
highly consistent change in macrophage gene expression patterns. To identify differentially
expressed genes, we applied the conservative Bonferroni approach to adjust for the very large
number of probe sets on the microarrays. Even using this conservative approach, we identified
110 genes as differentially expressed in smokers versus non-smoking controls. By contrast, only
10 genes were differentially expressed in macrophages from subjects with asthma, and none of
these genes overlapped with findings in smokers. Quantitative PCR confirmed differential
expression of genes in smokers identified by microarray. There are likely to be additional genes
induced by smoking that were not identified in microarray analyses due to our conservative
approach to data analysis and to the limitations of microarrays for detection of low abundance
transcripts. In support of this idea, we used real-time PCR to analyze expression of proteinases
not identified as differentially expressed in array studies and found evidence that some of these
(MMP-2, MMP-9 and cathepsin K) were increased in smokers (data not shown). Although
microarray-based studies have certain intrinsic limitations in sensitivity, we were still able to find
very clear and convincing evidence for extensive smoking-induced changes in macrophage gene
expression using this approach.
We compared macrophage gene expression changes in human smokers with those seen in two
transgenic mouse models of emphysema in order to identify common features which might be

16
involved in emphysema pathogenesis. Previous work suggests that development of emphysema
in these two mouse models is driven by very different mechanisms. IL-13 overexpressing mice
develop emphysema very rapidly and have granulocytic inflammation and increased TGF-β
levels (44), whereas integrin β6-deficient mice develop emphysema more slowly, do not have
granulocytic inflammation, and are deficient in functional TGF-β (22). Given these differences,
we were surprised to find that the pattern of macrophage activation was strikingly similar in
these two models (Fig. 4, Table 3). In contrast, the degree of similarity between human smokers
and the mouse models was much more restricted (Fig. 5, Table 4). There are inevitable
limitations inherent in comparing expression microarray data between species. Different
microarrays must be used for human and mouse samples, and it is not always possible to
unambiguously identify mouse orthologs of human genes. Furthermore, our between-species
comparison may be affected by technical differences in the way that mouse and human
macrophages were collected and purified and in the methods used to amplify mouse and human
macrophage mRNAs. Nonetheless, our finding that there were almost as many discordant
changes as concordant changes shows that there are major differences between the human and
mouse macrophage activation states. On the one hand, this finding focuses attention on a
relatively small number of genes that could have a role in emphysema pathogenesis in both
human smokers and are well-modeled in mouse models of emphysema. On the other hand, the
finding helps to identify unique features of smoking-induced macrophage activation that may not
be modeled by these transgenic systems.
One of the genes induced both in human smokers and in mouse models was the proteinase
MMP-12. Using arrays with >50,000 probe sets, MMP-12 was identified as the third most highly
17
induced gene in alveolar macrophages from smokers, and we confirmed previous reports that
MMP-12 is highly induced in each of the mouse models (21, 22). MMP-12 is required for the
development of emphysema in Itgb6-/- mice and in cigarette smoke-exposed mice (20, 22).
However, whether MMP-12 contributes to human emphysema has been uncertain, due in part to
conflicting evidence about whether this proteinase is induced in human smokers (10, 13, 23, 24).
Using quantitative PCR, which has a very large dynamic range, we measured an even greater
degree of induction of MMP-12 transcripts in alveolar macrophages from smokers than
estimated by the arrays (41-fold, Fig. 2). However, we, like some others (10, 13), were unable to
reliably detect MMP-12 protein or activity by casein zymography, Western blotting or
Fluorokine MAP assays with antibody-coated microparticles performed on BAL fluid
concentrated using Microcon filters (data not shown). In a recent report (23), MMP-12 protein
was detected in highly concentrated lyophilized BAL fluid from subjects with COPD. Thus, we
are uncertain whether the large and consistent smoking-induced increases in MMP-12 transcript
levels that we observed lead to increased MMP-12 protein expression or function. In addition,
our data suggest that increased MMP-12 expression may not in itself be sufficient to cause
emphysema since expression was increased in all smokers independent of the degree of
impairment in lung function (Figure 6D). Other genes induced in both human smokers and in
mouse models include PAF acetylhydrolase (PLA2G7, the second most highly induced gene in
smokers), monocyte chemoattractant protein-1 (CCL2), and chemokine receptor 5 (CCR5)
(Table 4). Mouse models will likely continue to be useful tools for helping to investigate the
possible contributions of these genes to emphysema.
18
Many of the gene expression changes induced by smoking were not apparent in either of the
transgenic mouse models. A notable example is the enzyme CYP1B1, the most highly induced
gene in smokers. This cytochrome P450-family protein is known to be induced by cigarette
smoke (37, 45) and produce carcinogenic DNA adducts in the process of detoxifying combustion
products in smoke. Another gene induced only in smokers was glutathione reductase (2.1-fold
induced, adjusted p<0.01), which plays an important role in protection against oxidative stress in
human alveolar macrophages (46).We found that Igf-I transcripts were decreased in smokers but
increased in mouse models and confirmed these changes at the protein level in BALF. Igf-I
inhibits apoptosis of lung epithelial cells (47) suggesting that decreases in Igf-I could contribute
to the increased epithelial cell apoptosis seen in human emphysema (48, 49). This pattern of
expression also differentiates smoking-induced alveolar macrophage activation from findings in
other lung diseases such as idiopathic pulmonary fibrosis which are characterized by increased
macrophage expression of Igf-I (50-52). Another distinctive gene expression change observed in
smokers which contrasted sharply with mouse models was increased expression of osteopontin.
BAL fluid protein analysis confirmed increased expression of osteopontin in smokers and
decreased expression in Itgb6-/- mice. Osteopontin is a multifunctional protein that has been
implicated in macrophage recruitment (53, 54) and plays a role in osteoclast differentiation and
activation (55, 56) which suggests parallels between smoke-exposed alveolar macrophages and
osteoclasts involved in degrading bone matrix. The role of each of these smoking-induced gene
expression changes requires further study in humans and in suitable model systems.
We found that habitual cigarette smoking induces a remarkably consistent pattern of gene
expression changes in all of the subjects that we studied, but epidemiologic data suggest that

19
only a subset of smokers develop COPD (57). We speculate that risk and susceptibility factors
for COPD could function at three levels. First, the risk of COPD is related to the dose and
duration of smoking exposure (58, 59), suggesting that COPD risk may relate to the cumulative
effects of the consistently observed changes in macrophage gene expression in smokers. Second,
there may be differences between individuals in the response of specific genes to smoking. For
example, we found that osteopontin was increased in all smokers, but that the extent of this
increase was greater in patients with more severe lung function impairment (Fig. 6C). Further
studies involving subjects with more extreme lung function abnormalities might allow for the
identification of other macrophage gene expression changes that are selectively associated with
the development of COPD in a subset of smokers. Third, it seems likely that susceptibility to
COPD may relate to differences in the response of the lung to smoking-induced macrophage
activation. For example, MMP-12 (which was elevated in smokers without apparent relation to
lung function) might produce emphysema more readily in smokers with lower levels of
antiproteinase activity. Our findings demonstrate that macrophage function is markedly altered
by smoking and provide a useful framework for future studies that focus on contributions of
specific macrophage gene expression changes to the pathogenesis of smoking-induced lung
disease in humans.

20
Acknowledgements: We thank John V. Fahy, Chris Barker, Chandi Griffin, Jennifer Gregg,
Dean Sheppard, Samantha Donnelley, Stephen C. Lazarus, Peggy Cadbury, Hofer Wong, and
Byron Alex for their assistance and advice.

21
References 1. World Bank. 1999. Curbing the epidemic: Governments and the economics of tobacco
control. The International Bank for Reconstruction and Development, Washington, DC.
2. Centers for Disease Control and Prevention. 2004. Cigarette smoking among adults -
United States, 2002. Morbidity and Mortality Weekly Report. U.S. Department of Health and
Human Services, Washington, D.C. 427-431.
3. Barnes PJ, Shapiro SD, Pauwels RA. Chronic obstructive pulmonary disease: molecular
and cellular mechanisms. Eur Respir J 2003;22(4):672-88.
4. Selman M. The spectrum of smoking-related interstitial lung disorders: the never-ending
story of smoke and disease. Chest 2003;124(4):1185-7.
5. van der Vaart H, Postma DS, Timens W, ten Hacken NH. Acute effects of cigarette
smoke on inflammation and oxidative stress: a review. Thorax 2004;59(8):713-21.
6. Di Stefano A, Turato G, Maestrelli P, Mapp CE, Ruggieri MP, Roggeri A, Boschetto P,
Fabbri LM, Saetta M. Airflow limitation in chronic bronchitis is associated with T-lymphocyte
and macrophage infiltration of the bronchial mucosa. Am J Respir Crit Care Med
1996;153(2):629-32.
7. King TE, Jr., Savici D, Campbell PA. Phagocytosis and killing of Listeria
monocytogenes by alveolar macrophages: smokers versus nonsmokers. J Infect Dis
1988;158(6):1309-16.
8. Davis WB, Pacht ER, Spatafora M, Martin WJ, 2nd. Enhanced cytotoxic potential of
alveolar macrophages from cigarette smokers. J Lab Clin Med 1988;111(3):293-8.

22
9. Finlay GA, Russell KJ, McMahon KJ, D'Arcy E M, Masterson JB, FitzGerald MX,
O'Connor CM. Elevated levels of matrix metalloproteinases in bronchoalveolar lavage fluid of
emphysematous patients. Thorax 1997;52(6):502-6.
10. Finlay GA, O'Driscoll LR, Russell KJ, D'Arcy EM, Masterson JB, FitzGerald MX,
O'Connor CM. Matrix metalloproteinase expression and production by alveolar macrophages in
emphysema. Am J Respir Crit Care Med 1997;156(1):240-7.
11. Ohnishi K, Takagi M, Kurokawa Y, Satomi S, Konttinen YT. Matrix metalloproteinase-
mediated extracellular matrix protein degradation in human pulmonary emphysema. Lab Invest
1998;78(9):1077-87.
12. Segura-Valdez L, Pardo A, Gaxiola M, Uhal BD, Becerril C, Selman M. Upregulation of
gelatinases A and B, collagenases 1 and 2, and increased parenchymal cell death in COPD. Chest
2000;117(3):684-94.
13. Imai K, Dalal SS, Chen ES, Downey R, Schulman LL, Ginsburg M, D'Armiento J.
Human collagenase (matrix metalloproteinase-1) expression in the lungs of patients with
emphysema. Am J Respir Crit Care Med 2001;163(3 Pt 1):786-91.
14. Russell RE, Culpitt SV, DeMatos C, Donnelly L, Smith M, Wiggins J, Barnes PJ.
Release and activity of matrix metalloproteinase-9 and tissue inhibitor of metalloproteinase-1 by
alveolar macrophages from patients with chronic obstructive pulmonary disease. Am J Respir
Cell Mol Biol 2002;26(5):602-9.
15. Lim S, Roche N, Oliver BG, Mattos W, Barnes PJ, Chung KF. Balance of matrix
metalloprotease-9 and tissue inhibitor of metalloprotease-1 from alveolar macrophages in
cigarette smokers. Regulation by interleukin-10. Am J Respir Crit Care Med 2000;162(4 Pt
1):1355-60.

23
16. Takeyabu K, Betsuyaku T, Nishimura M, Yoshioka A, Tanino M, Miyamoto K,
Kawakami Y. Cysteine proteinases and cystatin C in bronchoalveolar lavage fluid from subjects
with subclinical emphysema. Eur Respir J 1998;12(5):1033-9.
17. Takahashi H, Ishidoh K, Muno D, Ohwada A, Nukiwa T, Kominami E, Kira S. Cathepsin
L activity is increased in alveolar macrophages and bronchoalveolar lavage fluid of smokers. Am
Rev Respir Dis 1993;147(6 Pt 1):1562-8.
18. Reilly JJ, Jr., Chen P, Sailor LZ, Wilcox D, Mason RW, Chapman HA, Jr. Cigarette
smoking induces an elastolytic cysteine proteinase in macrophages distinct from cathepsin L. Am
J Physiol 1991;261(2 Pt 1):L41-8.
19. Joos L, He JQ, Shepherdson MB, Connett JE, Anthonisen NR, Pare PD, Sandford AJ.
The role of matrix metalloproteinase polymorphisms in the rate of decline in lung function. Hum
Mol Genet 2002;11(5):569-76.
20. Hautamaki RD, Kobayashi DK, Senior RM, Shapiro SD. Requirement for macrophage
elastase for cigarette smoke-induced emphysema in mice. Science 1997;277(5334):2002-4.
21. Zheng T, Zhu Z, Wang Z, Homer RJ, Ma B, Riese RJ, Jr., Chapman HA, Jr., Shapiro SD,
Elias JA. Inducible targeting of IL-13 to the adult lung causes matrix metalloproteinase- and
cathepsin-dependent emphysema. J Clin Invest 2000;106(9):1081-93.
22. Morris DG, Huang X, Kaminski N, Wang Y, Shapiro SD, Dolganov G, Glick A,
Sheppard D. Loss of integrin alpha(v)beta6-mediated TGF-beta activation causes Mmp12-
dependent emphysema. Nature 2003;422(6928):169-73.
23. Molet S, Belleguic C, Lena H, Germain N, Bertrand CP, Shapiro SD, Planquois JM,
Delaval P, Lagente V. Increase in macrophage elastase (MMP-12) in lungs from patients with
chronic obstructive pulmonary disease. Inflamm Res 2005;54(1):31-6.

24
24. Grumelli S, et al. An Immune Basis for Lung Parenchymal Destruction in Chronic
Obstructive Pulmonary Disease and Emphysema. Plos Med 2004;1(1):e8.
25. Churg A, Wright JL. Proteases and emphysema. Curr Opin Pulm Med 2005;11(2):153-9.
26. Koth LL, Rodriguez MW, Yang JY, Favoreto S, Dolganov GM, Donnelly S, Erle DJ,
Woodruff PG. Gene expression microarray analysis of BALF macrophages from smokers,
asthmatics, and healthy subjects. Proc Am Thorac Soc 2005;2.
27. Fahy JV, Wong H, Liu J, Boushey HA. Comparison of samples collected by sputum
induction and bronchoscopy from asthmatic and healthy subjects. Am J Respir Crit Care Med
1995;152(1):53-8.
28. Maus U, Rosseau S, Seeger W, Lohmeyer J. Separation of human alveolar macrophages
by flow cytometry. Am J Physiol 1997;272(3 Pt 1):L566-71.
29. Huang XZ, Wu JF, Cass D, Erle DJ, Corry D, Young SG, Farese RV, Jr., Sheppard D.
Inactivation of the integrin beta 6 subunit gene reveals a role of epithelial integrins in regulating
inflammation in the lung and skin. J Cell Biol 1996;133(4):921-8.
30. Zhu Z, Homer RJ, Wang Z, Chen Q, Geba GP, Wang J, Zhang Y, Elias JA. Pulmonary
expression of interleukin-13 causes inflammation, mucus hypersecretion, subepithelial fibrosis,
physiologic abnormalities, and eotaxin production. J Clin Invest 1999;103(6):779-88.
31. Kuperman DA, Huang X, Koth LL, Chang GH, Dolganov GM, Zhu Z, Elias JA,
Sheppard D, Erle DJ. Direct effects of interleukin-13 on epithelial cells cause airway
hyperreactivity and mucus overproduction in asthma. Nat Med 2002;8(8):885-9.
32. Gentleman RC, et al. Bioconductor: open software development for computational
biology and bioinformatics. Genome Biol 2004;5(10):R80.
25
33. Irizarry RA, Bolstad BM, Collin F, Cope LM, Hobbs B, Speed TP. Summaries of
Affymetrix GeneChip probe level data. Nucleic Acids Res 2003;31(4):e15.
34. Bolstad BM, Irizarry RA, Astrand M, Speed TP. A comparison of normalization methods
for high density oligonucleotide array data based on variance and bias. Bioinformatics
2003;19(2):185-93.
35. Yang YH, Speed T. 2003. Design and analysis of comparative microarray experiments.
In T Speed, editor. Statistical analysis of gene expression microarray data. Chapman & Hall,
Boca Raton. 35-92.
36. Dolganov GM, Woodruff PG, Novikov AA, Zhang Y, Ferrando RE, Szubin R, Fahy JV.
A novel method of gene transcript profiling in airway biopsy homogenates reveals increased
expression of a Na+-K+-Cl- cotransporter (NKCC1) in asthmatic subjects. Genome Res
2001;11(9):1473-83.
37. Piipari R, et al. Expression of CYP1A1, CYP1B1 and CYP3A, and polycyclic aromatic
hydrocarbon-DNA adduct formation in bronchoalveolar macrophages of smokers and non-
smokers. Int J Cancer 2000;86(5):610-6.
38. Hesse M, Modolell M, La Flamme AC, Schito M, Fuentes JM, Cheever AW, Pearce EJ,
Wynn TA. Differential regulation of nitric oxide synthase-2 and arginase-1 by type 1/type 2
cytokines in vivo: granulomatous pathology is shaped by the pattern of L-arginine metabolism. J
Immunol 2001;167(11):6533-44.
39. Munder M, Eichmann K, Modolell M. Alternative metabolic states in murine
macrophages reflected by the nitric oxide synthase/arginase balance: competitive regulation by
CD4+ T cells correlates with Th1/Th2 phenotype. J Immunol 1998;160(11):5347-54.

26
40. Cormier SA, Yuan S, Crosby JR, Protheroe CA, Dimina DM, Hines EM, Lee NA, Lee JJ.
T(H)2-mediated pulmonary inflammation leads to the differential expression of ribonuclease
genes by alveolar macrophages. Am J Respir Cell Mol Biol 2002;27(6):678-87.
41. Gratchev A, Guillot P, Hakiy N, Politz O, Orfanos CE, Schledzewski K, Goerdt S.
Alternatively activated macrophages differentially express fibronectin and its splice variants and
the extracellular matrix protein betaIG-H3. Scand J Immunol 2001;53(4):386-92.
42. Raes G, De Baetselier P, Noel W, Beschin A, Brombacher F, Hassanzadeh Gh G.
Differential expression of FIZZ1 and Ym1 in alternatively versus classically activated
macrophages. J Leukoc Biol 2002;71(4):597-602.
43. Webb DC, McKenzie AN, Foster PS. Expression of the Ym2 lectin-binding protein is
dependent on interleukin (IL)-4 and IL-13 signal transduction: identification of a novel allergy-
associated protein. J Biol Chem 2001;276(45):41969-76.
44. Lee CG, et al. Interleukin-13 induces tissue fibrosis by selectively stimulating and
activating transforming growth factor beta(1). J Exp Med 2001;194(6):809-21.
45. Port JL, et al. Tobacco smoke induces CYP1B1 in the aerodigestive tract. Carcinogenesis
2004;25(11):2275-81.
46. Pietarinen P, Raivio K, Devlin RB, Crapo JD, Chang LY, Kinnula VL. Catalase and
glutathione reductase protection of human alveolar macrophages during oxidant exposure in
vitro. Am J Respir Cell Mol Biol 1995;13(4):434-41.
47. Warshamana-Greene GS, Litz J, Buchdunger E, Garcia-Echeverria C, Hofmann F,
Krystal GW. The insulin-like growth factor-I receptor kinase inhibitor, NVP-ADW742,
sensitizes small cell lung cancer cell lines to the effects of chemotherapy. Clin Cancer Res
2005;11(4):1563-71.

27
48. Kasahara Y, Tuder RM, Taraseviciene-Stewart L, Le Cras TD, Abman S, Hirth PK,
Waltenberger J, Voelkel NF. Inhibition of VEGF receptors causes lung cell apoptosis and
emphysema. J Clin Invest 2000;106(11):1311-9.
49. Yokohori N, Aoshiba K, Nagai A. Increased levels of cell death and proliferation in
alveolar wall cells in patients with pulmonary emphysema. Chest 2004;125(2):626-32.
50. Rom WN, Basset P, Fells GA, Toshihiro N, Trapnell B, Crystal R. Alveolar macrophages
release an insulin-like growth factor I-type molecule. J Clin Invest 1988;82:1685-1693.
51. Wynes MW, Riches DW. Induction of macrophage insulin-like growth factor-I
expression by the Th2 cytokines IL-4 and IL-13. J Immunol 2003;171(7):3550-9.
52. Uh ST, Inoue Y, King TE, Chan ED, Newman LS, Riches DW. Morphometric analysis
of insulin-like growth factor-I localization in lung tissues of patients with idiopathic pulmonary
fibrosis. Am J Respir Crit Care Med 1998;158:1626.
53. O'Regan A. The role of osteopontin in lung disease. Cytokine Growth Factor Rev
2003;14(6):479-88.
54. Denhardt DT, Noda M, O'Regan AW, Pavlin D, Berman JS. Osteopontin as a means to
cope with environmental insults: regulation of inflammation, tissue remodeling, and cell
survival. J Clin Invest 2001;107(9):1055-61.
55. Aitken CJ, Hodge JM, Nicholson GC. Adenoviral down-regulation of osteopontin
inhibits human osteoclast differentiation in vitro. J Cell Biochem 2004;93(5):896-903.
56. Chellaiah MA, Kizer N, Biswas R, Alvarez U, Strauss-Schoenberger J, Rifas L, Rittling
SR, Denhardt DT, Hruska KA. Osteopontin deficiency produces osteoclast dysfunction due to
reduced CD44 surface expression. Mol Biol Cell 2003;14(1):173-89.

28
57. Fletcher C, Peto R, Tinker C. The natural history of chronic bronchitis and emphysema:
an eight-year study of early chronic obstructive lung disease in working men in London. Oxford
University Press, London; 1976.
58. Xu X, Dockery DW, Ware JH, Speizer FE, Ferris BG, Jr. Effects of cigarette smoking on
rate of loss of pulmonary function in adults: a longitudinal assessment. Am Rev Respir Dis
1992;146(5 Pt 1):1345-8.
59. Burrows B, Knudson RJ, Cline MG, Lebowitz MD. Quantitative relationships between
cigarette smoking and ventilatory function. Am Rev Respir Dis 1977;115(2):195-205.
29
Figure Legends
Figure 1. Cigarette smoking had a robust and consistent effect on gene expression in
human alveolar macrophages that was not observed in stable asthmatics. Macrophage RNA
from smokers, controls and asthmatic subjects were analyzed on DNA microarrays. (A) Cluster
analysis using data for the 200 probe sets with the highest variance across 15 smokers and 15
non-smoking controls completely segregated the smokers from control subjects. The color map
depicts fold differences in intensity as compared with the median value for all subjects. Colored
bars at right indicate genes with increased expression in smokers (red), decreased expression in
smokers (green) and genes unrelated to smoking status (black). (B) The same approach did not
distinguish macrophage gene expression in 15 non-smoking asthmatics from that in 15 non-
smoking non-asthmatic controls (as indicated by dendrogram).
Figure 2: Quantitative PCR validation of differential gene expression detected using
microarrays. Fold difference as determined by microarray and real-time PCR in macrophages
from smokers as compared to healthy controls are presented for 12 genes found to be
differentially expressed by microarray. For all 12 genes, real-time PCR data confirmed
statistically significant differential expression in smokers (adjusted p<0.05).
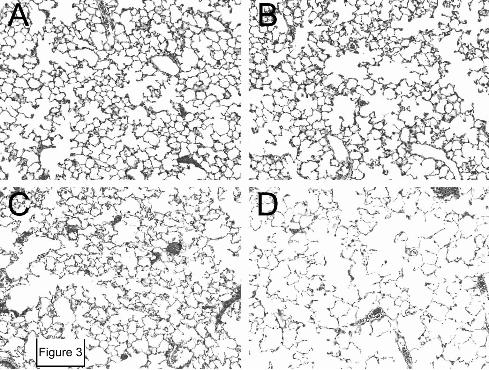
Figure 3: Histologic appearance of lungs from 2-, 6-, and 10-month-old integrin β6-
deficient mice. Sections of lung of 2-month-old wild type control mice (A) and 2-month-old (B),
6-month-old (C), and 10-month-old (D) integrin β6-deficient mice were stained with
hematoxylin and eosin and photographed using a 10 × objective.

30
Figure 4. Similar patterns of gene expression in alveolar macrophages from IL-13
overexpressing and integrin β6-deficient mice. Macrophage RNA from 2-month-old IL-13
overexpressing (IL-13 tg) and integrin β6-deficient (Itgb6-/-) mice and their respective wild type
controls (BALB/c and FVB) were analyzed on DNA microarrays (n = 3 per group). Additional
Itgb6-/- mice were studied at 10-months of age. Samples and genes were clustered using
expression data from the 200 probe sets with the highest variance. The color map indicates fold
difference as compared with the median value for all 6 controls (1 = no difference).
Figure 5. The most highly induced and repressed genes in alveolar macrophages from
smokers compared to results for orthologous genes from mouse models. The 10 genes with
greatest increase and decrease in expression in smokers are presented with shaded, hatched bars
indicating fold difference as compared to controls. Open bars denote fold difference for the
orthologous mouse gene in IL-13 overexpressing mice as compared to wild-type BALB/c
controls, and black bars denote fold difference for β6-deficient deficient mice as compared to
FVB controls. For three human genes (TDRD6, VGCNL1, and 242836_at; denoted by asterisks),
no orthologous gene was represented on the mouse arrays.
Figure 6. Distinctive changes in bronchoalveolar lavage fluid osteopontin protein
concentrations in smokers. (A) Osteopontin levels in bronchoalveolar lavage fluid from control
and integrin β6-deficient mice; * p=0.0001 versus controls. (B) Osteopontin levels in
bronchoalveolar lavage fluid from human control non-smokers and smokers; ** p=0.0003 versus
controls. (C, D) Relationship of airway obstruction (as measured by post-bronchodilator

31
FEV1/FVC ratio) to macrophage osteopontin and MMP-12 transcript expression in control non-
smokers (C) and smokers (S). The line indicates the correlation between FEV1/FVC in smoking
subjects and osteopontin or MMP-12 expression levels (for osteopontin, r=-0.64, p=0.011, for
MMP12, r=0.17, p=0.55 by Pearson correlation).

32
Table 1. Subject Characteristics
Controls Smokers Asthmatics
Number of subjects 15 15 15
Gender 10F/5M 2F/13M* 9F/6M
Age (years) 41±8 51±8* 35±10
FEV1 pre-bronchodilator (% predicted) 104±12% 80±15%* 81±15%*
FEV1/FVC pre-bronchodilator 0.80±0.06 0.62±0.12* 0.70±0.11*
FEV1 post-bronchodilator (% predicted) 107±12% 84±16%* 91±12%*
FEV1/FVC post-bronchodilator 0.83±0.05 0.67±0.14* 0.77±0.09
PC20 (mg/dl methacholine) 64 (64, 64) 11 (1.6, 48)* 0.5 (0.06, 1.2)*
Data are presented as mean ± SD or median (interquartile range). Abbreviations: FEV1, forced
expiratory volume in the first second; FVC, forced vital capacity; PC20, the concentration of
methacholine that caused a 20% decline in FEV1. * p<0.05 compared to non-smoking healthy
control subjects
33
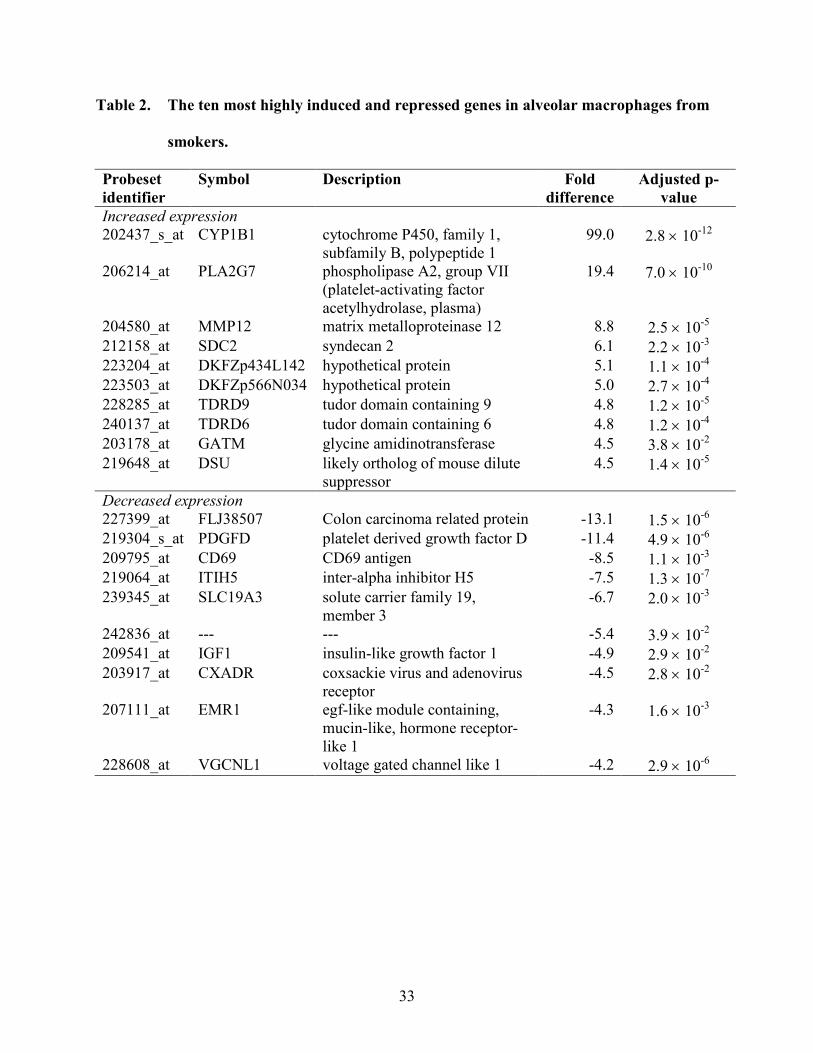
Table 2. The ten most highly induced and repressed genes in alveolar macrophages from
smokers.
Probeset identifier
Symbol Description Fold difference
Adjusted p-value
Increased expression 202437_s_at CYP1B1 cytochrome P450, family 1,
subfamily B, polypeptide 1 99.0 2.8 × 10⁻¹²
206214_at PLA2G7 phospholipase A2, group VII (platelet-activating factor acetylhydrolase, plasma)
19.4 7.0 × 10⁻¹⁰
204580_at MMP12 matrix metalloproteinase 12 8.8 2.5 × 10⁻⁵ 212158_at SDC2 syndecan 2 6.1 2.2 × 10⁻³ 223204_at DKFZp434L142 hypothetical protein 5.1 1.1 × 10⁻⁴ 223503_at DKFZp566N034 hypothetical protein 5.0 2.7 × 10⁻⁴ 228285_at TDRD9 tudor domain containing 9 4.8 1.2 × 10⁻⁵ 240137_at TDRD6 tudor domain containing 6 4.8 1.2 × 10⁻⁴ 203178_at GATM glycine amidinotransferase 4.5 3.8 × 10⁻² 219648_at DSU likely ortholog of mouse dilute
suppressor 4.5 1.4 × 10⁻⁵
Decreased expression 227399_at FLJ38507 Colon carcinoma related protein -13.1 1.5 × 10⁻⁶ 219304_s_at PDGFD platelet derived growth factor D -11.4 4.9 × 10⁻⁶ 209795_at CD69 CD69 antigen -8.5 1.1 × 10⁻³ 219064_at ITIH5 inter-alpha inhibitor H5 -7.5 1.3 × 10⁻⁷ 239345_at SLC19A3 solute carrier family 19,
member 3 -6.7 2.0 × 10⁻³
242836_at --- --- -5.4 3.9 × 10⁻² 209541_at IGF1 insulin-like growth factor 1 -4.9 2.9 × 10⁻² 203917_at CXADR coxsackie virus and adenovirus
receptor -4.5 2.8 × 10⁻²
207111_at EMR1 egf-like module containing, mucin-like, hormone receptor-like 1
-4.3 1.6 × 10⁻³
228608_at VGCNL1 voltage gated channel like 1 -4.2 2.9 × 10⁻⁶
34
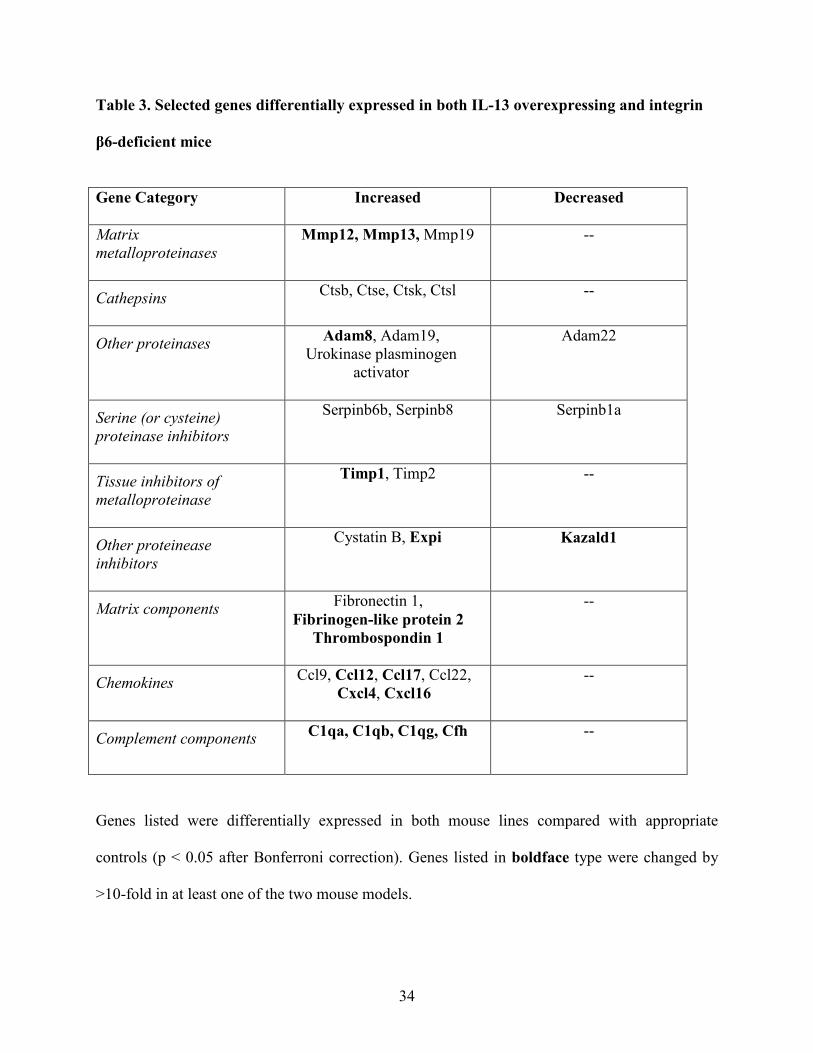
Table 3. Selected genes differentially expressed in both IL-13 overexpressing and integrin
β6-deficient mice
Gene Category Increased
Decreased
Matrix metalloproteinases
Mmp12, Mmp13, Mmp19 --
Cathepsins
Ctsb, Ctse, Ctsk, Ctsl --
Other proteinases
Adam8, Adam19, Urokinase plasminogen
activator
Adam22
Serine (or cysteine) proteinase inhibitors
Serpinb6b, Serpinb8 Serpinb1a
Tissue inhibitors of metalloproteinase
Timp1, Timp2 --
Other proteinease inhibitors
Cystatin B, Expi Kazald1
Matrix components Fibronectin 1, Fibrinogen-like protein 2
Thrombospondin 1
--
Chemokines Ccl9, Ccl12, Ccl17, Ccl22, Cxcl4, Cxcl16
--
Complement components
C1qa, C1qb, C1qg, Cfh --
Genes listed were differentially expressed in both mouse lines compared with appropriate
controls (p < 0.05 after Bonferroni correction). Genes listed in boldface type were changed by
>10-fold in at least one of the two mouse models.

35
Table 4. Genes differentially expressed in human smokers and at least one mouse model of
emphysema
Fold Difference*
Symbol Description Smokers IL-13 tg Itgb6-/-
Concordant changes PLA2G7 PAF acetylhydrolase 19.4 3.8 3.0MMP12 matrix metalloproteinase 12 8.8 14.5 22.1DKFZp434L142 hypothetical protein 5.1 22.6 35.0DSU likely ortholog of mouse dilute suppressor 4.5 5.2 4.3CLECSF5 C-type lectin, superfamily member 5 4.3 4.1 4.4BASP1 brain abundant, membrane attached signal
protein 1 3.3 3.0 2.8
FAM20C family with sequence similarity 20, member C 3.3 6.2 4.5TREM2 triggering receptor expressed on myeloid cells 2 3.1 5.3 4.5SLC26A11 solute carrier family 26, member 11 2.9 1.8 --CCR5 chemokine (C-C motif) receptor 5 2.7 15.8 7.7SLC7A11 solute carrier family 7, member 11 2.5 3.1 --CCL2 chemokine (C-C motif) ligand 2 1.9 6.2 11.1CSTB cystatin B 1.5 1.7 1.5C10orf128 hypothetical protein -1.7 -- -2.6NFIA nuclear factor I/A -2.3 -- -1.7RND3 Rho family GTPase 3 -3.9 -7.8 --RGS2 regulator of G-protein signaling 2 -3.9 -3.0 --
Discordant changes SPP1 Osteopontin 4.0 -- -13.9FLT1 vascular endothelial growth factor receptor 2.5 -- -24.3TGFBR1 Transforming growth factor, beta receptor I
(activin A receptor type II-like kinase, 53kDa) 2.2 -1.8 -2.5
GSR glutathione reductase 2.1 -- -4.1WWTR1 WW domain containing transcription regulator 1 1.7 -6.2 -24.3FGR Gardner-Rasheed feline sarcoma viral oncogene
homolog 1.6 -- -2.1
MGC15619 hypothetical protein 1.5 -- -2.8RAB11FIP5 RAB11 family interacting protein 5 (class I) -1.6 -- 1.7
C2 complement component 2 -1.7 2.4 --ITSN1 intersectin 1 -2.5 3.1 1.9THBS1 thrombospondin 1 -3.6 56.3 38.6NR4A2 nuclear receptor subfamily 4, group A, member
2-3.7 -- 6.5
IGF1 insulin-like growth factor 1 -4.9 89.4 6.4* All values represent statistically significant differences compared with appropriate controls (Bonferroni adjusted p < 0.05). Dashes (--) indicate no significant difference.


10 10 102 22222222 22 2Age (mo)
BALB/ccontrols
FVBcontrols
BALB/cIL-13 tg
FVBItgb6-/-
Fold difference-100 -10 1 10 100


Online Data Supplement
Manuscript title: A Distinctive Alveolar Macrophage Activation State Induced
by Cigarette Smoking
Authors: Prescott G. Woodruff, Laura L. Koth, Jean Yee Hwa Yang, Madeleine
Rodriguez, Silvio Favoreto, Gregory M. Dolganov, Agnes Paquet, David J. Erle
* This Online Data Supplement contains 6 tables in xls format that will be available online at wwww.atsjournals.org at the time of publication.
I. Detailed Materials and Methods:
Human subjects
The UCSF Committee on Human Research approved this study and signed
informed consent was obtained from all subjects. We studied 45 subjects (15
cigarette smokers, 15 healthy non-smoking controls and 15 non-smoking
subjects with asthma). Smokers and non-smoking controls were enrolled in a
two-visit cross-sectional study and the subjects with asthma were enrolled in
separate study that took place contemporaneously, using the same personnel,
equipment and methods.
Inclusion and exclusion criteria
Inclusion criteria for the smokers were age 30 to 65 and current smoking of at
least 10 cigarettes per day, with a history of at least 10 pack-years (defined as
smoking 1 pack per day per year). Exclusion criteria for smokers were a ratio of
forced expiratory volume in the first second (FEV1) to forced vital capacity (FVC)
<0.4, methacholine PC20<1 mg/mL (the concentration of methacholine required
to decrease the FEV1 by 20%), history of asthma, recent upper respiratory tract
infection, significant medical problems other than smoking-related lung disease,
history of home oxygen use, or admission to an intensive care unit for respiratory
failure. Inclusion criteria for non-smoking healthy control subjects were age 30 to
65, no history of lung disease, and a history of <10 pack-years of smoking with
no smoking in the previous 10 years. Inclusion criteria for subjects with asthma
were age 18 to 70, a prior physician diagnosis of asthma, use of only inhaled
beta-agonist medications for therapy, and at least one of the following: a) asthma
symptoms on at least two days per week, b) beta-agonist use on at least two
days per week, or c) FEV1 < 85% of predicted. The prior diagnosis of asthma
was confirmed by physician interview and documentation of bronchial
hyperresponsiveness (PC20 methacholine <8 mg/mL) at their first visit. No
subjects were using inhaled corticosteroids or leukotriene antagonists and all
asthmatic subjects were non-smokers.
Study procedures
At their first visit all subjects underwent history and physical examination,
completion of a symptom questionnaire, spirometry, and methacholine challenge
testing. Smokers also underwent measurement of diffusing capacity. At the
second visit one week later, bronchoscopy was performed.
Spirometry was performed according to American Thoracic Society criteria using
a dry rolling-seal spirometer (Model VRS2000, PDS Instrumentation, S&M
Instrument Co., Doylestown, PA).
Methacholine challenge was performed following the necessary medication holds
(albuterol for 8 hours and caffeine for 12 hours). Three spirometry maneuvers
were performed to establish the baseline and ensure it was ≥ 50% predicted.
Methacholine challenge was performed using a five-breath dosimeter method, a
method modified from Chai et al (1). Specifically, Provocholine® (Methacholine
Chloride Powder for Inhalation-Methapharm; Brantford, Ontario, Canada N3T
2V6) was diluted in sterile 0.9% sodium chloride injection, USP diluent (Abbott
Laboratories; North Chicago, IL 60064, USA) and delivered from a hand-held
nebulizer (DeVilbiss No.646; Somerset, PA, USA). The nebulizer was connected
to a dose-metering device (Model: Micro-Dosimeter, S&M Instrument Company,
Inc.; 202 Airport Boulevard, Doylestown, PA 18901, USA), which was driven by
compressed oxygen at 20 psi and equipped with a critical orifice, 7 mm in
diameter, at the inflow end to allow a maximum inspiratory flow of 500 mL/min.
Inspiration by the subject triggered a solenoid valve in the dosimeter to open for
0.6 seconds and deliver an average of 4.6 µL/actuation of methacholine from a 2
mL reservoir. Subjects took 5 inhalations of aerosol breathing from functional
residual capacity to total lung capacity. Three FEV1 maneuvers were measured
2.5 minutes after the end of the fifth inhalation of 0.9% sodium chloride saline
diluent and the best of these maneuvers was used as the post-diluent FEV1.
The initial concentration of methacholine administered was 0.03125 mg/mL; a
dose response curve was constructed by administering serial doubling
concentrations of methacholine to 64 mg/mL at 5 minute intervals until the best
post-methacholine FEV1 (confirmed with a second spirometry maneuver 30
seconds later) was ≤ 80% of the post-diluent FEV1. The provocative
concentration of methacholine required to produce a 20% decline in FEV1
(PC20) was calculated by linear interpolation between the last two points on the
dose-response curve.
Single-breath diffusing capacity for carbon monoxide (DLCO) was measured
using a V Max Series (Sensormedic Corp.; Yorba Linda, CA, USA); subjects
refrained from smoking for at least 4 hours prior to testing. For this
measurement, subjects exhaled to residual volume, inhaled a gas mixture
(composed of 0.3% carbon monoxide, 0.3% methane, 21% oxygen, 78.4%
nitrogen) to total lung capacity, held their breath for 10 seconds, and exhaled to
residual volume. The exhaled gas was analyzed for the concentrations of carbon
monoxide and methane. The test was repeated twice, with 5 minutes of rest
between tests. The average of 3 acceptable tests (matching within 5% of each
test) was used for the final value. Measurement of alveolar volume was also
obtained, and correction of the diffusing capacity for volume was calculated
(DL/VA).
Bronchoscopy was performed after pre-treatment with 360mcg albuterol for all
subjects (including healthy controls) using specific methods previously described
(2). Bronchoalveolar lavage (BAL) was performed by instilling two 50 mL
aliquots of saline into a segment of either the right middle lobe or lingula followed
by two 50 mL aliquots in the other segment of the same lobe. BAL fluid was
filtered through gauze, cytocentrifuged at 500g for 5 minutes, and the cells
resuspended in RPMI (Mediatech, Inc, Herndon, VA).
Mice
Animal studies were approved by the UCSF Institutional Animal Care and Use
Committee and were housed according to guidelines established by the UCSF
Laboratory Animal Resource Center. Mice with a deletion of the integrin β6 gene
(Itgb6-/- mice) (3) backcrossed 9 times to a FVB background were generously
provided by Dean Sheppard. The second model of emphysema we analyzed
were mice with constitutive transgenic expression of IL-13 by the CC10 promoter
(4), generously provided by Jack Elias. Mice used for these experiments were
Tg(CC10-IL-13)Stat6+/- mice on a Balb/c genetic background (herein referred to
as IL-13 tg) (5). These mice (like Tg(CC10-IL-13)Stat6+/+ mice) develop
spontaneous airspace enlargement by 2-4 months of age (5). At two months of
age, three mice from each experimental group (and littermate control groups)
underwent bronchoalveolar lavage (BAL). In additional experiments, three ten-
month old integrin β6-deficient mice underwent BAL to determine the effect of
age and disease progression on macrophage gene expression (IL-13 tg mice
were not studied as they do not survive beyond 3-4 months). BAL was performed
by instilling five 0.8 ml aliquots of PBS. BAL fluid cells were plated on tissue
culture plates for 30 min at 37˚C and non-adherent cells were removed by
vigorous washing with PBS. Adherent cells were >97% alveolar macrophages as
determined by Diffquik staining. Cell differential counts were performed on
Diffquik stained cytospins by counting 300-400 cells per mouse studied.
Analysis of alveolar macrophage RNA

RNA was extracted from mouse and human alveolar macrophages and DNAse-
treated using the RNeasy kit according to the manufacturer’s instructions
(Qiagen Inc. Valencia, CA). RNA concentration and quality were assessed using
the Bioanalyzer 2100 (Agilent Technologies, Palo Alto, CA).
For mouse Affymetrix GeneChip studies, total RNA (250 ng from each mouse)
was amplified using one round of in vitro transcription with incorporation of
biotinylated nucleotides (Message Amp II aRNA kit #1751, Ambion Austin, TX).
Amplified cRNA samples were hybridized to Affymetrix Mouse Genome 430 2.0
microarrays (Affymetrix, Santa Clara, CA) per the manufacturer’s instructions
with each mouse sample run on a separate array. For human samples, relatively
small quantities of RNA were available for GeneChip analysis. Therefore, 50 ng
of total RNA was amplified by performing 2 rounds of in vitro transcription
(Ambion Message Amp aRNA Kit #1750). Samples were hybridized to Affymetrix
Human Genome U133 Plus 2.0 GeneChips and post- hybridization processing
was performed according to the manufacturers' instructions. Samples were
amplified and hybridized in random order to avoid any effect of batch handling on
between-group differences.
Affymetrix microarray data analysis
Raw-image data were analyzed using GeneChip Expression Analysis Software
(Affymetrix) and quality control, preprocessing, cluster analysis, and linear
modeling were performed using Bioconductor (6) in the R statistical package (R
Foundation, Vienna, Austria). Quality control checks were performed using
affyPLM, and preprocessing of Affymetrix CEL files was performed using the
robust multi-array average (RMA) algorithm (7, 8). Unsupervised hierarchical
clustering was performed using Pearson correlation. Differential gene expression
was assessed using linear models (controlling for age and gender in human
samples). For each probe set, we computed the fold-change, moderated t-
statistics and p-value. Differentially expressed probe sets were selected based
on adjusted p-value <0.05 using Bonferroni correction. Expression levels of
MMP-12 and osteopontin were correlated with measures of lung function using
Pearson correlation.
Quantitative Real-time PCR
Two sets of nested primers and a probe were designed for each gene of interest
using “Primer Express” software (Perkin Elmer; Foster City, CA) based on
sequencing data from NCBI databases (Table E6). First strand cDNA synthesis
was carried out as described (9) using 20 ng of total RNA and Clontech BD
Biosciences Powerscript Reverse Transcriptase and random hexamer priming.
Then multiplex pre-amplification was performed using 1/5 of the resultant cDNA,
Clontech Advantage 2 Polymerase, and 5 picomoles of each outflanking primer.
Multiplex hot-start amplification was done for 5, 10, 15, and 20 cycles to ensure
that the reaction remained in the exponential phase of PCR and the substrates
were not limiting (9). Real-time PCR gene quantification was then performed on
the amplified cDNA using a TaqMan probe (Applied Biosystems, Inc.; Foster
City, CA, USA). Transcript quantification was run on an ABI Prizm 7900
Sequence Detection System (Applied Biosystems, Inc.; Foster City, CA). Cycle
threshold values obtained for each gene were then converted into relative
transcript copy numbers based on logarithmic transformation and linear
regression of prior data, as previously described (9). Transcript copy numbers
were normalized using a two-step approach. First, the amount of starting cDNA
used in TaqMan profiling was normalized on the basis of housekeeping gene
expression. Then a panel of four housekeeping genes was measured during
TaqMan profiling (GAPDH, ubiquitin, PPIA, EEF1A1), and the geometric mean
transcript copy number of these four housekeeping genes was used for
normalization of results.
ELISAs
We measured levels of osteopontin and insulin-like growth factor-I in
concentrated bronchoalveolar lavage fluid from smokers and nonsmokers by
ELISA according to the manufacturer’s protocols (Quantikine kits, R & D
Systems, MN). Bronchoalveolar lavage fluid was concentrated 5-fold (human
samples) or 3.5-fold (mouse samples) using Microcon filters (Millipore, Bedford
MA). Between group comparisons were made using Student’s t-test.

References for Online Data Supplement
E1. Chai H, Farr RS, Froehlich LA, Mathison DA, McLean JA, Rosenthal RR,
Sheffer AL, Spector SL, Townley RG. Standardization of bronchial inhalation
challenge procedures. J Allergy Clin Immunol 1975;56(4):323-7.
E2. Fahy JV, Wong H, Liu J, Boushey HA. Comparison of samples collected
by sputum induction and bronchoscopy from asthmatic and healthy subjects.
Am J Respir Crit Care Med 1995;152(1):53-8.
E3. Huang XZ, Wu JF, Cass D, Erle DJ, Corry D, Young SG, Farese RV, Jr.,
Sheppard D. Inactivation of the integrin beta 6 subunit gene reveals a role of
epithelial integrins in regulating inflammation in the lung and skin. J Cell Biol
1996;133(4):921-8.
E4. Zhu Z, Homer RJ, Wang Z, Chen Q, Geba GP, Wang J, Zhang Y, Elias
JA. Pulmonary expression of interleukin-13 causes inflammation, mucus
hypersecretion, subepithelial fibrosis, physiologic abnormalities, and eotaxin
production. J Clin Invest 1999;103(6):779-88.
E5. Kuperman DA, Huang X, Koth LL, Chang GH, Dolganov GM, Zhu Z, Elias
JA, Sheppard D, Erle DJ. Direct effects of interleukin-13 on epithelial cells
cause airway hyperreactivity and mucus overproduction in asthma. Nat Med
2002;8(8):885-9.
E6. Gentleman RC, et al. Bioconductor: open software development for
computational biology and bioinformatics. Genome Biol 2004;5(10):R80.

E7. Irizarry RA, Bolstad BM, Collin F, Cope LM, Hobbs B, Speed TP. Summaries
of Affymetrix GeneChip probe level data. Nucleic Acids Res 2003;31(4):e15.
E8. Bolstad BM, Irizarry RA, Astrand M, Speed TP. A comparison of
normalization methods for high density oligonucleotide array data based on
variance and bias. Bioinformatics 2003;19(2):185-93.
E9. Dolganov GM, Woodruff PG, Novikov AA, Zhang Y, Ferrando RE, Szubin R,
Fahy JV. A novel method of gene transcript profiling in airway biopsy
homogenates reveals increased expression of a Na+-K+-Cl- cotransporter
(NKCC1) in asthmatic subjects. Genome Res 2001;11(9):1473-83.
II. Supplementary data tables Table E1. Probe sets coding for genes differentially expressed in smokers
compared to healthy non-smoking controls (Bonferroni adjusted p-value<0.05).
Table E2: Probe sets differentially expressed in asthmatics compared to healthy
non-smoking controls (Bonferroni adjusted p-value<0.05).
Table E3: Probe sets coding for genes differentially expressed in interleukin-13
overexpressing transgenic mice as compared to strain matched controls
(Bonferroni adjusted p-value<0.05).
Table E4: Probe sets coding for genes differentially expressed in integrin β6-
deficient mice as compared to their strain matched controls (Bonferroni adjusted
p-value<0.05).
Table E5: Gene expression in macrophages from 10-month-old versus 2-month-
old integrin β6-deficient mice. The table includes probe sets for all mouse
orthologs of the human genes identified as differentially expressed in smokers.
Table E6: Primer and probe sequences for PCR (5’ to 3’ orientation).
Copyright © 2022 FDOKUMEN