A study on Effectiveness of advertisement on sales turnover of ...
54
“A STUDY ON EFFECTIVENESS OF ADVERTISEMENT ON SALES TURNOVER OF SOAP MANUFACTURING INDUSTRIES” Project Report submitted to UNIVERSITY OF CALICUT In partial fulfillment of the requirement for the award of the degree of BACHELOR OF BUSINESS ADMINISTRATION Submitted by MOHAMMED SUHAIL M M (CCASBBAR30) Under the supervision of Mr. LIPINRAJ K DEPARTMENT OF MANAGEMENT STUDIES CHRIST COLLEGE(AUTONOMOUS), IRINJALAKUDA MARCH 2021
-
Upload
khangminh22 -
Category
Documents
-
view
2 -
download
0
Transcript of A study on Effectiveness of advertisement on sales turnover of ...
“A STUDY ON EFFECTIVENESS OF ADVERTISEMENT ON
SALES TURNOVER OF SOAP MANUFACTURING
INDUSTRIES”
Project Report submitted to
UNIVERSITY OF CALICUT
In partial fulfillment of the requirement for the award of the degree of
BACHELOR OF BUSINESS ADMINISTRATION
Submitted by
MOHAMMED SUHAIL M M
(CCASBBAR30)
Under the supervision of
Mr. LIPINRAJ K
DEPARTMENT OF MANAGEMENT STUDIES
CHRIST COLLEGE(AUTONOMOUS), IRINJALAKUDA
MARCH 2021
CHRIST COLLEGE (AUTONOMOUS), IRINJALAKUDA
CALICUT UNIVERSITY
DEPARTMENT OF MANAGEMENT STUDIES
CERTIFICATE
This is to certify that the project entitled “A STUDY ON
EFFECTIVENESS OF ADVERTISEMENT ON SALES TURNOVER OF
SOAP MANUFACTURING INDUSTRIES” is a bonafide record of the project
done by MOHAMMED SUHAIL M M, CCASBBAR30, under my supervision
and guidance in partial fulfillment of the requirement for the award of the degree
of BACHELOR OF BUSINESS ADMINISTRATION and it has not previously
formed the basis for any Degree, Diploma and Associateship or Fellowship.
Prof. C.L.BABY JOHN Asst. Prof: LIPIN RAJ K.
Co-ordinator Project Guide
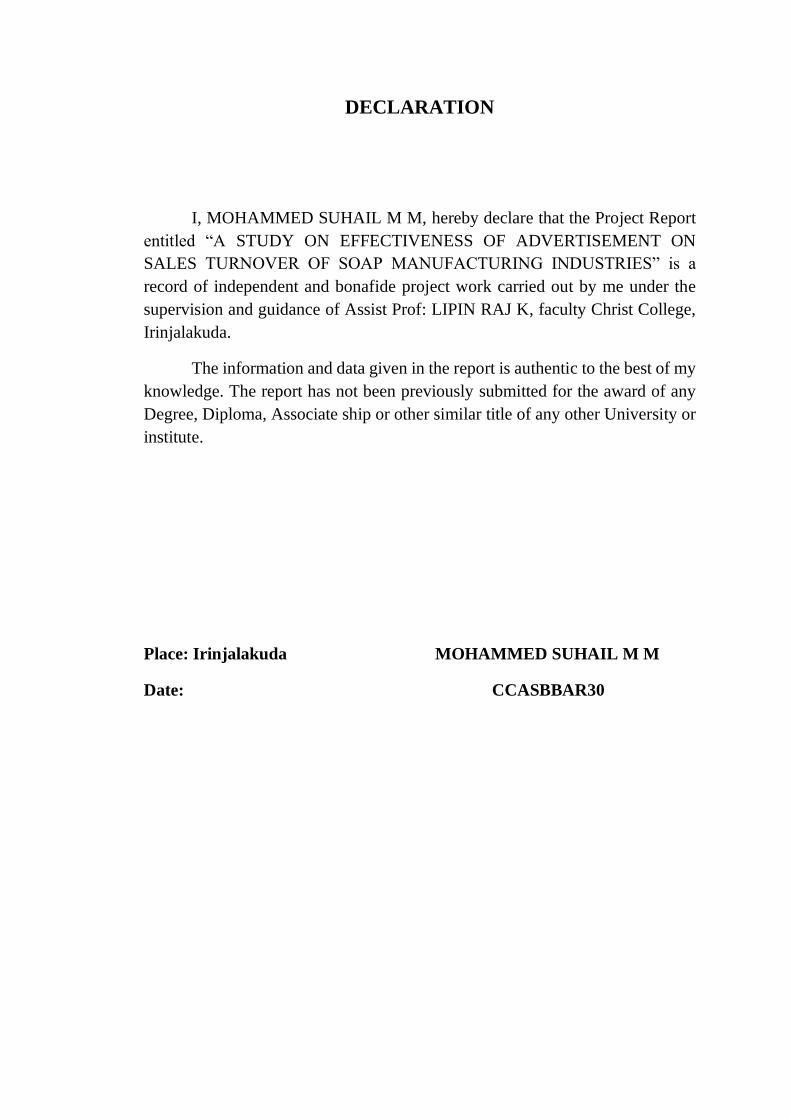
DECLARATION
I, MOHAMMED SUHAIL M M, hereby declare that the Project Report
entitled “A STUDY ON EFFECTIVENESS OF ADVERTISEMENT ON
SALES TURNOVER OF SOAP MANUFACTURING INDUSTRIES” is a
record of independent and bonafide project work carried out by me under the
supervision and guidance of Assist Prof: LIPIN RAJ K, faculty Christ College,
Irinjalakuda.
The information and data given in the report is authentic to the best of my
knowledge. The report has not been previously submitted for the award of any
Degree, Diploma, Associate ship or other similar title of any other University or
institute.
Place: Irinjalakuda MOHAMMED SUHAIL M M
Date: CCASBBAR30

ACKNOWLEDGEMENT
First all I am thankful to God. the almighty for all his blessings throughout
my life with a light and that helped me to do this project in better manner.
I express my sincere thanks and respect to Rev. Dr. JOLLY ANDREWS,
Principal of Christ College, Prof. C.L.BABY JOHN, Co-ordinator, of the
Department of Commerce, all faculties in Department for their motivation,
support and guidance throughout the preparation of this project.
I wish to express my deep sense of gratitude to my guide, Assist. Prof.
LIPIN RAJ K, Department of Commerce, Christ College, Irinjalakuda, for his
valuable support and providing me all possible opportunities for the fulfillment
of this study.
I am also thankful to my family members and friends for their constant
support and encouragement.
MOHAMMED SUHAIL M M
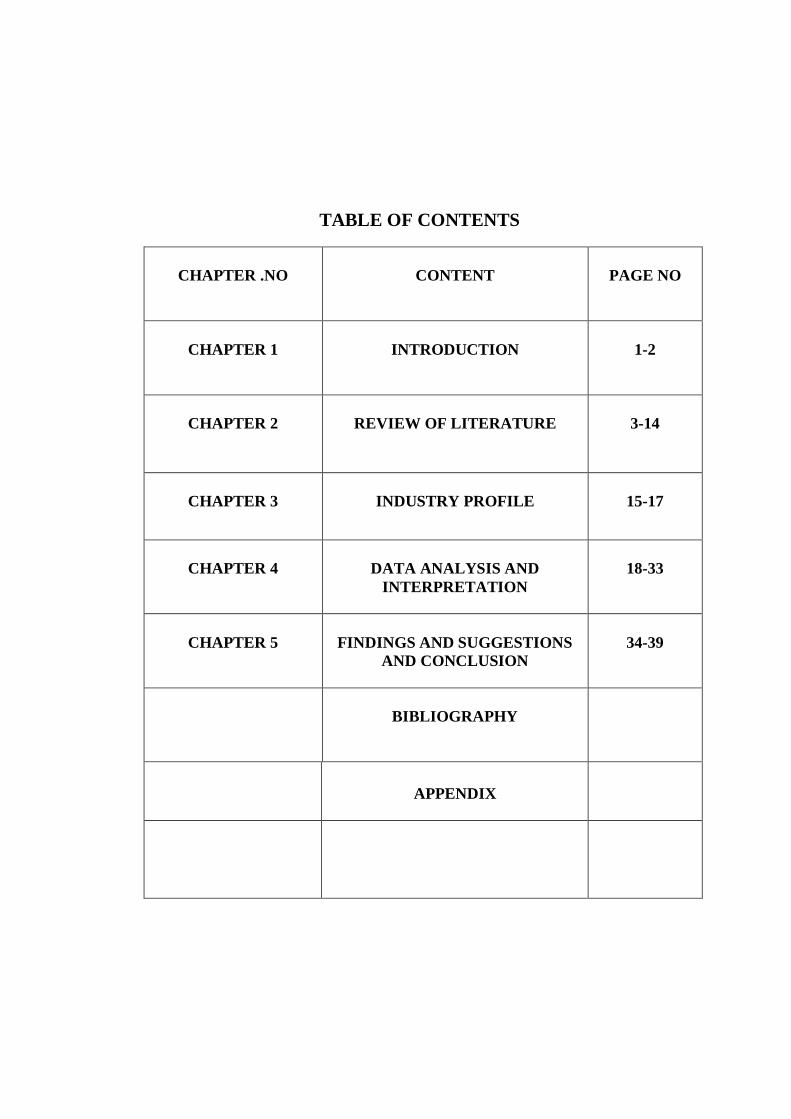
TABLE OF CONTENTS
CHAPTER .NO
CONTENT
PAGE NO
CHAPTER 1
INTRODUCTION
1-2
CHAPTER 2
REVIEW OF LITERATURE
3-14
CHAPTER 3
INDUSTRY PROFILE
15-17
CHAPTER 4
DATA ANALYSIS AND
INTERPRETATION
18-33
CHAPTER 5
FINDINGS AND SUGGESTIONS
AND CONCLUSION
34-39
BIBLIOGRAPHY
APPENDIX
LIST OF TABLES
TABLE
NO
TITLE
PAGE
NO
4.1
Table showing advertisement Influence on Buying Decision.
18
4.2
Table showing Effectiveness Advertisement
19
4.3
Table showing Media Prefer to see Advertisement
20
4.4
Table Showing Impact of Advertisement Lasting on
Respondents
21
4.5
Table Showing Shopping Dependency on Publicity of the
Company
22
4.6
Table Showing Most preferred Soaps for Daily Bathing.
23
4.7
Table Showing Reasons for Preferring the Soap.
24
4.8
Table showing the Purpose of Seeing Advertisement.
25
4.9
Table Showing Sales, Advertisement Expenditure and
Operating Profit of Vivel.(ITC)
26
4.10
Table Showing Sales, Advertisement Expenditure and
Operating Profit of Lux.
27
4.11
Table showing sales, advertisement expenditure and
operating profit of Santoor
28
4.12
Table showing sales, advertisement expenditure and
operating profit of Godrej No.1
29
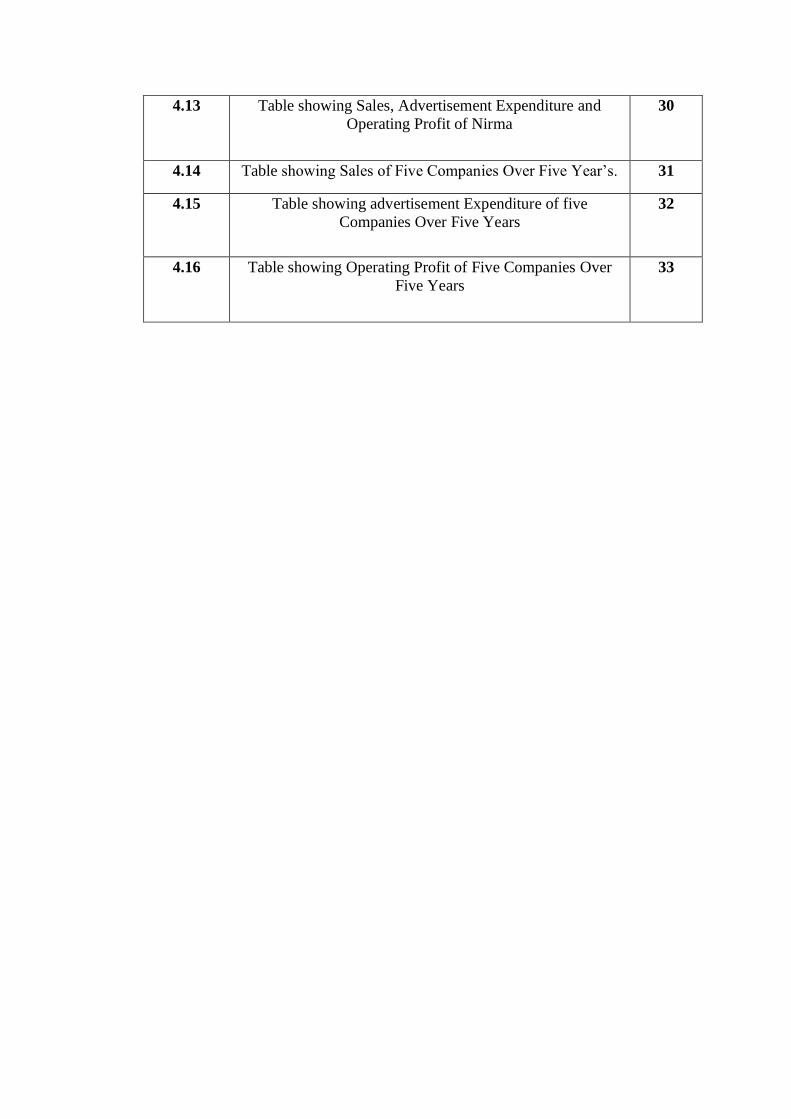
4.13 Table showing Sales, Advertisement Expenditure and
Operating Profit of Nirma
30
4.14 Table showing Sales of Five Companies Over Five Year’s. 31
4.15 Table showing advertisement Expenditure of five
Companies Over Five Years
32
4.16 Table showing Operating Profit of Five Companies Over
Five Years
33
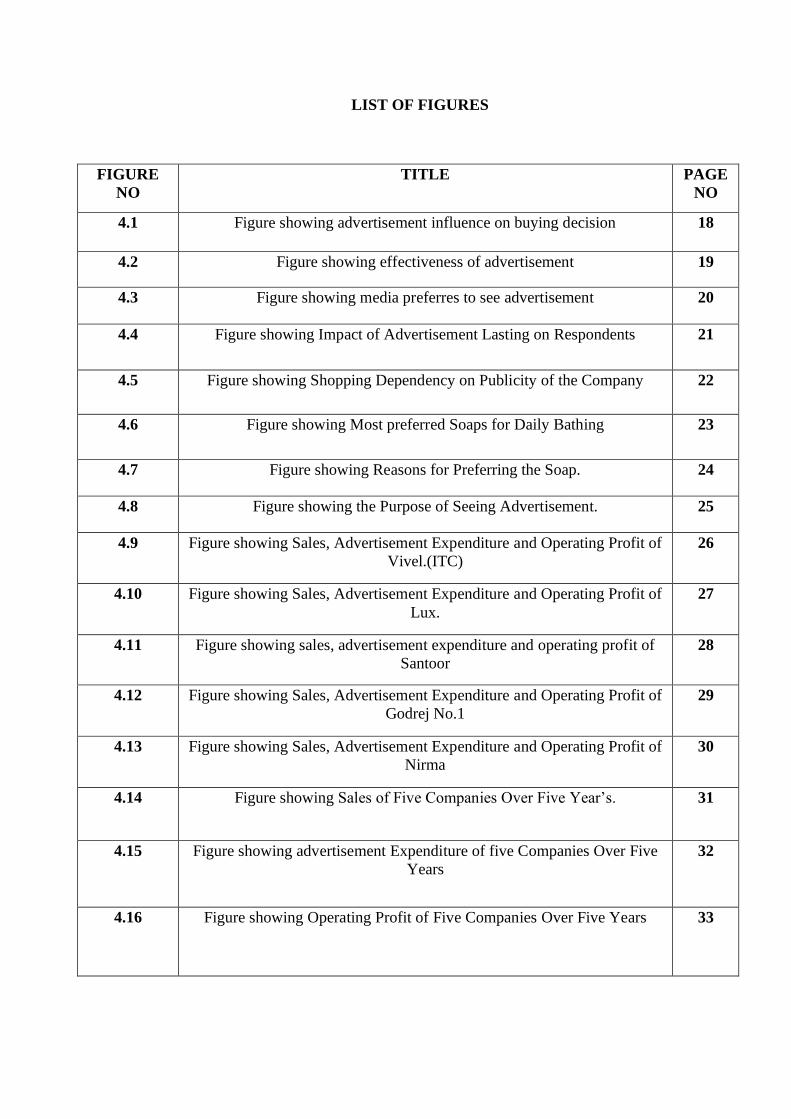
LIST OF FIGURES
FIGURE
NO
TITLE PAGE
NO
4.1 Figure showing advertisement influence on buying decision 18
4.2 Figure showing effectiveness of advertisement 19
4.3 Figure showing media preferres to see advertisement 20
4.4 Figure showing Impact of Advertisement Lasting on Respondents 21
4.5 Figure showing Shopping Dependency on Publicity of the Company 22
4.6 Figure showing Most preferred Soaps for Daily Bathing 23
4.7 Figure showing Reasons for Preferring the Soap. 24
4.8 Figure showing the Purpose of Seeing Advertisement. 25
4.9 Figure showing Sales, Advertisement Expenditure and Operating Profit of
Vivel.(ITC)
26
4.10 Figure showing Sales, Advertisement Expenditure and Operating Profit of
Lux.
27
4.11 Figure showing sales, advertisement expenditure and operating profit of
Santoor
28
4.12 Figure showing Sales, Advertisement Expenditure and Operating Profit of
Godrej No.1
29
4.13 Figure showing Sales, Advertisement Expenditure and Operating Profit of
Nirma
30
4.14 Figure showing Sales of Five Companies Over Five Year’s. 31
4.15 Figure showing advertisement Expenditure of five Companies Over Five
Years
32
4.16 Figure showing Operating Profit of Five Companies Over Five Years 33

CHAPTER 1
INTRODUCTION
1.1 INTRODUCTION
The study tries to examine the growth pattern and trend of sales and
advertisement expense for the selected companies over a period from 2010-
2015.Further it seeks to evaluate the effectiveness on advertisement expense on
sales of selected soap manufacturing companies in India. The study is based on
primary and secondary data collected for advertisement expenditure and sales
revenue of five randomly selected sample companies operating in India, over the
period from 2010-2015, which are further classified on the basis of amount of
sales revenue as well on the basis of type of product
The term advertising originates from the Latin word “adverto”, which
means to ‘turn round ‘Advertising has been defined as any paid form of non-
personal presentation and promotion of ideas, goods or services, by an identified
sponsor’. Advertisement is a prominent feature of modern business operations
.one can encounter advertising messages, while watching T V, Reading
magazines, listening to radio, surfing the internet or even simple while walking
down the street, advertisement has a stimulating influence on purchasing
behavior of the customer. Advertising about selling goods and services more
often to more people for more money.
1.2 Statement of problem
Advertisement is the most glamorous element of the promotion mix. It is
the poetry of marketing. It covers all activities connected with the giving of
publicity regarding goods and services offered by sales. Here the study is
conducted to know the effectiveness of advertisement on sales turnover of soap
manufacturing industries.
1.3 Objective of study
1. To assess the relation between advertisement and sales
2. To study the trend of sales related to advertisement for specified period
3. To know the effect of advertisement on customer’s buying decision.
1
1.4 Research methodology
Data require for the study, was obtained through primary and
secondary sources secondary data has been collected from published finance
statement of company website. The Primary data has been collected from fifty
samples using questionnaire. Judgment sampling techniques was used for
sampling. The collected data was analyzed with statistical Tools like percentage
comparison constituted the analysis part. Graphs, tables and charts has been used
to present the analysis in a better way.
1.5 Limitation
1. As this project is a three week project, time is a limiting factor
2. The analysis is made only by taking into account data for a period of past five
years
3. The analysis has been made purely on basis of sample response. 100%
accuracy in response cannot be ensured.
1.6 Chapterisation
Chapter 1: This chapter includes Introduction, Statement of problem, objective
of study, limitation of the study, research methodology and cauterization.
Chapter 2: It contains empirical and conceptual literature.
Chapter3: It show industry profile
Chapter 4:It includes graphs, tables and charts.
Chapter 5:This chapter deals with statistical tools like correlation, simple average
and percentage comparison.
Chapter 6:It includes summary, findings, recommendation, suggestions and
conclusion.
2

.
CHAPTER 2
REVIEW OF LITERATURE
3.1 Conceptual literatures
Definition of Advertisement;
“According to Hall “Advertising is salesmanship in writing, print or
pictures or spreading information by means of the written or printed words and
the pictures.”
Characteristics;
1. It is a non-personal communication to target audience.
2. It is a paid form of communication by an identified sponsor. (advertiser)
3. It provides information about products or services in a persuasive
manner.
4. It may be visual, spoken, or written.
5. It is a salesmanship in print.
6. It is a mass communication medium.
7. It stimulates sales.
Objectives;
1. To prepare a ground for new product.
2. To create, maintain and increase demand of products.
3. To face competition successfully.
4. To create or enhance goodwill.
5. To inform the changes regarding price, channel, of distribution,
product quality etc. to the public.
6. To create brand preference.
7. To educate consumers.
8. To capture a place in market and become a market leader.
9. To remind the consumers of the product from time to time.
10. To encourage the middlemen to maintain the stock of the enterprise.
3
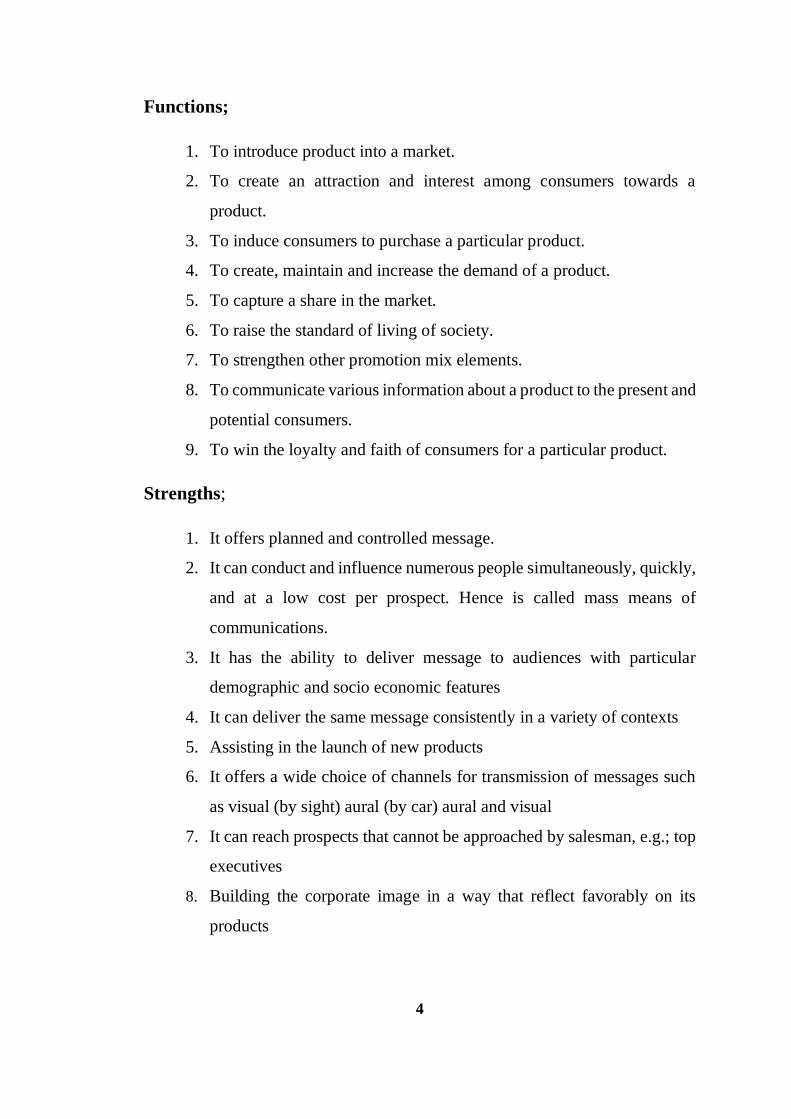
Functions;
1. To introduce product into a market.
2. To create an attraction and interest among consumers towards a
product.
3. To induce consumers to purchase a particular product.
4. To create, maintain and increase the demand of a product.
5. To capture a share in the market.
6. To raise the standard of living of society.
7. To strengthen other promotion mix elements.
8. To communicate various information about a product to the present and
potential consumers.
9. To win the loyalty and faith of consumers for a particular product.
Strengths;
1. It offers planned and controlled message.
2. It can conduct and influence numerous people simultaneously, quickly,
and at a low cost per prospect. Hence is called mass means of
communications.
3. It has the ability to deliver message to audiences with particular
demographic and socio economic features
4. It can deliver the same message consistently in a variety of contexts
5. Assisting in the launch of new products
6. It offers a wide choice of channels for transmission of messages such
as visual (by sight) aural (by car) aural and visual
7. It can reach prospects that cannot be approached by salesman, e.g.; top
executives
8. Building the corporate image in a way that reflect favorably on its
products
4
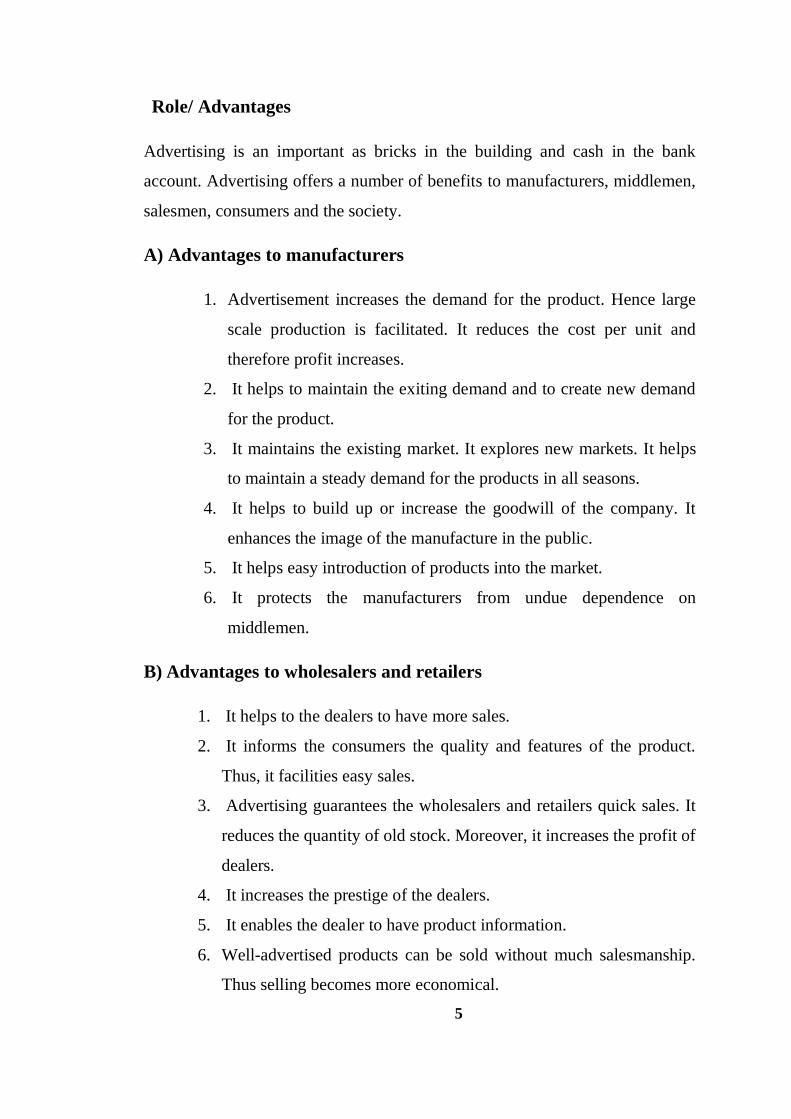
Role/ Advantages
Advertising is an important as bricks in the building and cash in the bank
account. Advertising offers a number of benefits to manufacturers, middlemen,
salesmen, consumers and the society.
A) Advantages to manufacturers
1. Advertisement increases the demand for the product. Hence large
scale production is facilitated. It reduces the cost per unit and
therefore profit increases.
2. It helps to maintain the exiting demand and to create new demand
for the product.
3. It maintains the existing market. It explores new markets. It helps
to maintain a steady demand for the products in all seasons.
4. It helps to build up or increase the goodwill of the company. It
enhances the image of the manufacture in the public.
5. It helps easy introduction of products into the market.
6. It protects the manufacturers from undue dependence on
middlemen.
B) Advantages to wholesalers and retailers
1. It helps to the dealers to have more sales.
2. It informs the consumers the quality and features of the product.
Thus, it facilities easy sales.
3. Advertising guarantees the wholesalers and retailers quick sales. It
reduces the quantity of old stock. Moreover, it increases the profit of
dealers.
4. It increases the prestige of the dealers.
5. It enables the dealer to have product information.
6. Well-advertised products can be sold without much salesmanship.
Thus selling becomes more economical.
5
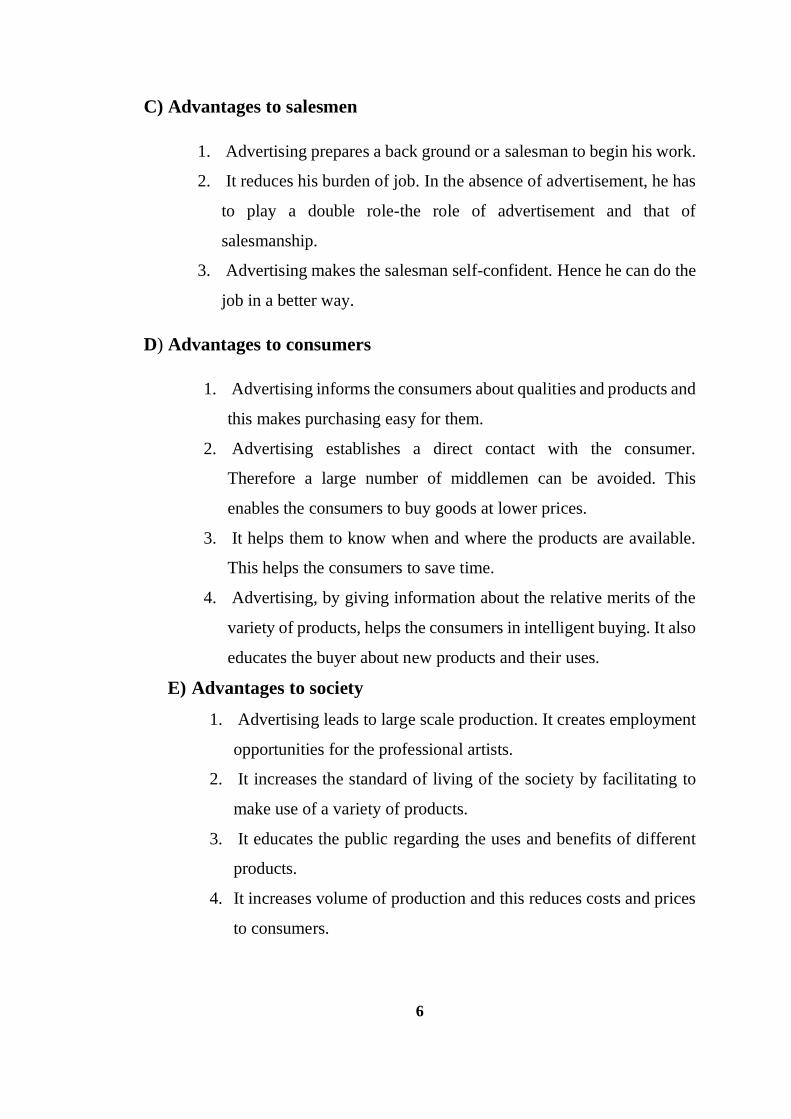
C) Advantages to salesmen
1. Advertising prepares a back ground or a salesman to begin his work.
2. It reduces his burden of job. In the absence of advertisement, he has
to play a double role-the role of advertisement and that of
salesmanship.
3. Advertising makes the salesman self-confident. Hence he can do the
job in a better way.
D) Advantages to consumers
1. Advertising informs the consumers about qualities and products and
this makes purchasing easy for them.
2. Advertising establishes a direct contact with the consumer.
Therefore a large number of middlemen can be avoided. This
enables the consumers to buy goods at lower prices.
3. It helps them to know when and where the products are available.
This helps the consumers to save time.
4. Advertising, by giving information about the relative merits of the
variety of products, helps the consumers in intelligent buying. It also
educates the buyer about new products and their uses.
E) Advantages to society
1. Advertising leads to large scale production. It creates employment
opportunities for the professional artists.
2. It increases the standard of living of the society by facilitating to
make use of a variety of products.
3. It educates the public regarding the uses and benefits of different
products.
4. It increases volume of production and this reduces costs and prices
to consumers.
6
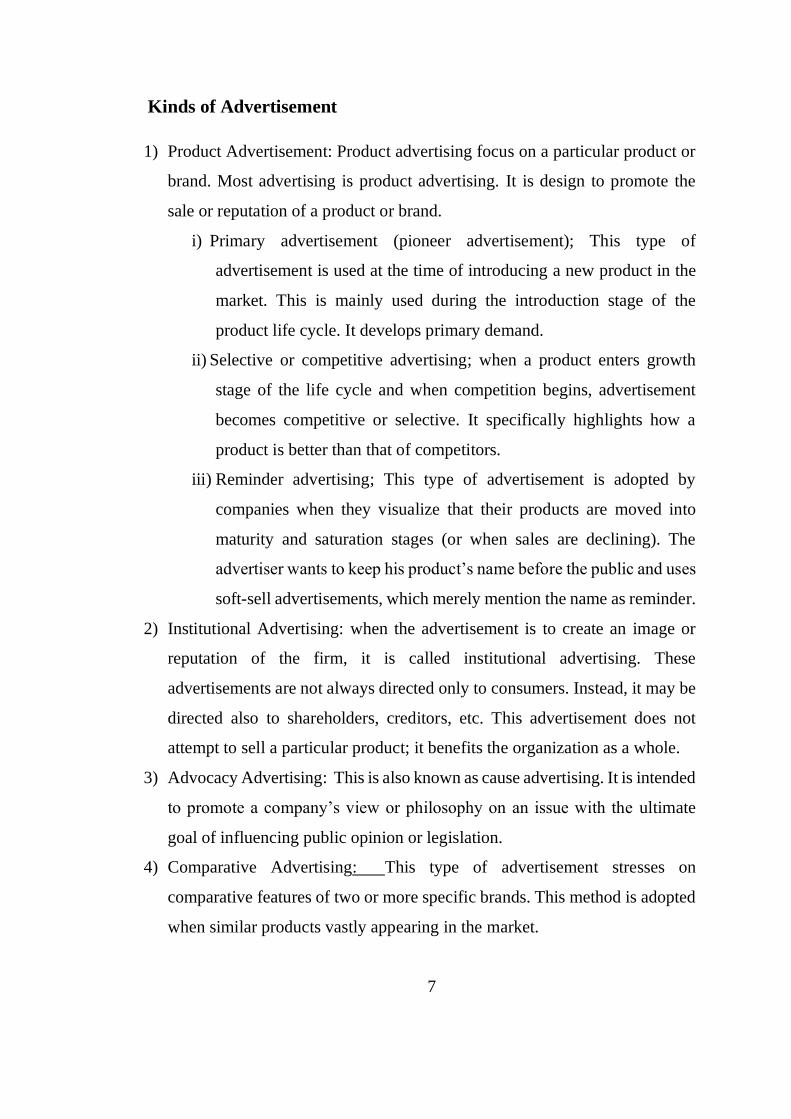
Kinds of Advertisement
1) Product Advertisement: Product advertising focus on a particular product or
brand. Most advertising is product advertising. It is design to promote the
sale or reputation of a product or brand.
i) Primary advertisement (pioneer advertisement); This type of
advertisement is used at the time of introducing a new product in the
market. This is mainly used during the introduction stage of the
product life cycle. It develops primary demand.
ii) Selective or competitive advertising; when a product enters growth
stage of the life cycle and when competition begins, advertisement
becomes competitive or selective. It specifically highlights how a
product is better than that of competitors.
iii) Reminder advertising; This type of advertisement is adopted by
companies when they visualize that their products are moved into
maturity and saturation stages (or when sales are declining). The
advertiser wants to keep his product’s name before the public and uses
soft-sell advertisements, which merely mention the name as reminder.
2) Institutional Advertising: when the advertisement is to create an image or
reputation of the firm, it is called institutional advertising. These
advertisements are not always directed only to consumers. Instead, it may be
directed also to shareholders, creditors, etc. This advertisement does not
attempt to sell a particular product; it benefits the organization as a whole.
3) Advocacy Advertising: This is also known as cause advertising. It is intended
to promote a company’s view or philosophy on an issue with the ultimate
goal of influencing public opinion or legislation.
4) Comparative Advertising: This type of advertisement stresses on
comparative features of two or more specific brands. This method is adopted
when similar products vastly appearing in the market.
7
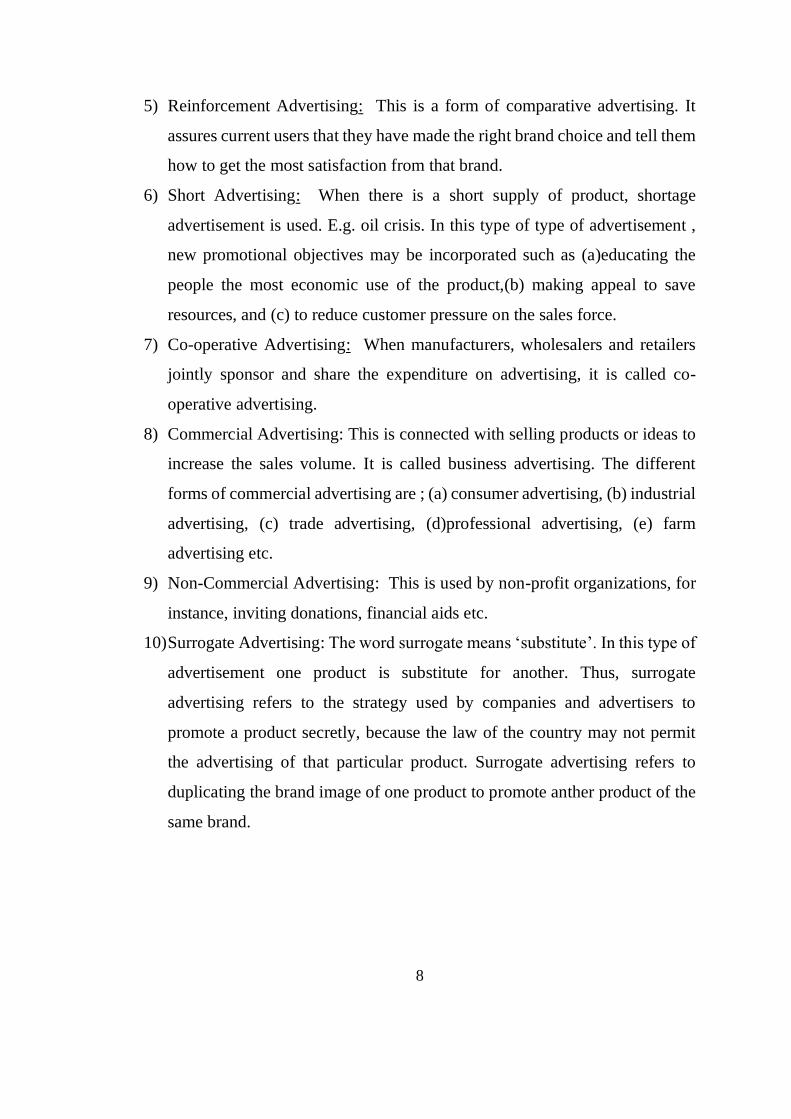
5) Reinforcement Advertising: This is a form of comparative advertising. It
assures current users that they have made the right brand choice and tell them
how to get the most satisfaction from that brand.
6) Short Advertising: When there is a short supply of product, shortage
advertisement is used. E.g. oil crisis. In this type of type of advertisement ,
new promotional objectives may be incorporated such as (a)educating the
people the most economic use of the product,(b) making appeal to save
resources, and (c) to reduce customer pressure on the sales force.
7) Co-operative Advertising: When manufacturers, wholesalers and retailers
jointly sponsor and share the expenditure on advertising, it is called co-
operative advertising.
8) Commercial Advertising: This is connected with selling products or ideas to
increase the sales volume. It is called business advertising. The different
forms of commercial advertising are ; (a) consumer advertising, (b) industrial
advertising, (c) trade advertising, (d)professional advertising, (e) farm
advertising etc.
9) Non-Commercial Advertising: This is used by non-profit organizations, for
instance, inviting donations, financial aids etc.
10) Surrogate Advertising: The word surrogate means ‘substitute’. In this type of
advertisement one product is substitute for another. Thus, surrogate
advertising refers to the strategy used by companies and advertisers to
promote a product secretly, because the law of the country may not permit
the advertising of that particular product. Surrogate advertising refers to
duplicating the brand image of one product to promote anther product of the
same brand.
8
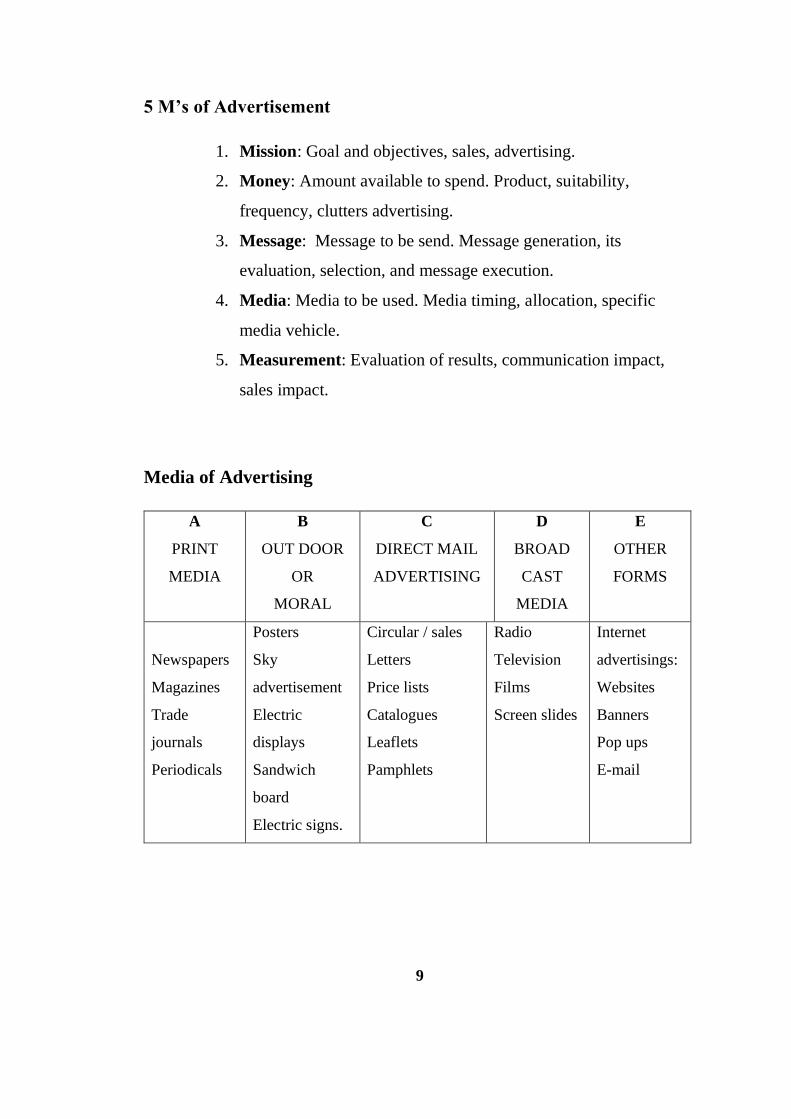
5 M’s of Advertisement
1. Mission: Goal and objectives, sales, advertising.
2. Money: Amount available to spend. Product, suitability,
frequency, clutters advertising.
3. Message: Message to be send. Message generation, its
evaluation, selection, and message execution.
4. Media: Media to be used. Media timing, allocation, specific
media vehicle.
5. Measurement: Evaluation of results, communication impact,
sales impact.
Media of Advertising
A
MEDIA
B
OUT DOOR
OR
MORAL
C
DIRECT MAIL
ADVERTISING
D
BROAD
CAST
MEDIA
E
OTHER
FORMS
Newspapers
Magazines
Trade
journals
Periodicals
Posters
Sky
advertisement
Electric
displays
Sandwich
board
Electric signs.
Circular / sales
Letters
Price lists
Catalogues
Leaflets
Pamphlets
Radio
Television
Films
Screen slides
Internet
advertisings:
Websites
Banners
Pop ups
9
E-Advertising;
Advertising on the electronic media such as Internet, web, e-mail etc. is known
as e-advertising. Advertising on the internet is known as net advertising (or net
advertising). Thus e-advertising is considered as non-personal information
usually persuasive in a nature about a product or services by an identified
sponsor, hence all paid space on the web or in an e-mail.
Objectives;
1. Two – way communication.
2. Two – way interaction (interactivity means purpose dialogue
between the company and stakeholders).
3. Customer retention.
4. Online sale.
5. Brand awareness.
Advantages;
1. Advertising can be made interactive through contests and
promotions.
2. Costs are low.
3. Effectiveness can be measured accurately.
4. There is 24 – hours access
5. Sites can be quickly changed and updated.
6. Messages can be designed to appeal the specific needs and wants
of the target audience.
7. Site visitors who are interested in the company will interact with
the company to know more.
8. This is a direct response medium. Hence it has the ability to
generate more sales.
9. Advertising can be made create.
10
10. It is possible to assess the impact of ads quite early. Hence, the
ad campaign can be changed before most of the money spent.
Selling concept;
This concept assumes that consumers will not buy goods voluntarily
unless the seller undertakes a large scale selling and promotional efforts.
• Selling refers to transferring goods and services to customers.
• Selling focus on the needs of the seller.
• Selling aims at maximum sales and profit.
• Selling concerned with the distribution of goods already produced.
• Selling emphasis on short term objective of profit maximizing.
• Selling is an activity that converts products in to cash.
• Selling is product oriented.
• Selling ends with the delivery of goods against money.
• Selling creates only possession utility.
• In selling the starting point is the product and the end point is the
customer.
• In selling, cost determine price.
Selling concept;
Focus Means Ends
Products selling and promotion Profit through sales
volume
Sales promotion;
Sales promotion simply means the tools and technique to promote sales.
According to Roger, “sales promotion is short term incentive to encourage
purchase or sale of a product or services”.
11
Sales promotion offers an extra value or inducement to customers, dealers,
and sales force with the objective of creating an immediate sale. In short, sales
promotion includes all those activities which are directed towards promoting
sales.
Advertisements are most important promotional tool which affects the
sales and overall profitability of the firm. Advertising is said to be the ears and
eyes of the organizations. This is because advertising keep the business in close
contact with its economic, political, social and technological environment and
informs it of events that can influence its activities as per the requirements of the
customers.
Advertisement and sales are the two sides of the same coin. Now in the
modern business world, advertisement becomes necessary for the management
for increasing sales. Many firms are increasing the advertising budget.
Advertisement increases the demand of the products; hence large scales
production is facilitated. This reduces the cost per unit and therefore profit
increases. All the companies will not adopt the same kind of advertising media.
There are different advertising media under which business enterprise conduct
their advertising activity. The role of this mass mode of communication in
creating brand loyalty, determine entry and consequently increasing sales
revenue and profit of the organization.
Advertisement plays a vital role in our daily life. Advertising touches
every aspect of our lives, from our birth to our death. Our entire life, our life
styles and our existence are continuously affected by advertising. If examine our
daily life, commencing from getting up from bed in the morning to the time go
to the bed in the night, number of products are used by the effect of different
advertisements.
12
Advertising begins from customer’s needs and wants. Advertising try to identify
these needs and want and develop products that will satisfy customers through
an exchange media. Advertisement is a persuasive communication which
attempts to change or reinforce one’ prior attitude and basically done not only to
inform customers about products rather it is a process, which further influence
and persuades customers to purchase the product.
3.2 Empirical literature
• Ekclund and Gramm (1969) analyzed the relationship between
advertising expenditure and aggregate consumption but could not
establish any positive relationship between these two.
• Taylor and weiserbs (1972) studied the relationship between advertising
expenditure and aggregate consumption on the basis of Houstakker-
Taylor model and showed that advertising affects aggregate consumption
and the relationship between advertisement and consumption ii not found
to be unidirectional but simultaneous.
• Elliot (2001) revealed that advertising has a significant positive effect on
food industry sales and this relationship between advertising expenditure
and sales appears to be stable.
• Kambar (2002) found a measurable relationship between advertising
expenditure and sales, even after controlling other factors, such as
company size and past sales growth rates etc.
• Sundarsan (2007) evaluated the effectiveness of advertisement on sales
of small and large firms and for multinational corporations. The result
showed that advertisement has influenced sales; through its relative
effectiveness was not the same for all the categories of firms.
13
Different studies have shown diverse results. However, in general, majority of
the studies have directed positive relationship between advertisement and sales.
Most of the studies have used time series data to capture the long term effect of
adverting on sales. Moreover, the area that, to what extent advertising’s
persuasive character works to alter consumer’s wants and consequently sales
have received scant attention.
3.3 REFERENCE
• Ekclund, Robert .B and William p. Gramm (1969). “A
Reconsiderationof Advertising Expenditures, Aggregate Demand
Stabilization“, Quarterly Review of Economic and Business.
• Taylor Lester d. and Daniel weiserbs (1972) “Advertising and
Aggregate Consumption function”, American Economic Review,
vol.lx11.
• Elliot c. (2001), “A Co integration Analysis of Advertisement and
Sales Date”, Review of Industrial Organization, vol.18.
• Kambar T. (2002), “The Brand Mangers Dilemma; Understanding
How Advertising Expenditure affect sales growth during the
Recession”, the journal of brand management, vol.10 (2).
• Sundarsan p. k (2007) “Evaluating Effectiveness of Advertising on
sales a study using firm level Data”, IFCAI Journal of Managerial
Economic vol. v (1).
14

CHAPTER 3
INDUSTRY PROFILE
2.1 SOAP INDUSTRY
The lever brothers, England during British rule introduced modern soap by
importing and marketing them in the country. Tata set up India’s first indigenous
soap manufacturing unit when they purchased the coconut oil mills at Cochin,
Kerala. The first company created was North West Soap Company, situated in
the city of Meerut in utter Pradesh.
The Indian soap industry includes about 700 companies with combined
annual revenue of about 17 billion. Major companies in the industry include
P&G, unilever and Dial. India is a country with a 1030 million people with
household penetration of soap is 98%. Soaps are categorized into men’s soap,
ladies soap and common soap. There is little specialty soap like glycerin soap,
sandal soaps, specially flavored soaps, medicated soap and baby soaps. It might
be scented unscented in burs, gels and liquids. ITC LTD has started investing in
aggressive brand building and product development project to promote its
brands, fiama Di wills, vivel and superia. Top leading players in soap market are
HUL, Godrej consumer products LTD, Colgate Palmolive and Wipro consumer
care.
2.2.1 BRIEF INDUSTRY PROFILE OF LEADING SOAP
MANUFACTURING COMPANIES IN INDIA
WIPRO LTD
WIPRO LTD the flagship company of the Azimpremji group was
established on 29 December 1945.Western Indian product LTD is an Indian
Multinational IT consulting and system integration service company head
quartered in Banglore.
Its first product was vegetable oil later popularized under the brand name
“sunflower vanaspathi”. It aloes offers personal care product such as Wipro baby
soap, soap like Santoor, Chandrika as well as international brand like Yardley.
As march 2015 the company has 158217 employees serving over 900 of the
fortune 1000 corporations with a presence in 67 countries. Its market
capitalization was approximately $35 billion, making it one of the largest
publically traded company and the 7th largest IT service firm in the world.
15
ITC LTD
ITC is one of the India’s public multi business enterprises; It was
incorporated on 24 August 1910, as a imperial Tobacco company of India LTD.
In 1970 the company was renamed as, Indian tobacco Company limited and
further to ITC LTD in 1974.
ITC is an Indian conglomerate head quartered in Kolkata, West Bengal.
It’s diversified business include five segments such as fast moving consumer
goods (FMCG),Hotel, paperboard and packing, Agribusiness and information
technology.
The company completed 100 years in 2010.It employs over 2500 people
at more than 60 location across India. It online sales in 2014. ITC is today the
only company in the world to be carbon positive, water positive and soil waste
recycling positive. Its personal care products includes perfume, hair care andskin
care categories. Major brands are Vivel, FiamaDiWillis, Superia.
HINDUSTAN UNILEVER LIMITED
HUL LTD is India’s largest fast moving consumer with a heritage of over
80 years in India. It was established in 1933 as lever brothers and in 1956 became
to know as Hindustan Unilever Ltd as a result of merger between laver brothers,
Hindustan vanaspathi Mfg.co.Ltd and united traders Ltd. HUL is an India
consumer goods company based in Mumbai, Maharashtra. It is owned by Anglo-
Dutch company Unilever which owns a 67% controlling shares of HUL as of
march 2015.
HUL employs over 16000 workers and indirectly facilitate employment
of over 65000 people. It covers over 2 million retail outlet across India directly
and its products are available over 6.4 million outlet in the country. HUL
products include food, beverages, cleaning agents, personal care products and
water purifiers. Its skin lightening products include human, Lakme, Llifeboy,
Lyril, Lux, pears soap, Rexona, Pepsodent, Ponds, Sunsilk.
Lux is one of global brand developed Unilever. Lux started as “sunlight
flakes” laundry soap in 1899.Today it is the market leader in countries like India,
Pakistan, Brazil, Thailand and south Africa. It is now headquartered in
Singapore.HUL aims to create a better future every day and helps people feel
good, look good and get more out of life with brands and services that are good
for them and good for others.
16
NIRMA
The company was incorporated on February 25-1980 as a private limited
company to carry on the business of manufacturing and selling synthesis
detergents, soap, chemicals and ailed products. The company became a deemed
public limited company in 1993nunder section 43-A of the companies Act
1956.Nirma is one the most recognizable Indian brands. It took on the might of
giant multinationals and wrote a new chapter in the Indian corporate history.
Starting as a one-man operation in 1969, today Nirma has about 14000
employee-bare and its annual turnover of more than 2500 crores. It has one of
the largest volume sales with a single brand name in the world. Karsanbhai
Khodidas Patel is an Indian Industrialist, founder of the 2500 crores
(USD500mn) Nirma groups with major interest in detergents, soap and
cosmetics.The firm has set up state-of-the-art packing and printing units and now
directly produces key raw materials to improve product quality. The company
has created Nirma consumer care Ltd. A owned subsidiary in August, which is
the sole license of the brand name Nirma within India.
GODREJ
Godrej group has its root in India’s Swadeshi movement. It is an Indian
conglomerate headquarter in Mumbai, Maharashtra, managed and owned largely
by the Godrej family. It was founded by Ardeshir Godrej and piroisha Burjorji
Godrej in 1897 Godrej is one of the most trusted brands with revenue of US$4.1,
and enjoys the patronage of 1.1 billion consumers globally across our consumer
goods, real estate and many other business. It operates in sectors as diversified
business which includes inside and outside India. The Godrej groups can be
broadly divided into two major holding companies working independently are
Godrej industries Ltd and Godrej & Boyce.
17
CHAPTER 4
DATA ANALYSIS AND INTERPRETATION
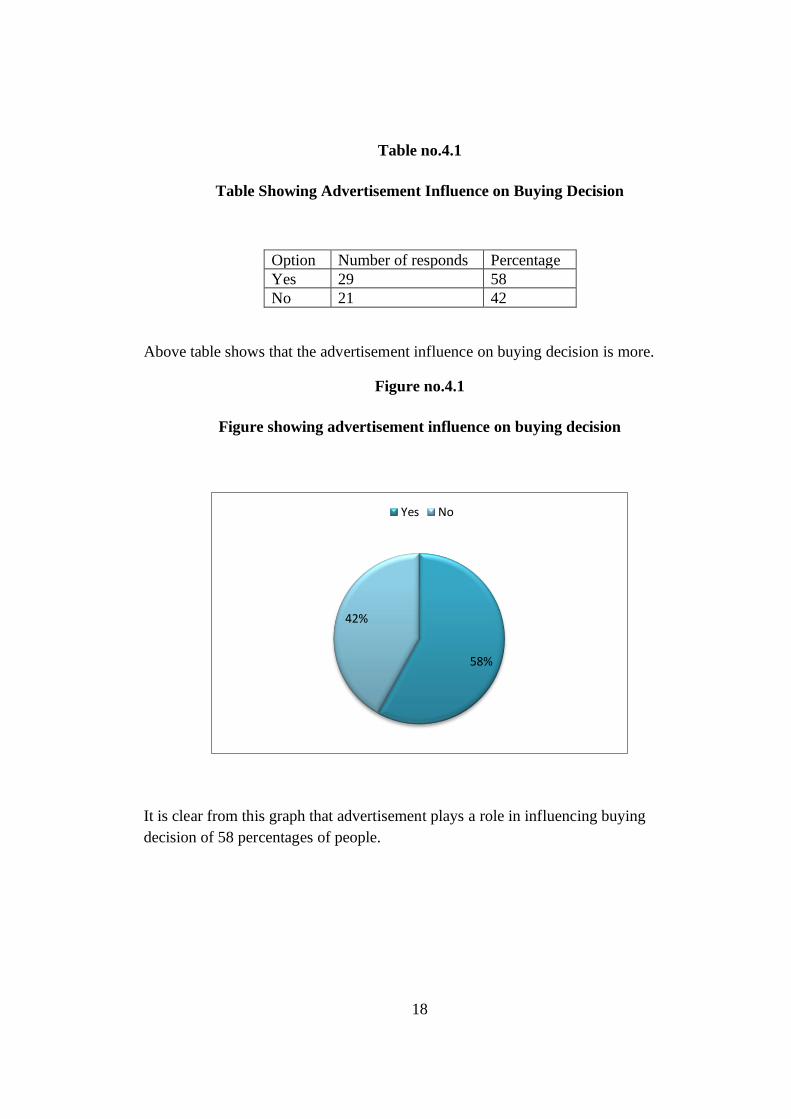
Table no.4.1
Table Showing Advertisement Influence on Buying Decision
Option Number of responds Percentage
Yes 29 58
No 21 42
Above table shows that the advertisement influence on buying decision is more.
Figure no.4.1
Figure showing advertisement influence on buying decision
It is clear from this graph that advertisement plays a role in influencing buying
decision of 58 percentages of people.
18
58%
42%
Yes No
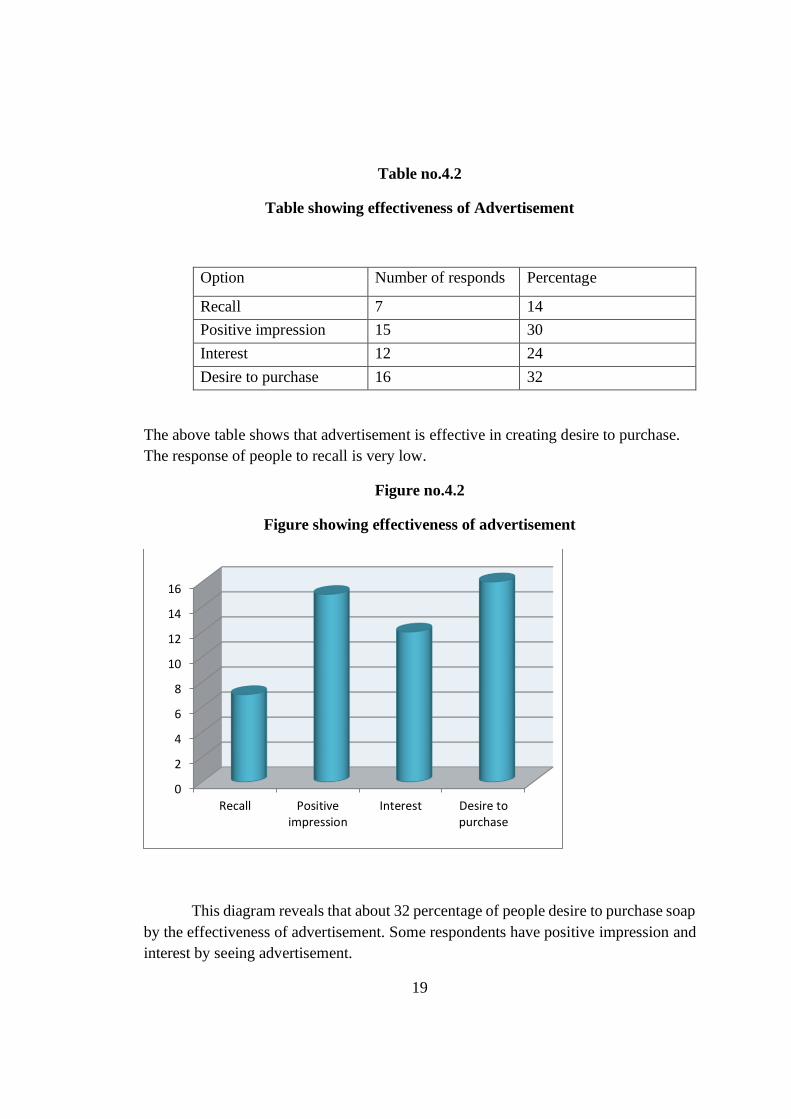
Table no.4.2
Table showing effectiveness of Advertisement
Option Number of responds Percentage
Recall 7 14
Positive impression 15 30
Interest 12 24
Desire to purchase 16 32
The above table shows that advertisement is effective in creating desire to purchase.
The response of people to recall is very low.
Figure no.4.2
Figure showing effectiveness of advertisement
This diagram reveals that about 32 percentage of people desire to purchase soap
by the effectiveness of advertisement. Some respondents have positive impression and
interest by seeing advertisement.
19
0
2
4
6
8
10
12
14
16
Recall Positiveimpression
Interest Desire topurchase
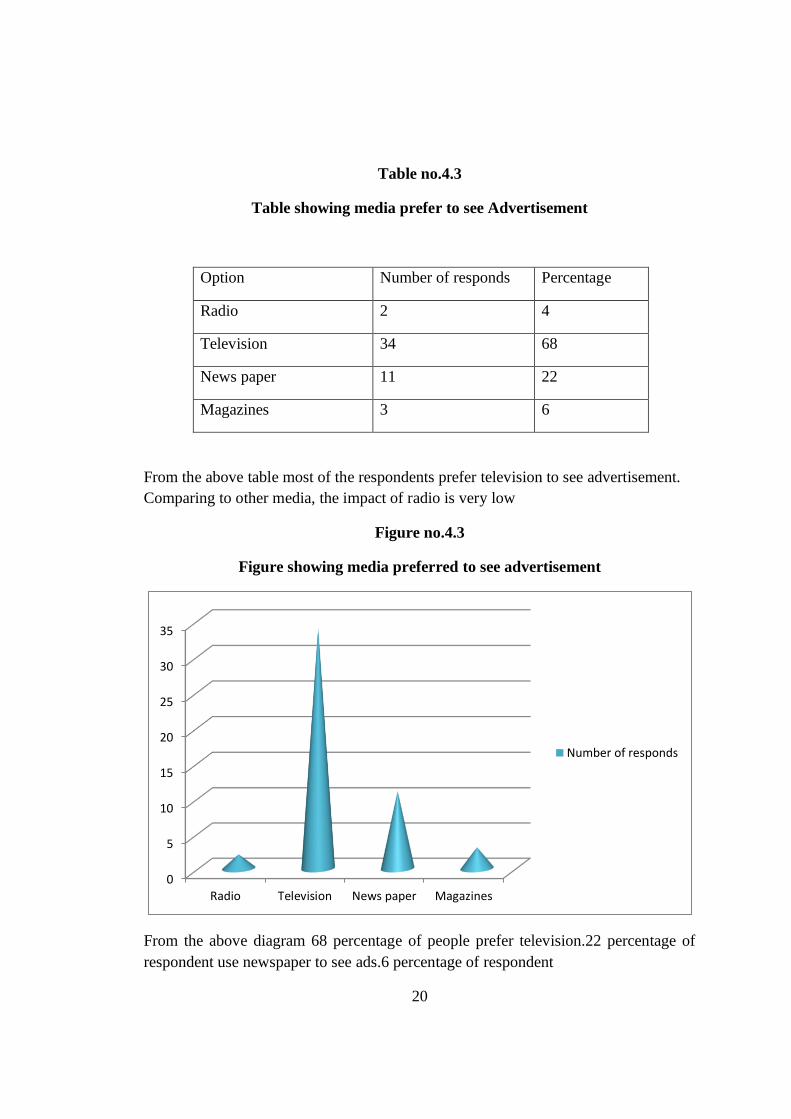
Table no.4.3
Table showing media prefer to see Advertisement
Option Number of responds Percentage
Radio 2 4
Television 34 68
News paper 11 22
Magazines 3 6
From the above table most of the respondents prefer television to see advertisement.
Comparing to other media, the impact of radio is very low
Figure no.4.3
Figure showing media preferred to see advertisement
From the above diagram 68 percentage of people prefer television.22 percentage of
respondent use newspaper to see ads.6 percentage of respondent
20
0
5
10
15
20
25
30
35
Radio Television News paper Magazines
Number of responds
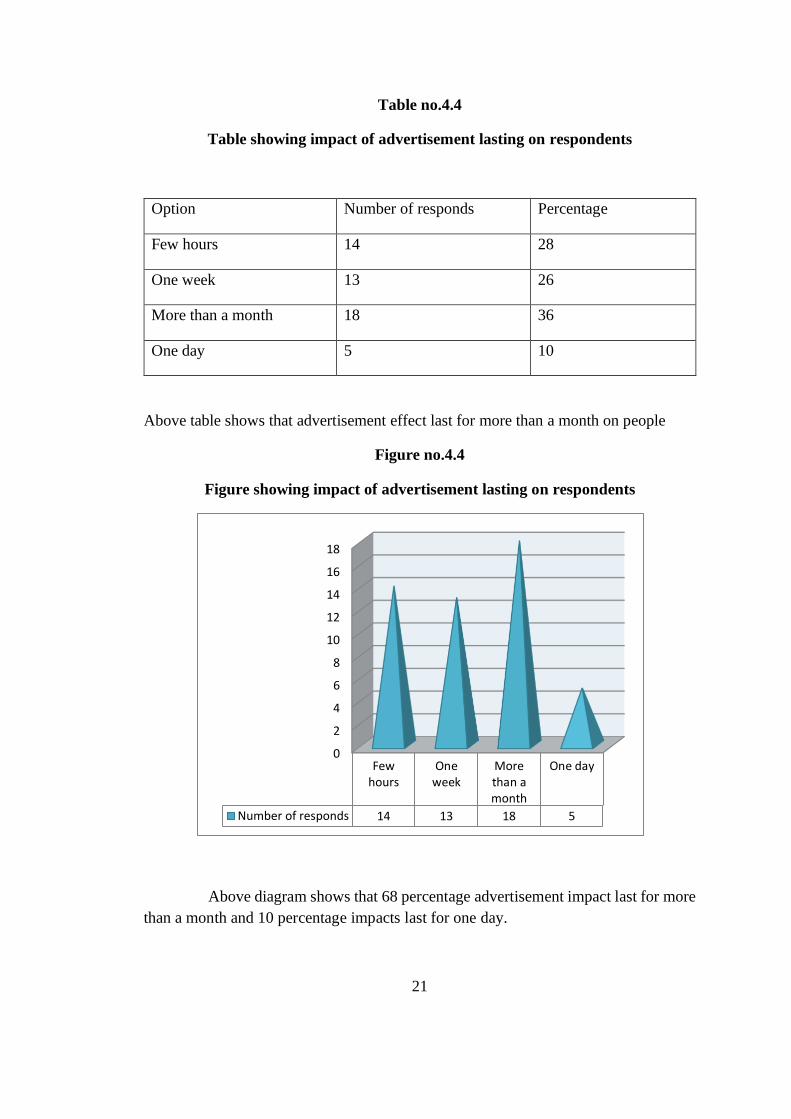
Table no.4.4
Table showing impact of advertisement lasting on respondents
Option Number of responds Percentage
Few hours 14 28
One week 13 26
More than a month 18 36
One day 5 10
Above table shows that advertisement effect last for more than a month on people
Figure no.4.4
Figure showing impact of advertisement lasting on respondents
Above diagram shows that 68 percentage advertisement impact last for more
than a month and 10 percentage impacts last for one day.
21
0
2
4
6
8
10
12
14
16
18
Fewhours
Oneweek
Morethan amonth
One day
Number of responds 14 13 18 5
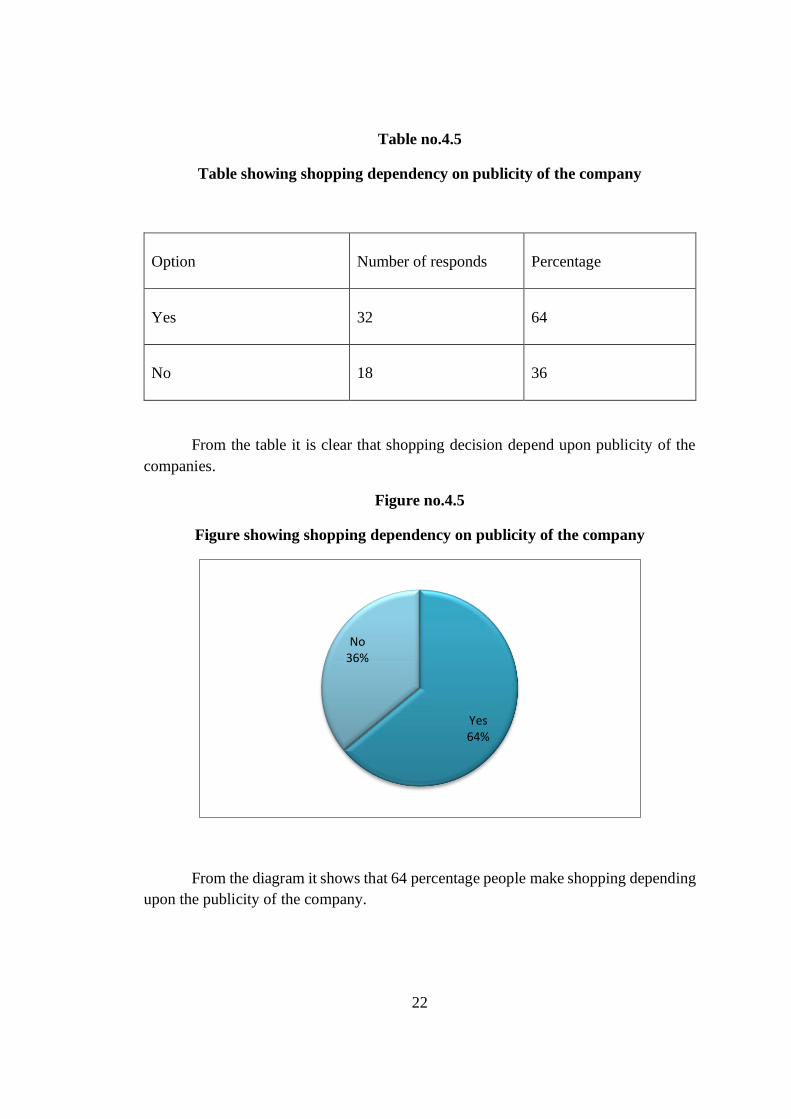
Table no.4.5
Table showing shopping dependency on publicity of the company
Option
Number of responds
Percentage
Yes
32
64
No
18
36
From the table it is clear that shopping decision depend upon publicity of the
companies.
Figure no.4.5
Figure showing shopping dependency on publicity of the company
From the diagram it shows that 64 percentage people make shopping depending
upon the publicity of the company.
22
Yes64%
No36%
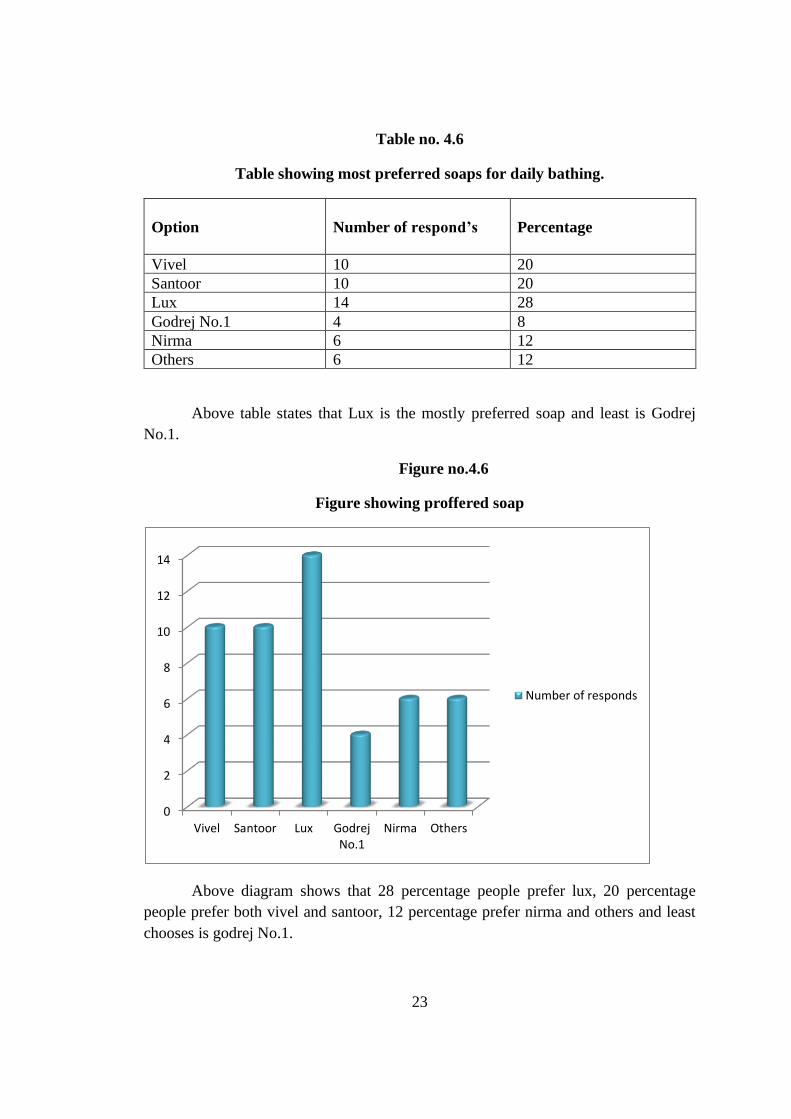
Table no. 4.6
Table showing most preferred soaps for daily bathing.
Option
Number of respond’s
Percentage
Vivel 10 20
Santoor 10 20
Lux 14 28
Godrej No.1 4 8
Nirma 6 12
Others 6 12
Above table states that Lux is the mostly preferred soap and least is Godrej
No.1.
Figure no.4.6
Figure showing proffered soap
Above diagram shows that 28 percentage people prefer lux, 20 percentage
people prefer both vivel and santoor, 12 percentage prefer nirma and others and least
chooses is godrej No.1.
23
0
2
4
6
8
10
12
14
Vivel Santoor Lux GodrejNo.1
Nirma Others
Number of responds
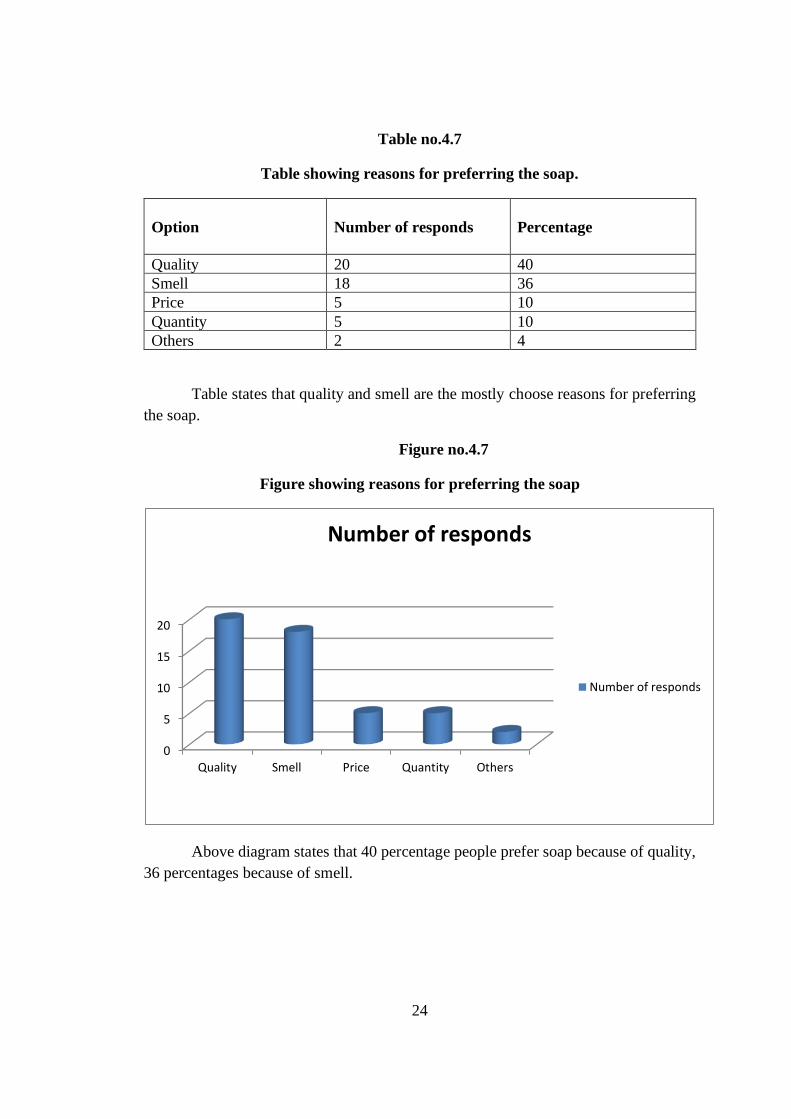
Table no.4.7
Table showing reasons for preferring the soap.
Option
Number of responds
Percentage
Quality 20 40
Smell 18 36
Price 5 10
Quantity 5 10
Others 2 4
Table states that quality and smell are the mostly choose reasons for preferring
the soap.
Figure no.4.7
Figure showing reasons for preferring the soap
Above diagram states that 40 percentage people prefer soap because of quality,
36 percentages because of smell.
24
0
5
10
15
20
Quality Smell Price Quantity Others
Number of responds
Number of responds
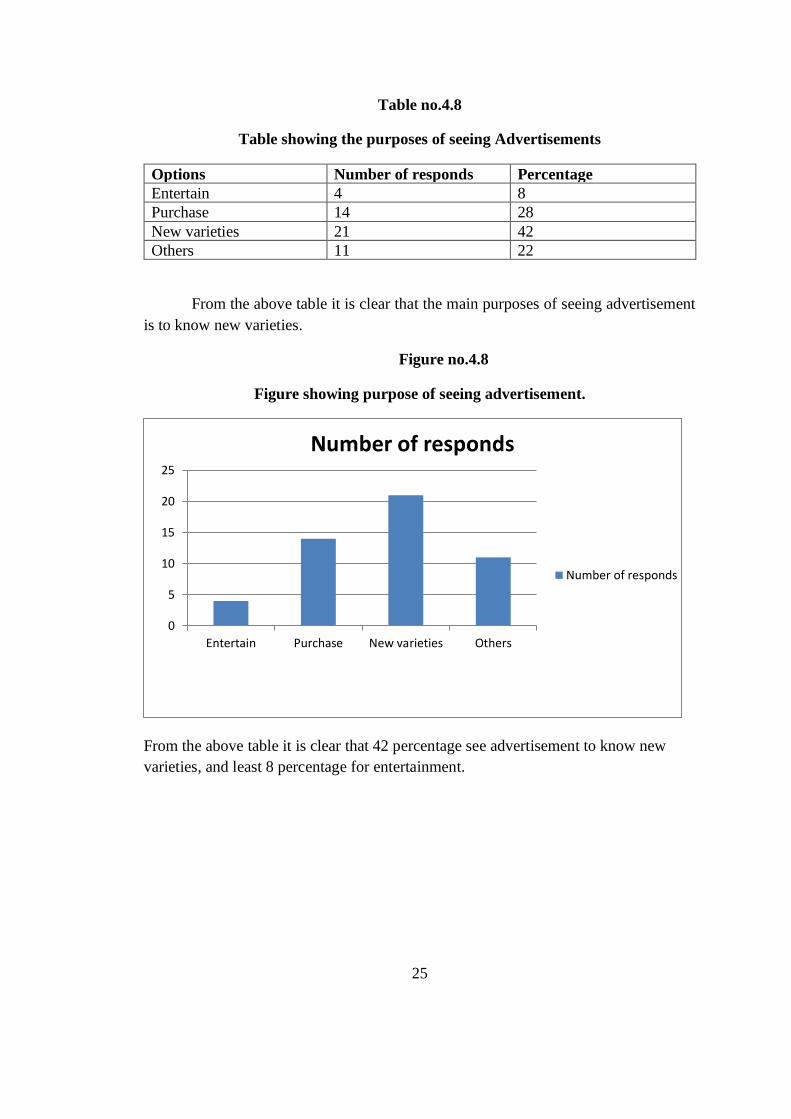
Table no.4.8
Table showing the purposes of seeing Advertisements
Options Number of responds Percentage
Entertain 4 8
Purchase 14 28
New varieties 21 42
Others 11 22
From the above table it is clear that the main purposes of seeing advertisement
is to know new varieties.
Figure no.4.8
Figure showing purpose of seeing advertisement.
From the above table it is clear that 42 percentage see advertisement to know new
varieties, and least 8 percentage for entertainment.
25
0
5
10
15
20
25
Entertain Purchase New varieties Others
Number of responds
Number of responds
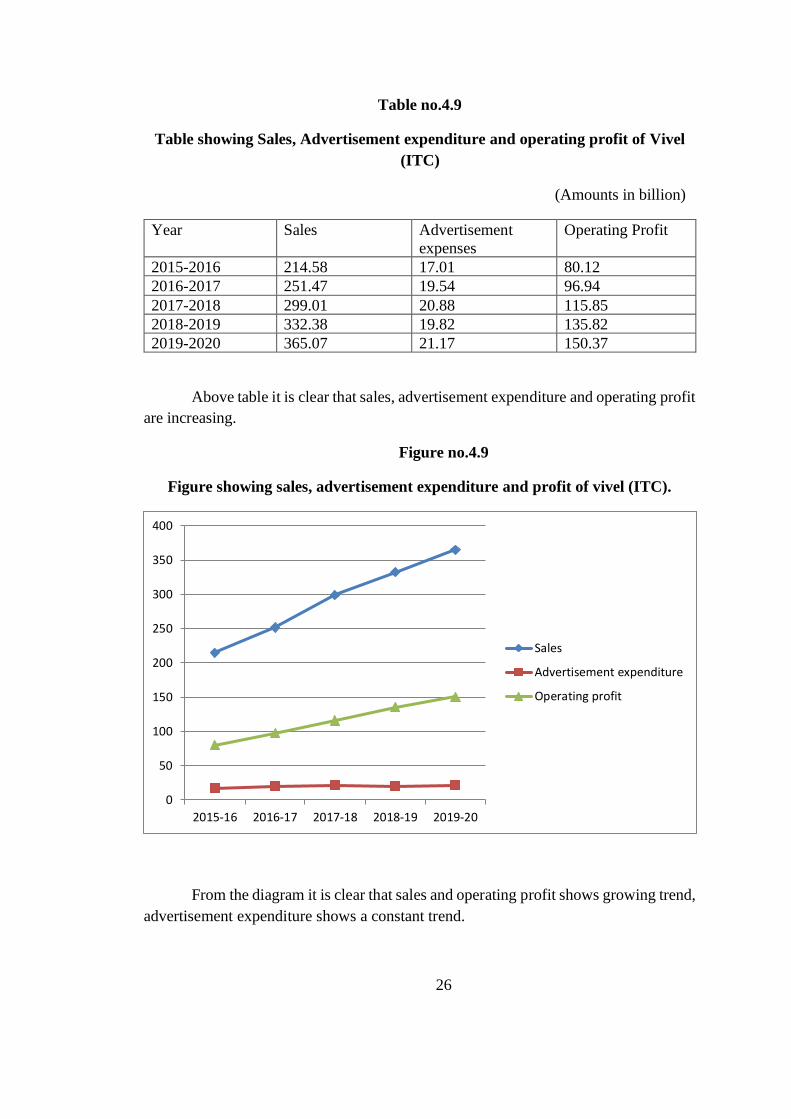
Table no.4.9
Table showing Sales, Advertisement expenditure and operating profit of Vivel
(ITC)
(Amounts in billion)
Year
Sales
Advertisement
expenses
Operating Profit
2015-2016 214.58 17.01 80.12
2016-2017 251.47 19.54 96.94
2017-2018 299.01 20.88 115.85
2018-2019 332.38 19.82 135.82
2019-2020 365.07 21.17 150.37
Above table it is clear that sales, advertisement expenditure and operating profit
are increasing.
Figure no.4.9
Figure showing sales, advertisement expenditure and profit of vivel (ITC).
From the diagram it is clear that sales and operating profit shows growing trend,
advertisement expenditure shows a constant trend.
26
0
50
100
150
200
250
300
350
400
2015-16 2016-17 2017-18 2018-19 2019-20
Sales
Advertisement expenditure
Operating profit
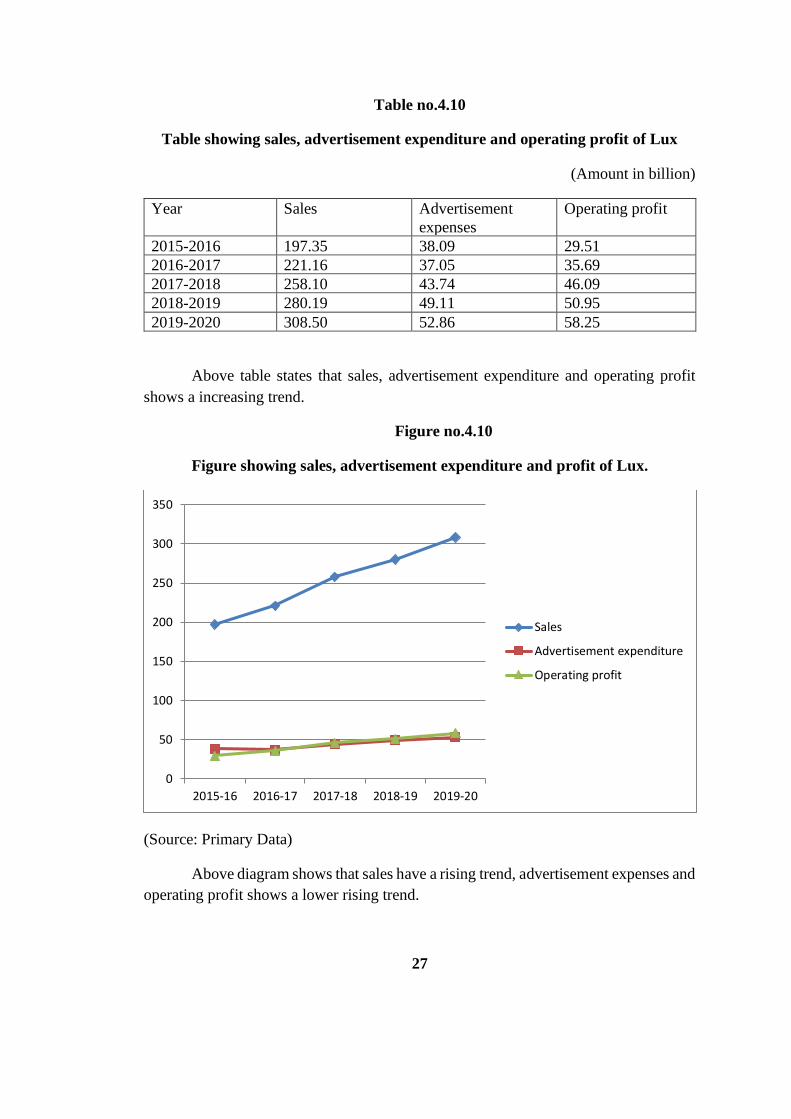
Table no.4.10
Table showing sales, advertisement expenditure and operating profit of Lux
(Amount in billion)
Year
Sales
Advertisement
expenses
Operating profit
2015-2016 197.35 38.09 29.51
2016-2017 221.16 37.05 35.69
2017-2018 258.10 43.74 46.09
2018-2019 280.19 49.11 50.95
2019-2020 308.50 52.86 58.25
Above table states that sales, advertisement expenditure and operating profit
shows a increasing trend.
Figure no.4.10
Figure showing sales, advertisement expenditure and profit of Lux.
(Source: Primary Data)
Above diagram shows that sales have a rising trend, advertisement expenses and
operating profit shows a lower rising trend.
27
0
50
100
150
200
250
300
350
2015-16 2016-17 2017-18 2018-19 2019-20
Sales
Advertisement expenditure
Operating profit
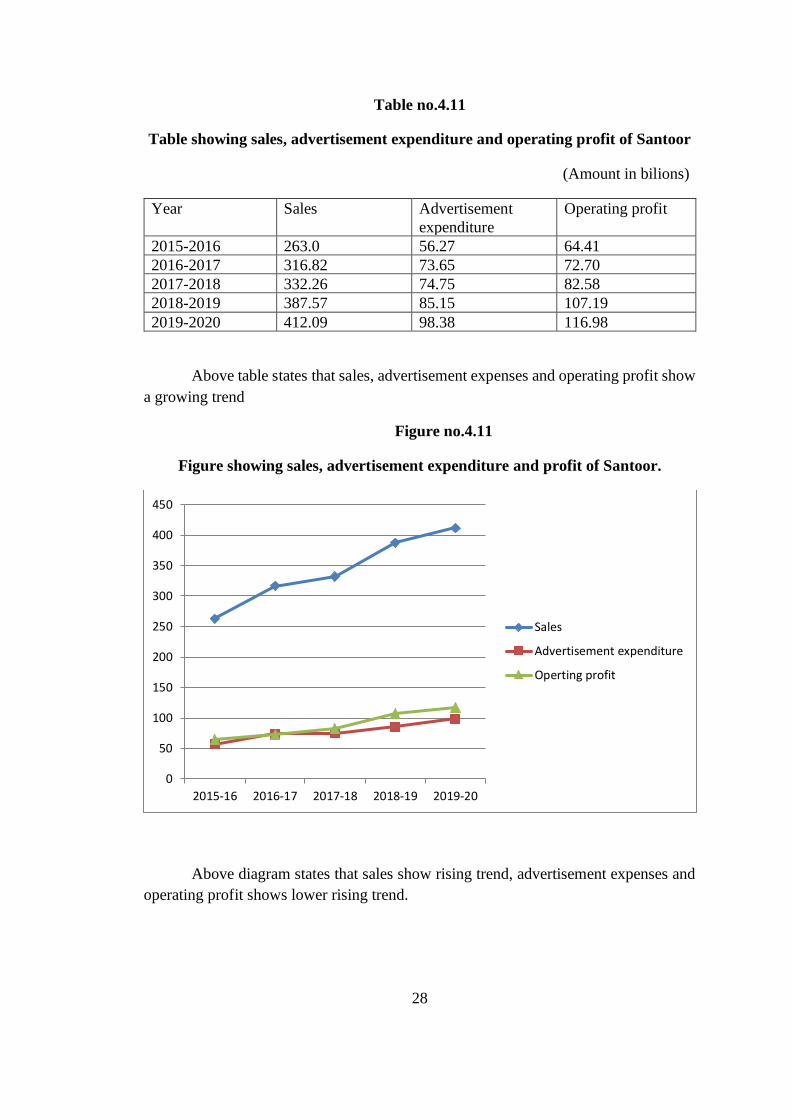
Table no.4.11
Table showing sales, advertisement expenditure and operating profit of Santoor
(Amount in bilions)
Year
Sales
Advertisement
expenditure
Operating profit
2015-2016 263.0 56.27 64.41
2016-2017 316.82 73.65 72.70
2017-2018 332.26 74.75 82.58
2018-2019 387.57 85.15 107.19
2019-2020 412.09 98.38 116.98
Above table states that sales, advertisement expenses and operating profit show
a growing trend
Figure no.4.11
Figure showing sales, advertisement expenditure and profit of Santoor.
Above diagram states that sales show rising trend, advertisement expenses and
operating profit shows lower rising trend.
28
0
50
100
150
200
250
300
350
400
450
2015-16 2016-17 2017-18 2018-19 2019-20
Sales
Advertisement expenditure
Operting profit
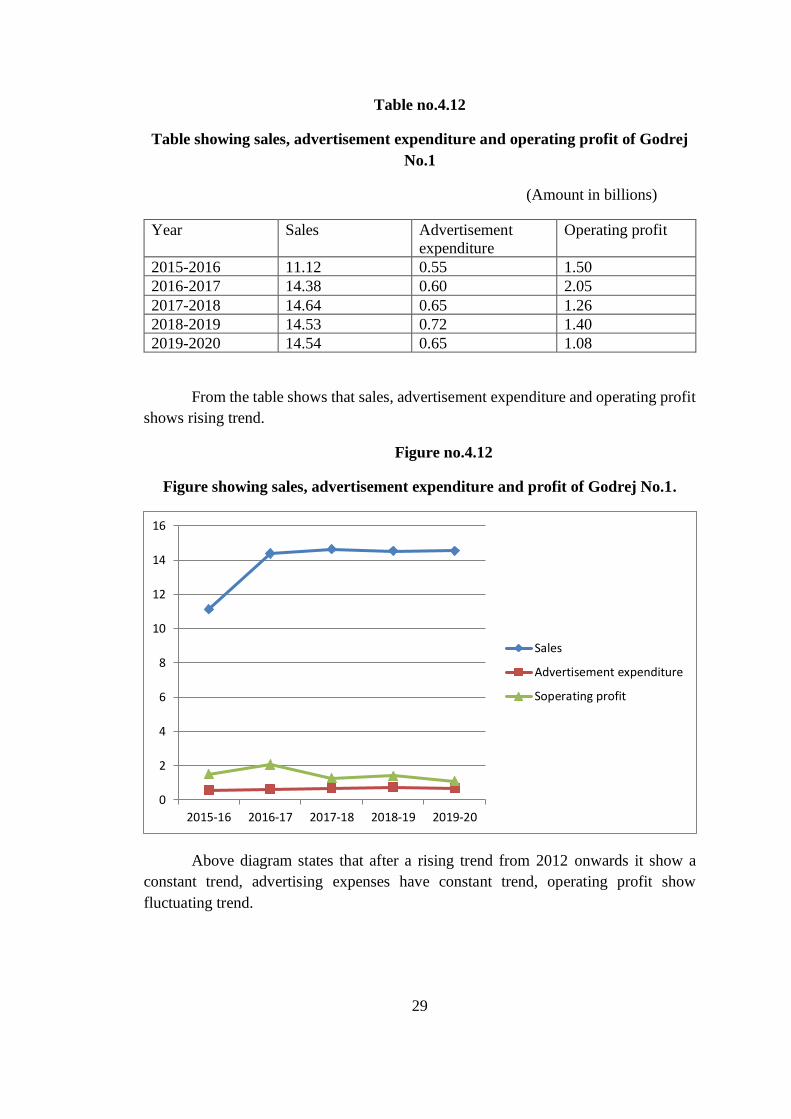
Table no.4.12
Table showing sales, advertisement expenditure and operating profit of Godrej
No.1
(Amount in billions)
Year
Sales
Advertisement
expenditure
Operating profit
2015-2016 11.12 0.55 1.50
2016-2017 14.38 0.60 2.05
2017-2018 14.64 0.65 1.26
2018-2019 14.53 0.72 1.40
2019-2020 14.54 0.65 1.08
From the table shows that sales, advertisement expenditure and operating profit
shows rising trend.
Figure no.4.12
Figure showing sales, advertisement expenditure and profit of Godrej No.1.
Above diagram states that after a rising trend from 2012 onwards it show a
constant trend, advertising expenses have constant trend, operating profit show
fluctuating trend.
29
0
2
4
6
8
10
12
14
16
2015-16 2016-17 2017-18 2018-19 2019-20
Sales
Advertisement expenditure
Soperating profit
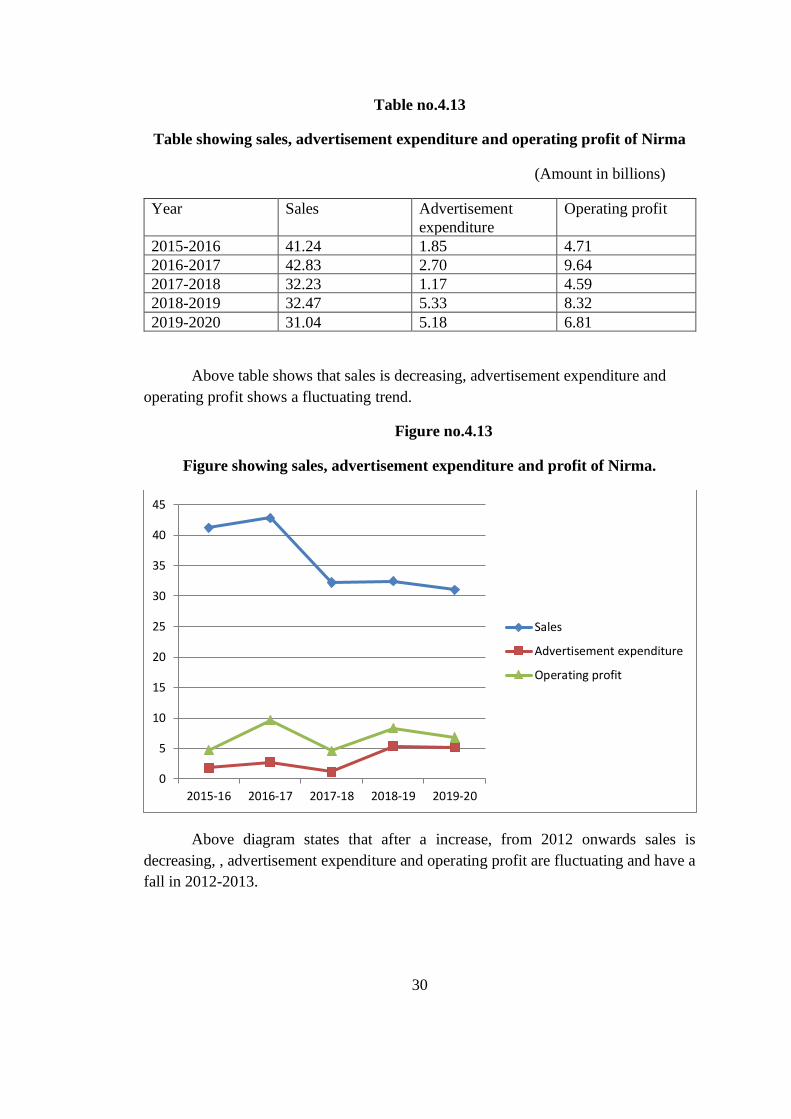
Table no.4.13
Table showing sales, advertisement expenditure and operating profit of Nirma
(Amount in billions)
Year
Sales
Advertisement
expenditure
Operating profit
2015-2016 41.24 1.85 4.71
2016-2017 42.83 2.70 9.64
2017-2018 32.23 1.17 4.59
2018-2019 32.47 5.33 8.32
2019-2020 31.04 5.18 6.81
Above table shows that sales is decreasing, advertisement expenditure and
operating profit shows a fluctuating trend.
Figure no.4.13
Figure showing sales, advertisement expenditure and profit of Nirma.
Above diagram states that after a increase, from 2012 onwards sales is
decreasing, , advertisement expenditure and operating profit are fluctuating and have a
fall in 2012-2013.
30
0
5
10
15
20
25
30
35
40
45
2015-16 2016-17 2017-18 2018-19 2019-20
Sales
Advertisement expenditure
Operating profit
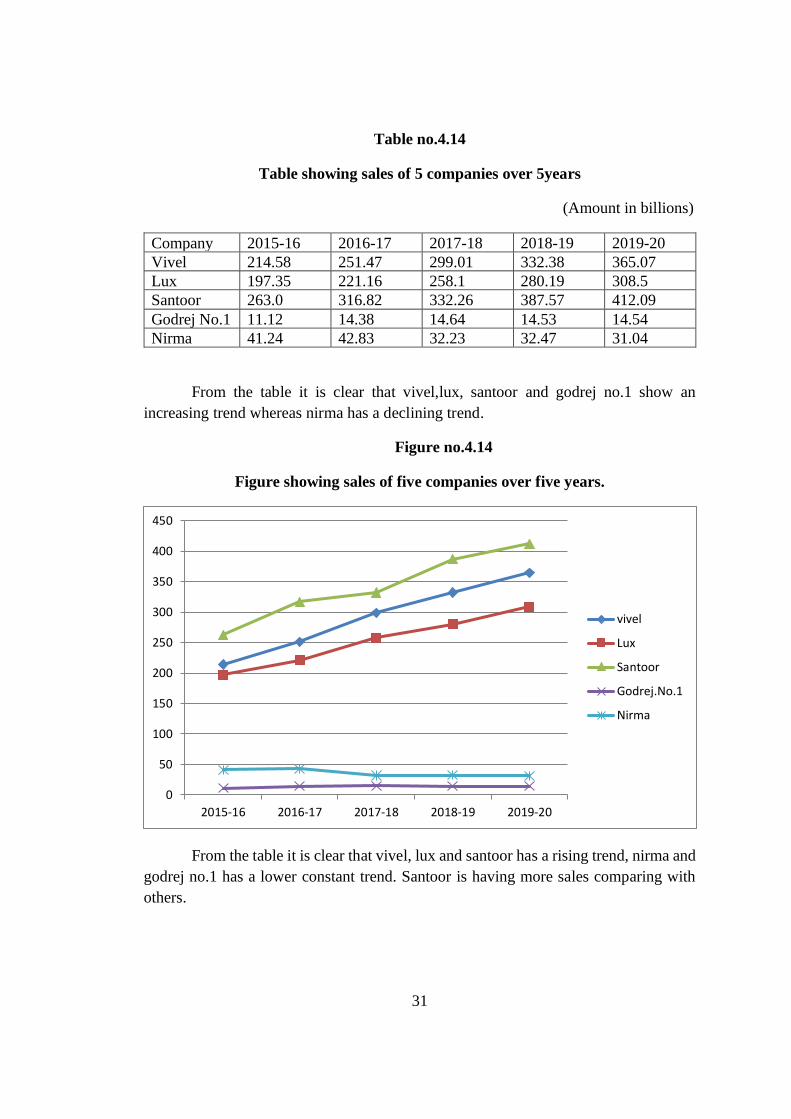
Table no.4.14
Table showing sales of 5 companies over 5years
(Amount in billions)
Company 2015-16 2016-17 2017-18 2018-19 2019-20
Vivel 214.58 251.47 299.01 332.38 365.07
Lux 197.35 221.16 258.1 280.19 308.5
Santoor 263.0 316.82 332.26 387.57 412.09
Godrej No.1 11.12 14.38 14.64 14.53 14.54
Nirma 41.24 42.83 32.23 32.47 31.04
From the table it is clear that vivel,lux, santoor and godrej no.1 show an
increasing trend whereas nirma has a declining trend.
Figure no.4.14
Figure showing sales of five companies over five years.
From the table it is clear that vivel, lux and santoor has a rising trend, nirma and
godrej no.1 has a lower constant trend. Santoor is having more sales comparing with
others.
31
0
50
100
150
200
250
300
350
400
450
2015-16 2016-17 2017-18 2018-19 2019-20
vivel
Lux
Santoor
Godrej.No.1
Nirma
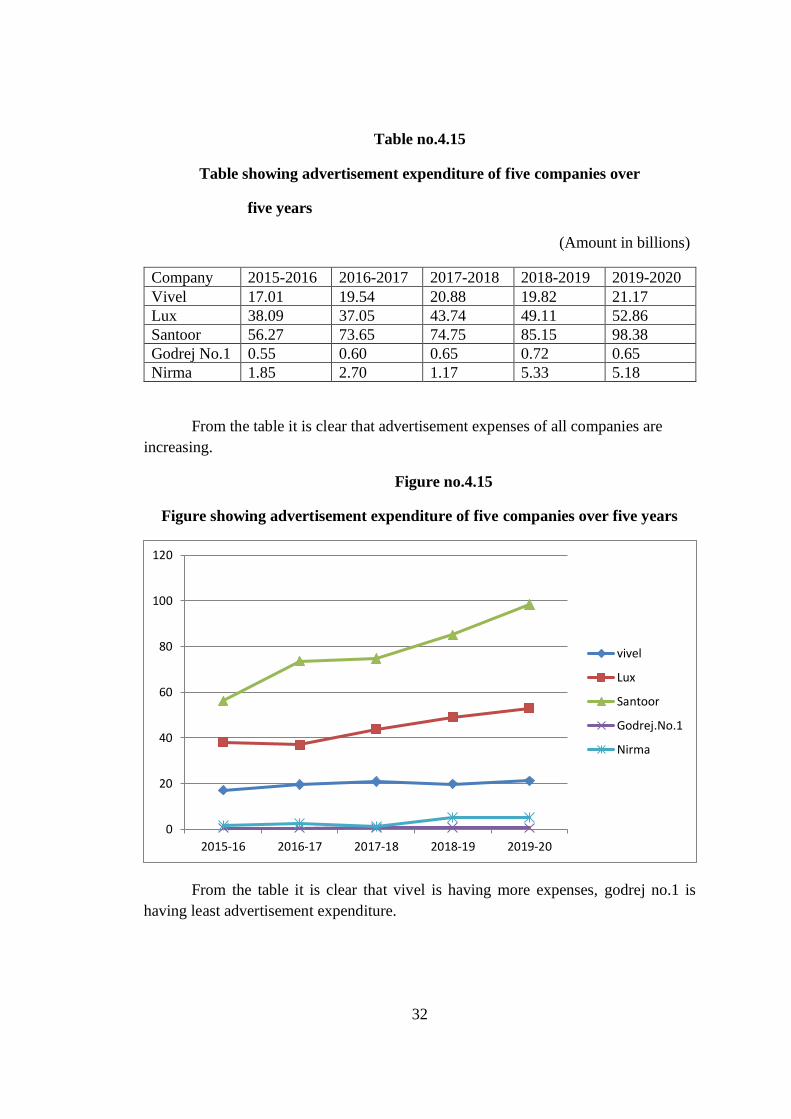
Table no.4.15
Table showing advertisement expenditure of five companies over
five years
(Amount in billions)
Company 2015-2016 2016-2017 2017-2018 2018-2019 2019-2020
Vivel 17.01 19.54 20.88 19.82 21.17
Lux 38.09 37.05 43.74 49.11 52.86
Santoor 56.27 73.65 74.75 85.15 98.38
Godrej No.1 0.55 0.60 0.65 0.72 0.65
Nirma 1.85 2.70 1.17 5.33 5.18
From the table it is clear that advertisement expenses of all companies are
increasing.
Figure no.4.15
Figure showing advertisement expenditure of five companies over five years
From the table it is clear that vivel is having more expenses, godrej no.1 is
having least advertisement expenditure.
32
0
20
40
60
80
100
120
2015-16 2016-17 2017-18 2018-19 2019-20
vivel
Lux
Santoor
Godrej.No.1
Nirma
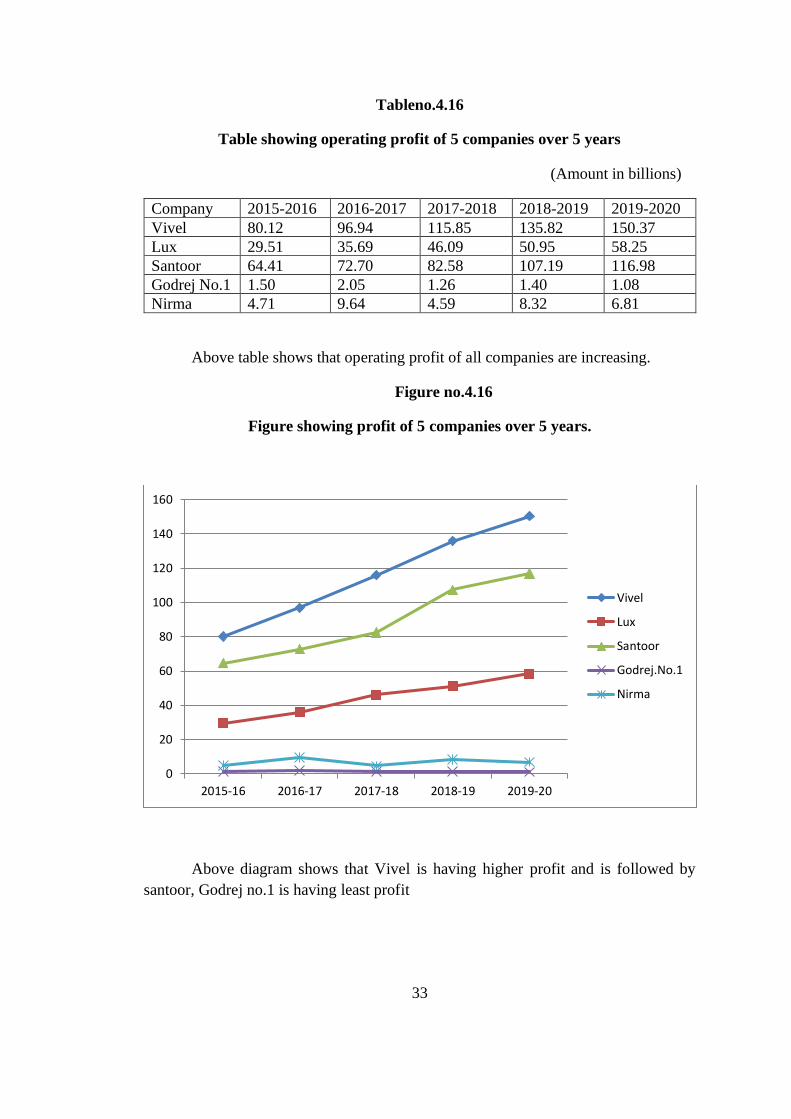
Tableno.4.16
Table showing operating profit of 5 companies over 5 years
(Amount in billions)
Company 2015-2016 2016-2017 2017-2018 2018-2019 2019-2020
Vivel 80.12 96.94 115.85 135.82 150.37
Lux 29.51 35.69 46.09 50.95 58.25
Santoor 64.41 72.70 82.58 107.19 116.98
Godrej No.1 1.50 2.05 1.26 1.40 1.08
Nirma 4.71 9.64 4.59 8.32 6.81
Above table shows that operating profit of all companies are increasing.
Figure no.4.16
Figure showing profit of 5 companies over 5 years.
Above diagram shows that Vivel is having higher profit and is followed by
santoor, Godrej no.1 is having least profit
33
0
20
40
60
80
100
120
140
160
2015-16 2016-17 2017-18 2018-19 2019-20
Vivel
Lux
Santoor
Godrej.No.1
Nirma

CHAPTER 5
FINDINGS, SUGGESTIONS AND CONCLUSION
Findings;
1. Survey prove that advertisement make desire to purchase soap rather than
entertainment.
2. Television is the best media to see ads.
3. The impact of advertisement lasts in the minds of respondents for more than a
month.
4. Sales and profit depend upon the publicity of the company.
5. Most preferred soap for daily bath is lux.
6. The purpose of watching advertisement is to know new varieties.
7. Sales and profit shows growing trend. Advertisement expenditure shows a
semi fluctuating trend in viveL ITC.
8. Most of the people prefer soap on the basis of quality and smell.
9. Advertisement expenses and profit shows a raising trend in Lux.
10. Advertisement expenses and profit shows a raising trend in Santoor.
11. Profit is fluctuating according to advertisement expenditure in Godrej.no.1
12. Advertisement expenditure and profit shows a fluctuating trend in Nirma.
13. Vivel, Lux,Santoor have rising trend in sale. Nirma and Godrej.no.1 have
lower sales compared to others.
14. Advertisement expenses of lux and santoor are increasing and it shows slight
fluctuation inVivel, Goderj.No.1, and Nirma.
15. Profits of all companies are increasing.
16. Correlation between sales and advertisement of Godrej company is positive.
17. The expenditure incurred on advertisement by lux company helps to increases
the sale and profit of the company.
18. There is high degree of positive relation between sales and advertisement
expenditure of Nirma Company.
19. The correlation between sales and advertisement expenditure of Santoor
Company is positive.
20. The advertisement expenditure makes positive impacts on sales turnover of
vivel company.
34
Recommendations;
1. Information published through advertisement should be reliable.
2. Use uniform or identical symbols, logs, marks for same product during
the life time of company.
3. The advertisement expenditure should be set in terms of a specified
percentage of sales according to profit.
4. Processing should be simplified.
5. The merits and demerits of this should be revealed.
35
Conclusion:
The study examines the effectiveness of advertisement on sales turnover.
Advertisement makes the product, idea, services known to induce action in
accordance with the intent and purpose of the advertiser. it helps to increase the
sales turnover of the company. The study aims to analysis the trend of sales over
five years and to know the effect of advertisement on customer’s decision
making. cross-sectional data are records of advertising expenditure and sales for
a specific period over different market. time-series data are records of parts of
advertisement expenditure and sales over times. The financial data of five
companies over five years are analyses in the study. The study helps to find how
advertisement expenditure makes impact on profit of the company. Statistical
tool of correlation helps to find out the relation between sales and advertisement.
Graphs and tables represent the trend over five years. Primary data is collected
using questionnaire with fifty samples. Ads can be a cost-effective way to
disseminate messages, whether to build a brad preference or to educate people.
The advertisement budget is set in terms of a specified percentage of sale. The
study deals with an in-depth analysis of sales turnover, advertisement
expenditure and profit of the five companies. The objectives of the study are to
study the advertisement effectiveness on sales turnover. there is positive
correlation exists between advertisement and sales turn over. So from this brief
and precise study it is concluded that the effectiveness of advertisement has a
direct, positive and proportional relationship with the overall sales turnover of
the soap manufacturing company.
36

BIBLIOGRAPHY
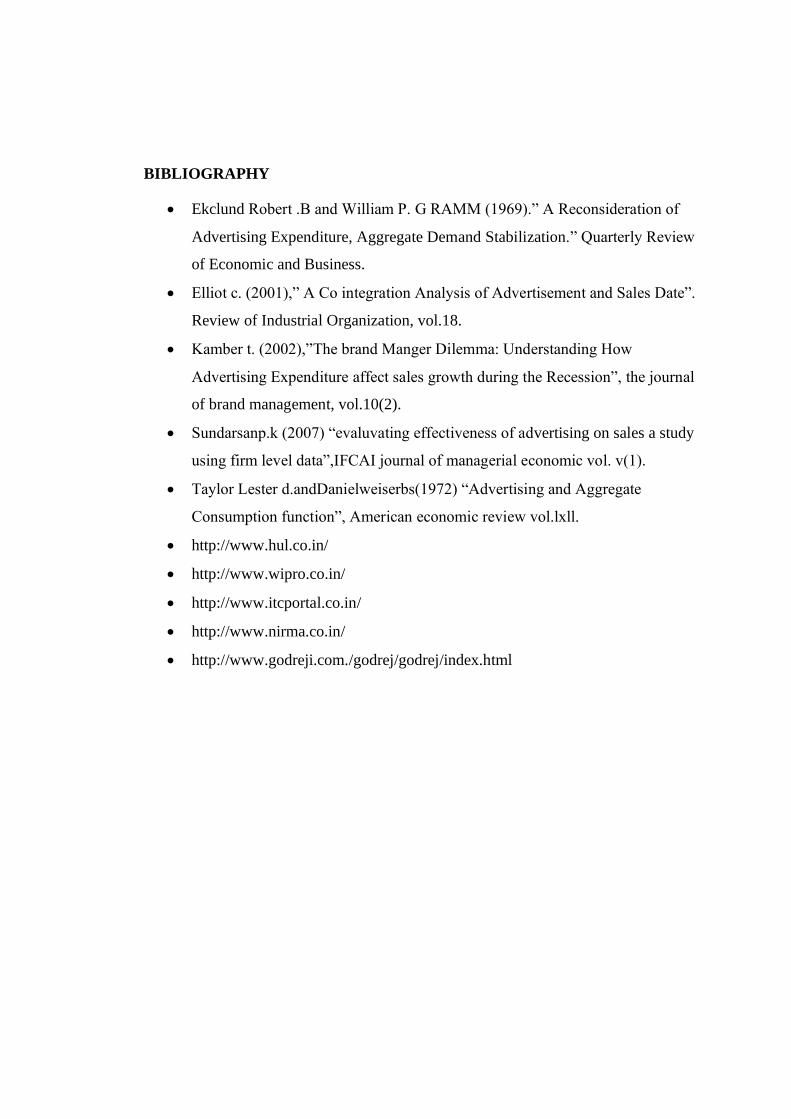
BIBLIOGRAPHY
• Ekclund Robert .B and William P. G RAMM (1969).” A Reconsideration of
Advertising Expenditure, Aggregate Demand Stabilization.” Quarterly Review
of Economic and Business.
• Elliot c. (2001),” A Co integration Analysis of Advertisement and Sales Date”.
Review of Industrial Organization, vol.18.
• Kamber t. (2002),”The brand Manger Dilemma: Understanding How
Advertising Expenditure affect sales growth during the Recession”, the journal
of brand management, vol.10(2).
• Sundarsanp.k (2007) “evaluvating effectiveness of advertising on sales a study
using firm level data”,IFCAI journal of managerial economic vol. v(1).
• Taylor Lester d.andDanielweiserbs(1972) “Advertising and Aggregate
Consumption function”, American economic review vol.lxll.
• http://www.hul.co.in/
• http://www.wipro.co.in/
• http://www.itcportal.co.in/
• http://www.nirma.co.in/
• http://www.godreji.com./godrej/godrej/index.html
APPENDIX
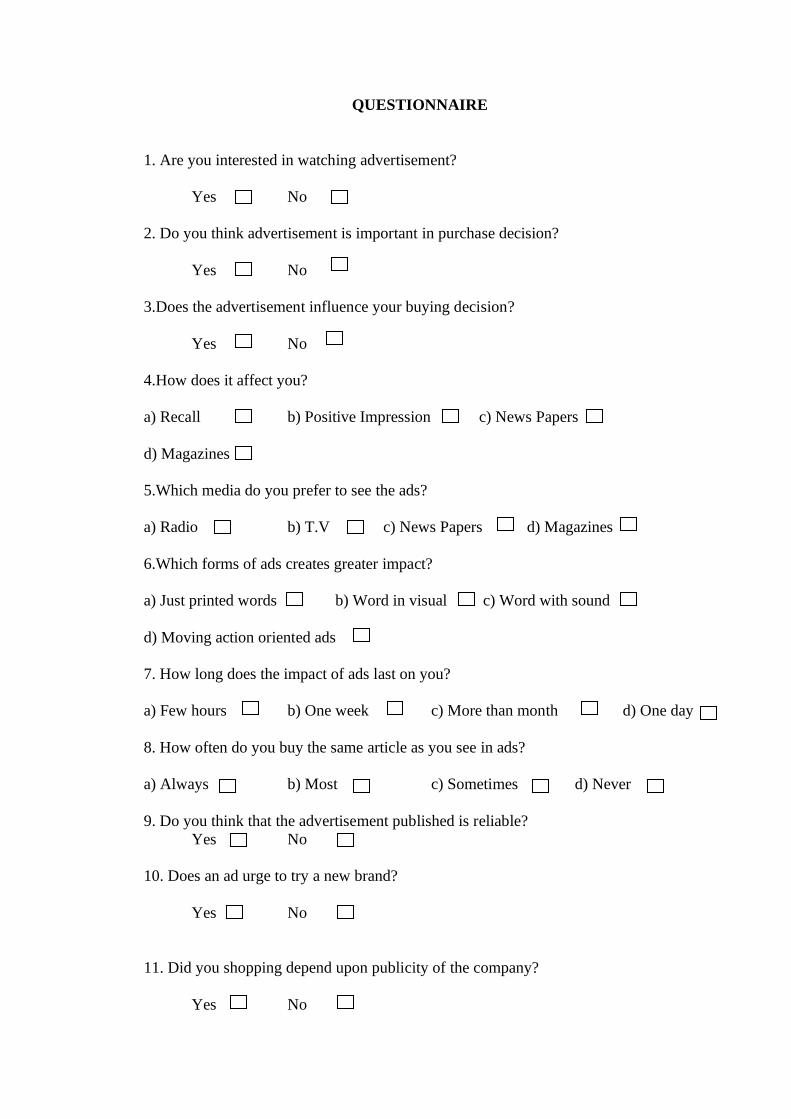
QUESTIONNAIRE
1. Are you interested in watching advertisement?
Yes No
2. Do you think advertisement is important in purchase decision?
Yes No
3.Does the advertisement influence your buying decision?
Yes No
4.How does it affect you?
a) Recall b) Positive Impression c) News Papers
d) Magazines
5.Which media do you prefer to see the ads?
a) Radio b) T.V c) News Papers d) Magazines
6.Which forms of ads creates greater impact?
a) Just printed words b) Word in visual c) Word with sound
d) Moving action oriented ads
7. How long does the impact of ads last on you?
a) Few hours b) One week c) More than month d) One day
8. How often do you buy the same article as you see in ads?
a) Always b) Most c) Sometimes d) Never
9. Do you think that the advertisement published is reliable?
Yes No
10. Does an ad urge to try a new brand?
Yes No
11. Did you shopping depend upon publicity of the company?
Yes No
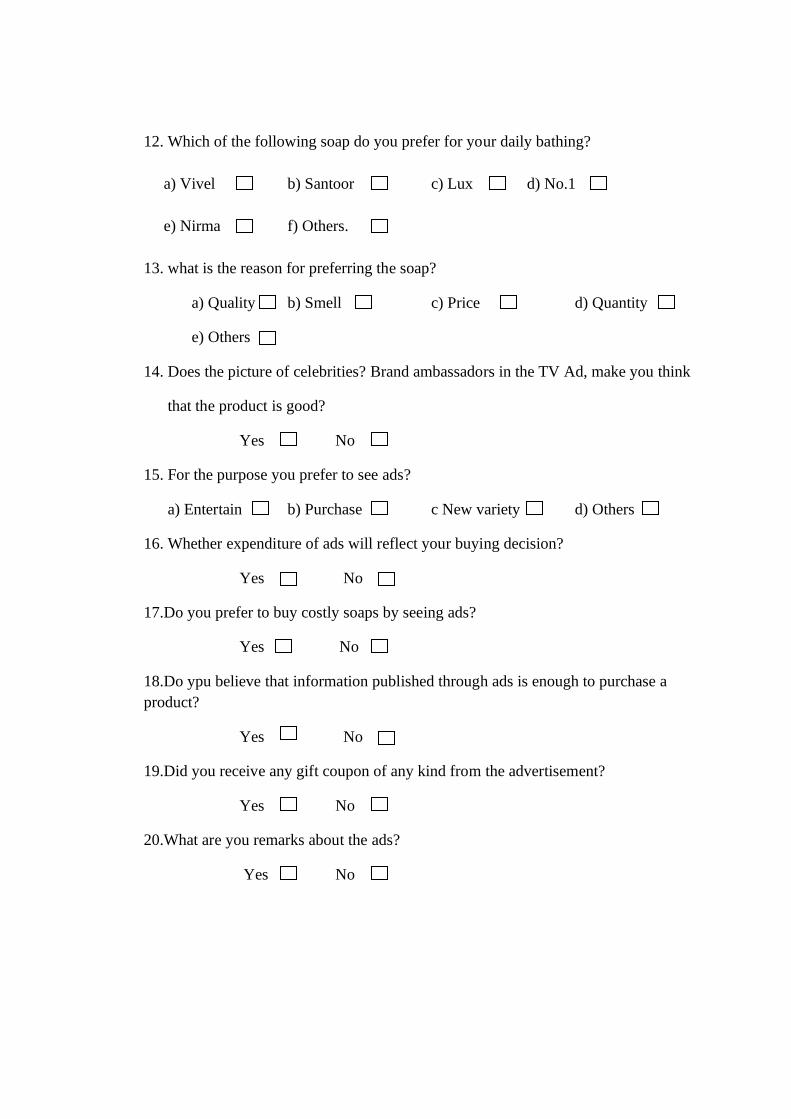
12. Which of the following soap do you prefer for your daily bathing?
a) Vivel b) Santoor c) Lux d) No.1
e) Nirma f) Others.
13. what is the reason for preferring the soap?
a) Quality b) Smell c) Price d) Quantity
e) Others
14. Does the picture of celebrities? Brand ambassadors in the TV Ad, make you think
that the product is good?
Yes No
15. For the purpose you prefer to see ads?
a) Entertain b) Purchase c New variety d) Others
16. Whether expenditure of ads will reflect your buying decision?
Yes No
17.Do you prefer to buy costly soaps by seeing ads?
Yes No
18.Do ypu believe that information published through ads is enough to purchase a
product?
Yes No
19.Did you receive any gift coupon of any kind from the advertisement?
Yes No
20.What are you remarks about the ads?
Yes No