A Study on Capital Structure Analysis at MYMUL, Mysore
12
Yashaswini D et al., IJSRR 2019, 8(2), 4678-4689 IJSRR, 8(2) April. – June., 2019 Page 4678 Research article Available online www.ijsrr.org ISSN: 2279–0543 International Journal of Scientific Research and Reviews “A Study on Capital Structure Analysis at MYMUL, Mysore” Yashaswini D 1* and Arjun J 2 1* PG Student, Dept. of MBA, PESITM Shivamogga-577201. Karnataka State. India. Email- [email protected] Mob: 8296146814 Assistant Professor, Dept. of MBA, PESITM Shivamogga-577201. Karnataka State. India. Email- [email protected] Mob: 9164012364 ABSTRACT The purpose of this project is to understand the “Capital Structure Analysis at MYMUL, Mysore” the finance managers of most firms invest maximum time and effort on capital structure analysis strategy aimed to maintaining a balance between leverages and profitability has for reaching results on growth and survival of the firm. Therefore, in order to bring out the relationship between capital structure analysis and debt equity, return on equity of the firm this topic has been choosen. Researcher have adopted descriptive research methodology and primary data collected from personal interaction with finance manager and other staff of the Mysore Milk Union Ltd., Mysore. Secondary Data 3 years financial statement of the Mysore Milk Union Ltd., Mysore. Journals and Books of capital structure analysis and websites. The debt equity ratio states that the firm has not taking proper use of capital structure effectively from last 3 years. The MYMUL, has enjoyed good financial position with profit margin debt equity ratio reached to standard ratio 1:2 and its shows positive direction to the firm so it is favorable to the company for profitability. By the capital structure analysis, it concludes that, overall financial performance of the MYMUL, is satisfactory. The company should take some measures to increase profit i.e. proper utilization of available resources to increase profit i.e. proper utilization of available resources and sale promotion to attract new customers. KEY WORDS: Capital structure, Profitability, Debt equity, Return on equity * Corresponding Author Mr. Arjun J Assistant Professor, Dept. of MBA, PESITM Shivamogga-577201. Karnataka State. India. Email- [email protected] Mob: 9164012364
-
Upload
khangminh22 -
Category
Documents
-
view
0 -
download
0
Transcript of A Study on Capital Structure Analysis at MYMUL, Mysore
Yashaswini D et al., IJSRR 2019, 8(2), 4678-4689
IJSRR, 8(2) April. – June., 2019 Page 4678
Research article Available online www.ijsrr.org ISSN: 2279–0543
International Journal of Scientific Research and Reviews
“A Study on Capital Structure Analysis at MYMUL, Mysore”
Yashaswini D1* and Arjun J2
1*PG Student, Dept. of MBA, PESITM Shivamogga-577201. Karnataka State. India. Email- [email protected] Mob: 8296146814
Assistant Professor, Dept. of MBA, PESITM Shivamogga-577201. Karnataka State. India. Email- [email protected] Mob: 9164012364
ABSTRACT The purpose of this project is to understand the “Capital Structure Analysis at MYMUL, Mysore” the finance managers of most firms invest maximum time and effort on capital structure analysis strategy aimed to maintaining a balance between leverages and profitability has for reaching results on growth and survival of the firm. Therefore, in order to bring out the relationship between capital structure analysis and debt equity, return on equity of the firm this topic has been choosen. Researcher have adopted descriptive research methodology and primary data collected from personal interaction with finance manager and other staff of the Mysore Milk Union Ltd., Mysore. Secondary Data 3 years financial statement of the Mysore Milk Union Ltd., Mysore. Journals and Books of capital structure analysis and websites. The debt equity ratio states that the firm has not taking proper use of capital structure effectively from last 3 years. The MYMUL, has enjoyed good financial position with profit margin debt equity ratio reached to standard ratio 1:2 and its shows positive direction to the firm so it is favorable to the company for profitability. By the capital structure analysis, it concludes that, overall financial performance of the MYMUL, is satisfactory. The company should take some measures to increase profit i.e. proper utilization of available resources to increase profit i.e. proper utilization of available resources and sale promotion to attract new customers.
KEY WORDS: Capital structure, Profitability, Debt equity, Return on equity
*Corresponding Author
Mr. Arjun J Assistant Professor,
Dept. of MBA, PESITM Shivamogga-577201.
Karnataka State. India.
Email- [email protected]
Mob: 9164012364
Yashaswini D et al., IJSRR 2019, 8(2), 4678-4689
IJSRR, 8(2) April. – June., 2019 Page 4679
INTRODUCTION In today’s competition world, no business is spread from the competition even the basic need
industries like milk industry are facing the same problem, so the companies should look at
theconsumer’s attitude towards their products and if any things goes wrong they should suddenly
rectify it.
The main objective of the companies is to be in the field of business and recap profits by
providing the necessary products at reasonable cost with good quality.
INDUSTRY PROFILE Thehighest milk producer in the entire globe is India. It is well known as globally it might be
dream for any nation in the world to capitalize on the largest and fastest rising milk and milk
products market. Indian dairy industry has been observing rapid growth with liberalization as the
economy provides good chances for MNCs and foreign investors to releaseusing innovative
technologiesthe main objective of the Indian. Dairy Industry is to manage the national resources in
manner to enhance milk production and upgrade milk processing.
The Indian dairy is regarded as an instrument for social and economic development. A
million of small manufacturerswho are dispersed throughout the rural areas supply the country’s
milk. An agriculturalistmaintains one or two milking animals in an average. A small farmer with a
land base and an ample labour areencouraged to practice dairying as an occupation subsidiary to
seasonal and the dairying provides a stable which is a year round income and also an important
economic incentive for a small farmer.
COMPANY PROFILE With the capacity of 10 TLPD Mysore Dairy was started in the year 1965 under the control of
the Department of Animal Husbandry and Veterinary Services of Karnataka State, which was
transferred to Karnataka Dairy Development Corporation in the year 1974. Later the capacity was
expanded to 60 TLPD in 1980 under the scheme operation flood and transferred to the Karnataka
milk Federation in 1984. The dairy and its chilling centers were handed over to Mysore milk union
on 01.06.1987 as per the Government policy. Again, the capacity was expanded to 100 TLPD under
the operation flood II and further expanded to 180 TLPD under perspective plan I programme.
Karnataka dairy development projects, under the World Bank aided, the activities on dairy
development were taken up in year 1975. on 23.11.1976, the Mysore District co-operative milk
producers’ societies union Ltd was registered, having the jurisdiction extended to the entire Mysore
District and five Taluks of Mandya District. The work of organization of milk co-operatives in
‘AMUL pattern’ with the main objective of socio-economic reformation of the farmers rural areas
Yashaswini D et al., IJSRR 2019, 8(2), 4678-4689
IJSRR, 8(2) April. – June., 2019 Page 4680
through dairying as main subsidiary occupation came under the Mysore District co-operative milk
producers’ societies union Ltd.,
LITERATURE REVIEW 1. Prof. (Dr). T. Velnampy& J. AloyNiresh (2012):The objectives are to find out an optimal
capital structure that would be associated with the best performance, and to suggest the banks
to increase profitability through adapting a better strategic framework on capital structure.
The company is an appropriate mix of capital structure to increase the profitability of banks.
The banks must set competitive lending that would not deter customers from accessing loans
in a company to achieve these.
2. Dr. M Sekar (2014):The study is to value the company, the influence of capital structure and
the return on equity. The value of the company is increased over years because of the
investment decisions of the company that are reflected from the EBIT as well as the low cost
of capital due to balanced capital structure. As it has an optimal capital structure it will have
positive effect in its future business.
3. Alicia M. Robb (2010):This study contrary to many accounts of startup activity, the firms in
our data rely heavily on external debt sources such as bank financing, and less extensively on
friends and familybased funding sources.The company motivated in part by widely held view
that frictions in capital markets prevent startups from achieving their optimal size, or indeed,
from starting up at all.
4. Ms. M. Gowri (2014):This Study examines the influence of capital structure on the
performance of the company so as to understand the factors that influence the capital
structure decisions of the company and know the impact of capital structure decisions on
profitability and performance of the company. The study concludes that the capital structure
is the crucial decision to be taken by every businessthe positives and negatives of these
decisions play an important role in determining the future of every business.
5. S. Sathyanarayana (2017):A study on “The determinants of capital structure evidence from
Indian stock market with special reference to capital goods, infrastructure and IT sector” aims
to examine the relationship between various identified determinants (profitability, tangibility,
growth rate, business risk, size and non-debt tax shield) and impact on financial leverage
decisions ofcapital goods, FMCG, Infrastructure and IT sector in Indian stock market. The
study reveals that the value of firm can be determined by taking its expected stream.
STATEMENT OF THE PROBLEM
Yashaswini D et al., IJSRR 2019, 8(2), 4678-4689
IJSRR, 8(2) April. – June., 2019 Page 4681
The MYMUL is a one the oldest firm. The firm is facing the problem of lack in advance
technology and its being very tough to compete in the market all these happen because of the
improper of utilization available of capital. That is a reason the study is taken on capital structure
analysis.
OBJECTIVES OF THE STUDY 1. To study and, understand the fundamental, concepts of capital structure analysis.
2. To know, about the source of capital structure, in the company.
3. To understand, how firm can create value, though its financing decision.
4. To show/ how to take account of a firm- financing mix in evaluating investment decision.
5. To suggest.the strategies to enhance better. optimal capital structure for the company.
TOOLS AND TECHNIQUE o Diagrammatic presentation of capital structure.
o Ratio analysis.
SCOPE OF THE STUDY
The study. is limited to capital structure. analysis of MYMUL.
The study, is limited to published financial0data received from MYMUL.
It covers. (2015-18). financial statement only.
RESEARCH METHODOLOGY Primary data: The information collected from personal interaction with finance manager and
other staff of Mysore Milk Union Ltd., Mysore.
Secondary data:It was collected from
Journals and Books...
Websites. (www.mymul.coop).
Annual report (2015-2018) and Records of the.Company.
LIMITATIONS OF THE STUDY o The time, constraint for carrying, out detailed analysis.
o Study is, limited to the use of only few, selected techniques.
o The data may not adequately, represent the issues entirely.
DATA ANALYSIS & INTERPRETATION
1. RATIO ANALYSIS:
Yashaswini D et al., IJSRR 2019, 8(2), 4678-4689
IJSRR, 8(2) April. – June., 2019 Page 4682
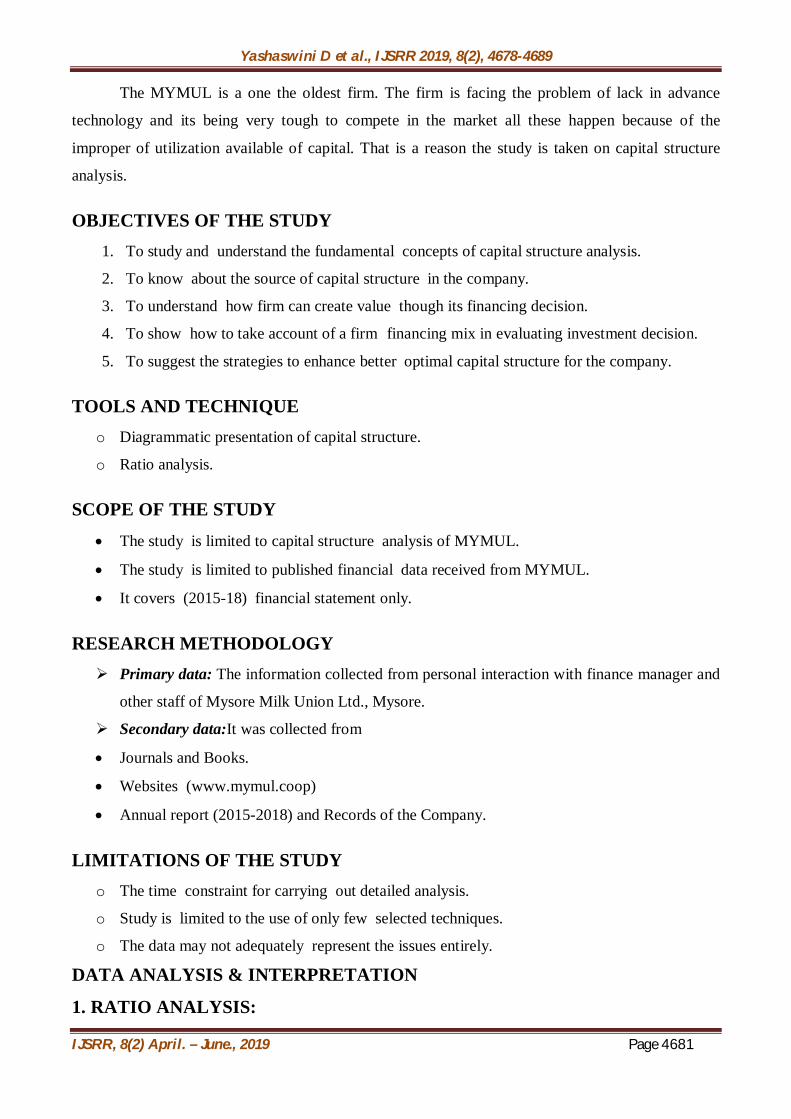
( Table No: 1 ) Table Showing Debt-Equity-Ratio Year Total debt Equity Ratio
2015-16 999,457,915.23 64,542,353.73 15.48 2016-17 74,575,854.42 72,299,851.54 1.03 2017-18 1,053,833,693.70 79,943,625.24 13.18
(Source: Annual Report of MYMUL) Graph No: 1
Graph ShowingDebt-Equity-Ratio
Analysis& Interpretation: The above0table shows0the debt equity ratio, in0the year 2015-16 the
ratio is 10.45, in 2016-17 the ratio is decreased 0.73 and 2017-18 the debt equity ratio is increased to
2.50.It is. clear that. the debt0equity ratio is 1:2; in this case the company is having more debt than
its equity. If the company is more depend on its debt, the company has to pay more interest, it leads
to downsize in profit level of the company. The company not able to meet day today operation of
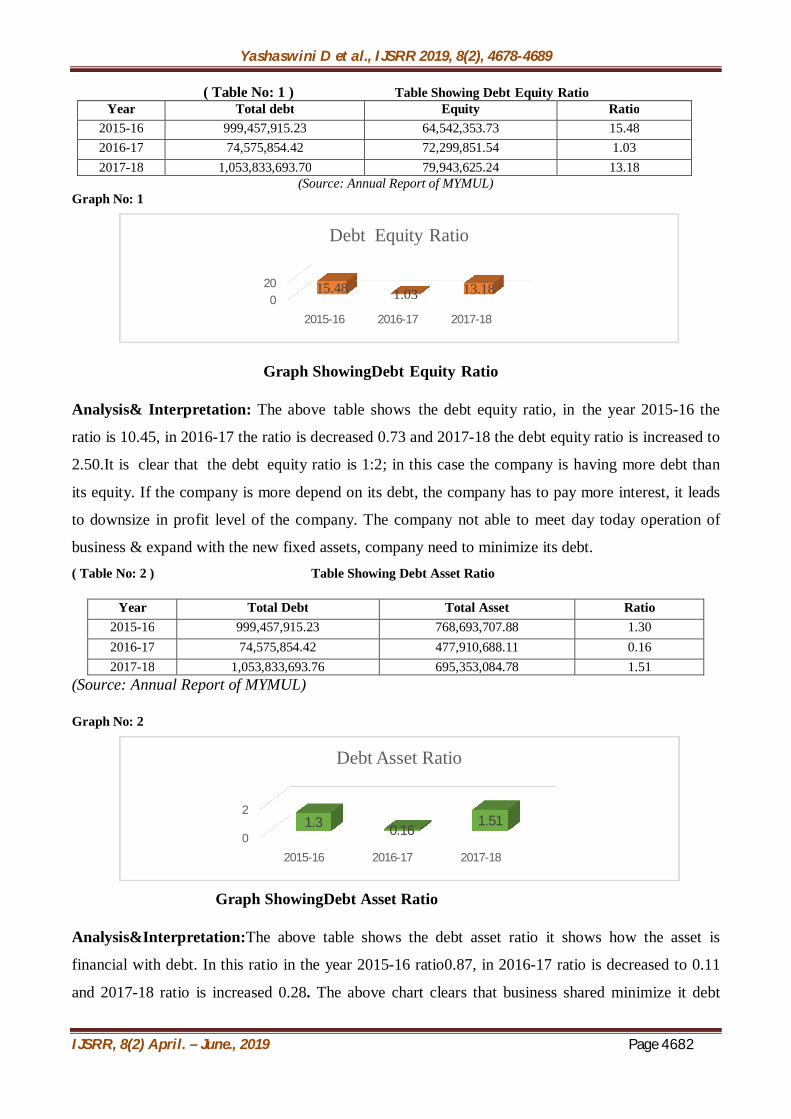
business & expand with the new fixed assets, company need to minimize its debt. ( Table No: 2 ) Table Showing Debt Asset Ratio
Year Total Debt Total Asset Ratio 2015-16 999,457,915.23 768,693,707.88 1.30 2016-17 74,575,854.42 477,910,688.11 0.16 2017-18 1,053,833,693.76 695,353,084.78 1.51
(Source: Annual Report of MYMUL)
Graph No: 2
Graph ShowingDebt Asset Ratio
Analysis&Interpretation:The above table shows the debt asset ratio it shows how the asset is
financial with debt. In this ratio in the year 2015-16 ratio0.87, in 2016-17 ratio is decreased to 0.11
and 2017-18 ratio is increased 0.28. The above chart clears that business shared minimize it debt
020
2015-16 2016-17 2017-18
15.48 1.03 13.18
Debt Equity Ratio
0
2
2015-16 2016-17 2017-18
1.3 0.161.51
Debt Asset Ratio
Yashaswini D et al., IJSRR 2019, 8(2), 4678-4689
IJSRR, 8(2) April. – June., 2019 Page 4683
asset ratio year by year. Because company faces a problem of non-payment of debt company not
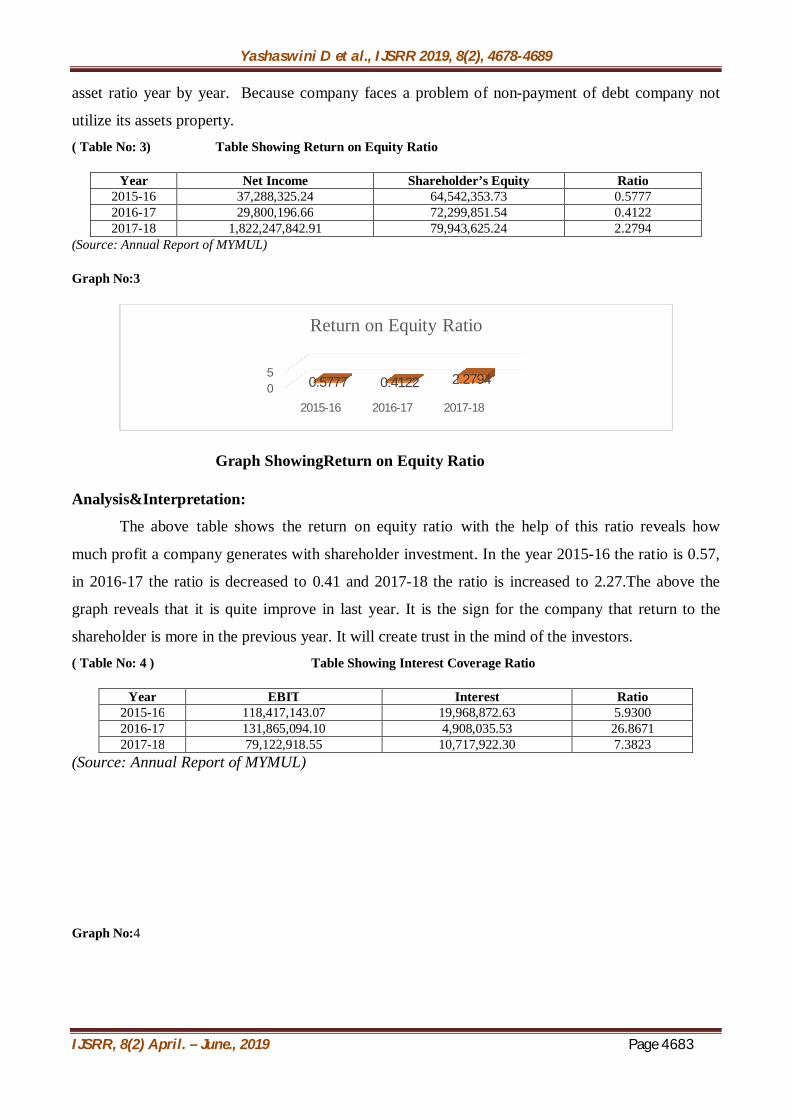
utilize its assets property. ( Table No: 3) Table Showing Return on Equity Ratio
Year Net Income Shareholder’s Equity Ratio 2015-16 37,288,325.24 64,542,353.73 0.5777 2016-17 29,800,196.66 72,299,851.54 0.4122 2017-18 1,822,247,842.91 79,943,625.24 2.2794
(Source: Annual Report of MYMUL)
Graph No:3
Graph ShowingReturn on Equity Ratio
Analysis&Interpretation:
The above0table shows0the return0on equity ratio0with the help of this ratio reveals how
much profit a company generates with shareholder investment. In-the year 2015-16 the ratio is 0.57,
in 2016-17 the ratio is decreased to 0.41 and 2017-18 the ratio is increased to 2.27.The above the
graph reveals that it is quite improve in last year. It is the sign for the company that return to the
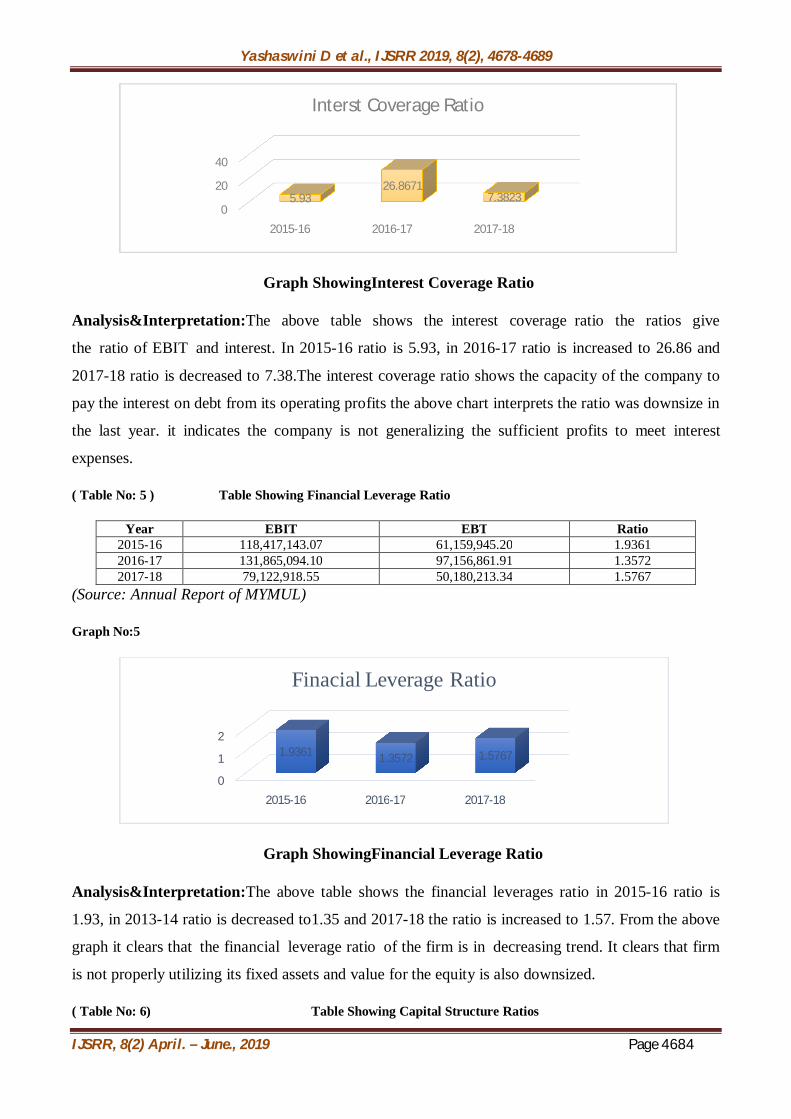
shareholder is more in the previous year. It will create trust in the mind of the investors. ( Table No: 4 ) Table Showing Interest Coverage Ratio
Year EBIT Interest Ratio 2015-16 118,417,143.07 19,968,872.63 5.9300 2016-17 131,865,094.10 4,908,035.53 26.8671 2017-18 79,122,918.55 10,717,922.30 7.3823
(Source: Annual Report of MYMUL)
Graph No:4
05
2015-16 2016-17 2017-18
0.5777 0.4122 2.2794
Return on Equity Ratio
Yashaswini D et al., IJSRR 2019, 8(2), 4678-4689
IJSRR, 8(2) April. – June., 2019 Page 4684
Graph ShowingInterest Coverage Ratio
Analysis&Interpretation:The above table shows the0interest coverage0ratio the ratios give
the0ratio of EBIT0and interest. In 2015-16 ratio is 5.93, in 2016-17 ratio is increased to 26.86 and
2017-18 ratio is decreased to 7.38.The interest coverage ratio shows the capacity of the company to
pay the interest on debt from its operating profits the above chart interprets the ratio was downsize in
the last year. it indicates the company is not generalizing the sufficient profits to meet interest
expenses.
( Table No: 5 ) Table Showing Financial Leverage Ratio
Year EBIT EBT Ratio 2015-16 118,417,143.07 61,159,945.20 1.9361 2016-17 131,865,094.10 97,156,861.91 1.3572 2017-18 79,122,918.55 50,180,213.34 1.5767
(Source: Annual Report of MYMUL)
Graph No:5
Graph ShowingFinancial Leverage Ratio
Analysis&Interpretation:The above table shows the financial leverages ratio in 2015-16 ratio is
1.93, in 2013-14 ratio is decreased to1.35 and 2017-18 the ratio is increased to 1.57. From the above
graph it clears that0the financial0leverage ratio0of the firm is in0decreasing trend. It clears that firm
is not properly utilizing its fixed assets and value for the equity is also downsized.
( Table No: 6) Table Showing Capital Structure Ratios
0
20
40
2015-16 2016-17 2017-18
5.9326.8671
7.3823
Interst Coverage Ratio
0
1
2
2015-16 2016-17 2017-18
1.9361 1.3572 1.5767
Finacial Leverage Ratio
Yashaswini D et al., IJSRR 2019, 8(2), 4678-4689
IJSRR, 8(2) April. – June., 2019 Page 4685
RATIOS 2015-16 2016-17 2017-18 Debt Equity Ratio 15.48 1.03 13.18 Debt Asset Ratio 1.30 0.16 1.51
Return on Equity Ratio 0.57 0.41 2.28 Interest Coverage Ratio 5.93 26.86 7.38 Financial leverage Ratio 1.93 1.35 1.57
(Source: Annual Report of MYMUL)
Analysis:
From the0above table0it interrupted that0Debt0Equity0Ratio in the year 2015-16 15.48%,
2016-17 is 1.03 & 2017-18 is 13.18. Debt Asset Ratio in the year 2015-16 1.30, 2016-17 is 0.16 and
in the year 2017-18 is 1.51. Debt Capital Ratio in the year 2015-16 15.79, 2016-17 is 10.39 and in
the year 2017-18 is 13.27. Return on Equity Ratio 2015-16 0.57, 2016-17 is 0.41 and in the year
2017-18 is 2.28. Interest Coverage Ratio 2015-16 5.93, 2016-17 is 26.86 and in the year 2017-18 is
7.38. Financial leverage Ratio 2015-16 1.93, 2016-17 is 1.35 and in the year 2017-18 is 1.57.
2. ANALYSIS0AND INTERPRETATION OF THE DATA COLLECTED WITH
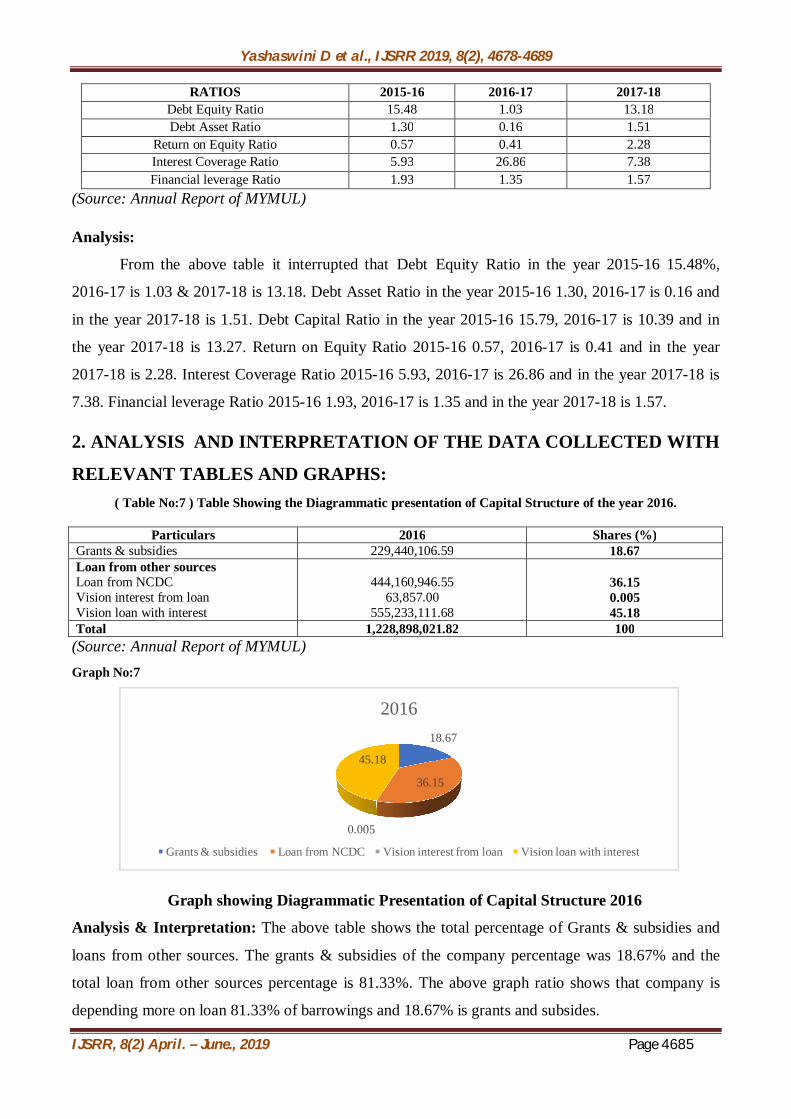
RELEVANT TABLES AND GRAPHS: ( Table No:7 ) Table Showing the Diagrammatic presentation of Capital Structure of the year 2016.
(Source: Annual Report of MYMUL) Graph No:7
Graph showing Diagrammatic Presentation of Capital Structure 2016
Analysis & Interpretation: The above table shows the total percentage of Grants & subsidies and
loans from other sources. The grants & subsidies of the company percentage was 18.67% and the
total loan from other sources percentage is 81.33%. The above graph ratio shows that company is
depending more on loan 81.33% of barrowings and 18.67% is grants and subsides.
18.67
36.15
0.005
45.18
2016
Grants & subsidies Loan from NCDC Vision interest from loan Vision loan with interest
Particulars 2016 Shares (%) Grants & subsidies 229,440,106.59 18.67 Loan from other sources Loan from NCDC Vision interest from loan Vision loan with interest
444,160,946.55
63,857.00 555,233,111.68
36.15 0.005 45.18
Total 1,228,898,021.82 100
Yashaswini D et al., IJSRR 2019, 8(2), 4678-4689
IJSRR, 8(2) April. – June., 2019 Page 4686
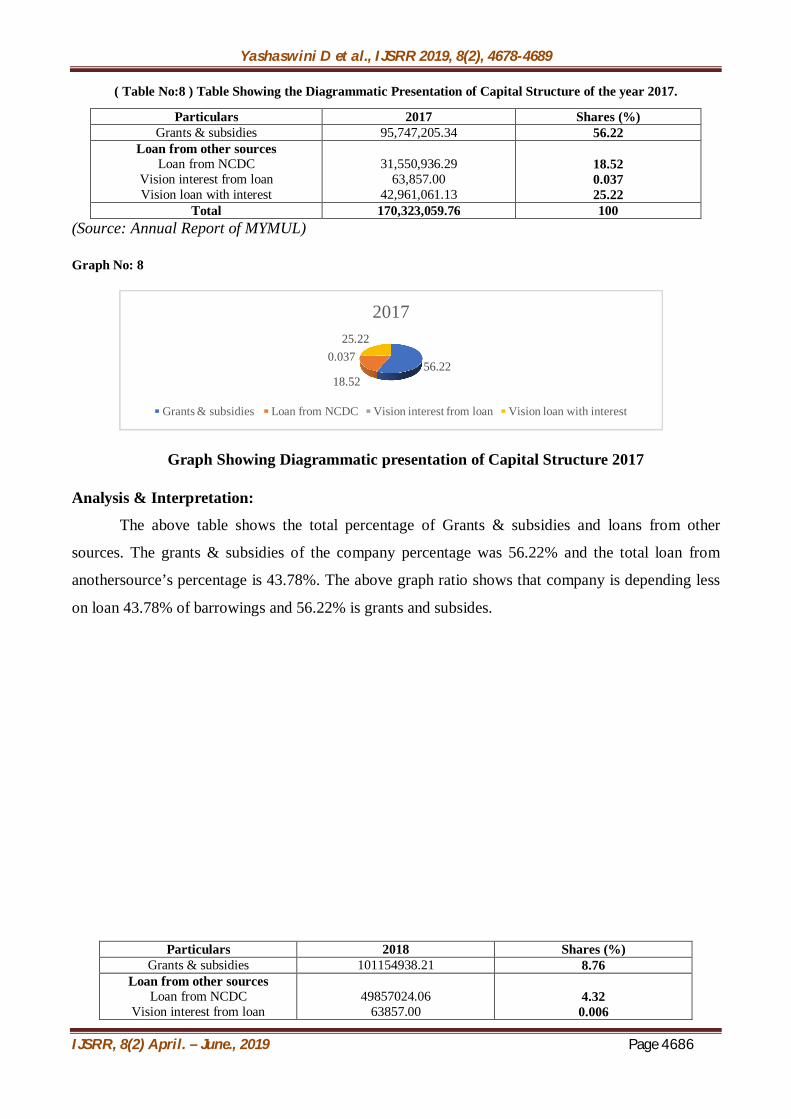
( Table No:8 ) Table Showing the Diagrammatic Presentation of Capital Structure of the year 2017.
(Source: Annual Report of MYMUL)
Graph No: 8
Graph Showing Diagrammatic presentation of Capital Structure 2017
Analysis & Interpretation:
The above table shows the total percentage of Grants & subsidies and loans from other
sources. The grants & subsidies of the company percentage was 56.22% and the total loan from
anothersource’s percentage is 43.78%. The above graph ratio shows that company is depending less
on loan 43.78% of barrowings and 56.22% is grants and subsides.
56.2218.52
0.03725.22
2017
Grants & subsidies Loan from NCDC Vision interest from loan Vision loan with interest
Particulars 2017 Shares (%) Grants & subsidies 95,747,205.34 56.22
Loan from other sources Loan from NCDC
Vision interest from loan Vision loan with interest
31,550,936.29
63,857.00 42,961,061.13
18.52 0.037 25.22
Total 170,323,059.76 100
Particulars 2018 Shares (%) Grants & subsidies 101154938.21 8.76
Loan from other sources Loan from NCDC
Vision interest from loan
49857024.06
63857.00
4.32 0.006
Yashaswini D et al., IJSRR 2019, 8(2), 4678-4689
IJSRR, 8(2) April. – June., 2019 Page 4687
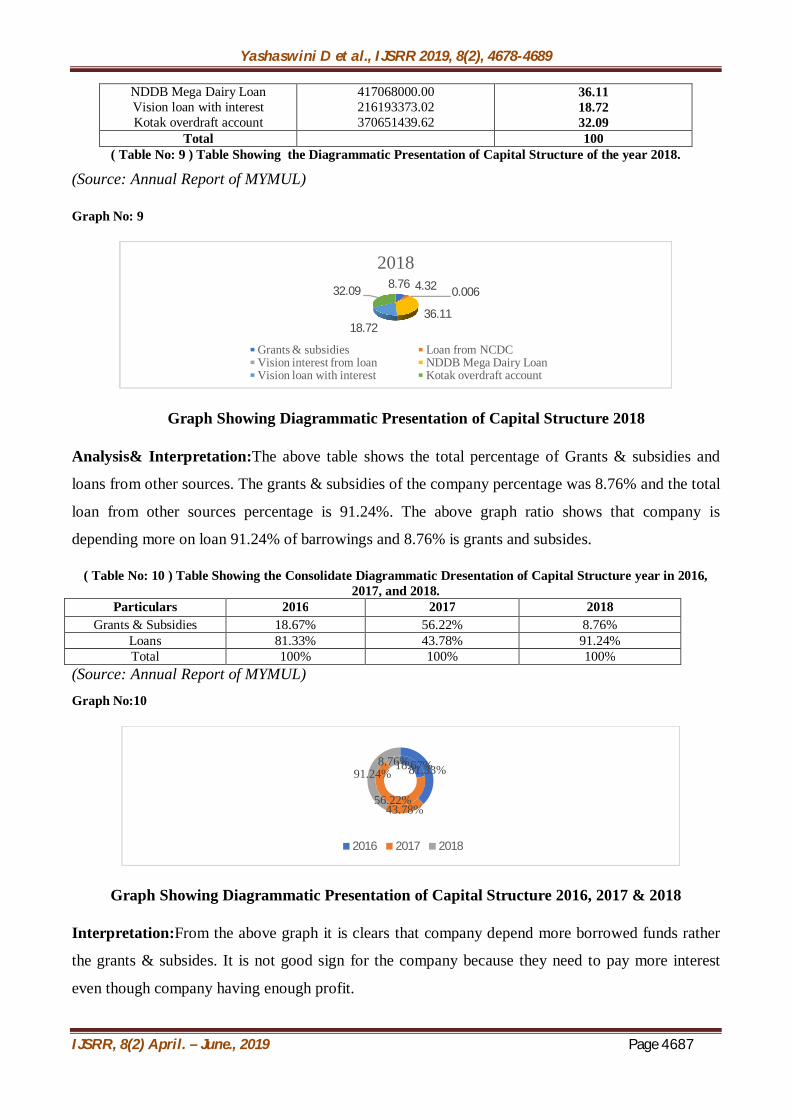
( Table No: 9 ) Table Showing the Diagrammatic Presentation of Capital Structure of the year 2018.
(Source: Annual Report of MYMUL)
Graph No: 9
Graph Showing Diagrammatic Presentation of Capital Structure 2018
Analysis& Interpretation:The above table shows the total percentage of Grants & subsidies and
loans from other sources. The grants & subsidies of the company percentage was 8.76% and the total
loan from other sources percentage is 91.24%. The above graph ratio shows that company is
depending more on loan 91.24% of barrowings and 8.76% is grants and subsides.
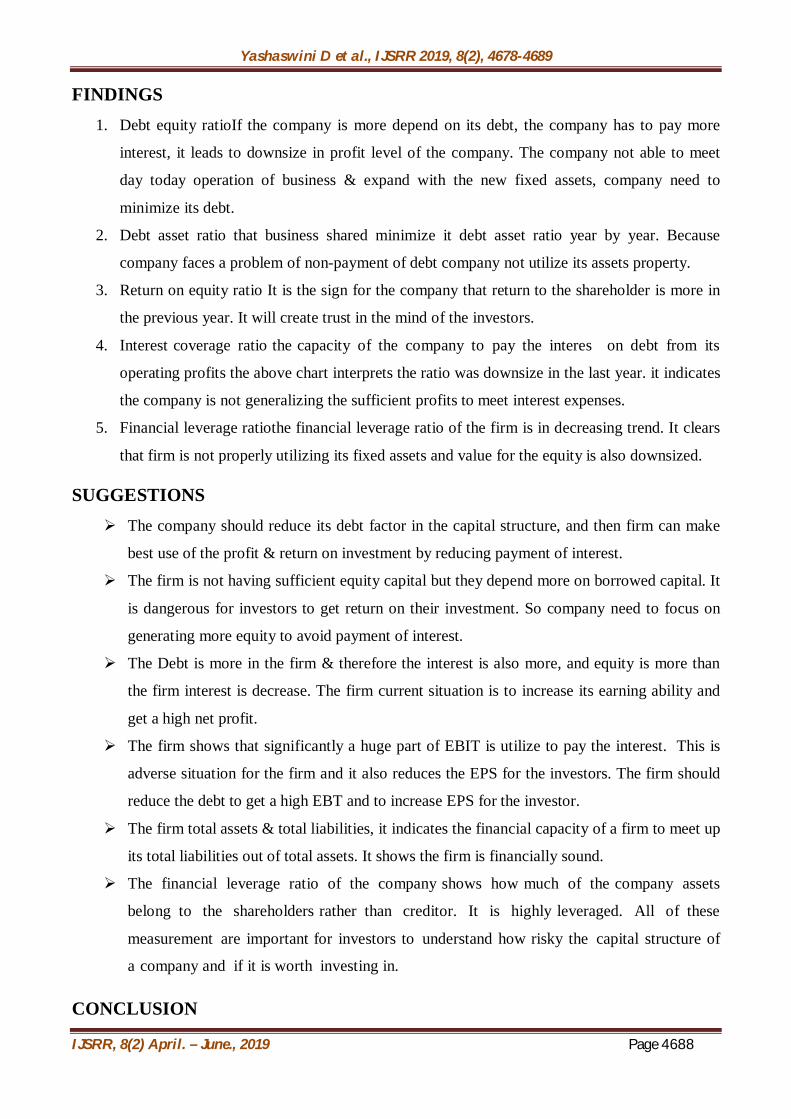
( Table No: 10 ) Table Showing the Consolidate Diagrammatic Dresentation of Capital Structure year in 2016, 2017, and 2018.
Particulars 2016 2017 2018 Grants & Subsidies 18.67% 56.22% 8.76%
Loans 81.33% 43.78% 91.24% Total 100% 100% 100%
(Source: Annual Report of MYMUL) Graph No:10
Graph Showing Diagrammatic Presentation of Capital Structure 2016, 2017 & 2018
Interpretation:From the above graph it is clears that company depend more borrowed funds rather
the grants & subsides. It is not good sign for the company because they need to pay more interest
even though company having enough profit.
8.76 4.32 0.006
36.1118.72
32.09
2018
Grants & subsidies Loan from NCDCVision interest from loan NDDB Mega Dairy LoanVision loan with interest Kotak overdraft account
18.67%
56.22%
8.76%81.33%
43.78%
91.24%
2016 2017 2018
NDDB Mega Dairy Loan Vision loan with interest Kotak overdraft account
417068000.00 216193373.02 370651439.62
36.11 18.72 32.09
Total 100
Yashaswini D et al., IJSRR 2019, 8(2), 4678-4689
IJSRR, 8(2) April. – June., 2019 Page 4688
FINDINGS
1. Debt equity ratioIf the company is more depend on its debt, the company has to pay more
interest, it leads to downsize in profit level of the company. The company not able to meet
day today operation of business & expand with the new fixed assets, company need to
minimize its debt.
2. Debt asset ratio that business shared minimize it debt asset ratio year by year. Because
company faces a problem of non-payment of debt company not utilize its assets property.
3. Return on equity ratio It is the sign for the company that return to the shareholder is more in
the previous year. It will create trust in the mind of the investors.
4. Interest-coverage ratio-the-capacity of the company to0pay the interes0 on debt from0its
operating profits the above chart interprets the ratio was downsize in the last year. it indicates
the company is not generalizing the sufficient profits to meet interest expenses.
5. Financial leverage ratiothe financial leverage ratio of the firm is in decreasing trend. It clears
that firm is not properly utilizing its fixed assets and value for the equity is also downsized.
SUGGESTIONS The company should reduce its debt factor in the capital structure, and then firm can make
best use of the profit & return on investment by reducing payment of interest.
The firm is not having sufficient equity capital but they depend more on borrowed capital. It
is dangerous for investors to get return on their investment. So company need to focus on
generating more equity to avoid payment of interest.
The Debt is more in the firm & therefore the interest is also more, and equity is more than
the firm interest is decrease. The firm current situation is to increase its earning ability and
get a high net profit.
The firm shows that significantly a huge part of EBIT is utilize to pay the interest. This is
adverse situation for the firm and it also reduces the EPS for the investors. The firm should
reduce the debt to get a high EBT and to increase EPS for the investor.
The firm total assets & total liabilities, it indicates the financial capacity of a firm to meet up
its total liabilities out of total assets. It shows the firm is financially sound.
The financial leverage ratio of the company-shows how-much of the-company assets
belong0to the shareholders-rather0than creditor. It is highly-leveraged. All of0these
measurement0are important-for investors to0understand how-risky the0capital structure of
a-company and0if it is worth0investing in.
CONCLUSION
Yashaswini D et al., IJSRR 2019, 8(2), 4678-4689
IJSRR, 8(2) April. – June., 2019 Page 4689
The0study on capital structure analysis is a critical thing which helps to recognize the
situation of the firm in capital mix. The firm is now performing well in its process; the firm has good
manufacture services. Any how the firm wants to decrease its debt through raising funds from further
sources.
This study helped to find out many things and analysis of capital structure helped to advise
the firm to get better its situation. About capital structure of the firm is not having a good situation as
it may leads to emergency in the business. The firm’s return on equity is good, but the firm is face
high cost if interest. So, the firm has to reduce its operating cost and retain current assets in good
position.
Overall company need not to depends much on the barrowed funds and save the probability
of the firm by reducing its payment towards interest.
BIBLIOGRAPHY
Prof. (Dr). T. Velnampy& J. AloyNiresh the study on the topic “The relationship between
structure & profitability”. Global journal of management and business research, vol no. 12
issue 2012; 16 (12) ISSN: 0975-5853
Dr. M SekarThe study on the topic “A study on capital structure and leverage of tata motors
limited: its role and future prospects”. Perocedia economics and finance vol no.11 issue 2014;
457 (22); ISSN: 445-458
Alicia M. Robb the0study on0the topic “The capital0structure decisions of new firms”. Issue
2010. NBER working Paper No: 16272
Ms. M. Gowri the study on the topic “A study on capital structure and leverage of tata motors
limited: its role and future prospects”. Perocedia economics and finance vol no.11 issue 2014;
457 (22); ISSN: 445-458.
S. Sathyanarayana A study on “The determinants of capital structure evidence from Indian
stock market with special reference to capital goods, infrastructure and IT sector” 2017;
73(10) ISSN: 2320-7906.