Determinants of Capital Structure and Speed of Adjustment in ...
195
Determinants of Capital Structure and Speed of Adjustment in Nigerian Non-financial Firms By ERNEST EZEANI A thesis submitted in partial fulfilment for the requirements for the degree of Doctor of Philosophy, at the University of Central Lancashire January 2019
-
Upload
khangminh22 -
Category
Documents
-
view
0 -
download
0
Transcript of Determinants of Capital Structure and Speed of Adjustment in ...

Determinants of Capital Structure and Speed of Adjustment in
Nigerian Non-financial Firms
By
ERNEST EZEANI
A thesis submitted in partial fulfilment for the requirements for
the degree of Doctor of Philosophy, at the University of Central
Lancashire
January 2019

ii
STUDENT DECLARATION
Type of Award Doctor of Philosophy (PhD)
School Lancashire School of Business & Enterprise
1. Concurrent registration for two or more academic awards
I declare that while registered as a candidate for the research degree, I have
not been a registered candidate or enrolled student for another award of the
University or other academic or professional institution
2. Material Submitted for another award
I declare that no material contained in the thesis has been used in any other
submission for an academic award and is solely my own work.
Signature of Candidate: _____________
Type of Award: Doctor of Philosophy
School: Lancashire School of Business and Enterprise (LSBE)

iii
ABSTRACT
The study aims to examine the capital structure determinants and SOA of all listed, non-financial
firms in Nigeria. The objectives are; to investigate the relationship between firms’ characteristics
and the capital structure choice among non-financial firms listed in the Nigerian Stock exchange,
to examine whether the financial crisis affected capital structure determinants. The study also
examines the speed of leverage adjustment (SOA) of Nigeria non-financial firms and the impact
of the financial crisis on the SOA.
The trade-off and pecking order theories are employed as the main theories to explain firms’
financing decisions in Nigeria. Other theories used are signaling, agency and market-timing
theories due to their contribution to the capital structure debate. This study used three different
types of leverage as dependent variables, which are scaled against total assets. The explanatory
variables are profitability, asset tangibility, firm size, firm growth, firm age, business risk and
liquidity. It also uses dynamic capital models to identify capital structure determinants and SOA.
The current study applied the two-step GMM system estimation.
The result shows 63% SOA for listed non-financial firms in Nigeria. SOA is also faster after the
financial crisis when compared to the pre-crisis situation. Furthermore, the study shows the impact
of the financial crisis on SOA of long-term and short-term leverage.
Firm characteristics are found to be capital structure determinants of non-financial firms in Nigeria.
Asset tangibility and firm growth are positively related with both long-term and short-term leverage
and highlight the importance of collateral in financing decisions of Nigerian non-financial firms.
Profitability shows a negative and significant relationship with short-term leverage but is positively
related with long-term leverage. Firm size and age show a negative and significant relationship with

iv
the long-term and short-term leverage. The coefficient signs of most independent variables confirm
the dominance of the pecking order theory in Nigerian firms’ financing behaviour.
This study contributes to knowledge by providing evidence of a moderate speed of adjustment
among Nigerian non-financial firms. It shows also that firm characteristics are determinants of long-
term and short-term leverage in Nigeria.

v
TABLE OF CONTENT
STUDENT DECLARATION………………………………………………………………...ii
ABSTRACT ........................................................................................................................ iii
TABLE OF CONTENTS……………...................................................................................iv
ACKNOWLEDGMENTS ..................................................................................................... v
LIST OF TABLES ..............................................................................................................vi
ABBREVIATIONS………………………………………………………………………….vii
Chapter One: Introduction................................................................................................. 1
1.1 Background of the study ................................................................................................. 1
1.2 Research Problem and Rationale ..................................................................................... 3
1.3 Research Aims and Objectives ........................................................................................ 6
1.4 Significance of the Study ................................................................................................ 6
1.5 Overview of the Methodology ......................................................................................... 8
1.6 Overview of the Research Contribution .......................................................................... 9
1.7 Nigerian Financial Market ............................................................................................ 10
1.8 Structure of the Thesis .................................................................................................. 12
Chapter Two: Theoretical Frameworks .......................................................................... 15
2.1 Introduction ................................................................................................................... 15
2.1.1 Understanding Capital Structure ................................................................................ 15
2.2. The Modigliani-Miller Theorem .................................................................................. 17
2.3 The trade-off theory ...................................................................................................... 18
2.3.1 Static Trade-off Theory .............................................................................................. 19
2.3.2 Dynamic Trade-off theory .......................................................................................... 20
2.3.3 Empirical Studies on Trade-off Theory ...................................................................... 21
2.4 The Pecking Order Theory ............................................................................................ 23
2.4.1 Modified Pecking Order ............................................................................................. 24

vi
2.4.2 Empirical Studies on the Pecking Order Theory ........................................................ 25
2.4.3 Comparing the Trade-off and the Pecking Order theory ............................................. 26
2.5 Agency Theory .............................................................................................................. 27
2.6 The Market Timing Theory ........................................................................................... 30
2.7 The Signaling Theory .................................................................................................... 31
2.8 Adjustment to Target Leverage ..................................................................................... 31
2.9 Summary ....................................................................................................................... 36
Chapter Three: Literature Review and Hypothesis Development................................. 39
3.1 Introduction ................................................................................................................... 39
3.2 Determinants of Capital Structure and SOA .................................................................. 39
3.2.1 Firm Characteristics as Determinants of Capital Structure ......................................... 39
3.3 Determinants of Capital Structure before after the Financial Crisis .............................. 54
3.4 Determinants of SOA .................................................................................................... 54
3.4.1 SOA and Degree of Indebtedness ............................................................................... 54
3.4.2 SOA and Firm Size .................................................................................................... 55
3.4.3 Industry and SOA ....................................................................................................... 56
3.4.4 Financial Crisis and SOA ........................................................................................... 56
3.5 Summary ....................................................................................................................... 60
Chapter Four: Methodology ............................................................................................. 61
4. Introduction ..................................................................................................................... 61
4.1 Research Philosophy ..................................................................................................... 61
4.1.1 Research Design ......................................................................................................... 65
4.2 Sample and Data Collection .......................................................................................... 67
4.2.1 Sample Size ................................................................................................................ 67
4.2.2 Data Collection .......................................................................................................... 68
4.3 Measurement of Variables............................................................................................. 69

vii
4.3.1 Measurement of dependent variables ......................................................................... 69
4.3.2 Measurement of Independent variables ...................................................................... 72
4.4 Justification of Book Value Measurement..................................................................... 76
4.5 Empirical procedures of data Analysis .......................................................................... 77
4.5.1. Preliminary Analysis ................................................................................................. 77
4.5.2. Multivariate Analysis ................................................................................................ 78
4.6 Further Analysis and Robustness Check ....................................................................... 84
4.6.1 Analysis Based On Degree of Indebtedness ............................................................... 84
4.6.2 Analysis Based On Firm Size ..................................................................................... 84
4.7. Summary ...................................................................................................................... 85
Chapter Five: Determinants of Capital Structure: Results and Discussions ................ 87
5.1 Introduction ................................................................................................................... 87
5.2 Descriptive Statistics ..................................................................................................... 87
5.3. Multicollinearity .......................................................................................................... 91
5.4. Multivariate Analysis ................................................................................................... 93
5.4.1 Determinants of Capital Structure .............................................................................. 94
5.4.1.1 Determinants of Capital Structure Before and After Financial Crisis. ................... 103
5.5 Further Analysis and Robustness Check ..................................................................... 110
5.5.1 Degree of Indebtedness ............................................................................................ 110
5.5.2 Firm Size .................................................................................................................. 111
5.5.3 Industry .................................................................................................................... 111
5.6 Summary ..................................................................................................................... 112
Chapter Six: Speed of Adjustment of Nigerian non-financial Firms .......................... 113
6.1 Introduction ................................................................................................................. 113
6.2 SOA of Nigerian Non-Financial Firms ........................................................................ 113
6.3 Factors Influencing SOA ............................................................................................. 115

viii
6.3.1 SOA and Degree of Indebtedness ............................................................................. 115
6.3.2 SOA and Firm Size .................................................................................................. 117
6.3.3 SOA Across Industry ............................................................................................... 118
6.4 Financial Crisis and SOA .......................................................................................... 122
6.5 Summary ..................................................................................................................... 124
Chapter Seven: Conclusion ........................................................................................... 125
7.1. Introduction ................................................................................................................ 125
7.2. Capital Structure Determinants of Non-financial firms in Nigeria. ............................ 126
7.3. SOA of Nigerian non-Financial firms ........................................................................ 128
7.4. The Study’s Implications ........................................................................................... 132
7.5. Limitations of the Study and Suggestion for Future Research .................................... 133
REFERENCES.................................................................................................................. 134
APPENDICES .................................................................................................................. 170

ix
ACKNOWLEDGMENT
I thank the almighty God for his faithfulness and infinite love, especially for the strength given
me to conclude this study. I also wish to extend my gratitude to Dr. Philip Kostov, my director
of study, whose supervision style, knowledge, experience, and time helped me through different
stages of my PhD study at UCLAN. Dr. Kostov, your encouragement and recommendation
helped me to gain teaching experience in finance, which is helpful in gaining deeper
understanding of core issues in the area of corporate finance. I would also like to show deep
appreciation to Neil Sutcliffe, my second supervisor, for patiently supporting me through
insightful comments and great attention to details. Thank you for your encouragement, which
made me, choose this PhD path after supervision of my Master’s dissertation at UCLAN.
Dr Mitchell Jonathan Larson, my research degree tutor, deserves very special thanks for his
guidance, help and encouragement throughout my study. My deepest gratitude goes also to my
line manager, Wayne Hawkins, for his immense support, and encouragement, especially for
reminding me always of the need to complete my PhD on time and for contributing financially
towards my last year’s tuition fees. I also wish to say a big thank you to all lecturers in the
accounting and finance department of the Lancashire business school for your kindness and
support. May God reward each one of you for your kindness. I also appreciate the suggestions
of my friend Dr Rami Salem and Muhammad Usman. My special appreciation goes to university
staff working in the research office, especially to Margaret Fisher. I am very grateful to my wife,
Ifeoma, and our children, Nonye, Chiamaka, Chukwuebuka and Uchechukwu, for your love,
emotional support and for being patient with me throughout my study periods. My gratitude is
extended to all who I am unable to name but have directly or indirectly contributed to the success
of this study. Thank you all for your immense support.

x
LIST OF TABLES
Table 1.1 Government Bond Vs Corporate Bond In 1st Quarter Of 2015 Pg. 11
Table 2.1 Major Contribution in Capital Structure Debate Pg. 38
Table 3.1 Summary of the Study Hypotheses on Capital Structure Determinants Pg. 58
Table 3.2 Summary of the Study Hypotheses on SOA Pg. 59
Table 4.1 Sample Selection Pg. 67
Table 4.2 Classification of firm according to Industry Pg. 69
Table 4.3 Measurement of Variables Pg. 76
Table 5.1 Descriptive Statistics of Dependent and Independent Variables Pg. 89
Table 5.2 Mean Yearly Leverage Pg. 90
Table 5.3 A Correlation Matrix Pg. 92
Table 5.3 B VIF Collinearity Test Results Pg. 93
Table 5.4 Relationship between Long-term and Short-term Leverage and firm-
level characteristics (Dynamic Model)
Pg.102
Table 5.5 Capital Structure Determinants and SOA for Over-Leveraged Firms Pg. 108
Table 5.6 Capital Structure Determinants and SOA for Under-Leveraged Firms Pg. 109
Table 6.1 SOA across Industries Pg. 121
Table 7.1 Key Findings of Capital Structure Determinants Pg. 130
Table 7.2 Key Finding of SOA Pg. 131

xi
ABBREVIATION
AR 1 First Level Autocorrelation
Astang Asset tangibility
CFO Chief Financial Officer
EBITDA Earnings before Interest Depreciation and Amortization.
GMM Generalized Moments of Method
Growth Firm growth
Interest Lending interest rates
IPO Initial Public Offering
I.I.D Independently and Identically Distributed
Listed Publicly held firms
Liquid Liquidity
Ltlev Long-term leverage
NPV Net Present Value
NSE Nigerian Stock Exchange
OLS Ordinary Least Square
Prof Profitability
RSK Risk
Stlev Short-term Leverage
Std Error Standard Error
Tax Effective Income Tax
Totlev Total leverage
VIF Variance Inflation Factor
WACC Weighted Average Cost of Capital

1
Chapter One: Introduction
1.1 Background of the study
In the corporate finance literature, the debate over the determinants of firms’ capital structure is
still on-going due to the extensiveness and indeterminate nature of firms’ debt to equity (Ozkan,
2001, Serrasqueiro and Caetano, 2015, Vo, 2017). This has made it difficult to answer the
important question raised by Myers (1984) regarding how firms choose their capital structure.
Since the irrelevancy theory of Modigliani and Miller (1958b), various capital structure theories
and empirical evidences have investigated the determinants of capital structure when the
assumption of Modigliani and Miller (1958b) are relaxed. For instance, it is suggested by the
trade-off theory that when tax advantage and other benefits of debt are traded-off against the risk
of bankruptcy (Kraus and Litzenberger, 1973), and the agency cost of debt (Jensen and Meckling,
1976), the optimal capital structure will be attained.
Nevertheless, the complexity of this debate and the theoretical inconclusiveness of the trade-off
theory was shown by adding several factors into the ‘puzzle’ (Myers, 1984). These factors include
the effect of personal taxation introduced by Miller (1977), the availability of substitutes of debt
known as the non-debt tax shield (DeAngelo and Masulis, 1980) and the problem of asymmetric
information (Myers, 1984, Baskin, 1989, Bharath et al., 2008, Nishihara and Shibata, 2017,
Myers and Majluf, 1984). On the other hand, the optimal capital structure is ignored by the
pecking order theory. This argues for a hierarchy of financing whereby a firm will first use funds
which are generated internally (retained earnings) before using debt and then equity when all
other options are exhausted (Myers and Majluf, 1984, Myers, 1984).
Apart from differences in theoretical assumptions, there is a lack of consensus among previous
studies regarding the factors that determine firms’ debt to equity choice in developing countries
2
(Abor and Biekpe, 2009, Črnigoj and Mramor, 2009, Abu Mouamer, 2011, Vo, 2017, Khémiri
and Noubbigh, 2018, Zhang et al., 2018). Črnigoj and Mramor (2009) suggest the need for further
investigation of capital structure determinants in individual developing countries, arguing that
other forces might be at work for firms in developing countries when compared to those in
developed countries.
In the case of Nigeria, there have been major changes in the business environment after the
financial liberalisation policy of 1987 and financial sector reform in 2005. These reforms
intensified the competition between commercial banks and non-financial firms in the capital
market, making it difficult for non-financial firms to issue debt finance. The result is the
accumulation of liquidity in the banking sector, leading to firms’ dependence on costly bank loans
in their financing decision. Consequently, the current study examines the capital structure
determinants and SOA for firms in Nigeria, in order to understand how the uniqueness of its
business and institutional environment, which includes its underdeveloped and illiquid capital
market, dependence on bank lending affect firms’ capital structure determinants and the SOA.
The present study investigates the determinants of capital structure and SOA over a 15-year period
to find out how the changes in the Nigerian capital market affect the capital structure decisions
and the SOA of non-financial Nigerian firms. Using this long period ensures consistent and
reliable observation, which increases the generalisability of the study result. Furthermore, this
longer time-period enables the examination of capital structure determinants and SOA before and
after the financial crisis to show the impact of the financial crisis on the debt-to-equity decisions
of Nigerian non-financial firms.

3
1.2 Research Problem and Rationale
In spite of the importance of capital structure for developing countries (Abor, 2008, Bhaduri,
2002, Köksal and Orman, 2014, Lemma and Negash, 2014, Hadi and Suryanto, 2017), firms in
emerging economies have not received sufficient attention in the capital structure research until
now (Al-Najjar and Taylor, 2008, Črnigoj and Mramor, 2009, Vo, 2017). While this is partly due
to the prevalence of political and socio-economic instabilities (Bhaduri, 2002), market
inefficiencies and institutional constraints add additional complication to the capital structure
debate in the context of developing countries (Samuel, 1996, Agarwal and Mohtadi, 2004, Abor,
2008).
Thus, earlier empirical studies focused extensively on the firm characteristics that affect firms’
capital structure among companies in the US (Castanias, 1983, Altman, 1984, Bradley et al., 1984,
Titman and Wessels, 1988b). Rajan and Zingales (1995) identified the four most researched firm-
level determinants of leverage which are, asset tangibility, profitability, growth opportunity and
firm size but limited their study to highly developed (G-7) countries. However, they accept that
if the robustness of empirical findings relating to capital structure are not tested outside the
context (developed countries) in which they are found, it will be difficult to ascertain if they are
merely spurious correlations. Similarly, Myers (2003) advocates the examination of firms’ debt-
to-equity in developing countries to better understand firms’ financing choices, especially in such
an environment where agency and information problems are severe.
Some studies in developing countries have investigated firms’ capital structure determinants
(Booth et al., 2001b, Fan et al., 2012, Nha et al., 2016, Gómez et al., 2016, Ramli et al., 2018,
Khémiri and Noubbigh, 2018) and SOA (Lemma and Negash, 2014, Zeitun et al., 2017, Munisi,
2017) without regards to variation in their institutional environment. These studies assume that

4
factors, which determine firms’ choice of finance, will be the same among these developing
countries.
However, the result obtained through investigation of capital structure decisions in individual
countries shows that the relationship between leverage and firm-level factors may be influenced by
firms’ macroeconomic environment (Samuel, 1996, Agarwal and Mohtadi, 2004). This variation in
the firms’ business environment may have contributed to contradictory evidences presented by
previous capital structure studies. For instance, with regards to tangibility and leverage, some
studies report a negative and significant relationship (Nguyen and Ramachandran, 2006, Ahmed
Sheikh and Wang, 2011) while other studies show a positive and significant association (Abor,
2008, Eldomiaty, 2008, Gwatidzo and Ojah, 2014, Ram, 2017, Zhang et al., 2018). Similarly,
regarding firm growth, some studies found a negative and significant relationship (Bassey et al.,
2014, Abor and Biekpe, 2009). Other studies in some developing economies show that firm growth
is financed mainly with debt (Delcoure, 2007, Nguyen et al., 2014, Aggarwal and Padhan, 2017,
Khan and Akhtar, 2018). Consequently, studies have suggested examination of the capital structure
of individual countries (Samuel, 1996, Agarwal and Mohtadi, 2004, Vo, 2017), which justifies the
need to re-examine capital structure determinants and SOA of Nigerian firms.
Furthermore, regarding SOA, prior literature shows the relevance of firm characteristics (Ozkan,
2001, Byoun, 2008, Clark et al., 2008, Soekarno et al., 2015, Zhou et al., 2016b, Nunes and
Serrasqueiro, 2017). However, studies show variation of SOA between developed and developing
countries. For instance, Dang et al. (2012), Antoniou et al. (2008) and Flannery and Rangan (2006),
found 30%, 32% and 34% speeds of adjustment respectively for US firms. Similarly, Antoniou et
al. (2008), show 32% SOA for UK firms and 39% for French firms. On the other hand, firms in
developing countries show higher speeds of adjustment. Ramjee and Gwatidzo (2012) reported
65.5% SOA for South African non-financial firms, while Ngugi (2008) shows SOA of 70.1 % for

5
non-financial firms in Kenya. This is higher than the SOA of 50% reported by Bhaduri (2002) for
Indian-listed companies. This variation may be due to differences in the institutional environment
(Öztekin and Flannery, 2012), varying access to the public debt market (Aybar-Arias et al., 2012)
or higher transaction costs (Dufour et al., 2018). The variation of adjustment speed, even among
developing countries, makes the examination of adjustment behaviour of Nigerian non-financial
firms interesting, to find out how their unique business environment affects their SOA.
Even within a particular country, studies have shown that economic conditions affect firms’
characteristics and adjustment behaviour (Lööf, 2004, Harrison and Widjaja, 2014, Iqbal and Kume,
2015, Zeitun et al., 2017). Cook and Tang (2010) report that firms’ adjustment is faster during
favourable economic conditions. Studies also show that firms’ borrowing capacity may be affected
by diminished lending and increased lending costs during a crisis situation (Harrison and Widjaja,
2014, Zeitun et al., 2017). Thus, this study examines how the 2008 financial crisis affect capital
structure determinants and SOA using data from listed non-financial firms in Nigeria.
The study focuses on Nigeria due to the uniqueness of its macro-economic environment, especially
due to additional complications caused by institutional constraints and inefficiencies of the market.
On the Nigerian Stock Exchange, government bonds such as the federal government bonds, state
and local government bonds and the so-called supranational bonds issued by the African
development bank trade alongside those of non-financial firms. Furthermore, the federal
government’s forced capitalisation policy increased the competition between financial firms
(mainly commercial banks) and non-financial firms. These challenges limit the debt issuance
capacity of Nigerian non-financial firms and lead to over-reliance on costly bank lending.
Thus, owing to the uniqueness of the Nigerian business environment, especially the increasing
role of bank lending, it is important to re-examine the determinants of firms’ capital structure and
SOA in Nigeria over a long period (15years) to ensure a reliable and consistent observation.

6
Furthermore, examining the determinants of capital structure and SOA before and after the financial
crisis will show the impact of the economic state on the firms’ characteristics and the adjustment
behaviour of firms.
There are also other reasons why the investigation of capital structure determinants in Nigeria is
worthwhile. In the past few years, many Western and Asian (mainly Chinese) companies have been
investing heavily in Nigeria. Therefore, investigating the capital structure determinants and SOA of
firms in Nigeria, as a developing country, will make a specific contribution to capital structure
research.
1.3 Research Aims and Objectives
The study aims to examine the capital structure determinants and SOA of all listed, non-financial
firms in Nigeria. The objectives are; to investigate the relationship between firms’ characteristics
and the capital structure choice among non-financial firms listed in the Nigerian Stock exchange
and to examine whether the financial crisis affected capital structure determinants. The study also
examines the speed of leverage adjustment (SOA) of Nigeria non-financial firms and the impact
of financial crisis on the SOA.
1.4 Significance of the Study
The present study will add to the dynamic capital structure literature by examining target capital
structure determinants and how Nigerian non-financial firms adjust their leverage towards target.
Previous capital structure studies in Nigeria used a static model and non-representative sample
size (Salawu and Ile-Ife, 2007, Akinlo, 2011, Akinyomi and Olagunju, 2013, Adesola, 2009).
Ahmad and Etudaiye-Muhtar (2017) employed a dynamic capital structure model. However, their
study used a limited sample size (only 59 non-financial firms), a different time-period and
included country-level variables.

7
Unlike prior capital structure studies in Nigeria, the current study employed a broader sample size
(127 non- financial firms) over a 15-year period, which no previous work on capital structure
determinants in Nigeria has covered. Investigating capital structure determinants and SOA using
this long period will ensure both the reliability and the relevance of the study results and, thus,
their generalisability. This longer period was also relevant since one of the objectives of this study
is to observe the capital structure determinants and SOA in two different periods, before the
financial crisis (from 2001-2007) and after the financial crisis (from 2010-2015).
Another issue is on the measurement of leverage and types of leverage used. Several empirical
studies have defined leverage based on book value (Shah et al., 2004, Anwar, 2013, Alzomaia,
2014, Bassey et al., 2014) debt market value (Faulkender and Petersen, 2006, Fan et al., 2012,
Qiu and La, 2010) or both (Bevan and Danbolt, 2002, Belkhir et al., 2016). Other studies which
have employed book leverage have either used total debt or total liabilities, or employed either
long-term or short-term debt. Few studies have used all three types of leverage as proxy for capital
structure (Abor, 2008, Psillaki and Daskalakis, 2009, Köksal and Orman, 2014). This lack of
consistency in the measurement of leverage and the type of leverage has reduced the
generalisability of previous research findings (Ahmed Sheikh and Wang, 2011). Consequently,
the current study employed short-term, long-term and total leverage which are scaled against their
book value. This is because each type of debt shows considerable differentiation in terms of
maturity, terms and contingencies of pay out, interest rate concession and the priority in the face
of bankruptcy (Berglöf and Von Thadden, 1994, Michaelas et al., 1999, Bevan and Danbolt, 2002,
Bhaduri, 2002).

8
1.5 Overview of the Methodology
The current study used the sample size of 127 listed non-financial firms for the period 2001 till 2015,
resulting in 1905 firm year observations. The rationale for using a longer period is to ensure the
reliability and the relevance of the study result and, thus, its generalisability. To achieve the study’s
objectives, the published annual reports of these Nigerian firms were used as the source of secondary
data. These annual reports are from the Osiris database, which contains the annual reports of listed
companies around the globe.
This study uses three different measures of leverage (total leverage, long-term leverage and short-
term leverage) as dependent variables. In line with prior studies, these dependent variables were
measured against the total book value of assets (Pirtea et al., 2014, Banerjee and De, 2014, Kakilli
Acaravci, 2015). In this study, 7 firm characteristics were used as independent variables to offer a
broader framework for the investigation of firms’ capital structure in Nigeria. These determinants
are firm size (SIZE), profitability (PROF), asset tangibility (ASTANG), firm growth (GWT), age
(AGE), risk (RISK) and lagged leverage (L1).
In the estimation of study result, this study uses the dynamic capital model to identify capital
structure determinants and SOA among Nigerian non-financial firms. Prior studies in Nigeria have
used different econometric techniques, specifically the ordinary least square (OLS), fixed or random
effects (Ebel Ezeoha, 2008, Salawu and Agboola, 2008, Adesola, 2009, Onaolapo and Kajola, 2010).
While the OLS technique overstates the correlation coefficient (Antoniou et al., 2008), the random
effects model is mostly inconsistent since it ignores variables that control for unobserved
heterogeneity (Aybar-Arias et al., 2012).
Unlike prior studies, this study considers OLS, fixed and random effects to be inappropriate as they
are not helpful in capturing firms’ adjustment behaviour and ignore the dynamic nature of capital
structure. Following prior studies (Clark et al., 2008, Lemmon et al., 2008, Abdeljawad et al., 2017),

9
the current study employed GMM system estimation which uses two simultaneous equations both in
the level and in the first differences. This is because, in instrumenting the first differences’ equation
and the level equation, the GMM system employs the lagged levels of endogenous variables and the
difference variables respectively (Aybar-Arias et al., 2012). Due to its use of more moment
conditions, the GMM system’s finite sample bias is reduced and its efficiency improved, even in the
presence of weak instruments. The current study also employed the two-step GMM system in its
dynamic capital structure estimation to eliminate the potential endogeneity problem. This means
that the two-step GMM ensures the robustness of study results.
1.6 Overview of the Research Contribution
This study makes a contribution to previous literature in several ways. Firstly, unlike previous capital
studies in Nigeria that used a non-representative sample size and limited time-period (Salawu and
Ile-Ife, 2007, Akinlo, 2011, Akinyomi and Olagunju, 2013, Adesola, 2009, Bassey et al., 2014,
Ahmad and Etudaiye-Muhtar, 2017), the current study examined the capital structure determinants
of listed non-financial firms over a 15-year period (1905 observations). The result shows evidence
of leverage adjustment among Nigerian non-financial firms, which helps in dispelling the apparent
consensus of leverage stability and stationarity propagated by researches based on static trade-off
models. Ahmad and Etudaiye-Muhtar (2017) also used the dynamic model ( GMM) in their
estimation. However, their study included country-level variables and covered a very limited time
period.
Secondly, using a dynamic model, this study found that firm characteristics are the determinants of
SOA among Nigerian non-financial firms. The SOA (based on total leverage) of Nigerian firms is
63%, indicating that Nigerian firms show moderate adjustment speed. This moderate speed of

10
adjustment, which is above the average result documented by studies in developed economies, may
be due to the dominance of bank lending in Nigeria since the 2005 financial market reform.
Thirdly, this study makes a significant contribution by investigating capital structure determinants
and SOA of Nigerian non-financial firms before and after the financial crisis, which no prior study
in Nigeria has done. The findings show that the speed of long-term and short-term leverage
adjustment is faster after the financial crisis and, thus, unable to support the empirical results of Ariff
et al. (2008) and Zeitun et al. (2017), who found that firms’ adjustment to target leverage is slow
after a financial crisis.
Finally, the current study found that the most important determinants of short-term and long-term
leverage among Nigerian non-financial firms is asset tangibility. Its positive and significant
relationship with the study’s dependent variables remains unchanged both in the full sample and sub-
samples. This means that Nigerian firms need tangible assets to obtain long-term debt and short-term
bank loans. The demand for tangible assets, even for short-term financing, may be because public
debt is not easily obtainable, leading to reliance of non-financial firms on loans offered by
commercial banks. Furthermore, bankruptcy laws are weak and not properly enforced in Nigeria,
resulting in the increase in lending costs and the demand for collateral for all types of debt.
1.7 Nigerian Financial Market
Previous literature has emphasised the complementary role of a well-functioning market and strong
banking sectors in the reduction of asymmetric information and transaction costs for firms
(Greenwood and Jovanovic, 1990, Song and Thakor, 2010, Singh, 2011). The Nigerian financial
market is illiquid and underdeveloped. It also experiences the dominance of commercial banks
which, according to Singh (2011), will result in the accumulation of liquidity in the banking sector.

11
This dominance of banks is intensified by the 2005 reform of the financial sector to increase the
volume of banks’ assets, encourage instruments’ diversity and ensure a healthy and competitive
financial system that supports real sector financing (Soludo, 2006). These financial sector reforms
outlined by the central bank of Nigeria in 2003, as part of a national economic empowerment and
development strategy (NEEDS), mandated banks to drastically increase their capital requirement to
N25 billion from the initial requirement of N2 billion and to ensure consolidation of their operation
through mergers and acquisitions (Hesse, 2007). This caused many commercial banks to compete
with non-financial firms in the capital market to successfully increase their capital requirement,
leaving non-financial firms with little chance of securing external finance. This further increased
the reliance on commercial banks as the major suppliers of external finance.
Furthermore, listed non-financial firms are having difficulty in obtaining debt finance due to the
large amount of government bonds (Federal government, state and local government) and the so-
called supranational bonds issued by supranational organisations, such as the African development
bank, that are traded through the NSE.
Table 1.1: Government Bonds vs Corporate Bonds in the 1st Quarter of 2015
Category Market Capitalisation (NGN)
As of Mar 31, 2015
Market Capitalisation (USD) As
of Mar 31, 2015
FGN Bonds 4,780,112,923,285 24,001,370,372
State and Municipal Bonds 540,993,942,400 2,716,378,502
Supranational Bonds 12,000,000,000 60,253,063
Corporate Bonds 188,391,500,000 945,930,408
(Source: NSE Fact sheet, 2015)

12
The table shows that, in the first quarter of 2012, the federal government bond, the state bond, the
municipal bond and the supranational bond dominate the capital market. This may make it difficult
for non-financial firms to borrow effectively from the capital market.
1.8 Structure of the Thesis
In the first chapter, the current study introduces the research background, problems and rationale of
the study (in sections 1.1 and 1.2). The study aim and objectives (section 1.3), the significance of
the study, the summary of the methodology and the overview of the research contributions (in
sections 1.4, 1.5 and 1.6) are also discussed in this chapter. The study gives a brief overview of the
Nigerian financial market in section 1.7.
The second chapter reviews the framework theories (in sections 2.2 -2.4) covering the irrelevancy
theory of Modigliani and Miller (1958a), Modigliani and Miller (1963a) in which tax advantage of
debt was recognised . It also discussed the trade-off and the pecking order theories, which are the
background theories of this study. To ensure a deeper understanding of firms’ trade-off behaviour,
the static trade-off theory, the dynamic trade-off theory and empirical studies on trade-off theory
are discussed briefly in sections 2.3.1 and 2.3.2 respectively.
Similarly, to gain an understanding of firms’ pecking order behaviour, theories of both traditional,
modified pecking order theories and empirical evidences on pecking order theories are reviewed in
section 2.4. In addition, other capital structure theories such as the agency theory, the market-timing
theory and signalling theories are included (see sections 2.5 to 2.7), owing to their contribution to
the capital structure debate and in evaluation of both trade-off and pecking order theories. This
chapter ends with a brief summary (section 2.9)
In the third chapter, the current study reviews empirical literature and develops hypotheses. It starts
with the review of empirical studies relating to the firm-level determinants of capital structure

13
(profitability, asset tangibility, firm size, firm growth, age, business risk and liquidity) in section
3.2. Empirical studies on firms’ adjustment behaviour are discussed in section 3.3 based on the
degree of indebtedness and on the firm size. The industry determinants of capital structure and the
SOA pre-and post-financial crisis are discussed in section 3.5. Literature on the impact of the
financial crisis on SOA is also reveiwed in section 3.6. The last section (3.7) is the summary of the
whole chapter.
Chapter 4 focuses on the study’s methodology and starts with the ontological and epistemological
framework that influences the study’s methodology and methods. It describes the sample size, the
data collection and measurement of variables in section 4.2, followed by the measurement method
for both dependent and independent variables (section 4.3). The justification for the choice of
measurement is provided in section 4.4. Furthermore, the empirical procedures of data analysis are
discussed in section 4.5 and cover preliminary analysis and multivariate analysis. In multivariate
analysis, various econometric techniques (OLS, fixed effect and random effect) are discussed with
the aim of justifying why the GMM system was considered the most appropriate for the purpose of
this study. In section 4.6, further analysis and a robustness check are also conducted. This is
followed by a brief summary of the entire chapter in section 4.7.
Chapter 5 focuses on analysis of determinants of capital structure. It discusses descriptive statistics
and multicollinearity issues in sections 5.2 and 5.3 followed by multivariate analysis in section 5.4.
Further analysis and a robustness check, based on the firm size and degree of indebtedness and
industry, are conducted (section 5.5), before a brief summary of the entire chapter.
Chapter 6 discusses the study findings regarding the speed of adjustment. It discusses the SOA of
Nigerian non-financial firms and factors influencing the adjustment behaviour in sections 6.2 and
6.3. The impact of the financial crisis on the SOA of long-term and short-term leverage is discussed
in section 6.4, followed by a brief summary of the entire chapter.

14
Chapter 7 summarises and concludes the entire study. It also discusses the study’s implications and
limitations in sections 7.5 and 7.6. In the last section, the suggestion for future research is also
provided.

15
Chapter Two: Theoretical Frameworks
2.1 Introduction
In this chapter, the current study reviews both theoretical and empirical studies relating to capital
structure determinants, SOA and their differences before and after the financial crisis. The chapter
is organised as follows: Section 2.2 starts with Modigliani and Miller (1958a) and Modigliani and
Miller (1963a). Sections 2.3 and 2.4 review literature on the trade-off and the pecking order theories.
To ensure a deeper understanding of firms’ trade-off behaviour, the current study reviews static and
dynamic trade-off literature.
2.1.1 Understanding Capital Structure
A firm’s capital structure shows the proportion of its debt to equity and is very important; the way
debt and equity are combined will influence the weighted average cost of capital (WACC) and
firms’ survival ability in a competitive environment (Mingfang, 2000, Chowdhury and Chowdhury,
2010). The majority of prior studies used leverage as a capital structure proxy (Drobetz and Fix,
2003a, Delcoure, 2007, Abor, 2008, Anderloni and Tanda, 2014, Handoo and Sharma, 2014). In
finance, the term leverage is used to explain a firm’s debt usage and shows the level of a firm’s debt
over its total assets. There are several benefits of leverage. Agarwal and Mohtadi (2004) and
Harrison and Widjaja (2014) argue that it is quicker to raise debt finance than equity and emphasised
that lenders are not interested in the operating activities of the business, which they finance.
Furthermore, when a firm uses debt, the firms’ after-tax earnings could be increased due to benefits
of tax shields (DeAngelo and Masulis, 1980, Anwar, 2013). Debt is a mechanism of control in the
agency theory of free cash flow (Jensen, 1986) and, most importantly, ensures shareholder’s control
of the firm. This issue of control is the major reason why debt issuance is welcomed by most firms’
current shareholders.

16
However, debt has some agency related costs which include the risk of underinvestment due to
conflict of interests (Myers, 1977) and the danger of losing a debt tax shield given other substitutes
of debt such as the non-debt tax shield (DeAngelo and Masulis, 1980, Masulis, 1983). In addition,
through leverage, firms have been encouraged to take excessive risks which have led to the
reduction of profitability (Toy et al., 1974, Cosh and Hughes, 1994).
Previous studies on firms’ financing behaviour have suggested several theories which, in one way
or the other , attempt to explain the debt ration variation among firms. These theories include
Modigliani and Miller’s theorem, the trade-off theory, the pecking order theory, the agency theory
and the signaling and the market timing theories, suggesting that not one single theory can explain
the capital structure decision of firms (Abdeljawad et al., 2017). Although each capital structure
theory is fundamentally different, some have certain assumptions, which they share with each other
to a varying degree.
In this chapter, the current study begins with Modigliani and Miller (1958a) irrelevancy theorem
which gives theoretical underpinnings to capital structure theories (Brusov et al., 2011) and then
reviews the empirical studies related to the trade-off theory and the pecking order theory. Other
capital structure theories are also discussed due to their contribution to the understanding of both
the pecking order and the trade-off theories. The section will then conclude with a brief summary
of the most relevant issues discussed in the whole chapter.

17
2.2. The Modigliani-Miller Theorem
The Modigliani and Miller (1958b) theory has gained prominence in the field of corporate finance
due to its idea of the irrelevancy of capital structure (Ahmeti and Prenaj, 2015, Ardalan, 2017, Chen,
2017). They argued that, in a frictionless world, no difference exists between debt and equity (Al-
Najjar and Taylor, 2008). This initial theory of Modigliani and Miller (1958a) which is widely
known as ‘irrelevancy theory’ outlined some restrictive assumptions which include the absence of
bankruptcy costs, transaction costs, personal taxes, asymmetric information and competitive
markets (Pagano, 2005).
The authors argue that a firm’s value will not depend on its capital structure under perfect market
conditions. This implies that the weighted average cost of capital will remain the same even after
changing a firm’s debt to equity mix, suggesting that there is no need for managers to focus on debt
or equity proportion(Ahmed Sheikh and Wang, 2011). Modigliani and Miller (1963b) reconsidered
their irrelevancy proposition and incorporated the benefit of a tax shield. With this theory,
Modigliani and Miller (1963a) suggest that firms will use more debt and less equity in their capital
structure. This shift of emphasis on debt is as a result of the benefit of a tax shield and its impact in
reducing the weighted cost of capital.
The limitations of this theory of Modigliani and Miller (1963b) are shown through the work of
Miller (1977) on personal taxation. The author argued that tax shield benefits are exaggerated, since
these will be offset by personal tax. In spite of this recognition that debt usage will maximise a
firm’s value, the theory ignores the risk of the marginal cost of debt (Brusov et al., 2011), especially
the bankruptcy cost associated with leverage (Gruber and Warner, 1977, Al-Najjar and Hussainey,
2011) which makes their theory unrealistic and valueless in the real world (Al-Najjar, 2011).
The merit of Modigliani and Miller’s (1958, 1963) theorem is that it has given theoretical
underpinning to other capital structure theories and is also seen as the first theory of capital structure
18
(Pagano, 2005). In the academic domain of finance, their contributions are well acknowledged as
the cornerstone of contemporary scientific research (Ardalan, 2017).
2.3 The trade-off theory
The trade-off theory is an attempt to relax the ‘no tax and bankruptcy cost’ assumptions of
Modigliani and Miller (1958b). Their recognition of the tax advantage of debt, after reassessing the
irrelevancy theory in their work published in 1963, suggests that debt increases the value of the
firm. The major argument of Modigliani and Miller (1963a) is that interest paid on debt financing
could be deducted from taxable earnings which increases firms’ profit. However, the authors’
inability to place limitations on the firms’ debt capacity, suggests that a firm’s value will be
maximised when its level of debt is 100%.
Although there are evidences of the tax advantage of debt (Brick and Palmon, 1992, Graham, 2000,
Kemsley and Nissim, 2002, Korteweg, 2010), this tax effect is minimal (Graham, 2000) and may
even be reduced by other potential costs (Miller, 1977, DeAngelo and Masulis, 1980, Myers, 1977,
Kim, 1982). For instance, Miller (1977) argued for the impact of personal taxes on the benefit of
tax shield and Myers (1977) raised the agency problem of ‘underinvestment’ arguing that owners
will ignore a project with a positive net present value if they notice that it will be more beneficial
to firms’ debt holders.
Furthermore, factors included are the impact of a non-debt tax shield raised by DeAngelo and
Masulis (1980), agency cost arguments (Jensen and Meckling, 1976, Barnea et al., 1980, Jensen,
1986, Morellec, 2004) and financial distress cost (Opler and Titman, 1993, Pindado and Rodrigues,
2005, Almeida and Philippon, 2007). These factors enable a better explanation of the assumed trade-
off.
It is important to observe a significant shift from ‘the tax shield vs bankruptcy’ argument seen in
Kraus and Litzenberger (1973) into a wider consideration of potential cost and benefits including

19
agency theoretical considerations which, according to Zeitun et al. (2017), are embedded in the
trade-off theoretical assumptions. For instance, Morellec (2004) recognised the agency problem
while Fama and French (2005) included agency cost between bondholders and stockholders and the
benefits of free cash flow in their explanation of the trade- off theory. Unlike the irrelevancy theory,
where no limit is placed on debt, the trade-off theory attempts to balance costs and benefits
associated with firms’ debt usage. Consequently, the theory suggests that firms will use debt until
the marginal costs of debt completely offset its marginal benefits. The theory suggests that the ideal
debt-to-equity ratio will involve identification of a trade-off point, which may be unique for each
firm.
The implication of this theory for firms is that firms will show preference for debt until a certain
point, where the danger of financial distress increases. The theory suggests that profitability, asset
tangibility and firm size will be positively related to leverage while business risk and firm growth
will show a negative relationship with leverage. Graham (2000) documents findings which show
that large, liquid, profitable firms use less debt. Another drawback of this theory is its excessive
focus on the debt tax shield (Hennessy and Whited, 2005), neglecting other forms of tax shield.
2.3.1 Static Trade-off Theory
The earlier works on the trade- off theory recognised the tax advantage of debt, but also placed an
emphasis on the bankruptcy risk, which is likely given a certain level of debt (Kraus and
Litzenberger, 1973, Leland, 1994, Leland and Toft, 1996). This version is called static trade-off
since it considers only one single period and maintains that the reduction of tax payment is the major
aim of using debt. According to the static trade-off theory, debt issuance raises the value of a firm
through smaximisation of its tax shield benefits. It also assumes that firms achieve their target debt
ratio over time (Frank and Goyal, 2007). One central theme in the static trade-off theory is the idea
of optimal leverage.

20
Owing to its idea of balancing cost and benefit of leverage, the static trade-off theory presupposes
a ‘trade-off’ tax advantage against financial distress cost and other potential costs resulting from
the debt finance option (Harris and Raviv, 1991, Graham and Harvey, 2001). Within this theory, it
is assumed that both cost and benefits of leverage will offset each other once there is optimal
leverage. This suggests that a firm which is below its optimal leverage will not improve its
performance until it moves towards the optimal leverage. The trade-off theory assumes that any
firm that has a financing need, but is, however, below its target debt ratio, is likely to borrow more
and will also adjust its debt level downwards when exceeding its target (Cotei and Farhat, 2009).
2.3.2 Dynamic Trade-off theory
Another strand of research is the dynamic trade-off model, which recognises adjustment costs
ignored in the static trade-off theory (Hennessy and Whited, 2005, Almeida and Philippon, 2007,
Abdeljawad et al., 2017). Prior literature on dynamic capital structure research overwhelmingly
suggests the idea of long-run target leverage and argues that firms make gradual adjustment towards
this target (Gaud et al., 2005, Hennessy and Whited, 2005, Haron, 2014, Yang et al., 2015).
Dynamic capital models allow firms’ deviation from the target level of leverage and attempt to
balance the advantage of achieving their leverage target with the adjustment cost towards that target
(Huang and Ritter, 2009, Öztekin, 2015, Abdeljawad et al., 2017, Zeitun et al., 2017). It also focuses
on measuring the speed of adjustment (SOA) or the extent of rebalancing the debt ratio of a firm in
the direction of a chosen target. The static model ignores this adjustment behaviour. In the dynamic
capital structure model, the firms’ debt-to-equity choice is linked to its margin of financing which
it expects in the coming period (Frank and Goyal, 2007, Castro et al., 2014, Getzmann et al., 2014,
Soekarno et al., 2015, Devos et al., 2017, Maroney et al., 2018). With its assumption of a going
concern, the dynamic capital structure model gives more attention to the actual firms’ leverage

21
behaviour (Drobetz and Wanzenried, 2006, Gwatidzo and Ojah, 2014, Maina et al., 2018) unlike in
the static trade-off model which only emphasises the tax advantage of debt. In the dynamic trade-
off theory, firms only adjust if the cost of being far from their target leverage is greater than the
actual adjustment cost(Gaud et al., 2005, Hennessy and Whited, 2005, Haron, 2014, Yang et al.,
2015) meaning that the actual leverage is driven by the net adjustment costs (Leary and Roberts,
2005).
Strebulaev (2007) found that firms deviate from optimal leverage in their dynamic capital structure
model. Zhou et al. (2016b) emphasised the transitory nature of such deviation. The idea is that a
firm that is below its optimal leverage will not improve its performance until it moves towards the
target leverage. Owing to the cost of adjustment towards the optimum leverage, some studies have
considered the possibility of partial adjustment (Leary and Roberts, 2005, Drobetz and Wanzenried,
2006).
2.3.3 Empirical Studies on Trade-off Theory
The trade-off theory has enjoyed the support of many empirical studies on firms’ choices of
financing. Miglo (2010) compared the trade-off theory and pecking order theory and found that
many capital structure determinants (apart from profitability) are better explained by the trade-off
theory. Graham and Harvey (2001) investigated the existence of optimal leverage among US firms
and found that the majority of chief financial officers (CFOs) maintain a target leverage ratio.
Furthermore, Bancel and Mittoo (2004) document evidence that most companies in the UK,
Netherlands and Germany set target debt ratios. Belkhir et al. (2016) , using a sample of 444 listed
firms covering the period 2003-2011, found that firms in MENA countries use target leverage ratios
and adjust these target ratios over time.
Despite the practicability of the trade-off theory, many empirical studies have identified various
problems with its conclusions and argue that the trade-off theory is unable to offer an explanation

22
as to the actual behaviour of firms (Hovakimian et al., 2011, Robb and Robinson, 2012, Mac an
Bhaird and Lucey, 2010). For instance, Hovakimian et al. (2011) observed that highly profitable
firms use less debt relative to less profitable firms since they have less need of external finance.
This means that their profitability will lead to more equity issuance instead of debt. This is contrary
to the proposition of the trade-off theory, which suggests that more debt will lead to increased
profitability. Also, Graham (2000) found evidence of debt conservatism among profitable large and
liquid firms. Similarly, Robb and Robinson (2012) document evidence which shows that companies
in their early years of operation use more debt.
Myers (1993) argues that this strong negative association between profitability and leverage is the
most obvious evidence against the trade-off theory. It is important to point out that these studies
were carried out among developed countries, which makes it necessary to investigate the validity
of the trade-off theory in explaining firms’ financing behaviour in Nigeria as a developing country.
Furthermore, these limitations of trade-off theory suggest that firms’ capital structure decisions are
not completely reconcilable with one single theory (Abdeljawad et al., 2017), which also explains
why the current study will review various capital structure theories. Additionally, the trade-off
theory is also unspecific about the type of debt with which the benefit of tax shield is maximised.
Thus, this work used three types of debt to understand how each one influences the firm-level factor
among Nigerian firms since there is a need to be specific on the type of debt implied. However, in
spite of these limitations, the relevance of the trade-off theory is its practical relevance (Ahmed
Sheikh and Wang, 2011).

23
2.4 The Pecking Order Theory
Firms’ hierarchy of financing was proposed by Donaldson (1961), who argued that firms will prefer
retained earnings to externally generated funds and then prefer debt finance before equity.
Nevertheless, the trade-off theory could not explain the observed low debt ratios in many profitable
firms, despite the tax advantage of debt. Therefore, the pecking order theory, which is based on
information asymmetry and its impact on firms’ cost of financing, offers an alternative explanation
of firms’ financing behaviour (Myers, 1984, Myers and Majluf, 1984).
Unlike the trade-off theory, the pecking order theory does not recognise the idea of target debt ratio
(Frank and Goyal, 2003). Myers and Majluf (1984) and (Myers, 1984)argued that managers are
more knowledgeable about what promotes the value of the firm than less informed external
investors. To avoid the risk of underinvestment, managers will fund their new investments using a
pecking order of financing whereby internally generated funds (retained earnings) are first used,
then debt and finally equity as the last option (Mac an Bhaird and Lucey, 2010, Agliardi et al., 2016,
Bhama et al., 2016, Bhama et al., 2017, Kannadhasan et al., 2018). Myers (1984); Smith and Watts
(1992); Shyam-Sunder and Myers (1999) and Myers (2001) argue that firms will only opt for debt
or equity issuance if they have no internal source of funding or if retained earnings are not sufficient.
Due to preference of internally generated funds, firms ensure financial slack using reserves to avoid
using external financing (Myers, 1984). For Titman and Wessels (1988b), the most important capital
structure determinants should be the firms’ history of profitability.
The hierarchy of financing is related to the level of information asymmetry and their relative costs
(Newman et al., 2011, Serrasqueiro et al., 2011, Mukherjee and Mahakud, 2012, Pirtea et al., 2014,
Agliardi et al., 2016, Bhama et al., 2016, Bhama et al., 2017). Baskin (1989) highlights the
importance of asymmetric information and argued that asymmetric information is a key
consideration under the pecking order theory. The insinuation of the theory is that a firm’s cost of

24
financing is directly proportionate to its level of information asymmetry (Vasiliou et al., 2009).
Pecking order theory assumes that retained earnings have no transaction cost, unlike common stock
where the transaction cost is much higher than that of new debt.
Myers and Majluf (1984) suggest that equity should be the last option because its level of
information asymmetry is high. This is also due to the pecking order assumption that asymmetric
information will lead to mispricing of stock. Mukheijee and Mahakud (2012) argued that the
sensitivity of equity to adverse selection and mispricing contributed to its avoidance in the pecking
order theory. Myers (1977) argues that firms that are willing to maximise the interests of
shareholders will avoid equity issuance since this will lead to loss of control and wealth transfer to
new owners.
To minimise asymmetric information, the pecking order theory prefers short-term debt before long-
term debt owing to its lower level of information asymmetry. This implies that profitable firms will
not borrow in the long-term to finance their new investment. The major limitation of the pecking
order theory is its inability to offer an explanation for firms’ capital structure decisions when there
is no information asymmetry (Yang et al., 2014).
2.4.1 Modified Pecking Order
The pecking order theory, in its modified form, creates a new pecking order, which starts with
retained earnings, then equity and finally long-term debt (Chen, 2004, Fama and French, 2005,
Delcoure, 2007). In the modified pecking order, the aim is to reduce the cost of capital (see Fama
and French, 2005).
The traditional pecking order theory assumed that the information asymmetry problem accompanies
all equity issuance and will lead to an increase in issuance cost. However, the modified pecking
order theory seems to suggest that if a firm increases its value through issuing over-valued stock,

25
then there may not be need for the traditional hierarchy of financing. Fama and French (2005)
suggest that if the information asymmetry could be avoided when issuing equity it means that equity
will no longer be considered the last choice, implying a less significant role of information
asymmetry in the firms’ capital structure decision. Earlier, Fama and French (2002b) argued that
equity issuance does not necessarily imply violation of the pecking order of financing, especially
when there is a future need for external financing to implement a new project and when debt
issuance will over-stretch the firms’ debt capacity. In this case, new shares will be issued to conserve
firms’ capacity of issuing future debt.
2.4.2 Empirical Studies on the Pecking Order Theory
The pecking order theory has enjoyed the support of numerous studies since it offers a valid and
reliable explanation of the relationship between profitability and leverage (Titman and Wessels,
1988a, Harris and Raviv, 1991, Rajan and Zingales, 1995, Booth et al., 2001a, Fama and French,
2002b, Gaud et al., 2005, Degryse et al., 2009, Ahmed Sheikh and Wang, 2011). Shyam-Sunder
and Myers (1999) investigated the capital structure decisions of 157 US firms from 1971 - 1989
and found that these firms only use debt when financing their deficit. Their findings support the
pecking order theory, which predicts that firms will use their retained earnings as the first financing
option to avoid the problem of information asymmetry.
In their study of capital structure and ownership structure, Al-Najjar and Taylor (2008) found that
profitability is negatively related to leverage among Jordanian companies. The authors confirmed
the prevalence of pecking order behaviour since Jordanian firms show a preference for internally
generated funds rather than debt financing.
Akdal (2011), using data of 202 UK companies from 2002-2009, investigated how firm-level
factors are related to leverage and found that profitability, volatility and non-debt tax shield has a
negative association with leverage. Pirtea et al. (2014) investigated the financing behaviour of 2000

26
Romanian firms, from 2003-2011, and found that profitable Romanian firms rely more on their
retained earnings than on external finance since profitability shows a negative relationship with
leverage.
Ilyas (2008) studied the financing behaviour of 364 Pakistani firms from 2000 to 2005 and found
that these firms prefer retained earnings and short-term debt before equity, a support for the pecking
order theory. In their survey of 272 Turkish firms, Uyar and Guzelyurt (2015) found that Turkish
firms follow a pecking order theory and do not set a target debt ratio.
Similarly, Ahmed Sheikh and Wang (2011) examined the determinants of firms’ capital structure
in Pakistan and document evidence in support of firms’ pecking order behaviour as firms’ liquidity
and profitability increased. They reported that internal funds are used when the liquidity and
profitability situation of those firms improved and attributed this to the high cost of securing
external finance in Pakistan as a result of underdeveloped capital markets and low levels of trading.
Allini et al. (2018) studied the financial behaviour of 1270 Egyptian firms between 2003-2014 and
found that profitable Egyptian firms use more of their retained earnings and less external finance.
These firms also issue equity to make up for their financial deficit instead of debt.
2.4.3 Comparing the Trade-off and the Pecking Order theory
From the theoretical and empirical literature, the similarities and differences between both the trade-
off and the pecking order theory are observed. For instance, it could be argued that both support
firms’ use of leverage since debt finance is second in the pecking order hierarchy. However, while
the trade-off theory argues for tax shield benefit (Kraus and Litzenberger, 1973, Scott Jr, 1976,
Marsh, 1982, DeAngelo and Masulis, 1980, López-Gracia and Sogorb-Mira, 2008), the pecking
order theory aims to reduce asymmetric information using internally generated funds as the best

27
financing option of achieving this (Myers, 1984, Myers and Majluf, 1984). Both theories also differ
on their predictions of the relationship between firm characteristics and leverage.
These differences in theoretical positions and predicted relationships among firm-level
determinants makes it interesting to investigate whether one of the theories better explains the
capital structure choice of Nigerian firms. However, the aim is not to treat both theories as mutually
exclusive. This study will identify which one of them enjoys more support in Nigeria, since these
two theories are, in several respects, complementary (Cotei and Farhat, 2009, Mukherjee and
Mahakud, 2012, Serrasqueiro and Caetano, 2015) and should not be considered to be in an empirical
horse race (Fama and French, 2005), in spite of their differences (Barclay and Smith, 2005). Again,
the underlying assumptions may also cease to apply under certain circumstances.
2.5 Agency Theory
Agency theory aims to resolve the conflict of interest between the managers of firms and the owners,
or among shareholders and bondholders, (Jensen and Meckling, 1976, Fama and Jensen, 1983) and
has gained relevance in the capital structure theory (Bancel and Mittoo, 2004). Agency relationship
is a result of asymmetric information since managers are better informed than the owners. Morris
(1987) argues that if managers seek only their self-interest to the detriment of the owners, it will
lead to conflicts, an agency cost that could affect both firms’ equity and debt.
The agency cost of equity will lead to a decline in the value of firms’ stock when managers are
perceived to pursue their self-interest. This will also increase the monitoring cost to ensure that the
interest of the owners is protected. The impact of the agency relationship on the capital structure,
and the centrality of the asymmetric information in the agency theory, (which is also the underlying
assumption in the pecking order theory) make it very important to understand the implication for
both the trade-off and the pecking order theory, which are the major theories of this study.

28
Firms’ use of debt reduces the agency cost which arises as a result of conflict of interest between
shareholders, managers and providers of debt finance (Jensen, 1986) since using debt implies
agreeing to pay out cash on a specified future date. The agency costs of debt include bankruptcy
costs and costs of reorganisation, over-payment of dividends, asset substitution and
underinvestment problems and also monitoring costs (Smith and Warner, 1979). These costs are
included by the debt holders when calculating payment for debt and thus influence the managers’
(agents’) capital structure decision.
In the free cash flow theory, the use of debt is seen as beneficial to the shareholders, especially in
monitoring the opportunistic behaviour of managers to ensure they do not act against the principal’s
interest of wealth maximisation (Jensen, 1986, Simerly and Li, 2002). Furthermore, through the use
of debt, managers’ excessive consumption of perquisites, salaries and reputation are subject to
greater control (Grossman and Hart, 1982, Williams, 1987) since they are forced to concentrate on
interest repayment (Jensen, 1986). The assumptions of the free cash flow theory (Jensen, 1986)
imply that firms’ capital structure will involve a greater proportion of debt similar to that proposed
by the trade-off theory.
However, Jensen (1986) argued that, in a large firm with growth opportunities, it will be less
effective to use debt when reducing agency cost. A similar argument is used by the pecking order
theory which suggests that, due to asymmetric information, large firms will use less debt and rely
more on their retained earnings (Myers, 1984). Myers (1977) suggested that, due to the agency
problem, increasing debt ratio will cause conflict between shareholders and bondholders and lead
to ‘underinvestment’ on the part of shareholders. He argued that firms with a high leverage ratio are
likely to share a considerable percentage of their profit with bondholders and explained that such
firms ignore even projects with a positive net present value when much benefit is expected to accrue
to bondholders.

29
Leland (1998) and Mauer and Sarkar (2005) added the problem of overinvestment to the issue of
underinvestment already investigated by previous literature (Myers, 1977, Mauer and Ott, 2000,
Moyen, 2007). Mauer and Sarkar (2005) argued that both underinvestment and overinvestment
affect the optimal debt to equity mix. Nevertheless, Leland (1998) argued for a minimal impact of
the agency cost of overinvestment.
An alternative suggestion was offered by Harris and Raviv (1991), who suggested that the
managerial opportunistic behaviour could be minimised by offering managers share options as
motivation. If this option is taken, the implication on the firms’ capital structure is that there may
be a reduction in the firms’ leverage ratio if share options increased the level of the firm’s equity (
see modified pecking order, section 2.4.1) and also a reduction in the cost of capital, since such
issuance may involve a low transaction cost (Fama and French, 2005).
These different positions on the use of debt or equity to control managers’ behaviour confirm that
the agency relationship may help to determine the capital structure of a firm. The reason is that if
debt serves as a means of controlling managers (Jensen, 1986), the capital structure of the firm will
show more debt when compared to equity. In this situation, it is expected that a firm’s profitability,
asset tangibility, firm size, age and industry will be positively related to both long-term and short-
term leverage of firms, as predicted by the trade-off theory.
However, if the agency relationship results in the use of share options (Harris and Raviv, 1991) or
underinvestment (Myers, 1977), then the capital structure is likely to have more equity than debt.
Under these conditions, the relationship between leverage and most capital structure determinants
used in this study (profitability, asset tangibility, firm age and business risk) is likely to be negative.
Thus, this study reviewed the agency theoretical literature because its conclusions are employed in
favour of either the trade-off or the pecking order theory, which are the major theories of this study.

30
2.6 The Market Timing Theory
Market timing theory predicts that managers would reduce the cost of capital by timing equity
issuance when they have a higher market value when compared to their book value or past market
value (Baker and Wurgler, 2002). The market timing theory suggests that firms’ financing choice
will reflect the overall result of managers’ efforts to target the issuance of equity (Baker and
Wurgler, 2002). The authors investigated the equity market timing to explain how to benefit from
a temporary fluctuation of equity cost and found that firms issue equity under favourable market
condition, which makes equity cheaper than debt. The market timing theory suggests that the
market-to-book ratio, which is used by Rajan and Zingales (1995) in measuring growth
opportunities, will have negative correlation with leverage (Öztekin, 2015).
Some empirical studies are in support of the market timing theory (Loughran et al., 1994, Graham
and Harvey, 2001, Brau and Fawcett, 2006). Graham and Harvey (2001), report findings that firms’
executives pay more attention to the timing of equity issuance in their financing decisions. This
suggests that the observed negative correlation between profitability and debt ratio is not related to
the availability of internally generated funds, as the pecking order theory assumes, but rather due to
managers’ market timing behaviour which lowers the cost of equity when compared to debt finance.
However, Leary and Roberts (2005), report findings that firms do remain within the optimal capital
structure through rebalancing their leverage. Similarly, Mahajan and Tartaroglu (2008) found no
support for the market timing theory.

31
2.7 The Signaling Theory
The signaling theory argues that the disparity in the information level could be reduced when the
party that possesses more information signals it to the other party with less information (Ross, 1977,
Morris, 1987). Similar to the pecking order, agency and market timing theories, the basic
assumption of this theory is asymmetric information which, according to (Stiglitz, 2002), means
different parties possessing different information. The main purpose of signalling is to reduce
asymmetry, especially where the sender and receiver have access to different information (Spence,
2002, Connelly et al., 2011). Prior literature on signaling has distinguished between costly signaling
equilibrium (Spence, 1973, Ross, 1977) and costless signaling equilibrium (Brennan and Kraus,
1984). The theory assumes that firms may communicate valuable information to less informed
outsiders (investors, lenders, etc.) to bridge the information gap between managers and important
stakeholders.
From the signaling, theoretical perspective, the difference between a good firm and a bad firm is
the good firm’s ability to send a credible signal (Kirmani and Rao, 2000), which will influence the
firm’s cost of capital in the capital market. Managers are considered to be better informed than
external stakeholders. According to the signaling theory, managers will incur an opportunity loss if
they fail to use the superior information available to them to their own advantage.
The credibility of the signal depends on its inimitability by other firms who may wish to send the
same signal to reduce their cost of capital. Ross (1977) argues that debt financing could serve as a
signal to the market about the superiority of the firm. Managers may signal their creditworthiness
by using more debt. Similarly, Maçãs Nunes and Serrasqueiro (2007) argue that higher debt ratio
signals a firm’s quality and maturity to the market. This is in line with the view of trade-off theory
and implies that firms’ capital structure will involve a greater percentage of debt.

32
Conversely, Rozeff (1982) also argues that firms’ dividend policies may be used as a signal to the
market, since increased dividend payment raises the expectation of the investors concerning future
earnings, thereby reducing the cost of equity. Firms with high dividend payouts reduce their cost of
equity financing since they are able to attract investors and obtain equity finance cheaper.
2.8 Adjustment to Target Leverage
Dynamic capital structure studies support the existence of optimal debt ratio and argue that firms
which deviate from their optimum leverage will adjust their leverage upwards or downwards (Lööf,
2004, Gaud et al., 2005, Cook and Tang, 2010, Haron, 2014, Dang and Garrett, 2015, Yang et al.,
2015, Chaklader and Jaisinghani, 2017, Ling et al., 2017). Previous studies have shown that this
adjustment to target leverage is not costless (Leary and Roberts, 2005, Drobetz and Wanzenried,
2006, Lemma and Negash, 2014). Dynamic capital structure literature has identified that transaction
costs (Flannery and Rangan, 2006, Faulkender et al., 2010, Faulkender et al., 2012, Dufour et al.,
2018) and deviation costs (Hovakimian, 2004, Drobetz and Wanzenried, 2006, Uysal, 2011,
Hussain et al., 2018) influence firms’ adjustment behaviour. Transaction has a significant impact
on the adjustment speed of firms and includes monitoring, information and bargaining costs (Dufour
et al., 2018). On the other hand, a firm experiences deviation costs when its leverage has moved
away from the target. Firms are likely to show adjustment towards target leverage when the
deviation costs are higher than the transaction costs. Due to firms’ need to balance these costs,
adjustment to optimal leverage is likely to be partial (Flannery and Rangan, 2006, Tamirat et al.,
2017). On the other hand, if these adjustment costs are non-existent, the observed leverage cannot
be differentiated from the optimal leverage. Other studies applied models which show how
adjustment costs influence SOA (Leary and Roberts, 2005, Drobetz and Wanzenried, 2006, Lemma
and Negash, 2014). These studies found that firms’ adjustment behaviour will consider both the
33
benefits and costs of adjustment. This means that firms’ adjustment speed will be lower given the
higher cost of adjustment (Devos et al., 2017).
2.8.1 Firm Characteristics as Determinants of SOA
Prior studies have identified various factors that influence firms’ speed of adjustment (SOA). The
majority of these studies found that firm characteristics play a significant role in firms’ speed of
adjustment (Ozkan, 2001, Hovakimian et al., 2001, Flannery and Rangan, 2006, Byoun, 2008,
Clark et al., 2008, Soekarno et al., 2015, Zhou et al., 2016b, Nunes and Serrasqueiro, 2017). The
relevance of firm characteristics is due to the differential cost of adjustment (Dang et al., 2012)
resulting from the variation in firms’ characteristics. Consequently, studies have reported an
absence of homogeneity of SOA across firms (Ozkan, 2001, Brendea, 2014, Haron et al., 2013,
Buvanendra et al., 2017, Ling et al., 2017, Tao et al., 2017b).
Ozkan (2001) studied the adjustment behaviour of 390 UK firms and found that UK firms adjust
their leverage towards target. The author also found that firm characteristics such as size,
profitability, firm growth and liquidity are determinants of SOA.
Drobetz and Wanzenried (2006) examined the speed of adjustment of 90 Swiss firms using firm-
level variables such as firm size, asset tangibility, profitability and growth opportunities and found
firm characteristics to be determinants of SOA. Gwatidzo and Ojah (2014) examined the leverage
adjustment behaviour of 178 South African non-financial firms between 1998-2008 and found that
firm level variables determined the adjustment behaviour of South African firms in their study
sample.
This relevance of firm-level factor is due to the differential cost of adjustment resulting from the
firms’ characteristics (Dang et al., 2014). Overall, studies suggest varying leverage targets and
adjustment speed for firms, arguing that the actual adjustment speed will reflect firms’

34
characteristics (Zhou et al., 2016a, Tao et al., 2017a, Bystryakov et al., 2018) and depend on how
far away the firm is from their leverage target (Dang et al., 2014).
2.8.2 SOA and Bank Lending
Studies also suggest that the type of debt used is likely to influence the adjustment behaviour (De
Miguel and Pindado, 2001, Drobetz and Fix, 2003b, Aybar-Arias et al., 2012). The SOA reported
for countries where firms use higher public debt proportion, (Flannery and Rangan, 2006, Antoniou
et al., 2008, Dang et al., 2011, Abdeljawad et al., 2017) is lower than those reported in countries
where firms depend on bank lending (De Miguel and Pindado, 2001).
Studies among US, UK and French firms (where firms have higher access to public debt) show a
lower adjustment speed. For instance, Dang et al. (2012), Antoniou et al. (2008) and Flannery and
Rangan (2006) document evidence of 30%, 32% and 34% speeds of adjustment respectively for US
firms, which confirms the empirical findings of (Lööf, 2004). Similarly, Antoniou et al. (2008),
show a 32% SOA for UK firms and 39% for French firms. However, it is important to emphasise
that SOA may be influenced by the econometrics procedure (Huang and Ritter, 2009, Dang et al.,
2012), making it relevant to apply caution when comparing SOA.
However, studies investigating SOA in bank- dominated economies reported a very high SOA. For
instance Drobetz and Fix (2003b) and De Miguel and Pindado (2001) examined the adjustment
behaviour of Swiss and Spanish listed non-financial firms respectively and found a very high (about
80%) speed of adjustment. De Miguel and Pindado (2001) argued that this high speed of adjustment
is explained by the low level of development of the bond market in Spain and the prevalence of
bank lending. Similarly, Drobetz and Fix (2003b) suggest that their high SOA is due to the
dependence on bank lending in Switzerland.

35
2.8.3 Financial Crisis and SOA
Studies show that crisis affects firms’ speed of adjustment toward target leverage (Harrison and
Widjaja, 2014, Dang et al., 2014, Iqbal and Kume, 2015, Zeitun et al., 2017, Abdeljawad et al.,
2017). For instance, Drobetz and Wanzenried (2006) reported an increase in SOA during good
times (pre-crisis). Similarly, Dang et al. (2014)) document evidence which shows that the
adjustment speed is faster when firms have a financial deficit than when they have a surplus, since
these firms are more likely to borrow more under an unfavourable financial situation. Specifically,
for the 2008-2009 financial crisis, previous studies found that borrowing capacity was negatively
affected by diminished lending and increased lending costs during the financial crisis (Ivashina and
Scharfstein, 2010, Harrison and Widjaja, 2014, Zeitun et al., 2017, Ali and Afzal, 2012). According
to Zeitun et al. (2017), firms’ need for debt increased as a result of the financial crisis but their
ability to borrow was limited by the liquidity problem faced by banks during the crisis. Byoun
(2008) argued that firms’ financing gaps will influence their speed of adjustment to the target
leverage
Although the literature on the financial crisis in sub-Saharan Africa emphasised reduced capital
inflows during the financial crisis (Brambila‐ Macias and Massa, 2010, Allen and Giovannetti,
2011), the effect of the financial crisis on firms’ capital structure in Sub-Saharan Africa has never
been considered. The peculiar circumstances of many developing countries, such as the issue of an
illiquid capital market, suggest that the impact of the financial crisis may be significantly different
from those experienced by firms in developed countries.
Furthermore, Iqbal and Kume (2015) suggests that firms’ dependence on bank lending may affect
their level of vulnerability to global financial crises. Since Nigerian firms rely mostly on bank
lending, it is, therefore, important to re-examine the determinants of short-term and long-term
leverage pre- and post- financial crisis and the speed of adjustment of Nigerian non-financial firms.

36
2.9 Summary
This study has reviewed both theoretical and empirical literature on both the trade-off and pecking
order theories. Unlike the trade-off theory, the idea of optimal debt ratio does not exist in the pecking
order theory, since it argues that firms’ capital structure choice will reflect their cumulative attempt
towards mitigation of information asymmetry (Myers, 1984, Myers and Majluf, 1984). In the
traditional pecking order assumption, there is a clear hierarchy of finance whereby firms use
retained earnings, debt and then equity where there is no other alternative (Myers, 1984, Shyam-
Sunder and Myers, 1999, Fama and French, 2002a). This ranking is dependent on the level of
asymmetric information involved (Mukherjee and Mahakud, 2012, Serrasqueiro and Caetano,
2015). It also considers retained earnings free from asymmetric information, which justifies while
it dictates the pecking order hierarchy. However, the modified pecking order (Chen, 2004, Delcoure,
2007) argues for the alteration of firms’ financing hierarchy in favour of equity over debt when the
cost of equity is cheaper than debt. The underlying issue is asymmetric information, which is also
the main issue in the agency, market timing and signaling theories.
Furthermore, the current study included agency theory’s assumptions on the cost of debt (Jensen
and Meckling, 1976). This has led to a more balanced understanding of the trade-off theory than
the earlier version, where the risk of bankruptcy is the only identifiable cost of debt (Kraus and
Litzenberger, 1973, Scott Jr, 1976). Similarly, the signaling theory addressed the problem of
information asymmetry, and is applied in favour of both the trade-off theory (whereby debt could
be a signal of credit worthiness) and against the trade-off theory (where constancy of dividend
payment signals quality). The market timing theory (Baker and Wurgler, 2002) does not support
the idea that the observed negative relationship between leverage and profitability is as a result of
firms’ retained earnings. The theory, rather, argues that managers’ market timing of equity issuance
is responsible for the observed negative relationship (Baker and Wurgler, 2002).

37
Regarding the adjustment speed, prior literature suggest that firm characteristics are determinants
of SOA (Ozkan, 2001, Hovakimian et al., 2001, Flannery and Rangan, 2006, Byoun, 2008, Clark
et al., 2008, Soekarno et al., 2015, Zhou et al., 2016b, Nunes and Serrasqueiro, 2017) and justifies
the use of firm characteristics in this study. Prior studies also suggest that SOA will be influenced
by the type of debt (public or private debt) used by firms (De Miguel and Pindado, 2001, Drobetz
and Fix, 2003b, Aybar-Arias et al., 2012). Finally, the study considered the impact of the financial
crisis on SOA.

38
Table 2.1: Major Contribution in Capital Structure Debate
Theory/ contribition Author/year Summary of contribution
Irrelevancy Theory Modigliani and Miller (1958a) Capital structure is irrelevant in a frictionless and perfect market.
Recognition of Tax advantage of debt Modigliani and Miller (1963a) Debt offers the advantage of a tax shield and is thus preferred to equity.
Recognition of Cost of Financial distress Kraus and Litzenberger (1973) Tax advantages of debt need to be traded-off against financial distress cost.
Agency Cost Jensen and Meckling (1976) Conflict of interest between managers and owners and impact on debt and equity
‘Underinvestment’ as a type of Agency Cost Myers (1977) Firms forgo investments with positive net present value if benefits accrue to debt
holders
Effect of Personal taxes Miller (1977) The tax advantage of debt may be off-set by the higher taxes paid on dividends by
investors.
Signaling effect on the firms’ capital structure Ross (1977) Firms’ cost of capital could be reduced through signaling.
Pecking order of financing Myers and Majluf (1984) Due to information asymmetry, firms will use pecking order of finance
Cost of Adjustment in Dynamic Model Fischer et al. (1989) Optimal dynamic policy as a function of firm characteristics
Market timing theory Baker and Wurgler (2002) Firm market timing activity reduces cost of capital

39
Chapter Three: Literature Review and Hypotheses Development
3.1 Introduction
In this section, the current study will review empirical literature on the adjustment speed, the impact
of firms’ industry and the financial crisis on their financing behaviour. Most importantly, it will
review empirical studies on determinants of capital structure and developed studies’ hypotheses in
this section.
3.2 Determinants of Capital Structure and SOA
In this section, this study will discuss firm-level determinants of capital structure and develop
hypotheses.
3.2.1 Firm Characteristics as Determinants of Capital Structure
Previous literature has identified determinants of capital structure such as firm size (Rajan and
Zingales, 1995, Booth et al., 2001a), firm growth (Titman and Wessels, 1988b, Rajan and Zingales,
1995), asset tangibility (Titman and Wessels, 1988b, Harris and Raviv, 1991, Abor, 2008), age
(Gregory et al., 2005, Abor, 2008, Saarani and Shahadan, 2013), profitability (Rajan and Zingales,
1995, Fama and French, 2002b), liquidity (Anderson and Carverhill, 2007, Sharma and Paul, 2015)
and business risk (Kim and Sorensen, 1986, Bhaduri, 2002, Al-Najjar and Taylor, 2008). Thus, in
this section, empirical literature on the firm characteristics will be reviewed in line with previous
studies.
3.2.1 Profitability
The trade-off theory argued that tax deductibility of interest expense and lower default risk will
result in higher debt ratios among profitable firms when compared with those that are less profitable
(Kraus and Litzenberger, 1973, Scott Jr, 1976). Cardone Riportella and Casasola (2003) also
suggested that due to easy access to long-term finance, profitable firms would have high leverage.

40
This positive association between leverage and profitability has also been expressed by some
studies, which argue that debt is a mechanism used in disciplining managers to reduce their ability
to consume excessive perquisites (Jensen, 1986, Stulz, 1990).
On the other hand, the pecking order theory generally argues that external finance should only be
considered when there is insufficiency or unavailability of retained earnings. According to the
theory’s hierarchy of financing, retained earnings should be used first, since they are free from
asymmetric information (Myers and Majluf, 1984). This is affirmed by Murinde et al. (2004), who
found that retained earnings are the principal source of financing. Öztekin (2015) argued that the
negative sign of the profitability coefficient reported by the majority of previous capital structure
studies is as a result of its positive impact on firms’ retained earnings. Consequently, in the pecking
order theory, firms’ past history of profitability and, hence, the huge level of retained earnings is an
important capital structure determinant (Murinde et al., 2004, Titman and Wessels, 1988b, Adesola,
2009). In line with this view, Graham (2000) also reported that low debt ratio is found among large
and profitable firms. Using a dynamic model, Flannery and Hankins (2007) found that both the
adjustment benefits and costs are influenced by profitability, while Lemma and Negash (2014) show
evidence of a lower cost of rebalancing towards optimal leverage for profitable firms.
However, Barton et al. (1989) found a positive relationship between profitability and leverage.
Similarly, Petersen and Rajan (1994) found that profitability is positively related to total leverage.
Hovakimian et al. (2001) offered a contrasting opinion on this relationship and argued that
profitable firms show more preference for equity over debt finance. The authors thus argued that
the perceived inverse relationship between leverage and profitability is unrelated to the assumed
impact of firms’ retained earnings on leverage.
Empirical studies have, however, linked this low appetite for leverage among profitable firms to the
type of debt used. For instance, Hall et al. (2000) found a negative relationship between profitability

41
and short-term leverage. Nevertheless, Michaelas et al. (1999) document a positive relationship
between profitability and both long-term and short-term debt. The author argues that profitability
has more effect on long-term debt. Long and Malitz (1985) found no evidence of a relationship.
However, the overwhelming evidences in the capital structure theory show that profitable firms are
not interested in debt finance (Titman and Wessels, 1988a, Harris and Raviv, 1991, Rajan and
Zingales, 1995, Booth et al., 2001a, Fama and French, 2002b, Gaud et al., 2005, Degryse et al.,
2009, Ahmed Sheikh and Wang, 2011, Toy et al., 1974, Kester, 1986, Al‐Najjar, 2011).
In Nigeria, the illiquid capital market has led to reliance on banks as major suppliers of external
finance. Due to the cost of bank loans in Nigeria, non-financial firms will show a preference for
internally generated funds before long-term debt finance. It will also be unlikely for these firms to
consider costly short-term debt when they have an internal source of funds.
Thus, this study formulates the following propositions based on previous studies:
H1: Profitability is negatively and significantly related to total leverage.
H1a: Profitability is negatively and significantly related to short-term leverage.
H1b: Profitability is negatively and significantly related to long-term leverage.
3.2.2 Asset Tangibility
The degree of tangibility of firms’ assets will lead to a greater liquidation value (Titman and
Wessels, 1988b, Harris and Raviv, 1991) since the information gap between lenders and
shareholders and agency costs may bring about an additional requirement in a form of collateral
when securing a loan (Harris and Raviv, 1991). Myers and Majluf (1984) argue that it may be to
the advantage of firms if they sell secured debt, since certain costs linked with the issuance of
securities are better known by the managers than outside investors. Thus, using tangible assets,
whose value is known in securing the debt issued, will ensure that these costs are avoided.

42
Tangible assets are also important in overcoming the problems of information asymmetry and moral
hazards (Di Patti and Dell'Ariccia, 2004) and bridge any gap which may exist between borrowers
and lenders (Batten and Hettihewa, 1999). This is because, in a situation of bankruptcy, the market
value of tangible assets will easily be ascertained, while intangible assets may have no such value
(Antoniou et al., 2008). Consequently, firms with many tangible assets are expected to secure debt
financing under more favourable conditions and at a reduced cost (Vătavu, 2012), especially when
the specificity of the asset is reduced (Acs and Isberg, 1996, Vilasuso and Minkler, 2001, Kim,
2017).
According to Mackie Mason (1990), debt will be less costly when the value of a firm is heavily
dependent on tangible investment already made. This is because a lower risk premium will be
demanded by firms with higher tangibility due to the reduced risk of lending (Charalambakis and
Psychoyios, 2012). Furthermore, the lenders’ acceptance will sometimes not depend on how credit-
worthy the firm is, but on the asset’s underlying value which outsiders can easily determine (Berger
and Udell, 2006). It is argued that agency related costs may increase for firms with reduced
tangibility of assets since it is much more difficult for their capital to be monitored (Titman and
Wessels, 1988b).
The trade-off theory predicts that tangible assets will be positively correlated with leverage. This
means that firms with tangible assets should have higher debt-to-equity since they are able to use
their tangible assets to secure this type of external finance (Booth et al., 2001a, Ahmed Sheikh and
Wang, 2011, Belkhir et al., 2016). Mackie Mason (1990) suggested that when plants and equipment
constitute the greatest part of firms’ assets, choosing debt financing will be the most likely option.
This may be because issuance of debt secured with these assets will minimise firms’ financial
distress costs (Psillaki and Daskalakis, 2009, Öztekin, 2015).
Paulo Esperança et al. (2003) report a positive association between asset tangibility and both short-
term and long-term debt. Custódio et al. (2013), found that short-term debt is positively related to

43
asset tangibility since it needs to be constantly renegotiated. However, Nguyen and Ramachandran
(2006) documented a negative association between tangibility and total leverage and attributed this
to the higher ratio of short-term debt (short-term debt does not require collateral) in their total
leverage value.
Similarly, Al-Najjar and Hussainey (2011) document a negative and significant relationship
between tangibility and capital structure, which contradicts the trade-off theory. The authors argued
that the results represent a trade-off of both agency costs and cost of debt, since firms use debt to
control managerial opportunism.
According to Fan et al. (2012), firms in developing countries may require collateral when acquiring
short-term debt. This is due to weaker laws, corruption and the need for investors’ protection.
The modified pecking order theory (Chen, 2004, Delcoure, 2007) predicts that, when a firm has
tangible assets, debt finance may be the unlikely option, since low information asymmetry linked
with such assets will make the cost of issuing equity finance to be far lower than that of debt finance
(Harris and Raviv, 1991). According to Hall et al. (2004), Sogorb-Mira (2005) and Psillaki and
Daskalakis (2009), a negative association exists between short-term debt and asset tangibility.
Cornelli et al. (1996) report evidence showing that total leverage is negatively related to tangibility.
However, in the capital structure literature, there is overwhelming evidence of a positive
relationship between leverage and asset tangibility (Rajan and Zingales, 1995, Michaelas et al.,
1999, Booth et al., 2001a, Hall et al., 2004, Chen, 2004, Al-Najjar and Taylor, 2008). If a firm has
tangible assets, the likelihood of obtaining cheaper long-term leverage increases, thereby reducing
the option of using costlier short-term leverage.
In the case of Nigeria, public debt is not easily obtainable, leading to the reliance of non-financial
firms on loans offered by commercial banks and on lease financing. In Nigeria, bankruptcy laws
are weak and not properly enforced. Thus, lenders are likely to demand collateral for long-term debt
in order to mitigate default risks. However, there may not be a need for collateral when obtaining
44
short-term debt. Furthermore, since asset tangibility is used in increasing long-term leverage, it will
have a negative relationship with short-term leverage.
Thus, this study formulates following propositions based on previous studies:
H2: Asset tangibility is positively and significantly related to total leverage.
H2a: Asset tangibility is negatively and significantly related to short-term leverage.
H2b: Asset tangibility is positively and significantly related to long-term leverage.
3.2.3 Firm Size
Prior studies have identified firm size as a major determinant of firms’ capital choice of finance
(Titman and Wessels, 1988b, Bevan and Danbolt, 2002, Chen, 2004, Deesomsak et al., 2004, Abor
and Biekpe, 2009) since firm size directly influences the issuance cost of both firms’ equity and
debt. Larger firms are, to some extent, more diversified (Rajan and Zingales, 1995, Vătavu, 2012)
with more stable cash flow (Titman and Wessels, 1988b) and less probability of bankruptcy
(Nagano, 2003) and are less volatile in their earnings (Fama and French, 2002b). They have also
relatively lower monitoring costs (Deesomsak et al., 2004), a lower agency cost of debts and are
able to gain access to credit markets easily (Booth et al., 2001a). Thus, Diamond (1989) and Rajan
and Zingales (1995) explained that large and mature firms will have a higher reputation in the debt
market.
According to Ebel Ezeoha (2008), a firm’s size has a direct impact on how it is able to influence
different stakeholders. The author argued that the rate of interest paid by large firms, when obtaining
a bank loan from Nigerian banks, is lower. This may be due to the advantage of loan size on
interest rate concessions (Laudadio, 1963) and the higher collateral value of their tangible assets
(Salawu and Agboola, 2008, Campello and Giambona, 2010).

45
Due to their disclosure requirements, larger firms also have less information asymmetry (Myers
and Majluf, 1984) and, as a result, more attractive financial options compared to smaller firms
(Gregory et al., 2005, Ebel Ezeoha, 2008). Smaller firms, on the other hand, have less capacity for
gaining external finance (Hamilton and Fox, 1998) since they are riskier and experience downgrades
in their rating (Guedes and Opler, 1996). They are often confronted with the problem of asymmetric
information and are discriminated against when they apply for long-term loan financing (Abor and
Biekpe, 2009, Ebel Ezeoha, 2008) unlike larger firms. For instance, Paulo Esperança et al. (2003)
argue that smaller firms’ risk premium , their lack of diversification and their lower liquidity may
contribute to their preference for short-term financing. Ortiz-Molina and Penas (2008) presented a
further argument based on debt maturity and show that lenders of debt finance are sometimes not
disposed to offer loans with longer maturity to smaller firms to minimise the risk of lending. The
trade-off theory argued for a positive correlation between firm size and leverage.
However, other studies have shown evidences of negative relationships between firm size and short-
term debt and a positive association with long-term debt finance (Titman and Wessels, 1988b,
Chittenden et al., 1996, Cassar and Holmes, 2003, Abor and Biekpe, 2009, Bassey et al., 2014). The
empirical work of Michaelas et al. (1999), Chen (2004)and Hall et al. (2004) reported that firm size
is negatively related to long-term debt. Sogorb-Mira (2005) found that the size of a firm negatively
influences its ability to use long-term debt but has no significant influence on how it uses short-
term debt finance. Ebel Ezeoha (2008) found a negative relationship between leverage and firm
size. There are also a few other studies that found no significant correlation between all types of
leverage and firm size (Stohs and Mauer, 1996, Upneja and Dalbor, 2001, Tang and Jang, 2007,
Ferri and Jones, 1979, Chung, 1993).
Pecking order theory is not specific about the impact of firms’ size on their leverage decision, since
the availability of internally generated funds (which does not depend on firm size) will influence
the pecking order of finance.

46
The overwhelming evidences support a positive association between long-term leverage and firm
size (Psillaki and Daskalakis, 2009, Degryse et al., 2009, Abor and Biekpe, 2009, Ahmed Sheikh
and Wang, 2011, Abor, 2008, Al-Najjar and Hussainey, 2011, Forte et al., 2013). However,
numerous empirical studies on the importance of retained earnings in firms’ financing choice report
evidence of a negative association between the size of a firm and its leverage ratio (Fama and
French, 2002b, Drobetz and Fix, 2003a, Köksal and Orman, 2015). According to Köksal and Orman
(2015), debt finance may not be attractive to larger firms due to a lower adverse selection which
makes equity issuance more favourable. Similarly, the empirical studies of Faulkender and Petersen
(2006) found that the low level of information asymmetry among larger firms will lead to lower
debt ratios since these firms will use equity financing rather than debt.
In Nigeria, the size of a firm is positively linked to its collateral value and increases its ability to
negotiate with lenders in order to obtain more attractive long-term debt. However, due to
competition in the Nigerian bond market, Nigerian non-financial firms are more likely to issue
equity instead of short-term debt, which requires constant renegotiation.
Thus, this study formulates the following propositions in line with previous studies:
H3: Firm Size is positively and significantly related to total leverage.
H3a: Firm Size is negatively and significantly related to short-term leverage.
H3b: Firm Size is positively and significantly related to long-term leverage.
3.2.4 Firm Growth
The growth level of firms may have an impact on their capital structure choice since the financial
distress cost, free cash flow problems and the agency cost of debt may be increased by growth
(Frank and Goyal, 2009). The impact of firm growth on firms’ debt-to-equity decisions was
investigated by prior literature (Psillaki and Daskalakis, 2009, Kühnhausen and Stieber, 2014).
According to Al-Najjar and Taylor (2008), growing firms are more likely to face the agency
problem. Myers (1977) argues that firms will reject even projects with positive net present value to

47
avoid high interest payment and shows in his model how this problem of underinvestment could be
resolved with short-term debt. Also, the financial distress cost (Kraus and Litzenberger, 1973, Kim,
1978) and the expected rate of return required by the lenders tend to increase when firms are
growing, due to their need of external finance to support their growth. Thus, the trade-off theory
predicts a negative relationship between firm growth and leverage since growing firms prefer
internally generated funds. Chang and Rhee (1990) found that firms with growth opportunities
usually retain their earnings instead of paying dividends and, thus, will be in a position to finance
their projects without external finance.
However, the pecking order theory expects a positive relationship between leverage and growth.
This is because excess investment needs to bring about an increase in firms’ financing needs and
debt levels, especially when the firms’ retained earnings are not enough to meet firms’ financing
need. For instance, Hall et al. (2004) stated that internally generated funds may sometimes be
insufficient during a growth phase, and suggest that this may, therefore, push a firm into more
borrowing.
Similarly, Nguyen and Ramachandran (2006) found evidence that firm growth is positively
correlated with short-term debt, and argued that firms with high growth have much need of working
capital. This is likely to be the case in Nigeria since firms may be willing to bear the cost of long-
term debt when there is an opportunity for a lucrative project, especially when their internal source
of funding is insufficient. However, short-term debt may lose its appeal for managers of growing
Nigerian firms, especially due to the high level of interest required by lenders (mainly commercial
banks). Thus, this study formulates following propositions in line with previous studies:
H4: Firm Growth is positively and significantly related to total leverage.
H4a: Firm Growth is positively and significantly related to Short-term leverage.
H4b: Firm Growth is negatively and significantly related to long-term leverage.

48
3.2.5 Age
The age of a firm will increase its ability to secure external finance (Diamond, 1989, Gwatidzo and
Ojah, 2009). This is because a firm establishes itself in its sector depending on the number of years
it has operated successfully. Diamond (1989) argues that the good image established by a firm over
a long term will be considered during their lending decision.
Furthermore, a firm’s age helps in obtaining a loan since the business shows itself as an on-going
business (Gregory et al., 2005, Abor, 2008, Saarani and Shahadan, 2013) and signals their
transparent track record (Haas and Peeters, 2006), which helps in reducing the problem of
information asymmetry between firms and lenders. According to Sibindi (2016), older firms are
likely to generate higher profits. This implies the possibility they have a better earnings retention,
suggesting also a negative relationship between age and leverage. La Rocca et al. (2011) found that,
as a firm matures, it restructures its capital structure by substituting debt for internally generated
funds
On the other hand, gaining access to external finance may be difficult and more costly for younger
firms (Cassar, 2004). Similar arguments are used by Berger and Udell (1998) who explain that firms
use internally generated funds in their early stages of development and will increase their debt ratio
during the maturity stage. They argued that, with more maturity, firms are capable of resolving
information asymmetry problems by improving both their private and public reputation. The trade-
off theory predicts that older firms will be in a better position to attract debt finance and are, as a
result, more likely to have higher debt ratios. However, some studies suggest that the older and the
more mature a firm gets, its use of debt finance will be reduced (Hall et al., 2004, Klapper et al.,
2006, La Rocca et al., 2011). This negative relationship is expected under the pecking order theory,

49
which argues that older firms will use less debt since their previously successful years in business
may have helped them to boost their retained earnings.
Furthermore, this inverse relationship between age and leverage was found by Hussain and
Nivorozhkin (1997), who reported that new firms use more debt financing than mature firms since
the reputation of older firms in the stock market makes it easier for them to raise equity finance.
They also argue that banks sometimes prefer to lend to new firms since such firms are willing to
borrow at all costs and are not overburdened with debt. Supporting this negative relationship,
Johnsen and McMahon (2005) and Robb and Robinson (2012) also suggest that, when a firm is in
its early stages of development, using external financing is the only available option until it becomes
more self-sufficient through profit reinvestment. These studies, therefore, suggest that more
established firms will use less debt due to their ability to generate funds internally. Nevertheless,
Michaelas et al. (1999), reported that firms’ age positively affects their use of long-term debt but
has an inverse effect on their ability to use short-term debt.
However, Lemmon and Zender (2001) report findings that the age of a firm has a negative
relationship with both short-term and long-term debt finance. Also, Romano et al. (2001), report no
evidence on the relationship between leverage and firm age. Older Nigerian firms will be able to
obtain affordable long-term leverage due to their reputation with lenders. They are also likely to
show a preference for costlier short-term debt. Thus, this study formulates the following
propositions based on previous studies:
H5: Firm Age is positively and significantly related to total leverage.
H5a: Firm Age is negatively and significantly related to Short-term leverage.
H5b: Firm Age is positively and significantly related to long-term leverage.
50
3.2.6 Business risk
The debt level of a firm and the firm’s approach to riskier investment will determine its capital
structure choices (Kale et al., 1991). According to empirical findings of Bradley et al. (1984), Kim
and Sorensen (1986) and Al-Najjar and Taylor (2008), firms with a high level of business risk will
use less debt, suggesting that business risk has a negative relationship with leverage. A possible
explanation for this relationship is that debt finance is associated with regular periodic repayment
to firms’ lenders. Thus, a high debt ratio will increase the probability of default. Firms with a high
debt ratio are assumed to be in danger of financial distress (Kim and Sorensen, 1986).
Prior literature has also used earnings’ volatility as a proxy for the risk of default (Mackie Mason,
1990, Wald, 1999, Antoniou et al., 2008). Firms that are experiencing volatile returns are not likely
to have a high leverage ratio (Bhaduri, 2002). Fama and French (2002a) argue that larger firms have
lesser earnings volatility, implying that they may have a lower level of business risk.
According to Balakrishnan and Fox (1993), firms in industries with high earnings fluctuations will
use more equity. This is to avoid the risk of financial distress, since income fluctuation may mean
that firms will be unable to make a regular interest payment associated with debt finance. The
majority of the empirical evidences found that firm risk has a negative correlation with leverage
(Kim and Sorensen, 1986, Titman and Wessels, 1988b). However, Ramjee and Gwatidzo (2012)
found a positive and a highly significant relationship between risk and leverage among South
African, non-financial firms.

51
In Nigeria, the prevalence of bank distress has led to tougher lending policies, ensuring that firms
with riskier investments are not granted both short-term and long-term loans or are faced with very
high risk premiums. Thus, this study formulates following propositions in line with previous
studies:
H6: Business risk is negatively and significantly related to total leverage.
H6a: Business risk is negatively and significantly related to short-term leverage.
H6b: Business risk is negatively and significantly related to long-term leverage.
3.2.7 Liquidity
The relationship between leverage and liquidity is still contested by prior studies. According to
Ozkan (2001), the impact of firms’ liquidity on their capital structure decision may be two-fold.
Firstly, there is a possibility of a higher level of short-term leverage among firms with higher
liquidity since they aim to settle short-term obligations when due, meaning a positive correlation
between short-term leverage and a firm’s liquidity. According to Degryse et al. (2012), firms that
are illiquid may be unable to attract long-term debt finance due to a high bankruptcy risk. This also
implies a positive relationship between liquidity and long-term leverage. The trade-off theory
supports this positive relationship between liquidity leverage, since liquidity ensures a firm’s ability
to meet its contractual obligations. According to Tauringana and Clarke (2000), a firm with high
liquidity shows its ability to pay its current obligation.
On the contrary, firms’ liquidity may provide an opportunity for firms to finance their assets without
borrowing, meaning in this case that a negative relationship is expected for both types of leverage.
Lipson and Mortal (2009) found that firms’ liquidity will affect their cost of capital, making equity
issuance a better alternative when compared with debt. Based on this view, a negative and
significant relationship between long-term leverage and liquidity will be expected. Ozkan (2001)
reports a similar negative relationship between liquidity and long-term debt among UK firms, which
52
is as predicted by the pecking order theory. The assumption of the theory is that firms with an
internal source of finance will reduce their reliance on debt (Myers, 1984, Myers and Majluf, 1984,
Shyam-Sunder and Myers, 1999).
However, for short-term leverage, the pecking order theory accepts a positive relationship with
liquidity. For instance, Myers (1977) argued that short-term leverage may be used to reduce the
asymmetric information between a firm and its investors. A negative relationship between different
measures of liquidity and leverage was found by Sharma and Paul (2015). The author argued that
this negative correlation, found overwhelmingly in developed countries, may not be applicable to
developing countries due to their less sophisticated economy, higher asymmetric information, the
underdeveloped capital market and over-reliance on bank lending. This argument is not justifiable
since other studies in developing countries have also documented a negative and significant
relationship between liquidity and leverage (Deesomsak et al., 2004, Ahmed Sheikh and Wang,
2011).Due to the high cost of short-term leverage and the burden of renegotiation, it is expected
that Nigerian firms with high levels of liquidity will use less short-term leverage. Thus, this study
formulates following propositions based on previous studies:
H7: Liquidity is negatively and significantly related to total leverage.
H7a: Liquidity is negatively and significantly related to short-term leverage.
H7b: Liquidity is negatively and significantly related to long-term leverage.
53
3.3 Determinants of Capital Structure before and after the Financial Crisis
Few studies on the effect of the financial crisis on firms’ capital structure show that capital structure
determinants vary before and after the financial crisis (Akbar et al., 2013, Harrison and Widjaja,
2014, Iqbal and Kume, 2015). For instance, Zeitun et al. (2017) examined the impact of the financial
crisis on the capital structure of Gulf Corporation Council (GCC) countries and found smaller
variation in the leverage ratio after the crisis than before the crisis period . This suggests that firms
use debt sparingly after the crisis. They also reported that firms’ risk (earnings volatility) show a
significant increase (27.9%) from their pre-crisis value (17.26%) while the asset tangibility figure
jumped slightly (39.98%) from its value before the crisis (38.73%). However, they reported a very
dramatic decrease (7.12%) in firm growth from the pre-crisis value (21.45%). This shows that
capital structure determinants vary before and after the crisis.
Harrison and Widjaja (2014) examined the impact of the financial crisis on the capital structure of
US S&P companies and found the correlation coefficient of asset tangibility showed significant
increase after the financial crisis, while the profitability effect declined. Furthermore, the impact of
this financial crisis on German, French and UK firms was examined by Iqbal and Kume (2015).
They found that leverage ratios went back to their pre-crisis period immediately after the crisis and
that highly leveraged firms (before the crisis) acquired less debt after the crisis while firms with low
leverage acquired more debt.
Akbar et al. (2013) also found that the crisis affected firms’ short-term debt negatively, but had no
significant impact on the long-term debt of UK firms. Due to reduced capital inflow during the
financial crisis, capital structure determinants of Nigerian non-financial firms will vary before and
after the financial crisis. However, since short-term leverage of Nigerian non-financial firms is very
low, its determinant is unlikely to change.

54
H8: Determinants of total leverage will vary before and after the financial crisis.
H8a: Determinants of short-term leverage will vary before and after the financial crisis.
H8b: Determinants of short-term leverage will remain the same before and after the
financial crisis
3.4 Determinants of SOA
In this section, the current study reviews empirical literature on the impact of firms’ degree of
indebtedness, firm size and industry on SOA. It will also discuss the impact of the financial
crisis on SOA.
3.4.1 SOA and Degree of Indebtedness
It has also been found that the degree of a firm’s indebtedness (over-leveraged or under-
leveraged) is likely to affect SOA (Lemmon et al., 2008, Abdeljawad et al., 2017). For instance,
Abdeljawad et al. (2017) found that the SOA of over-leveraged firms is higher than that of under-
leveraged firms. Prior literature argues that higher distress probability carries with it a high cost
of deviation, which is far greater than adjustment costs and is likely to lead to faster adjustment
speed (Clark et al., 2008, Dang et al., 2014). This higher distress probability may be as a result of
higher borrowing; the agency problem between shareholders and debt holders (Jensen and
Meckling, 1976). However, Byoun (2008) argues that highly leveraged firms have less cost
efficient financial options which may affect their overall SOA. These financing costs may be
significant if these firms are financed through costly bank lending and are likely to lead to higher
adjustment.
Abdeljawad et al. (2017) recognised that under-leveraged firms also have costs to shoulder, such
as the loss of a debt tax shield. However, these costs are incomparable with those of over-
leveraged firms (Abdeljawad et al., 2017). Strebulaev and Yang (2013), having studied under-

55
leveraged firms, found that it is less costly for firms to have a low leverage ratio, which implies
that their adjustment speed will be moderate or slow. Flannery and Hankins (2007) argue that the
SOA asymmetry between over-leveraged and under-leveraged firms is due to asymmetry in the
cost of deviating from leverage targets. In spite of an over-reliance of Nigerian non-financial firms
on bank lending, the overall debt in their capital structure is low. This low level of debt will
decrease the transaction costs of over-leveraged firms, leading to a reduced speed of adjustment.
However, for under-leveraged firms, the SOA will be higher since these firms intend to close their
financing gap. Thus, this study formulates the following propositions:
H1a: SOA will be low for over-leveraged firms due to a lower cost of deviation from target
leverage.
H1b: SOA will be higher for under-leveraged firms due to a higher cost of deviation from their
target leverage.
3.4.2 SOA and Firm Size
Prior studies have also identified firm size as a major determinant of capital structure choice
(Titman and Wessels, 1988b, Bevan and Danbolt, 2002, Chen, 2004, Deesomsak et al., 2004,
Abor and Biekpe, 2009) and argue for its impact in the speed of adjustment (Flannery and
Hankins, 2007, Byoun, 2008, Castro et al., 2014). Large firms have lower issuance costs for both
debt and equity (Lemma and Negash, 2014) which may lead to a higher speed of adjustment for
large firms (Castro et al., 2014). Lemma and Negash (2014) argue that, due to minimal levels of
financial distress costs for larger firms, it will be unlikely that these firms will show any speedy
adjustment.
56
Smaller firms have less capacity of gaining external finance (Hamilton and Fox, 1998) since they
are riskier and experience downgrades in their rating (Guedes and Opler, 1996). Smaller firms are
often discriminated against when they apply for debt finance (Abor and Biekpe, 2009, Ebel Ezeoha,
2008). Thus, the low level of their tangibility and lack of diversification increases their issuance
cost for debt and equity. This implies that the financing gap of smaller firms will be greater, thus
necessitating their need for speedier adjustment towards target leverage.Based on this view, it is
expected that smaller firms will adjust both their short-term and long-term debt quickly.
Larger Nigerian firms are likely to obtain debt finance more cheaply since they are considered
too big to fail, unlike smaller firms. Thus, their size reduces the risk of default and possibility of
financial distress. This means that they may be reluctant to adjust their leverage unlike smaller
firms. Thus, this study formulates the following propositions:
H2a: SOA will be slow for large firms due to reduced benefits of adjustment.
H2b: SOA will be higher for smaller firms to enable them close their financing gap.
3.4.3 Industry and SOA
Prior literature suggests that firms’ industrial affiliation may have an impact on their capital
structure decisions (DeAngelo and Masulis, 1980, Masulis, 1983, Harris and Raviv, 1991, Frank
and Goyal, 2009, MacKay and Phillips, 2005). Frank and Goyal (2009) used industry to represent
certain omitted factors, which are similar to all firms in their study.
According to Masulis (1983), there will be a similarity of leverage ratio for firms within a particular
industry. A similar finding was reported by Roberts (2002), who documented evidence of significant
variation in the adjustment speed to target leverage across industry. These differences may be as a
result of differences in costs and benefits of adjustment in different industries. Nigerian non-financial
firms are expected to follow similar leverage targets set within their industry due to the similarity of
operation. Furthermore, Nigerian non-financial firms are likely to have similar asset structures to

57
that which is found within their industry. Since the tangibility of assets infuences the cost of bank
lending in Nigeria, the overall adjustment speed of firms that belong to a particular industry is
expected to be the same. However, this will vary across industries.
H3a: Firms adjust their leverage to industry averages
H3b: SOA varies across Nigerian Industries
3.4.4 Financial Crisis and SOA
Prior studies have shown the impact of the economic state on the adjustment behaviour of firms
(Lööf ,2003; Banerjee, 2004, Hackbart, 2006, Cook and Tang, 2010; Drobetz et al., 2015). Zeitun
et al. (2017) found that firms’ adjustment to target leverage is slow after the financial crisis when
compared to pre-crisis SOA. They argue that this may be linked to the limited supply of debt finance
immediately after the crisis. A similar result, showing a reduction in SOA during the crisis, was
found by Ariff et al. (2008), and suggests that the cost of finance may outweigh the benefit of being
within the target.
Since Nigerian firms obtain long-term debt more cheaply do not need to renegotiate this type of
debt in the short-term, the cost of speedy adjustment may likely be more than its benefits. Thus, it
is likely that Nigerian non-financial firms may be reluctant to show speedy adjustment even after
the financial crisis. However, short-term debt needs to be constantly renegotiated and is costlier,
meaning that it may be more beneficial for firms to adjust speedily in the direction of their leverage
target.
H4a: Firms adjust their long-term leverage slower after the financial crisis
H4b: Firms adjust their short-term leverage faster after the financial crisis.

58
Table 3.2: Summary of the Study Hypotheses on Capital Structure Determinants
H1 Profitability is negatively and significantly related to total leverage Pg. 40
H1a Profitability is negatively and significantly related to short-term leverage Pg. 40
H1b Profitability is negatively and significantly related to long-term leverage Pg. 40
H2 Asset tangibility is positively and significantly related to total leverage Pg. 43
H2a Asset tangibility is negatively and significantly related to short-term leverage Pg. 43
H2b Asset tangibility is positively and significantly related to long-term leverage Pg. 43
H3 Firm Size is positively and significantly related to total leverage Pg. 45
H3a Firm Size is negatively and significantly related to short-term leverage Pg. 45
H3b Firm Size is positively and significantly related to long-term leverage. Pg. 45
H4 Firm Growth is positively and significantly related to total leverage Pg. 47
H4a Firm Growth is positively and significantly related to short-term leverage Pg. 47
H4b Firm Growth is negatively and significantly related to long-term leverage Pg. 47
H5 Firm Age is positively and significantly related to total leverage Pg. 49
H5a Firm Age is negatively and significantly related to short-term leverage Pg. 49
H5b Firm Age is positively and significantly related to long-term leverage Pg. 49
H6 Business risk is negatively and significantly related to total leverage Pg. 50
H6a Business risk is negatively and significantly related to short-term leverage Pg. 50
H6b Business risk is negatively and significantly related to long-term leverage Pg. 50
H7 Liquidity is negatively and significantly related to total leverage Pg. 51
H7a Liquidity is negatively and significantly related to short-term leverage Pg. 51
H7b Liquidity is negatively and significantly related to long-term leverage Pg. 51
H8 Determinants of total leverage will vary before and after the financial
Crisis
Pg. 53
H8a Determinants of short-term leverage will vary before and after the financial
crisis.
Pg. 53
H8b Determinants of short-term leverage will remain the same before and after the
financial crisis.
Pg. 53

59
Table 3.3: Summary of the Study Hypotheses on SOA
H1a SOA will be low for over-leveraged firms due to a lower cost of deviation from
target leverage
Pg. 54
H1b SOA will be higher for under-leveraged firms due to a higher cost of deviation
from their target leverage.
Pg. 54
H2a SOA will be slow for large firms due to reduced benefits of adjustment Pg. 55
H2a SOA will be higher for smaller firms to enable them close their financing gap Pg. 55
H3a Firms adjust their leverage to industry averages Pg. 56
H3b SOA varies across Nigerian Industries Pg. 56
H4a Firms adjust their long-term leverage slower after the financial crisis Pg. 56
H4b Firms adjust their short-term leverage faster after the financial crisis Pg. 56

60
3.7. Summary
In this chapter, the study reviewed empirical literature and developed hypotheses on the
determinants of capital structure and SOA. It started with the review of literature regarding
determinants of capital structure, which are firm characteristics; profitability, asset tangibility, firm
size, firm growth, age, business risk and liquidity. The aim is to establish a relationship between
this firmlevel factor and three types of leverage (total, short-term and long-term leverage) which
are used as independent variables in this study. It also examined how the financial crisis affects the
capital structure determinants.
Furthermore, the speed of adjustment literature was reviewed, especially regarding the impact of
firms’ level of indebtedness (over-leveraged and under-leverage firms) and size on their SOA. This
is important to understand how the debt level and the size of a firm affect its adjustment behaviour.
Finally, the study discussed the impact of the financial crisis on the SOA of total long-term and
short-term leverage to determine the impact of reduced capital inflow during the 2008-2009
financial crisis on the SOA.

61
Chapter Four: Methodology
4. Introduction
In this chapter, the criteria for selection of the study sample and the methods used in this study will
be discussed in detail in line with the aim and the objectives of this research. It starts by discussing
the ontological and epistemological principles that are applied in this research since these have
influence on the choice of data andits measurement and analysis. This is organised in 4 sections:
Section 4.1 discusses the research philosophy with subsection 4.1.1 focusing on research design.
Section 4.2 discusses the sample size and data collection while section 4.3 considers the
measurement of study variables; dependent variables (subsection 4.3.1) and independent variables
(subsection 4.3.2). Data analysis and the empirical model are discussed in sections 4.5 and 4.6,
followed by the summary of the whole chapter in section 4.8.
4.1 Research Philosophy
The obscurity surrounding basic research concepts (Morse et al., 2002) has made it difficult for
researchers to understand how methodology and methods used in a particular research could be
traced to the underlying paradigm (Burrell and Morgan, 1979, Morgan, 2007, Arghode, 2012, Aliyu
et al., 2014). Thus, in social science, it is important for the researcher not only to select an
appropriate research paradigm (Burrell and Morgan, 1979, Mackenzie and Knipe, 2006) but to
understand the methodological implication (Guba and Lincoln, 1994, Morgan, 2007, Arghode,
2012, Aliyu et al., 2014).
Research in social science could be viewed from either the objectivist or the constructivist
paradigms that have divergent ontological and epistemological assumptions (Bryman, 1984,
Christians and Carey, 1989, Byrne, 2001, Angen, 2000, Hall, 2003, Furlong and Marsh, 2010).
Ontological assumptions deal with how a social phenomenon presents itself to the actors (Morgan
and Smircich, 1980, Hall, 2003, Carter and Little, 2007). The epistemology is also very important;

62
the understanding of whether the social actors construct the social reality themselves or whether
they are externally presented (Burrell and Morgan, 1979, Bryman, 1984, Hay, 2007).
Previous literature overwhelmingly argues that the underlying philosophy should be reflected in its
methodology and methods (Harding, 1987, Schwandt, 2000, Carter and Little, 2007). This means
that the ontological and epistemological basis of any research should be evident in its
methodological and methodical approach. In line with this view, Carter and Little (2007) argue for
the ‘epistemic content’ of methodology. This means that each methodology is built on a particular
epistemological tradition. This view is related to the paradigm incommensurability of Kuhn (1996)
advocated by both quantitative purists (Schrag, 1992, Maxwell and Delaney, 2004) and qualitative
purists (Leininger, 1994, Schwandt, 2000).
These divergent epistemological assumptions raise concerns regarding how a discipline defines its
own acceptable knowledge (Bell and Bryman, 2007). Most importantly, in the context of research,
the choice of a suitable methodology will depend on the phenomenon which a researcher intends to
investigate and on the philosophical paradigm chosen (Byrne, 2001, Mackenzie and Knipe, 2006,
Carter and Little, 2007). Consequently, this study will briefly introduce both the objectivist’s and
constructivist’s paradigms by highlighting their basic assumptions.
For objectivist researchers, using the natural science method ensures precision and objectivity when
analysing the social phenomenon (Bryman, 1984, Schrag, 1992, Carey, 1993, Bryman and Bell,
2003, Aliyu et al., 2014). This is called the positivist paradigm because it assumes that only one
truth exists which is independent of the researcher’s perception (Sale et al., 2002). Through the
description of reality in a manner that ensures their measurability, the positivist’s paradigm
operationalises the underlying concepts (Collis and Hussey, 2009). The positivist researchers search
for causal relationships and irregularities that present themselves in the phenomenon which is
investigated to give explanation to, or to predict the happening of, the social world.

63
The quantitative research approach is employed in the positivist’s research to test the hypothesis
(Newman and Benz, 1998). This approach uses statistical tests of the study sample (Goertz and
Mahoney, 2012) to achieve its objective since its epistemology assumes that the researcher has the
capability of investigating a social phenomenon without changing it or being changed by it (Guba
and Lincoln, 1994). Also the quantitative research approach uses a large sample size, unlike the
qualitative approach, to ensure that the study sample represents the entire population investigated
(Carey, 1993). A deductive approach is employed in a positivist study which enables the hypothesis
to be developed based on the existing literature and consequently tested with the empirical data
(Collis and Hussey, 2009). Quantitative research starts with the review of relevant theories.
Furthermore, the empirical results of such a study are generalisable to the whole population,
especially if the large sample size is randomly collected. This makes the outcome of such a
deductive study to be highly reliable so that similar results are achievable, especially when similar
methodology is employed by other studies (Collis and Hussey, 2009).
Unlike the objectivist paradigm, the claim of constructivist research is that truth is not necessarily
universal since it depends on the perspective of the individual. Constructivism depends on the
theory of social interaction in the creation of knowledge (Carter and Little, 2007). This paradigm
emphasises the important role of the subjective judgement of the researcher in the creation of
knowledge. In constructivist research, the activities of the business can only be analysed by
individuals involved since, under this paradigm, business reality is socially constructed. The
qualitative research approach is based on the constructivist approach (Guba and Lincoln, 1994).
This type of research begins with observation of reality and employs a qualitative research approach
which enables the explanation of observation and the establishment of its theoretical basis (Goertz
and Mahoney, 2012).
Constructivists’ ontology assumes that one’s construction of reality will lead to different views of
reality (Sale et al., 2002), since reality is considered relative and multiple within this paradigm

64
(Hudson and Ozanne, 1988). This makes it necessary to uncover motives, meaning and other
subjective experiences which are time and context specific (Neuman, 2002). Furthermore, based on
its concept of knowledge and how knowledge is gained , the qualitative research assumes that reality
does not exist independently of the researchers’ mind since the researcher and the object studies are
in a relationship in such a way that it facilitates the findings of the object investigated (Guba and
Lincoln, 1994).
The qualitative researcher maintains a close relationship with the participants and their realities.
This is to ensure that the dynamism and complexity of reality is appropriately uncovered (Hoepfl,
1997, Morgan and Smircich, 1980). This is also to generate a very rich (‘thick’ )description of the
phenomenon under investigation by taking into account its actual context to preserve the meaning
ascribed in the research process (Gephart, 2004).
Constructivists’ epistemology contradicts that of positivism since it emphasises the subjective
dimension of science, whereby a personal meaning is imposed on a phenomenon (Husserl, 1962).
This paradigm encourages a different science wherein scientists’ preoccupation does not involve
mere observation of reality (Morgan and Smircich, 1980). Its epistemology advocates the
interpretation of reality to understand the social world (Johnson, 1987).
These two approaches have resulted from either qualitative or quantitative research which have
different ways of collecting and analysing data (Gelo et al., 2008). Qualitative research uses a non-
numeric approach when collecting information (Berg, 2004, Babbie, 2013). The qualitative method
is capable of capturing specific behaviour and attitudes among the phenomenon investigated
(Babbie, 2013). This approach has different disadvantages which makes it inappropriate for this
research. Firstly, it often uses a small sample size that is not representative of the whole population
(Hakim, 1987) and offers a low level of transparency and reliability (Berg, 2004). Secondly, it takes
a lot of time to conduct meaningful qualitative research (Berg, 2004).

65
The quantitative approach, on the other hand, reduces the phenomenon to measurable numerical
values (Gelo et al., 2008) and employs different statistical analysis in its measurement which makes
it more reliable and generalisable. Although Newman and Benz (1998) suggest that none of the
research approaches is superior to the other, Goertz and Mahoney (2012) argue that the differences
in qualitative and quantitative methods are attributable to the difference in culture and their
compromises when establishing causal relationships between phenomena, while Sale et al. (2002)
extend these differences beyond mere methodological and philosophical differences, to include
differences in the language of description.
To understand the determinants of capital structure choice among listed firms in Nigeria,
quantitative research is deemed more appropriate because the study uses secondary data and seeks
a relationship (based on statistical analysis) between firm-level characteristics and three types of
leverage (total, long-term and short-term leverage).
4.1.1 Research Design
In its research design, this study assumed that objectivism (positivist epistemology), which involves
the application of natural science techniques, will be more relevant to the analysis of the social
phenomenon under investigation. This is because the phenomenon investigated in this study lends
itself to positivists’ research because of the assumption of positivism that reality is external to the
researcher and presents itself in an objective manner. The study investigates the partial correlations
between different firm-level variables and leverage measures (which are based on pre-existing
financial information in firms’ annual reports) to understand the capital structure choice of listed
firms in Nigeria Thus, the positivists’ paradigm will be the most suitable.
In accordance with the majority of empirical studies (Gregory et al., 2005, Abor, 2008, Saarani and
Shahadan, 2013, Bassey et al., 2014, Pirtea et al., 2014), this study adopts a positivist research
66
approach in its investigation of capital structure determinants among listed non-financial firms in
Nigeria for the following reasons:
The researcher’s view of the reality is in line with the objectivist’s ontology which argues that social
reality is not created by social actors but is external, and presents itself in an objective manner.
The researcher’s view regarding epistemology and the creation of knowledge reflects the
objectivist’s understanding.
In this study, a large sample size is used in line with positivist research. Furthermore, using the
positivists’ paradigm will ensure the operationalisation of the underlying concepts in this study
(Collis and Hussey, 2009). Thus, this study discusses how both the dependent variables and the
independent variables used in this study are measured.
Similarly to other positivists’ studies, a deductive approach will be employed in this research. This
study uses major capital structure theories, which are the trade-off theory and the pecking order
theory, and employs other supporting theories (market timing, agency and signalling theories) to
explore the relationship among the phenomena under investigation. To increase the generalisability
of the empirical results, the current study uses the entire population, excluding missing values, with
the overall aim of producing a highly reliable result that ensures generalisability and the similarity
of the research outcome when the method is replicated.

67
4.2 Sample and Data Collection
In this section, this study will discuss the sample size and data collection techniques employed.
4.2.1 Sample Size
The population of this work is made up of 139 non- financial firms listed on the Nigerian Stock
exchange (NSE) from 2000-2015. A 15-year period was adopted so as to enable reliable statistical
estimations for the relationships among the dependent and independent variables used in this
research. This period was also relevant since the third objective of this study is to observe the capital
structure determinants (for total, long-term and short-term leverage) in two different periods, before
the financial crisis (from 2001-2007) and after the financial crisis (from 2010-2015). The study
excluded 12 companies which are listed after 2001 or delisted during the period of the study.
The final sample of this study is made up of 127 non-financial firms which is about 67 % of the
total population as seen in Table 4.1. Furthermore, the firms in the sample are divided into 10 sectors
in line with Nigerian stock exchange (NSE) classifications.
Table 4.1: Sample Selection
Description Number of Companies Number of Observations
Total of non-financial
Companies
139 2085
Firms listed or delisted after
2001
12 180
Total Final Sample
127 1905

68
4.2.2 Data Collection
The secondary data used in this research was collected from the published financial statements of
all publicly listed non-financial firms that make up the sample of this study. These financial
statements were taken from the OSIRIS Database. Prior studies have chosen the annual report as
the source of secondary data since information on the past transaction of the business, which is
necessary for adequate firm-level analysis, is available (Gaud et al., 2005).
For the purpose of investigating the determinants of short-term and long-term leverage among
listed Nigerian non-financial firms, data were collected for the whole period (2001-2015). This
long period ensures adequate and reliable observation. Furthermore, two unequal periods (2001-
2007 and 2010-2015) are used in this study to investigate firms’ capital structure before and after
the financial crisis. It excluded the years 2008-2009, which are considered the peak of the crisis.
This is because, during the financial crisis, firms’ access to external finance was restricted due
to the economic downturn (Ivashina and Scharfstein, 2010, Dang et al., 2014, Harrison and
Widjaja, 2014, Iqbal and Kume, 2015). This work assumes that overlooking the impact of the
financial crisis by considering the whole period may be inappropriate.
The data collected are from firms across 10 industries, as seen in table 4.2. This diverse background
of data is very important in ensuring the validity of the study result. Prior literature (DeAngelo and
Masulis, 1980, Masulis, 1983, Harris and Raviv, 1991, Frank and Goyal, 2009) argues that firms’
industry will play a major role in their capital structure decisions.

69
Table 4.2: Classification of firms according to their Industry
Industrial Classification (NSE) Proportion Based on full Sample
1) Consumer Goods 25
2) Services 23
3) Industrial Goods 22
4) Healthcare 11
5) Oil and Gas 11
6) IT and Computer Technology 9
7) Construction and Real Estates 9
8) Conglomerates 6
9) Agriculture 6
10) Natural Resources 5
Total 127
The Nigerian Stock Exchange (NSE) classifies firms into 12 different industries.
However, this study excludes financial service and utility firms.
4.3 Measurement of Variables
In this section, the current study shows how dependent and independent variables will be measured.
4.3.1 Measurement of dependent variables
In its definition of a dependent variable, the current study employed a broader measure of short-
term and long-term and total liabilities, which is scaled against total assets in line with prior
studies (Bevan and Danbolt, 2002, Abor, 2008, Psillaki and Daskalakis, 2009, Köksal and
Orman, 2014, Degryse et al., 2012).
In Nigeria it is common to use trade credit in financing, hence the term leverage will be most
appropriate. The reason for differentiating between long-term and short-term leverage is that
each type of leverage shows considerable differentiation in terms of maturity, terms and
contingencies of pay out, interest rate concession and the priority during the situation of
bankruptcy (Berglöf and Von Thadden, 1994, Michaelas et al., 1999, Bevan and Danbolt, 2002,
Upneja and Dalbor, 2001). Bevan and Danbolt (2002) argue that the relationship between firm

70
characteristics and leverage depends on the type of leverage analysed. This study also includes
different measures of leverage as a dependent variable to examine whether the financing behaviour
of Nigerian firms is in line with the trade-off or the pecking order theory. While the pecking order
theory seems to favour short-term debt to minimise asymmetric information (Myers and Majluf,
1984, Myers, 1977), the trade-off theory prefers long-term since this type of debt is assumed to
offer a better tax shield (DeAngelo and Masulis, 1980, Harrison and Widjaja, 2014) and constancy
of interest payment (Guedes and Opler, 1996) which helps firms in gaining a tax advantage.
4.3.1.1 Total Leverage
The total leverage of a firm is the combination of long-term leverage and short-term leverage and
shows the total non-equity capital used by a firm. Rajan and Zingales (1995) argue that total leverage
is a proxy of the shareholders’ stake in the case of liquidation. In the definition of total leverage,
items such as accounts payable are included (Drobetz and Wanzenried, 2006). Several proxies have
been used for measuring total leverage by previous literature since the definition of leverage is
dependent on the kind of analysis intended (Mukherjee and Mahakud, 2012) and on the study
objective (Rajan and Zingales, 1995). In his study of the capital structure determinants among
Swedish companies, Song (2005) use total liabilities as a proxy for total leverage which is scaled
against total assets. The result showed a yearly average leverage of 80 percent with a corresponding
median value of 81%. This may be due to inclusion of other short-term liability in the measurement.
For instance, Bevan and Danbolt (2002) added trade credit to total debt, disregarding Rajan and
Zingales (1995) view of trade credit as a financing transaction which may increase firms’ leverage
ratio disproportionately. This which will be measured as the ratio of book value of total debt to the
book value of total assets, in line with the majority of empirical studies (Pandey, 2001, Bevan and
Danbolt, 2002, Ebel Ezeoha, 2008, Xu and Li, 2014, Belkhir et al., 2016).

71
4.3.1.2 Long-term Leverage
Long-term leverage represents the liabilities of a firm which are expected to be repaid over a year,
such as bank loans, debenture or other long-term obligations. They are sometimes referred to as fixed
liabilities or funded debt (Guerard Jr and Schwartz, 2007). Long-term debt is cheaper than equity
and may be advantageous when there is fluctuation in the interest rate (Brick and Palmon, 1992).
Agency literature has pointed out the possibility of firms’ unique capital structure decision as a result
of long-term debt such as agency cost considerations (Jensen and Meckling, 1976), managerial
implication of the free cash flow theory (Jensen, 1986) and underinvestment (Myers, 1977). In line
with the free cash flow theory (Jensen, 1986, Stulz, 1990), the empirical findings of D’Mello and
Miranda (2010) show that long-term debt is important in reducing firms’ abnormal capital
expenditure. Long term debt is also linked with high fixed costs (Dalbor and Upneja, 2002) and is
more sensitive to mispricing (Kale and Noe, 1990). Owing to the role of long-term debt in the trade-
off theory, examining this type of debt and statistically showing the relationship with independent
variables (firm-level determinants) will lead to a better understanding of the capital structure
decisions of Nigerian firms.
Although several measurements have been used for long-term leverage, this study will measure
long-term debt against the total asset (𝐿𝑇𝐷 𝑇𝐴⁄ ) in line with prior studies (Michaelas et al., 1999,
Pandey, 2001, Chen, 2004, Bas, 2012).
4.3.1.3 Short-term Leverage
Short-term leverage is debt that is liable for repayment within one year. This type of debt includes
accounts payable, short-term bank loans and the proportion of the long-term loan due for repayment
in the current financial year. Although short-term debt is not considered in a strict notion of capital
structure (Ahmed Sheikh and Wang, 2011, Jõeveer, 2013), it is indispensable in the financing
decision of firms in developing countries (Fan et al., 2012). Furthermore, short- term debt may be
72
preferred by firms to long-term debt because debtors are more committed to its repayment (Nunes
and Serrasqueiro, 2017), especially where future cash flows are not easily predicted (Berglöf and
Von Thadden, 1994).
In addition, firms may prefer using short-term debt since it minimises the underinvestment problem
(Myers, 1977). However, short-term debt has to be frequently arranged and may not be renegotiated,
if there is any change in firms’ circumstances. This may adversely affect the firm’s ability to carry
out its operation. When retained earnings are unavailable or insufficient, the pecking order theory
will prefer this type of finance due to lower asymmetric information and lower agency costs (Myers
and Majluf, 1984). Owing to the use of trade credit in short-term financing, this study uses the
broader term, leverage. It also measures short-term debt against total assets (𝑆𝑇𝐷 𝑇𝐴⁄ ) in line with
prior empirical studies (Pandey, 2001, Abor and Biekpe, 2009, Bas, 2012).
4.3.2 Measurement of Independent variables
It is not unlikely that various factors will influence the financing behaviour of Nigerian non-financial
firms since determinants of firms’ capital structure are very extensive and indeterminate. Prior
literature has identified firm characteristics (Artikis et al., 2007, Maheshwari, 2016, Sethi and Tiwari,
2016) and firms’ institutional environments (Öztekin and Flannery, 2012, Gwatidzo and Ojah, 2014,
Baltaci and Ayaydin, 2014).
However, since the aim is to study the capital structure of firms in a single country, examining firm
characteristics that affect firms’ capital structure in Nigeria is most appropriate. This study considers
firm level variables that are closely related to the trade-off theory and the pecking order theory, which
are considered the major theories of this study. Three of these independent variables, such as firm
size, profitability and asset tangibility, are the most frequently researched variables (Nguyen et al.,
2014). These variables have been investigated by the majority of capital structure research (Abor and
Biekpe, 2006, Heyman et al., 2008, Abor and Biekpe, 2009, Ahmed Sheikh and Wang, 2011,

73
Charalambakis and Psychoyios, 2012, Eldomiaty et al., 2014, Bassey et al., 2014, Köksal and Orman,
2015), since the empirical study of Rajan and Zingales (1995). However, this study includes other
variables that have been investigated in capital structure research, such as firm growth, age, liquidity
and business risk.
There has been controversy in the capital structure literature on the measurement of the independent
variables. While there is a consensus in the measurement of certain variables such as asset tangibility,
other explanatory variables have been measured differently for many reasons such as data
availability, accounting standards used in the country of study and issues around multicollinearity.
In this section, the study shows how the independent variables will be measured and provides
justification for the chosen measurement approach. Generally, it is important to point out that the
method used in measurement will be based on its benefit to this study and its suitability in the context
of this research.
Profitability: The prediction of different theories about the relationship between leverage and
profitability is contradictory. While the trade-off theory suggests that profitability will lead to more
borrowing, the pecking order theory argues for a negative relationship and has found more empirical
support (Rajan and Zingales, 1995, Zaheer, 2011, Črnigoj and Mramor, 2009). Qiu and La (2010)
used the ratio of EBIT to total asset market value in measuring profitability. However, due to the
unreliability of measures based on market value, studies measured profitability against book value
(Nagano, 2003, Chen, 2004, Ramlall, 2009, Handoo and Sharma, 2014). Chen (2004), for instance,
measured profitability using the ratio of earnings before interest depreciation and amortisation
(EBITDA) to total assets. This study uses the ratio of annual operating profit to total assets in
measuring profitability in line with previous empirical literature (Titman and Wessels, 1988b, Fama
and French, 2002a, Psillaki and Daskalakis, 2009, Aviral and Raveesh, 2015).

74
Asset tangibility: Various measures have been used for tangibility by previous literature. Chen
(2004) added inventories in his measurement of tangible assets. Other research used the market value
of total assets as a denominator in their measurement (Qiu and La, 2010). This study favours the
measurement in terms of assets because the larger the fixed assets to total assets ratio of a firm, the
higher the likelihood of gaining external debt finance using those tangible assets as a collateral.
However, intangible fixed assets are not considered by the current study because they are more
illiquid, more firm-specific and their values are difficult to estimate (Campello and Giambona, 2010).
Inventories are also excluded since they are short-term assets which do not qualify as collateral.
Thus, tangibility is measured as a ratio of fixed asset to total assets (𝐹𝐴 𝑇𝐴⁄ ) similar to prior studies
(Titman and Wessels, 1988b, Strýčková, 2015, Nejad and Wasiuzzaman, 2015).
Firm Size: In the measurement of firm size, the majority of previous studies use measures based on
assets (Wald, 1999, Chen, 2004, Cassar and Holmes, 2003, Akhtar, 2005). Other studies used
measures relating to sales (Brav, 2009; La Rocca et al., 2011). However, to avoid multicollinearity,
this study will not measure firm size based on assets since the independent variables (short-term and
long-term debt) used in this study are already measured in terms of total assets. Thus, firm size was
measured as the natural logarithm of sales in line with previous empirical studies (Ahmed Sheikh
and Wang, 2011, Kühnhausen and Stieber, 2014, Daszynska-Zygadlo et al., 2012, Köksal and
Orman, 2014). In this study the log of total sales was used, since natural logarithm enables the
appreciation of consistent changes over time.
Firm growth: Due to lack of consensus on how firm growth is to be measured, previous empirical
literature has used several indicators of firm growth in its measurement. In this study, firm growth is
measured as the percentage change in revenue over the study period. This enables an understanding
of how the firm has performed over these years in terms of its revenue expressed in percentage terms.
Several studies on capital structure have measured growth in terms of increase in revenue (Rajan and
Zingales, 1995, Bevan and Danbolt, 2002).

75
Firm age: Firm age was measured in line with the majority of empirical studies by counting the time
from firms’ initial registration to the end of the tax year (Michaelas et al., 1999, Abor and Biekpe,
2009, Bassey et al., 2014). This is given in years.
Business risk: Several empirical studies on capital structure have measured risk using either
earnings volatility, stock return volatility or that of operating income (Titman and Wessels, 1988b,
Deesomsak et al., 2004, Welch, 2004). The most important factor in the measurement of firms’
business risk is the extent of volatility of its income since this influences the firms’ ability to make a
prompt payment of interest charges (Ferri and Jones, 1979, Brailsford et al., 2002). In line with Wald
(1999), this study will measure business risk using the standard deviation of yearly percentage
change in firms’ operating income before payment of interest, taxes and depreciation over total
assets.
Liquidity: Prior studies use firms’ current ratio as proxy for liquidity since the ratio shows firms’
ability to meet their current obligation (Graham, 2000, Ozkan, 2001, Deesomsak et al., 2004). In line
with these studies, liquidity is measured in this study as the ratio of current assets to current liabilities.
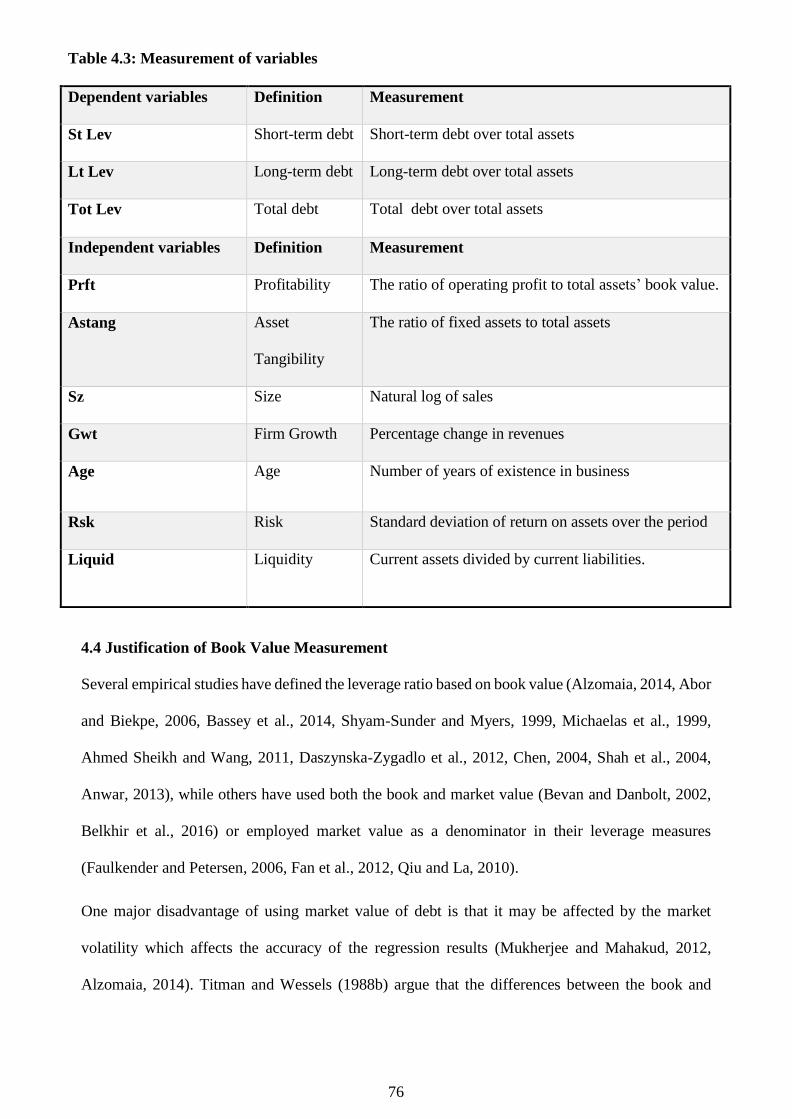
76
4.4 Justification of Book Value Measurement
Several empirical studies have defined the leverage ratio based on book value (Alzomaia, 2014, Abor
and Biekpe, 2006, Bassey et al., 2014, Shyam-Sunder and Myers, 1999, Michaelas et al., 1999,
Ahmed Sheikh and Wang, 2011, Daszynska-Zygadlo et al., 2012, Chen, 2004, Shah et al., 2004,
Anwar, 2013), while others have used both the book and market value (Bevan and Danbolt, 2002,
Belkhir et al., 2016) or employed market value as a denominator in their leverage measures
(Faulkender and Petersen, 2006, Fan et al., 2012, Qiu and La, 2010).
One major disadvantage of using market value of debt is that it may be affected by the market
volatility which affects the accuracy of the regression results (Mukherjee and Mahakud, 2012,
Alzomaia, 2014). Titman and Wessels (1988b) argue that the differences between the book and
Table 4.3: Measurement of variables
Dependent variables Definition Measurement
St Lev Short-term debt Short-term debt over total assets
Lt Lev Long-term debt Long-term debt over total assets
Tot Lev Total debt Total debt over total assets
Independent variables Definition Measurement
Prft Profitability The ratio of operating profit to total assets’ book value.
Astang Asset
Tangibility
The ratio of fixed assets to total assets
Sz Size Natural log of sales
Gwt Firm Growth Percentage change in revenues
Age Age Number of years of existence in business
Rsk Risk Standard deviation of return on assets over the period
Liquid Liquidity Current assets divided by current liabilities.

77
market value are unlikely to have any impact on the capital structure determinants. Similarly,
Bowman (1980) insists that the estimation of debt’s market value is not necessary since the difference
between those measures of debt is not large.
The major reason for using book value of debt in this research, instead of market value, is that
changes in debt market value are beyond managerial control and, thus, not a product of firms’
discretion (Mukherjee and Mahakud, 2012, Taggart, 1977, Baskin, 1989, Marsh, 1982). Ethridge
and Corbin (1996) argue that measurement based on debt book values are more reliable and have a
considerable degree of relevance for the user of financial statements.
Similarly, Myers (1977) argues that using the book value will be a more realistic option in the capital
structure measurement since it involves the asset value in place instead of capitalised future value.
Furthermore, Banerjee et al. (1999) explained that calculations of a firm’s tax shield and the debt
holder’s liability in the event of bankruptcy is based on debt book value. Thus, the current study
considered only book value in its measurement, as opposed to the market leverage, due to the
volatility of the (Nigerian) stock market as at this period.
4.5 Empirical procedures of data Analysis
This section discusses the preliminary analysis, the multivariate analysis and the robustness test
employed.
4.5.1. Preliminary Analysis
The majority of prior studies use descriptive statistics, multivariate analysis and the correlation
matrix in their preliminary data analysis. The purpose of descriptive statistics is to ensure an
appropriate summary of data.
The current study also employed the variance inflation factor (VIF) and pairwise correlation matrix
to test for multicollinearity among two or more explanatory variables with correlation coefficients
ranging from +1 (strong linear relationship) to -1 (no linear relationship). Prior studies suggest that
78
when the level of correlation among independent variables is high (above 80%), there will be a
negative impact on the regression results (Grewal et al., 2004, Gujarati and Porter, 2011).
4.5.2. Multivariate Analysis
The current study will employ the two-step GMM system in its dynamic capital structure estimation.
Autocorrelations will be tested using Arellano and Bond (1991) test of autocorrelation (AR1 and
AR2). While autocorrelation is expected in the first test (AR1), the robustness of the study result
will be determined by the absence of autocorrelation in the second test (AR2). Furthermore, this
study will test the validity of the study’s instruments using the Sargan test.
4.5.2.1 Econometric Techniques
Various econometric techniques have been employed by previous literature. This study uses GMM
as a method of estimation of capital structure determinants and the speed of adjustment among
Nigerian non-financial firms. Other econometric techniques, such as OLS regression, panel data
techniques, specifically fixed effect and the random effect, will be discussed to show why GMM is
more suitable to achieve the study’s aim.
4.5.2.1.1 OLS Regression
OLS regression has been employed by previous capital structure studies (Ozkan, 2001, Ahmed
Sheikh and Wang, 2011). However, OLS regression may not be consistent if used in the present
study due to the possibility of the correlation of the unobservable firm effect with the lagged value
of the dependent variable, 𝑦𝑡−1 (Bond, 2002). While this correlation could be avoided through first-
differencing, this still makes OLS inefficient as the change in the error term and that of the lagged
dependent variable will be correlated. Furthermore, the assumption of the OLS estimator is based
on the strict exogenous independent variables which are unlikely in the capital structure decision
(Antoniou et al., 2008). Ozkan (2001) documents strong evidence showing the upward bias of the
lagged dependent variable under OLS. The author estimation under OLS is 0.78 and is much higher
than the GMM result of 0.59.

79
4.5.2.1.2 Panel Data Econometrics
Panel data estimation is also applied by previous studies (De Miguel and Pindado, 2001, Ozkan,
2001, Maçãs Nunes and Serrasqueiro, 2007). Panel data consists of both cross sectional and time
dimensions (Hsiao, 2014, Greene, 2002). The cross-sectional data simply implies that multiple
individuals (firms) are observed at the same point in time, while the time series data enables the
observation of a single individual at many different times. Thus, using panel data allows observation
of firms at a particular period and also the study of each firm in the sample in each different year.
The importance of panel data is that it investigates causes of changes both on individual and on
cross-section observations over time. Furthermore, the panel data model increases the degree of
freedom (Gujarati, 2003b, Gaud et al., 2005, Antoniou et al., 2008, Gujarati and Porter, 2011).
According to Serrasqueiro and Nunes (2008), the advantage of panel data techniques is their
suitability for measuring those individual effects that are unobservable.
4.5.2.1.2.1 Fixed Effects
The fixed effect accounts for the heterogeneity among those firms in the study sample. In the fixed
effect regression, each company has its own intercept. The fixed effect allows the unobserved
heterogeneity (denoted by 𝛼𝑖) to be correlated with the estimator variables 𝐸(𝛼𝑖/𝑋𝑖𝑡𝑍𝑖 ) ≠ 0. The
model is generally stated as follow:
𝒀𝒊𝒕 = 𝜷𝟏𝑿𝒊𝒕 + 𝜶𝒊 + 𝒖𝒊𝒕 (eq. 1)
Where 𝛼𝑖 (I = 1…n) is used as each entities’ specific intercept (fixed effect); 𝑌𝑖𝑡 is the dependent
variable, (where i= entity and t= time); 𝑋𝑖𝑡 represents the independent variable; 𝛽1 the coefficient
of the independent variable and 𝜇𝑖𝑡 is the error term. However, the fixed effect understates the
regression coefficient (Aybar-Arias et al., 2012) and necessitates a separate endogeneity and
heteroscedasticity test.
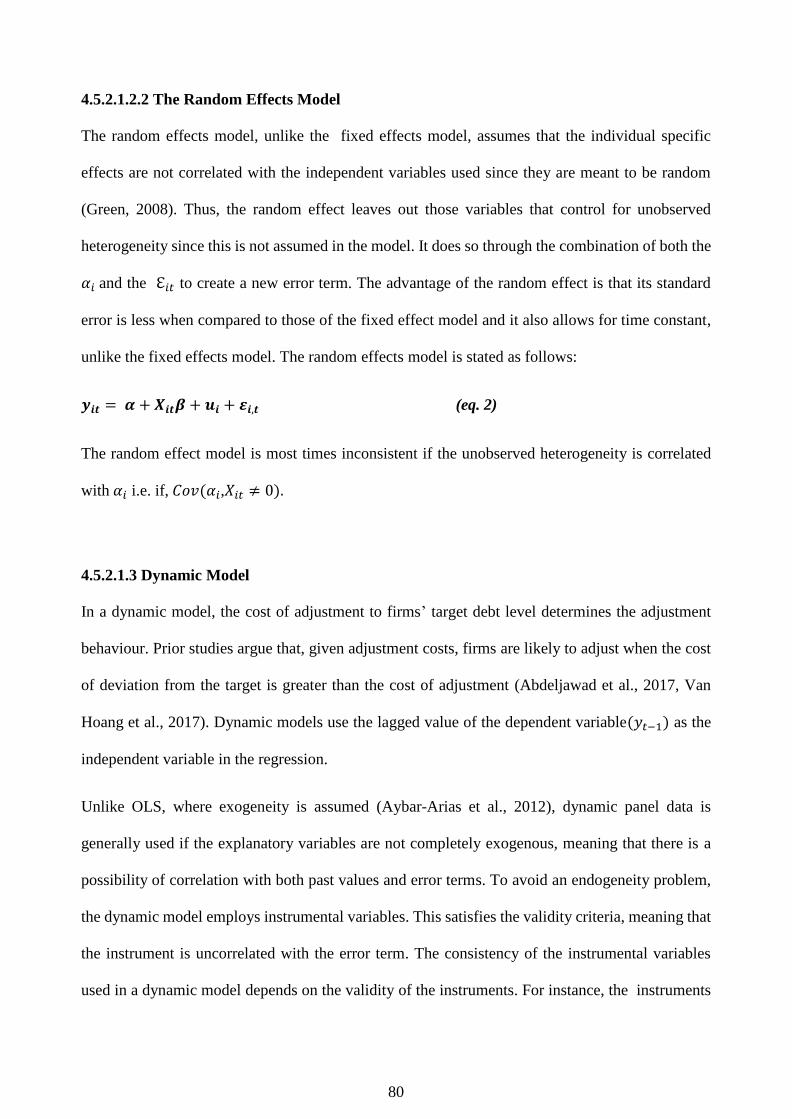
80
4.5.2.1.2.2 The Random Effects Model
The random effects model, unlike the fixed effects model, assumes that the individual specific
effects are not correlated with the independent variables used since they are meant to be random
(Green, 2008). Thus, the random effect leaves out those variables that control for unobserved
heterogeneity since this is not assumed in the model. It does so through the combination of both the
𝛼𝑖 and the ℇ𝑖𝑡 to create a new error term. The advantage of the random effect is that its standard
error is less when compared to those of the fixed effect model and it also allows for time constant,
unlike the fixed effects model. The random effects model is stated as follows:
𝒚𝒊𝒕 = 𝜶 + 𝑿𝒊𝒕𝜷 + 𝒖𝒊 + 𝜺𝒊,𝒕 (eq. 2)
The random effect model is most times inconsistent if the unobserved heterogeneity is correlated
with 𝛼𝑖 i.e. if, 𝐶𝑜𝑣(𝛼𝑖,𝑋𝑖𝑡 ≠ 0).
4.5.2.1.3 Dynamic Model
In a dynamic model, the cost of adjustment to firms’ target debt level determines the adjustment
behaviour. Prior studies argue that, given adjustment costs, firms are likely to adjust when the cost
of deviation from the target is greater than the cost of adjustment (Abdeljawad et al., 2017, Van
Hoang et al., 2017). Dynamic models use the lagged value of the dependent variable(𝑦𝑡−1) as the
independent variable in the regression.
Unlike OLS, where exogeneity is assumed (Aybar-Arias et al., 2012), dynamic panel data is
generally used if the explanatory variables are not completely exogenous, meaning that there is a
possibility of correlation with both past values and error terms. To avoid an endogeneity problem,
the dynamic model employs instrumental variables. This satisfies the validity criteria, meaning that
the instrument is uncorrelated with the error term. The consistency of the instrumental variables
used in a dynamic model depends on the validity of the instruments. For instance, the instruments

81
are weak if they have only marginal relevance (Bond, 2002). In this case, the consistency of the
estimator may still be maintained, but may approximate actual sampling distribution poorly. Thus,
it is important to identify appropriate instruments.
Hansen (1982) developed the generalised method of moments (GMM), alongside the Holtz-Eakin
et al. (1988) version of GMM which makes use of first differencing. Similarly to the GMM
estimator of Arellano and Bond (1991), it offers a better framework for ensuring asymptotically
efficiency estimation due to its ability to control for individual heterogeneity. This GMM
difference is also popular due to its ability to employ instrumental variables in mitigating
endogeneity problems and offering an advantage over the two-stage least square technique (2SLS)
of Anderson and Hsiao (1982).
However, Antoniou et al. (2008) show that the estimators of differenced GMM suffer from weak
instruments, which leads to poor finite sample properties. For instance, for subsequent first
differences given short periods, large cross-sections and the persistency of time series, the lagged-
level have higher chances of producing weak instruments (Blundell and Bond, 1998) resulting in
imprecise or even biased estimations.
The GMM systems estimator of Arellano and Bover (1995) and (Blundell and Bond, 1998), which
uses two simultaneous equations both in the level and in the first differences, was suggested as a
better estimator than that of Arellano and Bond (1991) because it instruments both first differences
equation and the level equation (Aybar-Arias et al., 2012). It employs lags of endogenous variables
and the differenced variables. Due to its use of more moment conditions, the GMM system’s finite
sample bias is reduced and its efficiency improved, even when there are weak instruments.
Consequently, many capital structure studies have employed the GMM system in their dynamic
capital structure estimation (Clark et al., 2008, Lemmon et al., 2008, Abdeljawad et al., 2017).

82
The current study employed the two-step GMM system estimator since it eliminates the potential
endogeneity problem, and is not based on conditions of normality and heteroscedasticity for its
assumptions to be fulfilled (Antoniou et al., 2008).
GMM estimators are expected to have the first order autocorrelation but the second order correlation
will violate its consistency because it shows some lags as invalid instruments. This study will report
second order autocorrelation to ensure the validity of the model. Furthermore, the model requires
an exogenous instrument to satisfy its validity criteria. This study will use the Sargan test to examine
whether the instruments are exogenous. Finally, the Wald test is used in this study to show whether
the model is suitable for the data.
The dynamic model is stated as follows:
𝒚𝒕 = 𝒇(𝒚𝒕−𝟏, 𝒙𝟏, 𝒙𝟐, . . . 𝜺𝒕 ,𝜺𝒕 ~𝑰𝑰𝑫(𝟎, 𝛔𝟐) (eq. 3)
The dynamic model is estimable on an individual level as follows.
∆𝒚𝒕 = ∅𝟎 ∆𝒙𝒕 − (𝟏 − 𝝀)[𝒚𝒕−𝟏 − 𝜶 − 𝜷𝒙𝒕−𝟏] (eq. 4)
In this equation (eq. 4), the adjustment parameter is (1-λ) and is used when measuring the
adjustment speed. 𝑥𝑡 is a random variable that is not correlated with the error term. The model
employed in this study is stated as follows:
𝒀𝒕 − 𝒀𝒕 − 𝟏 = 𝝀 (𝐘𝒕∗ − 𝒀𝒕 − 𝟏) (eq. 5)
λ is less than one but is greater than zero, (1 > λ > 0) but is expected to be one (λ =1) in a frictionless
world, when full adjustment is assumed. However, if no adjustment occurs, the λ will be equal to
zero. Prior studies argue that firms adjust slowly towards optimal leverage (Basu, 2015, Tao et al.,
2017a). Unlike in the static model, this adjustment is not immediate and requires the knowledge of
the target ratio (Y𝑡∗) which differs from the firms’ debt ratio of the current year (𝑌𝑡). The target
leverage is unobservable (Hovakimian et al., 2001, Drobetz and Wanzenried, 2006, Ramjee and

83
Gwatidzo, 2012), varies across firms and years (Abdeljawad et al., 2017) and depends on other firm
characteristics.
Depending on the target ratios, the deviation from leverage target may be either positive or negative.
If this is not the case, it will be assumed that the optimal leverage is a poor target or non-existent
giving a statistically insignificant result and a coefficient which is the same as zero. In line with the
prior studies (Shyam-Sunder and Myers, 1999, Nunes and Serrasqueiro, 2017), the current study
argues that target leverage depends on firm characteristics. Thus, the current study includes various
firm characteristics and the lagged dependent variable to determine the adjustment speed. Thus, in
examining the optimal level of short-term and long-term debt, the following model is employed;
𝐋𝐭𝐥𝐞𝐯𝐢,𝐭 = 𝝀𝐋𝐭𝐥𝐞𝐯𝐢,𝐭−𝟏 + ∑ 𝑩𝑲 𝒁𝑲,𝒊,𝒕 + 𝝁𝒊 + 𝝂𝒊,𝒕𝒏
𝑲=𝟏 (eq.6)
𝐒𝐭𝐥𝐞𝐯𝐢,𝐭 = 𝝀𝐒𝐭𝐥𝐞𝐯𝐢,𝐭−𝟏 + ∑ 𝑩𝑲 𝒁𝑲,𝒊,𝒕 + 𝝁𝒊 + 𝝂𝒊,𝒕𝒏
𝑲=𝟏 (eq. 7)
Where; Stlevi,t is the short-term leverage of firm i in period t; Ltlevi,t is the long-term debt of firm
i in period t. Stlevi,t−1 is the short-term debt of firm i in period t_1; Ltlevi,t−1 is the long-term debt
of firm i in period t_1; Stlev𝑖,𝑡∗ and Ltlev𝑖,𝑡
∗ is the respective optimal short-term and long-term debt
of firm i in period t. λ is the speed of adjustment of actual level of short and long-term debt towards
target short-term debt and long-term debt ratio. 𝑍𝐾,𝑖,𝑡 are the determinants (K) of both long-term
and short-term leverage of firm i in period t (Profitability, asset tangibility, size, firm growth, age,
business risk, liquidity), 𝜇𝑖 is the unobservable firm specific effect, while 𝜈𝑖,𝑡 represents the error
term.
The dynamic model used in this study ensures correct estimation of how long-term and short-term
leverage adjust towards target leverage. Arellano and Bond (1991) state that using the dynamic
panel model will lead to endogeneity control and elimination of collinearity between explanatory
variables. It will also ensure that problems emanating from omitted variables are avoided.

84
4.6 Further Analysis and Robustness Check
For the purpose of confirming the robustness of the study’s main result, further analysis will be
conducted based on the level of indebtedness and on the size of the firm.
4.6.1 Analysis Based On Degree of Indebtedness
Prior studies have found that the level of debt in a firm (whether a firm has high or low leverage)
may influence both the capital structure determinants and the speed of adjustment (Lemmon et al.,
2008, Abdeljawad et al., 2017). To test this assumption, the main study sample will be sub-divided
using median leverage to show firms with high leverage and those that have a low leverage level.
Each of these samples will be separately re-estimated to test the adjustment speed and the relevance
of the study’s independent variables (their significance) in explaining capital structure.
4.6.2 Analysis Based On Firm Size
The second robustness test will be based on firm size. The median value of the firms’ total assets
was used to split the whole study sample into two (larger firms and smaller firms) and the study’s
equation re-estimated. This is important since prior literature has suggested the impact of size on
firms’ capital structure choice (Titman and Wessels, 1988b, Bevan and Danbolt, 2002, Chen, 2004,
Deesomsak et al., 2004, Abor and Biekpe, 2009) and their adjustment speed to target leverage
(Byoun, 2008, Castro et al., 2014). Larger firms are assumed to be more diversified (Rajan and
Zingales, 1995), which ensures the stability of their cash flow (Titman and Wessels, 1988b), reduces
volatility of their earning (Fama and French, 2002b) and their risk of bankruptcy. Consequently,
this study tests the implication of size on both long-term and short-term leverage and the overall
adjustment process (including the SOA).
4.6.3 Analysis Based on Firms’ Industry
Prior literature suggests that firms’ industrial affiliation may have an impact on their capital
structure decision (DeAngelo and Masulis, 1980, Masulis, 1983, Harris and Raviv, 1991, Frank and

85
Goyal, 2009, MacKay and Phillips, 2005). Frank and Goyal (2009) used industry to represent
certain omitted factors which are similar to all firms in their study. This study will examine the
capital structure decision across different industries. The study sample will be divided based on
industry and the equation re-estimated to find out whether the result would be similar to the main
result in table 5.4.
4.7. Summary
The current study examines the capital structure determinants and speed of adjustment among
Nigerian non- financial firms for the period 2001 to 2015. Unlike most empirical studies, firms that
applied static framework using the observed leverage ratio as a proxy for the optimal leverage ratio
(Titman and Wessels, 1988b, Rajan and Zingales, 1995, Chittenden et al., 1996, Ahmed Sheikh and
Wang, 2011), the current study employs a dynamic model in examining whether there is a target
leverage ratio among Nigerian non-financial firms.
The dependent variable used in this study is long-term and short-term leverage, since Bevan and
Danbolt (2002) found that the relationship between leverage and firm characteristics is dependent
on the leverage component ( whether short-term or long-term leverage) analysed.
On the measurement of dependent variables, Rajan and Zingales (1995) suggest that the objective
of the analysis will determine the measures used. Consequently, both long-term and short-term
leverages were scaled against total assets in line with the majority of empirical studies (Michaelas
et al., 1999, Pandey, 2001, Chen, 2004, Bas, 2012).
Since Fischer et al. (1989) considered cost of adjustment in their dynamic leverage model, many
studies have examined the firm characteristics that affect target leverage (Ozkan, 2001, Clark et
al., 2008, Castro et al., 2014, Getzmann et al., 2014, Mangafić and Martinović, 2015, Zhou et al.,
2016b, Abdeljawad et al., 2017). Following prior studies, this study employed firm characteristics

86
(profitability asset tangibility, size, growth, age, risk and liquidity) as determinants of capital
structure.
The current study uses the book value measurement for both dependent and independent variables
in line with previous literature (Alzomaia, 2014, Abor and Biekpe, 2006, Bassey et al., 2014, Shyam-
Sunder and Myers, 1999, Michaelas et al., 1999, Ahmed Sheikh and Wang, 2011, Daszynska-
Zygadlo et al., 2012, Chen, 2004, Shah et al., 2004, Anwar, 2013). Furthermore, book value
measures are considered in this study, as opposed to the market leverage, due to the volatility of the
(Nigerian) stock market at this period, which makes it important to use more reliable measures
(book value) of debt as a result of the unavailability of market data. To avoid multicollinearity,
different measures (not based on total assets) were used for some of the study’s explanatory
variables.
The GMM system estimator of Arellano and Bover (1995) and (Blundell and Bond, 1998) is also
employed. Similarly to the study of (Ozkan, 2001), both the Wald and Sargan tests are employed in
testing the suitability of the model and the validity of the instrument respectively.

87
Chapter Five: Determinants of Capital Structure: Results and
Discussions
5.1 Introduction
Prior studies suggest that firm specific characteristics will determine firms’ target leverage (Ozkan,
2001, Castro et al., 2014, Mangafić and Martinović, 2015, Abdeljawad et al., 2017). Thus, the
current study examines firm level factors that determine long-term and short-term leverage among
listed non-financial firms in Nigeria. In this study, the distinction was made between these types of
leverage since each differs in terms of maturity, contingencies of pay out, interest rate concession
and the priority in the face of bankruptcy (Michaelas et al., 1999, Berglöf and Von Thadden, 1994).
5.2 Descriptive Statistics
In table 5.1, the current study’s total observations, the minimum, maximum, mean and the standard
deviation are presented. The current study uses the book value of the dependent variable and they
are all scaled by total assets. From the descriptive statistics, the minimum values of long-term
leverage and short-term leverage are 0.08 and 0.00 respectively, while 0.70 and 0.29 are their
respective maximum values. The standard deviation of long-term leverage (0.06) and short-
term leverage (0.05) show that both have a similar rate of dispersion. Furthermore, the mean
values of long-term and short-term leverage are 0.17 and 0.05 respectively, which implies
that long-term leverage is, on average, more than three times larger than the short-term leverage.
This may be due to the cost of short-term finance. The descriptive statistics also show that the total
number of observations used for the current study is 1905, which is large enough for the purpose of
the current study and ensures generalisability of the study findings.
With respect to the current study’s independent variables, profitability values show some level of
dispersion since they range from -0.022 to 0.19. Asset tangibility has a standard deviation of 10
with a very low (0.00) minimum value and a maximum value of 0.93. From table 5.1, i t is

88
evident that the mean value of firm size is 6.44, with 3.54 and 8.99 as its respective minimum
and maximum values. For firm growth, a minimum value of -0.48 and a maximum value of 3.87
are reported in table 5.1; its standard deviation of 0.15 shows a high degree of dispersion.
The average age of firms in the study sample is 37 years with a minimum age of 1 year and a
maximum of 116 years, which justifies the inclusion of age as a dependent variable in this study.
Furthermore, the respective minimum and maximum (0.03 and 41.42) values of business risk
variable, with its standard deviation of 5.09, show a varying risk level among firms in the study
sample. Liquidity has a minimum value of 0.03 and a maximum value of 8.35 showing also a very
significant variation in the liquidity level among Nigerian non-financial firms.
Table 5.2 also shows the yearly mean figures for long-term and short-term leverage. This yearly
analysis shows that the minimum mean of long-term and short-term leverage between 2001 and
2015 is 14.7% and 5.6% and the maximum value is 18.4% and 7.9% respectively. Overall, the low
leverage level among Nigerian firms may be due to capital market reform in Nigeria, especially
the forced capitalisation of Nigerian commercial banks (since 2005), leading to their dominance
in the Nigerian stock exchange. This is also linked to the increasing importance of equity finance
among Nigerian firms. However, the lowest figure of short-term leverage is between 2007 and
2010, and may be due to the effect of the financial crisis.

89
Table 5.1 Descriptive Statistics of Dependent and Independent Variables
Variable Observation
nnnns onn
Mean Sd.
Dev.
Min Max
DEPENDENT VARIABLES
Long-term Leverage BV (%) (LTD) 1905 0.17
0.06 0.08 0.70
Short-term Debt (%) (STD) 1905 0.05
0.05 0.00 0.29
INDEPENDENT VARIABLES
Profitability (%) (PROF) 1905 0.02 0.03 -0.22 0.19
Asset Tangibility (%) (ASTANG) 1905 0.02 0.10 0.00 0.93
Firm Size (%) (SIZE) 1905 6.44
0.88
3.54 8.99
Firm Growth (%) (GROWTH) 1905 0.03 0.15 -.48 3.87
Firm Age (AGE) 1905 37
20.0 1 116
Business Risk (RSK) 1905 5.38
5.09 .03 41.42
Liquidity (LIQUID) 1905 1.32 1.29 .03 8.35
In Table 5.2, the total number of observations, the minimum (min), the maximum (max), the
mean and the standard deviation (sd) of the study variables are provided. LTLEV = Long-
term leverage, measured as long-term debt over total assets. STLEV = Short-term leverage,
measured as short-term debt over total assets. L1= Lagged Value of the dependent variable.
PROF = Profitability, measured as the ratio of operating profit to the total assets’ book value.
ASTANG = Asset tangibility, measured as ratio of fixed asset to total asset. SIZE = Firm size,
measured as natural log of sales. GROWTH = Firm growth, measured as percentage change
in revenues. AGE = Firm Age, measured as the number of years in the business. RISK =
Business risk and is measured as the standard deviation of return on assets. LIQUID =
Liquidity and is measured as the ratio of current asset to current liability.

90
Table 5.2: Mean Yearly Leverage
Year MEAN
LTLEV STLEV
2001 14.8% 7.9%
2002 14.9% 8.7%
2003 14.7% 7.3%
2004 14.9% 6.9%
2005 14.8% 6.5%
2006 14.7% 7.4%
2007 17.9% 5.6%
2008 16.9% 5.2%
2009 15.7% 5.6%
2010 18.4% 5.6%
2011 17.2% 6.7%
2012 14.9% 6.3%
2013 14.8% 6.2%
2014 15.1% 5.9%
2015 18.1% 6.7%
Note: LTLEV = Long-term leverage and is measured as long-term debt over total
assets; STLEV = Short-term leverage and is measured as short-term debt over total
assets.

91
5.3. Multicollinearity
Multicollinearity occurs among independent variables when there is a high level (± 80%.) of
association between two or more independent variables, thereby increasing the problem of
distinguishing the effect of the study’s variables involved (Murray, 2005). The correlation
coefficient matrix or variance inflation factor (VIF), which are the two main techniques used in
detecting multicollinearity among independent variables, are employed in the current study.
Although there is still controversy with regards to the cut-off point for multicollinearity detection,
studies (e.g. Gujarati, 2003a, Grewal et al., 2004, Harris and Raviv, 2008, Gujarati and Porter, 2011)
argue that the cut-off for severe multicollinearity, which may harm the result of the regression, will
be as from 80%. For VIF, Craney and Surles (2002), argue for multicollinearity when the VIF
value is equal or greater than 10.
In table 5.3 A, which is based on the correlation coefficient matrix, the highest correlation (Coef =
0.1239) shown is between asset tangibility and firm risk. Furthermore, table 5.3B shows very low
VIF (the mean value = 1.04), meaning that the multicollinearity issue does not exist among the
dependent variables used in the current study.

92
TABLE 5.3A CORRELATION MATRIX
LTLEV STLEV PROF ASTANG SIZE GROWTH AGE RISK LIQUID
LTLEV 1.0000
STLEV 0.3953 1.0000
PROF -0.0799 -0.0946 1.0000
ASTANG 0.3673 0.2413 -0.0748 1.0000
SIZE 0.0558 0.1860 0.1176 -0.0894 1.0000
GROWTH 0.1003 0.0536 -0.0331 0.1004 -0.0671 1.0000
AGE 0.0207 0.1245 -0.0221 0.0572 0.1363 -0.0111 1.0000
RISK -0.0233 0.0640 -0.0896 0.1239 -0.2168 0.1126 -0.0346 1.0000
LIQUID -0.0221 0.0238 -0.0005 -0.0262 -0.0445 0.0193 -0.0319 -0.0231 1.0000
LTLEV = Long-term leverage, measured as long-term debt over total assets. STLEV = Short-term leverage, measured as short-term debt over total
assets. L1= Lagged value of the dependent variable. PROF = Profitability, measured as the ratio of operating profit to the total assets’ book value.
ASTANG = Asset tangibility, measured as the ratio of fixed assets to total assets. SIZE = Firm size, measured as natural log of sales. GROWTH
= Firm growth, measured as percentage change in revenues. AGE = Firm Age, measured as the number of years in the business. RISK = Business
risk, measured as the standard deviation of return on assets. LIQUID = Liquidity, measured as the ratio of current assets to current liability.

93
TABLE 5.3B VIF COLLINEARITY TEST RESULTS
Variable VIF 1/VIF
PROF 1.02 0.977116
ASTANG 1.04 0.964892
SIZE 1.09 0.918582
GROWTH 1.02 0.977116
AGE 1.03 0.974571
RISK 1.08 0.929797
LIQUID 1.00 0.995089
MEAN VIF 1.04
5.4. Multivariate Analysis
In order to examine the current study’s hypotheses, the GMM system estimator of Arellano and
Bover (1995) and Blundell and Bond (1998) is employed. Several tests, such as the autocorrelation
test ,Wald test and Sargan test used by previous studies (Ozkan, 2001, Drobetz and Wanzenried,
2006), are also employed in the current study to ensure the validity of the study findings.
For the autocorrelation test, Bond (2002) emphasised that GMM estimators are expected to show
the first order autocorrelation (which is significant), but the second order correlation will violate its
consistency because some lags may be shown as an invalid instrument. The result (see table 5.4) of
a second order autocorrelation test for total leverage (0.9105), long-term leverage (AR2 = 0.3348)
and short-term leverage (AR2 = 0.8916) shows that there is no autocorrelation problem that may
harm the result of this study.
Furthermore, the results of the Sargan test for total leverage (P-Value = 0.3186), long-term leverage
(P-Value = 0.1469) and short-term leverage (P-Value = 0.3805) show that the instruments are

94
exogenous, meaning that the instruments used in the current study are valid. Finally, the Wald test
was used in this study to examine the suitability of the current study’s model. The results of the
Wald test for both dependent variables are significant at the 1 percent level, showing also that the
regressors have joint significance in the estimation of the dependent variables used in the current
study.
The dependent variable used in this estimation are total, long-term (ltlev) and short-term leverage
(stlev). Bevan and Danbolt (2002) found variation in leverage determinants based on the leverage
component being analysed. The current study also used total leverage to measure the adjustment
speed among Nigerian non-financial firms. The results in table 5.4 report both the estimates for
long-term and short-term leverage. In order to compare the determinants of both types of leverage,
both estimates are place side by side in table 5.4. In line with previous studies, the current study
found that profitability asset tangibility, size, growth, age, risk and liquidity are the determinants of
optimal leverage.
5.4.1 Determinants of Capital Structure
In table 5.4, panel A shows a positive and significant relationship between profitability and long-
term leverage (Coef. = .01173, p < 0.000) and supports the trade-off theory, which argues that tax
deductibility of interest expense and a lower default risk will result in higher debt ratios among
profitable firms (Kraus and Litzenberger, 1973, Scott Jr, 1976). However, this result is contrary to
the current study’s hypothesis (H1b), which predicts a negative and significant relationship between
profitability and long-term leverage. A similar result is reported by Michaelas et al. (1999). Based
on agency theoretical consideration (the agency theory of free cash flow) , this positive relationship
between profitability and leverage may be justifiable if the intention of these firms is to discipline
their managers through debt and to limit their perquisite consumption (Jensen, 1986, Stulz, 1990).
This result may also be explained by the relative costliness of short-term leverage when compared
to long-term leverage. Since long-term debt is relatively cheaper, although difficult to acquire from

95
lenders (mainly Nigerian commercial banks), firms’ profitability may not lead to its decrease but
enable the firms to convince lenders of their ability to afford of this type of finance.
In line with the pecking order theory, a negative and a highly significant relationship between
profitability and short-term leverage (Coef. = -.0817712, p < 0.000) was also reported in table 5.4.
The pecking order theory generally argues that external finance should only be considered when
there is insufficiency or unavailability of retained earnings. According to the theory’s hierarchy of
financing, retained earnings should be used first, since they are free from asymmetric information
(Myers and Majluf, 1984). The study result is in line with the hypotheses H1 and H1a of the current
study. This negative correlation (H1a) is expected, since the cost of short-term finance is likely to
make firms rely on internally generated funds.
A similar negative and significant relationship was found between profitability and total leverage
(Coef. = -0.07265, p < 0.000) and points to the dominance of pecking order behaviour among
Nigerian non-financial firms. The majority of prior studies have documented a negative and
significant relationship between leverage and profitability, which shows that profitable firms are
generally not interested in debt (Titman and Wessels, 1988a, Harris and Raviv, 1991, Rajan and
Zingales, 1995, Booth et al., 2001a, Fama and French, 2002b, Gaud et al., 2005, Degryse et al.,
2009, Ahmed Sheikh and Wang, 2011, Toy et al., 1974, Kester, 1986).
In the case of the listed non-financial firms in Nigeria, another possible explanation of the negative
relationship between profitability, short-term leverage and total leverage is that these firms may
show more preference for equity rather than debt. This is due to the forced capitalisation policy of
the central bank of Nigeria, which led to fierce competition with financial firms in the capital
market.

96
Asset tangibility (Astang) has a positive and significant relationship with both total, short-term and
long-term leverage and confirms the current study’s hypotheses (H2, H2b) which predict a positive
and significant relationship between tangibility and leverage. Nevertheless, the negative
relationship expected for short-term leverage (H2a), contradicts the study result. It is assumed in
the hypothesis development that, due to the role of asset tangibility in increasing long-term leverage,
it will have a negative relationship with short-term leverage.
The positive and significant relationship between tangibility the dependent variables means that
Nigerian firms need tangible assets to obtain long-term debt and short-term bank loans. Although
this result is interpreted in favour of the trade-off theory, it does not contradict the pecking order
theory, which puts debt in the second pecking order of finance. This also confirms why both theories
are considered as not mutually exclusive and should not be involved in an empirical horse race
(Fama and French, 2002a, Cotei and Farhat, 2009, Mukherjee and Mahakud, 2012).
It is important to emphasise that, in such an environment of developing countries, marked by weaker
laws and investors’ protection (Fan et al., 2012), tangibility of firms’ assets will be very important
in securing both long-term and short-term loans. This is because tangibility of assets reduces the
information gap between borrowers and lenders (Myers and Majluf, 1984, Harris and Raviv, 1991),
helps lenders in overcoming the problem of moral hazard (Di Patti and Dell'Ariccia, 2004) and thus
reduces the overall cost of lending (Titman and Wessels, 1988b, Mackie Mason, 1990, Psillaki and
Daskalakis, 2009, Vătavu, 2012, Öztekin, 2015).
This result is also consistent with empirical results in both developed (Titman and Wessels, 1988b,
Rajan and Zingales, 1995, Michaelas et al., 1999, Bevan and Danbolt, 2000, Strýčková, 2015,
Berkman et al., 2016) and developing countries (Booth et al., 2001b, Abor and Biekpe, 2009,
Eldomiaty, 2008, Köksal and Orman, 2014, Lemma and Negash, 2014). For instance, Fan et al.

97
(2012) found a positive and significant relationship between leverage and asset tangibility in 38 out
of 39 countries studied.
With regards to firm size, the result shows a negative and significant relationship with the long-
term and short-term leverage (Coef. = -.00043, p < 0.000; Coef. = -.0014555 , p < 0.000) and thus
fail to confirm the current study’s hypotheses for total leverage and long-term leverage (H3, H3b),
which predict a positive and significant relationship with leverage in accordance with the prediction
of the trade-off theory. This relationship was predicted since firm size directly influences the
issuance cost of both firms’ equity and debt (Titman and Wessels, 1988b, Bevan and Danbolt, 2002,
Chen, 2004, Deesomsak et al., 2004, Abor and Biekpe, 2009). For short-term leverage, the current
study’s result is similar to the proposed relationship (H3a).
This result is expected since firm size influences its ability to obtain more attractive short-term
debt. Furthermore, a negative and significant relationship between size and total leverage (Coef. =
-0.001250, p < 0.000) is a further sign that, as the size increases, the attractiveness of leverage
reduces among these Nigerian firms in the study sample.
This result contradicts several empirical findings that show a positive relationship between size and
leverage (Titman and Wessels, 1988b, Bevan and Danbolt, 2002, Chen, 2004, Deesomsak et al.,
2004, Abor and Biekpe, 2009). Rajan and Zingales (1995) suggested that firm size may act as
inverse proxy for the level of asymmetric information between investors and managers. If this is
the case, large Nigerian firms are expected to issue more equity rather than debt. Michaelas et al.
(1999) and Chen (2004) document similar results.
Although the pecking order theory is not specific regarding how firm size is related to different
types of leverage, studies in favour of pecking order support a negative association with all types
of leverage (Fama and French, 2002b, Drobetz and Fix, 2003a, Köksal and Orman, 2015).
Firm growth is another variable, which points towards the pecking order theory. The study’s result,
presented in table 5.4, shows that firm growth has a positive and significant relationship with long-

98
term and short-term leverage (Coef. = 0.02531, p < 0.000; Coef. = 0.0051615, p < 0.000).
Similarly, the positive relationship between growth and total leverage (Coef. = 0.030555, p <
0.000) is also a sign that the study results support the pecking order theory.
This result confirms the proposed relationship for both long-term and short-term leverage (H4
and H4a) but fails to confirm the hypothesis for long-term leverage (H4b), where a negative and
significant relationship between firm size and leverage is proposed. In the pecking order hierarchy
of finance, debt is the more favourable means of finance after retained earnings (Myers, 1984,
Myers and Majluf, 1984). Pecking order theory argues, therefore, that firms will issue debt to
finance their growth, since retained earnings are mostly insufficient when a firm is growing. As
seen in the descriptive statistics in table 5.3, the proportion of debt used by Nigerian non-financial
firms in study samples are in no way comparable to that of equity and may help to explain the
positive relationship between firm growth and both long-term and short-term leverage.
Regarding the firm age, the result reports a negative and significant association with total, long-
term and short-term leverage (Coef. = -.00027, p < 0.000; Coef. = -0.00038, p < 0.000; Coef. = -
0.0002102, p < 0.000), and is contrary to the current study’s hypothesis for long-term leverage
(H5b), which proposes that firm age will be positively and significantly related to long-term
leverage in line with the findings of previous studies (Michaelas et al., 1999, Ramjee and
Gwatidzo, 2012). Nevertheless, the result of the current study and the overall trend in the previous
result supports the empirical results of Hussain and Nivorozhkin (1997), Johnsen and McMahon
(2005) and Robb and Robinson (2012) who found that firm age is negatively related to leverage.
Hussain and Nivorozhkin (1997) found that older firms’ reputations may help them to raise equity
finance in the stock market, which means a firm’s reputation, acquired through age (long years of
operation), may not necessarily be used in favour of debt as Diamond (1989) suggested.

99
Hussain and Nivorozhkin (1997) suggest that the negative relationship between age and long-term
leverage may be due to the unwillingness of older firms to borrow at all costs, which is likely to be
the case for Nigerian non-financial firms. The study result confirms the hypothesis (H5a) for short-
term leverage in line with prior studies (Michaelas et al., 1999, Lemmon and Zender, 2001). This
is because the availability of long-term finance may limit older firms’ use of short-term leverage.
The overall direction is further supported by the negative and significant relationship between age
and total leverage (Coef. = -0.00027, p < 0.000). This negative relationship, between short-term,
long-term and total leverage, is in support of the pecking order theory which suggests that firms’
age reduces its dependence on debt. Some previous studies have reported similar results which
show that the older and more mature a firm gets, the more its use of debt finance will be reduced
(Hall et al., 2004, Klapper et al., 2006, La Rocca et al., 2011).
The study result also shows that business risk is positively and significantly related to short-term,
long-term and total leverage (Kale et al., 1991) and contradicts the hypotheses H6, H6a and H6b,
which proposed a negative relationship between business risk and all dependent variables. This
result is surprising given the fact that Nigerian lenders are unlikely to finance a business they
deemed risky. However, since Nigerian non-financial firms show less reliance on debt, there is a
possibility of correlation between business risk and leverage.
Firms’ liquidity ensures its ability to meet its current financial obligation (Sharma and Paul, 2015,
Agliardi et al., 2016). The study result shows a negative and significant relationship between
liquidity and long-term leverage (Coef. = -0.00534, p < 0.000). This is also supported by the
reported negative association between liquidity and total leverage (Coef. = -.001079, p < 0.000).
This negative relationship is in line with the pecking order theory, which suggests that firms with
an internal source of funds (in this case, liquid assets) will only use debt when this fund is fully
used up or insufficient. It is also consistent with the results of prior studies (Ozkan, 2001,
Deesomsak et al., 2004, Frieder and Martell, 2006, Lipson and Mortal, 2009, Ahmed Sheikh and

100
Wang, 2011). This result confirms the hypotheses (H7 and H7b) of the current study, and is
expected, since the liquidity of a firm’s assets may lead to a lower cost of equity, thereby making
equity issuance more likely than debt (Lipson and Mortal, 2009).
However, for short-term leverage, a positive and significant relationship between liquidity and
leverage is reported, which is contrary to the current study’s hypothesis (H7a) and implies that a
firm’s liquidity does not reduce its short-term leverage. This may be justifiable, since short-term
debt is only about one third of total leverage of Nigerian firms, and is needed to boost firms’
financing options in such an environment where firms’ access to external finance is restricted due
to an underdeveloped capital market.
This positive relationship also does not violate the pecking order assumption since short-term
debt has lower asymmetric information (Myers, 1977, Myers, 1984, Myers and Majluf, 1984) and
is thus preferred in the pecking order of finance before long-term debt and equity. Consequently,
the whole result is interpreted in favour of the pecking order theory, since the coefficient sign of
two independent variables are based on its prediction.
Although the presence of adjustment behaviour may suggest a support for the trade-off theory, the
main result of the study shows that the behaviour of Nigerian firms is more in line with the pecking
order theory. This is because the signs of the coefficient of most variables are as predicted by the
theory. Similarly, Flannery and Rangan (2006) found in their study that pecking order consideration
is partly responsible for variation in the target leverage.
Prior studies have argued that both pecking order and trade-off theories can complement each other
(Shyam-Sunder and Myers, 1999, Barclay and Smith, 2005, Fama and French, 2005, Mukherjee
and Mahakud, 2012). According to Shyam-Sunder and Myers (1999), the pecking order theory is
not invalidated by a mere existence of target leverage adjustment behaviour among firms, while

101
Fama and French (2005) and Cotei and Farhat (2009) warned that it is inappropriate to engage both
theories in an empirical horse race.
The overall result shows that Nigerian firms’ profitability helps in reducing both their dependence
on long-term and their short-term borrowing. It shows also that debt is increased if a firm is growing
(see firm growth) and thus, in need of more funds. The most significant findings of this study is the
importance of tangibility of firms’ asset when acquiring long-term and short-term leverage.

102
Table 5.4: Relationship between Long-term and Short-term Leverage and firm-level characteristics (Dynamic Model)
PANEL A ( GMM) PANEL B (GMM)
TOTLEV
Exp.
Sign
Coefficient Std.
Error
LTLEV
Exp.
Sign
Coefficient Std. Error
STLEV
Exp.
Sign
Coefficient Std.
Error
_Cons + .154427 .000977 _Cons + .10967*** .0007258 _Cons + .0542116*** .0007822
L1 + .370889 .00077 L1 + .47066*** .0002270 L1 + .2091354*** .0004806
PROF _ -0.07265 .00341 PROF _ .01173*** .0009133 PROF _ -.0817712*** .0010314
ASTANG + .400245 .003574 ASTANG + .26232*** .0019733 ASTANG + .1326766*** .0007673
SIZE + -.001250 .000123 SIZE + -.00043*** .0000974 SIZE _ -.0014555*** .0000747
GROWTH + .030555 .001512 GROWTH + .02531*** .0007296 GROWTH + .0051615*** .0009923
AGE + -.00027 9.85E-06 AGE + -.00038*** 8.73e-06 AGE + -.0002102*** 7.37e-06
RISK _ 8.32E-05 3.28E-05 RISK _ 3.5106 9.95e-06 RISK + .000289*** .0000105
LIQUID _ -.001079 .00020 LIQUID _ -.00534*** .0000809 LIQUID _ .0024775*** .0001607
ADJUSTMENT SPEED (%) = 63%
AR 1= 0.000 SARGAN = 0.3186
AR2 = 0.9105 WALD = (8885)***
AR 1= 0.0003
AR2 = 0.3348
SARGAN 0.1469
WALD = (8.51) ***
AR 1= 0.000
AR2 = 0.8916
SARGAN = 0.3805
WALD = (405275)***
TOTLEV= Total leverage, measured as total debt over total assets. LTLEV = Long-term leverage, measured as long-term debt over total assets.
STLEV = Short-term leverage, measured as short-term debt over total assets. L1= Lagged Value of the dependent variable. PROF = Profitability,
measured as the ratio of operating profit to the total assets’ book value. ASTANG = Asset tangibility, measured as ratio of fixed asset to total asset.
SIZE = Firm size, measured as natural log of sales. GROWTH = Firm growth, measured as percentage change in revenues. AGE = Firm Age,
measured as the number of years in the business. RISK = Business risk, measured as the standard deviation of return on assets. LIQUID = Liquidity,
measured as the ratio of current asset to current liability. *** shows highest level of significant at 0.01, while ** and * shows significance at 5% 0.10
respectively. ADJUST SPEED is the speed of adjustment and is achieved by subtracting the coefficient of lagged total debt (L1) from 1. In GMM,
first level autocorrelation is normal. The validity of instruments is confirmed when the P value of the Sargan test is greater than .05.

103
5.4.1.1 Determinants of Capital Structure Before and After the Financial Crisis
In this section, the current study examines the impact of the crisis on the capital structure
determinants for long-term and short-term leverage before and after the financial crisis. Prior studies
found that firms’ borrowing capacity was negatively affected by diminished lending and increased
lending costs during the financial crisis (Ivashina and Scharfstein, 2010, Harrison and Widjaja,
2014, Zeitun et al., 2017, Ali and Afzal, 2012). However, studies on the effect of the financial crisis
in sub-Saharan Africa focused only on reduced capital inflows during the financial crisis
(Brambila‐ Macias and Massa, 2010, Allen and Giovannetti, 2011), ignoring its effect on firms’
capital structure.
Nigeria provides an idea environment for the examination of the impact of the financial crisis on
the relationship between these types of leverage and firm characteristics. The peculiar issues in
Nigeria, such as issue of illiquid capital market and prevalence of bank lending, suggest that the
impact of the financial crisis on leverage may be significantly different from that experienced by
firms in other countries. Iqbal and Kume (2015) suggest that firms’ dependence on bank lending
may affect their level of vulnerability to a global financial crisis. Since Nigerian firms rely mostly
on bank lending, it is, therefore, important to re-examine the determinants of short-term and long-
term leverage before and after the financial crisis.
In order to investigate the impact of the crisis on Nigerian non-financial firms, the study sample
was split to reflect the pre financial crisis (2001- 2007) and post financial crisis (2010-2015) to
understand how determinants of long-term and short-term leverage vary, before and after the crisis.
Zeitun et al. (2017) suggest that a financial crisis may lead to different predictions on the
relationship between capital structure determinants and leverage, since perfect elasticity of credit
supply may be violated during a crisis situation. Owing to the inclusion of a time dummy in the
regression, the correlation matrix was employed to detect multicollinearity. The resultant

104
multicollinearity test shows that the highest correlation (Coef = 0.2365) is between asset tangibility
and the time variable, which implies that there is no multicollinearity problem among the
independent variables used in the current study (see appendix 5.2).
The regression results for long-term leverage presented in table 5.5 show that before the financial
crisis (from 2001-2007), apart from lagged leverage, only asset tangibility and age are positively
and significantly related to long-term leverage. Tangibility shows only marginal significance before
the financial crisis (Coef. = .025205, p < 0.071). This means that Nigerian firms needed tangible
assets before the financial crisis in order to secure external debt finance.
Firm age is also positively and significantly related to long-term leverage before the financial crisis
and highlights the importance of firms’ years of experience when obtaining long-term debt. This
result is in line with prior studies which suggest that a firm shows itself as an on-going business
(Gregory et al., 2005, Abor, 2008, Saarani and Shahadan, 2013) and signals its transparency track
record (Haas and Peeters, 2006) through age. Although profitability is not significant, the sign of
its coefficient before the financial crisis is positive, which is as predicted by the trade-off theory.
After the financial crisis, asset tangibility is highly significant and positively related with long-term
leverage, meaning that tangibility is the most important capital structure determinant among non-
financial firms in Nigeria. This result is particularly important in the post-crisis Nigerian economy
where access to finance is limited due to the role of tangibility in reducing lending costs (Titman
and Wessels, 1988b, Mackie Mason, 1990, Psillaki and Daskalakis, 2009, Vătavu, 2012, Öztekin,
2015).
Similarly, firm growth has a positive and significant relationship with long-term leverage (Coef. =
0.0288691, p < 0.043), which suggests that growing Nigerian firms will use debt to reduce their
financing gap. This result is in line with the pecking order theory which supports firms’ use of debt
in financing their growth when retained earnings are insufficient or unavailable (Myers, 1984,

105
Myers and Majluf, 1984). Pecking order theory argues, therefore, that firms will issue debt to
finance their growth since retained earnings are mostly insufficient when a firm is growing.
Harrison and Widjaja (2014) and Van Hoang et al. (2017) documented similar results which suggest
firms’ pecking order behaviour post- financial crisis.
Business risk is also negatively and significantly related to leverage after the financial crisis,
meaning that firms with riskier operations will use less debt. This is also in line with prior empirical
studies which show that firm risk has a negative correlation with leverage (Bradley et al., 1984,
Kim and Sorensen, 1986, Titman and Wessels, 1988b). A possible explanation for this relationship
is that debt finance is associated with regular periodic repayment to firms’ lenders, which may have
been very costly immediately after the financial crisis. Thus, a high debt ratio of firms with riskier
operations will increase the probability of default. Firms with high risk are assumed to be in danger
of financial distress (Kim and Sorensen, 1986).
The negative sign of profitability and firm size coefficients post-crisis, regardless of its statistical
insignificance, confirms that Nigerian firms overwhelmingly followed pecking order behaviour
after the financial crisis. Thus, the result of the current study is in line with those of previous
literature which reported that firms’ capital structure decisions post-crisis are explained by the
pecking order theory (Harrison and Widjaja, 2014, Iqbal and Kume, 2015). For instance, the
empirical studies of Iqbal and Kume (2015) on firms in Germany, France and the UK show a
significant increase in firms’ use of retained earnings post- financial crisis. Similarly, Harrison and
Widjaja (2014) reported that pecking order theory explains the capital structure decisions of US
firms after the financial crisis due to their less reliance on debt finance.
Firm age shows a positive and highly significant relationship with long-term leverage post- financial
crisis (Coef. = 0.002878, p < 0.0008), which implies that older firms are more likely to obtain eternal
debt finance post- crisis. This is expected due to the contribution of a firm’s age in a business being

106
considered as a going concern (Gregory et al., 2005, Abor, 2008, Saarani and Shahadan, 2013) and
in gaining a reputation in the capital market (Diamond, 1989).
From the regression result presented in table 5.6, profitability and age had a positive and significant
relationship with short-term leverage before the financial crisis. The sign of their coefficient
indicates support for the trade-off theory. However, after the financial crisis, profitability shows a
negative and significant relationship with leverage, which implies that profitable Nigerian firms use
their own internal sources of funds to avoid higher costs associated with short-term debt. Campello
et al. (2010) found that firms reduce their overall demand for debt (including short-term debt)
finance due to associated costs and the difficulty involved in raising funds externally.
Liquidity is positively and significantly related to short-term leverage post- crisis. Ozkan (2001)
suggests that firms with high liquidity may need more debt to meet their current obligations. These
obligations may be interest payment on debt, or repayment of trade credit, in order to maintain a
closer relationship with suppliers. Meeting these obligations after the financial crisis may be very
important for firms, after the financial crisis, to maintain business relationships with lenders and
suppliers.
Asset tangibility shows a positive and significant relationship with leverage, confirming the need
for collateral when obtaining short-term leverage. This means that Nigerian firms need to secure
their short-term loan to minimise the risk of lending and is in line with the result reported for
tangibility in the earlier chapters. The study result also shows that asset tangibility is the most
important determinant for Nigerian non-financial firms, since tangibility maintained its positive and
significant relationship before and after the financial crisis. This shows the importance of collateral
in overcoming the problem of moral hazard (Di Patti and Dell'Ariccia, 2004) and lending risk
(Titman and Wessels, 1988b, Mackie Mason, 1990, Psillaki and Daskalakis, 2009, Vătavu, 2012,
Öztekin, 2015). This highlights lenders’ demand for collateral in such weak regulatory

107
environments (Fan et al., 2012). This importance of tangibility may also be due to the peculiar
financial system in Nigeria. In Nigeria, the banks are the major suppliers of debt finance for non-
financial firms. Therefore, Nigerian banks require collateral to make both long-term and short-term
lending decisions, which makes asset tangibility the most reliable determinant of firms’ capital
structure among Nigerian non-financial firms.
Regarding firm age, the study result shows that age is positively and significantly related to both
long-term and short-term leverage before and after the financial crisis. However, the level of its
significance (1%) is higher after the financial crisis. This shows that a firm’s age, which is linked
to its experience (Diamond, 1989) and its on-going operations (Gregory et al., 2005, Abor, 2008,
Saarani and Shahadan, 2013), will be used by lenders as criteria for their lending decisions. This is
in line with prior studies which suggest that firms’ age helps in reducing the problem of information
asymmetry between firms and lenders (Diamond, 1989, Gwatidzo and Ojah, 2009).
Business risk maintains a negative relationship in all sub-samples (both pre and post financial crisis)
suggesting that firms with risk will abstain from debt. However, it is only significantly related with
long-term leverage after the financial crisis, which further highlights the importance of reducing
dependence on debt after the crisis.
Overall, the results of the current study are in line with prior studies that investigated capital
structure determinants before and after the financial crisis (Harrison and Widjaja, 2014, Van Hoang
et al., 2017, Zeitun et al., 2017). For instance, Zeitun et al. (2017) examined the impact of the
financial crisis on capital structure dynamics of firms in GCC countries and found that asset
tangibility is a more relevant determinant of firms’ capital structure post- crisis than before the
financial crisis.
A similar result for the long-term leverage was documented by Harrison and Widjaja (2014), who
examined the impact of the 2008 crisis on the capital structure of the US S&P companies. They

108
found that asset tangibility showed a significant increase after the financial crisis while the
profitability effect declined. Furthermore, Iqbal and Kume (2015), found that leverage ratios went
back to their pre-crisis period immediately after the crisis and that highly leveraged firms (before
the crisis) acquired less debt after the crisis while firms with low leverage acquired more debt.
Table 5.5: Long-term leverage determinants Pre- and Post-Financial Crisis
Pre-financial Crisis Post Financial Crisis
LTLEV
Coefficient Std. Error
LTLEV
Coefficient Std. Error
_Cons .067618*** .0241565 _Cons 0.043554 0.043482
L1 .451991*** .0272928 L1 0.252422*** 0.027344
PROF .038389 .0269531 PROF -0.041787 0.050399
ASTANG .025205* .0139676 ASTANG 0.2937251*** 0.028975
SIZE -.002835 .0024859 SIZE -0.001352 0.003688
GROWTH .0011555 .0027634 GROWTH 0.0288691** 0.014245
AGE .0016053** .0006942 AGE 0.002878*** 0.001055
RISK -.0001848 .000157 RISK -0.001161* 0.000625
LIQUID -.001193 .0016184 LIQUID 0.0028221 0.005389
TM -. 002016*** .0007481 TM -0.002965*** 0.001019
LTLEV = Long-term leverage, measured as long-term debt over total assets. STLEV = Short-term leverage,
measured as short-term debt over total assets. L1= Lagged Value of the dependent variable. PROF =
Profitability, measured as the ratio of operating profit to the total assets’ book value. ASTANG = Asset
tangibility, measured as ratio of fixed assets to total assets. SIZE = Firm size, measured as natural log of sales.
GROWTH = Firm growth, measured as percentage change in revenues. AGE = Firm Age, measured as the
number of years in the business. RISK = Business risk, measured as the standard deviation of return on assets.
LIQUID = Liquidity, measured as the ratio of current assets to current liability.

109
Table 5.6: Short-term leverage determinants Pre and Post-Financial Crisis
Pre-financial Crisis Post Financial Crisis
STLEV
Coefficient Std. Error
STLEV
Coefficient Std. Error
_Cons .03033* 0.0175 _Cons -.011603 .02192
L1 .32070*** 0.0372 L1 .2917763*** .03710
PROF .05214* 0.0305 PROF -.145259*** .03814
ASTANG .01173* 0.0332 ASTANG .1450358*** .01631
SIZE -.00269 0.0031 SIZE .0007963 .00249
GROWTH .02072 0.0158 GROWTH -.004455 .00394
AGE .00064** 0.0003 AGE .0008885*** .00034
RISK -.00009 0.0002 RISK -.0001614 .00042
LIQUID .00242 0.0020 LIQUID .005277* .00292
TM -.00113** 0.0006 TM -.0001655 .00052
LTLEV = Long-term leverage, measured as long-term debt over total assets. STLEV = Short-term
leverage, measured as short-term debt over total assets. L1= Lagged Value of the dependent variable.
PROF = Profitability, measured as the ratio of operating profit to the total assets’ book value. ASTANG
= Asset tangibility, measured as ratio of fixed asset to total asset. SIZE = Firm size, measured as natural
log of sales. GROWTH = Firm growth, measured as percentage change in revenues. AGE = Firm Age,
measured as the number of years in the business. RISK = Business risk, measured as the standard
deviation of return on assets. LIQUID = Liquidity, measured as the ratio of current asset to current
liability.

110
5.5 Further Analysis and Robustness Check
In this section, further analysis of the study sample will be undertaken to understand how firms’
degrees of indebtedness, firm size and industry influences capital structure determinants of short-
term and long-term leverage. This section is also relevant to examine the robustness of the study
results presented in table 5.4. Thus, the full study sample is divided into two, based on whether the
firm is considered as over-leveraged or under-leveraged and based on firm size. Furthermore, a
separate estimation was made based on individual industry to investigate whether the study results
are in line with the main study findings.
5.5.1 Degree of Indebtedness
To test the robustness of the study result, the study sample was divided based on the degree of
indebtedness (by using the median value of total leverage) and the results presented in appendices
5.3 and 5.4.
Based on the study result, profitability is negatively and significantly related to long-term and short-
term leverage of both over-leveraged and under-leveraged firms respectively. Similarly, asset
tangibility maintains its positive and significant relationship with long-term and short-term leverage
of over-leveraged firms.
Furthermore, the sign and the statistical significance of the firm size coefficient remains unchanged
for both long-term and short-term leverage of over-leveraged firms, and the long-term debt of
under-leveraged firms is in line with the main study result. For over-leveraged firms, firm growth
shows a positive and significant relationship with the long-term, short-term and total leverage.
Most of the study variables are in line with the main result reported in table 5.4.

111
5.5.2 Firm Size
To confirm the study result, the study sample was divided based on median firm size and the
regression results are presented below in appendices 5.5 and 5.6 respectively.
In line with the main result reported in table 5.4, profitability shows a negative and significant
association with short-term and total leverage for both large and small firms. Asset tangibility
coefficients and statistical significance remain unchanged. For the total leverage, the coefficient of
firm size is negative for both small and large firms. Firm growth maintained a positive and
significant relationship with all types of leverage for both small and large firms. Regarding firm
age, the study results show a negative relationship between age and all types of leverage. The
results confirm the prevalence of pecking order behaviour and is in line with the main result.
5.5.3 Industry
One of the objectives of this chapter is to examine determinants of long-term and short-term
leverage across industry, since prior studies have suggested that determinants of capital structure
will vary across industry (DeAngelo and Masulis, 1980, MacKay and Phillips, 2005).
The result (see appendices 5.9a and 5.9b) shows that asset tangibility is the most important
determinant of long-term and short-term leverage across all industries. Asset tangibility maintained
its positive and significant relationship with long-term debt across all industries investigated.
Similarly, profitability shows a negative and significant relationship in the majority of industries
(conglomerates, consumer goods and computer technology) in line with the main result.
As seen in the main result, firm growth is positively and significantly related to both long-term and
short-term leverage in the majority of industries, meaning that these firms are likely to finance their
growth with long-term leverage as predicted by the pecking order theory. Thus, there is evidence
of pecking order behaviour across industries, which confirms the main result reported in table 5.4.

112
5.6 Summary
This study examined the relationship between firm characteristics and long-term and short-term
leverage over a 15-year period and found that firm characteristics are determinants of capital
structure of non-financial firms in Nigeria. From the main result presented in table 5.4, asset
tangibility and firm growth are positively related with both long-term and short-term leverage.
Profitability shows a negative and significant relationship with short-term leverage but is positively
related with long-term leverage. Firm size and age show a negative and significant relationship with
the long-term and short-term leverage. The coefficient signs of most independent variables confirm
the dominance of the pecking order theory.
The current study also investigates the impact of the financial crisis on capital structure decisions
of Nigerian non-financial firms and found also that firms’ characteristics are determinants of capital
structure before and after the financial crisis. Asset tangibility is the most important capital structure
determinant among non-financial firms in Nigeria before and after the financial crisis. The positive
and significant relationship between tangibility and both types of leverage means that Nigerian
firms need tangible assets to obtain long-term debt and short-term bank loans.
In order to confirm the study result, further analysis was conducted based on the degree of
indebtedness, firm size and industry. These tests confirm the study’s main result and support the
prevalence of pecking order behaviour among Nigerian non-financial firms.
113
Chapter Six: Speed of Adjustment of Nigerian non-financial Firms
6.1 Introduction
In this chapter, the current study will discuss the leverage adjustment behaviour of Nigerian non-
financial firms. It will also analyse SOA based on the degree of indebtedness, firm size and
industry. Finally, the current study will examine the impact of crisis on the leverage adjustment
behaviour of the firms in the study sample.
6.2 SOA of Nigerian Non-Financial Firms
The regression results in table 5.4 report overall leverage adjustment speed (using total leverage)
for non-financial firms in Nigeria. They show that the lagged total leverage is statistically significant
and accounts for about 37% change in total leverage when all other regressors are held constant.
This result of the lagged dependent variable is of importance in the dynamic capital structure model,
especially when the coefficient of the lagged variable is between 0 and 1 and shows statistical
significance, since this implies that debt adjustment policy is followed by these firms in the study
sample.
The result also shows the importance of a firm’s characteristics in influencing the SOA of Nigerian
non-financial firms and is in line with the previous studies (Ozkan, 2001, Hovakimian et al., 2001,
Flannery and Rangan, 2006, Byoun, 2008, Clark et al., 2008, Soekarno et al., 2015, Zhou et al.,
2016b, Nunes and Serrasqueiro, 2017). Dang et al. (2012) suggest that the relevance of firms’
characteristics in the firms’ adjustment behaviour is as a result of their differential adjustment
costs.
The study’s result, presented in table 5.4, shows that the SOA is 63%, which means that only 63 %
of the variation between target and actual total leverage is adjusted each year. This moderate
adjustment is due to firms’ inability to acquire debt finance through the underdeveloped and

114
illiquid Nigerian stock exchange. This implies that the large adjustment coefficient, which is more
than 0.5, is attributable to the low level of public debt used by Nigerian firms. The result of the
current study also suggests that Nigerian non-financial firms adjust their total leverage relatively
quicker (slightly above midway), balancing both the actual adjustment cost and cost of being away
from the target.
This result is similar to the SOA result (65.5% ) reported by Ramjee and Gwatidzo (2012) for both
total debt of South African non-financial firms. However, it is slightly higher than the SOA of 50%
reported by Bhaduri (2002) for Indian listed companies. Drobetz and Fix (2003a) reported SOA of
80% for Swiss firms, while De Miguel and Pindado (2001) reported SOA of 79% for firms in
Spain, which are both higher than the current study’s result, and attributed this to the use of bank
lending. De Miguel and Pindado (2001) argued that the higher SOA reported in their study is
linked to the underdeveloped Spanish bond market, causing firms to acquire debt finance through
bank lending and other sources. For Drobetz and Fix (2003a), using bank finance allows Swiss
firms to adjust their leverage speedily due to its low transaction costs. However, the 63% SOA
reported for Nigerian firms suggests that the bank debt in Nigeria may be costlier than in Spain and
Switzerland, and may have led to a moderate adjustment.
In contrast, the SOA reported for firms in developed countries, where firms have access to public
debt, shows either slow or moderate speeds of adjustment. For instance, Dang et al. (2012),
Antoniou et al. (2008) and Flannery and Rangan (2006), document evidence of 30%, 32% and
34% speeds of adjustment respectively for US firms. Similarly, Antoniou et al. (2008) show 32%
SOA for UK firms and 39% for French firms, suggesting that firms in developed countries have a
lower speed of adjustment when compared to firms in developing countries. This means that the
variation in the reported SOA is related to varying access to the public debt market (Aybar-Arias et
al., 2012).

115
The current study identified firm characteristics as determinants of speed of adjustment. It found
that profitability, asset tangibility, firm size, firm growth, age, business risk and liquidity
influence the adjustment behaviour of Nigerian non-financial firms. The majority of prior studies
found that firm characteristics play a significant role in firms’ speed of adjustment (Ozkan, 2001,
Hovakimian et al., 2001, Flannery and Rangan, 2006, Byoun, 2008, Clark et al., 2008, Soekarno
et al., 2015, Zhou et al., 2016b, Nunes and Serrasqueiro, 2017). Dang et al. (2012) suggest that
the relevance of firm-level factors in the adjustment process is due to differential costs of
adjustment resulting from variations in firms’ characteristics.
6.3 Factors Influencing SOA
In this section, the current study examines the impact of degree of indebtedness on SOA and
differences in the SOA of large and small firms in Nigeria. It will also examine the variation of
SOA across industries. As in the main result, the dependent variables are long-term leverage and
short-term leverage for both larger and smaller firms. The independent variables are profitability,
asset tangibility, size, growth, age, risk and liquidity. The SOA is also based on the total leverage
to ensure uniformity of approach.
6.3.1 SOA and Degree of Indebtedness
The current study groups the study sample based on the degree of indebtedness (by using the
median value of total leverage) since a varying degree of adjustment cost and cost of being away
from the target leverage are expected. The result of the estimation is presented in appendices 5.3
and 5.4. It is important to emphasise that, similarly to the main result, SOA calculation will be based
on total leverage.
In line with the main result in table 5.4, the lagged variables of total leverage have positive
coefficients which are between zero and one, and significant at a 1 % level, showing that both under-
leveraged and over-leveraged firms follow the adjustment process. The results show that the SOA

116
for over-leveraged and under-leveraged firms are 70% and 75% respectively. This suggests that, for
both, the relatively high cost of deviation from their target leverage ratio may outweigh any possible
adjustment cost.
However, the speed of adjustment is slightly lower (5%) for over-leveraged firms when compared
to under-leveraged firms. This confirms the study hypothesis (H1b), which proposes a higher SOA
for firms that are below their leverage target. Nevertheless, the result does not support the low
adjustment predicted for over-leveraged firms (H1a) since the result showed 70% SOA for firms
that are above their target. Prior studies document evidence that the adjustment speed of over-
leveraged firms may be affected by a possible cost of adjustment (Clark et al., 2008, Dang et al.,
2014, Castro et al., 2014).
The slightly higher adjustment (5%) reported for under-leveraged firms in this study is in line
with that of Drobetz and Wanzenried (2006), Byoun (2008) and Smith et al. (2015), who found
that firms that are below their target are more likely to make rapid adjustment compared to those
that are above their leverage target. Dang et al. (2011) argued that firms with low leverage are
more likely to issue more debt to reduce their financing deficits. The author suggests that this will
help firms to adjust faster to their leverage target.
Overall, the study shows that there is adjustment behaviour irrespective of the degree of
indebtedness, and thus confirms the dynamic nature of capital structure. Under-leveraged firms have
a faster adjustment speed (75%) when compared to over-leveraged firms’ SOA of 70%, suggesting
that the cost to deviation from their capital structure may be higher for the under-leveraged firms.

117
6.3.2 SOA and Firm Size
Prior studies have also identified firm size as a major determinant of capital structure choice
(Titman and Wessels, 1988b, Bevan and Danbolt, 2002, Chen, 2004, Deesomsak et al., 2004,
Abor and Biekpe, 2009) and argues for its impact in the speed of adjustment (Flannery and
Hankins, 2007, Byoun, 2008, Castro et al., 2014). Similarly to the main result in table 5.4, the
lagged total leverage has positive coefficients which are between zero and one, and is highly
significant at a 1 % level. This implies that both large and small Nigerian non-financial firms
adjust their capital structure.
The results (see appendices 5.5 and 5.6) show also that the SOA for large and small firms are 50%
and 58% respectively, suggesting a slower leverage adjustment process for both types of firm.
The slightly higher SOA for small firms may be due to a higher proportion of short-term leverage
used by smaller firms when compared to larger firms. Aybar-Arias et al. (2012) argue that the
need for re-negotiation and restructuring of short-term leverage may influence the adjustment
behaviour. However, the result failed to support the study’s hypothesis (H2b) since adjustment
speed could be described as a midway adjustment (Ozkan, 2001).
For smaller firms, this slower adjustment means that the cost of deviating from their target
leverage may be similar to their adjustment cost. Prior studies suggest that smaller firms are often
discriminated against when they apply for debt finance (Abor and Biekpe, 2009, Ebel Ezeoha,
2008) which may be due to reduced tangibility of their assets and lack of diversification. This is
likely to increase their issuance cost for debt finance, thereby discouraging their speedier
adjustment process, even in the face of a large financing gap.
For large firms, the adjustment speed is 50%. This confirms the study hypothesis (H2a), which
suggests slow adjustment due to reduced benefits of adjustment. This implies that these firms
balance the adjustment cost and the possible cost of deviating from their target leverage.

118
This lower SOA may also mean that large firms’ diversified operations (Rajan and Zingales, 1995,
Vătavu, 2012), reduced volatility of cash flow (Fama and French, 2002b) and bankruptcy risk
(Nagano, 2003) has equally minimised their financial distress cost enabling firms to ignore any
benefits resulting from speedy adjustment of their leverage. Large firms have lower issuance costs
for both debt and equity, leading to a moderate speed of adjustment for large firms (Castro et al.,
2014, Lemma and Negash, 2014). Lemma and Negash (2014) argue that, due to minimal levels
of financial distress cost for larger firms, it will be unlikely that these firms will show any speedy
adjustment.
6.3.3 SOA Across Industry
Prior literature suggests that firms’ industrial affiliation may have an impact on their capital
structure decisions (DeAngelo and Masulis, 1980, Masulis, 1983, Harris and Raviv, 1991, Frank
and Goyal, 2009, MacKay and Phillips, 2005). DeAngelo and Masulis (1980), Bradley et al. (1984),
Harris and Raviv (1991) and Anwar (2013) suggested a unique leverage ratio among firms in a
particular industry. Pinkova and Riederova (2013) argue that firms seek to adjust to industry
averages as their target ratio.
However, these studies failed to discuss the SOA across industries. One of the major contributions
of the dynamic capital structure literature is the recognition that firms’ adjustment to optimal
leverage may vary across industries (Byoun, 2008, Castro et al., 2014).
The adjustment process is evident when λ is less than one but is greater than zero (1 > λ > 0) for
each industry and when there is meaningful statistical significance (i.e. P-value ≤ 0.05).
In order to examine the determinants (firm characteristics) of target leverage and the speed of
adjustment across different industries, the current study employed the one-step GMM system of
Arellano and Bover (1995) and Blundell and Bond (1998). The Wald test and Sargan test are also
employed to ensure the validity of the study findings.

119
Consistent with the study’s aims and objectives, the current study employed total leverage in the
estimation of adjustment speed across industry. The independent variables used are firm
characteristics, which, according to prior studies, have a significant effect in determining optimal
leverage across industry (Ozkan, 2001, Flannery and Rangan, 2006, Brendea, 2014, Haron, 2014,
Mangafić and Martinović, 2015)
The regression reports a positive coefficient of the lagged total leverage which is significant at 1 %
level for 9 industries and 5% percent level for the oil and gas industry and confirms the dynamic
debt adjustment policy across industries, except construction and real estate.
There is also considerable variation in the adjustment speed across different industries. Extremely
high SOA is found among oil and gas firms (83%), industrial goods firms (76%), computer and
information technology (74%) and natural resources (72%). In contrast, very low adjustment speed
is reported in the service sector (41%).
Furthermore, firms in conglomerates show moderate adjustment (68%), while firms in consumer
goods and health care sectors report SOA of 51% and 56% respectively, which is evidence of what
Ozkan (2001) called mid-way adjustment. This result confirms an absence of SOA homogeneity
across industry as reported by previous studies (Ozkan, 2001, Drobetz and Wanzenried, 2006,
Brendea, 2014, Abdeljawad et al., 2017). These varying adjustment speeds (extremely high, high,
moderate and low) confirm the variation of costs and benefits of adjustment across industry and
confirms the study’s hypothesis (H3a).
This varying SOA shows that firms’ industry has an impact on the firms’ capital structure and is in
line with previous studies (DeAngelo and Masulis, 1980, Masulis, 1983, Harris and Raviv, 1991,
Frank and Goyal, 2009, MacKay and Phillips, 2005, Roberts, 2002, Flannery and Rangan, 2006). A
similar finding was reported by Roberts (2002) who documented evidence of significant variation in
the adjustment speed to target leverage across industries. These differences may be as a result of
differences in costs and benefits of adjustment. The average SOA across 10 industries in the study

120
sample is 64.2%, which suggests a moderate overall adjustment speed. Similarly to the result of
Roberts (2002), the current study found significant variation in the adjustment speed across
industries.
The highest SOA (83%) is found in the oil and gas sector, meaning that 83% of the variation
between target and actual total leverage is achieved in this sector each year. This higher speed of
adjustment suggests that the cost of adjustment is very small in this sector, making it easier for firms
to speedily move to their target. It could also mean that the risk of being below their target leverage
is very high, or that the low long-term and short-term leverage ratio of oil and gas firms make it
necessary for these firms to avoid further costly deviation from target.
However, the slow adjustment speed of service sector firms (41%) shows that the adjustment cost
may be too high for firms in this sector. This confirms the findings of previous studies, which show
that the cost of adjustment may hinder a rapid adjustment speed (Flannery and Rangan, 2006,
Ozkan, 2001, Clark et al., 2008, Soekarno et al., 2015, Zhou et al., 2016b, Nunes and Serrasqueiro,
2017). Drobetz and Wanzenried (2006) suggest that, when a firm faces costly adjustment, it may
be beneficial to avoid full adjustment to target leverage irrespective of how far it is from its leverage
target.

121
For conglomerates, and construction and real estate firms, the lagged leverage is not significant,
showing the absence of adjustment behaviour. On the other hand, the relatively slow SOA of
consumer goods firms (51%) and firms in the healthcare sector (56%) could mean that both
adjustment cost and cost of deviation may be equal for these firms. Thus, increasing adjustment
speed may not be in the interest of the firm.
In contrast to the study of Flannery and Rangan (2006), who found that firms adjust slowly towards
their leverage targets, the current study documents evidence which shows the absence of a uniform
Table 6.1 : SOA Across Industries
Industry
NSE
CODE
Coef.Totlev/ Sig SOA
AGRICULTURE 01 .4226*** 58%
CONGLOMERATE 02 .3194*** 68%
CONSUMER GOODS 04 .4902*** 51%
HEALTH CARE 05 .4446*** 56%
COMPUTER/INFORMATION 06 .2570*** 74%
INDUSTRIAL GOODS 07 .2390*** 76%
NATURAL RESOURCES 08 .2766*** 72%
OIL AND GAS 09 .1656** 83%
SERVICES 10 .5950*** 41%
Note: NSE CODE=Nigerian stock exchange industrial classification code. SOA = Speed of
adjustment. *** shows highest level of significant at 0.01, while ** and * shows significance
at 5% and 10% respectively.
122
speed of adjustment across industries, in line with several studies (Dang et al., 2014, Faulkender
and Petersen, 2006, Abdeljawad et al., 2017). The result of this study shows a systematic difference
with regards to SOA across these industries and confirms the current study’s hypothesis (H3b).
This variation in SOA across industries in Nigeria may be due to differences in asset structure across
different industries. This is because the level of tangibility of assets will influence the ease of access
to both short-term and long-term debt finance in Nigeria, as reported in the main results. Muradoǧlu
Yaz Gulnur and Sivaprasad (2012) argue that different asset structures across various industries will
influence financing options. Kakilli Acaravci (2015) suggests that firms in manufacturing industries
will have more tangible assets and will use this as collateral to increase their debt ratio, unlike firms
in the service sector.
6.4 Financial Crisis and SOA
Prior studies have examined the impact of the financial crisis on the firms’ capital structure
decisions and found that firms’ borrowing capacity was negatively affected by diminished lending
and increased lending costs during the financial crisis (Harrison and Widjaja, 2014, Zeitun et al.,
2017, Ali and Afzal, 2012). Since Nigerian firms relied mostly on costly bank lending even before
the financial, it is, therefore, important to re-examine how the financial crisis affected firms’
adjustment behaviour for long-term and short-term leverage before and after the crisis.
Consequently, the study sample was split to reflect both the pre-financial crisis (2001- 2007) and
the post financial crisis (2010-2015) to understand how SOA of these two types of debt were
affected by these two separate periods.
The regression results presented in tables 5.5 and 5.6 show that the lagged long-term and short-term
leverage is statistically significant in the pre-financial crisis and post-financial crisis periods,
showing that firms’ adjustment behaviour is upheld both before and after the financial crisis. This
is in line with previous studies, which showed that firms adjust their leverage to a specific target

123
before and after a financial crisis (Harrison and Widjaja, 2014, Dang et al., 2014, Iqbal and Kume,
2015, Zeitun et al., 2017, Abdeljawad et al., 2017).
The adjustment speed for long-term leverage before the financial crisis was 55% and this increased
to 75 % immediately after the financial crisis, which means that the speed of adjustment was faster
after the financial crisis. This contradicts the study’s hypothesis (H4a), which predicts a lower SOA
after the financial crisis. The SOA for short-term leverage before the financial crisis is 68% and this
increases to 71 % immediately after the financial crisis, confirming the study hypothesis (H4b)
One possible explanation of this significantly higher speed of adjustment is the gap between the
actual and the target advantage. This is as a result of firms’ inability to reach their leverage target
during the peak of the financial crisis (Hackbarth et al., 2006), partly due to deterioration of their
collateral value (Kiyotaki and Moore, 1997) and limited bank lending during the crisis period.
Furthermore, this may be related to the reduced capital inflows during the financial crisis (Brambila‐
Macias and Massa, 2010, Allen and Giovannetti, 2011). The implication is the widening of the
financing gap, which is the difference between the actual and the target leverage immediately after
the financial crisis.
In the case of Nigerian non-financial firms, the significantly higher SOA after the crisis may also
be due to government support programmes after the crisis, which offer financial flexibility to firms
allowing them to increase their long-term and short-term obligations without incurring higher costs.
This may explain the speedier adjustment after the financial crisis. This financial support, given by
the Nigerian government, created a favourable atmosphere for firms and reduced the cost of debt,
making it easier for firms to close their financing gap. Dang et al. (2014) argue that firms’ financing
gap will be the most important consideration in their trade-off decisions. Other studies also show
that financially constrained firms may prefer speedy adjustments to close their financial gap (Byoun,
2008, Aybar-Arias et al., 2012, Dang et al., 2014).

124
6.5 Summary
This chapter examined the adjustment behaviour of Nigerian non-financial firms and found a
positive sign of the coefficient of lagged total leverage, which is statistically significant at a 1 %
level, confirming that these firms adjust their total leverage. The study’s result shows that the SOA
is 63% meaning that 63 % of the variation between target and actual total leverage is adjusted each
year. Since this is above midway, it could be described as a moderate adjustment speed.
The result of further analysis shows that there is adjustment behaviour irrespective of the degree of
indebtedness and size and, thus, confirms the dynamic nature of capital structure. Under-leveraged
firms have a slightly higher SOA when compared to over-leveraged firms, suggesting that the cost
to deviation from their target leverage may be higher. Furthermore, smaller firms adjust their
leverage faster than larger firms. (Harrison and Widjaja, 2014, Dang et al., 2014, Iqbal and Kume,
2015, Zeitun et al., 2017, Abdeljawad et al., 2017).
The adjustment speed for long-term leverage before the financial crisis is 55% and this increased to
75 % immediately after the financial crisis. Similarly, the SOA for short-term leverage before the
financial crisis is 68% and this increases to 71 % immediately after the financial crisis, meaning
that SOA was faster after the financial crisis.
.

125
Chapter Seven: Conclusion
7.1. Introduction
The study aims to examine the capital structure determinants and SOA of all listed, non-financial
firms in Nigeria taking into consideration the unique institutional environment of this West African
country. The objectives are; to investigate the relationship between firm characteristics and the
capital structure choice among non-financial firms listed on the Nigerian Stock Exchange, to
examine whether the financial crisis affected capital structure determinants. The study also
examines the speed of leverage adjustment (SOA) of Nigerian non-financial firms and the impact
of the financial crisis on the SOA. This study employs the trade-off and the pecking order theory as
the main study theories. The underlying issue in the pecking order theory is the reduction of
asymmetric information. Myers and Majluf (1984) and Myers (1984) argued that, to avoid the risk
of underinvestment, managers will fund their new investments using a pecking order of financing
whereby internally generated funds (retained earnings) are first used, then debt and finally equity
as the last option.
The trade-off theory is an attempt to relax the ‘no tax and bankruptcy cost’ assumptions of
Modigliani and Miller (1958b). This theory argues that a firm will ‘trade-off’ tax advantage and
other benefits associated with leverage against financial distress costs and other potential costs
resulting from a debt finance option (Bradley et al., 1984, Harris and Raviv, 1991, Graham and
Harvey, 2001). However, the static trade-off theory is highly focused on the idea of observed
leverage and ignores the dynamism involved in the capital structure decision (Drobetz and
Wanzenried, 2006). Consequently, this study uses a dynamic capital structure model which
recognises adjustment costs ignored by the static trade-off theory (Leary and Roberts, 2005,
Hennessy and Whited, 2005, Almeida and Philippon, 2007, Abdeljawad et al., 2017) and the long-

126
run leverage targets. It emphasises the possibility of gradual adjustment towards a leverage target
(Gaud et al., 2005, Hennessy and Whited, 2005, Haron, 2014, Yang et al., 2015).
7.2. Capital Structure Determinants of Non-financial firms in Nigeria.
The first objective of the current study is to examine firm level factors that determine capital
structure among listed non-financial firms in Nigeria. The findings relating to this objective are
presented in chapter 5.
Regarding capital structure determinants, the current study reports a positive and significant
correlation between profitability and the long-term leverage, which supports the assumption of the
trade-off theory. The theory suggests that tax deductibility of interest expense and a lower default
risk will result in higher debt ratios among profitable firms (Kraus and Litzenberger, 1973, Scott Jr,
1976). However, a negative and highly significant relationship exists between profitability and
short-term leverage, which is in line with the pecking order theory’s assumption that profitable
firms will rely more on their retained earnings and use debt only when internally generated fund is
unavailable or insufficient (Myers and Majluf, 1984).
Similarly, a negative and significant relationship was found between profitability and total leverage
and points to the dominance of pecking order behaviour among Nigerian non-financial firms. One
possible explanation of the negative relationship between profitability, short-term leverage and total
leverage is that Nigerian firms may show more preference for equity rather than debt because of its
relative costliness. The result also shows that asset tangibility is the most important capital structure
determinant for Nigerian listed firms, due to its positive and highly significant relationship with
both long-term and short-term leverage. This may be due to its role in reducing information gap
between borrowers and lenders (Myers and Majluf, 1984, Harris and Raviv, 1991), the reduction of
moral hazard (Di Patti and Dell'Ariccia, 2004) and its influence on the overall lending cost.
Furthermore, this study shows a negative and significant relationship between firm size and both

127
long- and short-term leverage and total leverage, meaning that as the size increases, the
attractiveness of debt financing decreases among these Nigerian firms. Rajan and Zingales (1995)
suggested that firm size may act as inverse proxy for the level of asymmetric information between
investors and managers. This may be interpreted as being in favour of the pecking order theory,
since studies that support firms’ usage of retained earnings show a negative association between
firm size and all types of leverage (Fama and French, 2002b, Drobetz and Fix, 2003a, Köksal and
Orman, 2015). In addition, firm growth shows a positive and significant relationship with long-term
and short-term leverage. Firm age is negatively and significantly associated with short-term and
long-term leverage.
Regarding liquidity, the study result shows a negative and significant relationship between liquidity
and long-term and total leverage.This is expected under pecking order assumptions since the
liquidity of firms’ assets may lead to a lower cost of equity, thereby making equity issuance more
likely than debt (Lipson and Mortal, 2009). However, for short-term leverage, a positive and
significant relationship with firm growth is reported, and implies that firms’ liquidity does not
reduce their short-term leverage. This may be justifiable, since short-term debt is only about one
third of the total leverage of Nigerian firms and is needed to boost firms’ financing options in such
an environment, where access to external debt finance is restricted due to an underdeveloped capital
market. This positive relationship also does not violate the pecking order assumption since short-
term debt has lower asymmetric information (Myers, 1977) and is, thus, preferred in the pecking
order of finance before long-term debt and equity.
Overall, in spite of the existence of adjustment behaviour, the whole result of the current study
presented in this chapter is interpreted in favour of the pecking order theory since the coefficient
sign of the majority of independent variables are based on its predictions. Shyam-Sunder and Myers
(1999) argued that the pecking order theory is not invalidated by the mere existence of target

128
leverage adjustment behaviour among firms, while Fama and French (2005) warned that it is
inappropriate to involve both theories in an empirical horse race.
Furthermore, the impact of the financial crisis on the capital structure determinants of Nigerian non-
financial firms was examined in this study. The study sample was split to reflect the pre-financial
crisis (2001- 2007) and post financial crisis (2010-2015) to understand how determinants of long-
term and short-term leverage vary, before and after the crisis. The positive relationship between
asset tangibility and leverage remain unchanged before and after the financial crisis. However, the
size of coefficient and significance level of most of the independent variables change after the
financial crisis.
7.3. SOA of Nigerian non-Financial firms
In Chapter 6, this study examines the SOA of Nigerian non-financial firms. The study’s result,
presented in table 5.4, shows that the SOA is 63%, which means that only 63 % of the variation
between target and actual total leverage is adjusted each year. This moderate adjustment is due to
their inability to acquire debt finance through the underdeveloped and illiquid Nigerian stock
exchange. This implies that the large adjustment coefficient, which is more than 0.5, is attributable
to the low level of public debt used by Nigerian firms.
On the impact of the degree of indebtedness on leverage, the results show that the SOA for over-
leveraged and under-leveraged firms are 70% and 75% respectively. This suggests that, for both,
the relatively high cost of deviation from their target leverage ratio may outweigh any possible
adjustment cost. The results show also that firm size will influence the SOA. The SOA for large
and small firms are 50% and 58% respectively, suggesting a slower leverage adjustment process for
both types of firm. The slightly higher SOA for small firms may be due to a higher proportion of
short-term leverage used by smaller firms when compared to larger firms.
129
The current study found varying (very high, high, moderate and low) speeds of adjustment across
10 industries identified in the study sample. The highest SOA is found among oil and gas firms
(83%), industrial goods firms (76%), computer and information technology (74%) and natural
resources (72%). High adjustment speed is reported for firms in construction and real estate (68%)
and conglomerates (63%) while moderate SOA is reported for consumer goods, and health care
sectors report SOA of 51% and 58% respectively. Low SOA is reported for service sector firms
(41%). The average SOA across 10 industries in the study sample is 64.2%, which suggests a
moderate overall adjustment speed. The variation in the speed of adjustment is due to differences
in the cost and benefits of adjustment across industries and confirms the impact of firms’ industrial
affiliation in their capital structure decisions, as suggested by prior capital structure literature
(DeAngelo and Masulis, 1980, Masulis, 1983, Harris and Raviv, 1991, Frank and Goyal, 2009,
MacKay and Phillips, 2005, Roberts, 2002, Flannery and Rangan, 2006).
Finally, the impact of the financial crisis on SOA was investigated by the current study. The result
shows that the adjustment speed for long-term leverage before the financial crisis was 55%, this
increased to 75 % immediately after the financial crisis. This implies that the speed of adjustment
is faster after a financial crisis. The SOA for short-term leverage before the financial crisis is 68%,
and this increases to 71 % immediately after the financial crisis. Overall, the study result shows that
Nigerian non-financial firms show speedier leverage adjustment after a financial crisis.

130
Table 7.1 Key Findings of Capital Structure Determinants
Total Leverage Short-Term Leverage Long-Term Leverage
Profitability Negative Negative Positive
Asset Tangibility Positive Positive Positive
Size Negative Negative Negative
Growth Positive Positive Positive
Age Negative Negative Negative
Risk Positive Positive Positive
Liquidity Negative Negative Positive
TOTLEV= Total leverage, measured as total debt over total assets. LTLEV = Long-term
leverage, measured as long-term debt over total assets. STLEV = Short-term leverage, measured
as short-term debt over total assets. L1= Lagged value of the dependent variable. PROF =
Profitability, measured as the ratio of operating profit to the total assets’ book value. ASTANG =
Asset tangibility, measured as ratio of fixed asset to total asset. SIZE = Firm size, measured as
natural log of sales. GROWTH = Firm growth, measured as percentage change in revenues. AGE
= Firm Age, measured as the number of years in the business. RISK = Business risk,measured as
the standard deviation of return on assets. LIQUID = Liquidity, measured as the ratio of current
assets to current liability.

131
Nigerian Stock Exchange (NSE) classified firms into 12 different
industries. However, this study excludes financial service and utility
firms. ADJUST SPEED is the speed of adjustment and is achieved by
subtracting the coefficient of lagged total debt (L1) from 1. In GMM, first
level autocorrelation is normal. The validity of instruments is confirmed
when the P value of the Sargan test is greater than .05.
Table 7.2 Key Findings of SOA Adjustment Speed (%)
Overall SOA 63%
Agriculture 58%
Conglomerate 68%
Consumer goods 51%
Health care 56%
Computer/information 74%
Industrial goods 76%
Natural resources 72%
Oil and gas 83%

132
7.4. The Study’s Implications
The underdeveloped capital market in Nigeria and the competition with commercial banks has led
to a reliance of firms on bank lending as the major source of finance. This dominance of bank
lending has also led to an increasing importance of collateral in lending decisions. As seen in the
study’s results, lenders in Nigeria will demand tangible assets as collateral to secure both their long-
term and short-term assets and to minimise the overall risk of lending in such an environment
marked by limited protection for lenders. However, there is need for a diversified financial system
enabling firms to acquire part of their finance through the bond market to restore market discipline.
This development may be related to the adoption of pecking order behaviour, whereby firms used
internal resources before debt and equity to reduce the high cost of borrowing long-term and short-
term debt from commercial banks. The low level of short-term debt of these firms and their high
adjustment speed suggest that Nigerian firms are not able to take advantage of short-term lending
to close their financial gap. This is expected given the weak institutional environment in Nigeria.
Furthermore, the difference in SOA of 63 reported in this study and that of other studies conducted
in Spain (De Miguel and Pindado, 2001) and Switzerland (Drobetz and Fix, 2003a), where firms
use bank lending, show that, unlike in these developed countries, the cost of bank lending in Nigeria
is hindering firms’ SOA.
Due to the variation in asymmetric information and agency problems in many developing countries,
care should be taken when embarking on a cross-cultural study. This means that it may be relevant
to focus on firms in a particular country to better examine factors that affect its capital structure.
It is also important to be specific about the type of leverage analysed, since the signs of most
coefficients reported in this study change depending on the type of debt considered. This confirms
the empirical findings of Bevan and Danbolt (2002).

133
7.5. Limitations of the Study and Suggestion for Future Research
This study examined the firm characteristics that influence capital structure decisions among
Nigerian firms. However, many studies have also suggested the impact of firms’ institutional
environment on firms’ capital structure decisions (Öztekin and Flannery, 2012, Gwatidzo and Ojah,
2014). Since this study is based on capital structure decisions of firms in Nigeria, it ignored the
impact of the legal, political and regulatory environment on firms’ capital structure which, when
added to firm-level determinants, may have given a better understanding of factors influencing the
financing behaviour of Nigerian firms. For instance, it is possible that corruption will explain the
capital structure of non-financial firms in Nigeria. Hence, the impact of corruption on the financing
decision of Nigerian firms may be worthwhile to examine in the future.
In addition, prior studies suggested that corporate governance characteristics may affect firms’
capital structure (Wen et al., 2002, Bokpin and Arko, 2009, Morellec et al., 2012, Chang et al.,
2014) suggesting that leverage ratio may depend on the governance structure in place. This issue is
not taken into consideration by the current study.
Due to the unavailability of data, this study considered only listed Nigerian firms. However, the
majority of Nigerian firms are not listed and, if added, could provide further evidence on firms
financing decisions in Nigeria. There is also a possibility of significant variation in financing
behaviour between unlisted and listed firms. Therefore, this may be an area for future research to
gain better understanding of the capital structure decisions of Nigerian firms.
.

134
REFERENCES
ABDELJAWAD, I., ABDELJAWAD, I., MAT NOR, F. & MAT NOR, F. 2017. The capital
structure dynamics of Malaysian firms: timing behavior vs adjustment toward the target.
International Journal of Managerial Finance, 13, 226-245.
ABOR, J. 2008. Determinants of the capital structure of Ghanaian firms. African Economic
Research Consortium Nairobi.
ABOR, J. & BIEKPE, N. 2006. Small business financing initiatives in Ghana. Problems and
Perspectives in Management, 4, 69-77.
ABOR, J. & BIEKPE, N. 2009. How do we explain the capital structure of SMEs in sub-Saharan
Africa? Evidence from Ghana. Journal of Economic Studies, 36, 83-97.
ABU MOUAMER, F. M. 2011. The determinants of capital structure of Palestine-listed companies.
The Journal of Risk Finance, 12, 226-241.
ACS, Z. & ISBERG, C. 1996. Capital structure, asset specificity, and firm size: A transaction cost
analysis. Behavioral norms, technological progress, and economic dynamics, 285-298.
ADESOLA, W. 2009. Testing static tradeoff theory against pecking order models of capital
structure in Nigerian quoted firms. Global Journal of Social Sciences, 8, 51.
AGARWAL, S. & MOHTADI, H. 2004. Financial markets and the financing choice of firms:
Evidence from developing countries. Global Finance Journal, 15, 57-70.
AGGARWAL, D. & PADHAN, P. C. 2017. Impact of Capital Structure on Firm Value: Evidence
from Indian Hospitality Industry. Theoretical Economics Letters, 7, 982.
AGLIARDI, E., AGLIARDI, R. & SPANJERS, W. 2016. Corporate financing decisions under
ambiguity: Pecking order and liquidity policy implications. Journal of Business Research,
69, 6012-6020.
AHMAD, R. & ETUDAIYE-MUHTAR, O. F. 2017. Dynamic Model of Optimal Capital Structure:
Evidence from Nigerian Listed Firms. Global Business Review, 18, 590-604.

135
AHMED SHEIKH, N. & WANG, Z. 2011. Determinants of capital structure: An empirical study
of firms in manufacturing industry of Pakistan. Managerial Finance, 37, 117-133.
AHMETI, F. & PRENAJ, B. 2015. A Critical Review of Modigliani and Miller’s Theorem of
Capital Structure.
AKBAR, S., UR REHMAN, S. & ORMROD, P. 2013. The impact of recent financial shocks on
the financing and investment policies of UK private firms. International Review of
Financial Analysis, 26, 59-70.
AKDAL, S. 2011. How do firm characteristics affect capital structure? Some UK evidence. Some
UK Evidence (March 3, 2011).
AKHTAR, S. 2005. The determinants of capital structure for Australian multinational and domestic
corporations. Australian journal of management, 30, 321-341.
AKINLO, O. 2011. Determinants of capital structure: Evidence from Nigerian panel data. African
Economic and Business Review, 9, 1-16.
AKINYOMI, O. J. & OLAGUNJU, A. 2013. Determinants of capital structure in Nigeria.
International Journal of Innovation and Applied Studies, 3, 999-1005.
AL-NAJJAR, B. 2011. Empirical modelling of capital structure: Jordanian evidence. Journal of
Emerging Market Finance, 10, 1-19.
AL-NAJJAR, B. & HUSSAINEY, K. 2011. Revisiting the capital-structure puzzle: UK evidence.
The Journal of Risk Finance, 12, 329-338.
AL-NAJJAR, B. & TAYLOR, P. 2008. The relationship between capital structure and ownership
structure: New evidence from Jordanian panel data. Managerial Finance, 34, 919-933.
AL‐NAJJAR, B. 2011. The inter‐relationship between capital structure and dividend policy:
empirical evidence from Jordanian data. International Review of Applied Economics, 25,
209-224.

136
ALI, R. & AFZAL, M. 2012. Impact of global financial crisis on stock markets: Evidence from
Pakistan and India. Journal of Business Management and Economics, 3, 275-282.
ALIYU, A. A., BELLO, M. U., KASIM, R. & MARTIN, D. 2014. Positivist and Non-Positivist
Paradigm in Social Science Research: Conflicting Paradigms or Perfect Partners? Journal
of Management and Sustainability, 4, 79.
ALLEN, F. & GIOVANNETTI, G. 2011. The effects of the financial crisis on Sub-Saharan Africa.
Review of Development Finance, 1, 1-27.
ALLINI, A., RAKHA, S., MCMILLAN, D. G. & CALDARELLI, A. 2018. Pecking order and
market timing theory in emerging markets: The case of Egyptian firms. Research in
International Business and Finance, 44, 297-308.
ALMEIDA, H. & PHILIPPON, T. 2007. The risk‐adjusted cost of financial distress. The Journal
of Finance, 62, 2557-2586.
ALTMAN, E. I. 1984. A further empirical investigation of the bankruptcy cost question. Journal
of finance, 1067-1089.
ALZOMAIA, T. S. 2014. Capital structure determinants of publicly listed companies in Saudi
Arabia. The International Journal of Business and Finance Research, 8, 53-67.
ANDERLONI, L. & TANDA, A. 2014. The Determinants of Leverage: A Comparative Analysis.
Journal of Economics & Management, 18, 195.
ANDERSON, R. & CARVERHILL, A. 2007. Liquidity and capital structure.
ANDERSON, T. W. & HSIAO, C. 1982. Formulation and estimation of dynamic models using
panel data. Journal of econometrics, 18, 47-82.
ANGEN, M. J. 2000. Evaluating interpretive inquiry: Reviewing the validity debate and opening
the dialogue. Qualitative health research, 10, 378-395.

137
ANTONIOU, A., GUNEY, Y. & PAUDYAL, K. 2008. The determinants of capital structure:
capital market-oriented versus bank-oriented institutions. Journal of financial and
quantitative analysis, 43, 59-92.
ANWAR, W. 2013. Cross-industry determinants of capital structure: Evidence from Pakistani data.
African Journal of Business Management, 7, 1625.
ARDALAN, K. 2017. Capital structure theory: Reconsidered. Research in International Business
and Finance, 39, 696-710.
ARELLANO, M. & BOND, S. 1991. Some tests of specification for panel data: Monte Carlo
evidence and an application to employment equations. The review of economic studies, 58,
277-297.
ARELLANO, M. & BOVER, O. 1995. Another look at the instrumental variable estimation of
error-components models. Journal of econometrics, 68, 29-51.
ARGHODE, V. 2012. Qualitative and Quantitative Research: Paradigmatic Differences. Global
Education Journal, 2012.
ARIFF, M., TAUFIQ, H. & SHAMSHER, M. 2008. How capital structure adjusts dynamically
during financial crises.
ARTIKIS, G. P., ERIOTIS, N., VASILIOU, D. & VENTOURA-NEOKOSMIDI, Z. 2007. How
firm characteristics affect capital structure: an empirical study. Managerial Finance, 33,
321-331.
AVIRAL, K. T. & RAVEESH, K. 2015. Determinants of Capital Structure: A Quantile Regression
Analysis. Studies in Business and Economics, 10, 16-34.
AYBAR-ARIAS, C., CASINO-MARTÍNEZ, A. & LÓPEZ-GRACIA, J. 2012. On the adjustment
speed of SMEs to their optimal capital structure. Small business economics, 39, 977-996.
BABBIE, E. R. 2013. The basics of social research, Cengage Learning.
138
BAKER, M. & WURGLER, J. 2002. Market timing and capital structure. The journal of finance,
57, 1-32.
BALAKRISHNAN, S. & FOX, I. 1993. Asset specificity, firm heterogeneity and capital structure.
Strategic Management Journal, 14, 3-16.
BALTACI, N. & AYAYDIN, H. 2014. Firm, country and macroeconomic determinants of capital
structure: Evidence from Turkish banking sector. Emerging markets journal, 3, 47.
BANCEL, F. & MITTOO, U. R. 2004. Cross-country determinants of capital structure choice: a
survey of European firms. Financial Management, 103-132.
BANERJEE, A. & DE, A. An empirical study on the determinants of capital structure in Indian
Cement Industry in Pre and Post period of Recession. Business and Information
Management (ICBIM), 2014 2nd International Conference on, 2014. IEEE, 104-107.
BANERJEE, S., HESHMATI, A. & WIHLBORG, C. 1999. The dynamics of capital structure,
New York University-Salomon Center-Leonard N. Stern School of Business.
BARCLAY, M. J. & SMITH, C. W. 2005. The capital structure puzzle: The evidence revisited.
Journal of Applied Corporate Finance, 17, 8-17.
BARNEA, A., HAUGEN, R. A. & SENBET, L. W. 1980. A rationale for debt maturity structure
and call provisions in the agency theoretic framework. The Journal of Finance, 35, 1223-
1234.
BARTON, S. L., HILL, N. C. & SUNDARAM, S. 1989. An empirical test of stakeholder theory
predictions of capital structure. Financial Management, 36-44.
BAS, T. 2012. Capital structure and debt maturity choices of firms in developing countries. City
University London.
BASKIN, J. 1989. An empirical investigation of the pecking order hypothesis. Financial
management, 26-35.

139
BASSEY, N. E., ARENE, C. & OKPUKPARA, B. 2014. Determinants of Capital Structure of
Listed Agro Firms in Nigeria. Economic Affairs, 59, 35.
BASU, K. 2015. Market Imperfections and Optimal Capital Structure: Evidence from Indian Panel
Data. Global Business Review, 16, 61-83.
BATTEN, J. & HETTIHEWA, S. 1999. Small firm behaviour in Sri Lanka. Small Business
Economics, 13, 201-217.
BELKHIR, M., MAGHYEREH, A. & AWARTANI, B. 2016. Institutions and corporate capital
structure in the MENA region. Emerging Markets Review, 26, 99-129.
BELL, E. & BRYMAN, A. 2007. The ethics of management research: an exploratory content
analysis. British Journal of Management, 18, 63-77.
BERG, B. L. 2004. METHODS FOR THE SOCIAL, SCIENCES.
BERGER, A. N. & UDELL, G. F. 1998. The economics of small business finance: The roles of
private equity and debt markets in the financial growth cycle. Journal of Banking &
Finance, 22, 613-673.
BERGER, A. N. & UDELL, G. F. 2006. A more complete conceptual framework for SME finance.
Journal of Banking & Finance, 30, 2945-2966.
BERGLÖF, E. & VON THADDEN, E.-L. 1994. Short-term versus long-term interests: Capital
structure with multiple investors. The Quarterly Journal of Economics, 1055-1084.
BERKMAN, A. N., ISKENDEROGLU, O., KARADENIZ, E. & AYYILDIZ, N. 2016.
Determinants of Capital Structure: The Evidence from European Energy Companies.
International Journal of Business Administration, 7, 96.
BEVAN, A. A. & DANBOLT, J. 2000. Dynamics in the determinants of capital structure in the
UK.
BEVAN, A. A. & DANBOLT, J. 2002. Capital structure and its determinants in the UK-a
decompositional analysis. Applied Financial Economics, 12, 159-170.

140
BHADURI, S. N. 2002. Determinants of capital structure choice: a study of the Indian corporate
sector. Applied Financial Economics, 12, 655-665.
BHAMA, V., JAIN, P. K. & YADAV, S. S. 2016. Testing the pecking order theory of deficit and
surplus firms: Indian evidence. International Journal of Managerial Finance, 12, 335-350.
BHAMA, V., JAIN, P. K. & YADAV, S. S. 2017. Pecking Order among Select Industries from
India and China. Vision, 21, 63-75.
BHARATH, S. T., PASQUARIELLO, P. & WU, G. 2008. Does asymmetric information drive
capital structure decisions? The Review of Financial Studies, 22, 3211-3243.
BLUNDELL, R. & BOND, S. 1998. Initial conditions and moment restrictions in dynamic panel
data models. Journal of econometrics, 87, 115-143.
BOKPIN, G. A. & ARKO, A. C. 2009. Ownership structure, corporate governance and capital
structure decisions of firms: Empirical evidence from Ghana. Studies in Economics and
Finance, 26, 246-256.
BOND, S. R. 2002. Dynamic panel data models: a guide to micro data methods and practice.
Portuguese economic journal, 1, 141-162.
BOOTH, L., AIVAZIAN, V., DEMIRGUC-KUNT, A. & MAKSIMOVIC, V. 2001a. Capital
structures in developing countries. Journal of finance, 87-130.
BOOTH, L., AIVAZIAN, V., DEMIRGUC‐KUNT, A. & MAKSIMOVIC, V. 2001b. Capital
structures in developing countries. The journal of finance, 56, 87-130.
BOWMAN, R. G. 1980. The importance of a market-value measurement of debt in assessing
leverage. Journal of Accounting Research, 242-254.
BRADLEY, M., JARRELL, G. A. & KIM, E. 1984. On the existence of an optimal capital
structure: Theory and evidence. The journal of Finance, 39, 857-878.
BRAILSFORD, T. J., OLIVER, B. R. & PUA, S. L. 2002. On the relation between ownership
structure and capital structure. Accounting & Finance, 42, 1-26.

141
BRAMBILA‐MACIAS, J. & MASSA, I. 2010. The global financial crisis and Sub‐Saharan Africa:
the effects of slowing private capital inflows on growth. African Development Review, 22,
366-377.
BRAU, J. C. & FAWCETT, S. E. 2006. Initial public offerings: An analysis of theory and practice.
The Journal of Finance, 61, 399-436.
BRENDEA, G. 2014. Financing behavior of Romanian listed firms in adjusting to the target capital
structure. Finance a Uver - Czech Journal of Economics and Finance, 64, 312-329.
BRENNAN, M. J. & KRAUS, A. 1984. Notes on Costless Financial Signalling. Risk and Capital.
Springer.
BRICK, I. E. & PALMON, O. 1992. Interest Rates Fluctuations and the Advantage of Long‐Term
Debt Financing: A Note on the Effect of the Tax‐Timing Option. Financial Review, 27,
467-474.
BRUSOV, P., FILATOVA, T., OREHOVA, N., BRUSOV, P. & BRUSOVA, N. 2011. From
Modigliani–Miller to general theory of capital cost and capital structure of the company.
Research Journal of Economics, Business and ICT, 2.
BRYMAN, A. 1984. The debate about quantitative and qualitative research: a question of method
or epistemology? British journal of Sociology, 75-92.
BRYMAN, A. & BELL, E. 2003. Breaking down the quantitative/qualitative divide. Business
Research Methods, 465-478.
BURRELL, G. & MORGAN, G. 1979. Social paradigms and organizational analysis: Elements of
the sociology of corporate life. London: Heinemann Educational.
BUVANENDRA, S., SRIDHARAN, P. & THIYAGARAJAN, S. 2017. Firm characteristics,
corporate governance and capital structure adjustments: A comparative study of listed firms
in Sri Lanka and India. IIMB Management Review, 29, 245-258.

142
BYOUN, S. 2008. How and when do firms adjust their capital structures toward targets? The
Journal of Finance, 63, 3069-3096.
BYRNE, M. M. 2001. Linking philosophy, methodology, and methods in qualitative research.
Association of Operating Room Nurses. AORN Journal, 73, 207.
BYSTRYAKOV, A. Y., BLOKHINA, T. K., SAVENKOVA, E. V., KARPENKO, O. A. &
PONOMARENKO, E. V. 2018. Modelling an optimal capital structure of the
telecommunication company. Advances in Intelligent Systems and Computing.
CAMPELLO, M. & GIAMBONA, E. 2010. Asset tangibility and capital structure. Working paper,
University of Illinois.
CAMPELLO, M., GRAHAM, J. R. & HARVEY, C. R. 2010. The real effects of financial
constraints: Evidence from a financial crisis. Journal of financial Economics, 97, 470-487.
CARDONE RIPORTELLA, C. & CASASOLA, M. J. 2003. What do we know about the financial
behaviour of the Spanish SME?: an empirical analysis.
CAREY, J. W. 1993. Linking qualitative and quantitative methods: Integrating cultural factors into
public health. Qualitative Health Research, 3, 298-318.
CARTER, S. M. & LITTLE, M. 2007. Justifying knowledge, justifying method, taking action:
Epistemologies, methodologies, and methods in qualitative research. Qualitative health
research, 17, 1316-1328.
CASSAR, G. 2004. The financing of business start-ups. Journal of business venturing, 19, 261-
283.
CASSAR, G. & HOLMES, S. 2003. Capital structure and financing of SMEs: Australian evidence.
Accounting & Finance, 43, 123-147.
CASTANIAS, R. 1983. Bankruptcy risk and optimal capital structure. The Journal of Finance, 38,
1617-1635.

143
CASTRO, P., TASCÓN FERNÁNDEZ, M. T., AMOR-TAPIA, B. & DE MIGUEL, A. 2014.
Target leverage and speed of adjustment along the life cycle of European listed firms. BRQ
Business Research Quarterly.
CHAKLADER, B. & JAISINGHANI, D. 2017. Testing dynamic trade-off theory of capital
structure: An empirical study for the textiles industry in India and China. Afro-Asian
Journal of Finance and Accounting, 7, 378-401.
CHANG, R. P. & RHEE, S. G. 1990. The impact of personal taxes on corporate dividend policy
and capital structure decisions. Financial Management, 21-31.
CHANG, Y.-K., CHOU, R. K. & HUANG, T.-H. 2014. Corporate governance and the dynamics
of capital structure: New evidence. Journal of Banking & Finance, 48, 374-385.
CHARALAMBAKIS, E. & PSYCHOYIOS, D. 2012. What do we know about capital structure?
Revisiting the impact of debt ratios on some firm-specific factors. Applied Financial
Economics, 22, 1727-1742.
CHEN, J. 2017. Modigliani and Miller Propositions: The Scope of Their Applicability.
CHEN, J. J. 2004. Determinants of capital structure of Chinese-listed companies. Journal of
Business research, 57, 1341-1351.
CHITTENDEN, F., HALL, G. & HUTCHINSON, P. 1996. Small firm growth, access to capital
markets and financial structure: Review of issues and an empirical investigation. Small
Business Economics, 8, 59-67.
CHOWDHURY, A. & CHOWDHURY, S. P. 2010. Impact of capital structure on firm's value:
Evidence from Bangladesh. Business & Economic Horizons, 3.
CHRISTIANS, C. G. & CAREY, J. W. 1989. The logic and aims of qualitative research. Research
methods in mass communication, 354-374.
CHUNG, K. H. 1993. Asset characteristics and corporate debt policy: An empirical test. Journal
of Business Finance & Accounting, 20, 83-98.

144
CLARK, B. J., FRANCIS, B. B. & HASAN, I. 2008. Do firms adjust toward target capital
structures? Some international evidence.
COLLIS, J. & HUSSEY, R. 2009. Business Research (3: e uppl.). Hampshire: Palgrave
Macmillian.
CONNELLY, B. L., CERTO, S. T., IRELAND, R. D. & REUTZEL, C. R. 2011. Signaling theory:
A review and assessment. Journal of Management, 37, 39-67.
COOK, D. O. & TANG, T. 2010. Macroeconomic conditions and capital structure adjustment
speed. Journal of Corporate Finance, 16, 73-87.
CORNELLI, F., PORTES, R. & SHAFFER, M. E. 1996. The capital structure of firms in Central
and Eastern Europe.
COSH, A. & HUGHES, A. 1994. Size, financial structure and profitability: UK companies in the
1980s.
COTEI, C. & FARHAT, J. B. 2009. The trade-off theory and the pecking order theory: are they
mutually exclusive? Available at SSRN 1404576.
CRANEY, T. A. & SURLES, J. G. 2002. Model-dependent variance inflation factor cutoff values.
Quality Engineering, 14, 391-403.
ČRNIGOJ, M. & MRAMOR, D. 2009. Determinants of capital structure in emerging European
economies: evidence from Slovenian firms. Emerging Markets Finance and Trade, 45, 72-
89.
CUSTÓDIO, C., FERREIRA, M. A. & LAUREANO, L. 2013. Why are US firms using more
short-term debt? Journal of Financial Economics, 108, 182-212.
D’MELLO, R. & MIRANDA, M. 2010. Long-term debt and overinvestment agency problem.
Journal of Banking & Finance, 34, 324-335.
DALBOR, M. C. & UPNEJA, A. 2002. Factors affecting the long-term debt decision of restaurant
firms. Journal of Hospitality & Tourism Research, 26, 422-432.

145
DANG, V., GARRETT, I. & NGUYEN, C. 2011. Asymmetric partial adjustment toward target
leverage: international evidence. Unpublished Manuscript, University of Manchester.
DANG, V. A. & GARRETT, I. 2015. On corporate capital structure adjustments. Finance Research
Letters, 14, 56-63.
DANG, V. A., KIM, M. & SHIN, Y. 2012. Asymmetric capital structure adjustments: New
evidence from dynamic panel threshold models. Journal of Empirical Finance, 19, 465-
482.
DANG, V. A., KIM, M. & SHIN, Y. 2014. Asymmetric adjustment toward optimal capital
structure: Evidence from a crisis. International Review of Financial Analysis, 33, 226-242.
DASZYNSKA-ZYGADLO, K., SZPULAK, A. & SZPULAK, A. 2012. THE DETERMINANTS
OF CORPORATE DEBT RATIOS IN CHOSEN EUROPEAN COUNTRIES. Economics
and Management, 17, 62-68.
DE MIGUEL, A. & PINDADO, J. 2001. Determinants of capital structure: new evidence from
Spanish panel data. Journal of corporate finance, 7, 77-99.
DEANGELO, H. & MASULIS, R. W. 1980. Optimal capital structure under corporate and personal
taxation. Journal of financial economics, 8, 3-29.
DEESOMSAK, R., PAUDYAL, K. & PESCETTO, G. 2004. The determinants of capital structure:
evidence from the Asia Pacific region. Journal of multinational financial management, 14,
387-405.
DEGRYSE, H., DE GOEIJ, P. & KAPPERT, P. 2009. The impact of firm and industry
characteristics on small firms' capital structure: Evidence from Dutch panel data.
DEGRYSE, H., DE GOEIJ, P. & KAPPERT, P. 2012. The impact of firm and industry
characteristics on small firms’ capital structure. Small Business Economics, 38, 431-447.
DELCOURE, N. 2007. The determinants of capital structure in transitional economies.
International Review of Economics & Finance, 16, 400-415.

146
DEVOS, E., RAHMAN, S. & TSANG, D. 2017. Debt covenants and the speed of capital structure
adjustment. Journal of Corporate Finance, 45, 1-18.
DI PATTI, E. B. & DELL'ARICCIA, G. 2004. Bank competition and firm creation. Journal of
Money, Credit and Banking, 225-251.
DIAMOND, D. W. 1989. Reputation acquisition in debt markets. The Journal of Political
Economy, 828-862.
DONALDSON, G. 1961. Corporate debt capacity.
DROBETZ, W. & FIX, R. 2003a. What are the determinants of the capital structure? Some
evidence for Switzerland. WWZ/department of finance, working paper, 1-37.
DROBETZ, W. & FIX, R. 2003b. What are the determinants of the capital structure? Some
evidence for Switzerland. University of Basel. WWZ/Department of Finance, Working
Paper, 4, 51-75.
DROBETZ, W. & WANZENRIED, G. 2006. What determines the speed of adjustment to the target
capital structure? Applied Financial Economics, 16, 941-958.
DUFOUR, D., LUU, P. & TELLER, P. 2018. The influence of cash flow on the speed of adjustment
to the optimal capital structure. Research in International Business and Finance, 45, 62-71.
EBEL EZEOHA, A. 2008. Firm size and corporate financial-leverage choice in a developing
economy: Evidence from Nigeria. The Journal of Risk Finance, 9, 351-364.
ELDOMIATY, T. I. 2008. Determinants of corporate capital structure: evidence from an emerging
economy. International Journal of Commerce and Management, 17, 25-43.
ELDOMIATY, T. I., BADAWY, A. & FIKRI, A. 2014. Firm-specific, industry-wide and country-
wide determinants of corporate capital structure. International Journal of Economics and
Business Research, 8, 93-124.
ETHRIDGE, J. & CORBIN, D. 1996. The Move to Market Values in Accounting for Debt and
Equity Securities. National Public Accountant, 41, 30-33.
147
FAMA, E. F. & FRENCH, K. R. 2002a. Testing trade-off and pecking order predictions about
dividends and debt. Review of financial studies, 15, 1-33.
FAMA, E. F. & FRENCH, K. R. 2002b. Testing trade‐off and pecking order predictions about
dividends and debt. Review of financial studies, 15, 1-33.
FAMA, E. F. & FRENCH, K. R. 2005. Financing decisions: who issues stock? Journal of financial
economics, 76, 549-582.
FAMA, E. F. & JENSEN, M. C. 1983. Separation of ownership and control. The Journal of Law
& Economics, 26, 301-325.
FAN, J. P., TITMAN, S. & TWITE, G. 2012. An international comparison of capital structure and
debt maturity choices. Journal of Financial and quantitative Analysis, 47, 23-56.
FAULKENDER, M., FLANNERY, M., HANKINS, K. & SMITH, J. 2010. Transaction costs and
capital structure adjustments. Journal of Women s Health.
FAULKENDER, M., FLANNERY, M. J., HANKINS, K. W. & SMITH, J. M. 2012. Cash flows
and leverage adjustments. Journal of Financial Economics, 103, 632-646.
FAULKENDER, M. & PETERSEN, M. A. 2006. Does the source of capital affect capital
structure? Review of financial studies, 19, 45-79.
FERRI, M. G. & JONES, W. H. 1979. Determinants of financial structure: A new methodological
approach. The Journal of Finance, 34, 631-644.
FLANNERY, M. J. & HANKINS, K. W. 2007. A Theory of Capital Structure Adjustment Speed
(Working Paper, University of Florida, United States).
FLANNERY, M. J. & RANGAN, K. P. 2006. Partial adjustment toward target capital structures.
Journal of financial economics, 79, 469-506.
FORTE, D., BARROS, L. A. & NAKAMURA, W. T. 2013. Determinants of the capital structure
of small and medium sized Brazilian enterprises. BAR-Brazilian Administration Review,
10, 347-369.

148
FRANK, M. Z. & GOYAL, V. K. 2003. Testing the pecking order theory of capital structure.
Journal of financial economics, 67, 217-248.
FRANK, M. Z. & GOYAL, V. K. 2007. Trade-off and pecking order theories of debt. Available at
SSRN 670543.
FRANK, M. Z. & GOYAL, V. K. 2009. Capital structure decisions: which factors are reliably
important? Financial management, 38, 1-37.
FRIEDER, L. & MARTELL, R. 2006. Capital structure and equity liquidity: A bi-directional
relationship. Unpublished Working Paper, Purdue University.
FURLONG, P. & MARSH, D. 2010. A skin not a sweater: Ontology and epistemology in political
science. Theory and methods in political science, 184-211.
GAUD, P., JANI, E., HOESLI, M. & BENDER, A. 2005. The capital structure of Swiss companies:
an empirical analysis using dynamic panel data. European Financial Management, 11, 51-
69.
GELO, O., BRAAKMANN, D. & BENETKA, G. 2008. Quantitative and qualitative research:
Beyond the debate. Integrative psychological and behavioral science, 42, 266-290.
GEPHART, R. P. 2004. Qualitative research and the Academy of Management Journal. Academy
of Management Journal, 47, 454-462.
GETZMANN, A., LANG, S. & SPREMANN, K. 2014. Target capital structure and adjustment
speed in asia. Asia-Pacific Journal of Financial Studies, 43, 1-30.
GOERTZ, G. & MAHONEY, J. 2012. A tale of two cultures: Qualitative and quantitative research
in the social sciences, Princeton University Press.
GÓMEZ, A. P., CASTRO, G. Á. & ORTEGA, M. F. 2016. Determinants of leverage in mining
companies, empirical evidence for Latin American countries. Contaduría y Administración,
61, 26-40.

149
GRAHAM, J. R. 2000. How big are the tax benefits of debt? The Journal of Finance, 55, 1901-
1941.
GRAHAM, J. R. & HARVEY, C. R. 2001. The theory and practice of corporate finance: Evidence
from the field. Journal of financial economics, 60, 187-243.
GREEN, W. H. 2008. Discrete choice modelling. Handbook of Econometrics, 2.
GREENE, W. 2002. Alternative panel data estimators for stochastic frontier models. Unpublished
manuscript (Septemebr 1, 2002), Department of Economics, New York University.
GREENWOOD, J. & JOVANOVIC, B. 1990. Financial development, growth, and the distribution
of income. Journal of political Economy, 98, 1076-1107.
GREGORY, B. T., RUTHERFORD, M. W., OSWALD, S. & GARDINER, L. 2005. An empirical
investigation of the growth cycle theory of small firm financing. Journal of Small Business
Management, 43, 382-392.
GREWAL, R., COTE, J. A. & BAUMGARTNER, H. 2004. Multicollinearity and measurement
error in structural equation models: Implications for theory testing. Marketing Science, 23,
519-529.
GROSSMAN, S. J. & HART, O. D. 1982. Corporate financial structure and managerial incentives.
The economics of information and uncertainty. University of Chicago Press.
GRUBER, M. J. & WARNER, J. B. 1977. Bankruptcy costs: Some evidence. The journal of
Finance, 32, 337-347.
GUBA, E. G. & LINCOLN, Y. S. 1994. Competing paradigms in qualitative research. Handbook
of qualitative research, 2, 105.
GUEDES, J. & OPLER, T. 1996. The determinants of the maturity of corporate debt issues. the
Journal of Finance, 51, 1809-1833.
GUERARD JR, J. B. & SCHWARTZ, E. 2007. Long-Term Debt. Quantitative Corporate Finance.
Springer.

150
GUJARATI, D. 2003a. Basic Econometrics Fourth Edition McGraw Hill Gujarati, DN,(2003).
Basic Econometrics. McGraw Hill. International Edition.
GUJARATI, D. 2003b. Basic Econometrics, International Edition. McGraw-Hills, Companies. Inc.
New York, United Stated.
GUJARATI, D. N. & PORTER, D. C. 2011. Econometria Básica-5, Amgh Editora.
GWATIDZO, T. & OJAH, K. 2009. Corporate capital structure determinants: evidence for five
African countries. African Finance Journal, 11, 1-23.
GWATIDZO, T. & OJAH, K. 2014. Firms' debt choice in Africa: Are institutional infrastructure
and non-traditional determinants important? International Review of Financial Analysis,
31, 152-166.
HAAS, R. & PEETERS, M. 2006. The dynamic adjustment towards target capital structures of
firms in transition economies. Economics of Transition, 14, 133-169.
HACKBARTH, D., MIAO, J. & MORELLEC, E. 2006. Capital structure, credit risk, and
macroeconomic conditions. Journal of Financial Economics, 82, 519-550.
HADI, A. R. A. & SURYANTO, T. 2017. Capital Structure Determinants: Evidence From
Palestine and Egypt Stock Exchanges. IKONOMIKA, 1, 118-130.
HAKIM, C. 1987. Research design. Allen Unwin, London.
HALL, G., HUTCHINSON, P. & MICHAELAS, N. 2000. Industry effects on the determinants of
unquoted SMEs' capital structure. International journal of the economics of business, 7,
297-312.
HALL, G. C., HUTCHINSON, P. J. & MICHAELAS, N. 2004. Determinants of the capital
structures of European SMEs. Journal of Business Finance & Accounting, 31, 711-728.
HALL, P. A. 2003. Aligning ontology and methodology in comparative research. Comparative
historical analysis in the social sciences, 374.

151
HAMILTON, R. T. & FOX, M. A. 1998. The financing preferences of small firm owners.
International Journal of Entrepreneurial Behavior & Research, 4, 239-248.
HANDOO, A. & SHARMA, K. 2014. A study on determinants of capital structure in India. IIMB
Management Review, 26, 170-182.
HANSEN, L. P. 1982. Large sample properties of generalized method of moments estimators.
Econometrica: Journal of the Econometric Society, 1029-1054.
HARDING, S. G. 1987. Feminism and methodology: Social science issues, Indiana University
Press.
HARON, R. The existance of target capital structure on Indonesian firms. A dynamic approach.
ISTMET 2014 - 1st International Symposium on Technology Management and Emerging
Technologies, Proceedings, 2014. 302-305.
HARON, R., IBRAHIM, K., NOR, F. M. & IBRAHIM, I. 2013. Factors Affecting Speed of
Adjustment to Target Leverage: Malaysia Evidence. Global Business Review, 14, 243-262.
HARRIS, M. & RAVIV, A. 1991. The theory of capital structure. the Journal of Finance, 46, 297-
355.
HARRIS, M. & RAVIV, A. 2008. A theory of board control and size. Review of Financial Studies,
21, 1797-1832.
HARRISON, B. & WIDJAJA, T. W. 2014. The Determinants of Capital Structure: Comparison
between Before and After Financial Crisis. Economic Issues, 19, 55-82.
HAY, C. 2007. Does ontology trump epistemology? Notes on the directional dependence of
ontology and epistemology in political analysis. Politics, 27, 115-118.
HENNESSY, C. A. & WHITED, T. M. 2005. Debt dynamics. The Journal of Finance, 60, 1129-
1165.
HESSE, H. 2007. Financial intermediation in the pre-consolidated banking sector in Nigeria,
World Bank Publications.

152
HEYMAN, D., DELOOF, M. & OOGHE, H. 2008. The financial structure of private held Belgian
firms. Small business economics, 30, 301-313.
HOEPFL, M. C. 1997. Choosing qualitative research: A primer for technology education
researchers.
HOLTZ-EAKIN, D., NEWEY, W. & ROSEN, H. S. 1988. Estimating vector autoregressions with
panel data. Econometrica: Journal of the Econometric Society, 1371-1395.
HOVAKIMIAN, A. 2004. The role of target leverage in security issues and repurchases. The
Journal of Business, 77, 1041-1072.
HOVAKIMIAN, A., KAYHAN, A. & TITMAN, S. 2011. Are Corporate Default Probabilities
Consistent with the Static Trade-off Theory? Review of Financial Studies, hhr101.
HOVAKIMIAN, A., OPLER, T. & TITMAN, S. 2001. The debt-equity choice. Journal of
Financial and Quantitative analysis, 36, 1-24.
HSIAO, C. 2014. Analysis of panel data, Cambridge university press.
HUANG, R. & RITTER, J. R. 2009. Testing theories of capital structure and estimating the speed
of adjustment. Journal of Financial and Quantitative analysis, 44, 237-271.
HUDSON, L. A. & OZANNE, J. L. 1988. Alternative ways of seeking knowledge in consumer
research. Journal of consumer research, 14, 508-521.
HUSSAIN, H., HADI, A., MOHAMED-ISA, A., SALEM, M., KAMARUDIN, F. &
JABARULLAH, N. 2018. Adjustment to Target Debt Maturity and Equity Mispricing:
Evidence from Asia Pacific. Polish Journal of Management Studies (forthcoming).
HUSSAIN, Q. & NIVOROZHKIN, E. 1997. The capital structure of listed companies in Poland.
HUSSERL, E. 1962. Ideas, trans. WRB Gibson, New York, Collier, 270.
ILYAS, J. 2008. The determinants of capital structure: Analysis of non-financial firms listed in
Karachi stock exchange in Pakistan. Journal of Managerial Sciences, 2, 279-307.

153
IQBAL, A. & KUME, O. 2015. Impact of financial crisis on firms’ capital structure in UK, France,
and Germany.
IVASHINA, V. & SCHARFSTEIN, D. 2010. Bank lending during the financial crisis of 2008.
Journal of Financial economics, 97, 319-338.
JENSEN, M. C. 1986. Agency cost of free cash flow, corporate finance, and takeovers. Corporate
Finance, and Takeovers. American Economic Review, 76.
JENSEN, M. C. & MECKLING, W. H. 1976. Theory of the firm: Managerial behavior, agency
costs and ownership structure. Journal of financial economics, 3, 305-360.
JÕEVEER, K. 2013. What do we know about the capital structure of small firms? Small Business
Economics, 41, 479-501.
JOHNSEN, G. J. & MCMAHON, R. G. 2005. Owner-manager gender, financial performance and
business growth amongst SMEs from Australia’s business longitudinal survey.
International Small Business Journal, 23, 115-142.
JOHNSON, M. 1987. The Body in the Mind: The Bodily Basis of Meaning, Imagination, and
Cognition.
KAKILLI ACARAVCI, S. 2015. The determinants of capital structure: Evidence from the Turkish
manufacturing sector. International Journal of Economics and Financial Issues, 5, 158-
171.
KALE, J. R. & NOE, T. H. 1990. Risky debt maturity choice in a sequential game equilibrium.
Journal of Financial Research, 13, 155-166.
KALE, J. R., NOE, T. H. & RAMIREZ, G. G. 1991. The effect of business risk on corporate capital
structure: Theory and evidence. The journal of finance, 46, 1693-1715.
KANNADHASAN, M., THAKUR, B. P. S., GUPTA, C. P. & CHARAN, P. 2018. Testing capital
structure theories using error correction models: Evidence from China, India, and South
Africa. Cogent Economics and Finance, 6.

154
KEMSLEY, D. & NISSIM, D. 2002. Valuation of the debt tax shield. The Journal of finance, 57,
2045-2073.
KESTER, W. C. 1986. Capital and ownership structure: A comparison of United States and
Japanese manufacturing corporations. Financial management, 5-16.
KHAN, B. & AKHTAR, M. R. 2018. Firm Specific Determinants of Debt Financing: A Sino-Pak
Perspective.
KHÉMIRI, W. & NOUBBIGH, H. 2018. Determinants of capital structure: Evidence from sub-
Saharan African firms. The Quarterly Review of Economics and Finance.
KIM, E. 1982. Miller's equilibrium, shareholder leverage clienteles, and optimal capital structure.
The Journal of Finance, 37, 301-319.
KIM, E. H. 1978. A mean‐variance theory of optimal capital structure and corporate debt capacity.
The Journal of Finance, 33, 45-63.
KIM, J. H. 2017. Asset specificity and firm value: Evidence from mergers.
KIM, W. S. & SORENSEN, E. H. 1986. Evidence on the impact of the agency costs of debt on
corporate debt policy. Journal of Financial and quantitative analysis, 21, 131-144.
KIRMANI, A. & RAO, A. R. 2000. No pain, no gain: A critical review of the literature on signaling
unobservable product quality. Journal of marketing, 64, 66-79.
KIYOTAKI, N. & MOORE, J. 1997. Credit cycles. Journal of political economy, 105, 211-248.
KLAPPER, L. F., SARRIA-ALLENDE, V. & ZAIDI, R. 2006. A firm-level analysis of small and
medium size enterprise financing in Poland. World Bank Policy Research Working Paper.
KÖKSAL, B. & ORMAN, C. 2014. Determinants of capital structure: evidence from a major
developing economy. Small Business Economics, 44, 255-282.
KÖKSAL, B. & ORMAN, C. 2015. Determinants of capital structure: evidence from a major
developing economy. Small Business Economics, 44, 255-282.
KORTEWEG, A. 2010. The net benefits to leverage. The Journal of Finance, 65, 2137-2170.

155
KRAUS, A. & LITZENBERGER, R. H. 1973. A state‐preference model of optimal financial
leverage. The journal of finance, 28, 911-922.
KUHN, T. 1996. The Structure of Scientific Revolutions,(3) The University of Chicago Press.
Chicago.
KÜHNHAUSEN, F. & STIEBER, H. W. 2014. Determinants of capital structure in non-financial
companies. Available at SSRN 2410741.
LA ROCCA, M., LA ROCCA, T. & CARIOLA, A. 2011. Capital structure decisions during a
firm's life cycle. Small Business Economics, 37, 107-130.
LAUDADIO, L. 1963. Size of bank, size of borrower, and the rate of interest. The Journal of
Finance, 18, 20-28.
LEARY, M. T. & ROBERTS, M. R. 2005. Do firms rebalance their capital structures? The journal
of finance, 60, 2575-2619.
LEININGER, M. 1994. Evaluation criteria and critique of qualitative research studies. Critical
issues in qualitative research methods, 95-115.
LELAND, H. E. 1994. Corporate debt value, bond covenants, and optimal capital structure. The
journal of finance, 49, 1213-1252.
LELAND, H. E. 1998. Agency costs, risk management, and capital structure. The Journal of
Finance, 53, 1213-1243.
LELAND, H. E. & TOFT, K. B. 1996. Optimal capital structure, endogenous bankruptcy, and the
term structure of credit spreads. The Journal of Finance, 51, 987-1019.
LEMMA, T. T. & NEGASH, M. 2014. Determinants of the adjustment speed of capital structure:
Evidence from developing economies. Journal of Applied Accounting Research, 15, 64-99.
LEMMON, M. L., ROBERTS, M. R. & ZENDER, J. F. 2008. Back to the beginning: persistence
and the cross‐section of corporate capital structure. The Journal of Finance, 63, 1575-1608.

156
LEMMON, M. L. & ZENDER, J. F. 2001. Looking under the lamppost: An empirical examination
of the determinants of capital structure. Unpublished working paper. University of Utah
and University of Arizona.
LING, S. C. S., RAMAKRISHNAN, S., KHAN, S. & HISHAN, S. S. 2017. Dynamic capital
structure analysis among the manufacturing and non-manufacturing firms in Malaysia.
Advanced Science Letters, 23, 9291-9297.
LIPSON, M. L. & MORTAL, S. 2009. Liquidity and capital structure. Journal of Financial
Markets, 12, 611-644.
LONG, M. & MALITZ, I. 1985. The investment-financing nexus: Some empirical evidence.
Midland Corporate Finance Journal, 3, 53-59.
LÖÖF, H. 2004. Dynamic optimal capital structure and technical change. Structural Change and
Economic Dynamics, 15, 449-468.
LÓPEZ-GRACIA, J. & SOGORB-MIRA, F. 2008. Testing trade-off and pecking order theories
financing SMEs. Small Business Economics, 31, 117-136.
LOUGHRAN, T., RITTER, J. R. & RYDQVIST, K. 1994. Initial public offerings: International
insights. Pacific-Basin Finance Journal, 2, 165-199.
MAC AN BHAIRD, C. & LUCEY, B. 2010. Determinants of capital structure in Irish SMEs. Small
business economics, 35, 357-375.
MAÇÃS NUNES, P. J. & SERRASQUEIRO, Z. M. 2007. Capital structure of portuguese service
industries: a panel data analysis. The Service Industries Journal, 27, 549-562.
MACKAY, P. & PHILLIPS, G. M. 2005. How does industry affect firm financial structure? Review
of Financial Studies, 18, 1433-1466.
MACKENZIE, N. & KNIPE, S. 2006. Research dilemmas: Paradigms, methods and methodology.
Issues in educational research, 16, 193-205.

157
MACKIE MASON, J. K. 1990. Do taxes affect corporate financing decisions? The journal of
finance, 45, 1471-1493.
MAHAJAN, A. & TARTAROGLU, S. 2008. Equity market timing and capital structure:
International evidence. Journal of Banking & Finance, 32, 754-766.
MAHESHWARI, M. B. 2016. DETERMINANTS OF CAPITAL STRUCTURE OF SERVICE AND
MANUFACTURING SECTORS OF PAKISTANI COMPANIES LISTED IN KARACHI
STOCK EXCHANGE.
MAINA, L. K., OLWENY, T. & WANJAU, K. L. 2018. Dynamic adjustment towards target
capital structure: panel evidence of listed firms in Kenya.
MANGAFIĆ, J. & MARTINOVIĆ, D. 2015. The firm-specific determinants of the target capital
structure: Evidence from Bosnia and Herzegovina panel data. Mediterranean Journal of
Social Sciences, 6, 188-198.
MARONEY, N., WANG, W. & HASSAN, M. K. 2018. Incorporating Active Adjustment into a
Financing Based Model of Capital Structure. Journal of International Money and Finance.
MARSH, P. 1982. The choice between equity and debt: An empirical study. The Journal of finance,
37, 121-144.
MASULIS, R. W. 1983. The impact of capital structure change on firm value: Some estimates. The
Journal of Finance, 38, 107-126.
MAUER, D. C. & OTT, S. H. 2000. Agency costs, underinvestment, and optimal capital structure:
The effect of growth options to expand. Project Flexibility, Agency, and Competition
(Oxford University Press, Oxford).
MAUER, D. C. & SARKAR, S. 2005. Real options, agency conflicts, and optimal capital structure.
Journal of banking & Finance, 29, 1405-1428.
MAXWELL, S. E. & DELANEY, H. D. 2004. Designing experiments and analyzing data: A model
comparison perspective, Psychology Press.

158
MICHAELAS, N., CHITTENDEN, F. & POUTZIOURIS, P. 1999. Financial policy and capital
structure choice in UK SMEs: Empirical evidence from company panel data. Small business
economics, 12, 113-130.
MIGLO, A. 2010. The pecking order, trade-off, signaling, and market-timing theories of capital
structure: A review. Trade-Off, Signaling, and Market-Timing Theories of Capital
Structure: A Review (March 23, 2010).
MILLER, M. H. 1977. Debt and taxes. the Journal of Finance, 32, 261-275.
MINGFANG, S. R. L. L. 2000. Environmental Dynamism and Capital Structure: A Conceptual
Synthesis and an Empirical Testing. Strategic Management Journal, 21, 31-49.
MODIGLIANI, F. & MILLER, M. H. 1958a. The cost of capital, corporation finance and the theory
of investment. The American economic review, 48, 261-297.
MODIGLIANI, F. & MILLER, M. H. 1958b. The cost of capital, corporation finance and the
theory of investment. The American economic review, 261-297.
MODIGLIANI, F. & MILLER, M. H. 1963a. Corporate income taxes and the cost of capital: a
correction. The American economic review, 53, 433-443.
MODIGLIANI, F. & MILLER, M. H. 1963b. Corporate income taxes and the cost of capital: a
correction. The American economic review, 433-443.
MORELLEC, E. 2004. Can managerial discretion explain observed leverage ratios? Review of
Financial Studies, 17, 257-294.
MORELLEC, E., NIKOLOV, B. & SCHÜRHOFF, N. 2012. Corporate governance and capital
structure dynamics. The Journal of Finance, 67, 803-848.
MORGAN, D. L. 2007. Paradigms lost and pragmatism regained methodological implications of
combining qualitative and quantitative methods. Journal of mixed methods research, 1, 48-
76.

159
MORGAN, G. & SMIRCICH, L. 1980. The case for qualitative research. Academy of management
review, 5, 491-500.
MORRIS, R. D. 1987. Signalling, agency theory and accounting policy choice. Accounting and
business Research, 18, 47-56.
MORSE, J. M., BARRETT, M., MAYAN, M., OLSON, K. & SPIERS, J. 2002. Verification
strategies for establishing reliability and validity in qualitative research. International
journal of qualitative methods, 1, 13-22.
MOYEN, N. 2007. How big is the debt overhang problem? Journal of Economic Dynamics and
Control, 31, 433-472.
MUKHEIJEE, S. & MAHAKUD, J. 2012. Are trade-off and pecking order theories of capital
structure mutually exclusive? Evidence from Indian manufacturing companies. Journal of
Management Research, 12, 41-55.
MUKHERJEE, S. & MAHAKUD, J. 2012. Are trade-off and pecking order theories of capital
structure mutually exclusive. Journal of Management Research, 12, 41-55.
MUNISI, G. H. 2017. Determinants of capital structure: Evidence from Sub-Saharan Africa.
International Journal of Managerial and Financial Accounting, 9, 182-199.
MURADOǦLU YAZ GULNUR, Y. G. & SIVAPRASAD, S. 2012. Capital structure and abnormal
returns. International Business Review, 21, 328-341.
MURINDE, V., AGUNG, J. & MULLINEUX, A. 2004. Patterns of corporate financing and
financial system convergence in Europe. Review of International Economics, 12, 693-705.
MURRAY, M. P. 2005. Econometrics: A modern introduction, Pearson Higher Education.
MYERS, S. C. 1977. Determinants of corporate borrowing. Journal of financial economics, 5, 147-
175.
MYERS, S. C. 1984. The capital structure puzzle. The journal of finance, 39, 574-592.
160
MYERS, S. C. 1993. Still searching for optimal capital structure. Are the distinctions between debt
and equity disappearing, 80-95.
MYERS, S. C. 2001. Capital structure. Journal of Economic perspectives, 81-102.
MYERS, S. C. 2003. Financing of corporations. Handbook of the Economics of Finance, 1, 215-
253.
MYERS, S. C. & MAJLUF, N. S. 1984. Corporate financing and investment decisions when firms
have information that investors do not have. Journal of financial economics, 13, 187-221.
NAGANO, M. 2003. Determinants of corporate capital structure in East Asia: Are there differences
from the industrialized countries. WasedaUniversty Institute of Finance Working Paper
Series.
NEJAD, N. R. & WASIUZZAMAN, S. 2015. Multilevel Determinants of Capital Structure:
Evidence from Malaysia. Global Business Review, 16, 199-212.
NEUMAN, L. W. 2002. Social research methods: Qualitative and quantitative approaches.
NEWMAN, A., GUNESSEE, S. & HILTON, B. 2011. Applicability of financial theories of capital
structure to the Chinese cultural context: A study of privately owned SMEs. International
Small Business Journal, 0266242610370977.
NEWMAN, I. & BENZ, C. R. 1998. Qualitative-quantitative research methodology: Exploring the
interactive continuum, SIU Press.
NGUGI, R. W. 2008. Capital financing behaviour: evidence from firms listed on the Nairobi stock
exchange. The European Journal of Finance, 14, 609-624.
NGUYEN, D. T. T., DIAZ-RAINEY, I. & GREGORIOU, A. 2014. Determinants of the capital
structure of listed Vietnamese companies. Journal of Southeast Asian Economies (JSEAE),
31, 412-431.
NGUYEN, T. D. K. & RAMACHANDRAN, N. 2006. Capital structure in small and medium-sized
enterprises: the case of Vietnam. ASEAN Economic bulletin, 23, 192-211.

161
NHA, B. D., LOAN, N. T. B. & NHUNG, N. T. T. 2016. Determinants of capital structure choice:
Empirical evidence from Vietnamese listed companies. Society and Economy, 38, 29-45.
NISHIHARA, M. & SHIBATA, T. 2017. Default and liquidation timing under asymmetric
information. European Journal of Operational Research, 263, 321-336.
NUNES, P. M. & SERRASQUEIRO, Z. 2017. Short-term debt and long-term debt determinants in
small and medium-sized hospitality firms. Tourism Economics, 23, 543-560.
ONAOLAPO, A. A. & KAJOLA, S. O. 2010. Capital structure and firm performance: evidence
from Nigeria. European Journal of Economics, Finance and Administrative Sciences, 25,
70-82.
OPLER, T. & TITMAN, S. 1993. The determinants of leveraged buyout activity: Free cash flow
vs. financial distress costs. The Journal of Finance, 48, 1985-1999.
ORTIZ-MOLINA, H. & PENAS, M. F. 2008. Lending to small businesses: The role of loan
maturity in addressing information problems. Small Business Economics, 30, 361-383.
OZKAN, A. 2001. Determinants of capital structure and adjustment to long run target: evidence
from UK company panel data. Journal of Business Finance & Accounting, 28, 175-198.
ÖZTEKIN, Ö. 2015. Capital structure decisions around the world: which factors are reliably
important? Journal of Financial and Quantitative Analysis, 50, 301-323.
ÖZTEKIN, Ö. & FLANNERY, M. J. 2012. Institutional determinants of capital structure
adjustment speeds. Journal of financial economics, 103, 88-112.
PAGANO, M. 2005. The Modigliani-Miller theorems: a cornerstone of finance*. Banca Nazionale
del Lavoro Quarterly Review, 58, 237.
PANDEY, I. M. 2001. Capital Structure and the Firm Characterstics: Evidence from an Emerging
Market.

162
PAULO ESPERANÇA, J., MATIAS GAMA, A. P. & AZZIM GULAMHUSSEN, M. 2003.
Corporate debt policy of small firms: an empirical (re) examination. Journal of small
business and enterprise development, 10, 62-80.
PETERSEN, M. A. & RAJAN, R. G. 1994. The benefits of lending relationships: Evidence from
small business data. The journal of finance, 49, 3-37.
PINDADO, J. & RODRIGUES, L. 2005. Determinants of financial distress costs. Financial
Markets and Portfolio Management, 19, 343-359.
PINKOVA, P. & RIEDEROVA, S. 2013. Inter- and intra-industry variations of capital structure in
the Czech manufacturing industry. Acta Universitatis Agriculturae et Silviculturae
Mendelianae Brunensis, 61, 2623-2629.
PIRTEA, M., NICOLESCU, C. & BOŢOC, C. 2014. DO ROMANIAN COMPANIES FOLLOW
PECKING ORDER FINANCING? Economic Computation & Economic Cybernetics
Studies & Research, 48.
PSILLAKI, M. & DASKALAKIS, N. 2009. Are the determinants of capital structure country or
firm specific? Small Business Economics, 33, 319-333.
QIU, M. & LA, B. 2010. Firm characteristics as determinants of capital structures in Australia.
International journal of the Economics of Business, 17, 277-287.
RAJAN, R. G. & ZINGALES, L. 1995. What do we know about capital structure? Some evidence
from international data. The journal of Finance, 50, 1421-1460.
RAM, M. R. 2017. Determinants of Capital Structure of Pharmaceutical Firms in India. Asian
Journal of Research in Banking and Finance, 7, 1-10.
RAMJEE, A. & GWATIDZO, T. 2012. Dynamics in capital structure determinants in South Africa.
Meditari Accountancy Research, 20, 52-67.

163
RAMLALL, I. 2009. Determinants of capital structure among non-quoted Mauritian firms under
specificity of leverage: looking for a modified pecking order theory. International Research
Journal of Finance and Economics.
RAMLI, N. A., LATAN, H. & SOLOVIDA, G. T. 2018. Determinants of capital structure and firm
financial performance—A PLS-SEM approach: Evidence from Malaysia and Indonesia.
The Quarterly Review of Economics and Finance.
ROBB, A. M. & ROBINSON, D. T. 2012. The capital structure decisions of new firms. Review of
Financial Studies, hhs072.
ROBERTS, M. R. 2002. The dynamics of capital structure: an empirical analysis of a partially
observable system.
ROMANO, C. A., TANEWSKI, G. A. & SMYRNIOS, K. X. 2001. Capital structure decision
making: A model for family business. Journal of business venturing, 16, 285-310.
ROSS, S. A. 1977. The determination of financial structure: the incentive-signalling approach. The
bell journal of economics, 23-40.
ROZEFF, M. S. 1982. Growth, beta and agency costs as determinants of dividend payout ratios.
Journal of financial Research, 5, 249-259.
SAARANI, A. N. & SHAHADAN, F. 2013. The determinant of capital structure of SMEs in
Malaysia: Evidence from enterprise 50 (E50) SMEs. Asian Social Science, 9, 64.
SALAWU, R. O. & AGBOOLA, A. A. 2008. The determinants of capital structure of large non-
financial listed firms in Nigeria. The International Journal of Business and Finance
Research, 2, 75-84.
SALAWU, R. O. & ILE-IFE, N. 2007. An empirical analysis of the capital structure of selected
quoted companies in Nigeria. The International Journal of Applied Economic and Finance,
1, 16-28.

164
SALE, J. E., LOHFELD, L. H. & BRAZIL, K. 2002. Revisiting the quantitative-qualitative debate:
Implications for mixed-methods research. Quality and quantity, 36, 43-53.
SAMUEL, C. 1996. The stock markets a source of finance: A comparison of US and Indian firms
(World Bank. Policy Research Working Paper 1592).
SCHRAG, F. 1992. In defense of positivist research paradigms. Educational Researcher, 21, 5-8.
SCHWANDT, T. A. 2000. Three epistemological stances for qualitative inquiry. Handbook of
qualitative research, 2, 189-213.
SCOTT JR, J. H. 1976. A theory of optimal capital structure. The Bell Journal of Economics, 33-
54.
SERRASQUEIRO, Z. & CAETANO, A. 2015. Trade-Off Theory versus Pecking Order Theory:
capital structure decisions in a peripheral region of Portugal. Journal of Business Economics
and Management, 16, 445-466.
SERRASQUEIRO, Z. & NUNES, P. M. 2008. Determinants of capital structure: Comparison of
empirical evidence from the use of different estimators. International Journal of Applied
Economics, 5, 14-29.
SERRASQUEIRO, Z. S., ARMADA, M. R. & NUNES, P. M. 2011. Pecking Order Theory versus
Trade-Off Theory: are service SMEs’ capital structure decisions different? Service
Business, 5, 381-409.
SETHI, P. & TIWARI, R. 2016. New evidences on determinants of capital structure from the Indian
manufacturing industry. Corporate Ownership and Control, 13, 82-88.
SHAH, A., HIJAZI, T. & JAVED, A. Y. 2004. The Determinants of Capital Structure of Stock
Exchange-listed Non-financial Firms in Pakistan [with Comments]. The Pakistan
Development Review, 605-618.
SHARMA, P. & PAUL, S. 2015. Does Liquidity Determine Capital Structure? Evidence from
India. Global Business Review, 16, 84-95.

165
SHYAM-SUNDER, L. & MYERS, S. C. 1999. Testing static tradeoff against pecking order models
of capital structure. Journal of financial economics, 51, 219-244.
SIBINDI, A. B. 2016. DETERMINANTS OF CAPITAL STRUCTURE: A. RISK GOVERNANCE
& CONTROL: Financial markets and institutions, 227.
SIMERLY, R. L. & LI, M. 2002. Rethinking the Capital Structure Decision: Translating Research
into Practical Solutions. Journal of Applied Topics in Business and Economics.
SINGH, S. 2011. Financial market depth: friend or foe when it comes to effective management of
monetary policy and capital flows? BIS background papers, 231.
SMITH, C. W. & WARNER, J. B. 1979. On financial contracting: An analysis of bond covenants.
Journal of financial economics, 7, 117-161.
SMITH, C. W. & WATTS, R. L. 1992. The investment opportunity set and corporate financing,
dividend, and compensation policies. Journal of financial Economics, 32, 263-292.
SMITH, D. J., CHEN, J. & ANDERSON, H. D. 2015. The influence of firm financial position and
industry characteristics on capital structure adjustment. Accounting & Finance, 55, 1135-
1169.
SOEKARNO, S., KITRI, M. L. & UTOMO, S. 2015. The speed of adjustment to capital structure
target before and after financial crisis: Evidence from Indonesian state owned enterprises.
International Journal of Applied Business and Economic Research, 13, 5375-5387.
SOGORB-MIRA, F. 2005. How SME uniqueness affects capital structure: Evidence from a 1994–
1998 Spanish data panel. Small business economics, 25, 447-457.
SOLUDO, C. C. 2006. THE NEXT STAGE OF REFORM: INSTITUTIONALISING CHANGE
IN NIGERIA. Abuja, Nigeria: Central Bank of Nigeria.
SONG, F. & THAKOR, A. V. 2010. Financial System Architecture and the Co‐evolution of Banks
and Capital Markets. The Economic Journal, 120, 1021-1055.
SONG, H.-S. 2005. Capital structure determinants an empirical study of Swedish companies.

166
SPENCE, M. 1973. Job market signaling. The quarterly journal of Economics, 355-374.
SPENCE, M. 2002. Signaling in retrospect and the informational structure of markets. The
American Economic Review, 92, 434-459.
STIGLITZ, J. E. 2002. Information and the Change in the Paradigm in Economics. The American
Economic Review, 92, 460-501.
STOHS, M. H. & MAUER, D. C. 1996. The determinants of corporate debt maturity structure.
Journal of Business, 279-312.
STREBULAEV, I. A. 2007. Do tests of capital structure theory mean what they say? The Journal
of Finance, 62, 1747-1787.
STREBULAEV, I. A. & YANG, B. 2013. The mystery of zero-leverage firms. Journal of Financial
Economics, 109, 1-23.
STRÝČKOVÁ, L. 2015. Factors determining the corporate capital structure in the Czech republic
from the perspective of business entities. E a M: Ekonomie a Management, 18, 40-56.
STULZ, R. 1990. Managerial discretion and optimal financing policies. Journal of financial
Economics, 26, 3-27.
TAGGART, R. A. 1977. A model of corporate financing decisions. The Journal of Finance, 32,
1467-1484.
TAMIRAT, A. S., BARRERA, A. T. & PENNINGS, J. M. 2017. Dynamic Capital Structure:
Dynamics, Determinants and Speed of Adjustment.
TANG, C.-H. H. & JANG, S. S. 2007. Revisit to the determinants of capital structure: a comparison
between lodging firms and software firms. International Journal of Hospitality
Management, 26, 175-187.
TAO, Q., SUN, W., ZHU, Y. & ZHANG, T. 2017a. Do firms have leverage targets? New evidence
from mergers and acquisitions in China. North American Journal of Economics and
Finance, 40, 41-54.

167
TAO, Q., SUN, W., ZHU, Y. & ZHANG, T. 2017b. Do firms have leverage targets? New evidence
from mergers and acquisitions in China. The North American Journal of Economics and
Finance, 40, 41-54.
TAURINGANA, V. & CLARKE, S. 2000. The demand for external auditing: managerial share
ownership, size, gearing and liquidity influences. Managerial Auditing Journal, 15, 160-
168.
TITMAN, S. & WESSELS, R. 1988a. The determinants of capital structure choice. Journal of
Finance, 43, 1-19.
TITMAN, S. & WESSELS, R. 1988b. The determinants of capital structure choice. The Journal of
finance, 43, 1-19.
TOY, N., STONEHILL, A., REMMERS, L., WRIGHT, R. & BEEKHUISEN, T. 1974. A
comparative international study of growth, profitability, and risk as determinants of
corporate debt ratios in the manufacturing sector. Journal of Financial and Quantitative
Analysis, 9, 875-886.
UPNEJA, A. & DALBOR, M. C. 2001. An examination of capital structure in the restaurant
industry. International Journal of Contemporary Hospitality Management, 13, 54-59.
UYAR, A. & GUZELYURT, M. K. 2015. Impact of firm characteristics on capital structure choice
of Turkish SMEs. Managerial Finance, 41, 286-300.
UYSAL, V. B. 2011. Deviation from the target capital structure and acquisition choices. Journal
of Financial Economics, 102, 602-620.
VAN HOANG, T. H., GURĂU, C., LAHIANI, A. & SERAN, T.-L. 2017. Do crises impact capital
structure? A study of French micro-enterprises. Small Business Economics, 1-19.
VASILIOU, D., ERIOTIS, N. & DASKALAKIS, N. 2009. Testing the pecking order theory: the
importance of methodology. Qualitative Research in Financial Markets, 1, 85-96.

168
VĂTAVU, S. 2012. Trade-Off Versus Pecking Order Theory in Listed Companies Around The
World. OF THE UNIVERSITY OF PETROŞANI~ ECONOMICS~, 285.
VILASUSO, J. & MINKLER, A. 2001. Agency costs, asset specificity, and the capital structure of
the firm. Journal of Economic Behavior & Organization, 44, 55-69.
VO, X. V. 2017. Determinants of capital structure in emerging markets: Evidence from Vietnam.
Research in International Business and Finance, 40, 105-113.
WALD, J. K. 1999. How firm characteristics affect capital structure: an international comparison.
Journal of Financial research, 22, 161-187.
WELCH, I. 2004. Capital structure and stock returns. Journal of political economy, 112, 106-132.
WEN, Y., RWEGASIRA, K. & BILDERBEEK, J. 2002. Corporate governance and capital
structure decisions of the Chinese listed firms. Corporate Governance: An International
Review, 10, 75-83.
WILLIAMS, J. 1987. Perquisites, risk, and capital structure. The Journal of Finance, 42, 29-48.
XU, Q. & LI, C. An Empirical Study on Determinants of Capital Structure in Chinese Listed
Companies. Computational Intelligence and Security (CIS), 2014 Tenth International
Conference on, 2014. IEEE, 724-728.
YANG, G. J. A., CHUEH, H. & LEE, C. H. 2014. Examining the theory of capital structure: Signal
factor hypothesis. Applied Economics, 46, 1127-1133.
YANG, Y., ALBAITY, M. & HASSAN, C. H. B. 2015. Dynamic capital structure in China:
Determinants and adjustment speed. Investment Management and Financial Innovations,
12, 195-204.
ZAHEER, Z. 2011. Determinants of Capital Structure: A Comprehensive Study of Textile Sector
of Pakistan. International Journal of Academic Research, 3.

169
ZEITUN, R., TEMIMI, A. & MIMOUNI, K. 2017. Do financial crises alter the dynamics of
corporate capital structure? Evidence from GCC countries. The Quarterly Review of
Economics and Finance, 63, 21-33.
ZHANG, Q., SAQIB, Z. A. & CHEN, Q. Determinants of Capital Structure: An Empirical Analysis
of Fuel and Energy Sector of Pakistan. 2018 15th International Conference on Service
Systems and Service Management (ICSSSM), 2018. IEEE, 1-6.
ZHOU, Q., TAN, K. J. K., FAFF, R. & ZHU, Y. 2016a. Deviation from target capital structure,
cost of equity and speed of adjustment. Journal of Corporate Finance, 39, 99-120.
ZHOU, Q., TAN, K. J. K., FAFF, R. & ZHU, Y. 2016b. Deviation from target capital structure,
cost of equity and speed of adjustment. Journal of Corporate Finance, 39, 99-120.

170
APPENDICES
Appendix 5.1: Test of Auto correlation for Long-term leverage
Prob > chi2 = 0.1469 chi2(103) = 118.0874
H0: overidentifying restrictions are validSargan test of overidentifying restrictions. estat sargan
H0: no autocorrelation 2 -.96455 0.3348 1 -3.5757 0.0003 Order z Prob > z Arellano-Bond test for zero autocorrelation in first-differenced errors
. estat abond
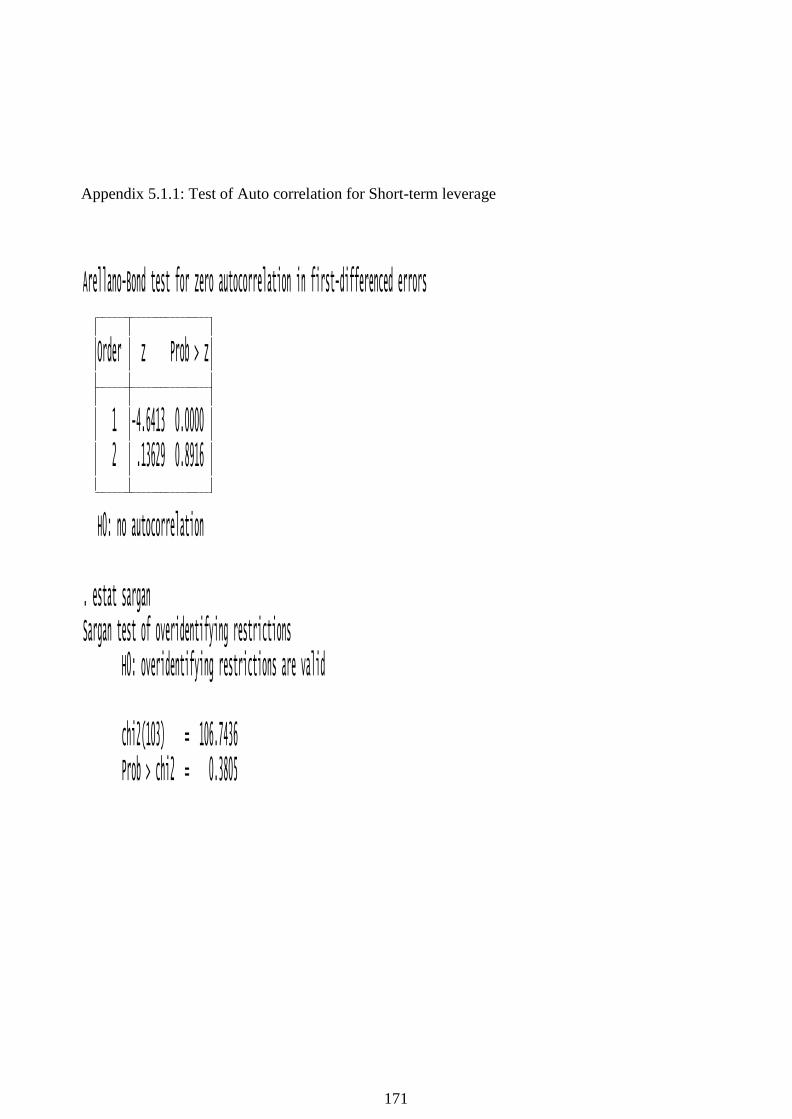
171
Appendix 5.1.1: Test of Auto correlation for Short-term leverage
Prob > chi2 = 0.3805 chi2(103) = 106.7436
H0: overidentifying restrictions are validSargan test of overidentifying restrictions. estat sargan
H0: no autocorrelation 2 .13629 0.8916 1 -4.6413 0.0000 Order z Prob > z Arellano-Bond test for zero autocorrelation in first-differenced errors
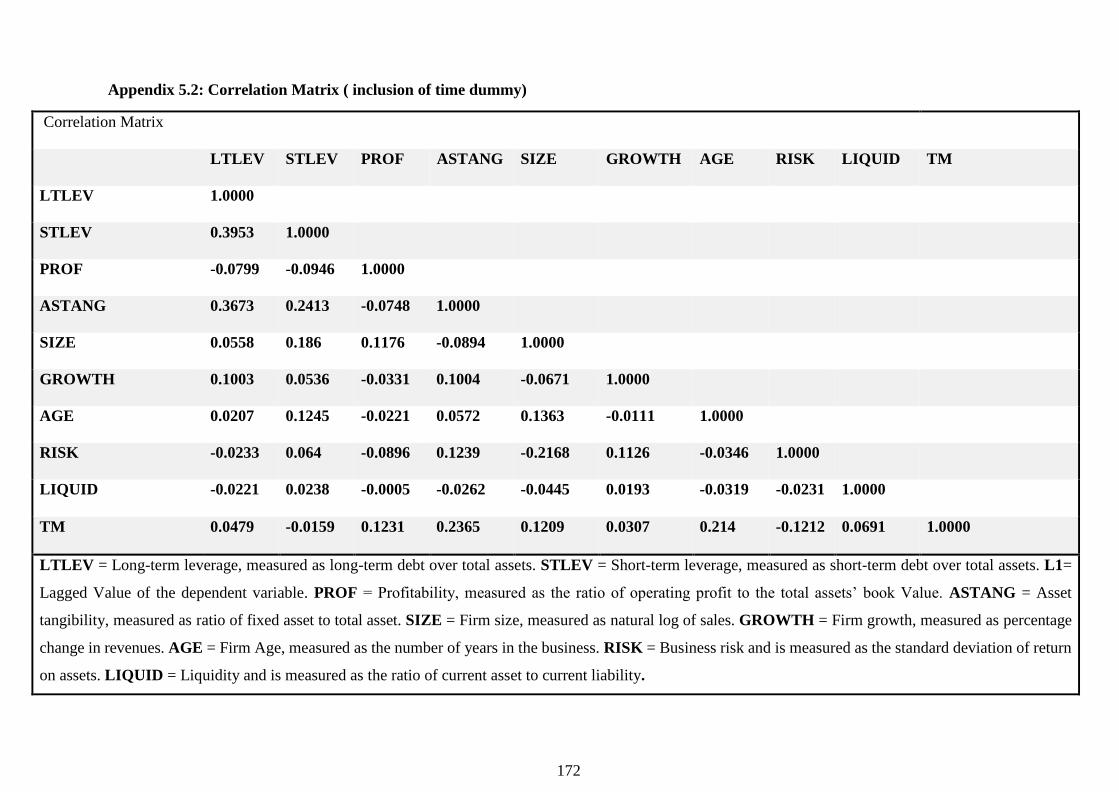
172
Appendix 5.2: Correlation Matrix ( inclusion of time dummy)
Correlation Matrix
LTLEV STLEV PROF ASTANG SIZE GROWTH AGE RISK LIQUID TM
LTLEV 1.0000
STLEV 0.3953 1.0000
PROF -0.0799 -0.0946 1.0000
ASTANG 0.3673 0.2413 -0.0748 1.0000
SIZE 0.0558 0.186 0.1176 -0.0894 1.0000
GROWTH 0.1003 0.0536 -0.0331 0.1004 -0.0671 1.0000
AGE 0.0207 0.1245 -0.0221 0.0572 0.1363 -0.0111 1.0000
RISK -0.0233 0.064 -0.0896 0.1239 -0.2168 0.1126 -0.0346 1.0000
LIQUID -0.0221 0.0238 -0.0005 -0.0262 -0.0445 0.0193 -0.0319 -0.0231 1.0000
TM 0.0479 -0.0159 0.1231 0.2365 0.1209 0.0307 0.214 -0.1212 0.0691 1.0000
LTLEV = Long-term leverage, measured as long-term debt over total assets. STLEV = Short-term leverage, measured as short-term debt over total assets. L1=
Lagged Value of the dependent variable. PROF = Profitability, measured as the ratio of operating profit to the total assets’ book Value. ASTANG = Asset
tangibility, measured as ratio of fixed asset to total asset. SIZE = Firm size, measured as natural log of sales. GROWTH = Firm growth, measured as percentage
change in revenues. AGE = Firm Age, measured as the number of years in the business. RISK = Business risk and is measured as the standard deviation of return
on assets. LIQUID = Liquidity and is measured as the ratio of current asset to current liability.

173
Appendix: 5.3: Capital Structure Determinants and SOA for Over-leveraged Firms
TOTLEV
Exp.
Sign
Coefficient Std. Error
LTLEV
Exp.
Sign
Coefficient Std.
Error
STLEV
Exp.
Sign
Coefficient Std. Error
_Cons + .29356*** .004334 _Cons + .185537*** .0007258 _Cons + .094925*** .00120
L1 + .30408*** .003179 L1 + .421633*** .0002270 L1 + .132031*** .001704
PROF _ -.15517*** .008054 PROF _ -.073285*** .0009133 PROF _ -.08449*** .002880
ASTANG + .26235*** .002643 ASTANG + .183556*** .0019733 ASTANG + .074398*** .001668
SIZE + -.0188*** .000341 SIZE + -.008571*** .0000974 SIZE _ -.00906*** .000167
GROWTH + .00454*** .000738 GROWTH + .011987*** .0007296 GROWTH + -.00208** .00098
AGE + .00070*** .000018 AGE + .000188*** 8.73e-06 AGE + .000684*** .000012
RISK _ -.00018*** .000042 RISK _ -.000296*** 9.95e-06 RISK + .000567*** .000027
LIQUID .00302*** .000210 LIQUID _ -.013475** .0000809 LIQUID _ .008791*** .000204
ADJUSTMENT SPEED (%) = 70%
AR 1= 0.0004 SARGAN = 0.99
AR2 = 0.9294 WALD = (153001)***
AR1=
0.0088
AR2=
0.6294
SARGAN 0.997
WALD = (4070000) ***
AR 1= 0.0003
AR2 = 0.8887
SARGAN = 0.9988
WALD = (466220.8)***
TOTLEV= Total leverage, measured as total debt over total assets. LTLEV = Long-term leverage, measured as long-term debt over total assets. STLEV = Short-term leverage,
measured as short-term debt over total assets. L1= Lagged Value of the dependent variable. PROF = Profitability, measured as the ratio of operating profit to the total assets’
book Value. ASTANG = Asset tangibility, measured as ratio of fixed asset to total asset. SIZE = Firm size, measured as natural log of sales. GROWTH = Firm growth, measured
as percentage change in revenues. AGE = Firm Age, measured as the number of years in the business. RISK = Business risk and is measured as the standard deviation of return
on assets. LIQUID = Liquidity and is measured as the ratio of current asset to current liability. *** shows highest level of significant at 0.01, while ** and * shows significance
at 5% 0.10 respectively. ADJUST SPEED is the speed of adjustment and is achieved by subtracting the coefficient of lagged total debt (L1) from 1. In GMM, first level
autocorrelation is expected. The validity of instruments is confirmed when the P value of the Sargan test is greater than .05.

174
Appendix: 5.4: Capital Structure Determinants and SOA for Under-leveraged Firms
TOTLEV
Exp.
Sign
Coefficient Std. Error
LTLEV
Exp.
Sign
Coefficient Std.
Error
STLEV
Exp.
Sign
Coefficient Std. Error
_Cons + .11068*** .001401 _Cons + .10293*** .000661 _Cons + .012532 .000533
L1 + .25131*** .006837 L1 + .32225*** .00322 L1 + .21676 .001018
PROF _ -.03291*** .002227 PROF _ -.0174*** .000691 PROF _ -.01078 .001282
ASTANG + .34194*** .00709 ASTANG + .10515*** .002359 ASTANG + .242791 .003974
SIZE + -.00010 .00011 SIZE + -2.23E*** .63E-05 SIZE _ .0002 .23E-05
GROWTH + .00015
.000838
GROWT
H
+
-2.85E*** .000151
GROWTH +
.003777 .000325
AGE + .000127*** 1.98E-05 AGE + .00012*** .44E-06 AGE + -7.6E-05 .84E-06
RISK _ .000329*** 1.68E-05 RISK _ .00014*** .34E-06 RISK + .000177 .57E-06
LIQUID .000695*** 3.16E-05 LIQUID _ .000444*** .26E-05 LIQUID _ .001285 .33E-05
ADJUSTMENT SPEED (%) = 75%
AR 1= 0.0062 SARGAN = 0.9985
AR2 = 0.2190 WALD = (61217)***
AR 1= 0.0613
AR2 = 0.1670
SARGAN 0.9982
WALD = (1.03e+06) ***
AR 1= 0.0202
AR2 = 0.3232
SARGAN = 0.9946
WALD = (242741)***
TOTLEV= Total leverage, measured as total debt over total assets. LTLEV = Long-term leverage, measured as long-term debt over total assets. STLEV = Short-
term leverage, measured as short-term debt over total assets. L1= Lagged Value of the dependent variable. PROF = Profitability, measured as the ratio of operating
profit to the total assets’ book Value. ASTANG = Asset tangibility, measured as ratio of fixed asset to total asset. SIZE = Firm size, measured as natural log of
sales. GROWTH = Firm growth, measured as percentage change in revenues. AGE = Firm Age, measured as the number of years in the business. RISK = Business
risk and is measured as the standard deviation of return on assets. LIQUID = Liquidity and is measured as the ratio of current asset to current liability. *** shows
highest level of significant at 0.01, while ** and * shows significance at 5% 0.10 respectively. ADJUST SPEED is the speed of adjustment and is achieved by
subtracting the coefficient of lagged total debt (L1) from 1. In GMM, first level autocorrelation is expected. The validity of instruments is confirmed when the P
value of the Sargan test is greater than .05.

175
Appendix: 5.5: Capital Structure Determinants and SOA for Large Firms
TOTLEV
Exp.
Sign
Coefficient Std. Error
LTLEV
Exp
.
Sign
Coefficient Std. Error
STLEV
Exp.
Sign
Coefficient Std.
Error
_Cons + .19150*** .00137 _Cons + .1227*** .00047 _Cons + 0.1131*** .000648
L1 + .49662*** .00058 L1 + .5884*** .00054 L1 + 0.3121*** .000660
PROF _ -.00203 .00296 PROF _ .0346*** .00146 PROF _ -0.034*** .001267
ASTANG + .28948*** .00140 ASTANG + .1835*** .00104 ASTANG + 0.0801*** .000231
SIZE + -.01706*** .00015 SIZE + -.0106*** .00010 SIZE _ -0.0168*** .000099
GROWT
H
+ .00669*** .00126 GROWT
H
+
.0012*** .00010
GROWTH + 0.0067***
.000648
AGE + .00102*** .00001 AGE + .0006*** .00001 AGE + 0.0010*** .000002
RISK _ .00079*** .00001 RISK _ .0003*** .00002 RISK + 0.0010*** .000005
LIQUID .00548*** .00010 LIQUID _ -.0012*** .00009 LIQUID _ 0.0066*** .000075
ADJUSTMENT SPEED (%) = 50%
AR 1= 0.0018 SARGAN = 0.7915
AR2 = 0.7757 WALD = (494000)***
AR 1= 0.0778
AR2 = 0.5141
SARGAN 0.8355
WALD = (8310000) ***
AR 1= 0.0045
AR2 = 0.9197
SARGAN = 0.7672
WALD =
(7300000)***
TOTLEV= Total leverage, measured as total debt over total assets. LTLEV = Long-term leverage, measured as long-term debt over total assets.
STLEV = Short-term leverage, measured as short-term debt over total assets. L1= Lagged Value of the dependent variable. PROF = Profitability,
measured as the ratio of operating profit to the total assets’ book Value. ASTANG = Asset tangibility, measured as ratio of fixed asset to total asset.
SIZE = Firm size, measured as natural log of sales. GROWTH = Firm growth, measured as percentage change in revenues. AGE = Firm Age, measured
as the number of years in the business. RISK = Business risk and is measured as the standard deviation of return on assets. LIQUID = Liquidity and is
measured as the ratio of current asset to current liability. *** shows highest level of significant at 0.01, while ** and * shows significance at 5% 0.10
respectively. ADJUST SPEED is the speed of adjustment and is achieved by subtracting the coefficient of lagged total debt (L1) from 1. In GMM, first
level autocorrelation is normal. The validity of instruments is confirmed when the P value of the Sargan test is greater than .05.

176
Appendix: 5.6: Capital Structure Determinants and SOA of Small Firms
TOTLEV
Exp.
Sign
Coefficient Std. Error
LTLEV
Exp
.
Sign
Coefficient Std. Error
STLEV
Exp.
Sign
Coefficient Std.
Error
_Cons + .11313*** .001507 _Cons + .10818*** .00054 _Cons + .092923*** .00014
L1 + .41968*** .000379 L1 + .30699*** .00089 L1 + .261941*** .00011
PROF _ -.00579*** .001590 PROF _ .00042 .00093 PROF _ -.024737*** .00049
ASTANG + .54101*** .002390 ASTANG + .36315*** .00174 ASTANG + .161043*** .00026
SIZE + -.00142*** .000222 SIZE + .00323*** .00008 SIZE _ -.012401*** .00002
GROWT
H
+ .07809*** .001597 GROWT
H
+
.02165*** .00054
GROWTH + .056852***
.00037
AGE + -.00009*** .000006 AGE + -.00093*** .00002 AGE + .000081*** .00000
RISK _ .00027*** .000014 RISK _ .00059*** .00002 RISK + -.000192*** .00000
LIQUID .00126*** .000079 LIQUID _ .00478*** .00009 LIQUID _ .001484*** .00002
ADJUSTMENT SPEED (%) = 58%
AR 1= 0.0006 SARGAN = 0.9985
AR2 = 0.8865 WALD = (1410000)***
AR 1= 0.0012
AR2 = 0.7075
SARGAN 0.9846
WALD = (5140000) ***
AR 1= 0.0008
AR2 = 0.9087
SARGAN = 0.9830
WALD =
(840000)***
TOTLEV= Total leverage, measured as total debt over total assets. LTLEV = Long-term leverage, measured as long-term debt over total assets.
STLEV = Short-term leverage, measured as short-term debt over total assets. L1= Lagged Value of the dependent variable. PROF = Profitability,
measured as the ratio of operating profit to the total assets’ book Value. ASTANG = Asset tangibility, measured as ratio of fixed asset to total asset.
SIZE = Firm size, measured as natural log of sales. GROWTH = Firm growth, measured as percentage change in revenues. AGE = Firm Age, measured
as the number of years in the business. RISK = Business risk and is measured as the standard deviation of return on assets. LIQUID = Liquidity and is
measured as the ratio of current asset to current liability. *** shows highest level of significant at 0.01, while ** and * shows significance at 5% 0.10
respectively. ADJUST SPEED is the speed of adjustment and is achieved by subtracting the coefficient of lagged total debt (L1) from 1. In GMM, first
level autocorrelation is normal. The validity of instruments is confirmed when the P value of the Sargan test is greater than .05.

177
Appendix: 5.7: Industrial Sectors and Subsectors Based on NSE Classification
1) AGRICULTURE Fishing, Hunting, Trapping Crop production, Livestock, Animal specialties
2) CONGLOMERATES Large firms that incorporate engineering to produce varied products.
3)
CONSTRUCTION/
REAL ESTATE
Construction, Non-Building, Heavy Construction Property Management, Real Estate Development, Real
Estate
Building Structure completion, Site Preparation Services, Other Construction Services
4) CONSUMER GOODS Automobiles, Auto Parts, Beverages, Brewers, Distillers, Beverages(Non-Alcoholic), Consumer Electronics,
Food Products, Household Durables, Personal Household Products, Textiles, Tobacco Products, Toys and
Games
5) HEALTHCARE Healthcare Providers, Medical Equipment, Medical Supplies, Pharmaceuticals
6)
INFORMATION AND
COMMUNICATION
TECHNOLOGY
Computers and Peripherals, Computer Based Systems, Computer Software, Diversified Communication
Services, Electronic Office Equipment, Internet Service Providers, IT Services, Processing Systems
Scientific and Technical Instrument, Semiconductors, Telecommunications Carriers, Telecommunications
Equipment
Telecommunication services
- Other ICT Products and Services
7)
INDUSTRIAL GOODS
Building Materials, Electronic and Electrical Products, Packaging, Containers, Tools and Machinery
8) NATURAL
RESOURCES
Chemicals, Metals, Precious Metals, Precious Stones, Paper and Forest Products, Non-Metallic Mineral
Mining
9) OIL AND GAS Coal Extraction, Coal and Coal Products Distributors, Crude Oil and Natural Gas Extraction, Petroleum
Refining
Petroleum and Petroleum Products Distributors, Petroleum Bulk Stations and Terminals, Gasoline Stations
Energy Equipment and Services, Field Services, Integrated Oil and Gas Services
10) SERVICES Advertising Agencies, Employment Solutions, Printing, Publishing, Waste Management, Airlines, Courier,
Freight, Delivery, Rail Transportation, Road Transportation, Water Transportation, Storage/Warehousing
Transport-Related Services, Hospitality, Hotel, Lodging, Education, Training, Media, Entertainment, Repair,
Maintenance, Travel and Tourism, Miscellaneous Services, Apparel Retailers, Automobile, Auto Part
Retailers
Electronics, Appliances Retailers, Food/Drug Retailers and Wholesalers,Specialty Retailers

178
Appendix: 5.8: Mean and Median Leverage Across Industries
INDUSTRY NSE
Code
MEAN MEDIAN
LTLEV STLEV LTLEV STLEV
AGRICULTURE 01 0.15 0.06 0.14 0.05
CONGLOMERATES 02 0.16 0.07 0.16 0.08
CONSTRUCTION REAL ESTATES 03 0.15 0.07 0.14 0.07
CONSUMER GOODS 04 0.19 0.08 0.18 0.06
HEALTH CARE 05 0.21 0.08 0.20 0.06
COMPUTER AND INFORMATION 06 0.21 0.07 0.20 0.04
INDUSTRIAL GOODS 07 0.20 0.03 0.18 0.04
NATURAL RESOURCES 08 0.12 0.04 0.10 0.02
OIL AND GAS 09 0.11 0.03 0.10 0.01
SERVICES 10 0.12 0.03 0.12 0.01
Note: LTLEV = Long-term leverage and is measured as long-term debt over total assets; STLEV = Short-term leverage and is measured as short-term debt over
total assets. Nigerian Stock Exchange (NSE) classified firms into 12 different industries. However, this study excludes financial service and utility
firms

179
Appendix: 5.9a Determinants of Long-term Leverage and SOA Across Industries
LTLEV
AGRICULTURE CONGLOMERATE CONSTRUCTION
REAL ESTATES
CONSUMER GOODS HEALTH CARE
Coef. Std Err. Coef. Std Err. Coef. Std Err. Coef. Std Err. Coef. Std Err.
_Cons .1026228 .0798823 .0046234 .0421686 .2461445*** .0371559 .0697963** .031558 .077870*** .0537065
L1 .4503981*** .0921211 .6036282*** .1392186 .1203785 .1144568 .302027*** .0474014 .374828*** .0585648
PROF .2536758 .1648633 -.1984041*** .0977651 -.0679235 .0635874 -.43108*** .0685862 .2356721* .1226758
ASTANG .1699258** .0860496 .315825*** .032348 .1188395*** .028586 .144814*** .0156428 .486853*** .0354124
SIZE -.0007629 .0096544 .0118555*** .0044935 -.0145548*** .003636 .011109*** .0038611 .0085914 .0071222
GROWT -.2156511 .3924609 .1348605** .0727328 -.0124646* .0070512 .0084743 .0183216 -.0329174 .0230963
AGE -.0000324 .0004734 -.000445 .0003471 .0001566 .0002143 -.000071 .0003745 -.0005949 .0006491
RISK .0002901 .0011154 -.0018472*** .0006498 -.0001753 .0006174 .0003662 .0006599 .0023932** .0012158
LIQUID -.017575* .0092276 .0011525 .0019176 -.0047301 .0076901 -.0040901 .0043513 -.0022492 .0039429
LTLEV
COMPUTER &
INFORMATION
TECHNOLOGY
INDUSTRIAL
GOODS
NATURAL
RESOURCES
OIL AND GAS SERVICES
Coef. Std Err. Coef. Std Err. Coef. Std Err. Coef. Std Err. Coef. Std Err.
_Cons .1679973*** .0344826 .1859137*** .0326403 .3096676*** .0712158 -.00590 .124552 -.004826 .0483645
L1 .5420725*** .0473275 .154789*** .048441 .2729353*** .0462573 .02299 .0413146 .727852*** .0296011
PROF -.2787154*** .0872161 -.0316016 .0791417 .0650966 .2171913 .35822*** .0566092 .019565 .079275

180
ASTANG .4617426*** .0819582 .173943*** .0224167 .4494334*** .0286238 .20143*** .0200641 .336940*** .0247734
SIZE -.0144895*** .004644 -.0040243 .004321 -.0336264*** .0098296 .0067161 .0066966 .007149 .0083654
GROWT
H
-.002908 .0094112 .028192 .0438073 -.0159374 .028508 .08341*** .0059216 .055804* .0304286
AGE .000299 .0002083 .0001489 .0004256 -.0009336* .0005368 .000221 .0002117 -0.000415 .0004232
RISK -.0006804 .0007381 -.0011488* .000624 -.0019972* .0011059 .002900 .0004896 .000978* .0005916
LIQUID .0137029 .0090442 .0004019 .0035726 .024912* .0134487 .00760*** .0027025 .0035545 .0053603
TOTLEV= Total leverage, measured as total debt over total assets. LTLEV = Long-term leverage, measured as long-term debt over total assets. STLEV
= Short-term leverage, measured as short-term debt over total assets. L1= Lagged Value of the dependent variable. PROF = Profitability, measured as the
ratio of operating profit to the total assets’ book Value. ASTANG = Asset tangibility, measured as ratio of fixed asset to total asset. SIZE = Firm size,
measured as natural log of sales. GROWTH = Firm growth, measured as percentage change in revenues. AGE = Firm Age, measured as the number of
years in the business. RISK = Business risk and is measured as the standard deviation of return on assets. LIQUID = Liquidity and is measured as the ratio
of current asset to current liability. *** shows highest level of significant at 0.01, while ** and * shows significance at 0.10 respectively.

181
Appendix: 5.9b: Determinants of Short-term Leverage and SOA Across Industries
STLEV
AGRICULTURE CONGLOMERATE CONSTRUCTION
REAL ESTATES
CONSUMER GOODS HEALTH CARE
Coef. Std Err. Coef. Std Err. Coef. Std Err. Coef. Std Err. Coef. Std Err.
_Cons .0528888 .0353336 .0133771 .0169002 .115358*** .0443623 .157229*** .0255855 .273988*** .0438293
L1 .1165766 .1035259 .0350477 .0324483 .488969*** .0574825 .185253*** .0509029 .1443855** .0681192
PROF -.1119769 .0810815 -.0980337** .0492188 .0283465 .0804359 -.0335566 .0590974 .1891017* .1047722
ASTANG .2106263*** .0450014 -.0014188 .0135411 -.0597297 0377832 .082043*** .0131156 .0386691 .0292067
SIZE -.0005437 .0039777 .0117258*** .0023257 -.011267** .0046000 -.0120288 .0031379 -.03167*** .0061251
GROWTH -.3951696** .1829786 .5923815*** .0335092 -.0160552* .0091304 -.0099700 .0156404 -.0101443 .0208116
AGE -.0003557 .0002734 -.0002503 .0001599 -.0000399 .0003545 -.0000403 .0003252 -.0005094 .0005352
RISK .0028302*** .0005825 -.0001579 .0003091 .002649*** .0007259 -.0002225 .0005742 .0000754 .0009387
LIQUID .0057615 .0053889 -.007176 *** .0012973 -.0042774 .0103776 -.0031725 .0043055 .009624*** .0031742
STLEV
COMPUTER &
INFORMATION
TECHNOLOGY
INDUSTRIAL
GOODS
NATURAL
RESOURCES
OIL AND GAS SERVICES
Coef. Std Err. Coef. Std Err. Coef Std Err. Coef. Std Err. Coef. Std Err.
_Cons .0931066** .042172 .0235443 .0275015 .247482*** .0826659 0.325741** .051889 .005980 .0395155
L1 .0905008 .0590448 .3202167*** .0445856 .334524*** .0884424 -0.0819*** .038778 .22609*** .0457903
PROF -.1278932 .117358 .1235406* .0645327 .0036149 .2716682 -0.2757*** .0543851 -.09410 .0604861

182
ASTANG .6957682*** .1080596 .214234*** .0199365 .0846399** .040255 0.15708*** .0194259 .16408*** .0198705
SIZE -.0092853 .0061436 .0018911 .0037696 -.03368*** .0107295 0.016260** .0068298 .00176 .0065704
GROWTH -.0035056 .0120473 .0187123 .0349358 .0529599 .0326463 -0.010036* .0058904 .03426 .0250104
AGE .0009544*** .0002178 -.000343 .0003152 -.0007682 .0007346 -0.00014 .0002238 .000221 .0003158
RISK .0023146** .0010238 -.0009241* .0005445 -.0013237 .0012142 0.00164*** .0004336 -.00054 .0004926
LIQUID -.008628 .0107295 -.0049462 .0033696 .0198233 .0163412 0.00159 .0023229 -.00109 .0045542
TOTLEV= Total leverage, measured as total debt over total assets. LTLEV = Long-term leverage, measured as long-term debt over total assets. STLEV =
Short-term leverage, measured as short-term debt over total assets. L1= Lagged Value of the dependent variable. PROF = Profitability, measured as the ratio
of operating profit to the total assets’ book Value. ASTANG = Asset tangibility, measured as ratio of fixed asset to total asset. SIZE = Firm size, measured
as natural log of sales. GROWTH = Firm growth, measured as percentage change in revenues. AGE = Firm Age, measured as the number of years in the
business. RISK = Business risk and is measured as the standard deviation of return on assets. LIQUID = Liquidity and is measured as the ratio of current
asset to current liability. *** shows highest level of significant at 0.01, while ** and * shows significance at 0.10 respectively

183
Table 6.3 Comparing the Adjustment Speed Across Different Industry
AGRICULTURE CONGLOMERATE CONSTRUCTION
REAL ESTATES
CONSUMER GOODS
TOTLEV LTLEV STLEV TOTLE
V
LTLEV STLEV TOTLEV LTLEV STLEV TOTLEV LTLEV STLEV
L1 .4194*** .4339*** .0895 .3282*** .4780*** -.0046 .3576 .0732 0.4970 .4901*** .3020*** .1853***
PROF .1827 .1667 -.1018 -.614*** -.3157*** -.1615*** -.0292 -.0418 0.0008 .0975*** -.431*** -.0336
ASTNG .3180*** .1945** .1899*** .4620*** .3755*** .0317** .0915* .1194*** -0.0615 .0217*** .1448*** .0820***
SIZE -.0077 .0114*** -.0021 .0458*** .0217*** .0165*** -.0274*** -.016*** -0.0105 .0052 .0111*** -.0120
GROW
TH -.8622** -.1338 -.4588** .6981*** .1218* .5759*** -.0284** -.0114 -0.0170 .0254 .00847 -.0099
AGE -.0014 -.0001 -.0008** .0006 .0002 .0005** -.0002 .0003 -0.0002 .0005 -.0001 -.0000
RISK .0035** .0013 .0032*** -.002*** -.0018*** -.0002 .0021** -.0003 0.0028 .0009 .00037 -.0002
LIQUI
D -.0190* -.0140 .0006 -.0001 -.0011 -.0037*** -.0128 -.0036 -0.0056 .0064** -.0041 -.0032
HEALTH CARE COMPUTER
& IT
INDUSTRIAL
GOODS
NATURAL
RESOURCES
TOTLEV LTLEV STLEV TOTLE
V
LTLEV STLEV TOTLE
V
LTLEV STLEV TOTLEV LTLEV STLEV
L1 .4446*** .3748*** .1444** .2570*** .5421*** .0905 .2390*** .1548*** .3202*** .2766*** .2729*** .3345***
PROF .4726*** .2357* .1891* -
.4443***
-.2787*** -.1279 .0963 -.0316 .1235* .1431 .0651 .0036
ASTNG .5406*** .4869*** .0387 .2497*** .4617*** .6958*** .3886*** .1739*** .2142*** .5720*** .4494*** .0846**
SIZE -.0250** .0086 -.0317*** -.0190** -.0145*** -.00929 -.0007 -.0040 .0019 -.0657*** -.034*** -.0336***

184
GRWT -.0297 -.0329 -.0101 -.0043 -.0029 -.0035 -.0020 .0282 .0187 .0281 -.0159 .0529
AGE -.0012 -.0006 -.0005 .0010*** .0003 .0009*** .0002 .0001 -.0003 -.0020** -.0009* -.0008
RISK .0012 .0024** .0007 .0009 .5421*** .0023** -.0017* .1548*** -.0009* -.0019 .2729*** -.0013
LIQUI
D
.0072 -.0022 .0096*** .0110 -.2787*** -.0086 -.0081 -.0316 -.0049 .0279 .06509 .0198
OIL AND GAS SERVICES TOTLEV= Total leverage, measured as total debt over total
assets. LTLEV = Long-term leverage, measured as long-term
debt over total assets. STLEV = Short-term leverage, measured
as short-term debt over total assets. L1= Lagged Value of the
dependent variable. PROF = Profitability, measured as the ratio
of operating profit to the total assets’ book Value. ASTANG =
Asset tangibility, measured as ratio of fixed asset to total asset.
SIZE = Firm size, measured as natural log of sales. GROWTH
= Firm growth, measured as percentage change in revenues.
AGE = Firm Age, measured as the number of years in the
business. RISK = Operating risk and is measured as the standard
deviation of return on assets. LIQUID = Liquidity and is
measured as the ratio of current asset to current liability. The
Results are approximated to 4 decimal places.
TOTLEV LTLEV STLEV TOTLEV LTLEV STLEV
L1 .1656** .0229 -.0819*** .5950*** 0.7278*** .2260***
PROF .0832 .3582**
*
-.2757*** .0010 0.0196 -.0941
ASTAN
G
.4214*** .2014**
*
.1571*** .5255*** 0.3369*** .1641***
SIZE .0184* 0.0067 .0163** .0100 0.0071 .0018
GRWT .0554*** 0.0834*
**
-.0100* .0493 0.0558* .0343
AGE -.0002 0.0002 -.0001 .0002 -0.0004 .0002
RISK .0045*** 0.0229 .0016*** .0002 0.7279*** -.0005
LIQUI
D
.0093** 0.3582*
**
0.0016 .0015 0.01956 -.0011