A Study of Key Accounting Principles for Financial Reporting ...
128
University of Mississippi University of Mississippi eGrove eGrove Honors Theses Honors College (Sally McDonnell Barksdale Honors College) Spring 5-9-2020 A Study of Key Accounting Principles for Financial Reporting A Study of Key Accounting Principles for Financial Reporting through Analysis of Case Studies through Analysis of Case Studies Brent Austin Thomas University of Mississippi Follow this and additional works at: https://egrove.olemiss.edu/hon_thesis Part of the Accounting Commons Recommended Citation Recommended Citation Thomas, Brent Austin, "A Study of Key Accounting Principles for Financial Reporting through Analysis of Case Studies" (2020). Honors Theses. 1296. https://egrove.olemiss.edu/hon_thesis/1296 This Undergraduate Thesis is brought to you for free and open access by the Honors College (Sally McDonnell Barksdale Honors College) at eGrove. It has been accepted for inclusion in Honors Theses by an authorized administrator of eGrove. For more information, please contact [email protected].
-
Upload
khangminh22 -
Category
Documents
-
view
1 -
download
0
Transcript of A Study of Key Accounting Principles for Financial Reporting ...

University of Mississippi University of Mississippi
eGrove eGrove
Honors Theses Honors College (Sally McDonnell Barksdale Honors College)
Spring 5-9-2020
A Study of Key Accounting Principles for Financial Reporting A Study of Key Accounting Principles for Financial Reporting
through Analysis of Case Studies through Analysis of Case Studies
Brent Austin Thomas University of Mississippi
Follow this and additional works at: https://egrove.olemiss.edu/hon_thesis
Part of the Accounting Commons
Recommended Citation Recommended Citation Thomas, Brent Austin, "A Study of Key Accounting Principles for Financial Reporting through Analysis of Case Studies" (2020). Honors Theses. 1296. https://egrove.olemiss.edu/hon_thesis/1296
This Undergraduate Thesis is brought to you for free and open access by the Honors College (Sally McDonnell Barksdale Honors College) at eGrove. It has been accepted for inclusion in Honors Theses by an authorized administrator of eGrove. For more information, please contact [email protected].
A Study of Key Accounting Principles for Financial Reporting through Analysis of Case
Studies
By
Brent Austin Thomas
A thesis submitted to the faculty of The University of Mississippi in partial fulfillment of
the requirements of the Sally McDonnell Barksdale Honors College.
Oxford, Mississippi
May 2020
Approved by
_____________________________
Advisor: Dr. Victoria Dickinson
_____________________________
Reader: Dr. W. Mark Wilder

ii
© 2020
Brent Austin Thomas
ALL RIGHTS RESERVED

iii
ACKNOWLEDGEMENTS
First and foremost, I cannot express in words how thankful I am for my parents who have
invested so much into mending me into the man I am today. The love and support that I
receive from them and my siblings has enabled me to continue to push forward in pursuit
of my educational and professional goals throughout my life.
Thank you to the Sally McDonnell Barksdale Honors College, the Patterson School of
Accountancy, and all of my professors for encouraging me to strive for excellency during
my undergraduate experience at the University of Mississippi.

iv
ABSTRACT
BRENT AUSTIN THOMAS: A Study of Key Accounting Principles for Financial
Reporting through Analysis of Case Studies
(Under the Direction of Victoria Dickinson)
The following thesis is a compilation of the solutions and analyses derived from twelve
different case studies covering a variety of topics related to financial accounting
standards in accordance with the Generally Accepted Accounting Principles as set forth
by the Financial Accounting Standards Board. These case studies demonstrate how key
accounting principles studied in academia are adapted into practice by businesses for
financial reporting. Through the case studies, the real-world presentations of financial
statements are analyzed in order to establish a knowledge of the current accounting
climate and promote understanding of specific accounting topics. The case studies were
completed under the direction of Dr. Victoria Dickinson in fulfillment of the
requirements for the University of Mississippi, Sally McDonnell Barksdale Honors
College, and Patterson School of Accountancy ACCY 420 course in the 2019-2020
academic year.
v
TABLE OF CONTENTS
LIST OF FIGURES ..................................................................................................vi
Case 1: Google Fusion ..............................................................................................1
Case 2: Rocky Mountain Chocolate Factory, Inc. ....................................................8
Case 3: In-Class Debate ............................................................................................16
Case 4: General Bank ................................................................................................23
Case 5: City Comparison ..........................................................................................31
Case 6: WorldCom, Inc. ............................................................................................51
Case 7: Starbucks Corporation ..................................................................................59
Case 8: BP p.l.c. ........................................................................................................71
Case 9: The Wendy’s Company ...............................................................................79
Case 10: Johnson & Johnson ....................................................................................88
Case 11: On the Balance Sheet-Based Model of Financial Reporting .....................101
Case 12: Google Inc. .................................................................................................111
Bibliography ..............................................................................................................118

vi
LIST OF FIGURES
Case 2: Rocky Mountain Chocolate Factory, Inc.
Figure 2-1: Rocky Mountain Chocolate Factory, Inc. General Ledger .......12
Figure 2-2: Rocky Mountain Chocolate Factory, Inc. Income Statement ....13
Figure 2-3: Rocky Mountain Chocolate Factory, Inc. Balance Sheet ..........14
Figure 2-4: Rocky Mountain Chocolate Factory, Inc. Cash Flows .............15
Case 5: City Comparison
Figure 5-1: Dallas Monthly Budget ..............................................................49
Figure 5-2: Houston Monthly Budget ...........................................................49
Case 7: Starbucks Corporation
Figure 7-1: Starbucks Consolidated Statement of Earnings ........................65
Figure 7-2: Starbucks Consolidated Balance Sheets ....................................66
Case 10: Johnson & Johnson
Figure 10-1: Hypothetical Retirement Flowchart ........................................96
Figure 10-2: Projected Benefit Obligation and Plan Assets ........................96

1
Case 1: Google Fusion Data Analytics
Brent Thomas
09/03/2018

2
TABLE OF CONTENTS
1.1 Case Introduction ................................................................................................3
1.2 Purpose of Google Fusion ...................................................................................4
1.3 Use of Google Fusion in a Business Setting .......................................................4
1.4 Memo to Partner .................................................................................................6

3
1.1 CASE INTRODUCTION
With the rapid growth of technology and data collection, businesses of all kinds
have begun integrating the use of data analytics programs into their planning and
operations. Data analytics tools are used to sort through data in order to identify trends,
patterns, abnormalities, and much more. As a result, the field of data analytics has
received a lot of attention from a plethora of organizations, especially those in the field of
accounting. Firms and other entities can now collect astronomical amounts of data, and
with the use of data analytics tools, users possess the ability to comb through larger data
sets than on traditional spreadsheets with efficiency and speed. Analysis on spreadsheet
data has always been done by accountants; however, with the use of specialized programs
like Alteryx, Domo, Google Fusion, Hadoop, and many others, accountants can dig
deeper into the numbers to find out what is really going on in businesses for tax and audit
purposes.
Before doing the research for this case study, I had been hearing “data analytics”
a lot and actually even did some research on Python and Tableau for the purpose of
attempting to learn how to use the systems and also standing out in the accounting
recruiting process. I never had any actual knowledge about how to implement these
different programs in the field of accounting; however, after researching Google Fusion
and learning more about data analytics, I realized that these tools can be used for a wide
variety of different uses to improve efficiency in all businesses.

4
1.2 PURPOSE OF GOOGLE FUSION
Identify the purpose of this tool and describe, in general, how it is used to make business
decisions.
Google Fusion (or Fusion Tables) is a popular data management platform that is
user friendly and allows for real-time collaboration. Fusion Tables is cloud-based and
allows for integration of data from multiple different databases. Google Fusion can be
used with a few different application programming interfaces (APIs) which enable users
to collect data, produce graphs and charts, upload information to the web, have secure
collaboration, and create a Google Map layer. With Google Fusion Tables, users can
transform data from spreadsheets into almost any type of visual: pie charts, line plots,
scatter plots, timelines, bar charts, and geographical maps. The ability to transform
massive spreadsheets into a visual representation provides many opportunities in the
business world. Thousands of rows and columns of data by itself provides little help to
managers and executive offers, but when put into a visual, easy-to-read format, Google
Fusion can be used to make informed business decisions and predictions.
1.3 USE OF GOOGLE FUSION IN A BUSINESS SETTING
How, specifically, would you use the tool in the following business settings? Create at
least three specific scenarios for each category in which the tool would lead to more
efficiency and/or better effectiveness. Be sure to describe what kinds of data your tool
would use for each scenario.
a. Auditing
1. One of the most important features of Google Fusion Tables is its ability to

5
evaluate spreadsheet information using maps. One example of when this could be
extremely beneficial for audit purposes is that it can create a geographical heat
map to see if any branches of a business have more returns and warranty claims
than others, which could be a sign of stealing or other problems internally.
2. Another possibility of the heat map function of Google Fusion is to create a risk
heat map for businesses. This practice has become increasingly popular among
accounting firms to assess risk during strategic planning. This can be done by
evaluating potential risks based off of historical data from spreadsheets and then
making predictions. Once the data is in Google Fusion, the user can visualize the
predictive value of the data in a heatmap.
3. Google Fusion can also help improve efficiency in internal auditing by
continuously updating its spreadsheets on a quasi-regular basis. This will help
identify risks and anomalies in the data.
4. Accountants in the field of audit often have to be on the road visiting client
locations. Google Fusion uses a cloud-based platform that allows users to be able
to access the Fusion Tables from anywhere with internet access. This can increase
efficiency in the audit process by having the information from the company’s data
center sent directly to a team of auditors that don’t necessarily need to be on site,
saving money and time.
b. Tax Planning
1. Companies are often trying to pay the legal minimum tax rate. However, tax
codes differ between states and countries. Google Fusion can be used to make a
map of all a company’s locations and mark the difference in tax codes for each

6
location, in order to pay the least amount possible. This can also be helpful when
deciding on potential new locations.
2. Google Fusion can also be used add value to regular tax information. Federal
income tax information can be displayed to compare book income of a company
against its taxable income. Google Fusion can preview that information in a form
that can be easily read and interpreted by users.
3. Google Fusion provides easy visualization of large amounts of data. The charts
and graphs that can be made with Fusion Tables can be used to look at
transactional data, highlight any abnormalities, and investigate the discrepancies.
1.4 MEMO TO PARTNER
Write a few paragraphs to your future public accounting partner explaining why your
team should invest in the acquisition of and training in this tool. Explain how the tool will
impact the staffing and scope of your future engagements.
To: Jaret Lieberth, Partner
From: Brent Thomas
Date: September 3, 2018
Subject: Investment in Google Fusion
Extensive research on Google Fusion Tables has revealed that our firm should implement
use of the data management platform. In the age of information, our firm would benefit
greatly from the acquisition of this tool, and we would be left behind without it or another
data analytics program. Google Fusion Tables would provide our firm with the ability to
gather, visualize, and share data tables from multiple spreadsheets for clients.

7
With its ease of use, integration with the internet, and collaboration features, Fusion
Tables would be an easy tool to train employees to use. Google Fusion uses spreadsheets
in order to analyze the data and map it, so users are not required to learn how to code or
use data formats. Not only would this tool be easy to use and implement, it is also free to
acquire and use. This would save the firm a lot of money because most other data
analytics tools are extremely expensive and require setup and security, which Google
Fusion does not.
A major component of Google Fusion’s allure is that it uses other Google programs to its
benefit, like Google Earth. The accuracy of Google’s other programs enhances the
visualization effects of using Fusion Tables. The Google Fusion mapping visuals provide
a variety of opportunities to distinguish our firm from others to get more clients. Google
Fusion’s ability to process large amounts of data in a timely manner will increase
efficiency and allow the scope of our future engagements to become larger as a result.
With Google Fusion, our firm will be able to provide detailed information with
geographical visualizations as well as expand the amount of data in our spreadsheets.
With our firm’s future in mind, it is in our best interest to invest in the implementation of
Google Fusion.

8
Case Two: Rocky Mountain Chocolate Factory, Inc.
Financial Statement Analysis
Brent Thomas
09/10/2018

9
TABLE OF CONTENTS
2.1 Case Introduction ........................................................................................................... 10
2.2 Case Analysis ................................................................................................................. 11

10
2.1 CASE INTRODUCTION
Rocky Mountain Chocolate Factory is an international corporation that deals in
the business of premium chocolate candies and other confectionary products. In this case
study, I had to create a simple spreadsheet which included developing a trial balance, an
income statement, a balance sheet, and an identification of cash flow transactions. In
order to do this, I had to record transactions as journal entries and determine how they
affected various debit and credit accounts in the trial balance. After all the transactions
were recorded and adjustments were made, I had to connect the accounts in the trail
balance to the income statement and, then, the balance sheet. Using the information given
in the case study, I was able to match numbers in my simple spreadsheet to those in
Rocky Mountain Chocolate Factory's actual financial statements from the period ending
August 28, 2010.
Through the completion of this case study, I was able to learn a lot about the
functions of excel that were applicable to the world of accounting. Also, I was able to
figure out how to format charts and cells, as well as insert functions into cells to connect
the trial balance, income statement, and balance sheet. Through the use of those
functions, I was able to further see the linkages between the financial statements that I
have been studying in my accounting classes.

11
2.2 CASE ANALYSIS
a. Prior to examining the company’s actual balance sheet, read the description of Rocky
Mountain Chocolate Factory, above.
After reading the description for Rocky Mountain Chocolate Factory, I expected
to see sales, franchise fees, and royalties on the balance sheet. Inventories of candies
and other confectionery products and accounts receivable will constitute the major
assets. Major liabilities will consist of wages payable and other payables.
b. Based on the transactions recorded, list at least three adjustments or reclassifications
that might need to be made prior to preparing the final financial statements.
In the normal course of business, most companies make adjusting journal entries.
In this situation, Rocky Mountain Chocolate Factory will most likely have to make
adjustments to depreciation and amortization expense, accrued salaries and wages, and
deferred income in the general ledger before financial statements can be issued.

12
Figure 2-1: Rocky Mountain Chocolate Factory, Inc. General Ledger
Description JE # Account Debit Credit
Purchase inventory 1 Inventories 7,500,000
Accounts payable 7,500,000
Incur Factory wages 2 Inventories 6,000,000
Accrued salaries and wages 6,000,000
Sell inventory for cash and on account 3 Cash and cash equivalents 17,000,000
Accounts receivable 5,000,000
Cost of sales 14,000,000
Sales 22,000,000
Inventories 14,000,000
Pay for inventory 4 Accounts payable 8,200,000
Cash and cash equivalents 8,200,000
Collect receivables 5 Cash and cash equivalents 4,100,000
Accounts receivable 4,100,000
Incur SG&A (cash and payable) 6 Sales & marketing 1,505,431
General and administrative 2,044,569
Retail operating 1,750,000
Cash and cash equivalents 2,000,000
Other accrued expenses 3,300,000
Pay wages 7 Accrued salaries and wages 6,423,789
Cash and cash equivalents 6,423,789
Receive franchise fee 8 Cash and cash equivalents 125,000
Deferred income 125,000
Purchase PPE 9 Property and Equipment, Net 498,832
Cash and cash equivalents 498,832
Dividends declared and paid 10 Retained earnings 2,407,167
Cash and cash equivalents 2,403,458
Dividend payable 3,709
Adjust for inventory count A-12 Cost of sales 216,836
Inventories 216,836
Record depreciation A-13 Depreciation and amortization 698,580
Property and Equipment, Net 698,580
Wage accrual A-14 General and administrative 639,200
Retail operating 6,956
Accrued salaries and wages 646,156
Brent Thomas
Rocky Mountain Chocolate Factory, Inc.
General Ledger
For the Year Ended February 28, 2010

13
Figure 2-2: Rocky Mountain Chocolate Factory, Inc. Income Statement
Column1 Column2
Revenues
Sales 22,944,017
Franchise and royalty fees 5,492,531
Total revenues 28,436,548
Costs and Expenses
Cost of sales, exclusive of depreciation and amortization expense of
$336,009, $370,485 and $389,273, respectively 14,910,622
Franchise costs 1,499,477
Sales & marketing 1,505,431
General and administrative 2,422,147
Retail operating 1,756,956
Depreciation and amortization 698,580
Total costs and expenses 22,793,213
Operating Income 5,643,335
Other Income (Expense)
Interest expense 0
Interest income 27,210
Other, net 27,210
Income Before Income Taxes 5,670,545
Income Tax Expense 2,090,468
Net Income 3,580,077
Basic Earnings per Common Share 0.6
Diluted Earnings per Common Share 0.58
Weighted Average Common Shares Outstanding 6,012,717
Dilutive Effect of Employee Stock Options 197,521
Weighted Average Common Shares Outstanding, Assuming Dilution 6,210,238
Brent Thomas
Rocky Mountain Chocolate Factory, Inc.
Income StatementFor the Year Ended February 28, 2010

14
Figure 2-3: Rocky Mountain Chocolate Factory, Inc. Balance Sheet
Column1 Column2
Assets
Current Assets
Cash and cash equivalents 3,743,092
Accounts receivable, less allowance for doubtful accounts of
$395,291 and $332,719, respectively 4,427,526
Notes receivable, current 91,059
Inventories, less reserve for slow moving inventory of
$263,872 and $251,922, respectively 3,281,447
Deferred income taxes 461,249
Other 220,163
Total current assets 12,224,536
Property and Equipment, Net 5,186,709
Other Assets
Notes receivable, less current portion 263,650
Goodwill, net 1,046,944
Intangible assets, net 110,025
Other 88,050
Total other assets 1,508,669
Total assets 18,919,914
Liabilities and Stockholders’ Equity
Current Liabilities
Accounts payable 877,832
Accrued salaries and wages 646,156
Other accrued expenses 946,528
Dividend payable 602,694
Deferred income 220,938
Total current liabilities 3,294,148
Deferred Income Taxes 894,429
Commitments and Contingencies
Stockholders’ Equity
Preferred stock, $.10 par value; 250,000 authorized;
0 shares issued and outstanding
Series A Junior Participating Preferred Stock, authorized 50,000 shares
Undesignated series, authorized 200,000 shares
Common stock, $.03 par value; 100,000,000 shares authorized;
6,026,938 and 5,989,858 shares issued and outstanding, respectively 180,808
Additional paid-in capital 7,626,602
Retained earnings 6,923,927
Total stockholders’ equity 14,731,337
Total liabilities and stockholders’ equity 18,919,914
Brent Thomas
Rocky Mountain Chocolate Factory, Inc.
Balance Sheet
As of February 28, 2010

15
Figure 2-4: Rocky Mountain Chocolate Factory, Inc. Cash Flows
Column1 Column2
Transactions Section of the Statement of Cash Flows
1. Purchase inventory Operating
2. Incur Factory wages Operating
3. Sell inventory for cash and on account Operating
4. Pay for inventory Operating
5. Collect receivables Operating
6. Incur SG&A (cash and payable) Operating
7. Pay wages Operating
8. Receive franchise fee Investing
9. Purchase PPE Investing
10. Dividends declared and paid Financing
11. All other transactions -
12. Adjust for inventory count Operating
13. Record depreciation Operating
14. Wage accrual Operating
15. Consultant's report -
16. Closing entry -
Brent Thomas
Rocky Mountain Chocolate Factory, Inc.
Cash Flows
For the Year Ended February 28, 2010

16
Case Three: In-Class Debate
Situational Analysis
Brent Thomas
09/18/2018

17
TABLE OF CONTENTS
3.1 Case Introduction ................................................................................................18
3.2 Situation One ......................................................................................................19
3.3 Situation Two ......................................................................................................20
3.4 Situation Three, Part 1 ........................................................................................21
3.5 Situation Three, Part 2 ........................................................................................22

18
3.1 CASE INTRODUCTION
Talking about potential career options is always something I have enjoyed. I
switched to Accounting from a Biochemistry/Pre-Med track, and since then, the options
for my future have opened up exponentially. With an accounting degree, students can go
into any business field and be ready to succeed. The portability of the degree is one of the
many logistical reasons that I ended up switching over to accounting. In our third class
period, we discussed a few scenarios that accounting majors may experience. The class
went over three situations in an in-class debate between the students, which was
monitored by Dr. Dickinson. During this debate, the class engaged in talks about several
potential career options for accounting majors. We examined the fallacies of some of the
arguments and were able to listen to Dr. D’s pieces of wisdom on the subjects.
I learned a lot about how big the decisions we are about to make about internships
and firms will affect us in the immediate future. As a current student trying to get an
accounting internship, I realized a lot more that what firm and location I try to go to
should be a top concern. Also, I now understand the investment that the firms make into
recruiting and training students. While I don’t know exactly what my future holds, I can
say with confidence that I will be trying to go the public accounting route for as many
years as I can.

19
3.2 SITUATION ONE
Situation:
One student is speaking to another about internships. You overhear their conversation in
Conner Hall. One student talks about how they are going to attend law school after he
completes his 8 week internship with “Big Four” firm. He wants to do Tax Law in a law
firm rather than in an accounting firm.
Response:
This situation involves one student who wants to go to law school after
completing his accounting internship at “Big Four” firm. While law school may be a
good decision for him, it is also not a given that the student will get into law school
because it is competitive. The accounting program at Ole Miss almost guarantees job
placement out of college, which is a benefit of going the accounting route. A student out
of law school makes more money than a student with an accounting degree out of
college; however, it costs a lot of money to go to law school. Another thing that the
student may not be thinking about is the opportunity cost of going to law school instead
of accepting his job offer from “Big Four” firm. While the student pays to go to law
school, the student that accepts their accounting firm offer will be making money and
making their way up the ranks in the firm. Personally, I see this as the best route, but it is
up to personal preference if the student would rather be in an accounting firm or law firm.
20
3.3 SITUATION TWO
Situation:
Two students are talking with another about their goals for after they complete their
accounting internships and graduate. The first two students explain their desires to leave
public accounting within their first couple years and then get a job in investment banking
and consulting. The third student asked why the other two students were doing
accounting as their major and internships if they wanted to go investment banking the
entire time.
Response:
I somewhat sympathize with the two students wanting to use their accounting
degree as a building block, especially because of how portable and good an accounting
degree looks to businesses. After all, accounting is the language of business and is the
structural framework of most business. This would provide the students with a great
opportunity to start their careers and have a stable income while trying to explore their
passions. However, it could be beneficial for the students to change their major in order
to streamline the process of getting into investment banking. The students also have the
opportunity of keeping their accounting degrees while looking for internships in
investment banking instead of accepting the accounting internship and the job that comes
with it. On the side of the students wanting to go accounting for a couple years then
changing though, they could build connections through the accounting firm and stay until
the investment banking opportunities come to them. Ultimately, only 20 percent of
people in accounting firms make it to partner anyway, so it’s not the end of the world if

21
they end up leaving. Although I am going into accounting to do public accounting and
work my way up in a firm, I could see myself leaving if a high paying job, with
something I’m passionate about, was irrefutable.
3.4 SITUATION THREE, PART ONE
Situation:
A student emails Dr. D to ask for advice on a potential transfer of locations after his
around six-week internship. The student received an offer from Washington D.C. but
wants to go to Dallas.
Response:
Although I understand the student’s situation, I think that they are a little late in
the game to be wanting to switch. Deciding on where to do a student’s internship is a big
deal. The place you decide on isn’t only for a 6-week internship. The location and firm
are where your career as a public accountant will begin. This scenario reminds me of
choosing a college. I was not even a legal adult when making that decision, and it was a
huge decision that ultimately affected the rest of my life. I chose to come to Ole Miss
where I knew zero people at all and hadn’t even been on campus before. I chose to
branch out and try something new, and it ended up being the best decision I had ever
made. When it comes to making big decisions that are big changes in our lives, it is a
daunting challenge, but you can’t just give up after 6 weeks. The student sounds
somewhat homesick and should try stepping out of their comfort zone. The student
should definitely give Washington D.C. a shot and try to make connections there.
22
3.5 SITUATION THREE, PART TWO
Situation:
Dr. D responded to the student with excitement about staying committed to the firm and
gave advice that transferring is difficult and that the student should talk to the recruiter.
She also says that each location has a limited number of spots and that, specifically, the
move to Dallas would be even more difficult.
Response:
When it comes to situations like this, it helps to remember that the members of
accounting firms and their recruiters are normal people. If you are transparent with the
recruiter about why you want to switch or what your concerns are, they will most likely
be able to help transfer the job offer or help with getting used to the area. The immediate
transfer might not even be possible as sometimes firms only hire those who got
internships in their location. While the immediate transfer to Dallas might be hard, the
student will have an opportunity to request a transfer later if they perform at a high level.
To avoid this situation altogether, the student should have just thought about where they
wanted to go ahead of time and worked towards getting the Dallas internship in the first
place.

23
Case Four: General Bank
Accounting for Debt Securities Sales and Impairments
Brent Thomas
10/1/2018

24
TABLE OF CONTENTS
4.1 Case Introduction ........................................................................................................... 25
4.2 Question One ................................................................................................................. 26
4.3 Question Two ................................................................................................................. 27
4.4 Question Three ............................................................................................................... 28
4.5 Question Four ................................................................................................................ 29
4.6 Question Five ................................................................................................................. 30

25
4.1 CASE INTRODUCTION
The fourth case, Generic Bank: Accounting for Debt Securities Sales and
Impairments, discussed available for sale securities and the accounting rules for debt
security impairment. The case focused on the sale of securities and how a sale, or lack of
a sale, of an available for sale security affected the impairment of itself and other debt
securities. The case involves looking at structure, timing, and necessity of sales to see the
effect on the financial reports. Judgements were required to be made based on the facts
given in the case in tandem with the ASC rules and other accounting guidelines.
From this case, I was able to gain a lot of knowledge about banks and how they
are structured to succeed financially. The inner workings of a bank were a mystery before
this case, and through it, I learned a lot about how banks are financed and raise revenue
with extremely low capital. Another thing I learned a lot more about was trading
securities, available for sale securities, and held to maturity securities, which I had been
first exposed to in intermediate. This case required me to read and learn from the FASB
and ASC guidelines as well as look up PwC’s policy of loans and investments. These
readings gave me some perspective about the depth of knowledge required from
accountants as well as how much judgement comes into effect in real accounting.

26
4.2 QUESTION ONE
Assume that Generic Bank does sell the aforementioned securities shortly after
year end in early 20x3. Does Generic Bank have an impairment loss on the seven
securities designated above in 20x2?
Assuming that Generic Bank sold the securities, the bank has an impairment loss
on the securities for sale with CUSIP numbers ending: 003, 015, 025, 030, and 076.
According to ASC 320, impairment of an available for sale security occurs when the
security’s fair value drops beneath its amortized cost. To determine impairment, the bank
must first ascertain if the loss in value is due to credit losses or just cyclical changes in
interest rates. Because Generic Bank believes that the decline in value of the available for
sale securities are mainly due to changes in interest rates and not credit loss, the bank
needs to then decide if it has the intent and ability to hold the securities until their fair
value prices can recover. Since Generic Bank had intent to sell the securities and not hold
them, the securities at a loss are deemed impaired. The securities were sold right after the
balance sheet date, but the bank was planning to sell the securities in the year of 20x2.
Therefore, the bank would have an impairment loss on five out of the seven securities in
20x2. According to PwC, this impairment loss would be recorded as a direct write-down
of the security with an offsetting entry to net income.

27
4.3 QUESTION TWO
Assume that Generic Bank does sell the aforementioned securities shortly after
year end in early 20x3. Does Generic Bank have an impairment loss on securities other
than the seven securities sold? If so how would you determine the extent of the
impairment?
Determining impairment on securities that are not being sold requires more
judgement than securities that have intent to be sold or are more likely than not to be
required to be sold before recovery of the loss. Out of the securities that weren’t sold,
there are securities with a fair value higher than the amortized cost as well as securities
with a fair value lower than the amortized cost. ASC 326-30-35-1 implies that there is no
impairment loss for the securities with a higher fair value because those debt securities
have an unrealized gain. For the securities with a fair value lower than its amortized cost,
it needs to be determined whether there are any credit losses and if the bank has the intent
and ability to hold the securities with unrealized losses until the amortized cost basis can
be recovered. Generic Bank states that the decline in value of securities is not due to
credit losses. The bank also asserts that it has the intent and ability to hold the securities
until they mature or the unrealized losses recover. According to PwC, the available for
sale securities with an unrealized loss would have an impairment. However, the
impairment will not be recorded as a direct write-down, like the five securities in
question one. No allowance for credit loss expense should be recorded. The non-credit
impairment loss should be recorded in other comprehensive income, not affecting net
income. To determine the extent of the temporary, non-credit impairment, total the net
unrealized losses of the fifty investments (fifty-five total minus the five that were sold)

28
that are in an unrealized loss position.
4.4 QUESTION THREE
Does your answer change if you assume the role of Heather Herring, the external
auditor? Does your answer change if you assume the role of a bank regulator? What other
factors might an external auditor or regulator consider in making their determination?
Assuming the role of the external auditor, I would look more deeply into Generic
Bank’s intent and ability to hold the non-credit impaired securities. However, without the
professional knowledge and experience to determine future factors and stability of the
bank, I would not change my answer.
As a bank regulator, I would also look at the bank’s ability and intent to hold the
securities. Assuming the role of a bank regulator though, I would probably have more
information about the rise and fall of interest rates and would look into the bank’s claim
that there is no credit deterioration. I would mainly look at some of the securities with
fair values that have dropped significantly more than an interest rate might cause it to.
For example, the security for sale with CUSIP number ending in 025 has an amortized
cost of $78.333 million and a fair value of $8.285 million. This security has suffered an
extreme loss of 89.42 percent and raises questions about the legitimacy of the banks
claim.
An external auditor and a bank regulator might look at the other ways the bank
could raise the needed liquidity as well as future conditions and events.

29
4.5 QUESTION FOUR
How would your assessment of the existence of an impairment in both
requirements 1 and 2 change if the securities sold had been collectively in a net gain
position? What if all the securities sold were in gain positions?
If the securities sold had been in a net gain position, it could cover up the losses;
however, it would still have securities that would have an impairment. At the individual
security level, each gain would not have an impairment, but each security sold at a loss
would have an impairment.
If all the securities sold were in gain positions, there would be no impairment loss
at all. All the securities would have a fair value higher than its amortized cost and would
be sold for a gain.

30
4.6 QUESTION FIVE
Assume that Generic Bank does sell the aforementioned securities shortly after
year end in early 20x3. Does Generic bank have an impairment loss on securities other
than the seven securities sold?
Since Generic Bank is adequately capitalized in this scenario rather than well
capitalized, the assertion that the bank has the ability to hold onto the available for sale
securities long enough for its fair value to recover comes into question. If the change
from adequately capitalized to well capitalized causes Generic Bank to not be able to
hold its securities, an impairment has occurred and should be recorded as a direct write-
down of the security with an offsetting entry to net income. If the change does not affect
the bank’s ability to hold the securities, there will still be an impairment, but it would be
recorded to other comprehensive income. Although it was not counted as an allowance or
a credit loss expense, there was impairment when the bank was well capitalized.
31
Case 5: City Comparison
Top Two Cities for Starting Career
Brent Thomas
11/4/2018

32
TABLE OF CONTENTS
5.1 Case Introduction ................................................................................................34
5.2 Question One ......................................................................................................35
5.3 Question Two ......................................................................................................36
5.4 Question Three ....................................................................................................37
5.5 Question Four ......................................................................................................38
5.6 Question Five ......................................................................................................39
5.7 Question Six ........................................................................................................40
5.8 Question Seven ...................................................................................................41
5.9 Question Eight ....................................................................................................42
5.10 Question Nine ...................................................................................................43
5.11 Question Ten .....................................................................................................44
5.12 Question Eleven ................................................................................................45
5.13 Question Twelve ...............................................................................................46
5.14 Question Thirteen ..............................................................................................46
5.15 Question Fourteen .............................................................................................47
5.16 Question Fifteen ................................................................................................48

33
TABLE OF CONTENTS
5.17 Question Sixteen ...............................................................................................49
5.18 Question Seventeen ...........................................................................................50

34
5.1 CASE INTRODUCTION
The fifth case, City Case, involves picking the top two cities in which I am
thinking about starting my career and answering seventeen questions that will give me a
better view about where I want to live in the future. My number one city is Dallas, TX,
and my second choice is Houston, TX. An analysis of the population, climate, scenery,
healthcare, transportation, and other elements of the cities will be completed and used to
determine if these locations are the fit I am looking for in a future home.
This case gave me the opportunity to look deeper into what living in Dallas and
Houston is really like. I have visited both of these cities on a plethora of different
occasions for anything from baseball tournaments to visiting family for Christmas.
However, my knowledge of what it is like to actually live in these cities before this case
was severely lacking. After finishing this case, I have realized how much it will actually
cost to live near where I want to work. I also learned that I probably don’t want to live
with my aunts and uncles in Dallas or Houston because the commute will be longer than I
expected for both cities.

35
5.2 QUESTION ONE
What is the population?
Dallas:
The population of Dallas in 2016 was estimated at 1.3 million people and is one
of the fastest growing cities in America. The overall Dallas-Fort Worth-Arlington
metropolitan area is composed of roughly 6.8 million people making it the 7th largest
metropolitan area in the United States. The large size and growth in Dallas are very
attractive to me. Having lived in a medium sized city and a small town in Texas, I,
personally, find the larger cities more appealing. Not only are a lot of people moving to
Dallas, there are also plenty of businesses moving into the Dallas area.
Houston:
Houston, Texas, is the largest city in the entire state of Texas and the fourth
largest in the country. The city, as of 2016, is home to over 2.2 million people and is also
a part of the 5th largest metropolitan area in the United States, Houston-The Woodlands-
Sugarland. This metropolitan area has over 6 million people. Like Dallas, Houston is a
large, rapidly-growing city in Texas, which is exactly what I am looking for.

36
5.3 QUESTION TWO
Describe the climate and seasonal fluctuations.
Dallas:
Dallas has a subtropical climate that includes four distinct seasons. This is typical
for the Southern Plains of the United States. There is a wide variation of temperatures
throughout the year and even throughout the seasons themselves. Summers are hot and
can have temperatures of over 100 degrees Fahrenheit. Winters are relatively mild, and
the fall and spring have very pleasant weather. Severe weather that citizens of Dallas
might have to worry about are hail, sleet, and a possibility of tornadoes, since they are at
the most southern point of the tornado valley. Dallas has a similar climate to what I had
grown up with in Waco, Texas, and is what I am most comfortable with. The heat of the
South is what I am used to and want to experience.
Houston:
Houston, like Dallas, has a subtropical climate but has a stronger influence from
the tropics. Houston is deeper south in Texas than Dallas and therefore usually warmer
and more humid. The summers are hot and surrounded by warm spring and fall months.
The winters in Houston bring relatively mild and temperate temperatures. Houston’s
biggest threat of severe weather comes in the form of flooding. Being near the Gulf of
Mexico, Houston citizens also have to worry about the possibility of tropical storms. The
warm, humid climate of Houston is more closely related to that of Nacogdoches, Texas,
where I live now. However, Nacogdoches is in the piney woods of East Texas whereas
Houston is in more of a central area of Texas with no pine trees.

37
5.4 QUESTION THREE
Describe the city’s topography, scenery, and other geographic or geological features of
the area in which the city is located.
Dallas:
Dallas is in a mostly flat area with the Trinity River running through it. The
Trinity River Project is still in progress right now, which is improving upon the aesthetic
and recreational use of the river in the form of man-made lakes, parks and trails, and
transportation upgrades. The elevation ranges from 450 to 550 feet. Dallas also has
multiple lakes surrounding it. One of the most notable is White Rock Lake, which is a
reservoir that provides Dallas citizens with a place to boat, row, jog, and bike. White
Rock Lake also has the Dallas Arboretum and Botanical Garden located on its eastern
shore. Also, if you want to see all of downtown Dallas, Reunion Tower is the perfect
place to go. It is the famous flickering orb that has lit up the skyline since 1978. I have
been to Dallas a lot and have known about the number of nice lakes up around northern
Dallas.
Houston:
Houston is located in the Gulf Coastal Plains and is built on marshes, forested
land, swamp, and prairie. The city is very flat, like Dallas, but only 50 feet above sea
level, which leaves the residents very prone to flooding. Houston is often referred to as
the Bayou City because of the high number of slow-moving, swampy rivers, which drain

38
into the Gulf of Mexico. Notable waterways are the San Jacinto River and Cypress Creek.
Within the city and near the Medical Center, Hermann Park allows citizens to escape the
busy city. I love the location of Houston and how close it is to the coast.
5.5 QUESTION FOUR
What are the individual tax rates within the city?
Dallas:
Texas does not collect state income tax from individuals, but has a sales tax rate
of 6.25 percent. Dallas has an additional tax on sales of one percent and another one
percent for DART (Dallas Area Rapid Transit). Dallas has a property total tax rate of
2.72 percent, but specifically is $0.7804 per $100 of assessed valuation per Dallas City
Hall. Sales tax applies to retail point-of-purchase for any goods and services. The lack of
state individual income taxes in Texas is a nice benefit. As for the sales tax, that is just
something I’m used to, being from there.
Houston:
As mentioned in the Dallas section of the question, Texas does not collect a state
income tax. The same sales tax rate of 6.25 percent applies to Houston along with a 1
percent sales tax for Houston and another 1 percent for a special rate. The sales tax rates
in Houston can be as low as 6.25 percent total or as high as 8.25 percent total. As for
property taxes, the City of Houston charges $0.63875 per $100 of assessed valuation.
These rates are almost the same as Dallas with the only difference being the 1 percent
special sales tax in Houston and the 1 percent to transportation in Dallas.

39
5.6 QUESTION FIVE
What transportation hubs are in the city?
Dallas:
Dallas has the third busiest airport in the world with the Dallas Fort Worth
Airport. This airport has appeal for people and cargo and also is a major factor in the
economy of the metropolitan area. Dallas also has a strong history with railroads and now
includes the Amtrak, DART Light Rail, and TRE commuter train service. Also, the
highway system that is in place in Dallas is always under construction to provide ensure
that Dallas is central player in transportation for the area. Dallas has plenty of
transportation options, and I would feel comfortable taking a car, using the train services,
or flying.
Houston:
Houston is a very spread out and large city, so the easiest way to get around is
definitely on the Houston freeway system, which has almost 600 miles of freeways and
expressways. Houston also has the METRORail and the METRO bus system. Houston
also has two commercial airports, George Bush Intercontinental Airport and Hobby
Airport. Because of its proximity to the Gulf of Mexico, Houston also has the Port of
Houston, which is important for cargo, cruises, and passenger ships. Compared to Dallas,
Houston is a lot larger in area and makes transportation longer.

40
5.7 QUESTION SIX
What are the city’s most prevalent industries?
Dallas:
The major industries in the diverse climate that Dallas has are defense, financial
services, information technology and data, life sciences, semiconductors,
telecommunications, transportation, and processing. Out of the Fortune 500 companies,
19 are headquartered in Dallas, Texas. Referencing the high amount of high-tech
companies and workers as well as the landscape of Dallas, it is dubbed the “Silicon
Prairie”. Dallas also has healthy real estate and tourism industries. The diversity of
businesses in Dallas is attractive to a newcomer because I can work with a variety of
different industries.
Houston:
It is no question that Houston has a huge presence in the energy industry, which
includes oil and gas exploration, petroleum refining, petrochemical production, etc.
However, Houston’s economy is also diverse, including high-technology, medical
research and healthcare delivery, agriculture, film and media, banking and finance, and
more. Houston beats out Dallas with 21 Fortune 500 companies headquartered there.
Houston is the best possible place to be in order to be in the booming energy industry.
41
5.8 QUESTION SEVEN
Describe the quality of the city’s healthcare?
Dallas:
Dallas has many hospitals that are ranked among the best in the nation in the U.S.
News & World Report’s America’s Best Hospitals report. Baylor University Medical
Center, Baylor Institute for Rehabilitation, Parkland Memorial Hospital, Presbyterian
Hospital and others have received high marks in each of their specialties. Offering great
service in a wide area of different specialties, the healthcare in Dallas is not something to
worry about when moving there. They have over seven major healthcare systems that
offer a variety of options, practices, and even more for Dallas residents.
Houston:
Houston is home to “one of the best medical communities in the world.” Texas
Medical Center is the largest medical center in the world and is 10 minutes from
downtown. The Houston area is home to 85 different hospitals and over 100,000 health
care professionals, which is around 7 percent of the workforce in Houston. I, personally,
have been to a couple different hospitals in Houston for surgeries growing up because of
the high quality of healthcare it has. The healthcare quality is something that is pretty
attractive about Houston for whenever I start a family and start getting old.

42
5.9 QUESTION EIGHT
What types of crime are common within the city and where are the locations within the
city to avoid?
Dallas:
Compared to all of Texas, Dallas has one of the highest crime rates of
communities of all sizes. However, when compared to communities of similar population
size, Dallas has a lower crime rate than average. The most common crimes are theft,
burglary, and motor vehicle theft. The south side of Dallas is more dangerous and a place
to avoid is Grand Ave. The worst neighborhood in Dallas is South Boulevard-Park Row.
I had never known that Dallas was dangerous at all before researching it, so that was
something that shocked me. The crime rate is not very attractive for someone looking to
start a family there.
Houston:
Houston has one of the highest crime rates in America for communities of all
sizes. Regardless of this statistic, it also has one of the highest crimes rates for
communities of its own size even. Theft is by far the most common crime followed by
burglary and assault. Sunnyside is a neighborhood in Houston that people should avoid. It
is the sixth-most dangerous neighborhood in America. Another noteworthy place to avoid
is the Third Ward at the intersection of Dowling and McGowen, ranked number fifteen
on the same list as Sunnyside. Houston’s crime rate is actually somewhat concerning.

43
5.10 QUESTION NINE
Based on where you see yourself living for the first three years, how much rent do you
expect to pay? Back up this assertion with sample properties from each location
(including pictures). Describe the square footage, amenities, need for a roommate,
availability of parking, etc.
Dallas:
I could live with my aunt and uncle in their extra house for the first couple years
and commute about forty minutes. However, for the sake of the question I found a
neighborhood called Deep Ellum that has a median monthly rent of $819 and is famous
for its street art, nightlife, and great bars. It has access to the DART Green Line and is
walking distance from the KPMG and Deloitte offices. The specific place I chose was
Broadstone Ambrose. The Frankford room is 650 square feet and $950 a month. This
specific room would not require a roommate, but there are plenty of other options for a
room with a roommate and a cheaper price. The complex has a pool, workout room,
balcony for the room, and a few other rooms for communal use.
Houston:
Houston apartments close to downtown are a little more expensive than the Dallas
apartments. However, it really just depends how close to downtown you are trying to live
in Houston. I found a place in the Second Ward called Canal Place Apartments with a
place similar in size and price to the apartment I found in Dallas. The Bari room is
another studio apartment at 700 square feet for $775 a month. This apartment complex is

44
right across the highway from Minute Maid, which is where the Houston Astros play.
The commute to work from this complex would only be around 10 minutes in a car. The
complex also has a pool and balcony area for the rooms. It also has a weight room for use
of residents as well as a living room with televisions and a pool table.
5.11 QUESTION TEN
What is the typical mode of commuting? Based on your answers identified in the prior
question, what are your likely commute times?
Dallas:
The typical mode of commute in Dallas is by car. From the place I picked in
Dallas, it would be a 5-minute car commute, a 9-minute bike commute, a 12-minute
commute using the Pearl/Arts District Train Station, or a 25-minute walk. I would take
my car to Dallas, so I would most likely just drive to work. I like driving, and the
commute from the place I found is very short and not littered with traffic.
Houston:
The typical mode of commute in Houston is also by car. The place I found in
Houston requires a 9-minute car commute, a 10-minute bike ride, a 14-minute bus/train
commute, or a 29-minute walk. Since I have a car, I would probably just drive. The
location of the apartment complex and the accounting firms is easily accessible without
running into a lot of traffic, which is very bad in Houston.

45
5.12 QUESTION ELEVEN
Where will you do your grocery shopping?
Dallas:
In Dallas, I will be grocery shopping at Central Market and Tom Thumb because
they are some of the top peer-rated grocery stores in the area of Dallas closest to where
the accounting firms are (Ross Ave). I have shopped at a Tom Thumb in Dallas before
and my cousin even worked in one in north Dallas, so I am familiar with their selections
and prices.
Houston:
In Houston, I will be grocery shopping at H-E-B because there is one near
downtown where the accounting firms are located. Also, H-E-B is my favorite grocery
store in the entire world. I grew up going to one all the time with my parents in Waco,
and the prices there are low enough to compete with Walmart.

46
5.13 QUESTION TWELVE
How will you do your laundry?
Dallas:
In Dallas, I can either do my laundry in my apartment or at my aunt and uncle’s
house in Lewisville. This will give me the opportunity to see my family and do my
laundry for free. If I need to find another option, I would take my laundry to Feather
Laundry, located on Ross Ave, which has a five-star peer-rating and great service.
Houston:
In Houston, my uncle’s house is probably a little too far for a regular laundry
visit, and I would probably just do my laundry in my apartment. However, if this is not an
option, I would take my laundry to Wolfe’s Cleaners, a small laundry service shop in
downtown Houston that is cheap and highly rated on yelp.
5.14 QUESTION THIRTEEN
Name at least three civic, religious, or charitable organizations you would like to be
active in for each city?
Dallas:
Churches are hard to pick without attending, but I would most likely become a
member of First Baptist Dallas. It is located near where I would potentially live and
work. I would become involved with the Dallas Foundation, which is a charitable
organization that helps create charitable funds that reflect the interests of the donors. I

47
would also probably become involved with the Cancer Care Services because my
grandma and a couple close family friends have been affected by cancer.
Houston:
As far as a church in Houston goes, I would probably become involved with
Houston's First Baptist Church - Downtown Campus. I would also continue my current
involvement with Shriners Hospitals for Children because that is the hospital that I went
to for three surgeries when I was a kid and was a patient ambassador for the hospital for a
while. The Barbara Bush Literacy Foundation is another non-profit organization that I
would take an active part in and donate to. This foundation tries to tackle the problems
that Houston has with literacy, and I also just love the Bush family because they lived
near me in Waco.
5.15 QUESTION FOURTEEN
What are the sports, entertainment, or recreational activities that you would be most
likely to engage in within the city? Name at least five activities.
Dallas:
Dallas has the NFL team (the Cowboys), the MLB team (the Texas Rangers), the
MLS team (Dallas FC), and the NBA team the Mavericks of which I am already
interested in. I would definitely attend these sporting events. Also, Dallas has an
awesome zoo that I visited as a kid that I would revisit, the Dallas Zoo. Dallas also has a
large variety of music festivals such as Deep Ellum Festival and JMBLYA that I could
attend.

48
Houston:
Houston, like Dallas, has an NFL team (Texans), an MLB team (Astros), an MLS
team (Dynamo), and an NBA team (Rockets). Houston also has a lot of really cool
museums, like the Houston Museum of Natural Science. The Space Center in Houston is
a very interesting place to visit. Also, the Houston Livestock Show and Rodeo is an
enormous rodeo that is actually very fun to go to. Houston also is right next to the gulf, so
beach trips are extremely viable for a weekend trip.
5.16 QUESTION FIFTEEN
What are the modes of traveling back to your hometown from this city? What is the
average cost you’d incur for each trip back home?
Dallas:
I would drive home from Dallas to Nacogdoches. The car ride is only 2 hours and
40 minutes and would not even take half a tank of gas to get there. A full tank of gas for
my car is around $45 dollars so I imagine the average trip (including snacks) would be
around $25.
Houston:
I would drive home from Houston to Nacogdoches. The car ride is only 2 hours
and 25 minutes and would take even less gas than the drive back from Dallas. The
average cost would probably be around $25 still though because there are around four
Buc-ee’s on the way home from Houston, and I would have to stop at two of them at
least.

49
5.17 QUESTION SIXTEEN
Based on your findings, develop a model monthly operating budget for each city for Year
2, assuming that with bonuses for being a high performer, your annual salary is $60,000.
Dallas: Houston:
Figure 5-1: Dallas Monthly Budget Figure 5-2: Houston Monthly Budget
For both of these cities, a $60,000 salary would provide $5,000 a month as a budget. The
expenses for Dallas and Houston are similar, and the main difference between the two
because of the rent expense. However, the rent in Houston, on average, tends to be a little
more expensive. Also, I, most likely, will end up living in a bigger apartment with
roommates and not a studio by myself, so I expect a change in my realistic budget for
that.

50
5.18 QUESTION SEVENTEEN
Finally, based on your full analysis, determine whether you still want to live in both
cities, and if so, which one is your preferred city and why?
Based on the analysis from this case, I would still love to live in either of these
cities. It was very enjoyable researching the places that I am looking at starting a career.
It also opened my eyes up to a lot of the entertainment and philanthropic opportunities in
the areas that I had previously not known about. The research done for this case made me
realize that the decision to choose one or the other is going to be a difficult when it comes
to that time. Dallas and Houston are very similar in a lot of aspects. After all, they are
both large cities in Texas and only about 3 hours and 30 minutes away from each other.
The similarities of the two cities make it a hard decision to pick between the two. This
case made Houston seem a lot more appealing than I had previously thought of it as,
which has made the decision even more difficult. However, I still believe my preferred
city, at this point in time, is Dallas. The size of Houston makes transportation a little
more difficult than that in Dallas. Also, the most prevalent industries in Dallas, like
financial services and high technology, are very interesting to me. Also, I, personally,
have a lot more connections in Dallas and in the DFW area.

51
Case Six: WorldCom, Inc.
Capitalized Costs and Earnings Quality
Brent Thomas
11/4/2018

52
TABLE OF CONTENTS
6.1 Case Introduction ........................................................................................................... 53
6.2 Objective A .................................................................................................................... 54
6.3 Objective B .................................................................................................................... 55
6.4 Objective C .................................................................................................................... 55
6.5 Objective D .................................................................................................................... 56
6.6 Objective E .................................................................................................................... 56
6.7 Objective F ..................................................................................................................... 57
6.8 Objective G .................................................................................................................... 58

53
6.1 CASE INTRODUCTION
The sixth case, WorldCom, Inc. – Capitalized Costs and Earnings Quality, dealt
with defining costs and expenses and looking more into how expenses should be
recorded, using a real-life example of improper recording. WorldCom is a company
that had deceived investors about the health of the company. It was one of the biggest
accounting scandals ever in the United States and bankrupt the company. Using the
financial statements provided and an article from the Wall Street Journal, we were
able to see how WorldCom had been caught improperly capitalizing expenses to
property, plant, and equipment.
This case was very interesting because I have heard so much about WorldCom
and can see the effect that it has had on the accounting standards and accounting in
general; however, I never really knew exactly what happened or what they did to
cause the scandal and the bankruptcy of the company. This case gave me the
opportunity to learn more about what actually happened and dive deeper
capitalization and proper expensing. It was also a chance to see a real-life example of
a company actually improperly overstating income by material margins.

54
6.2 OBJECTIVE A
FASB Statement of Concepts No. 6 (a replacement for SCON No. 3), Elements of
Financial Statements, describes the building blocks with which financial statements are
constructed.
i. Explain, in your own words, how SCON 6 defines “asset” and “expense.”
SCON 6 describes assets as objects in possession on an entity that can provide an
economic benefit in the future. It describes an expense as the use of an asset or incurrence
of a liability from activities that are in line with the company’s central operations.
ii. In general, when should costs be expensed and when should they be
capitalized as assets?
In general, costs should be expensed when they are used up and when they have no
future economic value which can be measured. When the costs haven’t been used up and
have future value, they should be capitalized as assets.

55
6.3 OBJECTIVE B
What becomes of “costs” after their initial capitalization? Describe, in general terms, how
the balance sheet and the income statement are affected by a decision to capitalize a
given cost.
The costs stop being considered an expense and are included in fixed assets after
the initial capitalization. The balance sheet and the income statement are affected by how
the company decides to deal with costs being capitalized or expensed. The cash flow
statement and the financial ratios will also be affected by the decision because the
capitalized costs will depreciate. This will look like the costs are coming over a span of
time instead of all at once, affecting the net income for these statements. The use of the
capitalization is to show higher net incomes and higher total assets in early operations
than it would have just by expensing the costs.
6.4 OBJECTIVE C
Refer to WorldCom’s statement of operations. What did the company report as line costs
for the year ended December 31, 2001? Prepare the journal entry to record these
transactions for the year. Explain in your own words, what these “line costs” are.
Dr. Line Cost Expense 14,739,000,000
Cr. Accounts Payable 14,739,000,000
In 2001, WorldCom’s financial statements included the line costs. WorldCom
falsely capitalized the line costs instead of expenses all of it. The line costs were around
half of the company’s total expenses but were not expensed as they should have been.

56
6.5 OBJECTIVE D
Refer to the Wall Street Journal article. Describe the types of costs that were improperly
capitalized at WorldCom. Explain, in your own words, what transactions give rise to
these costs. Do these costs meet your definition of assets in part a above?
The Wall Street Journal article read that WorldCom had improperly capitalized
$3.055 billion of expenses in 2001. The line costs expense should not have been
transferred to the company’s property, plant, and equipment because they were not
connected with long-term assets. The costs should have been recognized as an expense in
that specific quarter and not distributed along multiple periods. WorldCom’s description
of the line costs is not enough to consider them as assets.
6.6 OBJECTIVE E
Prepare a single journal entry to record the improperly capitalized line costs of $3.055
billion for the year. Where did these costs appear on the balance sheet? Where on the
statement of cash flows?
Dr. Property, Plant, and Equipment $3,055,000,000
Cr. Line Cost Expense $3,055,000,000
On the balance sheet, the costs will be in Property, Plant, and Equipment. On the
statement of cash flows, the costs will be in Depreciation Expense.
57
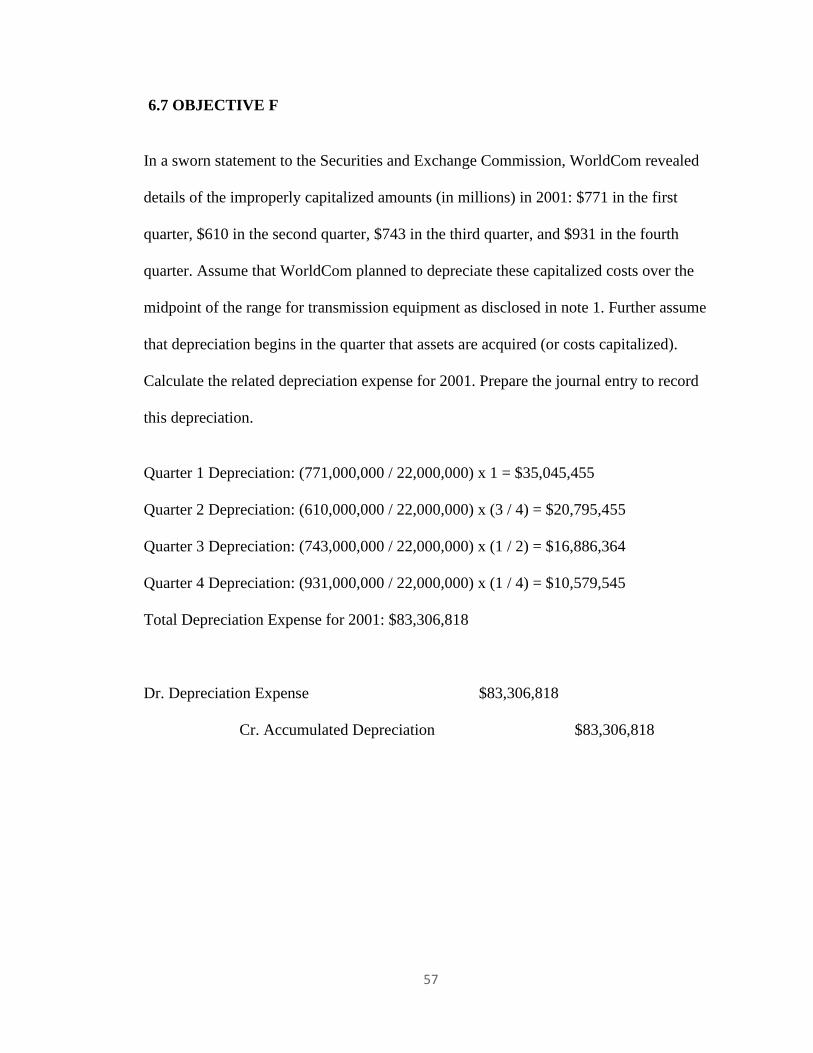
6.7 OBJECTIVE F
In a sworn statement to the Securities and Exchange Commission, WorldCom revealed
details of the improperly capitalized amounts (in millions) in 2001: $771 in the first
quarter, $610 in the second quarter, $743 in the third quarter, and $931 in the fourth
quarter. Assume that WorldCom planned to depreciate these capitalized costs over the
midpoint of the range for transmission equipment as disclosed in note 1. Further assume
that depreciation begins in the quarter that assets are acquired (or costs capitalized).
Calculate the related depreciation expense for 2001. Prepare the journal entry to record
this depreciation.
Quarter 1 Depreciation: (771,000,000 / 22,000,000) x 1 = $35,045,455
Quarter 2 Depreciation: (610,000,000 / 22,000,000) x (3 / 4) = $20,795,455
Quarter 3 Depreciation: (743,000,000 / 22,000,000) x (1 / 2) = $16,886,364
Quarter 4 Depreciation: (931,000,000 / 22,000,000) x (1 / 4) = $10,579,545
Total Depreciation Expense for 2001: $83,306,818
Dr. Depreciation Expense $83,306,818
Cr. Accumulated Depreciation $83,306,818

58
6.8 OBJECTIVE G
Use your answers to parts e and f above, to determine what WorldCom’s net income
would have been in 2001 had line-costs not been improperly capitalized. Use 35% as an
approximation of WorldCom’s 2001 marginal income tax rate, in your calculations. State
any other assumptions you make. Is the difference in net income material?
The difference in net income is material. There actually was a loss of
$341,150,569, but WorldCom recorded a gain because of the improperly capitalized line
costs.
Income, before taxes $2,393,000,000
Accumulated Depreciation 83,306,818
(Improperly Capitalized Line Costs) (3,055,000,000)
Income (Loss), before taxes (578,693,182)
Income Tax Benefit 202,542,613
Minority Interest 35,000,000
Net loss (341,150,569)

59
Case 7: Starbucks Corporation
Understanding Financial Statements
Brent Thomas
3/4/2019

60
TABLE OF CONTENTS
7.1 Case Introduction ........................................................................................................... 61
7.2 Concepts (a - e) .............................................................................................................. 62
7.3 Analysis (f) .................................................................................................................... 65
7.4 Analysis (g – j) ............................................................................................................... 67

61
7.1 CASE INTRODUCTION
The seventh case, Starbucks Corporation, involves looking into Starbucks’
Financial Statements and the nature of their business. Using excel and the SEC Form 10-
K Filings, we were able to prepare common-size income statements and answer some
questions. This case requires the students to become familiar with auditor opinions and
significant accounting policy footnotes, as well as performing basic interpretations of the
financial statements. The role of estimation in the preparation of financial statements was
also a topic that this case covered.
This case was enjoyable because we got to look deeper into an actual company’s
financial statements and draw analyses from the information. Being able to see
Starbucks’ actual financial statements was interesting to me because I didn’t know how
to find the SEC filings for different forms in the first place. The amount of information
that was provided was astonishing to me and made me realize how much financial
information companies report to the public. Also, the questions were interesting in that
they made me look deeper into an income statement and balance sheet than I had before
in my other accounting classes.

62
7.2 CONCEPTS (a – e)
a. What is the nature of Starbucks’ business? That is, based on what you know about
the company and on the accompanying financial statements, how does Starbucks
make money?
Starbucks’ entire business plan is centered on the brand that they have
created for their coffee. Starbucks created a chain coffee shop model that
prides itself on its products’ qualities and promotes it towards specific
lifestyles. Executive members designed Starbucks to sell premium coffee
at thousands of locations. This can be seen in the financial statements like
the balance sheet, which shows the company’s assets, liabilities, and
equity. The company has most of its assets in the form of cash,
inventories, and net property, plant, and equipment, which is what you
would expect from a coffee shop company that acts as both a retailer and
wholesaler. The income statement will also show that most of Starbucks’
revenue is from company-operated stores, while a small portion of
revenue comes from selling their products to licensed stores and food
services.
b. What financial statements are commonly prepared for external reporting
purposes? What titles does Starbucks give these statements? What does
“consolidated” mean?
In the SEC filings, we were able to find Starbucks’ Form 10-K. This form
is what Starbucks prepares every year for external reporting purposes. The

63
10-K includes Document and Entity Information, Consolidated Statements
of Earnings, Consolidated Statements of Comprehensive Income,
Consolidated Balance Sheets, Consolidated Statements of Cash Flows,
Consolidated Statements of Equity, Summary of Significant Accounting
Policies, Acquisition Information, and Derivative Financial Instruments
Information. “Consolidated” is used a lot in the statement titles to show
that these are the financial statements for all of Starbucks and its
subsidiaries.
c. How often do publicly traded corporations typically prepare financial statements
for external reporting purposes?
External users require that the financial statements be prepared quarterly.
This is to keep the financial statements’ relevance in the decision-making
process of the external users and regulators. The timeliness and accuracy
of the financial statements is what is important and can get slowly/poorly
reporting companies in trouble.
d. Who is responsible for the financial statements? Discuss the potential users of the
Starbucks financial statements and the type of information they are likely
interested in.
Starbucks, or any public companies, put the responsibility of the financial
statements on its executive members. They are responsible for reporting
the financial statements accurately and timely, as well as in compliance

64
with GAAP and other regulatory bodies. Potential users of the Starbucks
financial statements could vary immensely. Any stakeholders of the
company, internal or external, are potential users of the company’s
financial statements. Stakeholders could be investors, employees,
managers, government regulatory bodies, rival companies, etc.
Investors are likely interested in the revenues, expenses, profits/losses,
earnings per share, and other information in order to use in their capacity
as investors to try to make profits off of their investments.
e. Who are Starbucks’ external auditors? Describe the two “opinion” letters that
Starbucks received in 2013. In your own words, what do these opinions mean?
Why are both opinions dated several months after Starbucks’ year-end?
Starbucks’ external auditors are Deloitte LLP. The specific audit team for
Deloitte is located in Seattle, Washington. The two “opinion” letters
signified that the audit that Deloitte performed were up to PCAOB
standards. The first opinion means that Starbucks’ financial statements
were an accurate representation of the company’s financial health. The
second opinion means that the internal controls put into place by
Starbucks. Both opinions were dated several months after Starbucks’ year-
end because Deloitte had to get Starbucks’ financial statements and then
go through all of them thoroughly, or at least up to the standards of the
PCAOB.

65
7.3 ANALYSIS (f)
f. Figure 7-1: Starbucks Consolidated Statement of Earnings
Common-size Income Statements
Consolidated Statements Of Earnings
(USD $)
12 Months Ended 12 Months
Ended
In Millions, except Per Share data,
unless otherwise specified
Sep. 29,
2013
Sep. 30,
2012
Sep.
29,
2013
Sep.
30,
2012
Net revenues: ' ' ' '
Company-operated stores $11,793.20 $10,534.50 79% 79%
Licensed stores 1,360.50 1,210.30 9% 9%
CPG, foodservice and other 1,738.50 1,554.70 12% 12%
Total net revenues 14,892.20 13,299.50 100% 100%
Cost of sales including occupancy costs 6,382.30 5,813.30 43% 44%
Store operating expenses 4,286.10 3,918.10 29% 29%
Other operating expenses 457.2 429.9 3% 3%
Depreciation and amortization expenses 621.4 550.3 4% 4%
General and administrative expenses 937.9 801.2 6% 6%
Litigation charge 2,784.10 0 19% 0%
Total operating expenses 15,469 11,512.80 104% 87%
Gain on sale of properties 0 0 0% 0%
Income from equity investees 251.4 210.7 2% 2%
Operating income -325.4 1,997.40 -2% 15%
Interest income and other, net 123.6 94.4 1% 1%
Interest expense -28.1 -32.7 0% 0%
Earnings before income taxes -229.9 2,059.10 -2% 15%
Income taxes -238.7 674.4 -2% 5%
Net earnings including noncontrolling
interests 8.8 1,384.70 0% 10%
Net earnings attributable to noncontrolling
interest 0.5 0.9 0% 0%
Net earnings attributable to Starbucks $8.30 $1,383.80 0% 10%
Earnings per share - basic $0.01 $1.83 0% 0%
Earnings per share - diluted $0.01 $1.79 0% 0%
Weighted average shares outstanding: ' ' Basic 749.3 754.4 5% 6%
Diluted 762.3 773 5% 6%
Cash dividends declared per share $0.89 $0.72 89% 0%

66
Figure 7-2: Starbucks Consolidated Balance Sheets
Consolidated Balance Sheets (USD $) Sep. 29,
2013
Sep. 30,
2012
Sep.
29,
2013
Sep.
30,
2012 In Millions, unless otherwise specified
Current assets: ' ' Cash and cash equivalents $2,575.70 $1,188.60 22% 14%
Short-term investments 658.1 848.4 6% 10%
Accounts receivable, net 561.4 485.9 5% 6%
Inventories 1,111.20 1,241.50 10% 15%
Prepaid expenses and other current assets 287.7 196.5 2% 2%
Deferred income taxes, net 277.3 238.7 2% 3%
Total current assets 5,471.40 4,199.60 48% 51%
Long-term investments 58.3 116 1% 1%
Equity and cost investments 496.5 459.9 4% 6%
Property, plant and equipment, net 3,200.50 2,658.90 28% 32%
Deferred income taxes, net 967 97.3 8% 1%
Other assets 185.3 144.7 2% 2%
Other intangible assets 274.8 143.7 2% 2%
Goodwill 862.9 399.1 7% 5%
TOTAL ASSETS 11,516.70 8,219.20 100% 100%
Current liabilities: ' ' Accounts payable 491.7 398.1 4% 5%
Accrued litigation charge 2,784.10 0 24% 0%
Accrued liabilities 1,269.30 1,133.80 11% 14%
Insurance reserves 178.5 167.7 2% 2%
Deferred revenue 653.7 510.2 6% 6%
Total current liabilities 5,377.30 2,209.80 47% 27%
Long-term debt 1,299.40 549.6 11% 7%
Other long-term liabilities 357.7 345.3 3% 4%
Total liabilities 7,034.40 3,104.70 61% 38%
Shareholders' equity: ' ' Common stock ($0.001 par value) -
authorized, 1,200.0 shares; issued and
outstanding, 753.2 and 749.3 shares
(includes 3.4 common stock units),
respectively 0.8 0.7 0% 0%
Additional paid-in capital 282.1 39.4 2% 0%
Retained earnings 4,130.30 5,046.20 36% 61%
Accumulated other comprehensive income 67 22.7 1% 0%
Total shareholders' equity 4,480.20 5,109 39% 62%
Noncontrolling interests 2.1 5.5 0% 0%
Total equity 4,482.30 5,114.50 39% 62%
TOTAL LIABILITIES AND EQUITY $11,516.70 $8,219.20 100% 100%
[1] In conjunction with the change in reportable operating
segments, we reclassified goodwill by segment as of
October 2, 2011.

67
7.4 ANALYSIS (g - j)
g.
i. The accounting equation holds for Starbucks. Starbucks has assets of
$11,516.70, liabilities of $7,034.40, and equity of $4,482.30 (all of which are in
millions).
ii. Starbucks’ major assets are property, plant, and equipment ($3,200.50
million), cash ($2,575.70 million), and inventory ($1,111.20 million). Short-term
assets for 2013 are 48 percent of all assets and long-term assets contribute to be
52 percent of total assets. This does seem appropriate as Starbuck’s has thousands
of stores with a lot of equipment in each of those buildings. The high levels of
cash and inventory make sense for a coffee shop that is selling its products for
cash.
iii. Intangible assets are assets that are not physical in nature. Goodwill,
patents, and trademarks are just a few examples of intangible assets. Goodwill
represents non-physical assets like brand name. It can only be recognized by
acquiring another company’s goodwill and is a debit on the balance sheet.
Specific intangible assets that Starbucks might have are copyrights on their coffee
flavors, trade secrets on how they make their coffee, and trade names for their
other products like Pike Place Keurig cups.
iv. Starbucks is financed through retained earnings, long-term debt, and
common stock. The majority of Starbucks’ money comes from the operating
activities, thus the retained earnings being mentioned previously. However,

68
Starbucks Corporation is also partially financed through long-term debt, which is
equivalent to 11 percent of the company’s total assets. Common stock isn’t relied
upon as heavily for Starbucks, but their Additional Paid-In Capital is still 2
percent of their total assets.
h.
i. Starbucks records revenue when they receive cash from their customers
according to cash-basis accounting for their own stores. However, they recognize
revenue differently for their licensed stores. Whenever they resupply their
licensee, Starbucks records revenue. As for the stored value cards, revenue is
recognized when the cards are redeemed or whenever the company realizes that
the stored value cards are probably not going to ever be redeemed. With so many
different ways of accounting for revenue, it could be hard to accurately read their
financial reports in depth. Not only do their revenue recognition methods make
reading financial statements difficult, but they also require judgement of when to
deem certain revenues for the stored value cards. For example, when do you
recognize revenue for a stored value card that never expires?
ii. Starbucks’ major recurring expenses are their cost of sales and store
operating expenses. They also have a significant litigation charge for
approximately $2.784 billion during the 2013 year.
iii. There were some significant changes in Starbucks cost structure in 2013.
The most significant being the litigation charge mentioned in the previous answer.
The litigation charge was a $2,784,100,000 increase in expenses for this year, but

69
it was not the only difference in costs. General and administrative expenses,
depreciation expenses, and other operating expenses also increased from 2012 to
2013.
iv. The litigation charge, although not a recurring expense, is still included in
operating expenses because it is a sizable amount that is deemed probable and
material. The litigation charge is also a result from operating activities and not
general and administrative, so it is included there.
v. The company was profitable during the 2012 fiscal year but not the 2013
fiscal year. Although the company had positive net incomes for both years,
Starbucks had an operating loss of $325,400,000 in 2013. Determining whether a
company is profitable or not is based on its central and ongoing activities, or
operating activities.
i.
i. Starbucks’ net earnings in 2013 were only a mere $8.8 million compared
to the $2,908.3 million net cash provided by operating activities. The bulk of the
difference is made up of the depreciation/amortization expense and litigation
charge. The rest of the difference in these numbers comes from how these
numbers were found in the first place. The net cash provided by operating
activities comes from the cash flow statement, which uses a cash basis working
backwards to make adjustments from non-cash activities. The net earnings are
found using the income statement which uses accrual base accounting.
ii. Starbucks spent $1,151.20 million on additions to property, plant, and

70
equipment. Starbucks also sold some property, plant, and equipment for $15.3
million.
iii. Starbucks paid $628.9 million in cash dividends during 2013. However,
Starbucks declared $668.6 million is cash dividends in the equity statement. The
difference between the amount of dividends declared and dividends paid comes
out to be $39.7 million, which is the amount that is still to be paid in the future to
shareholders.
j. There is a plethora of different accounts that require estimates in financial
reporting. When trying to complete accurate, relevant, and timely financial statements,
GAAP often requires management of companies to make judgements when using
estimates. For Starbucks, the revenue from stored value cards, the rates of depreciation,
the impairment of assets and goodwill, the number of receivables counted as bad debt,
and the potential outcome of tax implications are all accounts on the balance sheet that
require estimates.

71
Case 8: BP p.l.c.
Contingencies
Brent Thomas
4/1/2019

72
TABLE OF CONTENTS
8.1 Case Introduction ........................................................................................................... 73
8.2 Concept A ...................................................................................................................... 74
8.3 Concept B ...................................................................................................................... 74
8.4 Concept C ...................................................................................................................... 75
8.5 Concept D ...................................................................................................................... 76
8.6 Concept D Plus .............................................................................................................. 77

73
8.1 CASE INTRODUCTION
The BP p.l.c. - Contingencies case covered the accounting implications of
contingent liabilities, the accounting for contingent warranty costs and those related to
the Gulf oil spill, and the earnings management opportunities that arise with the
measurement of those contingencies. BP’s oil spill is one of the best examples of being
exposed to risk through contingent liabilities because they were sued over 400 times and
had over 150,000 damage claim made against the company. The fact that BP put aside
$20 billion in an escrow account for the settlements really emphasizes how material and
how big of a difference the contingent liabilities can be. BP’s losses were very different
than the contingent liability of an assurance-type warranty.
This case was especially interesting to me, because, through researching the case,
I started to realize that my grandparents probably could have sued BP and gotten a
settlement. I was very young at the time of the oil spill, but I still remember the effect that
it had on the coast and my grandparents’ property in Biloxi. Not only did this case
somewhat hit home, but it also is a great example of the importance and difficulty of
accounting judgements dealing with contingencies. Accountants and businesses both do
not like risk and support certainty, and contingent liabilities are pretty much the opposite
of that. For that reason, you can see the enormity of the losses for BP in 2010 aside from
just their employees who were lost, the hit to their public image, their lost oil.

74
8.2 CONCEPT A
What is a contingent liability? Explain, in your own words, when a company would
record a contingent liability (i.e. a contingent loss) on its books. List some types of
contingent liabilities. Do companies ever record contingent assets (i.e. contingent gains)?
A contingent liability is a potential liability that may occur, depending on the
outcome of an uncertain future event. The potential liability is not accounted for as a loss
unless it is very likely that the loss will occur and the loss is reasonably estimable. If
these two criteria are not met, then the contingent liability will not be reported in the
financial statements. If the loss is either likely or reasonably estimable, it may be
included in the footnotes of the financial statements but not recorded on the balance
sheet. Therefore, a company would record a contingent liability on its books when it is
probable that the company will experience the loss and the amount of the loss can be
somewhat accurately predicted. Some examples of contingent liabilities are pending
lawsuits, government investigations, and some types of warranties. Contingent assets,
however, are not included on the balance sheet. They can be included in the footnotes of
the financial statements but are not realized unless the cash flows from the contingent
gain are almost certain.
8.3 CONCEPT B
Product warranties are a common contingent liability. Consider a piece of equipment
such as a telescopic joint, which BP purchases from GE Oil and Gas. The telescopic joint
compensates for heave and offset on drilling vessels and is sold with a two-year warranty
against defects. From BP’s perspective as the purchaser of the telescopic joint, what is a

75
product warranty? From the perspective of GE Oil and Gas, the manufacturer of the
telescopic joint, what is a warranty?
A product warranty may allow the product to be returned or replaced, essentially
guaranteeing a satisfactory performance of the product. From BP’s perspective as the
purchaser of the telescopic joint, this grants them the opportunity to get a new product if
one that they had purchased was faulty or broken. This type of warranty is an assurance
warranty, which is included in the selling price of the product. For BP, this warranty is a
contingent asset.
As for GE Oil and Gas, the warranty is however many telescopic joints they
would have to replace or how much money they would need to compensate BP for. The
warranty would also be considered to be a contingent liability because of the uncertainty
in the number of units that will be returned or replaced. So, if BP requested to redeem the
warranty for certain products, then GE Oil and Gas would be liable for the agreed upon
amount. GE would also need to match the liability to the period of the sale.
8.4 CONCEPT C
What judgments does management need to make to account for contingent liabilities in
general and accrued warranty costs in particular? How does a claim for damages resulting
from the Deepwater Horizon oil spill differ from a warranty claim on a piece of
equipment such as a telescopic joint?
In order to account for contingent liabilities in general, the management needs to
determine the probability of the contingent loss occurring, which is extremely difficult.

76
However, if the contingent liability is not at a high risk of being considered a loss, then it
is pretty easy to simply not record anything in the books. Identifying the risk is the
important determination. This judgement is very important though because it will affect
the financial statements of the company, overall profits, and, ultimately, shareholders’
earnings per share. For accrued warranty costs in particular, the main judgement comes
from setting aside an allowance to account for returns and replacements for products.
Product warranties only really deal with returns and replacements of faulty products, so
the accounting for them is a lot simpler than a claim for damages resulting from the
Deepwater Horizon oil spill, which affected people, businesses, tourism, general
economies, wildlife, land, and even more. BP could be liable for so much more than just
a few products.
8.5 CONCEPT D
Describe some of the estimates that BP must make to account for the contingencies
associated with the Deepwater Horizon oil spill. By way of comparison, the Exxon
Valdez oil spill took place on March 24, 1989. Litigation continues as of early 2011.
Because of the Deepwater Horizon oil spill, BP had to make a plethora of
estimates to account for the contingencies dealing with a bunch of different business and
individuals spanning across multiple states and Mexico. The oil spill triggered tons of
lawsuits because of the enormous scope of the damages caused by it. BP had to make
estimates for contingent losses from lawsuits and settlements that had arisen from eleven
deaths, multiple injuries, financial damages, environmental damages, and more. With so
many possible legal battles, it was hard to estimate exactly how great the losses would be

77
and if more lawsuits would come. The auditors and lawyers of BP had to go through each
possible type of litigation that could be taken against them and also from how many
people and businesses to determine reasonably possible estimates for the losses. Unlike
Exxon with the Exxon Valdez oil spill, BP’s lawyers put in place a time frame for BP
lawsuits and stated that no one could sue BP for damages after 2015. Other complicating
factors included determining which other parties should share in the charges. While BP
was the majority owner and operator of the lease, Transocean owned the rig and
Halliburton was involved in its operation. The U.S. Justice Department could also sue all
of the responsible parties for violating the Clean Water Act and the Oil Pollution Act.
8.6 CONCEPT D PLUS
As an auditor of BP, I would work with lawyers to determine the criteria for who,
businesses and entities, could possibly sue BP for damages initially, as well as the
amount that would be able to be charged only to BP. First, one would have to look at
what effect the oil spill had. The spilled oil directly affected coastal areas in Texas,
Mississippi, Louisiana, Alabama, Florida, and even Mexico. People and businesses
dependent on fishing and tourism have been severely affected, along with those in other
industries, including some farther from the Gulf Coast. Businesses like banks, casinos,
insurance companies, and land developers can not file a claim while businesses that are
dependent upon the economic value of the Gulf Coast areas can file a claim. Companies
heavily dependent on the viability of the water for trade and tourism are the companies
who will most likely sue and also get the largest settlements. These companies would
include businesses like hotels, motels, restaurants, shopping centers, real estate
78
management firms, law firms, and other companies based on tourism. As for individuals,
any of the eleven deceased BP employee’s families or any of the BP employees injured
by the oil spill would be the most likely to sue and receive the largest payout. Also, any
residents of the previously mentioned affected with health problems from oil and
chemical dispersants may be entitled to a lawsuit, as well as those cleaning up the oil
spill. While many of these people and entities could sue, BP also needed to account for
any settlements that may have been made outside of the courtroom, which would have
cheaper and more certain results than any potential lawsuits.

79
Case Nine: The Wendy’s Company
Equity Method Investments
Brent Thomas
4/9/2019

80
TABLE OF CONTENTS
9.1 Case Introduction ........................................................................................................... 81
9.2 Concept A ...................................................................................................................... 82
9.3 Concept B ...................................................................................................................... 82
9.4 Concept C ...................................................................................................................... 83
9.5 Process D ....................................................................................................................... 84
9.6 Process E ........................................................................................................................ 84
9.7 Process F ........................................................................................................................ 85
9.8 Process G ....................................................................................................................... 87

81
9.1 CASE INTRODUCTION
Case 9, The Wendy’s Company - Equity Method Investments, involves looking at
the accounting for joint ventures and other strategic investments, the accounting for
equity method investments, the effects of the joint-venture activity in the footnotes of the
financial statements, and the impact of alternative accounting treatments. The case
involved looking at Wendy’s financial statements after their joint-venture merger with
Tim Hortons. After just covering the equity method in the second portion of Intermediate
Accounting, it was interesting to see the effects of the method in an actual large
company’s financial statements. This case also shows the necessity of footnote
disclosures, which aren’t really emphasized a whole lot in our accounting classes.
I found the Wendy’s case interesting because I plan on getting into a service line
dealing with mergers and acquisitions in the future (either Deal Advisory or M&A Tax).
Although Wendy’s and Tim Hortons combined through a joint-venture in TimWen
instead of Wendy’s just acquiring Tim Hortons as a subsidiary, the analysis of the
financial statements and footnotes was amusing and good practice for my future
internship. Seeing how the equity method affects different investment and cash accounts
through a company’s financial numbers instead of through a homework problem made
this case a lot more interesting. This case was helpful in getting to further know how to
navigate the financial statements and find where numbers can be buried in other accounts.

82
9.2 CONCEPT A
In general, why do companies enter into joint-venture agreements?
Joint-ventures allow companies to join together as a cooperative enterprise while
retaining their distinct identities. This agreement allows the two companies to share
assets, profits/losses, markets, etc. Companies could enter joint-venture agreements
instead of merging with another company in order to avoid the legal complications and
costs of merging and acquiring the other company. The joint venture not only saves costs
but also reduces risk for Wendy’s in this situation. Joint ventures are an easier solution to
creating a seamless partnership with the benefits of gaining the systems knowledge and
technology of the other company’s operations.
9.3 CONCEPT B
Consistent with U.S. GAAP, Wendy’s uses the equity method to account for its joint
venture in TimWen. Briefly explain this accounting method. In your answer, be sure to
comment on how the investing company accounts for its initial investment and any
subsequent income and dividend activity of its investee.
The equity method of accounting is used when a company has acquired between
twenty and fifty percent of the stocks in another company and can exercise significant
influence on the investee company. The main importance in that statement is the ability
to exert significant influence, which in this case means that Wendy’s can control the
operations of Tim Hortons. The initial investment by Wendy’s was accounted for on the
balance sheet as an increase of the Equity Investment account. Any subsequent income

83
will be accounted for as a further increase in the Equity Investment account on the
balance sheet. As for the dividends of the investee, they will be recorded as an increase in
cash but a decrease in the Equity Investment.
9.4 CONCEPT C
When a company purchases shares (ownership) in another company, the investment
amount may exceed their share of the book value of the underlying net assets of the
investee. How does the investing company account for this excess amount under the
equity method?
In the circumstance that the initial investment amount exceeds the book value of
the investee’s net assets, the excess amount will be assessed with an accounting
acquisition premium. Under the equity method of accounting, the company purchasing
share of another company will identify the amount of the identifiable assets and liabilities
and then recognize the rest as goodwill. The assets and liabilities that were identified will
be then written up to the fair value and depreciated annually. The goodwill will be tested
annually as well for impairment; however, the goodwill does not get amortized or
depreciated.

84
9.5 PROCESS D
Consider the information in Note 8. What amount did Wendy’s include on its 2012 and
2011 balance sheets for their equity method investments? Where does this appear on
Wendy’s consolidated balance sheet?
Wendy’s included $113,283 for 2012 and $119,271 for 2011 for their total
investments on their balance sheet. As for the equity method investments, Wendy’s
reported $87,620 in 2012 and $91,819 in 2011 in note 8 of the financial statements. The
equity method investments are included in the investments section of Wendy’s assets
along with Wendy’s other cost investments.
9.6 PROCESS E
Using information in Note 8, compare the amount recorded for Wendy’s investment in
TimWen at December 30, 2012 with Wendy’s 50 percent share of TimWen’s equity at
December 30, 2012. What accounts for the difference between these two amounts?
The amount that Wendy’s recorded for its investment in TimWen at the end of
2012 was $89,370. The amount of Wendy’s 50 percent share of TimWen’s equity at the
end of 2012 was reported as $35,282. The $54,088 excess represents the acquisition
accounting premium discussed earlier and comes from the purchase price adjustments
that were accounted for from the joint-venture.

85
9.7 PROCESS F
i. How did Wendy’s equity method investment in TimWen affect their earnings
before taxes in 2012 and 2011? Where does this appear in Wendy’s consolidated
statements of operations?
Wendy’s equity method investment in TimWen increased their earnings
by the portion of Wendy’s actual share of net income in Tim Horton. This number
can be found in note 8 where the earnings from TimWen in 2012 is found to be
$13,680 as “equity in earnings for the period”. There is also an amortization of the
purchase price adjustments for the period, which is $3,129 in 2012. This
amortization will bring Wendy’s 2012 earnings before taxes to be $10,551. The
earnings before taxes for Wendy’s in 2011 was $10,571, which came from the
difference of the equity in earnings for the period ($13,505) and the amortization
of the purchase price adjustments ($2,934). These numbers are buried in the other
operating expenses section of Wendy’s consolidated statements of operations but
are specified in note 8 of the financial statements.
ii. Prepare the journal entry to record Wendy’s share of TimWen’s 2012 earnings.
2012 JE:
Dr. Equity Investment in Joint Venture - TimWen 13,680
Cr. Equity Investment Income 13,680
iii. What is the amount of the amortization of the purchase price adjustments in
2012? Prepare the journal entry to record the amortization of the purchase price

86
adjustments for 2012.
The amount for the amortization of the purchase price adjustments in 2012
was recorded in note 8 as $3,129. This number was based upon the average
original aggregate life of 21 years.
2012 JE:
Dr. Equity Income 3,129
Cr. Equity Investment in Joint Venture - TimWen 3,129
iv. What amount of dividends did Wendy’s receive from the TimWen joint venture in
2012 and 2011? Prepare the journal entry to record the receipt of dividends from
TimWen for 2012.
Wendy’s received $15,274 in dividends in 2012 and $14,942 in 2011.
These numbers were found in the financial statements recorded under note 8 as
“Distributions received”.
2012 JE:
Dr. Cash 15,274
Cr. Equity Investment in Joint Venture - TimWen 15,274

87
9.8 PROCESS G
I. The operating activities section of the statement of cash flows reports a negative
adjustment for “Equity in earnings in joint ventures, net” of $8,724 in 2012.
Reconcile this amount to the information disclosed in Note 8. Explain why a
negative adjustment is made to arrive at net cash from operating activities.
The negative adjustment is made in order to adjust for the earnings already
being included in net income. The equity income in included in the total income,
but it was not received in cash. The only cash that was received was from the
dividends, which is not included in the net income. Therefore, the loss from the
joint venture in Japan of $1,827 will be deducted from the equity investment
earnings before taxes of $10,551 to come to the amount of the negative
adjustment for “Equity in earnings in joint ventures, net” of $8,724 in 2012.
II. The operating section also reports a positive adjustment for “Distributions
received from joint venture” of $15,274 in 2012. Reconcile this amount to the
information disclosed in Note 8. Explain why a positive adjustment is made to
arrive at net cash from operating activities.
As discussed in part i, the dividends were received in cash but were not
including in the net income because they were entered in as a deduction of the
equity investment in TimWen. Therefore, in order to find the right cash amount in
the statement of cash flows, there had to be a positive adjustment for the
distributions received from the TimWen joint venture of $15,274.

88
Case 10: Johnson & Johnson
Retirement Obligations
Brent Thomas
4/9/2019

89
TABLE OF CONTENTS
10.1 Case Introduction ......................................................................................................... 90
10.2 Concept A .................................................................................................................... 91
10.3 Concept B .................................................................................................................... 92
10.4 Concept C .................................................................................................................... 93
10.5 Concept D .................................................................................................................... 94
10.6 Concept E ..................................................................................................................... 94
10.7 Process F ...................................................................................................................... 95
10.8 Process G ..................................................................................................................... 97
10.9 Process H ..................................................................................................................... 98
10.10 Process I ..................................................................................................................... 100

90
10.1 CASE INTRODUCTION
The Johnson & Johnson – Retirement Obligations case shows students how to
read and interpret retirement benefit (pension) footnotes, understand the difference
between the pension expense and the actual contributions to the retirement benefit
obligations, and evaluate the impact of actuarial assumptions in the computation of the
pension expense, retirement plan assets, and retirement benefit obligation. Case 10
required an active knowledge of retirement obligations, which we had just gotten from
chapter 20 in the financial accounting book and from Dr. Dickinson’s lecture. The case
questions were then able to push the students a step further in the learning process by
conceptualizing the basic journal entries that we knew how to compute into interpreting a
company’s financial statements.
This case was interesting because it gave a better understanding of pension
expenses and retirement plans, which is what we just covered in the second section of
intermediate accounting. Being able to see how a large company actually reports and
calculates its pension expenses and obligations through its financial statements was eye
opening and allowed me to understand the connection between all of the accounts better.
Working backwards from the financial statements to answer the conceptual and process
questions asked in the case was something that we had not done in our intermediate class
and thus it allowed me to really see the effects of the journal entries and computations for
calculating pension expense that we did learn in class.
91
10.2 CONCEPT A
There are two general types of retirement (i.e. pension) plans—defined benefit plans and
defined contribution plans.
i. How do these two types of plans differ? Which type does Johnson &
Johnson have?
With a defined benefit plan, the employer sets its retirement benefits based
upon a few different factors, which include the employee’s salary,
completed years of service, or a variety of others. Defined benefit plans
put the investment risk that comes with the funding of the plan on the
company, which then has to get projections made by actuaries to
determine the amount of payment due upon retirement. With the
complexities and risks that are involved with the defined benefit plan, the
other type of plan, the defined contribution plan, has almost put an end to
the use of defined benefit plans completely. Defined contribution plans are
a lot less expensive and risky for companies because they are primarily
funded by the employee along with contributions from the company that
match the employee’s payments to a certain amount. The specific amount
of the company’s contributions for each employee is based off of either
salary or some other base amount.
ii. Explain why retirement plan obligations are liabilities.

92
Retirement plan obligations are the amount that the employer owes past
and present employee’s in retirement for work done up to the present year.
Since all the retirement plans are set up to compensate workers for work
done, the company is obligated to pay all of its employees the specified
amount that was promised in either the defined benefit or defined
contribution plan. Therefore, the retirement plan obligations are
considered liabilities.
iii. List some of the assumptions that are necessary in order to account for
retirement plan obligations.
In order to account for retirement plan obligations accurately, companies
have to have actuaries come in to make assumptions on how long
employees will work for the company, estimated future salaries for that
amount of time, when the employees will retire, and even the length of
their employee’s lives.
10.3 CONCEPT B
In general, companies’ pension obligations are influenced each year by four main types
of activities: service cost, interest cost, actuarial gains or losses, and benefits paid to
retirees. Explain each of the four activities in your own words.
Each year, service costs are incurred by the company which are included in the
pension expense and increase the projected benefit obligation for whatever amount is
decided by the company. These service costs are for an additional year of services

93
rendered by the employees. Because companies set up benefit obligations, interest costs
are involved since the obligation is set up to be paid years down the road. The interest
cost is a certain rate decided by the company for how much the benefits for the
employees accrue. Actuarial gains or losses come from realized actual expenses for the
pension plan compared to the predictions made by actuaries, based on the assumptions
discussed earlier like average retirement age, mortality age, and others. The benefits paid
to retirees are payments made to reduce the projected benefit obligation that come out of
the plan assets account that is set up by the company.
10.4 CONCEPT C
In general, companies’ pension assets are influenced each year by three main types of
activities: actual return on pension investments, company contributions to the plan, and
benefits paid to retirees. Explain each of the three items in your own words.
Actual return on pension investments, which is estimated at the beginning of the
year, increase the plan assets and decrease the amount of pension expense to be paid. The
actual return will cause an unexpected gain or loss if it is different than the estimated
return. The actual return can be calculated by subtracting the beginning balance of plan
assets (plus contributions and less any benefits paid) from the ending balance of plan
assets for the year. Company contributions to the plan influence companies’ pension
assets by increasing them for the amount that the company pays in each year. The
benefits paid to retirees takes money from the plan assets and uses that amount to
decrease the projected benefit obligation.

94
10.5 CONCEPT D
In general, companies’ pension expense and pension plan assets both have a “return on
plan assets” component. How do the two returns differ? Explain the rationale for this
difference.
While both the pension expense and pension plan assets are affected by return on
plan assets, the two are both affected by different return on plan assets amounts. As
mentioned in Concept C, the return on plan assets is estimated at the beginning of the
year. This estimated return on plan assets is taken out of the pension expense and reduces
it for the amount of the estimation. Then, at the end of the year when the actual return on
plan assets is calculated, the actual amount of return on plan assets is added to the
pension plan assets. The difference between the two amounts is an unexpected gain or
loss and is either added or subtracted to the pension plan assets accordingly but does not
affect the pension expense. The pension expense uses the expected return to reduce
market-induced volatility in the income statement.
10.6 CONCEPT E
Johnson & Johnson provides other benefits to retirees including health-care and insurance
benefits. What is the primary difference between the company’s other-benefits plans and
its retirement plans?
The primary difference between the company’s other-benefits plans and its
retirement plans is that the retirement plan is a specified liability that leads to future
payments for employees currently working and even those that are retired. The other-

95
benefits plans are not paid for ahead of time like the retirement plan. Therefore, the other-
benefits plans can still be altered dramatically, whereas the retirement plans are set
(assuming no adjustments due to actuarial changes).
10.7 PROCESS F
Consider Johnson & Johnson’s pension expense detailed on page 61 of the company’s
annual report.
Note that the company uses the term “net periodic benefit cost” to refer to pension
expense.
i. How much pension expense did Johnson & Johnson report on its 2007
income statement?
Johnson & Johnson reported a pension expense of $646 million on its
2007 income statement. The pension expense includes $597 million from
service cost and $656 million from interest cost.
ii. Prepare the journal entry to record the service cost and interest cost
portion of the 2007 pension expense.
Dr. Annual Pension Expense 1,253
Cr. Projected Benefit Obligation – Service Cost 597
Cr. Projected Benefit Obligation – Interest Cost 656
*in millions
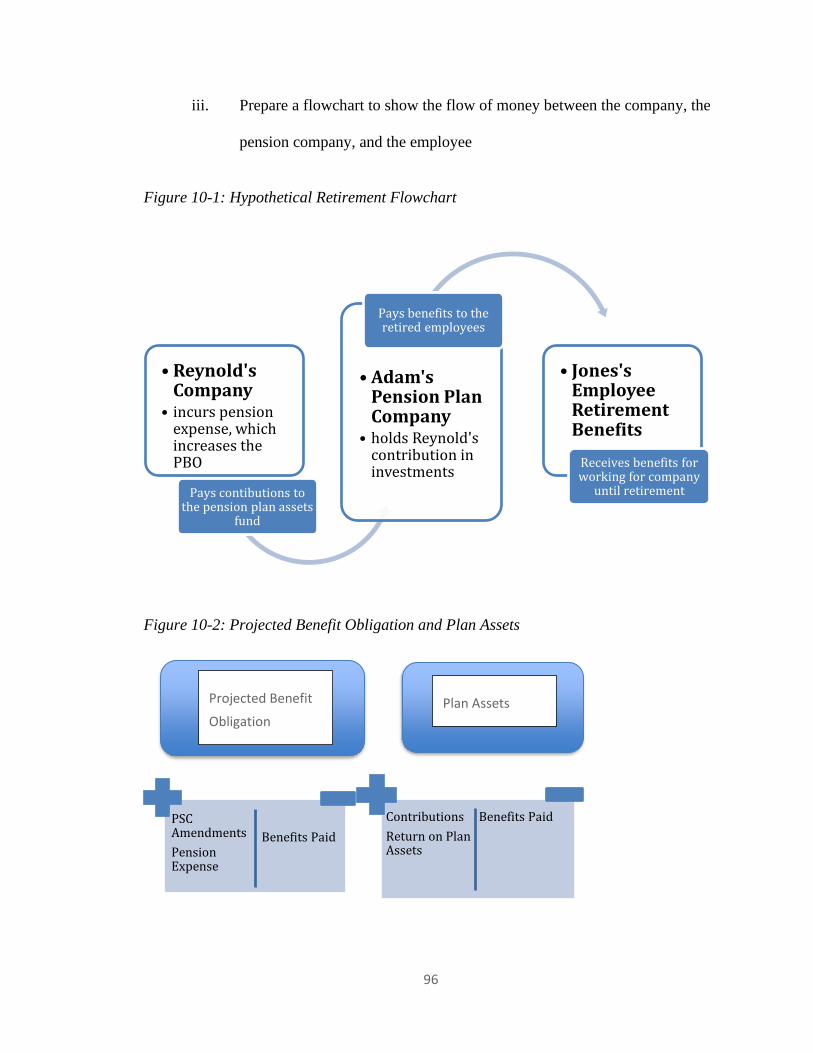
96
iii. Prepare a flowchart to show the flow of money between the company, the
pension company, and the employee
Figure 10-1: Hypothetical Retirement Flowchart
Figure 10-2: Projected Benefit Obligation and Plan Assets
• Reynold's Company
• incurs pension expense, which increases the PBO
Pays contibutions to the pension plan assets
fund
• Adam's Pension Plan Company
• holds Reynold's contribution in investments
Pays benefits to the retired employees
• Jones's Employee Retirement Benefits
Receives benefits for working for company
until retirement
PSC Amendments
Pension Expense
Benefits Paid
Contributions
Return on Plan Assets
Benefits Paid
Projected Benefit
Obligation Plan Assets

97
10.8 PROCESS G
Consider Johnson & Johnson’s retirement plan obligation, that is, the pension liability, as
detailed on page 62 of the company’s annual report.
i. What is the value at December 31, 2007, of the company’s retirement plan
obligation? What does this value represent? How reliable is this number?
The company’s retirement plan obligation was worth $12,002 million at
the end of 2007. This value represents the amount that the company will
be responsible for paying its employees upon retirement. The reliability of
this number can be questioned because of all of the assumptions that were
made to get to that exact number and because of the fact that it can be
adjusted; however, the number is fairly reliable because it is the best
possible estimate that Johnson & Johnson could have. The company hires
third party actuaries to perform all of those assumptions mentioned earlier
in order for an accurate, unbiased number.
ii. What is the pension-related interest cost for the year? Compute the
average interest rate the company must have used to calculate interest cost
during 2007. Does this rate seem reasonable? Explain.
The pension-related interest cost for the year was $656 million. Johnson &
Johnson must have used an interest rate of 5.626 percent in order to get to
an interest cost of $656 million. This can be found by dividing the interest
cost by the beginning projected benefit obligation for the year, which was

98
$11,660 million. Because the interest cost is $656 million, the beginning
PBO is $11,660 million, and PSC amendments are $14 million, this means
the average interest rate is 5.6 percent. While the rate seems reasonable, to
actually determine the reasonableness of this test one would have to
compare this rate to companies with similar actuarial assumptions. This
number does, in fact, fall within the domestic and international rates that
were disclosed in the footnotes.
iii. What amount of pension benefits were paid to retirees during the year?
Did Johnson and Johnson pay cash for these benefits? How do the benefits
paid affect the retirement plan obligation and the retirement plan assets?
Pension benefits in the amount of $481 million were paid to retirees
during 2007. Johnson & Johnson did not pay cash for these benefits. The
benefits came from the pension plan assets in order to pay off the
projected benefit obligation.
10.8 PROCESS H
Consider Johnson & Johnson’ retirement plan assets that is, the pension plan asset, as
detailed on page 62 of the company’s annual report.
i. What is the value at December 31, 2007, of the retirement plan assets held
by Johnson & Johnson’s retirement plan? What “value” is this?
The retirement plan assets at the end of 2007 had a fair value of $10,469.
This value represents the fair value of the investments and amount of

99
funding that the Johnson & Johnson’s retirement plan has gained over the
years of its existence in order to pay of the retirement obligation.
ii. Compare the amount of the expected return on plan assets to the amount
of the actual return during 2006 and 2007. Are these differences
significant? In your opinion, which return better reflects the economics of
the company’s pension expense?
The expected return on pension plan assets for 2006 and 2007 were $701
million and $809 million, respectively. The actual return on pension plan
assets for 2006 and 2007 were $966 million and $743 million,
respectively. While the difference for 2007 was not very significant at an
unexpected loss of 8.158 percent, the difference between the expected and
actual for 2006 was a whopping unexpected gain of $265 million, which
came out to a 37.803 percent gain. The expected return on plan assets is
the better reflection of the pension expense since it is actually used in the
computation of the pension expense.
iii. How much did Johnson & Johnson and their employees contribute to the
retirement plan during 2007? How does that compare to contributions in
2006? (See page 63.)
During 2007, the company contributed $317 million to the plan and the
employees contributed $62 million. The total contributions of $379
million were a $73 million increase from the 2006’s contributions of $306

100
million ($259 million from the company and $47 million from the
employees).
iv. What types of investments are in Johnson & Johnson’s retirement plan
assets?
Johnson & Johnson’s retirement plan assets include 79 percent in equity
securities and 21 percent in debt securities for its U.S. Retirement plans.
The international retirement plans included 67 percent in equity securities,
32 percent in debt securities, and 1 percent in real estate and other.
10.8 PROCESS I
Is the company’s retirement plan under funded or over funded at December 31, 2007? At
December 31, 2006? Where does this funded status appear on the company’s balance
sheet?
The company’s retirement plan was under funded at the end of 2007 and 2006 by
$1,533 million and $2,122 million, respectively. The funded status is included in multiple
spots on the balance sheet: non-current assets, current liabilities, and non-current
liabilities. The actual amount is located in Note 13 of the financial statements as “Fund
status at end of year”.

101
Case Eleven: On the Balance Sheet-Based Model of
Financial Reporting
Brent Thomas
4/28/2019

102
TABLE OF CONTENTS
11.1 Case Introduction ......................................................................................................... 103
11.2 Summary of the Article ................................................................................................ 104
11.3 Reaction to the Income Statement-based Method ........................................................ 108
11.4 Usefulness of the Information in Future Career ........................................................... 100
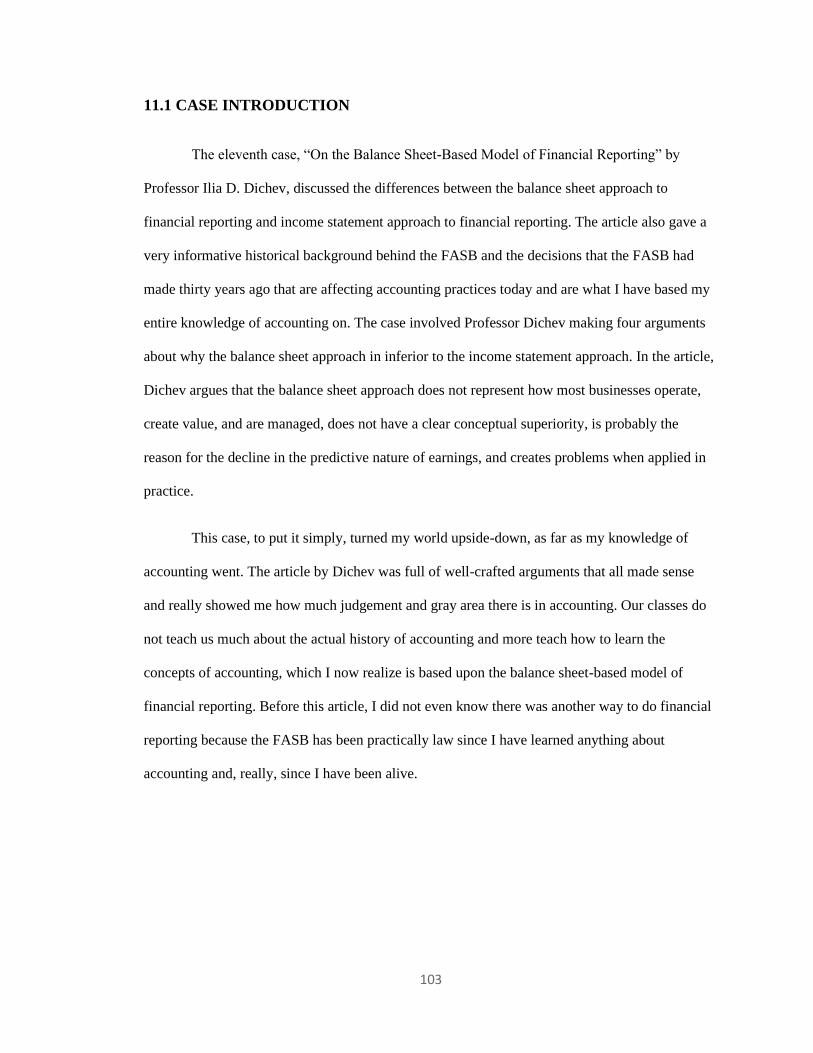
103
11.1 CASE INTRODUCTION
The eleventh case, “On the Balance Sheet-Based Model of Financial Reporting” by
Professor Ilia D. Dichev, discussed the differences between the balance sheet approach to
financial reporting and income statement approach to financial reporting. The article also gave a
very informative historical background behind the FASB and the decisions that the FASB had
made thirty years ago that are affecting accounting practices today and are what I have based my
entire knowledge of accounting on. The case involved Professor Dichev making four arguments
about why the balance sheet approach in inferior to the income statement approach. In the article,
Dichev argues that the balance sheet approach does not represent how most businesses operate,
create value, and are managed, does not have a clear conceptual superiority, is probably the
reason for the decline in the predictive nature of earnings, and creates problems when applied in
practice.
This case, to put it simply, turned my world upside-down, as far as my knowledge of
accounting went. The article by Dichev was full of well-crafted arguments that all made sense
and really showed me how much judgement and gray area there is in accounting. Our classes do
not teach us much about the actual history of accounting and more teach how to learn the
concepts of accounting, which I now realize is based upon the balance sheet-based model of
financial reporting. Before this article, I did not even know there was another way to do financial
reporting because the FASB has been practically law since I have learned anything about
accounting and, really, since I have been alive.

104
11.2 SUMMARY OF THE ARTICLE
The article by Professor Ilia D. Dichev, “On the Balance Sheet-Based Model of Financial
Reporting”, discusses the flaws in the United States Financial Accounting Standards Board’s
(FASB) adoption of a balance sheet-based model as the foundation of the conceptual framework
of accounting. In the midst of the re-assessment of the conceptual frameworks of FASB and the
International Accounting Standards Board (IASB), Dichev makes the argument to change the
very basis of that conceptual framework back to an income statement-based model of financial
reporting. In the article, Dichev gives a background of the accounting policies and of the
accounting regulatory bodies behind the debate, four reasons backing up his beliefs, and two
suggestions for what he thinks would be a “good” model of financial reporting.
Dichev begins the article talking about a merger between the FASB and IASB, which
highlights the need for a change in the orientation of financial reporting sooner than later. As the
world becomes increasingly more connected through technological innovations, companies,
investors, accountants, and others affected by accounting standards are all pushing for the
standard setting organizations (FASB and IASB) to converge their systems in order to agree on
specific issues. The differences in accounting standards comes from the lack of a shared
conceptual framework between the organizations. Foundational concepts like “assets”,
“liabilities”, and “revenue recognition” are just of few that were mentioned in the article that need
to be re-defined.
Immediately after, the author discusses the background of accounting going back to
before the FASB’s existence and even before the Accounting Principles Board’s (APB) brief
reign. Before the FASB, there was not a firm accounting standard setting organization. Once this
organization was established and gained power, the FASB decided in the late 1970’s that the only
conceptually sound and logical basis of accounting was the balance sheet approach. The FASB

105
came to this conclusion after deciding that the primary goal of financial reporting was to
determine the proper valuation of a company’s assets and liabilities, considering other accounting
variables as secondary and derivative. This conclusion meant that earnings would most accurately
come from considerations made on the balance sheet. Dichev, then, comes in to give his argument
for the primary goal of financial reporting to be the determination of revenues, expenses, and
earnings, which stems from use of the income statement approach.
The income statement approach relies on the accurate determination of the timing and
amount of revenues and expenses as the primary goal of financial reporting. The income
statement approach is based off of the revenue recognition and the matching of expenses to
revenues principles of accounting, which leaves the balance sheet accounts as secondary and
derivative. This approach is what Dichev believes should be taken by the FASB and IASB in the
future, which is the opposite of how accounting has been done for the past 30 years. Dichev’s
critique is built around four main themes: the balance sheet approach does not represent how
most businesses operate, create value, and are managed; the balance sheet approach’s conceptual
superiority is unclear and false; the balance sheet approach is probably the reason for the decline
in the predictive nature of earnings; and the balance sheet approach creates problems when
applied in practice.
Dichev’s first critique, that the balance sheet approach is not representative of how
businesses actually work, stems from the fundamental purpose of most businesses: spending
money as expenses in order to receive revenue and earnings. The author of the article describes a
business’s assets as props that are continually used or transformed in order to produce revenue
and earnings. The Middle Age Italian trading guilds analogy that the author used in his argument
was a simplified version of how businesses operate really drove home the message that most
businesses are, at their core, “sophisticated devices for continually advancing expenses, hoping to
earn revenue and earnings”. The only difference between modern companies and the Italian
106
trading guilds is the scope of business and the time horizon, while the assets are just temporary
implements to carry out the business. The article also points to the fact that managers use the
income statement approach in order to manage their businesses and would not even think about
the build-up of assets as a determination of value added. Although all of these arguments point to
a preference of the income statement approach, the author does mention that, for certain
businesses, balance sheet-based accounting makes sense. The dividing line between the practical
use of the two methods is the distinction between operating (income statement) and financing
(balance sheet) activities.
The second argument that the author makes is that the conceptual superiority of the
balance sheet approach, that FASB claims, is unclear and might be a false statement in general.
FASB’s claim stems from their belief that the concept of “asset” is the most important and
fundamental in accounting, with all others stemming from that. However, Dichev uses FASB’s
own definition of assets, which is that assets are “probable future economic benefits”, to
undermine the claim that the balance sheet approach is superior conceptually. Dichev says that
the future economic benefit sounds a lot like earnings, which “leads to circularity in FASB’s
argument”. While the concept of asset and earnings are connected, Dichev argues that the concept
of income is more fundamental and clearer than the concept of asset, especially with the drastic
increase of intangible assets in the past decade.
The article’s third claim mentions the substantial temporal decline in the forward-looking
usefulness of earnings and blames balance sheet accounting for being a major contributor to that
decline. Dichev states that earnings is the single most important output of the accounting system
and the balance sheet approach requires a regular re-valuation of various assets, which increases
the volatility of reported earnings and decreases the persistence of earnings (all the while the
properties of the business fundamentals have not really changed). This approach allows for a less
accurate number for earnings and increased abuse of the accounting system through earnings

107
management. The trend of less accurate forward-looking earnings numbers is one that has already
been detrimental to investors and could have potential far-reaching consequences if not changed
soon.
In Dichev’s final critique, he says that there are substantial problems with actually
applying the balance sheet approach in practice. The balance sheet-method of accounting has
been taken advantage of by companies who have used more and more valuation estimates into
their financial reports. As mentioned in the previous point, this approach allows increasing
subjectivity and judgement by managers, which directly leads to earnings management by people
whose salaries are tied to stock performance. A dangerous example of this abuse is Enron. The
increase in fair value assessment of assets continues a feedback loop between financial markets
and the actual economy and puts too much faith in the false accuracy of market prices, which may
deviate from the actual values of assets. This treatment allows for false market prices to increase
and decrease earnings although earnings may not have actually differed in the first place.
Dichev then gives his own suggestions for what he believes a “good” conceptual
framework may look like. For his definition of a “good” conceptual framework, Dichev takes the
perspective of an outside investor. His first major difference is that he would implement a clear
distinction between operating and financing activities that is reflected in all financial statements.
The second major difference is that he would like to see a renewed emphasis on the matching
principle and the revenue recognition principle for operating activities. He acknowledges that
these suggestions are not a full alternative model and that such model would take a lot more
consideration; however, the main point of this article was not to offer a solution but to start the
conversation, as the upcoming decisions made by the FASB and IASB will have consequences
for many years to come.
108
11.3 REACTION TO THE INCOME STATEMENT-BASED METHOD
How did reading this article change your current way of thinking?
Reading this article really opened up my eyes to what has been going on with accounting
in the past decade. After learning in class about the accounting principles, the FASB and IASB,
and even what happened with Enron, the fact that there was a different way of accounting that has
been done for almost all of time except for the past 30 years kind of blew my mind. This article
made me question my entire knowledge of accounting so far, and the main problem with
Dichev’s article is that all of it made sense and seemed a lot more logical than the way the FASB
makes companies report their financial statements.
The historical background for the current developments in accounting was honestly just
as interesting as his points against the balance sheet-based model of reporting financial
statements. My knowledge from my accounting classes does not even touch anything really past
2000 at all, and the only thing we covered really from that time period was Enron and the
Sarbanes-Oxley Act of 2002. Even when we covered the Sarbanes-Oxley Act, we didn’t discuss
the actual accounting problems that led to that; it was more a discussion of here are all these new
regulations that have been implemented since then. So, learning about accounting pre-2000’s was
very intriguing and also brought to my attention that they totally could have made the wrong
decision thirty years ago when FASB chose the balance sheet approach instead of the income
statement approach. After all, thirty years ago was before technology like the internet and since
then, not only has the world drastically changed but so have businesses and the size of businesses.
Plus, with the ease of money transfers and the speed and size of investment markets, companies
have been able to diversify, get bigger, and find ways to change earnings through estimation and
valuation accounts with an astounding increase in pace. The companies of today have access to a
whole new world of financing opportunities, which were not a thing thirty years ago when FASB

109
made their decision. However, we are so deep into the balance sheet-based reporting of financial
statements that it would be a huge problem for all parties involved if the very basis of accounting
was changed. Although I am a fan of Dichev’s article, a change to the income statement-based
reporting of financial statements would probably cost millions of dollars and a crazy amount of
time to write up and implement.
11.4 USEFULNESS OF THE INFORMATION IN FUTURE CAREER
How will you use this information in your future career? Be thoughtful and creative about
the situations you will encounter where this article will affect your beliefs and the way you carry
out your future job
This article got me extremely interested right away because I began thinking about how
helpful this change in accounting would be for my potential future career in Deal Advisory. In
Deal Advisory, the accountants will look at the income statement and work backwards to find a
valuation of the company from the earnings before interest, tax, depreciation, and amortization
(EBITDA), which is a measure of a company’s operating performance. When companies are
looking at buying, selling, or merging with another company, they first need to find out what the
business is actually worth. This valuation is done by looking at the financial reports of the
company (mainly the income statement) in order to evaluate the company’s performance without
having to factor in financial decisions, accounting decisions, or tax environments. This financial
due diligence (FDD) is almost exactly what Dichev describes in his article and actually further
convinced me of his points.
When I first learned about Deal Advisory, I was interested to see how people picked apart
different companies’ financial statements to find out if a company was actually successful or not.
After all, I had found out that companies could somewhat alter what their earnings were, which I
had learned in my accounting classes. So, when I was reading each of Dichev’s points about how

110
the balance sheet approach does not represent how most businesses operate, create value, and are
managed, how the balance sheet approach’s conceptual superiority is unclear and false, how that
approach is probably the reason for the decline in the predictive nature of earnings, and how the
balance sheet approach creates problems when applied in practice, it was safe to say that a lot of
dots connected in my head.
Not only did all of Dichev’s points resonate with me, but they also made me think about
the potential effect that this change he is calling for would have on my potential career in Deal
Advisory. To be honest, I don’t know how this would affect my potential career. It would
certainly make things easier for me, but, then again, it might take away some of the value that my
potential position adds because earnings would be more accurately indicative of companies’ true
values. Obviously, the Deal Advisory service line does more than just put a value on companies,
and I would like to think that a change like this would just be helpful. However, a change to the
fundamentals of accounting would affect things that I can’t even comprehend yet, and I do not yet
know the ins and outs of the deal advisory service line. So, any thoughts that I have would merely
be speculator and coming almost “out of left field”.

111
Case Twelve: Google Inc.
Earnings Announcements and Information Environment
Brent Thomas
5/1/2019

112
TABLE OF CONTENTS
12.1 Case Introduction ......................................................................................................... 113
12.2 Analysis H .................................................................................................................... 114
12.3 Analysis I ..................................................................................................................... 115
12.4 Analysis J ..................................................................................................................... 116

113
12.1 CASE INTRODUCTION
In Case 12, Google Inc. - Earnings Announcements and Information Environment, the
students looked at Google’s financial statements, as well the press release from the end of 2013, a
Wall Street Journal article, and stock chart information of Google’s stock price history. The
students were then to dive into those pieces of information given in the case to find out
management’s intent and to understand investors reactions. The lessons learned from this case
were to understand the purpose of managers’ use of non-GAAP earnings, to understand the
timing of the release of earnings information to investors, to understand the type of information
included in the quarterly press releases of financial information, and to explore how investors
respond to earnings and other information about a firm’s performance. The case called for
students to read in between the lines of the different articles in order to see how press releases can
affect stock price, even without looking at the financial statements.
The Google case was extremely interesting as I could see the relationship between news
articles and press releases and the stock market prices. After all, stock market prices are pretty
much speculation by investors. Investors are actively keeping up with press releases and quarterly
financial information, as I could tell from the Wall Street Journal article that showed the 4%
after-hours jump in stock price. Also, it was interesting to see what exact expenses the managers
decided to leave out when computing their non-GAAP net income equivalent, which they used to
report their earnings per share.

114
12.2 ANALYSIS H
Read the excerpts of the press release titled “Google Announces Fourth Quarter and
Fiscal Year 2013 Results” and review Google’s operating performance reported in the statements
of income accompanying the press release.
The press release includes information about non-GAAP financial measures for the
fourth quarter of 2013. Consider the table that reconciles GAAP measures to the non-GAAP
measures. What explains the difference between GAAP net income and the non-GAAP
equivalent? Do you agree with each of Google’s adjustments in computing non-GAAP earnings?
Why or why not?
The differences between GAAP net income and the non-GAAP equivalent stem from the
elimination of the stock-based compensation expense, the restructuring and related charges, the
net loss from discontinued operations, and the income tax effects of the stock-based
compensation expense and the restructuring and related charges. I agree with each of the
adjustments that Google made in computing non-GAAP earnings. The entire reason for
computation of the non-GAAP net income equivalent is for management’s use in strategic
planning of operations. The Google management team took out those expenses in order to
provide a more accurate net income for its recurring core business operations. Although the
stock-based compensation expense is a recurring and an important part of their employees’
compensation, the expense is paid in stocks and is not important to the actual business operations
of Google. The stock-based compensation expense amount also fluctuates pretty widely, so
excluding it from the non-GAAP net income helps with the comparability between periods. This
non-GAAP equivalent can provide useful, applicable insights for its management, as well as
investors, when comparing this number against Google’s own recurring core business operations
over multiple periods of time and against other those of other companies.

115
11.3 ANALYSIS I
Use the attached stock-market charts for Google for the period January 1, 2013,
through February 14, 2014, to answer the following questions.
i. Compare Google’s fiscal 2013 earnings performance with the movement in Google’s
stock price over 2013.
Google’s fiscal 2013 earnings were $12,920 million, which is a $2,183 million
increase from the 2012 net income ($10,737 million). Google’s stock price also saw a big
increase. The stock price rose $413 per share from the end of 2012’s stock price of $707
per share to reach a whopping $1,120 per share at the end of 2013.
ii. Compare Google’s 2013 stock price performance with the performance of the broader set
of firms trading on the NASDAQ exchange (that is, the NASDAQ index).
After a slight dip beneath the NASDAQ index in early January of 2013, Google’s
2013 stock price outperformed the broader set of firms trading on the NASDAQ
exchange. There was a short time in October that the NASDAQ index caught up to
Google’s stock, but, shortly afterwards, Google’s stock price soared high above the index
and never looked back during 2013.
iii. Based on the stock market chart, did the market perceive the earnings news in
Google’s press release dated January 30, 2014, as “good news” or “bad news”?
Note: the press release was made available after the close of trading for the day.
From the chart, it seemed that the market initially perceived Google’s press
release as “bad news”. However, Google’s stock price immediately recovered and rose
116
above where it was before the Q4 earnings press release. All in all, I believe that the
market saw that Google’s numbers were improving even though investors were
concerned about the shift in Internet usage to mobile devices from desktop computers.
Therefore, there was an initial shock to the stock price. Once the market realized that
Google was still showing good signs of growth though, the stock price came back up to
where it should be within hours, increasing 4 percent in after-hours trading. So, in total,
investors saw Google’s press release as “good news”.
11.4 ANALYSIS J
j. Read the Wall Street Journal article from January 30, 2014 titled “Google Reports Higher
Profit.”
i. According to the article, how did Google’s fourth quarter revenue and earnings compare
to the consensus analyst forecasts at the time of the earnings press release? Are these
relations consistent with the positive stock market reaction following the press release?
Google’s fourth quarter revenue was $16.9 billion, which slightly exceeded the
analysts’ projected revenue of $16.8 billion. The earnings per share was slightly below
the analysts’ predictions, but this could have been partially due to the fluctuating nature
of the stock-based compensation that was eliminated to get to the $12.01 earnings per
share number that Google reported. These relations are consistent with the positive stock
market reaction following the press release.
ii. What other factors does the article discuss that might contribute to the market’s positive
reaction to the earnings press release? Are there any factors that might cause investors to
be concerned about Google’s recent performance?
The positive increase in ad revenues was a major contributor to the market’s positive

117
reaction following the earnings press release. Another contributor to the positive reaction
was the app sales via the Google Play store on Android smartphones, as they doubled to
$1.7 billion from the prior year. Also, as stated earlier, the sale of Motorola boosted
Google’s bottom line and eliminated a subsidiary that was producing large operating
losses for Google. Although there were many positive signs for investors, the major
transformation from desktop computers to mobile devices does pose some potential
problems for Google. The average amount for each click that Google receives for
advertisements is continuing to fall at a rate of 11 percent since the previous year. This
drop is due to the shift towards smaller screens of mobile phones and less expensive ads
being sold for mobile phones. For what it’s worth though, I believe that Google will find
a way to better address this problem by incorporating a better way to implement ads on
the smaller screens and possibly drive revenues from each click up in the future.

118
BIBLIOGRAPHY
Case 1: Google Fusion
Andrews, Daniel. “Using Google's Fusion Tables For Data Management.” Bud SEO, 31
Aug. 2014, www.budseo.com/tools/using-googles-fusion-tables-data-
management/.
Gonzalez, Hector, et al. “Google Fusion Tables: Web-Centered Data Management and
Collaboration.” Thodrek, 2010, thodrek.github.io/CS839_spring18/papers/p1061-
gonzalez.pdf.
EY Reporting. “How Big Data and Analytics Are Transforming the Audit.” EY, 2015,
www.ey.com/en_gl/assurance/how-big-data-and-analytics-are-transforming-the-
audit.
MacGrath, Michael J., and Scanaill Cliodhna Ni. Sensor Technologies: Healthcare,
Wellness, and Environmental Applications. Apress Open, 2014.
Case 4: General Bank
Financial Accounting Standards Board (FASB). 2016. Financial instruments - Credit
losses (Topic 326). FASB Accounting Standards Update No. 2016-13. Norwalk,
CT: FASB.
PwC. 2016. In brief: Classification and measurement - FASB issues final standard.
https://www.pwc.com/us/en/cfodirect/assets/pdf/in-brief/us-2016-01-fasb-
classification-measurement-final-standard.pdf

119
Case 5: City Comparison
“The 13 Best Places for Groceries in Dallas.” Foursquare, foursquare.com/top-
places/dallas/best-places-groceries.
“All Roads Lead to Dallas / Fort Worth, Transportation Hub.” Chesmar Homes,
chesmar.com/dallas/roads-lead-dallas-transportation-hub/.
“Barbara Bush Houston Literacy Foundation.” Barbara Bush Houston Literacy
Foundation, www.bushhoustonliteracy.org/.
“Canal Place Apartments - Houston, TX.” Apartments.com, 9 Sep. 2018,
www.apartments.com/canal-place-houston-tx/e6sjwlq/.
“Cost of Living in Dallas, Texas, United States. Sep 2018 Prices in Dallas, Texas.”
Expatistan, Cost of Living Comparisons, www.expatistan.com/cost-of-
living/dallas.
Dallas Foundation. “The Dallas Foundation Was the First Community Foundation in the
State of Texas.” About Us > The Dallas Foundation,
www.dallasfoundation.org/about-us.aspx.
“Dallas, Texas Population 2018.” Dallas, Texas Population 2018 (Demographics, Maps,
Graphs), worldpopulationreview.com/us-cities/dallas-population/.
“Dallas, TX Crime Rates.” NeighborhoodScout,
www.neighborhoodscout.com/tx/dallas/crime.

120
“Dallas: Economy.” Dallas: Economy - Major Industries and Commercial Activity,
Incentive ProgramsNew and Existing Companies, www.city-data.com/us-
cities/The-South/Dallas-Economy.html.
“DFW Quality Healthcare, Hospitals and Physicians.” Dallas Relocation Guide,
www.destinationdfw.com/DFW-Quality-Healthcare-Hospitals-and-Physicians/.
“Economy and Trade.” Back to Www.houstontx.gov,
www.houstontx.gov/abouthouston/economytrade.html.
“Financial Transparency.” Current Tax Rates,
dallascityhall.com/departments/budget/financialtransparency/Pages/current-tax-
rates.aspx.
“Health.” Back to Www.houstontx.gov, www.houstontx.gov/abouthouston/health.html.
“Houston, Texas Population 2018.” Houston, Texas Population 2018 (Demographics,
Maps, Graphs), worldpopulationreview.com/us-cities/houston-population/.
“Houston, Texas Sales Tax Rate - Avalara.” Taxrates,
www.avalara.com/taxrates/en/state-rates/texas/cities/houston/.
“Houston, TX Crime Rates.” NeighborhoodScout,
www.neighborhoodscout.com/tx/houston/crime.

121
Case 6: WorldCom, Inc.
Hayes, Adam. “WorldCom.” Investopedia, Investopedia, 29 Jan. 2018,
www.investopedia.com/terms/w/worldcom.asp.
Jared Sandberg, DeborahSolomon, and Rebecca Blumenstein. “Accounting Spot-Check
Unearthed A Scandal in WorldCom's Books.” The Wall Street Journal, Dow Jones
& Company, 27 June 2002,
online.wsj.com/article/0,,SB102512901721030520,00.html.
Case 8: BP p.l.c.
Goguen, David. “BP Oil Spill Lawsuits and Legal Issues.” Www.nolo.com, Nolo, 31 Dec.
2015, www.nolo.com/legal-encyclopedia/bp-oil-spill-lawsuits-legal-33442.html.
“Is It Too Late to File a BP Oil Spill Claim?” Farrell, Patel, Jomarron & Lopez, 29 Nov.
2018, justice360.com/late-file-bp-oil-spill-claim/.
“US Deepwater Horizon Explosion & Oil Spill Lawsuits.” Business & Human Rights
Resource Centre, 17 Aug. 2010, www.business-humanrights.org/en/us-deepwater-
horizon-explosion-oil-spill-lawsuits?page=19.
Case 9: The Wendy’s Company
Natter, Elisabeth. “A Difference Between Mergers and Joint Ventures.” Your Business, 9
May 2018, yourbusiness.azcentral.com/difference-between-mergers-joint-ventures-
11796.html.