The application of Lean Principles and Six Sigma in the Mexican
Upload
khangminh22Category
view
3download
0
THE APPLICATION OF MANAGEMENT ACCOUNTING PRINCIPLES IN
THE BREAD INDUSTRY: A CASE STUDY
Susanna Levina Middelberg, Hons. B. Corn.
Mini-dissertation submitted in partial fulfilment of the requirements for the
degree Magister Commercii in Management Accounting
at North-West University.
Supervisor: Prof. S. Van Rooyen
Potchefstroom
November 2006

ACKNOWLEDGEMENTS
I hereby wish to express my sincere gratitude and appreciation towards the following persons
for their cooperation and support during the completion of the study:
Prof S van Rooyen. my supervisor, for her guidance, support and especially
encouragement in the supervision of this study. Thank you for your continuous effort in
spite of your work-load.
The General Manager and Financial Manager of Bread Factory A, for their time, interest
and continuous support.
Martinus Postma for his professional, friendly approach and the time spent on the
language editing of this mini-dissertation.
The friendly and competent staff of Ferdinand Postma Library for their continuous
assistance in the searches for literature.
My loving husband, Conrad, who always puts my needs first. Thank you for caring for
our daughter Elizca while 1 had to work. You are a wonderful husband and father.
My daughter, Elizca_ who always brings a smile to my face.
And above all, to the most important Source of encouragement. the Lord God Almighty,
who carried and blessed me throughout this study.

ABSTRACT
A loaf of bread is a consumable product and is consumed by millions o f people on a daily
basis around the \\orld. Bread constitutes the staple diet o f millions o f South Africans. The
bread industry in South Africa has undergone a total transformation since deregulation o f the
industry on 1 March 1991. The deregulation lead to a considerable amount o f new entrants to
the market which increased competition immensely. Another impact deregulation had was
that the distribution channel o f bread changed from cafes and medium-sized shops to large
chain stores, supermarkets, spaza shops and habbkers. I n the past a distributor only had
limited distribution stops, but the distribution stops have increased significantly due to the
changing distribution channel. This. combined with rising fuel prices, increased delivery cost
significantly.
A bread factory. the ob.iect nf this case stody. has espericnced similar increases in their
distribution costs. The bread factory has numerous delivery routes and as a way to monitor
these distribution costs, the bread factory calculates a delivery route contribution margin to
determine whether a deliver) route is viable or not. This calculation deducts the costs to
service the delivery route from the income generated by the route. The production costs o f
bread therefore directly affect the profitability o f a delivery route margin. The main
ingredient o f bread, namely flour, is purchased from a miller than forms part o f the group that
the bread factory belongs to. The transfer price at \rhich this tlour i s purchased, impacts the
production cost o f bread directly.
The general objective o f this research was to determine whether general management
accounting prir~ciples were applied in the bread factory with specific reference to the financial
viabiliry o f the delivery routes. The study consisted o f a literature study and an empirical
survey. Semi-structured interviews, using a questionnaire, were conducted with senior
management o f the bread factory. The results o f the interviews and an examination and
analysis o f the financial data for Bread Factory A were used to assess the current calculation
o f the delivery route segment margin and to develop a model for future calculation o f an
accurate delivery route segment margin. Cenain strategic documents o f Bread Factory A
were analysed to determine whether their strategy enabled Bread Factory A to gain a
competitive advantage. Quotations were obtained from independent external suppliers for the
supply o f flour and compared with the current transfer price paid to the group supplier o f
flour to determine whether the transfer price was market-related.
The results s l l o ~ e d that certain production costs were not allocated as part of cost of sales aud
therefore affected the calculation of the profitability of delivery routes. The delivery route
calculation was not a calculation of the contribution margin of the delivery route.
Furthermore, based on the quotations obtained, the transfer price at which flour is purchased
from the miller is higher than the market price. Based on the results of this study, it is
recommended that the bread factory uses a delivery route segment margin calculation to
determine the profitabilig of a delivery route. A model is provided by the researcher.
Funllrrmore. it is recommended that the holding company of the bread factory and the miller
should involve both parties in the setting of the transfer price of flour. Negotiations should
take place between these three parties to ensure that a more market-related transfer price is
set.

OPSOMMING
Brood dien daagliks as stapelvoedsel vir miljoene nlense wereldwyd. Op 1 Maan 1991 het
die broodindustrie 'n reuse metamorfose ondergaan as gevolg van deregulasie. Dit het
daartoe gelei dat 'n groot aantal nuwe toetreders die mark binnegekom het wat kompetisie
aansienlik verhoog het. Die deregulasie het ook tot gevolg gehad dat die verspreidingskanaal
verander het van kafees en medium-grootte winkels na groot kettingwinkels, supermarkte,
negosiewinkels en smouse. Die verandering in die verspreidingskanaal het teweeg gebring
dat die aantal verspreidingspunte aansienlik verhoog het en tesame met die steeds stygende
brandstofpryse het dit 'n reuse invloed op afleweringskoste gehad.
Die broodfabriek wat in hierdie gevallestudie bestudeer word het die bogenoemde verhoging
in afleweringskoste eerstehands ervaar. Die broodfabriek het Lerskeie afleweringsroetes en
b\. wyse \.an monitering \an hierdie kostes nard die afle\\erin:sroete b\draelnarge hereken
om te bepaal of 'n spesifieke roete finansieel lewensvatbaar is. In hierdie berekening word
die koste om die afleweringsroete te diens afgetrek van die inkomste \vat deur die roete
gegenereer word. Die winsgewendheid van 'n afleweringsroete word daarom direk bei'nvloed
deur die produksiekoste van brood. Meel. hat die basiese bestanddeel van brood is, word
aangekoop by ' n meule \vat deel vorm van die groep waaraan die broodfabriek ook behoort.
Die produksiekoste van brood word direk be'ininvloed deur die oordragprys waarteen die meel
aangekoop word.
Die algemene doelstelling van hierdie navorsing was om te bepaal of algemene
bestuursrekeningkundige beginsels toegepas is in die broodfabriek met spesifieke verv.ysing
na die finansiele lewensvatbaarheid van die afleweringsroetes. Die studie bestam uit 'n
literatuurstudie en 'n ernpiriese opname. Semi-gestruktureerde onderhoude is deur middel
van vraelyste met die topbestuur van die broodfabriek gevoer. Die resultate van die
onderhoude en die ondersoek van die finansiele verslae is gebruik om die huidige berekening
van die afleweringsroete segmentele tnarge te beoordeel en \,ir die toehomstige berekening
van akkurate afleweringsroete segmentmarges. Sekere strategiese dokumente van die
bakkery is geanaliseer om te bepaal of die broodfabriek met die huidige strategie
kompeterende voordeel behaal. K\rotasies is verkry vanaf onaflianklike verskaffers van meel
om te bepaal of die oordragprys war deur die bakker). aan die meule betaal word vir meel, \\el
markvenvant is.

Die resultate het getoon dat sekere produksiekostes nie as deel van die koste van verkope
toegedeel is nie en as gevolg daarvan is die berekening van die winsgewendheid van
afleweringsroetes bei'mloed. Die finansiele lewensvatbaarheid van 'n afleweringsroete was
nie gebaseer op die berekening van die bydraemarge van 'n afleweringsroete nie. Die
oordragprys wat aan die meule betaal word vir aankope van meel is hoer as die markvenvante
prys. Volgens hierdie studie. word dit aanbeveel dat die broodfabriek 'n afleweringsroete
segmentele marge gebruik om die winsgewendheid van 'n afleweringsroete te bereken. 'n
Model uord deur die navorser voorsien. Dit word ook aanbeveel dat die rnoedennaatskappy
die broodfabriek en die meule moet betrek by die vasstelling van die oordragprys van meel
om sodoende te verseker dat die prys meer markvenvant is.

TABLE OF CONTENTS
ACKNOWLEDGEMENTS ABSTRACT OPSOMMJNG TABLE OF CONTENTS LIST OF TABLES LIST OF FIGURES LIST OF GRAPHS LIST OF EXAMPLE LIST OF DIAGRAMS LlST OF CALCULAT
CHAPTER 1 .............................................................................................................. 1 INTRODUCTION ................................................................................................................ 1
BACKGROUND Before deregulation After deregulatio Changing competitors' environment .......................................................... 3 Distribution of bread .............................................................................................. 3 C a w stud!: In~roductiim to RI-cad Factor\ A's en\ ircmnent ........................ .. . 4
4 5 5 6 6 6 7 7
Phase I: Literature study ............................................................... 7 . . Phase 2: Ernp~r~cal study ...................................................................... 7 Research design ........................................................................................ 7 Composition of the study fie Methods and techniques for Reliability and validi Report and discussio
............................. 1 1
CHAPTER 2 .............................................................................................................. 12 COST ASSIGNMENT, COST BEHAVIOUR AND COSTlNG SYSTEMS ................... 12
INTRODUCTIO COST ASSIGN Direct and indirec costs Cost assignment of indirect costs
Variable costs .................... .... ......................................................... 15 Fixed costs ..................... .. ........... ...... . . . . . . . . . . . . . . . . . . . . . . . . . . . . . . . . . . . . . . 16 Semi-variable costs (mixed costs) 18 Semi-fixed costs (step fixed costs) 18 Total cost and unit cost 19 Manufacturing cost 19 Controllable and un 19

TABLE OF CONTENTS (CONTINUED)
Relevant and irrelevant cost ............... .. .............................................. 2 1 CONTRlBUTlON THEORY 21 Segment reporting .............................................................. 22 Segmented income statemen 23 COSTING SYSTEMS 26
26 26 27 29 30
Benefits and cos 3 1 Developing manufacturing oxerhead standard rates ............................................ 32 Variance analvsis ... ............................................... 32 Relevance of standard costing ..................................................................... 33 SUMMARY .............................................................................................. 34
CHAPTER 3 ............................................................................................................ 36 COMPETlTlVE ADVANTAGE ......................................................................................... 36
INTRODUCTION .............................................................................. 36 STRATEGY FORMULATION ........................................................................... 57
Strengths ................... .... ......... ....... . . . . . . . . . . . . . . . . . . . . . . . . . . . . . . . . . . . . . . . . . . . 47 Weaknesses .......................................................................................................... 48
48 48 48 50 5 1 5 1 52
CHAPTER 4 .............................................................................................................. 54 TRANSFER PRICING ......................................................................................................... 54
INTRODUC 54 METHODS ................................. 5 5 Market-hased transfer prices 5 7 Advantages of using market- ................... .. ................... 57 Cost-based transfer prices ................... ... ........... ....... . . . . . . . . . . . . . . . . . . . . . . . 58
59 Negotiated transfer pric 60 Drawbacks of using negotiated transfe 60
66
vii

TABLE OF CONTENTS (CONTINUED)
CHAPTER 5 .............................................................................................................. 67 RESEARCH METHODOLOGY ......................................................................................... 67
INTRODUCTION 67 OBJECTIVES OF EMPIRICAL INVESTIGATION ................................. 67 STUDY POPULATION 68 MEASURING INSTRUMENTS 68 THE INTERVIEW 68 Objective of the inter . . 68 Descrtpt~on of the interview ..... .................................................. 69 Study sample of the interview .......... .. ....... ....................................... 70 . . Adtnmstration of the interview ........................................................................... 70
..................... ... ............. 75
Analysis .... ................................................................ 76 . . . . . Rel~abhty and val~dtty .................................................................... 77 SUMMARY 77
CHAPTER 6 .............................................................................................................. 78 ANALYSIS OF RESULTS .............................................................................................. 78
INTRODUCTION
Outside group sales
Sales of factored goods an Returns ........................... .. .................................................................... 81 Discounts ................................................................................ 81
82 Cost of r a ~ materials 82
83 84 85 86
Production costs 86 Distribution cost 89
94
. . 94 Deprec~atlon ................... .. ................................................................... 94

TABLE OF CONTENTS (CONTINUED)
ANALYSIS OF EACH COST ITEM IN DETERMINATION OF DELIVERY ROUTE CONTRIBUTION
Production - Wages ........................................................................................ 98 , . Vvrapp~ng - Wages .............. .. .............................................................. 98
Technical Fees
Protective clothing
Drivers' commis
Vehicle operating costs 102
CALCULATION OF DELIVERY ROUTE CONTRIBUTION ....................... 104
Production cost
COMPETITIVE ADV.4NTAGE
CHAPTER 7 ............................................................................................................ 122 CONCLUSIONS AND RECOMMENDATIONS ............................................................ 122
7.1 INTRODUCTION 122 7.2 CONCLUSIONS ............................ .. ..................................................... 122 7.2.1 Conclusions regarding the specific theoretical objectives ................................. 122 7.2.1 .I Cost tenns and concepts referring to cost assignment, cost behaviour and costing
7.2.1.2 Competit
7.2.2.1 The behaviour, traceability and relevancy of costs used in the calculation of the profitability of deliverq routes in Bread Factory A .......................................... 124

TABLE OF CONTENTS (CONTINUED)
The calculation of the delivery route profitability per delivery route in Bread Factory Compli Transfer price determination method u LIMITATIONS OF THE RESEARCH RECOMMENDATIONS .... .. .......... Measurement of the profitability of delilery routes at Bread Factory A . .......... 127
........... Bread Factory A's approach towards achieving competitive advantage 128
........................................................................... .......................... BIBLIOGRAPHY .. 13 I APPENDIX 1 ......................... ... ......................................................................... 138 APPENDIX 2 ............................................................................................................ 141

LIST OF TABLES
Table Description
1.1 Distinguishing characteristics of quantitative and qualitatwe approaches
5.1 Reliability of the interview
5.2 Validity of the intervie%
6.1 Classification of Bread Factory A's production costs
6.2 Summary of the cost behaviour. traceability and relevance of distribution
costs
Page
9
73
74
99
103
6.3 Calculation ofthe actual profitability of delivery routes at Bread Factory A
for a combined four-week period 114
6.4 Comparison of pill-chase prices of flour I\ ith Miller A's transfer prices 119

LIST OF FlGURES
Figure Description Page
3.1 Forces dri\ ing industry competition 40
3.2 Combining the five forces model with generic strategies 46
3.3 Porter's value chain 52
4.1 The transfer-pricing scenario 5 5
4.2 What companies actually use as transfer prices 66
xii

LIST OF GRAPHS
Graph Description
?.I Variable cost in total
2.2 Variable cost per unit
2.3 Fixed cost in total
2.4 Fixed cost per unit
Page

LIST OF EXAMPLES
Example Description
Behaviour of variable cost
Behaviour of fixed cost
A segmented income statement
A standard cost card for one loaf of bread
Vision statement of Woolwo~Ths
Mission statement of SABMiller
Defining the boundaries of the bread industy
Cost-based transfer prices
Lowest and highest acceptable transfer prices
Calculation of drivers' commission
Calculation of cost of raw materials per unit
Page
xiv

LIST OF DIAGRAMS
Diagram Description
2.1 Tv.0 iypes of costing systems
2.2 An overview of a standard costing system
Page

LIST OF CALCULATIONS
Calculation Description Page
6.1 Calculation of a predetermined traceable fixed production costs
rate 109
6.2 Calculation of a predetermined other vehicle operating cost rate 110
6 .3 Calculation of a predetermined other distribution cost rate 11 1

CHAPTER 1
INTRODUCTION
1.1 BACKGROUND
A loaf o f bread i s a consumable product and i s consumed by millions o f people on a daily
basis around the world. Bread constitutes the staple diet o f millions o f South Africans.
The bread industry in South Africa, as we know i t today, i s approximately fifteen years old.
Although the South African bread industry has certainly been in existence since the first
wheat kernel was milled, i t has undergone a total transformation since a decision was made to
deregulate the industry from 1 March 1991.
The Longman Business English Dictional?/ (2001. 4:127) states the following definition for
deregulate: "to remove or reduce the number o f government controls on a particular business
activity, done to make companies work more effectively and to increase competition". I n
contrast the Longman English Dictionary's (2001, 4:236) definition for regulated industry
is: "an industrj that is closely controlled by the government".
A deregulated industn i s therefore not controlled b) government regulation and organisations
within that industrq are free to set their own selling prices o f their products or services.
1.1.1 Before deregulation
Until 1 March 1991 the bread industry in South Africa was regulated,
According to the General Manager o f Bread Factory A, the system functioned as follows
during regulation:
Production o f "government bread" was restricted to only six licensed bakers nationally
(Anon, 1990:78).
The government fixed the price per loaf o f bread and on 28 February 1991 the set price
for brown bread was R I .03 and R l . I 8 for white bread (Brand, 1991 :2: Anon, 1991x2).
The government applied a subsidy system where a subsidy o f 3.3 cents on white bread
and 7.9 cents on brown bread was applied.

A quota system was used whereby bakeries were only allowed to supply bread in
specified regions. Monthly regional meetings were held between bakeries to reconcile
supplied volumes for the month. If a bakery sold more than its quota, that bakery would
buy from the other bakeries in order to correct the "quota volumes". As a result of the
regulation, bakery managers did not have to spend time and energy on marketing and
customer service. Not only were such managers certain about their market, hut they also
sold a fixed amount of bread each month. The bakery manager focused mainly on the
reduction of production costs and spent most of his 1 her time on operations.
Only a limited product range could be produced profitably due to the subsidy system,
meaning standard white, brown and whole wheat bread.
The standard weight of bread was set throughout the country.
1.1.2 After deregulation
Since 1 March 1991 the bread industn has heell deregulated and the subsidy of 3.3 cents on
white bread and 7.9 cents on br0v.n bread tenninated. This relieved the government paying
bread subsidies amounting to more than R250 million annually (Anon, 1990:78).
Mr James Dippenaar, executive director of the Chamber of Baking summarised the new
regime as follows (Anon, I991 b: 1 1):
There would only be three broad classifications of bread that bakeries could produce by
following any recipe. namely white bread, brown bread and whole wheat bread.
General sales tax (GST) would not be levied on any of these three categories.
There would he NO restriction of entry to the bread industry and anyone could apply to
the Wheat Board for a license.
There would be no price control on any bread.
Bakers of bread would still have to adhere to standard weight requirements for bread
As a result of all these changes due to deregulation, bakeries could set their own selling prices
while taking into account their production costs. distribution costs and naturally the demand
for their product inside their market environment.

1.1.3 Changing rompetitors' environment
The deregulation of the bread industry lead to a considerable number of new entrants to the
market (Anon, 1991c:14). According to Premier Foods' Executive Director. Willem de Kok.
hundreds of new bakery licenses were issued since deregulation on 1 March 1991 (Anon.
1991d: 79). Mr Peter Cownie, executive director of the South African Chamber of Baking,
confirmed that the number of employers in the bread industry has increased dramatically
since 1991. He also emphasised that it \\as a free market and therefore highly competitive
where everyone would have to fight to keep there market share intact (Moos, 2003:3).
The larger bread factories were continually losing market share to smaller competitors.
Since deregulation, the large bakeries' market share had dropped from 60% to 40%. One of
the reasons was that the smaller bakeries were not inspected, and were therefore able to bake
a loaf of bread weighing between 680 - 700g instead of the standard weight of 800g (Anon,
1098:38). A survey was conducted b!, thc mctrolopy department of the South African Bureau
of Standards (SABS). They inspected and tested 577 batches of bread of which 135 (23%)
were found to be lighter than the required weight (Tshetlo, 2006:9; Naidu, 2006:2;
Makgalenmele. 2006:l). This meant that the smaller competitors' cost of production was
lower, thus leading to a more competitive price. The smaller competitors were also more
adaptable because they had managed to swing the huge fixed cost component, which was a
characteristic of the bread industly, around to a largely variable cost. In an industry that was
extremely volume-sensitive, this would only constitute significant problems for the larger
bakeries (Hughson, 1992:35).
1.1.4 Distribution of bread
Before deregulation most of the bread that was produced was distributed through cafes and
medium-sized shops. Today large chain stores and supermarkets play a much larger role in
the distribution of bread. The most significant change in the distribution channel is
unmistakably the role of spaza shops and hawkers selling bread (General Manager: Bread
Factory A, 2006). This infonnal sector supplies bread and other products directly to the
consumer and is normally located very favourably for the market they serve. Such a spaza
shop is operated from a garage or a shack nest to the road. The result of this is that it has a
huge impact on the method of distribution of bread. I n the past a distributor would stop at for
example thirty customers and deliber a thousand loaves, whereas today he has to stop at sixty
customers in order to deliver the same amount of bread. This requires very significant
additional time and costs.

Tjaart van der Walt, executive director of Sunbake, highlighted that since deregulation, long
distances had to be travelled by bakeries to deliver a relatively low-value product in order to
maintain volumes. This was caused by the removal of the quota system. Distribution costs
have therefore escalated (Hughson, 1992:35).
1.1.5 Case study: Introduction to Bread Factory A's environment
Bread Factory A is located in the countryside. It produces roughly 16 million loaves of bread
annually. Bread Factory A's approximately 3 100 customers are spread over a radius of some
120 kilometres from where the factory is located. This area is divided into 42 routes which
are being serviced by 47 delivery trucks. These trucks are the factory's own assets, but the
maintenance of the delivery trucks is outsourced.
Bread Factory A's distribution costs consist ofthe following:
A fixed rate per kilometre travelled is paid to the outsourced party - this used to include
diesel and oil plus general maintenance of the delivery trucks but has changed since
September 2006. Currently Bread Factory A's responsibility includes the diesel that the
delive? trucks consumes and the maintenance of tyres;
the driver of the delivery truck receives a \ariable amount (cents per loaf) based on the
number of loaves delivered; and
the delivery truck assistant receives a fixed amount per day.
Distribution costs formed 52% of the controllable expenses of Bread Factory A for the last
financial year and 19% compared to total sales income. It is therefore essential that the
distribution costs be controlled as tightly as possible.
The main roads in the area are tarred but access to many of the smaller villages is still via dirt
roads. They become increasingly difficult to traverse in wet weather.
1.1.5.1 Management information for decision-making
Currently Bread Factory A calculates a monetary contribution per route in order to determine
a route's profitability. The total of the above-mentioned expenses plus the production cost of
the delivered route is deducted from the income from the sale of the delivered bread for that
specific route. Based on this formula. there are alreadb some routes making a loss.

With the recent steady increase in the diesel price. however these losses will increase and
other marginal routes will possibly start suffering losses too. A monthly analysis of the
profitability per route is therefore very necessary, as well as formulating alternative plans for
the marginal routes without sacrificing customers in the process.
1.1.5.2 Transfer pricing determination
Bread Factory A purchases flour from Miller A. Miller A and Bread Factory A are both
subsidiaries of the same holding company. Bread Factory A is forced to purchase flour from
Miller A. The question has to be raised whether the determination of the transfer price is to
the advantage of the holding company in its entirety.
1.2 PROBLEM STATEMENT
Against this background of shrinking market share and increased competition combined
with a changing distribution channel, we can assume that effective and efficient cost
management will play a crucial role in the continuing economic existence of the larger bread
factories.
Since deregulation was implemented in 1991. the cost management of production costs has
generally been optimised. The sharp increase in the crude oil price and the subsequent rise of
the diesel price has, however, dramatically affected the distribution costs of bread. On a daily
basis Bread Factory A's delivery trucks travel a cumulative distance of approximately 10 000
km spread over 42 routes. Distribution cost therefore directly influences profitability and will
have to be managed effectively and efficiently.
Distribution costs as such can be divided into controllable and non-controllable costs. As
management has no control over non-controllable costs, focus must be placed on controllable
costs. The current distribution costs include cost pahable to the outsourced party for
maintenance of the delivery vehicles, driver's variable costs. the van assistant's fixed daily
wage. etc. The relationship with the outsourced p a w has to be nurtured in order to ensure
that the outsourced party does not run into financial difficulty due to increased costs. Should
this happen. a new snpplier will have to be found. which nil1 lead to dire consequences
logistically and financially.
A bakery's continued existence depends heavily on sales volumes. Sales volumes are crucial
to cover the fixed operational costs of a factory. This means that customers that are serviced
via an unprofitable delivery route cannot be easily discarded.
1.3 RESEARCH OBJECTIVES
This research will embrace general and specific objectives.
1.3.1 General objective
The general objective of this study is to determine whether general management accounting
principles were applied in Bread Factory A with specific reference to the financial viability of
the delivery routes.
1.3.2 Specilic objectives
The specific objectives of this study are as follows:
To conceptualise cost terms and concepts from the literature by referring to cost
assignment, cost behaviour and costing systems.
To conceptualise competitive advantage from the literature.
To conceptualise transfer price determination from the literature.
To determine the accurate behaviour, traceability and relevancy of costs used in the
calculation of the profitability of delivery routes in Bread Factory A.
To calculate the profitability of the delivery routes at Bread Factory A.
To determine whether Bread Factory A follows the guidelines provided by the
literature on competitive advantage.
To determine whether the most beneficial transfer price determination method is
used i n Bread Factory A.
To formulate recommendations regarding the method used to measure the
profitability of delivery routes at Bread Factory A.
To formulate recommendations regarding Bread Factory A's approach to achieve
competitive advantage.
To formulate recommendations regarding the determination of transfer prices of
flour from Miller A to Bread Factory A.

1.4 HYPOTHESIS
The accurate measurement and allocation of distribution costs and the optimisation of
delivery routes would lead to improved profitability and proper cost management.
Optimisation of delivery routes uould mean that sales volumes can be maintained and
possibly increased.
1.5 RESEARCH METHOD
The research consists of the following:
1.5.1 Phase 1: Literature study
The literature study will fbcus on as much relevant literature as possible as well as available
information. This includes legislation regarding the deregulation of the bread industry. It
also includes reviewing journal and magazine articles, books. newspaper articles. other
publications as well as previous dissertations and mini-dissertations.
1.5.2 Phase 2: Empirical study
The proposed methodology for the empirical study is discussed below:
1.5.2.1 Research design
A research design is defined by Yin (2003:20) as "a Iog~colplirrr,for gettingfiom here to
there, where here may be defined as the initial set of questions to be answered, and rhere is
some set of conclusions (answers) about these questions".
The purpose of a research design is to assist in avoiding a situation where the evidence of
the research does not address the initial research questions (Yin, 2003:20).
A case study is used as approach for the research. A case study is an empirical enquiry that
investigates a particular programme or event in depth for a period of time (Yin, 2003:13;
Leedy & Ormrod. 2005:135: Babbie, 2004:293). A case study is a valuable vehicle for
communicating applied industry-related research data (Lyons. 2005:702). Leedy and Ormrod

(2005:135) state that a case study may be especially suitable where you \-.ant to obtain more
information about a little known or poorly understood situation.
The overall case study research can be classified as qualitative research and quantitative
research. Case studies can be performed by using qualitative and quantitative evidence
(Yin, 198158). Leedy and Ormrod (2005:105) believe that research studies are enhanced by
combining both quantitative and qualitative methods. This statement is confirmed by Karami
er al. (2006:48) who indicates that research methodology in business and management
requires the right balance between qualitative and quantitative methods.
A qualitathe research approach has the following characteristics (Leedy & Ormrod,
2005: 133):
Focus is placed on the phenomena that occur in their natural setting ("real wor ld)
It involves studying those phenomena in all their complexi 5.
The interviewing process is a qualitative approach that is exploratory in nature (Leedy &
Ormrod, 2005:95).
The examination and analysis of the financial data for Bread Factory A is quantitative
research. According to Leedq and Ormrod (2005:94). quantitative research is perfonlled to
obtain answers to questions about relationships between measured variables, and the purpose
thereof is to explain, predict and control phenomena.
In table 1.1 the difference between quantitative and qualitative research approaches is
tabulated.

Table 1.1: Distinguishing characteristics of quantitative and qualitative approaches
Question What is the purpose of the research?
What is the nature of the research process?
What is the data like, and how is it collected?
How is data analyzed to determine its meaning?
How are the findings communicated?
Known variables Unknown variables Established guidelines Flexible guidelines
Quantitative To explain and predict To confirm and validate To test theory
Focused
Predetermined methods / . Emergent methods
Qualitative To describe and explain To explore and interpret To build theory . Holistic
Somewhat context-free I Context bound Detached view I . Personal view
.Numeric data I . Textual andlor image-based data
Formal voice, scientific style I . Personal voice, literary style
Representative, large sample Standardised instruments
. Statistical analysis Stress on objectivity Deductive reasoning
Numbers Statistics, aggregated data
Source: (Leedy & Ormrod, 2005:96)
- Informative, small sample Loosely structured or
non-standardised observations and interviews
Search for themes and categories
Acknowledgement that analysis is subjective and potentially biased
Inductive reasoning
Words Narratives, individual quotes
1.5.2.2 Composition of the study field
The study field consists of an affiliated Bread factory, hereafter named Bread Factory A,
which manufactures and distributes bread.
The period under review will be the financial year ended during 2006.
1.5.2.3 Methods and techniques for data analysis
The methods that will be used to conduct this study include:
Interviews conducted with the General Manager and the Financial Manager of Bread
Factory A in order to obtain the relevant information.

Examination and analysis o f the financial data for Bread Factory A for the period under
review. The income and expenses relating to distribution routes w i l l be analysed in order
to determine the profitability o f distribution routes. The purchase cost o f flour w i l l be
obtained in order to determine the transfer prices o f flour purchased from Mil ler A.
A comparison wi l l be drawn between the transfer price o f flour purchased from Mil ler A
\\ith similar cotnpetitor flour prices.
1.5.2.1 Reliability and validity
A research design should represent a logical set o f statements. Design tests have been
developed to establish the quality o f any empirical research. These four tests are (Yin,
2003:33; Riege, 2003:80):
Construct validity;
internal validity:
external validity; and
reliability.
The results of the four tests can be summarised as follows:
The researcher i s unable to directly manipulate the tinancial data o f Bread Factory A.
The formulas and classifications that are used. are described in the literature and have
been developed by a panel o f experts in the Management Accounting field. This ensures
the validity o f the formulas and classifications.
When referring to reliability. the assutnption i s made that the financial records provided
by Bread Factory A are accurate in their application of accepted accounting practice.
1.5.2.5 Report and discussion of results
The results o f the empirical investigation wi l l be tabulated, discussed and related to the
literature.

1.5.2.6 Conclusions and recommendations
Recommendations regarding the method used to measure distribution costs in Bread Factory
A and recommendations regarding the determination of transfer prices of flour from Miller A
to Bread Factory A, will be made based on the empirical investigation.
1.6 SUMMARY
In this chapter an introduction and background was given on the bread industry. The problem
statement and the motivation behind the study were given. The research objectives and the
research method were discussed.
The study is structured as follows:
In chapters t ~ o to four the literature will be reLiewed. Chapter two will provide a theoretical
background on cost terminolog) and concepts, more specifically regarding cost assignment,
cost behaviour and costing systems.
Chapter three will deal with the literature review of measuring and gaining competitive
advantage. It will then be applied specifically to the bread industry and the case study.
Chapter four will review the methods of determining transfer prices. The chapter will review
the various methods concluding with the most appropriate method applicable to the case study
under review.
Chapter five will describe and explain the research methodology that will be used in this
study. The chapter will address issues such as the study population, the interview process and
the examination of the financial records.
In chapter sir the results will be analysed and discussed, while chapter seven will conclude
with recommendations based on the research conducted.

CHAPTER 2
COST ASSIGNMENT, COST BEHAVIOUR AND COSTING SYSTEMS
2.1 INTRODUCTION
Competition in the bread industry has increased dramatically since the implementation of
deregulation in 1991. According to Mr. Peter Cownie, executive director of the Chamber of
Baking, the new entrants into the baking industry have increased sharply since deregulation.
Bakeries are competing to supply bread at a low price (Moos, 2003:3). Effective cost
management in a bread factory is therefore crucial. The lower the cost. the lower the bread
price can be set by the bakery.
According to the Longman Business English Dictionary (2001, 4:102), cost is defined as "the
amount of money that >ou ha\e to pay in order to buy. do or produce something. Costs
(plural), the money that a business or an individual must regularly spend".
The Oxford English Dictionary (1978, 2:1034) defines cost as "that which must be given or
surrendered in order to acquire. produce, accomplish, or maintain something: the price paid
for a thing".
The term cost is defined by Drury (2004:29) as a reflection of a monetary measure of the
resources sacrificed or forgone in order to achieve a specific objective, for example, to
acquire goods or a service.
Cost is therefore considered and evaluated in monetary value. In return for the money spent,
you receive goods or services.
Cost management is the focus of management's attention on cost reduction and continuous
improvement and change, rather then containing costs (Drury, 2004:943). Cost
management is used to describe the approaches and activities that managers follow and
undertake in order to increase the value for customers while at the same time lowering costs
of products and services (Horngren el al.. 2006:3).
Cost management therefore focuses on improving operations through reducing costs and
improving quality.

It is considered important to first explain cost terminology and cost concepts used in this
study.
2.2 COST ASSIGNMENT
Costs are typically accounted for by a costing system in hvo basic smges (Horngren el ul.,
2006:27; Dmry, 2004:30):
Cost accumulation followed by
cost assignment.
Cost accumulation in an organisation is the collection of cost data by an accounting system
classi&ing the costs into categories such as labour, materials and overhead costs (Drury,
2004:30; Horngren et 01.. 2006:27).
Cost assignment on the other hand involves (Horngren er ul., 2006:27):
Allocating costs having a direct relationship with a cost object: and
Allocating costs that have an indirect relationship with a cost object.
A cost object can be defined as anything for which separate cost data (measurement) is
desired (Garrison er 01.. 2006:50; Drury. 2004:30). To assign costs to cost objects. costs can
be classified either as direct or indirect costs.
2.2.1 Direct and indirect costs
Direct cost is a cost that is directly related to a particular cost object and can be allocated to
that cost object in a cost-effective way (Horngren er ul., 2006:27). Drury (2004:30) defines
direct costs as "those costs that can be specifically and exclusively identified with a particular
cost object."
In a bakery, examples of directs costs are flour, yeast, salt, etc.
lndirect costs on the other hand are related to a particular cost object but cannot be traced to
that cost object in a cost-effective nay (Horngren rr 01.. 2006:27). Drury (2004:30) defines
indirect costs as "cannot be identified specifically and exclusively with a given cost object".

An example of an indirect cost in a bakery is the salary of the General Manager. It is not
specifically and exclusireiy related to the production of white bread, but the cost was incurred
to the advantage of the bakery in its entirety.
The necessity for classifying and assigning costs as direct or indirect was traditionally
required in order to value inventory and measure profits (Drury, 2004:3 I). Managers want to
assign costs accurately to products in order to measure the profitability of different
products. If products are costed incorrectly, managers might promote products that are not
profitable and vice i2ersa (Horngren et al.. 2006:28).
2.2.2 Cost assignment of indirect costs
Indirect costs are sometimes referred to as common costs because they cannot be directly
traced to the units produced or to cost objects (Zimmerman. 2006:343; Garrison ei al.,
2006:51: Hilton er ul.. 2006.56). The cost assignment (allocation) of indirect costs are
necessary for purposes of valuing inventory, for planning and monitoring cost activities, and
for various strategic decision making (Martin, s.a.: 1).
Cost assignment requires three steps, namely (Zimmerman, 2006:343):
Defining the cost objects;
accumulating the common costs (indirect costs) to be assigned to the cost objects; and
choosing a method for allocating the accumulated indirect costs to the cost objects.
Steps I and 2 should not be too difficult. Step 3 requires the identification of an allocation
base. An allocation base is a measure such as units of production. machine hours or labour
hours, used to assign costs to cost objects (Garrison et a/., 2006:93; Zimmerman. 2006:343).
Once an allocation base is identified the indirect costs, usually manufacturing overheads. can
be allocated to cost objects.
2.3 COST BEHAVIOUR
Cost behaviour refers to how a cost will react or respond to different levels of activih
(Garrison ei 01.. 2006:48). "A knowledge of how costs and revenue will vary with different
levels of activity (or volume) is essential for decision making" as quoted by Drury (2004:32).

Activity levels can be measured in terms of production bolumes (loaves of bread baked), sales
volumes (loaves of bread sold), machine hours used, etc. Decisions that can be made based
on different levels of activity include (Drury, 2004:33):
What should the planned level of production be for the next month?
Should we reduce the selling price to sell more units? What would the effect be on
profitability?
For both these decisions it is necessary for management to determine "applicable cost"
Cost can be classified as variable. fixed, semi-variable (mixed) or semi-fixed (step fixed).
2.3.1 Variable costs
Variable costs change ill direct proportion to the changes in the related level of activity or
volume (Drury, 2004:34; Horngren et ol., 2006:30: Garrison el at., 2006:48). If the activity
level doubles, the total variable costs will also double. We can therefore derive that total
variable cost is linear (as indicated in graph 2.1) and unit variable cost is constant (Drury,
2004:34).
Example 2.1: Behaviour of variable cost
A bakery produces 1 000 loaves of bread. Production is increased to 2 000 loaves and then to
3 000 loaves.
Activity level
I000 loaves
[ 3000 loaves 1 R 2 I R 6 000
I I
Source: (Researcher)
Variable cost
2000 loaves
Per unit
R 2
R 2 I R 4 000
Total
R 2 000

Graph 2.1: Variable cost in total
7000g6000~ 5000(,)
~ 4000J:JC<I
"I: 3000C<I
~ 2000~~ 1000
o
o 500 1000 1500 2000 2500 3000 3500
Activity level
Source: (Drury, 2004:35 Adapted)
Variable cost per unit is constant as indicated in graph 2.2.
Graph 2.2: Variable cost per unit
Source: (Drwy, 2004:35 Adapted)
2.3.2 Fixed costs
Fixed costs remain constant (unchanged) in total regardless of wide changes in the level of
activity or volume for a given period of time (Drwy, 2004:34; Homgren et al., 2006:30;
Garrison et al., 2006:49). Total fixed costs are constant for all levels of activity while unit
fixed costs decrease proportionally with an increased level of activity (Drury, 2004:34).
16
- - - - - - - - - - - - - - - - --- - --- - - - - -- - -
, , 5.00ej,
"2 4.00=ac.. 3.00-'"0
2.00:E. 1.00
0.00 I I
0 500 1000 1500 2000 2500 3000 3500
Activity level

Example 2.2: Behaviour of fixed cost
A bakery produces 1 000 loaves of bread. Production is increased to 2 000 loaves and then to
3 000 loaves.
Source: (Researcher)
Total fixed cost are constant and remain unchanged as indicated in graph 2.3.
Graph 2.3: Fixed cost in total
6000
~ 5000
~4ooo-c
..:: 3000'"ou 2000""0Q)
~ 1000
o I I I
o 500 1000 1500 2000 2500 3000 3500
Activity level
Source: (Drury, 2004:35 Adapted)
Fixed cost per unit decrease proportionally when the activity level increases.
17
Vaste koste
Aktiwiteitsvlakke Per eenheid Totaal
1 000 brode R 5.00 R 5,000
2 000 brode R 2.50 R 5,000
3 000 brode R 1.67 R 5,000

Graph 2.4: Fixed cost per unit
6.00
g 5.00....§ 4.00...Q)
~ 3.00eno~ 2.00
Q)><
~ 1.00
0.00
o 500 1000 1500 2000 2500 3000 3500
Activity level
Source: (Drury, 2004:35 Adapted)
2.3.3 Semi-variable costs (mixed costs)
Semi-variable costs, also known as mixed costs, are costs that include both a fIXedelement
and a variable element (Drury, 2004:37; Vigario, 2005:20; Garrison et al., 2006:194).
An example of a mixed cost can be rent. The monthly rent is, say, RIO 000 plus 10% of the
gross sales revenue (Vigario, 2005:20).
2.3.4 Semi-fixed costs (step fIXedcosts)
Within a given period of time, costs are fixed within specified activity levels, but it eventually
increase or decrease by a constant amount at various critical activity levels (Drury, 2004:36;
Vigario, 2005:20; Garrison et al., 2006:187-188).
An example of a semi-fixed cost is the leasing cost of a machine where one machine can only
manufacture 1 000 units. If production then increases to 2 800 units, three machines are
required. The leasing cost of the machines will then be three times the fixed leasing cost of
one machine (Vigario, 2005:20).
18
- - - - - - -

2.3.5 Total cost and unit costs
In the graphs relating to variable costs and fixed costs (graphs 2.1, 2.2, 2.3, 2.4), we compared
the cost behaviour between total cost and per unit costs. Generally management should
think and make decisions in terms of total costs rather than unit costs (Homgren el al.,
2006:34). In the bread industry, however, calculating a unit cost (cost per loaf) is essential.
According to Homgren et al. (2006:35), a unit cost, also called an average cost, is calculated
by dividing some amount of total costs by the related number of units. Referring to the bread
industry, the related units would be the number of loaves produced. It is essential for
decision-making to know the manufacturing costs per loaf.
2.3.6 Manufacturing costs
In a n~anufacturinp organisation. products are frequently the cost object (Drury. 2004:3 1 ). I n
the case of a bread factory. a loaf of bread is the cost object. Most manufacturing
organisations di\ide the manufacturing costs into three broad categories, namely direct
materials, direct labour and manufacturing overheads or indirect manufacturing costs
(Garrison el a/ . . 2006:36; Horngren er al., 200637: Drury, 2004:31). All direct costs (direct
materials and direct labour) are referred to as prime costs (Horngren et al., 2006:37; Drury,
2004:31).
The manufacturing costs in Bread Factory A are classified in the following categories:
Flour
Other ingredients
Wrapping
2.3.7 Controllable and uncontrollable costs
It is important to differentiate between costs that management can control and for which they
should be held accountable and costs that they have no control over and for which they
cannot be held accountable (Drury, 2004:656: Garrison et al.. 2006:379).
A controllable cost as defined by Homgren et al. (2006: 198) "is any cost that is primarily
subject to the influence of a given responsibilin centre vlanager for a given period" while

Vigario (2005:20) refers to a controllable cost as "costs that a person has a choice in the
outcome".
Responsibility accounting is the various concepts and tools used to measure the
performance of a responsibility centre that a manager is accountable for (Homgren et a/.,
2006:379; Hilton et al., 2006:745; Garrison et a/., 2006:379).
A responsibility centre is a unit of an organisation where an individual manager has control
over, and is accountable for the unit's performance. The different types of responsibility
centres are (Horngren et a/., 2006:197; Drury, 2004:653; Garrison et a/., 2006:541; Hilton et
ul., 2006:746):
s Cost centres: The manager has control over and is held accountable for costs only.
Revenue centres: The manager has control over and is held accountable for the revenue
attributed to the unit.
Profit centres: The manager has control over and is held accountable for both costs and
revenues.
Investment centres: The manager is held responsible for revenues and costs, and has the
responsibility and authority to make decisions about working capital and capital
investments.
It is therefore crucial to differentiate behveen controllable and uncontrollable costs
because it affects the measurement of a manager's performance.
According to Drury (2004:656), Merchant (1998) identitied three types of uncontrollable
factors namely:
Economic and competitive factors;
acts of nature; and
interdependencies.
In Bread Factory A there are uncontrollable costs such as the cost of diesel. The diesel price
is partly regulated by the government. The cost of diesel used to be included as part of a
fixed fee paid to an outsourced party responsible for the maintenance of the delivery vehicles,
but since September 2006 Bread Factory A is now responsible for paying the diesel consumed
by the delivery vehicles.

2.3.8 Relevant and irrelevant cost
Relevant costs are expected future costs that will change as a direct consequence of the
decision under review (Vigario, 2005:360; Dmry, 2004:37; Horngren e ta l . , 2006:380). It is
important to note that only relevant costs should be considered during decision making
(Vigario. 2005:360).
Irrelevant costs are costs that will not be affected by the decision under review (Drury,
2004:37). Vigario (2005:360) gives examples of costs that are not relevant:
Past sunk costs, or money already spent;
0 future spending already committed by separate decisions;
costs which are not of a cash nature, e.g. depreciation; and
absorbed overheads. (Only cash overheads incurred are relevant to a decision)
2.4 CONTRIBUTION THEORY
Costs are separated into fixed and variable elements. Once costs can be classified according
to their behaviour, the information can be used to make improved decisions.
Sales volumes are not constant, they change daily. When these sales volumes change, the
only numbers that change in direct correlation are total revenues and total variable costs
(refer graph 2.1, page 16) (Horngren et 01.. 2006:62). The amount remaining when total
variable cost is deducted from total revenues is called the contribution margin (Horngren et
id.. 2006:62; Hilton et a / . , 2006:61; Edmonds et a/ . , 2006355: Garrison et al., 2006:207).
The selling price per unit and the variable cost per unit are assumed to be constant (refer
graph 2.2, page 16), therefore the contribution margin per unit can also be assumed to be
constant (Dmry, 2004:271). Therefore, as the sales volume increases, the total contribution
margin increases, while the opposite occurs when the sales volume decreases. The
contribution margin contributes towards the recovering of fixed costs and thereafter provides
the organisation with profits (Horngren et al., 2006:63: Edmonds et al., 2006:55: Garrison et
a/. , 2006:207).

The contribution margin approach is only used for internal reporting purposes. Generally
Accepted Accounting Practice (GAAP) prohibits the use of the contribution approach for
external reporting purposes (Edmonds et al., 2006:55; Garrison et al., 2006:207). The
contribution approach enables managers to organise data pertinent to all kinds of special
decisions such as product-line analysis, pricing and the use of scarce resources (Garrison et
al., 2006:207). Bread Factory A uses the contribution margin or contribution loss on
distribution routes in their decision-making process. The calculation of the delivery route
profitability can be classified as segment reporting.
2.4.1 Segment reporting
A segment is a part or an activity of an organisation that earns revenues and incurs expenses.
Managers require information about these revenues and expenses (Garrison et a/., 2006:543;
Sanders et a/., 1999:36; Seal et a/., 2006:649). Examples of segments are divisions of a
company. sales territories. individual customers and product lines (Garrison et a/.. 2006:543)
The objective of segmental reporting is to provide information about the different types of
business products and services the organisation produces and the different economic
environments in which it operates (Quiree & Yeoh; 2006:64; Rushinek & Rushinek, 1994:s).
Organisations also require information about the profitability of a segment of the business
(Hansen & Mowen, 2003:867; Garrison et al., 2006543; Seal rt a/.. 2006:650). The
information on segment reporting is used in management decision making (Hansen &
Mowen, 2003:867).
Segment reporting is acquired through the construction of a segmented income statement
(Garrison et a/., 2006:543).
When a segment is evaluated, traditional performance measures such as return on investment
(ROI), residual income (Fd) and econonlic value added (EVA) can be calculated to evaluate
the segment's performance (Garrison er d., 2006556; Drury, 2004:845-846; Hilton el a/.,
2006:755-761). Bread Factory A does riot have a balance sheet. All the assets and liabilities
are reflected in the holding company's financial statements. These traditional performance
measures can therefore not be calculated.
For purposes of accurately calculating and recording the deliverq. route profitability in Bread
Factory A. it is necessary to construct a segmented income statement. The delivery routes in
Bread Factory A will be treated as segments.

2.4.1.1 Segmented income statement
When preparing a segmented income statement, the variable costs (paragraph 2.3.1, page 15)
are deducted from the sales to determine the contribution margin (paragraph 2.4, page 21)
for the segment. The information provided by the contribution margin enables management
to make decisions regarding the most effective uses of the existing capacity (Garrison et al.,
2006546; Seal el a/., 2006:655).
The next step is to deduct the fixed costs (paragraph 2.3.2, page 16) from the contribution
margin. Fixed costs are divided into traceable and common fixed costs (Anon, s.a.:l;
Garrison et a/. , 2006546; Seal el a/., 2006:655).
Traceable fixed costs of a segment occur due to the existence of the segment. If a segment is
discontinued, the fixed costs would no longer exist. Traceable fixed costs are charged to the
sqmented income statement (Seal e/ 01.. 2006:655: Garrison ?t al.. 2006548: Anon. s.a.:l).
An example of a traceable fixed cost in Bread Factory A is the fixed wages of the delivery
vehicle van assistant. The van assistant receives a fixed amount per day when he or she
accompanies a driver on a delivery route (paragraph 6.2.6.2. page 91).
Common fixed costs cannot be traced directly to the segment and are fixed costs incurred to
support the operations of more than one segment in an organisation. If a segment closes, the
fixed costs will still have to be incurred (Seal et al., 2006:655; Garrison e/ a/., 2006548;
Anon, s.a.:l). An example of a common fixed cost is the salaries of the repairs and
maintenance staff in Bread Factory A. The staff receives a fixed salary per month to maintain
the production plant.
When differentiating between fixed costs, the distinguishing factor would be whether the
fixed costs would disappear when the segment closes. If the fixed costs would disappear, it is
a traceable fixed cost and should be allocated to the segment (Seal et al., 2006:658; Garrison
el al., 2006:550; Anon, s.a.:l).
The traceable fixed costs are deducted from the contribution margin to obtain the segment
margin. The segment margin represents the margin of the segment after it has covered all the
costs to operate the margin. If a segment cannot cover all its own costs, the segment should
probably not be retained. The segment margin should be used in decision making about
whether to close a segment (Seal el at.: 2006:658; Garrison el al._ 2006:550-551).

Common fixed costs are deducted from the segment margin to obtain the net operating
income of the organisation (Anon. s.a.:l).
An example of a segmented income statement is shown in example 2.3
Example 2.3: A segmented income statement
Books Inc. offers three books for sale namely a cookbook, a travel guide and a handy speller.
Each book sells for R10. The company's most recent monthly income statement is given
below:
Product line
company
Less: Expenses Printing costs Advertising General sales Salaries Equipment depreciation Sales commissions General administration
Total I Guide 1 Speller
Sales
Net operating income 30.000 100 17,500 12,400
Cookbook Travel
300,000 1 90.000 1 150,000 1 60,000
The following additional information is available about the company:
Handy
Printing costs and sales commissions are variable costs. all other costs are fixed. Sales
commissions are calculated at 10% of sales for any product.
The general sales cost above includes the salar) of the sales manager and other sales costs
that are not traceable to any specific product line.
The same equipment is used to produce all three books, therefore the depreciation on
equipment has been divided equally among the three product lines. An analysis has been
performed of the company's activities. This indicates that the equipment is used 30% of
the time to produce cookbooks. 50% to produce travel guides and 20% to produce handy
spellers.

. General administration cost relate to the administration of the company as a whole.
These costs have been allocated equally among the product lines.
All other costs are traceable to the three product lines as indicated in the income
statement above.
A segmented income statement is prepared based on the information provided:
Sales
Less: variable expenses
Printing cost Sales commissions
Total company
Contribution margin
Less: traceable fixed expenses
Advertising Salaries
Product line
Cookbook
Equipment depreciation*
Less: common fixed 1 60,000 / expenses
General sales General administration
Travel Guide
Segment margin
Net operating income 30.000
Handy Speller
9,000
90,000 1 19.800 1 39.000 1 31,200
* R9000 X 30%, 50% and 20%, respectively.
Source: (Garrison rt 01.. 2006584-585, Adapted)
2,700 4,500 1 1,800
2.5 COSTLNG SYSTEMS
The purpose of a managerial costing system is stated by Garrison er a/. (2006:88): "the
essential purpose of any managerial costing system should be to provide cost data to help
managers plan, control, direct and make decisions".
There are hvo basic costing systems that are commonly used by manufacturing organisations
to assign costs to products or services (Garrison et al., 2006:88: Drury, 1004:40; Horngren et
al., 2006:99):
Job-costing system.
Process-costing system.
2.5.1 Job-costing system
In this system, the cost object is a unit or batch of output of a product that is unique. The
product is called a job. The products Gobs) are heterogeneous. This system would typically
be found in industries that provide customised products or services (Garrison et al., 2006:89;
Drury, 2001:40; Horngren eta/ . , 2006:99).
Examples are airline meals prepared by LSG SkyChefs and engineering companies making
machines to meet individual customer specifications (Garrison et al., 2006:89; Drury,
2004:40; Horngren et al.. 2006:99).
A job-costing system would not be relevant at Bread Factory A because the product, bread.
is homogeneous and the products are not custornised to a customer's preference.
2.5.2 Process-costing system
A process-costing system relates to situations where the organisation produces masses of
identical or similar units of a product. There products are homogeneous. Products are
generally produced in the same manner and flow through the production process on a
continuous basis (Garrison et nl., 200639; Drury. 2004:40: Horngren et al., 2006:98).
Examples are bottling beverages at Coca-Cola and oil refining (Garrison et al., 2006:89;
Drury, 2004:40; Horngren et al., 2006:99).

Bread Factory A definitely would make use of a process-costing system. Bread is a
homogeneous product and flous through the production process on a continuous basis.
Diagram 2.1 illustrates the two types of costing systems. namely job-costing and process-
costing.
Diagram 2.1: Two types of costing systems
Distinct units of a product
Masses of identical or similar units or a
product
- Process-costing
system
- Job-costing system
Source: (Homgren er al., 2006:99)
C 3
2.5.3 Standard costing system
A standard costing system is a financial control system that enables management to analyse
in detail deviations (variances) from the budget. Future costs can then be controlled more
effectively (Drury, 2004:725; Vigario, 2005:261). Standard costs are the building blocks for
preparing the budget (Edmonds et a/., 2006:321).
Any control system should have three basic parts, according to Hilton el al. (2006:648).
namely:
A predetermined or standard performance;
a measure of actual performance: and
a comparison of standard and actual performance (variance analysis).
Firstly, it is wise for an organisation to prepare a budget (predetermined or standard
performance) as it provides the company with a goal and a map to work towards that goal
(Vigario 2005:262; Hilton et a/., 2006:648). It is therefore vital for an organisation to not
discard a budget (Vigario, 2005:262).
A standard can be defined as a benchmark or "norm" for measuring performance (Garrison
et a/., 2006:429; Edmonds et al.. 2006:321; Hilton er a/.. 2006:648). A standard represents

the amount that a cost or quantity should be based on in certain anticipated circumstances
(Edmonds et al.. 2006:320). The budget represents the numbers and benchmarks against
which an organisation measures their performance (Jehle, 1999:55).
Standard costs are predetermined costs. These standard costs should be attained under
efficient operating conditions. Standard costs are not the same as budgeted costs. A budget
is set for an entire activity, while a standard is the same information but only on a per unit
basis (Drury, 2004:726). Drury (2004:726) states that "a standard therefore provides cost
expectations per unit of activity and a budget provides the cost expectation for the total
activity".
Secondly, the actual costs incurred during the production process should be measured.
Thirdly, the variance between the budgeted cost (standard cost per unit) and actual cost is
compared. This variance is called a cost variance. Cost variances are analysed to obtain
information to control costs (Hilton et 01.. 2006:648). This process of analysing and
investigating reasons for variances and eliminating it is called management by exception
(Garrison et a/., 2006:429; Homgren et ul.. 2006:222).
Management by exception is a \ahable management tool. Through this process managers
only concentrate on areas not operating as expected, mstead of wasting their valuable time
on areas operating as expected (Homgren et al., 2006:222: Garrison et al., 2006:429:
Edmonds etal., 2006:321; Hilton et al., 2006:648-649).

Diagram 2.2: An overview of a standard costing system
Standard and actual costs compared and variances analysed
Standard cost of actual output recorded for each
responsibility centre
Variances investigated and corrective action taken
Actual costs traced to each responsibility centre
to reflect changes in standard usage andor prices
1
Source: (Dmry, 2004:728)
2.5.3.1 Setting standards
Standards should be set for each category of manufacturing costs, namely direct material,
direct labour and manufacturing overheads (paragraph 2.3.6. page 19). Standards can be
set using two methods: analysis of historical data and task analysis (Hilton et al..
1006:649). Historical data can be used to set cost standards, but the danger in using this
method is that the historical data will include past inefficiencies in the production operation
(Drury, 2004:729). When an organisation has considerable production experience, historical
data can be used as a reliable basis for predicting future costs (Hilton et al., 2006:649). If an
organisation produces a product for the first time, there will be no historical data available
and this method would not be applicable.
When using task analysis to determine standards, engineering studies are used to determine
these standards (Drury, 2004:729: Hilton er ol., 2006:649). Engineers who are intimately
familiar with the production process \ \ i l l determine exactly how much direct material would
be required and the way the machine? should be used in the production process. The result

of the engineering studies is standards for direct materials, direct labour and manufacturing
overheads.
Standards are set for quantity and price. The engineers and production supervisors typically
calculate and predict quantity standards while accountants, procurement and sales managers
predict price standards (Garrison er ul., 2006:429). These standards should be both
meaningful and attainable for a standard costing system to be successful (Vigario, 2005:264).
Example 2.4: A standard cost card for one loaf of bread
Qty standard
Direct material: Flour Other ingredients
Direct labour * 1 0.001 machine hour I R150 p 1 mh I R0.15 I I I
Price standard
Wrapping
Standard cost
500 g
20 g 30 cm / R2.00 p i rn I R0.60
* 1 machine hour baking time produces 1 000 loaves
I I I
Manufacturing overheads
Standard cost - 1 loaf
Source: (Researcher)
R5.00 p 1 kg R1O.OO p i kg
2.5.3.2 Ideal versus practical standards
R2.50 R0.20
0.001 machine hour
The question can now be asked whether standards should be attainable all the time. Should
standards be so difficult to attain that they become in effect the "impossible dream" (Garrison
et ul.. 2006:429: Hilton el ul., 2006:650; Vigario, 2005:264)? According to Hilton el 01.
(2006:650) ' the answers to these questions depend on the purpose for which standards are
used and the way standards affect behaviour".
R200 p 1 mh RO.20
R3.65

Ideal standards
Ideal standards refer to the "impossible dream". These standards can only be attained
under nearly perfect operating conditions. i.e. best circumstances. They do not make
allowance for machine breakdowns or other disruptions in production. The best quality
materials that can be obtained are used and most skilled and efficient employees are working
at a peak effort of 100% of the time (Dmry, 2004:733, Garrison el a/.. 2006:429; Hilton et a/.,
2006:650; Vigario, 2005:264). Managers argue about the motivational impact of using ideal
standards. Vigario (2005:264) is of the opinion that "such standards seldom represent a
target as they are seen as being impossible to achieve and so demotivate workers".
Practical lurroinahle) standards
Practical o r attainable standards are described as "tight but attainable" (Hilton et a/.,
2006:651; Garrison et a/.. 2006:431). Allowance is made for normal spoilage. machine
breakdowns and lost time. Using practical standards keep employees on their toes, but the
standards do not require miracles. It also produces the best norm that actual costs should he
compared with. Variances from practical standards indicate deviations from normal operating
conditions and require management's attention (Drury, 2004:733; Garrison et al., 2006:431;
Hilton et al., 2006:65 1; Vigario, 2005:264). Practical (attainable) standards are preferable for
purpo5es of planning and budgeting (Drury, 2004:733).
2.5.3.3 Benelits and costs of standard costing systems
The benefit of a standard costing system is that i t provides information that assists
management to control costs (Hilton el a/.. 2006:652; Edmonds et al., 2006:322). Standard
costing systems alert management about problem areas and it encourages proper planning. If
standard costing is established and maintained properly, it can boost morale and also motivate
employees (Edmonds eta/., 2006:322; Drury, 2004:733).
To implement and maintain cost standards are time-consuming and costly. To establish
standards is labour-intensive and expensive. These standards should also be updated
periodically to reflect changes in the cost structure of a product and to keep up with the
changing production environment (Hilton et a/., 2006:652).

2.5.3.4 Developing nianufacturing overhead standard rates
It is essential for planning and control to develop separate standard rates for variable and
fixed overhead costs (Drury, 2004:730). A predetermined rate. also referred to as a standard
rate, has to be calculated (Hilton et al., 2006:694; Garrison el nl., 2006:94; Drury, 2004:730).
The allocation of manufacturing overhead costs is accomplished by using an appropriate
allocation base (paragraph 2.2.2. page 14). Examples of allocation bases are direct labour
hours, machine hours or production volumes (Garrison et al., 2006:93; Horngren et al.,
2006:258; Drury, 2004:68).
The predetermined rate or standard rate is calculated as follows (Garrison el al.. 2006:94;
Horngren et al., 2006:258; Drury, 2004:71):
This rate is then calculated for the variable and fixed manufacturing overheads
The next step is to allocate the overhead costs to the cost objects. The formula for assigning
overheads to the cost objects is (Garrison et al., 2006:94; Horngren et al., 2006:258; Drury,
2004:71):
Overhead applied to cost object = (predetermined rate X amount of the allocation base
incurred by the cost object)
The difference between the standard overhead costs applied to the cost objects and the actual
manufacturing overheads is referred to as a variance (paragraph 2.5.3.5, page 32).
2.5.3.5 Variance analysis
The third part in an effective control system is to compare budget (standard) performance
with actual performance. This is called variance analysis.
A variance as defined by Longman Business English Dictionary (2001, 4:516) is " 1 . The
amount by which two or more things are different, and 2. ACCOUNTING - the difference
between what something actually costs and its usual or standard cost, or its cost when
calculated earlier".

Drury (2004:653) defines a variance as the difference between the standard and actual cost
while Horngren el a[ . (2006:222) state that a variance is the difference between the actual
amount and corresponding hudgeted amount.
A variance is therefore the difference between what an organisation predicted the cost will be
and what it actually is.
Standards are set for both price and quantity. Variances are also calculated based on price
and quantity (Garrison et al., 2006:429). Variance analysis is divided into material variances,
labour variances and manufacturing overhead variances.
Bread Factory A does not currently use variance analysis.
A~ralj~sis und rnvestigation of variances
The analysis of variances is crucial to determine the factors that cause the actual results to
differ from the predetermined standards or budgeted targets (Drury, 2004:658; Horngren el
al., 2006:236; Garrison el a/., 2006:430).
One of the reasons for an adverse yield variance could be attributed to the use of inferior
quality materials. In the bread industry it could be due to >east that has passed its expiry
date. Another reason for an adverse yield variance could be attributed to a failure to follow
standard procedures. An example in the steel industry could be the practice that was
followed for pouring molten metal. which was different from the most efficient practice that
was determined when the standard lield was calculated (Drury. 2004:780).
Bread Factory A analyses and investigates quantity direct material yield variances daily.
Referring to the example 2.4 (page 30): 20 loaves per 65 kg bag of flour. The reasons for the
deviations are investigated and problems are resolved in order to prevent discrepancies from
recurring. The result is that the efficiency of the production process improves daily.
2.5.3.6 Relevance of standard costing
The question whether the use of a standard costing system has become outdated has been
raised quite often recently. According to Sulainian el al. (2005:109) "many authors have
predicted that the shorter product life cycles, advanced manufacturing technologies.
decreasing emphasis on labour in the production process. and global competition may lead to

the demise of standard costing". Researchers conducting an exploratory study in Malaysia
came to the following conclusion: "Despite its various criticisms, the empirical findings
suggest that standard costing is still being used by a large majority of firms in Malaysia.
Thus. Malaysian companies (both Japanese and local) perceive that the basic principles of
standard costing remain sound" (Sulaiman et al., 2005:109).
The use of the traditional management accounting techniques such as standard costing and
variance analysis remains strong (Sulaiman et al., 2004:493).
The assumption can therefore be made that the use of a standard costing system has not
become outdated.
2.6 SUMMARY
The cost of a product or service in any organisation is necessary for planning, control and
decision-making purposes. The management and control of costs are therefore crucial in any
organisation, especially in an industry where competition is fierce and sales volumes are
limited.
This chapter focused on explaining cost terminology and cost concepts. First the assignment
of cost was discussed and secondly, cost behaviour. Knowledge of how cost would vary
when activity levels change, forms an important part of planning, control and decision
making. This information is used during budgeting, planning of production and sales and
optimising inventory levels.
The discussion of the contribution theory followed. The calculation of the contribution of
products is imperative for internal planning and decision-making purposes. Segment
reporting assists in the decision-making process because it provides information about
specific segments of an organisation. In reference to the case study of Bread Factory A. the
contribution theory is used in the calculation of profitability of delivery routes.
The chapter concluded with a discussion of costing systems. Costing systems provide data to
management in order to plan. control and make decisions. First job and process costing
systems were discussed, followed by standard costing systems combined with variance
analysis. Standard costing data provides the building blocks for budgeting, and variance
analysis highlights inefficient operations within a manufacturing e m ' wonment.

Thereby the first specific objective (objective 1.3.2.1, page 6), namely to conceptualise cost
terms and concepts from the literature by referring to cost assignment, cost behaviour and
costing systems, has been reached.

CHAPTER 3
COMPETITIVE ADVANTAGE
3.1 INTRODUCTION
The Longman Business English Dictionary (2001, 4:lO) defines competitive advantage as
"an advantage that makes a company more able to succeed in competing with others".
Botten and Sims (2004:204) give the definition for competitive advantage as using the
knowledge of competitive forces in order to place an organisation in a position where it exerts
more competitive forces on competitors than competitors exert on the organisation.
According to De Wit and Meyer (2005:lOl) competitive advantage can only be achieved by
creating superior value for buyers.
An organisation therefore has a competitive advantage if it succeeds in using their advantages
to outperform their competitors.
Silvi and Cuganesan (2006:310) have highlighted that "in recent years, significant effort has
been devoted to understanding and emphasizing the role of knowledge in conferring
competitive advantage". In order to gain competitive advantage, organisations have to
obtain as much knowledge as possible.
According to Kazan et al. (2006: 14) organisations have to use their resources effectively and
productively in order to compete in an increasingly globalised economy.
The bread industly is an extremely competitive industry and bakeries have to compete to
maintain their customer's business and to gain new business. Each organisation will
develop a strategy to deal with competitive rivals, to serve its particular base of customers and
to act on the changes that impact on the way it operates. This strategy should enable the
organisation to develop a competitive advantage that will lead to it competing effectively
(Pins & Lei, 2003:7). According to Chase et al. (2004:6) efficiency means "doing something
at the lowest possible cost" while "effectiveness means doing the right things to create the
most value for the company".

Distribution costs of bread have to be considered when setting the selling price of a loaf. The
distribution costs forn part of the manufacturing overhead costs. The lower the distribution
costs, the more profitable a bakery can be. Alternatively the selling price can be reduced,
which can lead to higher sales volumes. A lower selling price combined with high quality in
an extremely competitive industry, is a competitive advantage. Competitive advantage
starts with the formulation of an organisation's strategy.
3.2 STRATEGY FORMULATION
There are three ingredients that are critical to the success of a strategy. The strategy must
firstly be consistent with the conditions in the competitive environment. Secondly, the
strategy must place realistic requirements on an organisation's resources and finally, the
strategy must be carefully executed (Pearce & Robinson, 2003:123).
Strategy formulation in an organisation includes developing a mission, setting major
objectives, assessing the external and internal environments, and evaluating and selecting
strategy alternatives (Falshaw et al., 2006:l I). Strategy fornulation in an organisation
starts with the development of a vision statement and a mission statement. These
statements give a broad direction that an organisation should and will attempt to follow
(Botten & Sims, 2004:7: Ehlers & Lazenby, 20065).
A vision statement describes where an organisation ideally wants to be (Pitts & Lei,
2003:lO). It is a dream that focuses on a desirable future and often has a strong emotional
appeal (Ehlers & Lazenby, 2006:48; Pitts & Lei, 2003:lO). The example of the vision
statement of Woolworths will be used as an illustration:
Example 3.1: Vision statement of Woolworths
"We aspire to being the most trusted and respected African retail brand. We will achieve this
by nurturing and building lifetime relationships with our customers. These relationships will
be earned by us all making the Woollies difference."
Source: (Ehlers & Lazenby, 200658)
A mission statement on the other hand is more specific than a vision statement. It describes
the nature of the organisation's business, its customers, values and beliefs of the organisation

and also an element of sustainable competitive advantage (Botten & Sims, 2004:8; Ehlers &
Lazenby, 2006:51; Pitts & Lei, 2003:ll). The mission statement of SABMiller will be used
as an example:
Example 3.2: Mission statement of SABMiller
SABMiller plc is an international company committed to achieving sustained commercial
success, principally in beer and other beverages, but also with strategic investments in hotels
and gaming. We achieve this by meeting the aspirations of our customers through quality
products and services, by sharing fairly among all stakeholders the wealth and opportunities
generated, and by seeking business partners who share our values. Thereby, we fulfil our
goals of business growth and maximised long-term shareholder value, while behaving in a
socially responsible and progressive manner.
The company's values then follow.
Source: (Ehlers & Lazenby, 200651)
In order to formulate a strategy that is consistent with the conditions in the competitive
environment, an environmental analysis of the organisation is performed (Ehlers &
Lazenby, 20065). A number of external factors influence an organisation's choice of
direction and action. These factors, which constitute the external environment, can be
divided into three subcategories (Pearce & Robinson, 2003:57):
Factors in the industry environment.
0 Factors in the remote environment.
Factors in the operating environment
There are models that an organisation can use to analyse these environments. The industry
analysis can be performed by using Porter's five forces model, while the PEST(EL)
analysis is used to analyse the remote environment. The operating environment include
factors that are much more subject to the organisation's influence or control than the remote
environment (Pearce & Robinson, 200332).
The internal environment is evaluated by performing a SWOT analysis (corporate
appraisal) and value chain analysis (Botten & Sims, 2004:67).

The results of the environmental analysis will be used in setting strategic objectives
3.3 EXTERNAL ENVIRONMENT
The external environment analysis consists of an industry analysis, remote environment
analysis and operating environment analysis.
3.3.1 Industry analysis
The first stage in performing an industry analysis will be to define the industry. This is not
as easy as it seems. What does help is to consider a "flow of goods" or "supply chain"
diagram in order to define the boundaries of the industry (Anon. 2005a:33).
Example 3.3: Defining the boundaries of the bread industry
The process starts with farmers that grow wheat from the farmer the wheat goes to the miller
where the wheat becomes flour, the flour then progresses to the bakery where the flour
becomes bread and finally to the supermarket where it is sold. If the boundaries of the bread
industry is considered, it is important to differentiate between the factors that are relevant to
bakers but not to farmers. Another point to remember is that a vertically integrated company
operates in more than one industry.
Source: (Anon, 2005a:33)
Once the industrq is defined. the following models can be used to assist in identifying factors
that influence the industry in which the organisation operates.
3.3.1.1 Porter's Five Forces Model
Michael Porter from the Haward Business School, United States, identified five forces that
drive industry competition namely (Porter, 1998:3-4; Botten & Sims, 2004:28; Pearce &
Robinson., 2003:70):
Threat of new entrants
Rivalry among existing firnls

Threat of substitute products
Bargaining power of buyers
Bargaining power of suppliers.
Porter (l998:4) highlights that "in order for any organisation to gain competitive advantage
in an industry, it must find a position in the industry where it can hest defend itself against
these competitive forces or can influence them in its favour".
All five of these forces have to be evaluated in order to determine the impact of each force.
This will enable an organisation to determine the intensity of the industry forces influencing
the external environment.
The five forces driving industry competition are illustrated in Figure 3.1.
Figure 3.1: Forces driving industry competition
POTENTIAL ENTRANTS Threat of new entrants
I Rivalry among existing firms I
SUBSTITUTES Threat of substitute products I
INDUSTRY COMPETITORS
BUYERS Bargaining power
of buyers
SUPPLIERS Barga~n~ng power of
suppl~ers
Source: (Porter, 1998:4)
+
Each of the five forces will now be discussed in detail
10

Threat of new entrants
New entrants into the market threaten the market share of the existing competitors (Ehlers &
Lazenby, 2006:96: Pearce & Robinson, 2003:70). It can lead to a reduction in profit of the
existing competitors (Porter, 1998:56).
Many new entrants entered the bread industry since deregulation in 1991 (Anon. 1991c:14).
The larger bakeries' market share dropped from 60% to 40% since deregulation (Anon,
1998:38).
The threat of new entrants into an industry depends, however, on the barriers to entry that are
present combined with the reaction that a new entrant can expect from the existing
competitors (Porter, 1998:7). The major sources of barriers to entry include capital
requirements, economies of scale, switching costs from one supplier to another, access to
distribution channels. etc. (Porter. 1998:7-10: Ehlers & Lazenby. 2006:96-97: Pearce &
Robinson, 2003:7 1).
Rivalry among existing competitors
This is the strongest force of the five forces. Existmg competitors use tactics like price
competition, advertising battles and new product innovations to gain market share. All of
these tactics are used to differentiate your organisation's products from competitors and
create a competitive advantage (Ehlers & Lazenby, 2006:99-100: Porter, 1998:17: Pins &
Lei, 2003:56; Pearce & Robinson. 2003:75).
The bread industry has very intense rival^ among the competitors. Product innovations such
as foil packaging, vitamin-enriched bread and longer-life bread differentiate brand names
from one another.
0 Substitute products
Substitute products create an immediate threat to profitability (Ehlers & Lazenby,
2006:99; Pearce & Robinson, 2003:74). A substitute product as stated by Ehlers and Lazenby
(2006:99) is "if a product or senice from another industry can be used to perform similar
functions as a product or service in the industry".

Substitute products for bread can be "mealiepap", rice, potatoes, provita, etc. In the bread
industry, the threat of substitute products is a real one. The increase in bread prices may have
encouraged the lower income consumers to switch to imported staples such as rice, or to
lower value added products, such as flour (Watkinson & Makgetla, 2002:6).
Bargaining power of buyers
The buyers refer to the customers of the organisation. Buyers form a strong force because
they always demand lower prices at a higher quality. When buyers have a large amount of
bargaining power they can influence the price by forcing it down (Ehlers & Lazenby.
?006:98; Porter, 199824; Pearce & Robinson, 2003:73).
Buyers have bargaining power when (Ehlers & Lazenby, 2006:98-99; Pearce & Robinson.,
2003:73):
The seller sells large quantities of its products to a buyer. An example is: Pick 'n Pay
purchases a large quantity of bread from different bakeries, therefore Pick 'n Pay has a
large amount of bargaining power.
The sales of the product represent a large portion of the seller's revenue.
Customers do not incur costs when switching from one product to another. It costs
nothing for a customer to purchase a different brand of bread.
The industry's products are undifferentiated or standardised. An example in South Africa
is MTN and VodaConi. Both deliver the same standardised product. The customers have
a strong force of bargaining power to obtain the lowest prices.
In the bread industry, customers have a strong force of bargaining power and therefore have a
strong impact on the price of bread.
Bargaining power of suppliers
Suppliers are the organisations supplying the rax materials, machinery. etc. to participants in
the industry. The supply of labour also forms part of the supplier group (Ehlers & Lazenby,
2006:97; Porter, 1998:27).
Michael Porter's (1998:27) opinion is that "powerful suppliers can thereby squeeze
profitability out of an industry unable to recover cost increases in its own prices."

A supplier group is powerful if (Ehlers & Lazenby. 2006:97-98; Porter, 1998:27-28; Pearce &
Robinson, 2003:73):
It is dominated by a few large organisations.
There are no substitute products that customers can purchase. Bread is manufactured by
using flour milled from wheat. No substitute product can be used economically to
produce bread.
The supplier's product is crucial to the buyer's business. A bakery cannot produce bread
without flour.
The supplier group in the bread industry, namely wheat millers, is powerful. In the case of
Bread Factory A. the price of flour is determined by the holding company in favour of Miller
A. Bread Factory A does not really have a choice.
3.3.2 Remote environment analysis
The remote environment analysis consists of a PEST(EL) analysis.
3.3.2.1 PEST(EL) analysis
PEST or PESTEL is an acronym for political, economic, socio-cultural, technological,
environmental and legal analysis (Bonen & Sims, 2004:29; Anon, 2005a:33; Pearce &
Robinson, 2003:58). PEST analysis is the "industry standard" that is required when
performing an industry analysis, but some writers prefer the more detailed PESTEL analysis
(Botten & Sims. 2004:29).
Each of these factors has to be considered by evaluating its impact on the organisation. Take
into account that these factors should not be considered on its own. For instance, political
decisions do affect economic factors. Similarly, technological factors will only have an
impact if they are socially accepted and permitted politically (Anon, 2005a:33).
Examples of factors are (Botten & Sims, 2004:29: Pearce & Robinson, 2003:68):
Polilicalfaclors:
Form of government
Strength of opposition parties and groups
Foreign trade regulations

Government stability.
Economic factors:
Level of economic development
Taxation system
Interest rates
Inflation
Unemployment disposable income
Socio-cultural faclors:
Demographics
Income distribution
Lifestyle changes
0 Attitudes to work and leisure
Consumerism.
Tech~~ological factors:
0 Government spending on research
New discoveries 1 development
Rates of obsolescence.
Ecologicul factors:
0 Protection laws
Energy consumption issues
Waste disposal.
Legal jucrors:
Monopolies legislation
Effectiveness of legal system
Employment law, product safety. etc
3.3.3 Operating environment analysis
The operating environment is also called the competitive or task environment. The factors in
the competitive environment that affect an organisation's success include the organisation's
competitive position, the composition of its customers, the organisation's reputation among

suppliers and creditors. and its ability to anract capable employees. An organisation has
much more control over the operating environment than it does over the remote
environment. The organisation should therefore be more proactive in dealing with the
operating environment (Pearce & Robinson, 2003:82).
3.3.4 Generic strategies
Organisations have to either take offensive or defensive action to create a defendable
position in their industry and to cope successfully with the five competitive forces discussed
in 3.3.1.1 (page 39). Each organisation has to identify a unique competitive strategy that
reflects its particular circumstances (Poner. 1998:34).
Porter (1980) identified three generic strategy models that an organisation can use to create a
competitive advantage and outperform other organisations within the same industly (Botten &
Sims. 2004:259: Porter. 1998:34: Taylor. 7-005:38):
Overall cost leadership
Differentiation.
Focus.
An overall cost leadership strategy concentrates on maintaining the lowest cost relative to
competitors (Botten & Sinis, 2004:259; Potter, 1998:35: Horngren ef al., 2006:457). An
organisation can achieve this by maintaining very tight cost control (Porter, 1998:35).
A differentiation strategy is achieved by creating a perception that a product or service is
unique with their industly (Bonen & Sims, 2001:259: Porter. 1998:37; Horngren et al.,
2006:457). Poner (1998:37) lists approaches to differentiating: "Design or brand image
(Mercedes in automobiles). technology (Hyster in lift trucks: Coleman in camping
equipment). features (Jenn-Air in electric ranges), customer service (Crown Cork and Seal in
metal cans), dealer network (Caterpillar Tractor in constructio~i equipment), or other
dimensions".
The last generic strategy is focusing on serving a narrow strategic target like a particular
buyer group. segment of a product line or geographic market, more effectively than
competitors who competes more broadly (Bonen & Sims, 2004:259; Porter. 1998:38).

Figure 3.2 combines the Porter's five forces model with the generic strategies that can help an
organisation establish a competitive advantage and t o maintain it.
F igure 3.2: Combin ing t h e five forces model w i t h gener ic strategies
Force
I .Potential entrants
2.Buyer power
4.Supplier power
5.Competitive rivalry
How to mitigate the impact of this force
Build barriers to entry to deter new rivals
Either tie in your buyers through contracts, or loyalty, or increase the number of buyers so that you are less dependant on anyone
Ensure that !our product is unique. and. therefore hard to substitute
Either use only raw materials that are available from a range of suppliers, or widen your pool of suppliers
Win competitive battles with your rivals
Source: (Taylor, 2005:38)
3.4 INTERNAL ENVIRONMENT
Generic strategies
Economies of scale and lowest unit cost are barriers to entry (cost leadership), as are powerful brands and loyal customers (differentiation)
Buyers are less likely to leave you ifthey clearly value what you are offering - e.g. low prices (cost leadership) or high quality (differentiation)
Quality 1 innovauon - e.&. patents - are hard to copy (differentiation)
Cost leaders tend to be large owing to the econon~ies of scale needed for this, which reduces supplier power. By using only undifferentiated supplies, you can easily switch suppliers, thereby reducing their bargaining power.
Cost leadership gives you the upper hand in any price war. If customers believe your product to be differentiated, they will not see your competitors' products as viable alternatives
The second ingredient that is critical to the success o f a strategy is that the strategy must place
realistic r equ i remen t s on an organisation's resources. This requires a realistic analysis of an
organisation's resources (Pearce & Robinson, 2003:123). A SWOT analys is and a value-
chain analysis will provide the required information o f t h e internal environment.

3.4.1 SWOT analysis (corporate appraisal)
SWOT is an acronym for the internal strengths and weaknesses and the environmental
opportunities and threats facing an organisation (Pearce & Robinson, 2003:134; Ehlers &
Lazenby, 2006:62; Botten & Sims, 2004:68). According to Bonen and Sims (2006:68) "the
SWOT analysis enables management to interpret the information they have gathered about
their organisation and its environment in relation to how it affects the ability of the business
to reach its strategic goals".
The information gathered in the external environmental analysis (refer 3.3, page 39)
provides the information necessary to identif?. the opportunities and threats in an
organ is at ion.^ environment (Pearce & Robinson, 2003: 134).
The strengths and weaknesses are information regarding what the organisation has or does
not have in terms of rrsources and capabilities (Fhlers & Lazenby. 2006:63).
The objective of a good strategy will be to focus on increasing its strengths, optimising
opportunities, decreasing the influence of its internal weakness and external threats (Ehlers
& Lazenby, 2006:63: Pearce & Robinson, 2003:134).
The SWOT analysis captures the knowledge of the people \vho understand the various facets
of the business, i.e. the managers (Botten 8: Sims, 2004:71). It is important that a systematic
discussion of an organisation's resources and basic alternatives takes place, because what
one manager sees as an opportunit). another might view as a threat (Pearce & Robinson,
2003:135).
SWOT analysis is an aid to strategic analysis.
3.4.1.1 Strengths
A strength is a resource or capability that an organisation has relative to its competitors. It
is a distinctive competence that gives an organisation a competitive advantage in their
industry (Pearce & Robinson, 2003:135; Ehlers & Lazenby. 2006:63; Botten & Sims,
2004:68). An organisation's strength arises therefore from the resources and capabilities
within the organisation (Pearce & Robinson. 2003: 135).

Examples of strengths are skilful employees, large financial reserves. a quality product or
service and strong reputation (Ehlers & Lazenby, 2006:64).
3.4.1.2 Weaknesses
"A weakness is a limitation or deficiency in one or more resources or competencies relative
to competitors that impedes a firm's effective performance" as stated by Pearce and Robinson
(2003:135). A weakness makes an organisation vulnerable to competitors (Bonen & Sims,
2004:68).
Examples of weaknesses are limited financial resources, poor marketing skills. poor after-
sales service and negative organisational culture (Ehlers & Lazenby, 2006:64).
3.4.1.3 Opportunities
An opportunity refers to a major favourable situation in the organisation's environment
(Ehlers & Lazenby. 2006:64; Pearce & Robinson, 2003:135). It represents a strategic
challenge to an organisation (Botten & Sims, 2004:68).
Examples of opportunities are the discovery of a new product innovation, decrease in the
interest rates (if organisation has a loan obligation) and closing down of one of its major
competitors (Botten & Sims, 2004:68; Ehlers & Lazenby, 2006:64).
3.4.1.4 Threats
A threat is a major unfavourable situation in the organisation's environment (Ehlers &
Lazenby, 2006:65; Pearce & Robinson, 2003: 135).
Examples of threats are unrest among the labour force, entrance of new competitors and slow
market growth (Botten & Sims. 2004:68; Ehlers & Lazenby, 2006:65).
3.4.2 Value chain analysis
The Chartered Institute of Management Accountants (CIMA) defines a value chain as the
business activities that add value, in the perspective of the end user, to the products or
services produced by an organisation (Bonen & Sims, 2004:74).

Pearce and Robinson (2003: 137) agree with CIMA on the definition of a value chain but add
that inputs are transformed into outputs by a chain of activities.
Ensign (2001:21) on the other hand states that a value chain conceptualises the activities that
are needed in order to provide a product or sewice to a customer.
A value chain is therefore a chain of activities that adds value to an organisation's products
or services and ultimately adds value to customers.
Michael Porter, the "father" of the Five Forces model (refer 3.3.1 . I , page 39). developed the
concept of the value chain (Bonen & Sims. 2004:74; Ehlers & Lazenby, 2006:70; Ensign,
:001:21).
According to Kosior and Strong (2006:358) "the ultimate customer. once thought of as the
"end of the line". no\\ dictates the c o ~ t and performance requirements of logistical conduits".
Custon~ers and customer satisfaction has therefore become the focus of organisations and the
reason for the optimisation of its value chain.
The examination of the value chain, also known as value chain analysis, is a systematic
method of performing an internal analysis to determine which business activities really add
value to the products or senices of an organisation (Ehlers & Lazenby. 2006:70; Bonen &
Sims. 2004:74; Pitts & Lei, 2003:64).
Value chain analysis can he a useful tool that an organisation that seeks to achieve
competitive advantage can use (Ensign, 2001:21).
The meaning of value in value chain analysis is described by Ehlers and Lazenby (2006:71)
as the monetary value that customers are prepared to pay for what the organisation is
providing them. Value creation on the other band is seen through the eyes of the
shareholders (Rathbone, 2006:40).
According to Porter, there are two routes through which an organisation can create customer
value arid therefore generate superior competitive performance (Bonen & Sims, 2004:74:
Ehlers & Lazenby. 2006:70: Pearce & Robinson, 2003:137):
Product differentiation (refer Porter's generic strategies 3.3.4, page 45): b> being more
innovative than its competitors in finding nays to be unique and 1 or different.
Cost leadership: by providing their customers with a lower cost product or service as
their rivals but at the same quality of product or service.
The generic value chain model that Porter developed for a manufacturing organisation can
be grouped into m o categories, namely primary activities and support activities (Botten &
Sims, 2006:75: Ensign, 2001:21; Ehlers & Lazenby, 2006:71; Pitts & Lei, 2003:69).
3.4.2.1 Primary activities
The primary activities are those activities that create the physical product or service by
transforming the raw materials into products or services enjoyed by customers (Pins & Lei,
?003:70: Ehlers & Lazenby, 2006:71).
Primary activities are (Botten & Sims, 2004:74; Ehlers & Lazenby. 2006:70: Pearce &
Robinson. 2003: 137):
Inbound logistics: The activity that is associated with the receipt, handling and storage of
materials and inventory. This includes warehousing. inventoly control and vehicle
scheduling.
Operations: Activity that transforms the inputs into the final product. This activity is
concerned with the generation. manufacture and I or production of products or services.
Specific activities include machining, packaging, testing and equipment maintenance.
Outbound logistics: This activity relates to the distribution of products or services to the
distribution channels or customers directly. It includes finished goods warehousing.
delivery vehicle operation and order processing.
Marketing and sales: Providing customers with inducements to get them to purchase the
product or service offered. It includes advertising and promotion, pricing and sales force
issues.
Sewice: Customer service to make sure that the value of a product is maintained or
enhanced. It includes services such as installation, maintenance and training.

3.1.2.2 Support activities
These activities provide support to the primary activities. The performance of the primary
activities depends heavily on the support activities. The costs of the support acthities are
usually classified as manufacturing overhead costs (refer 2.3.6, page 19), because the costs
cannot be directly attributed to the products (Botten & Sims, 2006:75; Ehlers & Lazenby,
2006:72; Pitts & Lei, 2003:74).
Support activities are (Botten 6i Sims, 2004:75; Ehlers & Lazenby, 2006:72; Pearce &
Robinson, 2003: 137):
Procurement: This activity refers to the purchasing of the necessary inputs of the
organisation. The purchasing function includes the procedures of dealing with suppliers,
billing systems and discounts.
Technology development: Technology is very important for all the activities. There are
rapid technological changes present in almost every industry. Technology includes a
hroad range from software found in computers. standard operating procedures used to
manage a factory and customer servicing procedures.
Human resource management: Human resource management refers to the working with
people throughout an organisation. This activity focuses on recruitment, training,
development. retention and compensation of employees. This support activity is
extremely important to an organisation.
Firm infrastructure: These activities assist all the value-adding functions in an
organisation. It includes general management, finance. accounting and legal affairs.
3.4.2.3 Conducting a value chain analysis
In order to conduct a value chain analysis, the company's operations are divided into
specific activities or business processes. grouping them similarly to the primarq and support
activities (Pearce & Robinson, 2003:139).
Each activity in the value chain incurs costs. After dividing the operations into activities. the
next step is to determine and attach these costs to each activity. Through this process of

determining and assigning costs, the activities that create cost advantages or disadvantages
are identified (Pearce & Robinson, 2003:141; Ehlers & Lazenby, 2006:71). According to
Pearce and Rohinson (2003:141), it "may also bring attention to several sources of
differentiation advantage relative to competitors".
The last step in conducting a value chain analysis is to examine the value chain that has been
documented (Pearce & Robinson, 2003:141). Opportunities for cost reduction will be
identified and value enhanced, or alternatively value may be enhanced when determining
where differentiation takes place (Bonen & Sims. 2004:78: Ehlers & Lazenby. 2006:71). A
value chain is an excellent framework by which managers can determine the strengths and
weaknesses of each activitj by comparing it to competitors (Pitts & Lei, 2003:69).
Porter's generic value chain is depicted in Figure 3.3
Figure 3.3 Porter's value chain
Source: (Botten & Sims, 2004:75)
Firm infrastructure
Technoloev development
Human resource manaeement
Procurement
3.5 SIJMMARY
The aim for any organisation should be to maximise shareholder value taking into
consideration the needs of all of its stakeholders. including the environment, suppliers,
buyers. employees and creditors. An organisation can onl) achieve this by gaining a
competitive advantage and outperforming their rivals.
Inbound logistics
This chapter focused on how an organisation can achieve a competitive advantage. First,
attention was given to the formulation of a strategy. Strategic planning is imperative as it
Opera- tions
Outbound logistics
Marketing and sales
Service

provides a map towards that destination the organisation wants to travel. It forms the basis
against which all strategic decisions should be measured, asking whether we are still on the
right track to reach our destination.
Secondly, in order for an organisation to gain a competitive advantage, the external
environment should be analysed. Two commonly used methods to analyse an organisation's
external environment are discussed, namely Porter's five forces model and a PEST(EL)
analysis. The external environmental factors play a significant role in the strategic decisions
that an organisation makes. Special consideration should be given to the industry that the
organisation operates in.
Lastly, the analysis of the internal environment of an organisation was discussed. The
organisation should first consider what they are capable of by referring to their available
resources - strengths, weaknesses, opportunities and threats (SWOT analysis). The
organisation should also compile and produce a value chain analysis in order to focus on the
value-adding activities and reducing and eliminating value-destroying activities.
When an organisation has formulated strategic objectives by referring to its mission, vision.
external and internal environments, it will be a focused organisation on its way to building a
competitive advantage.
Thereby the second specific ohjective (paragraph 1.3.2.2, page 6) has been reached, namely to
conceptualise con~petitive advantage from the literature.

CHAPTER 4
TRANSFER PRICING
The main ingredient, as well as the main manufacturing cost, in the manufacturing of bread is
flour. According to the General Manager of Bread Factory A (2006), flour contributed to
75% of the manufacturing costs of all the types of bread for the financial year ending 2006.
The Longman Business English Dictionary (2001,4:369) defines transfer price as "the price
for something that is sold b) one part of an organisation to another part, rather than to a final
buyer".
Horngren er rrl. (2006:764) state that a transfer price is the price charged by one division or
department to another division or department of the same organisation for a product or service
supplied. Garrison et al. (2006568) agree with this definition.
The transfer price at which the selling division sells and at which the buying division
purchases, has a direct effect on each organisation's profits. A high transfer price results in
high profits for the selling division and low profits for the buying division, whereas a low
transfer price has the opposite effect. The selling division would therefore prefer to have the
transfer price as high as possible and the buying division would prefer the transfer price as
low as possible. The established transfer price creates revenue for the selling division and
purchase cost for the receiving (purchasing) division (Hilton er a]., 2006:790: Garrison et nl.,
2006568; Drury, 2004:883; Horngren et al., 2006:764; Edmonds et al., 2006:372; Sahay,
2003:177-192).
If the transfer is made, the transfer pricing policy has no effect on the holding company's
overall financial performance. because the sale and purchase are classified as intergroup
sales and purchases. The determination of the transfer price is, however, crucial to the
financial performance of the separate affiliated companies (Garrison et al., 2006:568; Hilton
er al., 2006:790). If the affiliated companies' performance is evaluated using performance
measures such as return on investment (ROI), residual income (RI) or any other measure
using reported profits, the transfer price affects these reported perfomlance (Hilton et d . .
2006:791: Drury. 2004:885). Consequently. the transfer pricing policy can atTect the

performance-related incentives of the divisional managers of the affected divisions (Hilton
et al., 2006:790).
One of the main objectives of establishing a transfer price according to Vigario (2005:244) is
to "promote divisional autonomy without prejudice to the group". This means that transfer
prices should be set to establish incentives for autonomous divisional managers to make
decisions that still support the group's overall strategies and goals and fit its organisational
structure (Hilton et aI., 2006:791; Horngren et al., 2006:765).
Figure 4.1 illustrates the transfer-pricing scenario.
Figure 4.1: The transfer-pricing scenario
Boundary betweenthe organisation andparties outside theorganisation
Goods transferred ata transfer price
Sellingdivision
Buyingdivision
Sales offinished goodsto customersoutside theorganisation
Purchases ofproductiveinputs tromvendorsoutside theorganisation
Assuming the transfer is made, the transfer price will notaffect the holding company's overall profit, however, itdoes affect the profit associated with each division. As aconsequence, the transfer- pricing policy can affect thedecisions of the autonomous division managers who aredeciding whether to make the transfer.
Source: (Hilton et al., 2006:790)
4.2 METHODS FOR DETERMINING TRANSFER PRICES
There are three methods for determining transfer prices (Horngren et al., 2006:765; Garrison
et al., 2006:568; Drury, 2004:885):
55
-- --------- - - - - --

Market-based transfer prices
Cost-based transfer prices.
Negotiated transfer prices.
According to Cheng (2002:l-8) there is a fourth method for determining transfer prices,
namely dictated transfer prices. This method indicates that transfer prices are dictated by top
management.
An illustration will be used in order to better explain tile different methods of determining
transfer prices. Reference will be made to the figures indicated in the illustration.
Illustration: Information on Division A and Division B
Division A and Division B are divisions of the same company. Division A purchases wheat
from farmers and mills the uhcat until flour is the final product. Division A sells this flour to
Division B.
Division A incurs the following standard costs:
Variable costs per 65 kg bag of flour: R 35
Direct material: Wheat
Direct labour Manufacturing overheads
Fixed costs: R40 000 per month
Costs from other business functions: Distribution R2O 000 per month
Selling and administrative expenses R20 000 per month
Division A's monthly production capacity of 65 kg flour is 20 000 bags. Division A sells this
flour on the outside market at R45 per 65 kg bag.
Division B can purchase a 65 kg bag of flour on the outside market at R44 per bag. Division
B's monthly consumption is 10 000 bags of 65 kg flour.

The following unit costs can be calculated based on production capacity of 20 000 bags of
65 kg of flour:
Fixed costs per unit: R40 000 120 000 = R2
Distribution costs per unit: R20 000 120 000 = RI
Selling and administrative expenses per unit: R20 000 I20 000 = R1
The different methods for determining transfer prices will now be discussed.
4.2.1 Market-based transfer prices
Setting the transfer price at an external market price is ideal where a market exists for the
products transferred (Vigario, 2005:422: Hilton et a/., 2006:794; Garrison et a/., 2006573;
D r q . 2004:886). The ~narket price can also he the price at which the sellinp division sells
the product to external customers (Drury, 2004:885; Horngren et ul., 2006:765).
Another way to determine the market price will be to obtain the price a competitor is offering
for a similar product (Dmry, 2004:885).
The market-based transfer method ill not be applicable where no competitive market for
the product of the selling division exists (Drury. 2004:888; Garrison et a/., 2006:573:
Horngren el a]., 2006:768).
In the case study, the price that Miller A sells flour to external customers (customers that do
not form part of the group), will be regarded as the market price.
4.2.1.1 Advantages of using market-based transfer prices
The advantages of using market-based transfer prices are that it motivates divisional
managers to maximise the division's profit (Hompren et a/., 2006:768), and divisional profits
can be evaluated against direct competitors because the profit is a reflection of what the
divisional profit would have been if the product were sold on the outside market (Drury,
2004:886; Garrison etal.. 2006:572; Horngren etal., 2006:768).

4.2.2 Cost-based transfer prices
Management may choose to set the transfer price based on the cost of manufacturing the
product. This is the least desirable transfer option because the incentive to control cost is
lost if an organisation's goal is not to be profitable (Edmonds el al., 2006:374).
Examples of cost-based transfer prices include using variable manufacturing cost (refer to
paragraph 2.3.1, page 15), variable and fixed manufacturing cost (refer to paragraph 2.3.1,
page 15 and paragraph 2.3.2. page 16), cost-plus a mark-up and full cost of the product as
basis for determining transfer prices. Full cost of the product includes all manufacturing costs
plus costs from other business functions such as research and development, distribution and
customer service (Horngren et a/., 2006:765; Vigario, 2005:422: Drury, 2004:885).
The following is an example of cost-based transfer prices (Researcher).
Example 4.1: Cost-based transfer prices
Refer to the information in the illustration. page 56.
The transfer price from Division A to Division B can be calculated by applying the following
methods:
Transfer price based on variable cost: R3 5
Division A uses only variable cost as a transfer price.
Transfer price based on variable and fixed cost: (R35 + R2) = R37
Division A uses variable and fixed cost as a transfer price.
Transfer price based on variable cost plus a mark-up of 10%: R35 + R3.50 = R35.50
Division A bases its transfer price on variable cost and adds a mark-up of 10% on the
variable cost.
Transfer price based on full cost: R 3 7 + R I + R I = R 3 9
The full cost (variable cost, fixed cost, distribution costs and selling and administrative
costs) is used as a transfer price.

Transfer price based on full cost plus a mark-up of 10%: R39 + R3.90 = R42.90
Division A bases its transfer price on full cost plus a mark-up of 10%.
The following conclusions can be made:
If Division A transfers at variable cost and Division B is its only customer, the revenue
from the transfer will not be sufficient to cover the fixed cost and costs from other
business operations. Division A will therefore incur a loss.
If Division A transfers at variable and fixed cost and Division B is its only customer. the
revenue from the transfer will not be sufficient to cover the costs from other business
operations. Division A will again incur a loss.
If Division A transfers at variable cost plus a mark-up of 10%. the revenue of R35.50
per 65 kg bag of flour, will not be sufficient to cover the full cost of R39 per 65 kg bag of
flour. Division A will incur a loss per bag of R3.50.
If Division A transfers at full cost. the revenue will be sufficient to cover all the costs.
Division A will break even and therefore make no profit.
If Division A transfers at full cost plus a mark-up of lo%, the revenue will be sufficient
to cover all the costs and also show a profit. This is the best transfer pricing policy
alternative based on cost.
4.2.2.1 Drawbacks of using cost-based transfer prices
To calculate cost-based transfer prices is relatively simple, but it has some major defects
(Garrison el a/., 2006:572):
Bad decisions and therefore sub-optimisation can be the result of using cost. particularly
full cost, as a transfer price. Refer to example 4.1 (page 58) where the full cost of flour
can never be less than R39 per bag (R35 variable cost per bag + R2 fixed cost per bag at
full capacity + R2 distribution cost and selling and adrriiriistratiori costs). If Division B
can purchase a 65 kg bag of flour from an outside supplier at less than R39, say R37, and
the transfer price was bureaucratically set at full cost (R39), Division B would never want

to huy flour from Division A since it can purchase it from another supplier at a lower
cost. However. from the point of view of the company as a whole, flour should be
transferred from Division A to Division B whenever Division A has idle capacity. The
reason for this is that when Division A has idle capacity (refer example 4.2, page 61), it
only costs the company R35 variable cost per 65kg bag of flour, but it costs Division B
R37 to purchase from outside suppliers.
When the organisation uses a cost-based transfer price policy, Division A will never
show a profit on an internal transfer (refer to example 4.2, page 61). The only division
that will show a profit is when the buying division (Division B) sells bread to outside
parties.
The last defect that cost-based transfer pricing has is that it does not provide an incentive
to control costs. If the actual costs of Division A are simply transferred from Division A
to Division B. there is v e T little incentive to I n and reduce costs. One way to overcome
this is by using a standard costing system (refer paragraph 2.5.3, page 27).
4.2.3 Negotiated transfer prices
A negotiated transfer price is the result of ne_gotiations between the selling and buying
divisions (Hilton et al.. 2006:795; Garrison er a/ . , 2006:568). In some circumstances, a
negotiated transfer price could be more beneficial than a market-based transfer price (Drury,
2004:893: Edmonds et d., 2006:374). The managers involved have much better
information about the potential costs and benefits of the transfer than other managers in the
organisation it preserves the autonomy of the divisions and its preserves the notion of
fairness (Edrnonds et al., 2006:374: Garrison e ta / . , 2006:568).
According to Ghosh (2000:l-30) the dependent variables when transfer prices are
negotiated between trading divisions "were perceived fairness of the transfer pricing policy,
inter-divisional conflict, the economic outcome measure of firm profit, and the time taken
by the managers to negotiate an agreement (since time is an important economic resource to
the manager) and firm profit efficient}".
4.2.3.1 Drawbacks of using negotiated transfer prices
There are drawbacks to using negotiated transfer prices. The negotiations could lead to
disagreement between managers (conflict) resulting in divisiveness. It takes time to

negotiate an agreement. The negotiated transfer price depends on the negotiation skills of
the manager involved (Drury, 2004:894; Hilton et al., 2006:796; Garrison et al., 2006:568).
In order for the negotiations to work effectively, it is important that managers from both the
selling and buying divisions have equal bargaining power. Unequal bargaining power
exists when the selling division has limited outlet possibilities while the buying division can
source the product from a number of suppliers. Another possibility that could result in
unequal bargaining power is when the transfers form a large portion of one of the division's
business, while for the other division the transfer is only a small portion of their business
(Drury, 20042393).
There is a range of acceptable transfer prices. This range is generally the range of transfer
prices within which both divisions' profits will increase when a transfer occurs. The actual
transfer price agreed to by the two divisions' managers will fall anywhere between these
limits (Garrison el 01.. 2006:568-569).
The calculation of the lowest and highest acceptable transfer prices will be illustrated by
example 4.2 (Garrison er al., 2006569-571, Adapted).
Example 4.2: Lowest and highest acceptable transfer prices
Refer to the infonr~ation in the illustration. page 56.
The selling division's (Division A) lowest acceptable transfer mice
Division A will only be interested in a transfer if its profit increases. Clearly the transfer
price must not fall below the variable cost of R35 per 65kg bag of flour. In addition, if
Division A has insufficient production capacity to fi l l Division B's order, then it would have
to give up some of its regular sales. Division A would expect to be compensated for the
contribution margin (sales price less variable cost) on these lost sales. In sum, if the transfer
has no effect on fixed costs, then from Division A's point of view the transfer price must
cover both the variable costs of producing the transferred units and any contribution margin
forgone from lost sales (Garrison rt al., 2006:569; Horngren eta/., 2006:773).
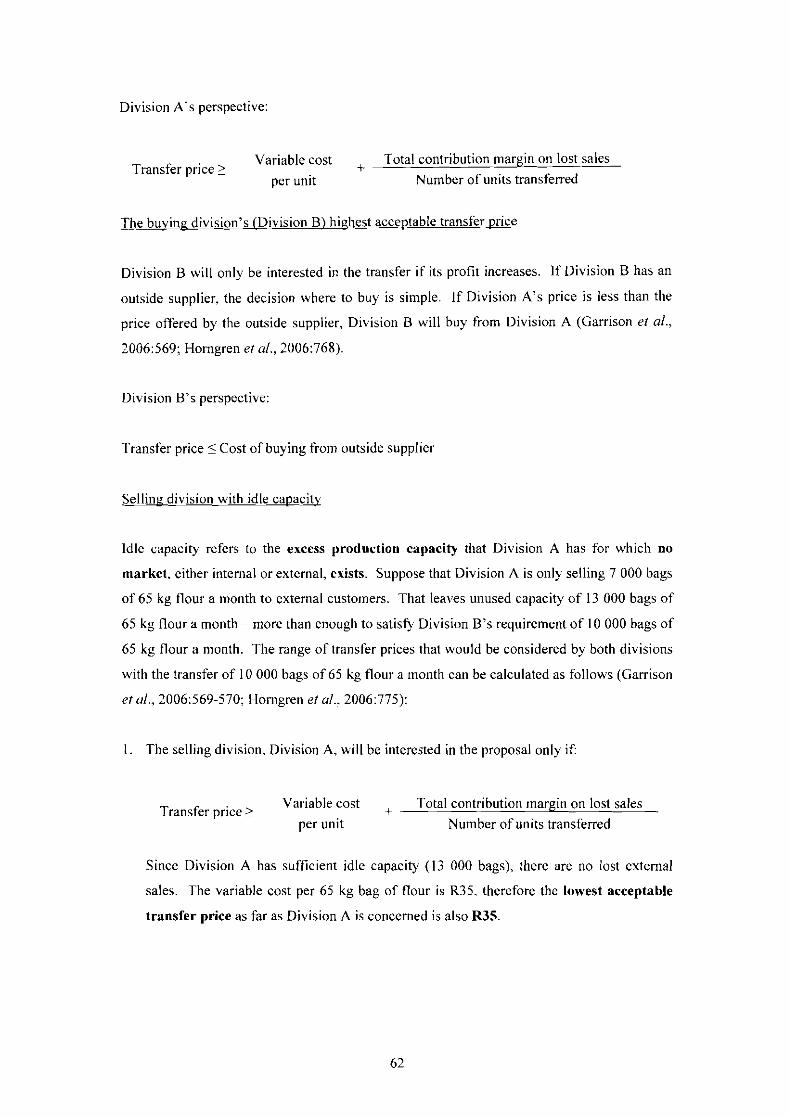
Division A's perspective:
Variable cost + Total contribution margin on lost Transfer price ?
per unit Number of units transferred
The buying division's (Division B) highest acceptable transfer-
Division B will only be interested in the transfer if its profit increases. If Division B has an
outside supplier, the decision where to buy is simple. If Division A's price is less than the
price offered by the outside supplier, Division B will buy from Division A (Garrison el al.,
2006:569; Horngren et al., ?006:768).
Division B's perspective:
Transfer price 5 Cost of buying from outside supplier
Selling division with idle capacity
Idle capacity refers to the excess production capacity that Division A has for which no
market. either internal or external, exists. Suppose that Division A is only selling 7 000 bags
of 65 kg flour a month to external customers. That leaves unused capacity of 13 000 bags of
65 kg flour a month - more than enough to satisf) Division B's requirement of 10 000 bags of
65 kg flour a month. The range of transfer prices that would be considered by both divisions
with the transfer of I0 000 bags of 65 kg flour a month can be calculated as follows (Garrison
et ul.. 2006569-570; Horngren el at., 2006:775):
1. The selling division. Division A, will be interested in the proposal only if:
Variable cost + Total contribution margin on lost sales Transfer price > per unit Number of units transferred
Since Division A has sufficient idle capacity (13 000 bags), there are no lost external
sales. The variable cost per 65 kg bag of flour is R35. therefore the lowest acceptable
transfer price as far as Division A is concerned is also R35.

2 . l l ~ e buying division, Division B, can buy similar flour from an outside supplier at R44.
Therefore. Division B would be unwilling to pay more than R44 per 65 kg bag of flour
for Division A's flour.
Transfer price 5 Cost of buying from outside supplier = R44
3. Combining the requirements of both the divisions, the rangc of acceptable transfer prices
in this situation is:
R35 5 Transfer price 2 R44
The managers from both divisions should now negotiate on a transfer price within this
range.
Selling division with no idle c a m
Suppose that Division A has no idle capacity; it is selling 20 000 bags of 65 kg flour to
external customers at a price of R45 per 65 kg bag of flour. This means that in order for
Division A to fill Division B's order, it will have to divert 10 000 bags of 65 kg flour from its
external customers. The range of transfer prices that would be considered by both divisions
with the transfer of 10 000 bags of 65 kg flour a month can be calculated as follows (Garrison
el ul., 2006570-571; Horngren rt ul., 2006:775):
I . The selling division, Division A. will be interested in the proposal only if:
Variable cost Total contribution margin on lost sales Transfer price > + per unit Number of units transferred
Since Division A has no idle capacity, there are lost external sales. The contribution
margin on these lost external sales is R10 (R45 - R35) per bag of 65kg flour.
Transfer price z R 35 + R 1 O x ' O o o O - - - R35 +RIO = R45 10 000
Therefore. as far as Div~sion A is concerned, the transfer price must at least cover the
revenue on the d~verted sales of 10 000 bags, which is R45 per bag. This makes sense
because the cost of producing the I0 000 bags of 65 kg flour is the same, whether they are

sold internally or on the external market. The only difference is that Division A loses
some of the revenue if it transfers 10 000 bags at an amount less than R45 to Division B.
2 . The buying division, Division B, can buy similar flour from an outside supplier at R44.
Therefore. Division B would be unwilling to pay more than R44 per 65 kg bag of flour
for Division A's flour.
Transfer price 5 Cost of buying from outside supplier = R44
3. Division A would insist on a transfer price of at least R45 while Division B would refuse
to pay anything more than R44. It is impossible to satisfy both managers simultaneously.
Thus there will be no agreement and no transfer will take place. This does, however,
make sense in terms of the company as a whole. The company would sacrifice revenue
of R45 per bag to save costs of R44 per bag. The idea behind transfer pricing is that it is
a mechanism for dividing between the buying and selling division any profit that the
entire group earns as a result of the transfer. If the group loses money on the transfer.
there will be no profit to split, and i t will be impossible for the two divisions to come to
an agreement.
Sellinr division has some idle capacitv
Suppose that Division A can sell 15 000 bags of 65 kg flour on the external market. Division
B can only purchase flour from one source, it cannot purchase 5 000 bags from one supplier
and the other 5 000 bags from Division A.
To fill Division B's entire order of 10 000 bags of 65 hg flour, Dikision A must divert
5 000 bags o f its external customers to Division 9, and the rest of the 5 000 bags Division A
can supply to Division B from its idle capacity. The range of transfer prices that would be
considered by both divisions with the transfer of 10 000 bags of 65 kg flour a month can be
calculated as follows (Garrison et ul., 2006:571):
I. As before, Division A will be interested in the proposal only if:
Variable cost + Total contribution margin on lost sales Transfer price ?
per unit Number of units transferred

Since Division A does not have sufficient idle capacity to fill the entire order of 10 000
bags, there are lost external sales. The contribution margin on these lost external sales is
R10 (R45 - R35) per bag of 65 kg flour.
R1O OoO = R3j + R5 = R40 Transfer price ? R 35 + - l o 000
Therefore, as far as Division A is concerned, the transfer price must cover the variable
cost of R35 plus the R5 cost on lost sales.
2. The buying division, Division B. would be unwilling to pay more than R44 per 65 kg bag
of flour (external supplier's price) for Division A's flour.
Transfer price 5 Cost of buying from outside supplier = R44
3. Combining the requirements of both the divisions, the range of acceptable transfer prices
in this situation is:
R40 5 Transfer price 2 R44
Again, the managers from both divisions should now negotiate on a transfer price within
this range.
No outside su~olier
If Division B has no external supplier to purchase flour from, the highest price it would be
willing to pay would depend on how much Dkision B expects to earn, excluding the transfer
price (Garrison et ul., 2006571: Homgren et crl., 2006:776). If, for example, Division B
expects to earn R60. after deducting its own costs, by selling bread manufactured from one
bag of 65 kg flour, it would be willing to pay up to R60 per 65 kg bag of flour to Division A.
After the discussion of the different methods for determining transfer prices, it is interesting
to know what method companies actually use to determine transfer prices. Figure 4.2
illustrates this.

Figure 4.2: What companies actually use as transfer prices
a 17"10Full cos t plus markup
.24% Fullcost
o 5%Variablecost
o 37"10Market price
. 17"10Negotiated price
Source: (Tang, 1992:22-26)
4.3 SUMMARY
In this chapter the different methods for the detennination of transfer prices were discussed.
These methods include market-based transfer prices, cost-based transfer prices and negotiated
transfer prices. Market-based transfer prices are the preferred method to determine transfer
prices, while cost-based transfer prices are the least preferred method. Market-based transfer
pricing uses the price that the selling division of an organisation can obtain externally for their
product or service as the transfer price. Cost-based transfer prices are based on the selling
division's cost of production of the product or service, while negotiated transfer prices are
transfer prices negotiated between the selling and buying divisions of an organisation.
The determination of transfer prices in an organisation can be a very controversial issue and
can create conflict amongst different divisions, especially if divisional managers'
perfonnance bonuses are measured based on the divisional perfonnance.
Assuming the transfer does take place, the transfer pricing policy in an organisation has no
direct effect on the profitability of the organisation as a whole, but when transfer prices are
determined unfairly, it can lead to de-motivated staff which in turn can lead to lower
productivity.
Thereby the third specific objective (paragraph 1.3.2.3, page 6) has been reached, namely to
conceptualise transfer pricing determination from the literature.
66
-- --

CHAPTER 5
RESEARCH METHODOLOGY
5.1 INTRODUCTION
Henning ef a/. (2004:36) state that "(research) methodology refers to the coherent group of
methods that complement one another and have the "goodness of fit" to deliver data and
findings that will reflect the research question and suit the research purpose".
Research methodology focuses on the process and the kinds of tools and procedures used
(Babbie & Mouton, 200 1 :75).
Leedy and Ormrod (2005:12) define research methodology as the general approach the
researcher follo\\s while conducting the research. This approach prescrihes. to some extent.
the particular tools that the researcher selects.
The research methodology that the researcher follows refers to the methods (tools) used to
obtain answers to the research questions and thus achieving the set objectives.
5.2 OBJECTIVES O F EMPIFUCAL INVESTIGATION
The specific empirical objectives of this research (paragraph 1.3.2, page 6) are as follows:
To calculate the profitability of the delivery routes in Bread Factory A (paragraph 1.3.2.5.
page 6).
To determine whether Bread Factory A follows the guidelines provided by the literature
on competitive advantage (paragraph 1.3.2.6, page 6).
To determine whether the most beneficial transfer price determination method is used in
Bread Factory A (paragraph 1.3.2.7. page 6).

5.3 STUDY POPULATION
A Bread Factory affiliated to a holding company was selected as the research subject for this
research project. Interviews were conducted with the General Manager and the Financial
Manager of Bread Factory A. The un-audited financial data for the financial year ending in
2006 was examined and analysed as well as the 2006 marketing plan for Bread Factory A. A
detailed discussion of the interviews conducted and the examination of the financial records
and marketing plan of Bread Factory A will follow in the discussion of the measuring
instruments used.
5.4 MEASURING INSTRUMENTS
The following measuring instruments were used during the research:
Inter\.ie\rs with senior management of Bread Factory A .
The examination and analysis of financial data for Bread Factory A.
The examination and analysis of certain strategic documents of Bread Factory A.
Quotations obtained from independent external suppliers for the supply of flour.
Detailed descriptions of these measuring instruments follow below.
5.5 THE lNTERVIEW
The interview topic will be discussed using the following headings: objective of the
interview: description of the interview: study sample of the interview: administration of the
interview; analysis of the interview and the reliability and validity of the interview.
5.5.1 Objective of the interview
The interview is one of the most important. and essential, sources of useful information in a
case study (Yin, 2003:89; Leedy & Ormrod. 2005: 146).
The interview was used during the research as a medium to obtain relevant information about
the environment that Bread Factory A operates in: including the external and internal
environment. Another reason was to obtain a clearer understanding of the day to day

operations of Bread Factory A and the information that management uses to plan. control and
make decisions.
5.5.2 Description of the interview
In a case study, the interviews conducted are qualitative and semi-structured in nature (Yin,
2003:89; Leedy & Ormrod, 2005:146; Sampson, 1972:lO). When doing field research (as
opposed to survey questionnaires), the less-structured interview is more appropriate (Babbie,
2004:300). The advantage of a semi-structured interview is that the researcher has a specific
list of topics to cover and the time allocated to each topic is lefi to the discretion of the
researcher. Any unexpected facts or unresolved questions can then be explored further,
therefore maximising the collection of relevant data (Sampson. 1972: 10; Babbie, 2004:300).
A qualitative interview is more guided conversations rather than structured questions (Yin,
2003:89: Babbie, 2004:300). The questions asked should be friendly and non-threatening in
nature (Yin. 2003:90).
The questions asked in the interviews are open-ended (Yin, 2003:90: Babbie. 2004:244).
Open-ended questions meaning that the respondent is asked his or her own answer to the
question (Babbie, 2004:244). You can ask key respondents about the facts but also their
opinions about the situation. Their insights about a situation can lead to more questions and
can possibly identify other persons that the researcher can interview (Yin, 2003:90).
The following guidelines should be followed when formulating and asking questions
(Breakwell. 1970:79-80; Babbie. 2004:246-249):
Avoid formulating double-barrelled questions;
Questions should not include jargon or complex words.
Questions should be relevant.
Questions should be short and to the point.
Avoid biased and leading questions prompting respondents to answer in a certain way.
Leedy and Ormrod (2005: 147) offer guidelines on conducting a productive interview:
Identify some questions in advance: Questions should encourage respondents to converge
about the topic addressed. When the conversation is drifting in an unproductive direction,
the researcher should gently guide it back on its course.
Ensure your interviewees are representative of the group.
Find a suitable location: A quiet place with minimum distractions and interruptions.

Establish and maintain rapport: Stan the conversation with small talk until you are both
relaxed and comfortable. These types of interviews are informal. Listen carefully and
show interest in what the respondent is saying.
Don not put words in the respondent's mouth: Listen carefully what the respondent is
saying and let him or her say it in their own words.
Record the respondent's answers: Whether using handwritten notes, shorthand or a tape
recorder, ensure everything is captured that the person says, especially in an unstructured
interview.
Keep your reactions to yourself.
Remember that you are not necessarily getting the facts.
Questions were asked based on a semi-structured interview questionnaire (appendix 1,
page 138) compiled by the researcher.
5.5.3 Study sample of the interview
Qualitative, semi-structured interviews were conducted with:
The General Manager of Bread Factory A: and
the Financial Manager of Bread Factory A.
The respondents were chosen to conduct interviews with on the basis of the expertise and
knowledge that they have acquired through years of service at Bread Factory A. Both the
respondents have in-depth knomledge of the operations of Bread Factory A and the in dust^ in which it operates.
5.5.4 Administration of the interview
The researcher planned the interviews as follows:
Appointments were made with each respondent to interview them at Bread Factory A.
The financial records of Bread Factoq A were obtained beforehand to assist the
researcher in preparing for the interview.
The appointments were confirmed with the respondents beforehand.
Interview questions were formulated by the researcher based on the financial records of
Bread Factory A and based on the objectives defined by the researcher (paragraph 1.3,
Page 66).

The researcher has two tasks throughout the interview process (Yin, 200339):
Following the line of inquiry as reflected by the researcher's case study design.
Asking questions in an unbiased manner that will also serve the needs of the line of
inquiry.
The researcher followed the following stages as suggested by Steinar Kvale (1996:88). He
highlights seven stages in the complete interviewing process:
Thenrarising: identifying and clarifying the purpose of the interviews and also the
concepts that the researcher wants to explore (paragraph 5.2, page 67).
Designing: designing the process that you will follow to accomplish your purpose
(paragraph 1 S.2.1, page 7).
Inrerviewing: performing the actual interviews.
Trunscribing: capturing and writing the actual text of the interviews. Once the interview
process is complete, the researcher should create a written text of the interviews (Babbie.
2004:302).
Analysing: interpreting the meaning of the gathered materials in relation to the purpose of
the study (paragraph 6.2, page 78).
Verif.ing: the reliability and validity of the materials should be checked (paragraph 5.5.6.
page 72).
Reporling: communicating your results to others (Chapter 7, page 122).
The analysis (stage five) ofthe interview will be discussed next
5.5.5 Analysis of the interview
As highlighted by Steinar Kvale's seven stages (paragraph 5.5.4, page 71), the information
gathered during the interview should be analysed.
After the completion of the interviews, the detailed notes taken by the researcher were written
down in actual text to enable the researcher to interpret the information gathered. The data
was first sorted into categories based on the objectives of the study (paragraph 1.3, page 6).
The areas that still lacked information to complete the total understanding of the topic by the
researcher were noted. The researcher contacted the respondents telephonically to ask for
further information to clarify the unclear areas. Where appropriate additional financial
records were sent via e-mail to the researcher. otherwise the additional information was

communicated by the respondents telephonically and the researcher transcribed this
information (stage four of Steinar Kvale's seven stages, paragraph 5.5.4, page 71).
All the information gathered during the interviews was thoroughly documented by the
researcher. This document was then sent to both respondents to check and agree that what
was written was accurate.
5.5.6 Reliability and validity
Reliability is the extent to which a particular technique. applied repeatedly to the same
object, consistently yields the same results each time. Validity should not be confused with
reliability (Babbie, 2004: 141; Neunian, 2006: 188).
According to Henning rt a/. (2004:147), "validity asks the question whether, by using certain
methods. we are investigatine what we say we are investigating".
In conducting the interviews the researcher attempted to address the factors highlighted in
table 5.1. These factors ma) influence the reliability of the results obtained (Woods &
Catanzaro, 1988: 136-137):

Table 5.1: Reliability of the interview
Threat Researcher'> status
position
Participant choice
Social situation conditions
-- Methods of
procedure
Specific examples Lnvestigator may be well known to the participants. The gender orthe investigator
may influence the openness u,ith which participants share
Information.
Intermediary may approach mly thosejudged as "good" mticipants. rhose who elect to participate nay possess characteristics :hat differ from non- ~articipants.
"articipants may judge the ippropriateness of information n relation to the context
ieplication of qualitative
itudies not possible. - -onstant comparative analysis nay result in lack of igreement on description or :omposition of events.
-
Control Clearly identify the researcher's role in the research setting.
Describe the content and development of the researcher's role as the study
Encourage intermediaries to recruit participants non- Selectively. Describe characteristics of participants and the decision processes involved in their choice to participate.
Delineate the conteyt (social. physical and interpersonal) in which data is gathered. Record field notes immediately after data collectio~~ 10 ensure accurate recall of the structure and function of the context.
Report precisely and thorough11 on the strategies used to collect, analyse and report data. Transcribe tape-recorded interviews verbatim. At least two coders perform theoretical coding.
I Phrase low inference
1 descriptors in concrete, precise Terms. Seek reaction to working analysis from selected Participants. Compare findings with published studies and other investigators pursuing similar work.

Validity was ensured by taking into account the factors that could influence the validity of the
interview. These factors are expounded out in table 5.2 (Woods & Catanzaro, 1988:137):
Table 5.2: Validity ofthe interview
rhreat ( Specific examples
4istory and I Particular problem when
Participants may become
dependant on researchers for status enhancement 01
satisfaction or
naturation
( psychological needs.
data is generated over
time (e.g., longitudinal studies).
1 Participants may behave ( abnon-nally to put self in
best light, lie, omit releva
data, or misrepresent thei Claims. Researchers may see and report data as a function (
( their position.
selection and I Possible distortion of dat; .egression by selection of participan
(see above).
Control
Identify those changes that are recurrent,
progressive, and cyclical as the sources of change.
Distinguish maturation from effects of intervening phenomena through use of constant comparative analysis and
blortality
discrepant-case analysis.
Independent corroboration from nlultiple
Longitudinal study requiring hours of commitment.
participants, discrepant-case analysis, and observation. Substantive and theoretical codins likely
to elicit contrived responses. Comparison of data to theories and
analytical models derived from literature. Presentation of data in relation to
researcher's position and relationships.
constant comparative analysis and validity checks with participants.
Recruit participants who meet purposive sampling criteria.
Question commonly assumed meanings,
utilise discrepant-case analysis, compare
data across sampling categories.
Remind participants often that they are experts in the topic of study (input
valued). Provide consistent follow-up to participants in the form of information
about the ongoing study.
Make it easy for participants to notify the investigator of address changes (e.g.,
provide return postcards).

5.6 THE EXAMINATION OF THE FINANCIAL RECORDS
The examination of the financial records will be discussed under the following headings:
objective; administration; analysis; and reliability and validity.
5.6.1 Objective
The financial records of Bread Factory A were examined to obtain information on the
distribution costs of bread to customers and transfer prices paid to Miller A for flour
purchases.
5.6.2 Administration
The Financial Manager of Bread Factory A provided the financial records. These financial
records included:
Profit and loss statement of Bread Factory A;
sales volumes of Bread Factory A;
inventory control sheets of Bread Factory A;
detailed maintenance, diesel and oil costs per delivery vehicle for Bread Factory A;
delivery route details; and
details of inter-group purchases between Bread Factory A and Miller A .
The profit and loss statcmcnts for the financial year ended during 2006 were obtained. This
included monthly figures as well as cumulative budget and actual figures. The other financial
records were obtained for one month with detailed information ahout weekly operations. In
congruence with the confidentiality agreement with Bread Factor?: 4, the month used is not
divulged. This was done in order to perform calcula~ions based on a four-week period and
then compare the calculatiuns were compared with a month's figure on the profit and loss
statement.
5.6.3 Analysis
The information obtained was examined and the income and costs relating to distribution
costs and transfer prices were extracted according to the literature as discussed in Chapters
two to four.

5.6.4 Reliability and validity
The researcher is unable to directly manipulate the financial data of Bread Factory A. The
formulas and classifications that are used are described in the literature and have been
developed by a panel of experts in the Management Accounting field. This ensures the
validity of the formulas and classifications.
When referring to reliability, the assumption is made that the financial records provided by
Bread Factory A, are accurate in their application of accepted accounting practice.
5.6.5 QUOTATIONS FROM INDEPENDENT EXTERNAL SUPPLIERS
The objective, administration, analysis and the reliability and validity of the comparison with
competitor' prices \ \ i l l be discussed in this section.
5.6.6 Objective
Quotations obtained from direct miller con~petitors were examined in order to obtain
information to determine the market-based transfer price (paragraph 4.2.1, page 57) of the
different types of flour.
5.6.7 Administration
Independent (Telephonic) quotations of flour purchases were obtained by the researcher from
direct miller competitors. These quotations were obtained for the different flour types. The
same credit terms that apply to Bread Factov A with Miller A were used as one of the
criteria. Another criterion is that the flour has to be delivered to Bread Factory A. The prices
obtained therefore included a general delivery fee. The researcher did not provide the direct
competitors with the quantities required per different flour tvpe, in congruence with the
confidentiality agreement with Bread Factory A.
5.6.8 Analysis
The direct miller competitor prices of the different flour types were compared with the actual
transfer prices paid by Bread Factory A to Miller A.

5.6.9 Reliability and validity
The researcher is unable to directly manipulate the transfer prices paid by Bread Factory A to
Miller A. The quotations obtained from the direct competitors are based on the same criteria
that Bread Factory A purchases flour from Miller A. The quotations were obtained by the
researcher. No direct manipulation is possible. This ensures the validity of the comparison.
When referring to reliability, the assumption is made that the transfer prices provided by
Bread Factory A are accurate.
5.7 SUMMARY
The research methodology followed while conducting this research was discussed in this
chapter.
First the objectives of the empirical investigation were highlighted (paragraph 1.3.2. page 6)
followed by a description of the study population.
The measuring instruments used during the research were interviewing, examination of the
financial records and comparison with competitor prices. Each of these measuring
instruments was discussed in detail. The objective of each of the measuring instruments were
indicated, the administration thereof, analysis of the data obtained through each of the
measuring instruments and the reliability and validity of using each measuring instrument.

CHAPTER 6
ANALYSIS OF RESULTS
The general aim of this research was to determine whether general management accounting
principles were applied in Bread Factory A with specific reference to the financial viability of
the delivery routes (paragraph 1.3.1, page 6). Certain specific objectives were also set. These
specific objectives included a literature study on cost assignment, cost behaviour and costing
systems, and a literature study on competitive advantage (objectives 1.3.2.1 to 1.3.2.2,
page 6). These literature studies were covered in chapters two and three. The literature study
was completed in chapter four with a discussion on the determination of transfer prices
(objectives 1.3.2.3, page 6).
This chapter discusses the results of the research under the following headings:
6.2. Interviews
6.3. Analysis of each cost item in the determination of delivery route contribution (objective
1.3.2.4, page 6)
6.4. Calculation of delivery route profitability (objective 1.3.2.5. page 6)
6.5. Competitive advantage (objective 1.3.2.6, page 6)
6.6. Comparison of transfer prices with third party quotations (objective 1.3.2.7, page 6)
6.2 INTERVIEWS
Semi-structured interviews were conducted with the General Manager and the Financial
Manager of Bread Factory A. Questions were asked based on an inteniew questionnaire
(appendix 1. page 138) compiled by the researcher. Due to the nature of a semi-structured
interview, the questions asked were open-ended (paragraph 5.5.2, page 69). More questions
were prompted by the discussions. The results of the interviews will now be discussed.
6.2.1 Manufacturing Process
According to the General Manager of Bread Factory A, the factory manufactures bread seven
days a week. On Saturdays, manufacturing ends early in the morning, but commences again

in the late afternoon. Bread is delivered every day by the delivery vehicles, but on Sundays
only about one third of the delivery vehicles deliver bread.
6.2.2 Financial Accounting System
Bread Factory A uses an in-house developed financial accounting system. According to the
Financial Manager, this system is not very effective and most of the control, for example
inventory control and dispatch surnmary (paragraph 6.2.5.4, page 85) is kept on Microsoft
Excel.
6.2.3 Financial Reporting
The Financial Manager of Bread Factory A stated that financial reporting to the holding
company occurs monthly. A very detailed profit and loss statement is prepared and reported
monthly by the Financial Manager of Bread Facton A. The General Manager of Bread
Factory A highlighted that the holding company prescribes the format of the profit and loss
statement and income and costs are handled as per the holding company's instructions.
According to the General Manager of Bread Factorq A, the factory does not have a balance
sheet. All the assets and liabilities are recognised by the holding company.
Internally. financial reporting occurs weekly as highlighted by the General Manager and
Financial Manager of Bread Factory A. A week starts on Saturday and ends on the following
Friday.
Most of the profit and loss statement items will now be discussed in detail.
6.2.4 Sales
According to the Financial Manager of Bread Factorq A, the delivered sales volumes equal
the net loaves sold. The reason is that except for a few individuals that purchase single loaves
at Bread Factory A itself, all the loaves are delivered. According to the Financial Manager,
the sales volumes are split per different classification of bread. The sales figures used in
Bread Factory A's calculation of the delivery route contribution are the actual sales volumes,
per classification, of the past week multiplied by the current selling price of that specific
classification.

Sales will be discussed by referring to outside group sales, intergroup sales. intergroup
purchases sold, sales of factored goods and stales. returns. write offs and discounts.
6.2.4.1 Outside group sales
According to the Financial Manager of Bread Factory A and the profit and loss statement.
most of Bread Factory A's sales consist of sales to customers that do not form part of the
group. They classify these sales as "outside group sales". The General Manager of Bread
Factory A highlighted that these customers are spread over a radius of some 12Okm from
Bread Factory A. The General Manager of Bread Factory A indicated that the factory does
not have sales representatives as it is traditionally known. The drivers of the delivery vehicles
have the responsibiliq to obtain sales orders from the existing customers on their delivery
route. The driver can therefore be regarded as the sales representative for that delivery route.
The selling price of Bread Facton A'$ bread is determined and set by Bread Factory A itself.
according to the General Manager of Bread Factory A. The selling price is detennined based
on competitors' pricing and the cost of production. The General Manager and F~nancial
Manager of Bread Factory A agreed that some customers receive discounts (refer paragraph
6.2.4.6, page 8 I).
Customers have a number of options to pay for purchases, according to the Financial
Manager, namely:
Cash on delivery;
cash on the day after delivery;
on credit: custonlers have credit terms; and
bank transfers.
According to the Financial Manager of Bread Factory A. the drivers have the responsibility to
collect the payments. If they have a cash shortage, it is deducted from their salaries at the end
of the month.
6.2.4.2 Intergroup sales
Both the General Manager and Financial Manager of Bread Factory A agreed that bread is
sold to another bread factory that is also part of the group. This is recorded as intergroup
sales.

6.2.4.3 Intergroup purchases sold
Bread is bought from another Bread Factory and then sold to Bread Factory A's customers as
indicated by the Financial Manager of Bread Factory A. This is recorded as intergroup
purchases sold. According to the Financial Manager, these sales volumes are negligible.
6.2.4.4 Sales of factored goods and stales
Bread Factory A purchases other items such as chips and cookies, which the drivers sell when
they deliver bread. The stale bread is also sold. According to the Financial Manager and the
profit and loss statement. this turnover is minimal.
6.2.4.5 Returns
The Financial Manager of Bread Factory A has indicated that a customer of Bread Facton A
can take less bread than what they have ordered. This results in excess bread on the delivery
vehicle, which is known as "returns". Once the driver has finished his deliveries, he returns
to Bread Factory A where the returns are accepted back into inventory by the dispatching
unit. The dispatcher counts the number of loaves returned and both the dispatcher and the
driver sign for it.
6.2.4.6 Discounts
The General Manager and Financial Manager of Bread Factory A agreed that some customers
receive discount from the regular selling price of Bread Factory A's selling price. Uiscour~ts
cannot be negotiated by the driver, it can only be negotiated and approved by the General
Manager of Bread Factory A. Discounts can be granted based on the following:
Competitor pricing: if a competitor offers a better price than Bread Factory A, Bread
Factory A offers discount in order to retain the customer; and
when a new customer is on an existing deliven route, it is assumed that the delivery costs
are already covered (refer to the contribution theory, paragraph 1.4, page 21). These sales
will then contribute only to the profit of Bread Factory A.
According to the Financial Manager of Bread Factory A, the discount agreements are
captured into the financial accounting system. The driver of the delivery vehicle has a list of
sales prices per customer on his delivery route. When he delivers the bread to a customer. he
completes a hand-written invoice based on the sales volumes delivered and the list of selling

prices that he has. Once lie has completed his deliveries, he returns to the factory with a list
of sales volumes delivered to each customer. The sales volumes are captured on the financial
accounting system and the discounts given to customers are calculated automatically.
Discounts are controlled and checked daily by the Financial Manager of Bread Factory A.
6.2.5 Cost of sales
The cost of sales cost in the profit and loss statement consists of cost of raw materials, cost of
factored goods and cost of intergroup purchases. According to the Financial Manager and the
profit and loss statement of Bread Factory A, the cost of sales only includes the direct
material cost. The lahour costs and manufacturing overhead costs as per the classification in
the profit and loss statement of Bread Factory A are viewed as indirect costs (refer paragraph
2.2.1. page 13).
Cost of sales i l l be discussed under the follo\\ing headings: cost of raw materials.
dispatching of bread, write-offs and inventory control.
6.2.5.1 Cost of raw materials
According to the Financial Manager of Bread Factory A, the cost of raw materials consists of
the cost of:
Flour;
other ingredients; and
wrapping.
According to the Financial Manager of Bread Factory A. the cost of raw materials per unit
(loaf of bread) per classification is calculated on a monthly basis. The actual flour, other
ingredients and wrapping costs used to manufacture each classification of bread are calculated
and divided by the total production volume per classification of bread. The Financial
Manager of Bread Factory A indicated that due to the internal requirement of weekly
calculating and reporting delivety route contribution, the cost of raw material figures used is
the previous month's cost of raw materials.
Both the General Manager and Financial Manager of Bread Factory A agreed that all the flour
is purchased from Miller A. The Financial Manager of Bread Factory A indicated that Miller
A is part of the holding company that owns Bread Factory A . It is therefore also an inter-

group purchase. The General Manager and the Financial Manager of Bread Factory A
indicated that the price at which the flour is purchased from Miller A is not negotiated by
Bread Factory A. There is also no indication given to Bread Factory A as to how this transfer
price of flour is determined.
The other ingredients and wrapping form the rest of the cost of raw materials.
6.2.5.2 Dispatching of bread
The dispatching of bread from Bread Factory A to customers is a very important function
where tight control is maintained by Bread Factory A as indicated by the Financial Manager
of Bread Factory A.
As mentioned in paragraph 6.2.4.1 (page 80). the drivers are also the sales representatives for
Bread Facton A. According to the Financial Manager of Bread Factory A. the drivers obtain.
during their daily deliveries, orders for bread for the next day or for the next delivery from
customers. At the end of their deliveries, all the orders are added together and a global order
is submitted by the driver for his specific delivery route to Bread Factory A. The General
Manager obtains all these orders at each day-end and assigns sales volumes to drivers, based
on production volumes and priority of customers. This means that the drivers do not always
obtain all of their orders that they have requested. The General Manager of Bread Factory A
agreed a.ith this, but highlighted that customers almost always receive the orders that they
have requested. It is then the driver's responsibility to assign volumes to customers.
The Financial Manager of Bread Factory A indicated that the personnel at the dispatching
function obtain a list of allocated volumes per delivery vehicle. It is their responsibility to
ensure that the actual dispatched volumes correspond with the list of allocated volumes. Once
the delivery truck is loaded and the driver has counted and checked the dispatched volumes,
both the driver and the responsible dispatcher sign the dispatch document.
The Financial Manager of Bread Factory A highlighted that after the deliveries have been
completed. the driver returns to Bread Factory A. If it has returns (paragraph 6.2.4.5, page
81), the dispatcher counts and checks the returns back into inventory.
According to the Financial Manager of Bread Factory A, a dispatch summary is kept
manually by the dispatching unit and electronicallj by the accounting staff. The Financial

Manager checks the dispatch summary daily. Any discrepancies are investigated and
resolved daily.
6.2.5.3 Write-offs
Both the General Manager and Financial Manager of Bread Factory A agreed that write-offs
of bread occur frequently due to the nature of the product. When it is very warm, the write-
offs increase dramatically. Bread cannot be kept fresh for too long and customers will not
accept bread that is not up to standard.
According to the Financial Manager of Bread Factory A, the reasons for write-offs are:
Bread gets squashed during loading or off-loading;
customers take less bread than what they ordered; or
over-supply of bread.
The General Manager and Financial Manager agreed that it is crucial that Bread Factory A
keeps write-offs as low as possible. because bread that is written off means lost profit.
Management of Bread Factory A controls write-offs very tightly and the Financial Manager
checks and signs off this figure daily.
According to the Financial Manager of Bread Factory A. a calculation is performed weekly to
determine whether the quantity of write-offs is acceptable or not. The Financial Manager of
Bread F a c t o ~ A has explained the calculation. The calculation is described below.
1. Calculate the number of loaves produced based on a 65 kg bag of flour:
Produced = transferred from production to dispatch +difference between opening and closing
inventory of bread in Bread Factory A
2. Calculate the number of loaves sold based on a 65 kg bag of flour
The production volume and the sales volume are actual volumes. and the flour used is the
actual flour used during production.

The difference between 1 and 2 is calculated. According to the Financial Manager o f Bread
Factory A, the management o f Bread Factory A has set a monthly target for the difference.
The result o f the calculation is compared with the actual target in order to measure the
operational performance o f Bread Factory A and to determine whether write-offs are o f an
acceptable level.
6.2.5.4 Inventory control
Inventory control in Bread Factory A is crucial. According to the Financial Manager of
Bread Factory A, the dispatch summary i s kept to keep track o f the movement o f bread in and
out o f Bread Factory A. The Financial Manager indicated that Bread Factory A uses a first-
in-first-out (FIFO) inventory valuation method. The actual movement o f bread is recorded on
the dispatch summary, one can therefore refer to this as "book" stock. The dispatch summary
calculates what the actual inventory should be in the factory. This book stock figure i s then
compared with the actual physical stock inside the factoq. According to the Financial
Manager o f Bread Factory A, discrepancies between the book stock and physical stock can be
due to:
Errors during dispatching:
wrong sales volumes recorded and captured;
wrong returns recorded and captured; and
thefi.
The Financial Manager o f Bread Factory A highlighted that the management o f Bread Factory
A has prepared an incentive scheme for the dispatching unit. If the discrepancies betueen the
book stock and physical stock for a four or five week period are below a certain number o f
loaves, a cash reward is given to the employees o f the dispatching unit. According to the
Financial Manager o f Bread Factory A. this incentive scheme seems to be working well.
The book stock and physical stock are compared daily and checked by the Financial Manager.
The Financial Manager highlighted that discrepancies are investigated and resolved daily.

6.2.6 Costs
According to the Financial Manager of Bread Factory A, expenses in the profit and loss
statement consist of production expenses, distribution expenses, selling expenses,
administration expenses and depreciation.
6.2.6.1 Production costs
The Financial Manager highlighted that the production expenses include indirect expenses
(refer paragraph 2.2.1. page 13) such as the fuel that the ovens consume, laundry and
cleaning, repairs and maintenance, water and electricity, salaries and wages and depreciation
of the plant, ovens and tools. According to the profit and loss statement of Bread Factory A,
production expenses for the past financial year amounted to 28% of the controllable expenses
of Bread Factory A and 10% of total sales income.
Each of these expenses will now be discussed in detail
Oven fuel
According to the General Manager of Bread Factory A, the ovens that are used to bake the
bread consume fuel. This fuel can only be purchased from one supplier and it is expensive.
Both the General Manager and the Financial Manager of Bread Factory A indicated that the
fuel the oven uses increases when production increases.
Laundry and cleaning
The Financial Manager indicated that expenses are incurred to keep Bread Factory A clean
and according to the standards of general health and safety that they have to adhere to.
Laundry and cleaning expenses include general cleaning supplies that are used in the factory
as well as the wages paid to cleaning staff. Laundry and cleaning wages are also paid to staff
that works through a labour broker. These laundry and cleaning wages are referred to as
outsourced laundry and cleaning wages.

Repairs of the building
Repairs and maintenance expenses are incurred in order to maintain the factory in a decent
operational condition. According to the Financial Manager of Bread Factorq A, the building
repairs and maintenance expenses are split into material and outwork and wages. The
material and outwork expenses consist of expenses such as light bulbs, locks for new doors,
new doors, etc. The Hages paid for repairs occur on an ad-hoc basis to contracted staff.
Power
The General Manager and the Financial Manager of Bread Factory A have explained that the
power costs at Bread Factory A are calculated by the power supplier as follows:
Bread Factory A has a contract with the power supplier that a fixed lower rate is paid for a set
power usage before eight in the morning. If the power usage increases to above a set certain
level, a higher rate is charged. When a delivery truck off-loads flour into the flour container.
the delivery truck uses high levels of power. If the delivery truck off-loads after eight in the
morning, the power usage increases to above the set level. and a higher rate is charged by the
power supplier. This higher rate is then charged by the power supplier to Bread Factory A for
the rest of the month.
Water
According to the Financial Manager of Bread Factory A, the water expense consists of
general water usage in the factory including cleaning, drinking water, sanitary usage and then
water is also used in the production process. Water is used as an ingredient for baking bread.
The water expense annually amounts to less than 1% of the total production expenses,
according to the profit and loss statement of Bread Factory A.
Protective clothing
The protective clothing expense is expenses relating to staff uniforms as indicated by the
Financial Manager of Bread Factory A. Staff members receive a uniform once a year.

Repairs plant
The repairs and maintenance cost is split in the profit and loss statement into material and
outwork cost. rebuilding cost and wages paid for repairs and maintenance performed. The
material costs of repairs and maintenance on the plant occur on an ad-hoc basis according to
the Financial Manager of Bread Factory A. There is a correlation with the production
volumes. but it will be very difficult to determine the correlation. Repairs and maintenance
cost on the plant would increase *hen production increases due to more wear and tear on the
plant. Equipment might suffer a breakdown three months after Bread Factory A had to
temporarily increase production due to a competitor's strike for example.
The Financial Manager of Bread Factory A indicated that a provision is created monthly for
rebuilding costs that might occur. Once rebuilding occurs, the difference between the
provision and the actual costs are expensed in the profit and loss statement of Bread Factory
A . The wages paid for repairs performed on the building occur on an ad-hoc basis.
Production salaries
The Financial Manager indicated that fixed salaries are paid to certain production staff.
Production wages
The Financial Manager highlighted that production wages are paid at a fixed rate per hour to
certain production staff. When production increases, the total production wages would
increase. Staff earns different rates per hour and overtime rates are also paid. Production
wages annually amount to 7% of the controllable expenses of Bread Factory A.
Wrapping wages
According to the Financial Manager these wages are paid to staff responsible in the
production process for wrapping of the bread.
Vehicle operating costs
The Financial Manager of Bread Factory A indicated vehicle operating cost can occur in the
production expenses as well as in the distribution expenses. The vehicle operating cost

occurring in the production expenses relates to costs to maintain other vehicles, not delivery
vehicles, used by Bread Factory A. These costs include general maintenance costs on other
vehicles.
Technical fees
Bread Factory A has to comply with regulations on health and safety, according to the
Financial Manager of Bread Factory A. Technical fees are paid to a specialist that assists in
the inspections to ensure that they comply. Other technical fees are paid to a specialist that
assists Bread Factory A when they have a problem with the bread recipes. If the texture of
the bread changes suddenly, this specialist assists in resolving the problem with the recipe.
These expenses occur on an ad-hoc basis and a provision is created by Bread Factory A to
reduce the impact of the expense on a monthly basis. If the actual expense is more than the
provision, the difference nil1 be expensed in the profit and loss statement of Bread Factory A
when it occurs. If the actual expense is less than the provision. the provision will be reversed
and the expense reduced when the actual expense is incurred.
6.2.6.2 Distribution costs
According to the Financial Manager of Bread Factory A, customers do not pay additional fees
for deliveries these expenses are carried solely hy Bread Factory A. Distribution cost
formed 52% of the controllable expenses of Bread Factory A for the last financial year and
19% compared to total sales income, according to the profit and loss statement of Bread
Factory A. It is therefore essential that the distribution costs be controlled as tightly as
possible. Any reduction in the distribution costs will increase profit.
According to the Financial Manager of Bread Factory A, the distribution cost expenses
include bread and confectionery boxes, protective clothing, deliverq wages, dispatch salaries.
drivers' commission, outsource costs of drivers and dispatchers and vehicle operating costs.
First some clarification on the delivery process of bread at Bread Factory A
Delivery vehicles
According to the General Manager, Bread Factory A owns the 47 delivery vehicles that they
use for deliveries. The capacity of the delivery vehicles differs from a capacity of 160 baskets
to 670 baskets. A basket can carry eight to ten loaves. Each delivery vehicle is assigned to a

specific driver and a specific delivery route. The reasoning behind this is that each driver is
responsible for the general condition of the delivery vehicle. The dedicated driver is
responsible for the vehicle. They have to adhere to service intervals and report general
maintenance requirements. The driver is held fully responsible for abuse of the vehicle.
Both the General Manager and Financial Manager of Bread Factory A agreed that the
maintenance on the deliver) vehicles is outsourced. A fixed fee per hilometre travelled is
paid to a contractor. The contracted party is responsible for the following:
Servicing of the delivery vehicles;
attending to breakdowns on the road; and
replacement of broken delivery vehicle parts caused by general &ear and tear on the
delivery vehicles.
The General Manager highlighted that the contracted party used to be responsible for the
diesel that the deliven vehicles consumed and the delivep \chicles‘ tyres. but since
September 2006 the contract has been changed to exclude diesel and tyres. A reduced fee per
kilometre has been negotiated.
Delivery routes
The General Manager of Bread Factory A indicated that delivery routes of bread have been
developed over a period of time based on the logistics of customers. A GPS (Global
Positioning System) map has been drawn up for each delivery route. The kilometres travelled
on that route will be different each day because not all customers are serviced daily. One day
the kilometres travelled on the route might be 50 and the next day it might be 60.
Each delivery vehicle is assigned to a specific route according to the General Manager of
Bread Factory A. The reason being that the capacity of the delivery vehicle must compare
with the sales volumes usually delivered on that route. Another reason is that the driver of
that specific delivery vehicle is also the sales representative for that delivery route. The
driver knows the customers and has a relationship with them. The General Manager insisted
that it would be a foolish marketing decision to change drivers every no\v and again.
According to the General Manager. Bread Factor). A has the following options when a
delively route is not profitable:

Closing the distribution route and servicing the customers by adjusting current
distribution routes to incorporate the customers previously serviced by the closed route;
or
0 increase sales volumes on that distribution route to make the route profitable; or
0 closing a distribution route and losing the customers altogether.
Drivers' commission
Both the General Manager and Financial Manager of Bread Factory A agreed that the
management of Bread Factory A has developed a drivers' incentive scheme whereby drivers
earn commission based on the sales volumes of their delivery route. The more loaves the
driver sells the higher his or her commission will be. This is also a way to try and reduce the
returns. because the driver does not earn commission on returns.
Bread and confectionery boxes
The Financial Manager of Bread Factory A indicated that the bread and confectionery boxes
refer to the plastic baskets in which the bread and confectionery are loaded to prevent them
from squashing when they are transported to customers. These baskets are purchased as and
when they are hroken or stolen. The expense is immediately recognised in the profit and loss
statement. No inventory is kept of these baskets, because the baskets do not last very long.
New baskets are purchased monthly.
Protective clothing
The protective clothing expense comprises the uniforms that the sales staff (drivers and van
assistants) wears i.e. shirts, pants and hats, according to the Financial Manager of Bread
Factory A.
Delivery wages
Each delivery vehicle has an allocated driver and van assistant, according to both the General
Manager and Financial Manager of Bread Factory A. The same driver and the same van
assistant are always responsible for the same route. It is imperative that the combination of
the driver. van assistant and delivery route stays constant in order to maintain the marketing
strategy that Bread Factory A is following.

The driver's commission will be discussed in the paragraph following dispatch salaries
(page 92). The expenses allocated to delivery wages are the wages of the van assistants. The
van assistants receive a fixed wage per day. The only exception is that when the driver of the
route is on leave, the van assistant qualifies for an additional fixed cents per loaf calculated on
the delivered sales volumes of the delivery route. The drivers have three weeks leave out of a
possible 52-week year. The reason for the additional commission paid to the van assistant is
to compensate them for maintaining the customer relationships while the driver is on leave.
The commission paid to the van assistants also form part of the delivery wages expense.
Dispatch salaries
According to the Financial Manager of Bread Factory A, the dispatch salaries expense
comprises the salaries of the dispatch supervisors. The dispatch supervisors receive a fixed
salary per month whether 1 000 loaves have been dispatched or 10 000 loaves.
Driven' commission
The drivcrs' remuneration is based on an incentive scheme developed by Bread Factory A
whereby drivers earn commission based on the sales volumes of their delivery route. The
more loaves the driver sells the higher his or her commission will be. The commission is
calculated based on a fixed cent per loaf of bread sold. There is however a fixed minimum
salary that a driver can earn. When the commission is more than the minimum salary, the
driver earns only commission, hut when the commission is less than the minimum salary, he
a r she mould earn the minimum salary. Most of the drivers earn more than the basic salary
and an assumption will therefore he made that the drivers' commission is only commission.
Example 6.1: Calculation of drivers' commission
The minimnm salary is, for example. set at a Rl 000 per month. The driver earns commission
of say RO.10 per loaf sold. He sells 12 000 loaves for the month. His commission would be
calculated at 12 000 loaves x RO.10 = Rl 200 for the month. The minimum salary is set at
Rl 000. He would therefore earn RI 200 for the month.
Source: (Researcher)

0 Outsource cost of drivers
The cost of outsourcing of drivers is exactly the same in nature as drivers' commission cost
(paragraph 6.2.6.2, page 90). The only difference is that these drivers work through a labour
broker.
Outsource cost of dispatchers
The outsource cost of dispatchers consists of the salaries paid to the loader and dispatching
clerks. The loader and dispatching clerks earn a fixed salary per month. The dispatchers are
responsible to load all the delivery vehicles irrespective of the delivery route.
Vehicle operating costs
Both the General Manager and Financial Manager of Bread Factory A agreed that vehicle
operating costs consist of the maintenance cost paid to an outsourced contracted party
responsible for the maintenance of the delivery vehicles, the cost of repairs of delivery
vehicles that Bread Factory A is responsible for, insurance and licenses.
A fixed fee per kilometre travelled is paid to the contractor. The contracted party is
responsible for the following:
Servicing ofthe delivety vehicles:
attending to breakdowns on the road; and
replacement of broken delivery vehicle parts caused by general wear and tear on the
delivery vehicles.
The contracted party used to be responsible for the diesel that the delivery vehicles consumed
and the delivery vehicles' y e s . but since September 2006 the contract has been changed to
exclude diesel and tyres. A reduced fee per kilometre has been negotiated.
Bread Factory A is responsible for the following:
Replacement of broken delivery vehicle parts not caused by general wear and tear;
tyres (since September 2006):
diesel (since September 2006);
licensing fees: and
insurance.

6.2.6.3 Selling costs
According to the Financial Manager the selling expenses include promotion costs and salaries
and wages.
6.2.6.4 Administration costs
The Financial Manager of Bread Factory A highlighted that administration expenses include
expenses such as salaries and wages of administrative personnel, bank charges, computer
expenses, insurance, office equipment expenses, security, staff refreshments, telephone, etc.
6.2.6.5 Depreciation
The Financial Manager of Bread Factory A stated that depreciation is calculated on each
delive~? vehicle in order to compensate for near and tear on the deliven vehicles.
Depreciation per delivery vehicle is calculated using the straight-line method over a period of
seven years. The initial purchase price is used as a basis for the calculation of depreciation.
The General Manager of Bread Factory A highlighted that depreciation should be ignored in
the calculation of the delivery route contribution, because depreciation is a non-cash item and
an irrelevant cost (paragraph 2.3.8, page 21) because the cost does not change when a
delivery route is closed.
This concludes the information obtained during the interviews conducted
6.3 ANALYSIS O F EACH COST ITEM IN DETERMINATION O F DELIVERY
ROUTE CONTRlBUTION
The general ob.jective of this study (paragraph 1.3.1, page 6) is to determine the financial
viability of Bread Factory A's delivery routes. This can be determined by calculating a
delivery route segment margin (paragraph 2.4.1.1. page 23) detailing the contribution
margin (paragraph 2.4, page 21). This will be accomplished by preparing a segmented
income statement (paragraph 2.4.1 . I , page 23) (ob.jective 1.3.2.5, page 6). A delivery route
is regarded as a segment (paragraph 2.4.1 . l , page 23). The use of the delivery route segment
margin will enable the management of Bread Factory A to make decisions regarding the
financial viability of a delivery route.

In order to prepare a segmented income statement, it is necessary to analyse each of the cost
items to determine its cost behaviour, traceability and relevance to the decision (objective
1.3.2.4. page 6).
The following cost items, based on costs indicated in the profit and loss statement of Bread
Factory A, should be analysed to determine whether it should be taken into account in the
calculation of the delivery route profitability:
Production costs (paragraph 6.2.6.1, page 86);
distribution costs (paragraph 6.2.6.2, page 89);
selling costs (paragraph 6.2.6.3, page 94); and
administrative costs (paragraph 6.2.6.4, page 94)
I n order to achieve the specific research ob.ject~ve 1.3.2.4 (page 6). these costs u ~ l l be
analysed and classified in terms of their:
Behaviour: variable costs (paragraph 2.3.1, page 15). fixed costs (paragraph 2.3.2. page
16). semi-variable costs (paragraph 2.3.3, page 18) and semi-fixed costs (paragraph 2.3.4,
page 18).
Traceubili~y: direct and indirect costs (paragraph 2.2.1, page 13).
Relevancr relevant and irrelevant costs (paragraph 2.3.8, page 21) and traceable fixed
costs or common fixed costs (paragraph 2.4.1.1, page 23).
Costs that are relevant to the decision to close a segment will be included as part of the
delivery segment margin. Therefore only variable costs and traceable fixed costs will be
relevant costs.
Each cost will now be discussed and classified based on the above-mentioned criteria.
6.3.1 Production costs
Manufacturing costs include direct materials, direct labour and manufacturing overheads
(paragraph 2.3.6, page 19). Direct materials and direct labour are usually classified as direct
costs, while manufacturing overheads are indirect costs (paragraph 2.2.1, page 13).

Bread Factory A classifies all production costs as indirect costs and do not assign these costs
as manufacturing costs. Bread Factory A refers to production cost as manufacturing cost.
These production costs are manufacturing overheads and should be analysed to determine
whether these costs are fixed or variable costs. If production costs are variable, these costs
should be included as pan of the delivery route contribution margin. The fixed production
costs should then be classified as either traceable fixed cost or common fixed cost
(paragraph 2.4.1 .I, page 23) as prescribed by the segment reporting approach (paragraph
2.4.1.1, page 23). When all the traceable fixed costs have been deducted from the
contribution margin, the result will be a delivery route segment margin (paragraph 2.4.1 .I,
page 23).
The production costs consist of oven fuel, laundrj arid cleaning, repairs and maintenance of
the building. power, water, protective clothing, repairs and maintenance of the plant,
production salaries and wages. wrapping wages. vehicle operating costs and technical fees.
Each cost will now be discussed in dctail to determine whether it is a variable (paragraph
2.3.1, page 15) or fixed cost (paragraph 2.3.2, page 16). If it is a fixed cost_ the fixed costs
should be classified as either traceable or common fixed cost (paragraph 2.4.1.1, page 23).
6.3.1.1 Oven fuel
The oven fuel (paragraph 6.2.6.1, page 86) can be classified as a variable cost and the
allocation base (paragraph 2.2.2. page 14) to use to assign the total cost to the cost objects is
the total sales volume. The reason is the more bread Bread Factory A bakes, the higher the
fuel consumption.
6.3.1.2 Laundry and cleaning
These costs (paragraph 6.2.6.1. page 86) can be classified as a common fixed costs because it
cannot be traced directly to the segment and are fixed costs incurred to support the operations
of more than one segment in the organisation (paragraph 2.4.1, page 22).
6.3.1.3 Repairs building
These costs (paragraph 6.2.6.1, page 87) are incurred on an ad-hoc basis and can be classified
as a common fixed cost because it cannot be traced directly to the segment, and are fixed
costs incurred to support the operations of more than one segment in the organisation
(paragraph 2.4.1. page 27).

6.3.1.4 Power
The cost of power (paragraph 6.2.6.1, page 87) in Bread Factory A cannot be classified as a
semi-variable cost (paragraph 2.3.3, page 18) as it is generally done due to the nature of the
cost (paragraph 6.2.6.1, page 87). The delivery of the flour affects the power usage more than
the manufacturing process. Power costs cannot be classified as a variable cost either. The
researcher therefore classified it as a common fixed cost, because it cannot be traced directly
to the segment and will still be incurred ifthe segment closes.
6.3.1.5 Water
Due to the mater cost (paragraph 6.2.6.1, page 87) being insignificantly small, and the
difficulty to obtain a relevant allocation base to assign the variable portion, the researcher
classified the water cost as a common fixed cost.
6.3.1.6 Protective clothing
The cost of the uniforms (paragraph 6.2.6.1, page 87) can be classified as a common fixed
cost because it cannot be traced directly to the segment and is fixed costs incurred to support
the operations of more than one segment in the organisation (paragraph 2.4.1,
page 22).
6.3.1.7 Repairs plant
All the costs relating to repairs of the plant (paragraph 6.2.6.1, page 88) are classified as a
common fixed cost because it cannot be traced directly to the segment and are fixed costs
incurred to support the operations of more than one segment in the organisation (paragraph
2.4.l_ page 23).
6.3.1.8 Production - Salaries
The salaries paid to production staff (paragraph 6.2.6.1, page 88) can be classified as a
common fixed cost because the cost will still exist even if a segment closes.
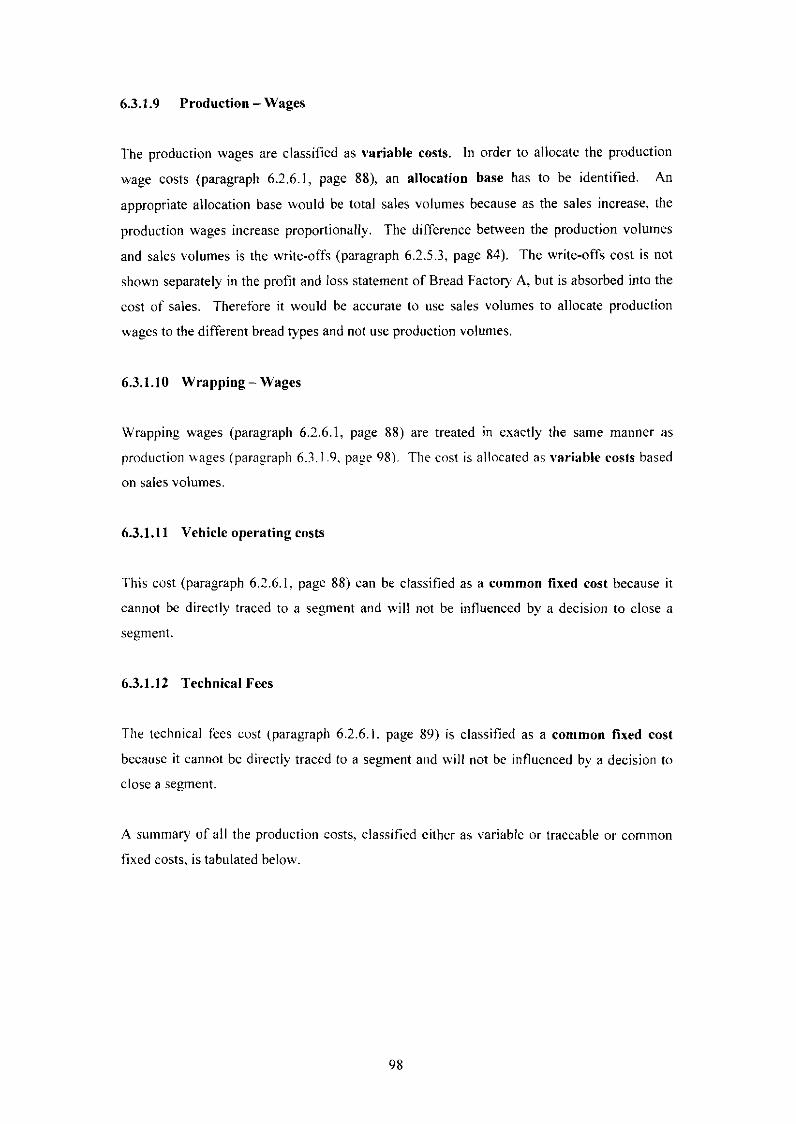
6.3.1.9 Production -Wages
The production wages are classitied as variable costs. In order to allocate the production
wage costs (paragraph 6.2.6.1, page 88), an allocation base has to be identified. An
appropriate allocation base would be total sales volumes because as the sales increase, the
production wages increase proportionally. The difference between the production volumes
and sales volumes is the write-offs (paragraph 6.2.5.3, page 84). The write-offs cost is not
shown separately in the profit and loss statement of Bread Factory A, but is absorbed into the
cost of sales. Therefore it would be accurate to use sales volumes to allocate production
wages to the different bread types and not use production volun~es.
6.3.1.10 Wrapping - Wages
Wrapping wages (paragraph 6.1.6.1, page 88) are treated in exactly the same manner as
production uages (parqrapli 6.3.1.9. page 98). The cost is allocated as variable costs based
on sales volumes.
6.3.1.11 Vehicle operating costs
This cost (paragraph 6.2.6.1. page 88) can be classified as a common fixed cost because it
cannot be directly traced to a segment and will not be influenced by a decision to close a
segment.
6.3.1.12 Technical Fees
The technical fees cost (paragraph 6.2.6.1. page 89) is classified as a common fixed cost
because it cannot be directly traced to a segment and will not be influenced by a decision to
close a segment.
A summary of all the production costs, classified either as variable or traceable or common
fixed costs. is tabulated below.

Table 6.1 Classification of Bread Factory A's production costs
Repairs building
Cost
6.3.2 Distribution costs
The distribution costs in the profit and loss statement include bread and confectionery boxes.
protective clothing, delivery wapes, dispatch salaries. drivers commission, outsource costs of
drivers and dispatchers and vehicle operating costs.
Indirect
Each cost will now be discussed in detail in order to determine its cost behaviour, traceability
and relevance (refer to paragraph 6.3. page 94). In determining traceability (direct and
indirect costs) reference is made to the cost object (paragraph 2.2, page 13). Specific
objective 1.3.2.5 (page 6) requires separate cost data for the delivery routes and therefore the
cost object is a delivery route.
6.3.2.1 Bread and confectionery boxes
Irrelevant Common
fixed
Relevant
The cost of bread and confectionery boxes (paragaph 6.2.6.2, page 91) can be attributed to
the distribution cost, but it cannot be directly attributed to the cost object in a cost-effective
way. The cost is therefore an indirect cost.
Variable
cost
Traceable
fixed

The cost of bread and confectionery boxes is not a variable cost because the total costs do
not increase proportionally when the activity level increases. There are too many factors
other than sales volume that have an influence, such as handling, climate, routes travelled, etc.
It is, however, relevant to the decision because the total costs of bread and confectionery
boxes will change when a deliver). route closes. Its behaviour will therefore be classified as
traceable fixed cost, because it can be traced to the delivery function although not to a
specific delivery route. A predetermined fixed overhead rate (paragraph 2.5.3.4, page 32)
will be calculated using annual total sales volume as an allocation
base (paragraph 2.2.2, page 14).
6.3.2.2 Protective clothing
The cost of these clothes (paragraph 6.2.6.2, page 91) cannot be directly attributed to the cost
object in a cost-effective way and is therefore classified as indirect cost.
Protective clothing cost is not a variable cost because the total cost does not increase
proportionally when the activity level increases. For purposes of the delivery route
profitability calculation, the behaviour of this cost is relevant because the cost will be
reduced if a segment closes due to the fact that there will be a reduction in staff. Its behaviour
will therefore be classitied as a traceable fixed cost. A predetermined fixed overhead rate
(paragraph 2.5.3.4, page 32) will be calculated using annual total sales volume as an
allocation base (paragraph 2.2.2, page 14).
6.3.2.3 Delivery wages
The cost of delivery wages (paragraph 6.2.6.2, page 91) is directly attributable to a specific
delivery route and can therefore be assigned to the cost object in a cost-effective way. The
cost will therefore be classified as a direct cost.
The cost is a relevant cost because the cost will change if the deliveries do not take place
The cost of the delivery wages is a fixed cost, except for the three week period that the
drivers are on leave. then the cost changes to a combination of fixed and variable cost. Due
to the small portion variable cost, the researcher classified the delivery wages as a traceable
fixed cost (paragraph 2.4. I . I, page 23).
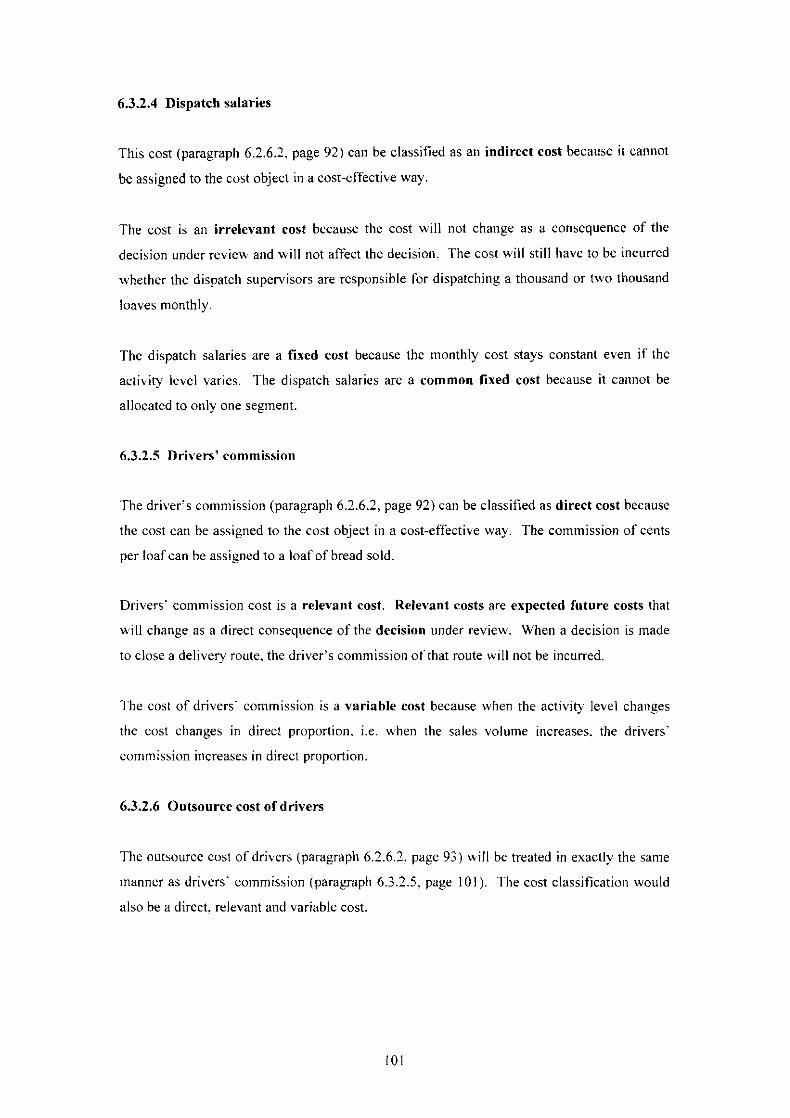
6.3.2.4 Dispatch salaries
This cost (paragraph 6.2.6.2. page 92) can be classified as an indirect cost because it cannot
be assigned to the cost object in a cost-effective way.
The cost is an irrelevant cost because the cost will not change as a consequence of the
decision under review and will not affect the decision. The cost will still have to be incurred
whether the dispatch supervisors are responsible for dispatching a thousand or hvo thousand
loaves monthly.
The dispatch salaries are a fixed cost because the monthly cost stays constant even if the
activity level varies. The dispatch salaries are a common fixed cost because it cannot be
allocated to only one segment.
6.3.2.5 Drivers' commission
The driver's commission (paragraph 6.2.6.2, page 92) can be classified as direct cost because
the cost can be assigned to the cost object in a cost-effective way. The commission of cents
per loaf can be assigned to a loaf of bread sold.
Drivers' commission cost is a relevant cost. Relevant costs are expected future costs that
will change as a direct consequence of the decision under review. When a decision is made
to close a delivery route, the driver's commission of that route will not be incurred.
The cost of drivers' commission is a variable cost because when the activity level chanees
the cost changes in direct proportion. i.e. when the sales volume increases. the drivers'
commission increases in direct proportion.
6.3.2.6 Outsource cost of drivers
The outsource cost of drlvers (paragraph 6.2.6.2, page 93) \%il l be treated in exactly the same
manner as drivers' colnmiss~on (paragraph 6.3.2.5. page 101). The cost classification would
also be a direct. relevant and variable cost.
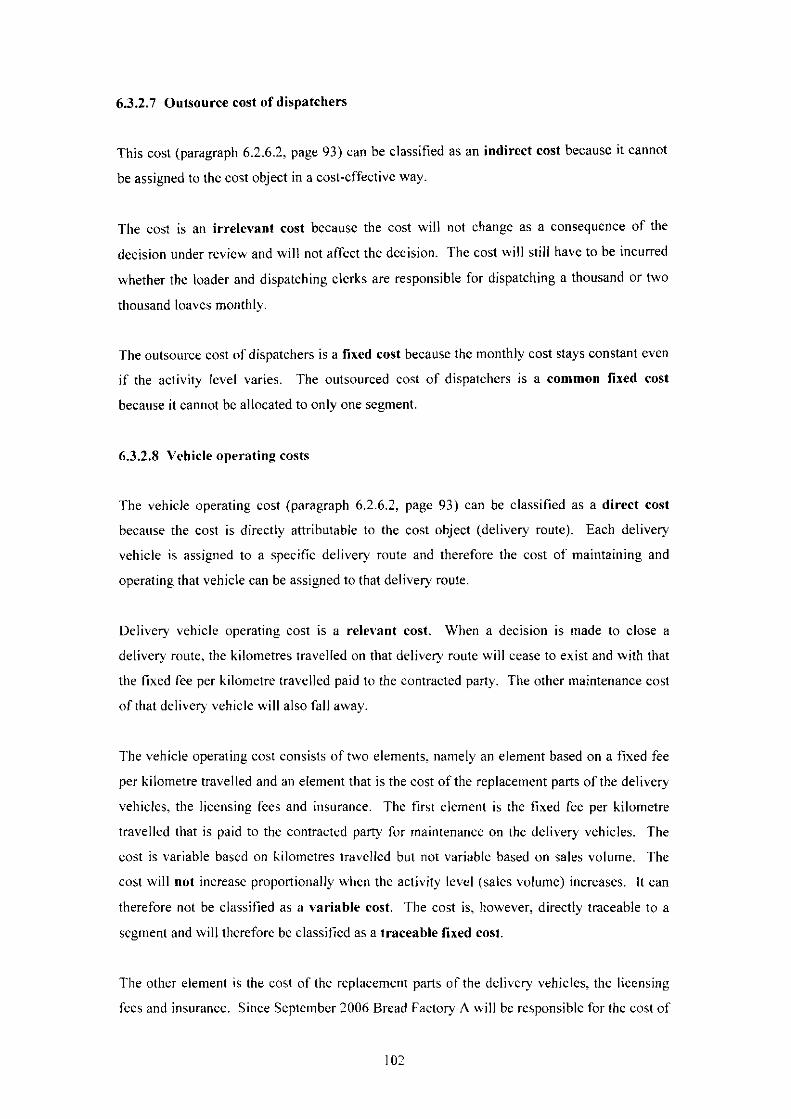
6.3.2.7 Outsource cost of dispatchers
This cost (paragraph 6.2.6.2, page 93) can be classified as an indirect cost because it cannot
be assigned to the cost object in a cost-effective way.
The cost is an irrelevant cost because the cost will not change as a consequence of the
decision under review and will not affect the decision. The cost will still have to be incurred
whether the loader and dispatching clerks are responsible for dispatching a thousand or two
thousand loaves monthly.
The outsource cost of dispatchers is a fixed cost because the monthly cost stays constant even
if the activity level varies. The outsourced cost of dispatchers is a common fixed cost
because it cannot be allocated to only one segment.
6.3.2.8 Vehicle operating costs
The vehicle operating cost (paragraph 6.2.6.2, page 93) can be classified as a direct cost
because the cost is directly attributable to the cost object (delivery route). Each delivery
vehicle is assigned to a specific delivery route and therefore the cost of maintaining and
operating that vehicle can be assigned to that delivery route.
Delivery vehicle operating cost is a relevant cost. When a decision is made to close a
delivery route, the kilometres travelled on that delivery route will cease to exist and with that
the fixed fee per kilometre travelled paid to the contracted party. The other maintenance cost
of that deliver! vehicle will also fall away.
The vehicle operating cost consists of two elements. namely an element based on a fixed fee
per kilometre travelled and an element that is the cost of the replacement parts of the delivery
vehicles, the licensing fees and insurance. The first element is the fixed fee per kilometre
travelled that is paid to the contracted p a m for maintenance on the delivery vehicles. The
cost is variable based on kilometres travelled but not variable based on sales volume. The
cost will not increase proportionally when the activity level (sales volume) increases. It can
therefore not be classified as a variable cost. The cost is, however, directly traceable to a
segment and will therefore be classitied as a traceable lixed cost.
The other element is the cost of the replacement parts of the delivery vehicles, the licensing
fees and insurance. Since September 2006 Bread Factory A will be responsible for the cost of

diesel and tyres of the delivery vehicles and these costs will not form part of the fixed rate
payable to the contractor. The researcher classified the second element of the vehicle
operating costs as traceable fixed costs because it is directly attributable to a specific vehicle
that travels a specific delivery route and therefore a to specific segment.
A summary of the cost behaviour, traceability and relevance of the distribution costs is
tabulated in table 6.2.
Table 6.2: Summary of the cost behaviour, traceability and relevance of distribution
costs
Drivers' commiss
Abbreviations: Dir: Ind: VC: Tr: Co: Rel: Irrel:
6.3.3 Selling costs
Direct cost Indirect cost Variable cost Traceable f i ~ e d cost Common tixed cost Relevant cost Irrelevant cost
Selling costs (paragraph 6.2.6.3, page 94) include promotional costs and salaries and wages.
These costs are indirect costs and irrelevant to the decision. Selling costs are classified as a
common fixed cost.

6.3.4 Administrative costs
Administrative costs (paragraph 6.2.6.4, page 94) are handled in exactly the same manner as
selling expenses, i.e. it is treated as a common fired cost.
This concludes the analysis of each cost item to determine its cost behaviour. traceability and
relevance in the calculation of the delivery route profitability.
6.4 CALCULATION OF DELIVERY ROUTE CONTRIBUTION
In order to achie\.e the specific research objective (paragraph 1.3.2.5_ page 6) the delivery
route profitability using the segment reporting approach (paragraph 2.4.1, page 22), will now
be calculated by the researcher. 4 Microsoft Excel model (appendix 2, page 141) will be
developed hy the researcher and provided to Bread Factory A for fnture calculation of a
delivery route segment margin per delivery route.
This will be achieved by referring to the literature discussed in chapter 2 (page 12). A
delivery route at Bread Factory A can be classified as a segment (paragraph 2.4.1, page 22).
A segmented income statement (paragraph 2.4.1.1, page 23), detailing the contribution
margin (paragraph 2.4, page 2 I) and a deliverj route segment margin (paragraph 2.4.1.1.
page 23) are therefore the projected end result. The cost behaviour, traceability and relevancy
of the costs as determined in paragraph 6.3 (page 94) will be used to compile the segmented
income statement. The delivery route segment margin is the result of the accurate
measurement and allocation of the distribution costs. The financial viability of the delivery
routes can therefore be determined which will lead to the optimisation of delivery routes
(refer hypothesis. page 7).
When applying this theory to Bread Factory A's delivery routes_ the calculation should be
performed as follows:
The income that is generated by a delivery route less:
the variable manufacturing cost of the sales volumes sold on that particular delivery
route. and
0 the variable distribution costs to service that delivery route.

The result will be a delivery route contribution margin. The traceable fixed costs should
then be deducted from the delivery route contribution margin to calculate the delivery route
segment margin.
The use of the delivery route segment margin will enable the management of Bread Factory
A to make decisions regarding the viability of a delivery route (paragraph 6.3, page 94).
The delivery route segment margin per delivery route is required by management on a weekly
basis. For purposes of internal reporting. a week starts on Saturday and ends on the following
Friday. The researcher has used the same classification of a week. starting on a Saturday and
ending on the following Friday and performed the calculation of a segment margin based on a
four-week month information. The result will be a delivery segment margin per one month.
Each of the items used by Bread Factory A in the calculation will now be discussed in detail.
6.4.1 Sales
For purposes of the delivery route profitability calculation, only the outside group sales
volumes (paragraph 6.2.4.1, page 80) and intergroup sales volumes
(paragraph 6.2.4.2, page 80) are considered. The intergroup purchases sold and sales of
factored goods and stales sales volumes are negligible (paragraph 6.2.4.3 to 6.2.4.4, page 81).
The sales volumes are split per different classification of bread (paragraph 6.2.4, page 79).
The income generated by a delivery route will be calculated by multiplying the actual sales
volumes per different type of bread with the current selling price of the same type of bread
(paragraph 6.2.4, page 79).
Discounts (paragraph 6.2.4.6. page 81) granted on sales are the actual discounts per delivery
route as per the financial accounting systems. Discounts are directly deducted from sales to
obtain a net sales figure.
6.4.2 Cost of sales
The cost of sales comprises the cost of raw materials, cost of factored goods and cost of inter-
group purchases (paragraph 6.2.5. page 82).

6.4.2.1 Cost of raw materials
The cost o f raw materials comprises the cost o f flour, other ingredients and wrapping
(paragraph 6.2.5.1, page 82). Inventor); o f flour, the other ingredients and wrapping i s kept
by Bread Factory A. Bread Factory A uses a first-in-first-out (FIFO) inventory valuation
method (paragraph 6.2.5.4, page 8 5 ) . This method issues inventory in the order in which i t i s
received, meaning the oldest inventory i s the first to be used (Niemand er al., 2004:45; Uliana
& Marcus, 1990:38). The cost of raw material figures, i n volume and monetary value. for
the raw materials inventory i s calculated monthly by Bread Factory A, using the following
formula:
Beginning inventory + purchases - closing inventory = production usage
The cost o f the raw materials used in production represents the cost of raw materials. The
cost o f rau materials therefore incorporates that which \ \as sold plus any write-offs (refer
paragraph 6.2.5.3, page 84).
The cost of raw materials per unit (loaf o f bread) per classification i s calculated by Bread
Factory A (paragraph 6.2.5, page 82) on a monthly basis. The actual flour, other ingredients
and wrapping costs used to nlanufacture each classification o f bread i n a particular month are
calculated and divided by the total production volume per classification o f bread for that
month.
A simple example to illustrate the calculation o f cost o f raw materials per unit per
classification o f bread i s provided below.
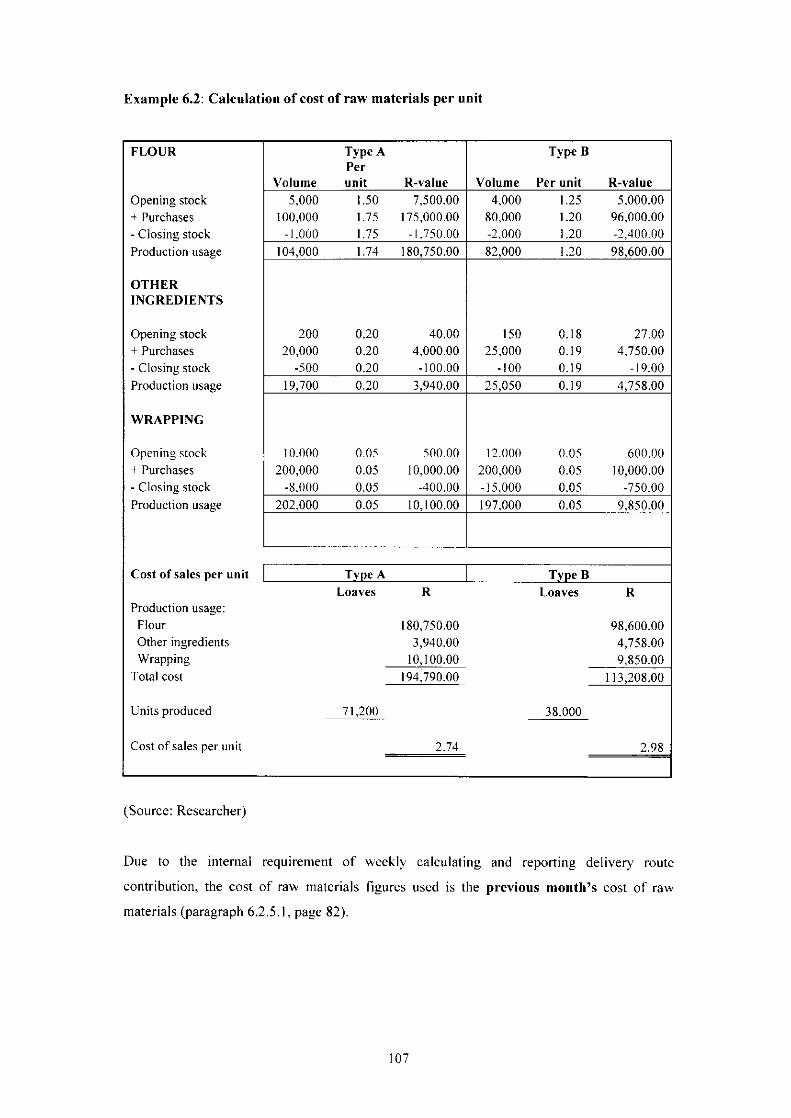
Example 6.2: Calculation of cost of r aw materials per unit
FLOUR
Opening stock + Purchases -Closing stock Production usage
OTHER INGREDIENTS
Opening stock + Purchases -Closing stock Production usage
WRAPPING
Opening stock + Purchases -Closing stock Production usag
Type A Per
Volume unit R-value 5,000 1.50 7,500.00
100,000 1.75 175,000.00
Volume Per unit R-value 4,000 1.25 5,000.00
80,000 1.20 96,000.00
Units produced
Cost of sales per unit
Cost of sales per unit I Type A
(Source: Researcher)
Type B
Due to the internal requirement of weekly calculating and reporting delivery route
contribution, the cost of raw materials figures used is the previous month's cost of raw
materials (paragraph 6.2.5.1. page 82).
Loaves R Loaves R Production usage:
Flour 180,750.00 98,600.00 Other ingredients 3,940.00 4,758.00 Wrapping 10,100.00 9.850.00
Total cost 194,790.00 113,208.00
6.4.2.2 Cost of factored goods
Inventory of factored goods (paragraph 6.2.4.4, page 81) is kept. The cost of the factored
goods is calculated by using the following formula:
Beginning inventory + purchases c l o s i n g inventory = cost of sales
The cost of factored goods is not taken into account in the calculation of the delivery route
contribution. because the profit compared to the bread sales is negligible (paragraph 6.2.4.4,
page 81).
6.4.2.3 Cost of intergroup purchases
Inventory of intergroup purchases (paragraph 6.2.4.3, page 81 ) is kept. The cost of the inter-
group p~~rchases is calculated by nsing the following formula:
Beginning inventory + purchases- closing inventory = cost of sales
The cost of intergroup purchases is not taken into account in the calculation of the deliver!
route contribution, because the profit compared to the bread sales is negligible (paragraph
6.2.4.3, page XI).
6.4.3 Production costs
Production costs are classified as indirect costs (paragraph 6.2.6.1, page 86: paragraph 6.3.1.
page 95). These costs can be divided into variable and traceable fixed costs (paragraph
6.3.1, page 95). According to the literature (paragraph 2.5.3.4, page 32) a predetermined
overhead rate based on the traceable fixed production costs should be calculated.
The allocation base (paragraph 2.2.2. page 14) \?i l l be the sales volumes
The actual figures were adjusted in congruence with the confidentiality agreement with Bread
Factory A. The figures will not be shown in the calculation due to its confidentiality.

Calculation 6.1: Calculation of a predetermined traceable fired production costs rate
(paragraph 2.5.3.4, page 32):
Annual budgeted traceable fixed production costs * Predetermined rate =
Annual budgeted sales volumes
= R0.1538 per unit sold
*The annual budgeted traceable fixed productions costs included in the calculation of the
predetermined rate are:
Laundry and cleaning (paragraph 6.3. I .2, page 96);
repairs building (paragraph 6.3. I .3, page 96);
power (paragraph 6.3.1.4. page 97);
water (paragraph 6.3.1.5. page 97):
protective clothing (paragraph 6.3.1.6, page 97);
repairs plant (paragraph 6.3.1.7, page 97);
production salaries (paragraph 6.3.1.8, page 97);
vehicle operating costs (paragraph 6.3.1 .I 1, page 98);and
technical fees (paragraph 6.3.1.12, page 98).
These budgeted costs were obtained from the profit and loss statement of Bread Factory A
The overhead to be applied to the cost object will be calculated by multiplying the pre-
determined rate with the sales volumes per delivery route (paragraph 2.5.3.4, page 32).
6.4.4 Distribution costs
An analysis of the cost behaviour, traceability and relevancy of distribution costs was
performed and summarised (table 6.2, page 103). The \ariable distribution costs, name11
drivers' commission (paragraph 6.3.2.5, page 101) and outsource cost of drivers (paragraph
6.3.2.6, page 101) were taken into account in calculating the contribution margin.

Vehicle operating costs
The vehicle operating cost (paragraph 6.3.2.8, page 102) can be divided into a fixed rate per
kilometre travelled and a predetermined rate for other expenses that include the
replacement cost of broken delivery vehicle parts not caused by general wear and tear,
licensing fees. insurance. and since September 2006. tyrrs and diesel. For purposes of the
actual calculation of the delivery route segment margin (table 6.2, page 103). the fixed fee
paid to the contractor will still include the tyres and diesel expenses because the fee per
kilometre travelled was only re-negotiated during September 2006. For purposes of the
model (appendix 2, page 141) developed for Bread Factory A, the fixed fee payable to the
contractor excludes diesel and tyres. These costs (diesel and tyres) will be classified as
traceable fixed cost (paragraph 6.3.2.8, page 102). The allocation base (paragraph 2.5.3.4,
page 32) to use is the kilometre$ travelled by the delivery vehicles.
The actual figures were adjusted in coilgruence with the confidentiality agreement with Bread
Factory A.
Calculation 6.2: Calculation of a predetermined other vehicle operating cost rate
(paragraph 2.5.3.4, page 32):
Annual budgeted other vehicle operating costs * Predetermined rate =
Annual budgeted kilometres travelled
= R0.1975 per kilometre travelled
*The annual budgeted traceable fixed other vehicle operating costs included in the calculation
of the predetermined rate are:
Repairs: Mechanical
Repairs: Bodywork
Insurance
Licences
These budgeted costs were obtained from the profit and loss statement of Bread Factory A.
The overhead to be applied to the cost object will be calculated by multiplying the
predetermined rate with the actual kilometres travelled on the delivery route.

Other distribution costs
The other distribution costs, namely breadiconfectionery boxes (paragraph 6.3.2.1, page 99),
protective clothing (paragraph 6.3.2.2, page 100) and delivery wages
(paragraph 6.3.2.3, page 100) are classified as traceable fixed costs.
A predetermined rate (paragraph 2.5.3.4, page 32) should be calculated for the
breadlconfectionerq boxcs (paragraph 6.3.2.1, page 99) and protective clothing (paragraph
6.3.2.2. page 100). The allocation base (paragraph 2.2.2, page 14) to use is the annual sales
volurnes.
The actual figures were adjusted in congruence with the confidentiality agreement with Bread
Factory A. The figures will not be shown in the calculation due to its confidentiality.
Calculation 6.3: Calculation of a predetermined other distribution costs rate (paragraph
2.5.3.4, page 32):
Predetermined rate = Annual budgeted distribution costs *
Annual budgeted sales volumes
= R0.0170 per unit sold
*The annual budgeted traceable fixed other distribution costs included in the calculation of
the predetermined rate are:
Breadiconfectionery boxes
Protective clothing
These budgeted costs were obtained from the profit and loss statement of Bread Factory A.
The delivery wages can be traced directly to the delivery routes and are the actual costs
incurred per delivery route. The breakdown of the deher) . wages per delivery route was
obtained from the Financial Manager of Bread Factory A.

6.4.5 Actual calcuhtion of the profitability of the delivery routes
The profitability of the delivery routes affects the profitability of Bread Factory A directly. If
a delivey route is not profitable it compromises the profit of Bread Factory A. It is therefore
imperative that Bread Factory A knows which routes are profitable and which routes incur
losses.
The researcher developed a model (appendix 2 , page 141) to assist Bread Factory A in
measuring the profitability of delivery routes. After analysing all the costs that could affect
the profitabilie of the delivery routes, the actual calculation of tht. profitability ofthe delivery
routes for a four-week period was performed by the researcher based on the method of
calculation described in paragraph 6.4 (page 104).
The actual figures were obtained from Bread Factory A's financial records and have been
ad.iusted in congruence \r ith the confiden~iality agreement with Bread Factory A.
The actual figures were obtained from the following sources in Bread Factory A:
Actual sales volumes per deliverq route: Sales summary
Sales price per unit: Financial Manager: Bread Factory A
Cost of raw material: Cnlculation of actual raw material input
costs performed by Bread Factory A
Drivers' commission: Financial Manager: Bread Factory A
Oven fuel, production wages and
wrapping wages:
Predetermined rates:
Profit and loss statement for the financial
year 2006 of month under review: Bread
Factory A
Calculations performed by researcher using
the profit and loss statement of Bread
Factory A (paragraph 6.4.3 to 6.4.4. pages
I08 to 109)

Actual kilometres travelled: Delivery vehicles maintenance records kept
by outsourced part).
Fixed rate per kilometre: Financial Manager: Bread Factory A
Discounts: Sales summay
Delivery wagcs: Sales summary
Only the first five delivery routes' results of the calculation are tabulated below.

Table 6.3: Calculation of the actual profitability of delivery routes at Bread Factory
A for a combined four-week period
Routes
oven&/ (OF,
Producrion wages iP Wi
Wrapping wages /WWj
Kilomerres travelled (KM) Fixed rate per kilometre (RKM)
Rands
0.0481
0.0408
0 0 187
Predetermined rates per u n t Other production costs (OP)* Other vehicle operating cost per
km (OV)** Oher distribution costs (OD)**'
869
R 1.2540
0.0481 1 0.0481
0.0408 0.0408
00187 1 0.0187 I
R0.1538
R0.1975 R 0.0170
1.150
R 1.2530
0.048 1
0.0408
0.0187
R0.1538
R0.1975 R 0.0170
0.0481
0.0408
0.01 87
2,944
R 1.2540
R0.1538
R0.1972 R 0.0170
3.034
R 1.2540
2,333
R 1.2540
R0.1538
R0.1975 . -
R 0.0170
R0.1538
R0.1975 R 0.0170

Seemented income statement
I I I I I
Sales (SV X SP) less discounts 1 41,276.04 / 18,586.50 1 42,207.72 ( 45,312.84 1 39,254.48 I I I I I
Oven fuel 91078 1 609 66 ( 924 49 / 1,043 89 ( 949 35 I
Less variable expenses:
Cost of raw materials
(SV X CRM)
( Other vehicle operating costs 171.54 1 227.11 ( 581.21 / 599.10 1 460.61
22,938.06 19.657.23
Producrion wages
I Other distribution costs 321.21 1 215.01 ( 32605 / 368.16 1 334.81
771.56 1 516.17 1 783.17 1 884.32 ( 804.23
L Delivery wages (Actual) 672.00 1 504.00 1 504.00 1 504.00 / 504.00
15,282.38 13,078.68
(SV X PW)
Segment margin 1 13,172.32 1 8>966.79 1 30,974.18 1 11,520.43 1 8,494.98
* Calculation 6.1, page 109
** Calculation 6.2, page l I0
23,175.74 19.792.01
*** Calculation 6.3, page I l l
6.5 COMPETITIVE ADVANTAGE
25,179.33 21,416.41
In order to achieve the specific research objective (paragraph 1.3.2.6, page hi, namely to
23,500.02 20.066.38
detennine whether Bread Factory A follows the p ide l ines provided by the literature on
competitive advantage. the strategic documents of Bread Factory A were analysed and
discussed with the management of Bread Factoly A

Literature
According to the literature discussed in chapter 3 (page 36), the guidelines provided on
competitive advantage include:
0 Strategy formulation: formulating a vision statement and mission statement (paragraph
3.2, page 37).
Performing an external environmental analysis (paragraph 3.3, page 39) using Porter's
Five Forces model (paragraph 3.3.1.1_ page 39) and a PEST(EL) analysis (paragraph
3.3.2.1, page 43).
Porter's generic strategies (paragraph 3.3.4. page 45).
Performing an internal enbironmental analysis by referring to a SWOT analysis
(paragraph 3.4.1, page 47) and a value chain analysis (paragraph 3.4.2. page 48).
The application o f this literature i n Bread Factory A will now be discussed.
Case study
Bread Factory A produces an annual marketing plan. The marketing plan commences with
the vision and the mission (paragraph 3.2, page 37) of Bread Factory A. The marketing plan
is produced annually by the management of Bread Factory A.
It is followed b> an analysis of the internal and external environment using the following
methods:
Porter's five forces model (paragraph 3.3.1.1, page 39):
SWOT analysis (paragraph 3.4.1, page 47); and
Porter's generic strategies (paragraph 3.3.4, page 45)
The marketing plan is completed a ith a conclusion of the impact that the environment has on
Bread Factory A and steps to be taken to address the influences and reduce the impact thereof.
This marketing plan is sent to the holding company's head office for scrutiny and approval
According to the General Manager of Bread Factory A, once a year the General Manager
attends a group-wide strategy session where the group's strategy is discussed as well as that
of the affiliated organisations. The purpose of this strategy session is to communicate the

group's strategic objectives to all the affiliated organisations and to discuss each affiliated
organisation's strategy based on its marketing plan.
As highlighted by the literature, a value chain analysis (paragraph 3.4.2, page 48) assists in
the analysis of the internal environment. The General Manager prepared a value chain for
Bread Factory A in the year 2000. It includes a breakdown of the primary activities, namely
inbound logistics, operations, outbound logistics, marketing and sales and service. The
support activities include the firm's infrastructure, human resources, technology development
and procurement. An updated version of the value chain of Bread Factory A does not exist
and the value chain does not form part of the annual marketing plan as produced by Bread
Factory A.
The value chain of Bread Factory A is illustrated in figure 6.1.
Figure 6.1: The value chain of Bread Factory A
Source: (General Manager: Bread Factory A, 2000)
Firm Infrastructure Human resources Technology Development
Procurement
6.6 COMPARISON OF TRANSFER PRICES WITH THIRD PARTY
QUOTATIONS
In order to achieve the specific research objective (paragraph 1.3.2.7, page 6), namely to
determine whether the most beneficial transfer price determination method is used in Bread
Financing, Legal Support, Accounting
Recruiting, training, incentive system, employee feedback
Inventory System, Material Selection Flour, Water, etc.
Delivery of Raw Materials, Storage
Inbound Logistics
Process Optimisation
Process Equipment
Manufacture of bread, Wrapping , Packing on Crates Operations
Truck Routing Procedure
Trucks, Diesel, Crates
Loading, Delivery to customers
Outbound Logistics
Presentation of Bread
Bread, Shelves
Pricing, Promotions, Discounts,
Marketing and Sales
Return Procedure
Customer Returns
Service

Factory A, the different methods for determining transfer prices as prescribed by the literature
in chapter 4 (page 54) were considered and applied to Bread Factory A.
Bread Factory A purchases the main ingredient in the production process, namely flour, from
Miller A. Miller A and Bread Factory A form part of the same holding company (paragraph
6.2.5.1, page 82). The price at which Bread Factory A purchases flour from Miller A is
therefore called a transfer price (paragraph 4.1, page 54).
The literature in chapter 4 (page 54) prescribes three methods for determining transfer prices,
namely market-based transfer prices (paragraph 4.2.1, page 57), cost-based transfer prices
(paragraph 4.2.2, page 58) and negotiated transfer prices (paragraph 4.2.3, page 60).
The analysis of the results of each method will now he discussed
Market-based transfer price
In order to determine the market price of flour, the researcher obtained quotations to purchase
flour from direct competitors of Miller A as suggested by the literature in paragraph 4.2.1
(page 57). Three independent quotations on flour prices were obtained based only on
payment terms and delivery. The payment terms were specified as cash on delivery and
delivery charges were included in the price of the quotations. There were no negotiations on
the purchase prices and it is probable that discount on the quoted prices would he given due to
the large volume of flour purchased.
Quotations were obtained from Miller B, Miller C and Miller D for the following types of
flour:
White bread flour; and
brown bread flour.
The purchase prices were compared based on percentage difference with the prices of Miller
A. The actual prices cannot he published in congruence with the confidentiality agreement
with Bread Factory A and Millers B, C and D. The results of the comparison are tabulated in
table 6.4.

Table 6.4: Comparison of purchase prices of flour with Miller A's transfer prices
Diff with
Miller A
White bread flour
Abbreviation: Diff: Difference
Miller D
I I I I I I I
Table 6.4 indicates that Miller B's white bread flour price is 8.67% cheaper and brown bread
flour's price is 5.47% cheaper than Miller A's flour prices. When comparing Miller C's
prices, white bread flour's price is 18.12% cheaper than Miller A's prices while brown bread
flour's price is almost 14% cheaper. Miller D's white bread flour's price is 95.25% of Miller
A's price, while brown bread flour's price is 97.46% of Miller A's price. Miller A's flour
prices are therefore the most expensive compared to the three direct competitors' quotations.
Diff with
Miller A
I I 100.00%
Cost-based transfer price
Miller C
Miller A
Unfortunately the researcher did not have access to the financial records of Miller A
(paragraph 7.3, page 127) and was therefore unable to determine the transfer price of flour
from Miller A to Bread Factory A based on cost (paragraph 4.2.2, page 58). The highest and
lowest acceptable transfer prices based on cost could not be calculated.
91.33%
97.46% Brown bread flour
The researcher did not have access to Miller A's customer base to determine whether it has an
external market to sell flour or whether Bread Factory A is the only client of Miller A. If
Bread Factory A is the only client of Miller A, the transfer price set by Miller A should cover
the full costs of Miller A in order not to incur a loss (example 4.1, page 58).
Miller B
-2.54% 86.23%
The researcher also does not have information about the production capacity of Miller A's
plant to determine whether it has idle capacity. If Miller A does have idle capacity, the
transfer price could be affected as illustrated by example 4.2 (page 61). The only costs Miller
A would then bave to recover from the income of the transfer would be the variable costs,
because the fixed costs would already bave been recovered by Miller A's other sales. The
lowest acceptable transfer price for Miller A would then be based on variable costs.
Diff with
Miller A
-8.67%
-13.77% 100.00%
81.88%
94.53% -5.47%
-18.12% 95.25% -4.75%

Negotiated transfer price
Bread Factory A cannot negotiate (paragraph 4.2.3, page 60) the price at which the flour is
purchased. It has therefore no power to negotiate supplier or price
(paragraph 6.2.5.1, page 82).
Due to the cheaper quotations obtained from the three direct competitors of Miller A
(table 6.4, page 119) it would be more beneficial for Bread Factory A to purchase flour from
one of these suppliers. The purchase would depend on the impact that it has on Bread Factory
A and Miller A's holding company's financial results. The switch of suppliers would also
depend on the qualitative factors such as the quality of flour, delivery of the flour, etc.
The researcher did not have access to the holding company's financial records to determine
whether the current method of determining transfer prices is beneficial to the group as a
whole.
6.7 SUMMARY
In this chapter an analysis of the results were performed. The results were discussed based on
the research objectives set in chapter 1 (page 6).
First the information gathered through the interviews that were conducted was discussed.
This was followed by an analysis of each of the cost items used in the determination of the
delivery route contribution. These costs were analysed and classified either as direct or
indirect costs, variable or fixed, controllable or non-controllable and relevant or irrelevant
costs. The researcher used these classifications of the cost items to calculate delivery route
profitability using the segment reporting approach.
Fierce competition in the bread industry required an analysis of the competitive advantage of
Bread Factory A. The strategic documents that Bread Factory A prepares were evaluated to
ensure compliance with the literature discussed in chapter 3.
The chapter was concluded with a comparison of transfer prices of flour with third party
quotations in order to determine whether the transfer price that Bread Factory A pays to
Miller A is market-related.

Thereby the specific objectives relating to empirical studies in Bread Factory A (paragraph
1.3.2.4 to 1.3.2.7, page 6) have been reached namely to determine the behaviour, traceability
and relevancy of costs used in the calculation of the profitability of delivery routes, to
calculate the delivery route profitability per delivery route, to determine whether Bread
Factory A follows the guidelines provided by the literature on competitive advantage and to
determine whether the most beneficial transfer price determination method is used.

CHAPTER 7
CONCLUSIONS AND RECOMMENDATIONS
7.1 INTRODUCTION
The final specific research objectives (paragraph 1.3.2.8 to 1.3.2.10, page 6 ) were to
formulate recommendations regarding the method used to measure the profitability of
delivery routes at Bread Factory A: to formulate recommendations regarding Bread Factory
A's approach to achieve competitive advantage and to formulate recommendations regarding
the determination of transfer prices of flour from Miller A to Bread Factory A.
In this concluding chapter, the findings of the research will be discussed. Furthermore, the
limitations are highlighted and recommendations are made.
7.2 CONCLUSIONS
The conclusions of the research will be discussed based on the specific theoretical objectives
of the research and the results obtained during the empirical study.
7.2.1 Conclusions regarding the specific tbeoretical objectives
The specific objectives regarding the literature study (objectives 1.3.2.1 to 1.3.2.3, page 6 ) are
discussed below:
7.2.1.1 Cost terms and concepts referring to cost assignment, cost bchaviour and costing
systems
The cost terms and concepts were researched from the literature (Chapter 2, page 12),
referring to cost assignment, cost behaviour and costing systems (objective 1.3.2, page 6) .
The research revealed that in order to manage costs effectively and to determine accurate
product costs. costs have to be assigned accurately. Accurate product costs are imperative in
an indusby where competition is fierce, where switching costs are non-existent and where
substitute products exist. Bread Factory A operates in such an industry. Accurate product
costing enables management to set prices based on accurate information and improved
strategic decision making.

Costs can only be assigned accurately once the behaviour of the cost has been identified. The
behaviour of costs directly affects decisions regarding the activity levels of the production
plant at Bread Factory A. The contribution theory and segment reporting are very important
tools that can be used by organisations to improve p lann in~ control and decision making.
These tools appear to improve jnformation about the delivety route profitability in Bread
Factory A and therefore assist in improved decision making regarding the viability of delivety
routes.
i'he costing systems incorporate the information about cost assignment and cost behaviour
into reports that management can use to improve planning, control and decision making.
7.2.1.2 Competitive advantage
The literature study on competitive advantage (Chapter 3, page 36) as highlighted by
objective 1.3.2.3, page 6. provided the theory to measure Bread Factory A's approach to
competitive advantage.
In an industry where the barriers to entry have decreased rapidly since deregulation in 1991,
new competitors are frequently entering the market. Smaller bakeries do not require a huge
capital outlay and there is very little product differentiation, therefore the larger bakeries are
fighting to maintain their sales volumes. Strategic direction and decision making are
imperative to remain competitive and to remain profitable.
7.2.1.3 Determination of transfer pricing
From the literature study on determination of transfer pricing (chapter 4, page 54) as
highlighted by objective 1.3.2.4 (page 6) it is clear that the determination of a transfer pricing
policy is a controversial issue. The effect of the transfer pricing policy should not have an
impact on the profitability of the holding company, but it does impact on the "softer" issues,
such as staff morale of the selling and buying divisions.
The ideal transfer pricing policy to adopt is the market-based transfer price and the least
ideal transfer pricing policy is the variable cost-based transfer price determination method,
depending on whether the organisation has idle capacity or not. When the transfer price
exceeds the market-based transfer price, it can have an effect on the buying division's staff
morale and productivity and it directly affects the profitability of the buying division.
Decisions can be made based on inaccurate information, because a segment might appear to

make a loss when in actual fact it would be profiable if the raw materials or intermediate
goods were purchased at a lower price.
7.2.2 Conclusions regarding the specific empirical objectives
The conclusions regarding the specific empirical objectives (objective 1.3.2.4 to
1.3.2.7, page 6) are discussed below.
722.1 The behaviour, traceability and relevancy of costs used in the calculation of the
profitability of delivery routes at Bread Factory A
In chapter 6. page 78, the researcher analysed the cost assignment and cost behaviour of the
following costs (objective 1.3.2.4, page 6) to determine its use in the calculation of the
profitability of delivery routes:
Cost of sales;
production expenses; and
distribution costs.
The following conclusions were reached:
Cost of sales expenses in the profit and loss statement of Bread Factory A only consist of
the cost of raw materials, cost of factored goods and cost of intergroup purchases. The
indirect manufacturing overhead expenses (production expenses) did not form part of the
cost of sales cost per unit. The cost assignment by Bread Factory A was therefore not
accurate and these expenses were not taken into account when decisions regarding the
profitability of delivery routes were made.
Theoretically the calculation of the profitability of the delivery routes used by Bread
Factory A cannot be called a delivery route contribution, because not only variable costs
are taken into account during the calculation. The accurate term would be a delivery
route segment margin.
All the other costs were assigned accurately.

7.2.2.2 The calculation of the delivery route profitability per delivery route at Bread
Factory A
A calculation of the profitahility of the delivery routes was performed (objective 1.3.2.5, page
6) by the researcher using the segmented income statement approach after all the costs were
analysed to determine its behaviour, traceability and relevancy and accurate allocation. The
researcher followed management accounting principles as prescribed by the literature (chapter
2, page 12) to conclude that an accurate calculation of the delivery route profitahility per
delivery route will be achieved by using the template prescribed in appendix 2 (page 141).
The delivery route segment margins calculated for delivery routes 1 to 5 were all positive,
(table 6.3, page 114) indicating that they contributed towards the recovery of the fixed costs
of Bread Factory A as a whole.
7.2.2.3 Compliance of Bread Factory A with literature on competitive advantage
Objective 1.3.2.6 (page 6) was to determine whether Bread Factory A complies with the
literature on competitive advantage. Bread Factory A produces an annual marketing plan that
is sent to the holding company's head office for approval. This marketing plan highlights the
vision and mission of Bread Factory A. A competitors' analysis is performed using Porter's
five forces model. A SWOT analysis highlights the strengths, weaknesses, opportunities and
threats of the environment that Bread Factory A operates in. An analysis of the market is
performed indicating what the key success factors are that would ensure sustained growth for
Bread Factory A, both in profit and volumes.
Porter's generic strategies are discussed to form a clear strategic direction for Bread Factory
A. To complete the marketing plan, a conclusion is drawn based on all the information
gathered.
The researcher can therefore conclude the following:
Bread Factory A does comply with the literature on competitive advantage as discussed in
chapter 3 (page 36).
One of the weaknesses raised in the marketing plan of Bread Factory A is that there is no
clear strategic direction due to the non-existence of a dedicated marketing department. It
therefore does not help that strategic direction exist only on paper, but cannot be
executed. Definite steps have to he taken to execute the defined strategy especially in the
extremely competitive environment that Bread Factory A operates in.
7.2.2.4 Transfer price determination method used in Bread Factory A
Bread Factory A has no power over the supplier and price of flour provided by Miller A.
The transfer price of flour is determined and enforced by the holding company. The transfer
price has no effect on the profitability of the holding company, but it has a definite impact on
the profitability of Bread Factory A and Miller A.
The researcher came to the following conclusions by referring to the literature in chapter 4
(page 54) and comparison with competitor flour prices:
s The ideal transfer pricing determination method (objective 1.3.2.7, page 6) is to use the
market-based transfer price (paragraph 4.2.1, page 57). This method enables
orgauisational profits to be evaluated against direct competitors because the profit is a
reflection of what the divisional profit would have been if the product was sold on the
outside market (paragraph 4.2.1.1, page 57). The method that was used to determine the
transfer pricing policy by the holding company of Bread Factory A is the dictated
transfer price method (paragraph 4.2, page 56).
0 Based on a comparison with three direct competitors, the price paid by Bread Factory A
to Miller A for flour is in all three cases much higher (up to 18% higher for white bread
flour) than the market price. The prices obtained fTom the competitors were before any
discount was given for bulk purchases.
The transfer pricing policy can affect the performance-related incentives and the morale
and productivity of the management of Bread Factory A.
Due to the high cost of flour, compared with direct competitors, the production cost of
bread in Bread Factory A is higher than what it would be if flour was obtained at market
value. Decisions regarding the profitability of delivery routes would therefore be
affected, for example, a delivery route segment margin would be calculated as a loss, but
if the cost of flour was market-based, the delivery route would record a profit. The result
could be ineffective decision making regarding the viability of delivery routes.

7.3 LIMITATIONS OF THE RESEARCH
The following shortcomings were identified during the research:
The financial records of Miller A and the holding company could not be obtained. This
would have enabled the researcher to determine whether the transfer pricing policy was to
the advantage of the holding company as a whole.
Interviews were not conducted with the holding company's staff to obtain the reasoning
behind the transfer pricing policy.
The classifications of costs were performed based on the literature (chapter 2, page 12)
and interviews (paragraph 6.2, page 78) conducted with the management of Bread
Factory A. Some assumptions were made in the classifications of the costs due to the
complexity and different factors influencing the costs.
7.4 RECOMMENDATIONS
The following recommendations are made based on the specific objectives (paragraph 1.3.2.8
to 1.3.2.10, page 6).
7.4.1 Measurement of the profitability of delivery routes a t Bread Factory A
The following recommendations are made in terms of the calculation of profitability of the
delivery routes at Bread Factory A (objective 1.3.2.8, page 6):
The segment reporting approach (paragraph 2.4.1, page 22) should be followed when
reporting the profitability of delivery routes at Bread Factory A.
Bread Factory A should classify production costs and distribution costs as either variable,
traceable fixed costs or common fixed costs.
The variable production expenses, namely oven fuel, production wages and wrapping
wages should be allocated to the variable cost of sales, based on the total sales volumes.

The other production expenses should be classified as either traceable or common fixed
costs.
After the other production expenses are classified as either traceable or common fixed
costs, the traceable fixed costs should he allocated as part of the delivery route segmented
income statement and the calculation of delivery route segment margin.
Bread Factory A should compile all the variable expenses (cost of raw materials, drivers'
commission, oven fuel, production wages and wrapping wages) and deduct the variable
expenses from the total sales to obtain a contribution margin.
Traceable fixed costs should be deducted from the contribution margin to obtain the
segment margin.
Bread Factory A should make decisions hased on the segment margin per delivery route.
7.4.2 Bread Factory A's approach towards achieving competitive advantage
The following recommendations are made based on Bread Factory A's approach towards
achieving competitive advantage (objective 1.3.2.9, page 6):
Bread Factory A should take definite steps to execute the defined strategy especially in
the extremely competitive environment that Bread Factory A operates in.
An updated version of the value chain of Bread Factory A should be created by Bread
Factory A and included in their annual marketing plan.
7.4.3 Determination of transfer prices of flour from Miller A to Bread Factory A
The following recommendations are made based on the determination of transfer prices for
transfers from Miller A to Bread Factory A:
The holding company should involve both Bread Factory A and Miller A in the setting of
the transfer price of flour. Negotiations should take place between these three parties to
ensure that a more market-related transfer price is set.

Decisions regarding the profitability of delivery routes should be reconsidered after
adjustments have been made to the cost of raw materials. These adjustments should take
into account the higher price paid to Miller A for flour.
7.5 SUMMARY
In this chapter the conclusions and recommendations resulting from the study were presented
and discussed.
First the conclusions based on the literature study were discussed. This was followed by the
conclusions reached based on the empirical study. The conclusions resulting from the study
can be briefly summarised as that Bread Factory A mostly adheres to management accounting
principles as prescribed by the literature study (chapter 2 to 4).
The limitations of the research were discussed and the chapter concluded with the
recommendations.
The areas where improvements are necessary are highlighted by the recommendations:
The segment reporting approach should be followed by Bread Factory A in the
calculation of delivery route profitability.
Production expenses should be analysed and assigned to the cost of sales figure of
products manufactured.
Bread Factory A should make decisions on the viability of delivery routes based on the
segment margin.
Bread Factory A should take definite steps to execute the defined strategy especially in
the extremely competitive environment that Bread Factory A operates in.
An updated version of the value chain of Bread Factory A should be created by Bread
Factory A and included in their annual marketing plan.

The holding company of Bread Factory A should reconsider its transfer pricing policy
on flour and enter into negotiations with both Bread Factory A and Miller A.
Decisions regarding the profitability of delivery routes should be reconsidered after
adjustments have been made to the cost of raw materials.
The last research objective was thereby reached and the research study concluded.

BIBLIOGRAPHY
ANON. 1990. Off to market. Financial Mail, 117(1):78,6 Jul,
ANON. 1991a. Price set to rise as bread subsidy goes. Pretoria News: 2,28 Febr.
ANON. 1991 b. Nuwe tydvak vir bakbedryf. Die Transvaler: 11, 1 Mar.
ANON. 1991c. Om den brode. Beeld 14.30 Mei.
ANON. 1991d. Half-baked deregulation. Financial Mail, 122(7):79-80, 15 Nov.
ANON. 1998. Surplus strangles wheat fanners. Farnier's Weekly: 38,22 May.
ANON. 2004. Performance is evaluated. Sowetan: 10, 31 Aug.
ANON. 2005a. Management Accounting - Business strategy. Financial Management, 33-
34, 1 Febr.
ANON. 2005b. Management Accounting - Performance evaluation. Financial
Managenienf, 45-47, 1 Mar.
ANON. s.a. Segment reporting and decentralization - Chapter 12.
http:Nnorthonline.sccd.ctc.edulpbouker/ACC23O~Folder/Chapterl2~SegmentReporting.htm
Date of access: 23 Oct. 2006
BABBIE, E. 2004. The practice of social research. 10" ed. Belmont, Calif.:
Wadsworth/Thomson Learning. 493 p.
BABBIE, E. & MOUTON, J . 2001. The practice of social research. South African edition.
Oxford: Oxford University Press. 674 p.
BOTTEN, N & SIMS, A. 2004. Management Accounting - Business strategy. Oxford:
Elsevier Ltd. 623 p.
BRAND. 1991. Price set to rise as bread subsidy goes. Pretoria News: 2, 28 Febr.

BREAD FACTORY A. 2006. Marketing plan. 6 p.
BREAD FACTORY A. 2006. Profit and loss statement. 18 p
BREAKWELL, G.M. 1990. Interviewing. London: The British Psychoiogical Society.
100 p.
CHASE, R.B., JACOBS, F.R. & AQUILANO, N.J. 2004. Operations management for
competitive advantage. 10" ed. New York: McGraw-HilVInuin. 765 p.
CHENG, J.M. 2002. A breakthrough in transfer pricing: The renegotiate-any-time system.
Management Accounting Quarterly, 1-8, Winter.
DE WIT, B & MEYER, R. 2005. Strategy synthesis: Resolving strategy paradoxes to create
competitive advantage (Text and readings). 2nd ed. London: International Thomson
Leaming. 469 p.
DRURY, C. 2004. Management and cost accounting. 6" ed. London: lntemational
Thomson Learning. 1280 p.
EDMONDS, T.P., EDMONDS, C.D., OLDS, P.R. & SCHNEIDER, N.W. 2006.
Fundamental managerial accounting concepts. 3rd ed. New York: McGraw-Hillfirwin.
654 p.
EHLERS, M.B. & LAZENBY, J.A.A. 2006. Strategic management, Southern African
concepts and cases. 5" ed. Pretoria: Van Schaik. 308 p.
ENSIGN, P.C. 2001. Value chain analysis and competitive advantage. Journal of General
Management. 27(1): 18-42, Autumn.
FALSHAW, J.R., GLAISTER, K.W. & TATOGLU, E. 2006. Evidence on formal strategic
planning and company performance. Munagement Decision, 44(1):9-30.
FINANCIAL MANAGER: BREAD FACTORY A. 2006. Verbal communication with the
researcher. Bread Factory A.

GARRISON, R.H., NOREEN, E.W. & BREWER P.C. 2006. Managerial Accounting. 1 lth
ed. NewYork: McGraw-HilVIrwin. 863 p.
GENERAL MANAGER: BREAD FACTORY A. 2006. Verbal communication with the
researcher. Bread Factory A.
GHOSH, D. 2000. Complementary arrangements of organizational factors and outcomes of
negotiated transfer price. Accounting Organizations and Society, 25(7):661-682.
HANSEN, D.R. & MOWEN, M.M. 2003. Cost Management: accounting and control. 4"
ed. Cincinatti, Oh.: South -Westem College. 1029 p.
HEWING, E., VAN RENSBURG, W. & SMIT, B. 2004. Finding your way in qualitative
research. Pretoria: Van Schaik. 179 p.
KILTON, R.W., MAHER, M.W. & SELTO, F.H. 2006. Cost Management, Strategies for
Business Decisions. 3" ed. New York: McGraw-HilllIrwin. 914 p.
HORNGREN, C.T., DATAR, S.M. & FOSTER, G. 2006. Cost accounting: a managerial
emphasis. 1 2 ~ ed. Upper Saddle River, N.J.: Prentice Hall. 868 p.
HUGHSON, L. 1992. Bakery business: deregulation fetters still in place? Food Review, 35
- 37, Aug 1 Sept.
JEHLE, K. 1999. Budgeting as a competitive advantage. Strategic Finance, 81 (4):54-57.
KARAMl, A.. ROWLEY, J . & ANALOUI, F. 2006. Research and knowledge building in
management studies: an analysis of methodological preferences. International journal of
Management, 23(1):43-52.
KAZAN, H., OZER, G. & GETIN, A.T. 2006. The effect of manufacturing strategies on
financial performance. Measuring Business Excellence, 1 O(1): 14-25.
KOSIOR, J.M. & STRONG, D. 2006. Supplyldemand chain modeling utilizing logistical-
based costing. Journal of Enterprise Information Management, 19(3):346-360.

KVALE, S. 1996. Interviews: an introduction to qualitative research interviewing.
Thousand Oaks, Calif.: Sage Publications. 326 p.
LEEDY, P.D. & ORMROD, J.E. 2005. Practical research: planning and design. 81b ed.
Upper Saddle River, N.J.: Prentice Hall. 319 p.
LONGMAN BUSINESS ENGLISH DICTIONARY. 2001. 4*' ed. Essex: Pearson
Education Limited. 533 p.
LYONS, H. 2005. Food industry case studies: a suitable medium for publication. British
Food Journal, 107(9):702-7 13.
MAKGALEMELE, T. 2006. Bakeries cheat consumers with underweight bread. Saturday
Weekend Argus: 1,29 Apr.
MARTIN, R. s.a. Management Accounting: concepts, techniques & controversial issues.
http://www.maaw.info/Chapter6.htm#concepts Date of access: 21 Oct. 2006
MILLER B. 2006. Verbal communication with the researcher. Potchefstroom.
MILLER C. 2006. Verbal communication with the researcher. Potchefstroom.
MILLER D. 2006. Verbal communication with the researcher. Potchefstroom.
MOOS, A. 2003. Broodptys styg in Julie. Beeld 3, 7 Aug.
NAIDU, E. 2006. Consumer bodies call for action on underweight bread. Sundq
Independent: 2,2 1 May.
NEUMAN, W.L. 2006. Social Research Methods: qualitative and quantitative approaches.
6" ed. Boston: Allyn and Bacon. 592 p.
NIEMAND, A,, MEYER, L., BOTES, V.L. & VAN VUUREN, S.J. 2004. Fundamentals of
cost and management accounting. 5*' ed. Johannesburg: LexisNexis. 695 p.
OED (Oxford English Dictionaty). 1978. Cost. Oxford: Oxford University Press.

PEARCE, J.A.11. & ROBINSON, R.B.Jr. 2003. Strategic Management: Formulation,
implementation and control. 8" ed. New York: McGraw-Hillllnvin. 344 p.
PITTS, R.A. & LEI, D. 2003. Strategic Management: Building and sustaining competitive
advantage. 31d ed. Canada: Thomson Learning South-Westem. 555 p.
PORTER, M. 1998. Competitive strategy: Techniques for analyzing industries and
competitors. New introduction. New York: Free Press. 396 p.
QUER~E, A. & YEOH, J. 2006. Segment reporting through the eyes of management.
CharteredAccountants Journal, 85(2):64-65.
RATHBONE, C.L.H. 2006. Value creation. Financial Management. 40, JulyIAug.
RlEGE, A.M. 2003. Validity and reliability tests in case study research: a literature review
with "hands-on" applications for each research phase. Qualitative Market Research: an
internationaljournal, 6(2):75-86.
RUSHINEK, A. & RUSHINEK, S.F. 1994. Improving profitability with segmented income
statements for Local Area Networks. Industrial Management & Data Systems, 94(2):7-15.
SAHAY, S.A. 2003. Transfer pricing based on actual cost. Journal of Management
Accounting Research, (1 5) : 1 77-1 92.
SAMPSON, P. 1972. Qualitative research and motivation research. (In Worcester, R.M., ed.
Consumer Market Research Handbook. London: McGraw-Hill. p. 7-27.)
SANDERS, J., ALEXANDER, S. & CLARK, S. 1999. New segment reporting. Is it
working? Strategic Finance, 8 1 (6):3 5-38.
SCHOLTZ, H.G. 1999. Die invloed van deregulering op die bemarking van brood.
Potchefstroom: N W . (Skripsie - MBA) 37 p.
SEAL, W., GARRISON, R.H. & NOREEN, E.W. 2006. Management Accounting. 2nd ed.
Berkshire: McGraw-Hill Education. 971 p.
SILVI, R. & CUGANESAN, S. 2006. Investigating the management of knowledge for
competitive advantage: a strategic cost management perspective. Journal of Intellectual
Capital, 7(3):309-323.
STANLEY, J. 2004. Comparables key to transfer pricing. Business day: 6, 11 Oct.
SULAIMAN, M., AHMAD, N.N.N. & ALWI, M.N. 2005. Is standard costing obsolete?
Empirical evidence from Malaysia. Managerial Auditing Journal, 20(2): 109- 124.
SULAIMAN, M., AHMAD, N.N.N. & ALWI, M.N. 2004. Management accounting
practices in selected Asian countries: A review of the literature. Managerial Auditing
.Journal, 19(4):493-508.
TANG, R.Y.W. 1992. Transfer pricing in the 1990s. Management Accounting, 22-26, Febr.
TAYLOR, M. 2005. Management Accounting - Business Strategy. Financial Management,
38-40, 1 Nov.
TSHETLO, T. 2006. SABS finds bread underweight. Citizen: 9 ,3 May.
ULIANA, E. & MARCUS, D. 1990. Accounting for managers: an introduction to financial
and management accounting. 3rd ed. Kenwyn: Juta. 153 p.
VAN ROOYEN, S. 2004. The financial viability of the training and development of
pharmacist's assistants. Potchefstroom: NWU. (Mini-dissertation - M.Comm)
232 p.
VIGARIO, F. 2005. Managerial Accounting. 3" ed. F. Vigario. 532 p.
WATKWSON, E. & MAKGETLA, N. 2002. South Africa's food security crisis.
http:llwww.naledi.org.za/cgi-binlnaledi/na-showitem.p?publication:1033299505 Date of
access: 4 Oct. 2006.
WOODS, N.F. & CATANZARO, M. 1988. Nursing research: theory and practice. St.
Louis: Mosby. 590 p.

YIN, R.K. 1981. The case study crisis: some answers. Administrutive Science Quarterly,
26:58-65.
YIN, R.K. 2003. Case study research: design and methods. 31d ed. California: Sage
Publications, Inc. 181 p.
ZIMMERMAN, J.L. 2006. Accounting for decision making and control. 5" ed. New York:
McGraw-HillIInvin. 800 p.

APPENDIX 1: SEMI-STRUCTURED INTERVIEW QUESTIONNAIRE
THE APPLICATION OF MANAGEMENT ACCOUNTING PRINCIPLES IN THE
BREAD INDUSTRY: A CASE STUDY
GENERAL
1. What is your job title?
2: Who do you report to - your line of authority?
3. How long are you employed at Bread Factory A?
FINANCIAL REPORTING
4. Briefly explain the ownership structure of Bread Factory A.
5. Which financial accounting package do you use?
6. How often does internal reporting occur?
7. In which format do you report internally?
8. How often does external reporting occur?
9. In which format do you report externally?
10. What are your main sources of information when preparing the financial records?
MANUFACTURING
11. Briefly explain the manufacturing process you follow to produce bread.
12. Which inventory do you keep at Bread Factory A for use in the production process?
13. With reference to the inventory suppliers: do you have one or many suppliers? Explain.
14. Briefly explain the inventory control process.
FINANCIAL RECORDS
15. I obtained a copy of your financial records. Briefly explain what each of the line items on
the profit and loss statement consist of (income and expenses).
16. Did you develop the format of your reporting system yourself or is it prescribed by the
holding company?

SEMI-STRUCTURED INTERVIEW QUESTIONNAIRE (CONT.)
SALES
17. Briefly explain your sales order system?
18. How do you maintain your customer base?
19. What strategy do you employ to increase your customer base?
20. Briefly explain your pricing structure?
21. Do customers qualify for discounts?
22. Based on what criteria do customers qualify for discounts?
23. Briefly explain your invoicing system?
24. Do you grant credit?
DESPATCHING OF BREAD
25. Briefly explain the despatching process of bread from Bread Factory A.
26. What control measures do you have in place to ensure that discrepancies between what
was dispatched and what was loaded on the delivery trucks are eliminated?
DELNERY OF BREAD
27. How often do you deliver bread?
28. Who determined the delivery routes?
29. How was the delivery routes determined?
30. Briefly explain the delivery process and the expenses involved.
31. Do the delivery vehicles belong to Bread Factory A or are the delivery function
outsourced?
32. The delivery salaries and wages paid, how is it calculated and why?
33. Do you currently measure profitability of delivery routes?
34. If you do, how is it calculated?
35. How often do you measure the profitability of delivery routes?
COMPETITIVE ADVANTAGE
36. Do you have a strategic document with a clear vision and mission?
37. Do you set strategic objectives?
38. How often do you revise or update your strategy?

SEMI-STRUCTURED WTERVIEW QUESTIONNAIRE (CONT.)
COMPETITIVE ADVANTAGE (CONT.)
39. Are you responsible for your own strategy or is it prescribed by the holding company?
GROW
40. Do you enter into any inter company transactions?
41. If yes, please provide details.

APPENDIX 2: MICROSOFT EXCEL MODEL TO CALCULATE THE DELIVERY
ROUTE SEGMENT MARGIN

TEMPLATE TO CALCULATE THE DELMCRY ROUTE SEGMENT MARGIN
segmented income 1 I I itatement
I I I
Sales (SV X SP) less discounts 1 I 1 I I I
,ess variable expenses: Cost of raw materials (SV X CRM) Oven fuel (SV X OF) Production wages (SV X PW) Wrapping wages (SV X WW) Drivers' commission
Contribution margin
Less: traceable fixed expenses
Other production costs (SV x OP) Vehicle operating costs
(KM X RKM) Other vehicle operating costs (KM X OV) Other dishibution costs (SV X OD) Delivery wages (Actual)
Segment margin
Copyright © 2022 FDOKUMEN