A Study of H-transfer Kinetics and Catalytic Protein Dynamics ...
228
A Study of H-transfer Kinetics and Catalytic Protein Dynamics in Ene-reductase Enzymes of the OYE Family A thesis submitted to the University of Manchester for the degree of Doctor of Philosophy (PhD) in the Faculty of Science & Engineering 2016 Alexander C. Geddes School of Chemistry
-
Upload
khangminh22 -
Category
Documents
-
view
2 -
download
0
Transcript of A Study of H-transfer Kinetics and Catalytic Protein Dynamics ...
A Study of H-transfer Kinetics and Catalytic Protein
Dynamics in Ene-reductase Enzymes of the OYE Family
A thesis submitted to the University of Manchester
for the degree of Doctor of Philosophy (PhD) in the
Faculty of Science & Engineering
2016
Alexander C. Geddes
School of Chemistry

2

3
Contents
Abstract ............................................................................................................................................. 12Declaration ........................................................................................................................................ 13Copyright statements ....................................................................................................................... 13Preface to the alternative format ..................................................................................................... 14Chapter 1 - Introduction ................................................................................................................... 15
1.1 Enzyme catalysis and fast-timescale protein dynamics ................................................. 151.2 The Old Yellow Enzyme family .......................................................................................... 17
1.2.1 Discovery of the Flavin-dependent family of ene-reductases ........................................ 171.2.2 The mechanism of catalysis .......................................................................................... 191.2.3 Structural features and oligomeric organisation ............................................................ 211.2.4 Conserved features within the active site of OYE enzymes .......................................... 241.2.5 Characteristic features of the OYE subclasses ............................................................. 25
1.3 Pentaerythritol tetranitrate reductase (PETNR) ............................................................... 281.3.1 Structure & function ....................................................................................................... 281.3.2 FMN cofactor and substrate binding sites within PETNR .............................................. 28
1.4 Thermophilic Old Yellow enzyme (TOYE) ........................................................................ 301.4.1 Structure & function ....................................................................................................... 301.4.2 FMN cofactor and substrate binding sites within TOYE ................................................ 30
1.5 Xenobiotic reductase A (XenA) ......................................................................................... 321.5.1 Structure & function ....................................................................................................... 321.5.2 FMN cofactor and substrate binding sites within XenA ................................................. 32
1.6 Uses of OYE enzymes in synthetic biology and biocatalysis ........................................ 341.6.1 Biocatalytic applications of stereoselective ene-reductases .......................................... 341.6.2 The importance of natural coenzyme biomimetics ........................................................ 34
1.7 Quantum Mechanical Tunnelling in enzyme systems .................................................... 361.7.1 The Bell correction model .............................................................................................. 381.7.2 Full-tunnelling Marcus-like models ................................................................................ 381.7.3 Promoting motions ......................................................................................................... 391.7.4 The temperature dependence of Kinetic Isotope Effects ............................................... 401.7.5 The pressure dependence of Kinetic Isotope Effects .................................................... 411.7.6 KIEs studies in mutagenic variants ................................................................................ 43
1.8 Nuclear Magnetic Resonance Spectroscopy .................................................................. 451.8.1 Fundamental Principles of NMR spectroscopy .............................................................. 451.8.2 Relaxation of Nuclear spins ........................................................................................... 481.8.3 Mechanisms of nuclear spin relaxation ......................................................................... 481.8.4 The NOE effect .............................................................................................................. 491.8.5 Multidimensional NMR pulse sequences ....................................................................... 52
1.9 Protein crystallography ...................................................................................................... 54

4
1.9.1 Protein crystallisation ..................................................................................................... 541.9.2 Data collection ............................................................................................................... 56
1.10 Aims and synopsis of the thesis ..................................................................................... 59Chapter 2 - Materials & Methods ..................................................................................................... 60
2.1 Materials and reagents ....................................................................................................... 602.2 Protein expression and purification methods ................................................................. 62
2.2.1 Bacterial transformation ................................................................................................. 622.2.2 PETNR Expression ........................................................................................................ 622.2.3 Isolation of PETNR ........................................................................................................ 622.2.4 Preparation of isotope labelled PETNR protein ............................................................. 632.2.5 Expression of 15N-labelled PETNR ................................................................................ 642.2.6 TOYE & XenA Expression ............................................................................................. 642.2.7 Isolation of TOYE & XenA ............................................................................................. 65
2.3 Molecular biology techniques ........................................................................................... 662.3.1 Plasmid DNA purification ............................................................................................... 662.3.2 Site�directed mutagenesis ........................................................................................... 662.3.3 Agarose gel electrophoresis .......................................................................................... 672.3.4 Plasmid preparation and DNA sequencing .................................................................... 67
2.4 Protein techniques ............................................................................................................. 682.4.1 Sodium dodecyl sulphate polyacrylamide gel electrophoresis ...................................... 682.4.2 Crystallography .............................................................................................................. 68
2.5 Spectroscopy ...................................................................................................................... 692.5.1 UV�Vis spectroscopy ................................................................................................... 692.5.2 Stopped�flow experiments ........................................................................................... 69
2.5. NMR spectroscopy ............................................................................................................ 702.5.1 1H�15N HSQC NMR spectroscopy ............................................................................... 702.5.2 Resonance assignment ................................................................................................. 702.5.3 Saturation Transfer Difference (STD) NMR ................................................................... 712.5.4 Selective NOE NMR ...................................................................................................... 71
2.6 Preparation of NAD(P)H isotopologues and nonreactive analogues ............................ 722.6.1 (R)-[4-2H]-NAD(P)H preparation .................................................................................... 722.6.2 1,4,5,6-tetrahydroNAD(P)H [NAD(P)H4] preparation ..................................................... 722.6.4 Purification of Coenzyme isotopologues and nonreactive analogues ........................... 73
Chapter 3 - A structural and kinetic characterisation of mutagenic variants of PETNR .......... 743.1 Abstract .............................................................................................................................. 753.2 Introduction ........................................................................................................................ 763.3 Results ................................................................................................................................ 79
3.3.1 Preparation PETNR variants ......................................................................................... 793.3.2 Purification of wild-type and variants forms of PETNR .................................................. 81
5
3.3.3 X-ray crystallographic analysis of PETNR variant structures ........................................ 843.3.4 Concentration dependence of FMN reduction with NADPH/NADH in wild type and
variant forms of PETNR ............................................................................................................. 893.3.5 Analysis of the temperature dependence of Kinetic Isotope Effects observed for wild-
type and variants forms of PETNR with NAD(P)H ..................................................................... 913.4 Discussion .......................................................................................................................... 993.5 Supporting Information for Chapter 3 ........................................................................... 103
Chapter 4 - Donor-Acceptor Distance Sampling Enhances the Performance of "Better than
Nature" Nicotinamide Coenzyme Biomimetics .......................................................................... 1174.1 Abstract ............................................................................................................................ 1184.2 Introduction ...................................................................................................................... 1194.3 Results and discussion ................................................................................................... 1224.4 Supporting information for chapter 4 ............................................................................ 127
Chapter 5 - An investigation of Hydride Donor-Acceptor Distances Within PETNR Ligand
Complexes as a Function of Pressure Using Intermolecular Nuclear Overhauser Effect
Spectroscopy .................................................................................................................................. 1555.1 Abstract ............................................................................................................................ 1565.2 Introduction ....................................................................................................................... 1575.3 Results .............................................................................................................................. 161
5.3.1 Resonance assignment ............................................................................................... 1615.3.2 Chemical shift perturbation studies to assess ligand binding to PETNR ..................... 1675.3.3 A Saturation Transfer Difference (STD) NMR based study of cofactor to coenzyme
distances within the PETNR:Nicotinamide complex ................................................................ 1735.3.4 A study of selective Nuclear Overhauser effects (NOE) within the PETNR:NADPH4
complex ................................................................................................................................... 1855.3.5 A variable pressure study of selective Nuclear Overhauser effects (NOE) within the
PETNR:NADPH4 complex ....................................................................................................... 1955.4 Discussion ........................................................................................................................ 2015.5 Supporting Information for chapter 5 ............................................................................. 204
Chapter 6 - Discussion ................................................................................................................... 2076.1 Discussion and future prospects .................................................................................... 207
6.1.1 The use of enzymatic variants for the study of H-transfer kinetics in PETNR ............. 2076.1.2 Novel cofactors analogues and newish enzymes for biocatalysis ............................... 2086.1.3 Studying donor acceptor distances via NOE spectroscopy ......................................... 209
Chapter 7 - References .................................................................................................................. 2107.1 References for Chapters 1 & 2 ....................................................................................... 2107.2 References for Chapter 3 ............................................................................................... 2167.3 References for Chapter 4 ............................................................................................... 2187.4 References for Chapter 5 ............................................................................................... 220
6
7.5 References for Chapter 6 ............................................................................................... 222Chapter 8 – Acknowledgements………………………………………………………………………...223
7
List of Figures
Figure 1.1. A hypothetical energy landscape for a protein .................................................................16 Figure 1.2. Flavin mononucleotide (FMN)...........................................................................................18 Figure 1.3. The catalytic cycle of OYE enzymes.................................................................................20 Figure 1.4 The typical structure of OYE enzymes...............................................................................23 Figure 1.5. Aligned sequences of OYE enzymes................................................................................27 Figure 1.6. Structure and active site of PETNR..................................................................................29 Figure 1.7. Structure and active site of TOYE.....................................................................................31 Figure 1.8. Structure and active site of XenA......................................................................................33 Figure 1.9.TST, Bell correction and Full-tunnelling/Marcus-like models of enzyme catalysis.............37 Figure 1.10. Nuclear precession.........................................................................................................47 Figure 1.11. NMR energy level diagram.............................................................................................47 Figure 1.12. An energy level diagram showing the NOE effect for two coupled spins........................51 Figure 1.13. Protein crystallisation phase diagram.............................................................................55 Figure 1.14. Typical workflow for protein structure determination via X-ray crystallography..............58
Figure 3.1. Crystal structure of PENTR-NADH4 complex...................................................................78 Figure 3.2. Agarose electrophoresis gel showing products of site directed mutagenesis...................79 Figure 3.3. DNA sequences of plasmids encoding variant PETNR enzymes.....................................80 Figure 3.4. SDS PAGE gel showing expression of PETNR variant enzymes.....................................80 Figure 3.5. SDS-PAGE gel showing Mimetic Orange 2 A6XL fractions..............................................82 Figure 3.6. SDS-PAGE gel showing source-Q fractions.....................................................................82 Figure 3.7. Absorbance spectrum of purified wild type PETNR..........................................................83 Figure 3.8. Mutated residues and encompassing electron density.....................................................86 Figure 3.9. Overlays of the crystal structures of PETNR variants.......................................................87 Figure 3.10. Per residue RMSD values determined for PETNR variants............................................88 Figure 3.11. Kinetic parameters extracted from NAD(P)H concentration dependence studies of FMN reduction with wild-type and variant forms of PETNR.........................................................................90 Figure 3.12. The relationship between apparent activation enthalpy and activation entropy for the reactions of PETNR variants with NAD(P)H/D....................................................................................96 Figure 3.13. The relationship between apparent activation enthalpy/entropy changes and change in heat capacity for PETNR variants NAD(P)H/D...................................................................................97 Figure 3.14.Amide chemical shift changes (δHN) observed upon binding of NAD(P)H4 to PETNR.103 Figure 3.15. 1HN line broadening analysis of PETNR and PETNR:NAD(P)H4 complexes...............104 Figure 3.16. Stopped flow studies of the NADH concentration dependence of FMN reduction in wild type and variant forms of PETNR.....................................................................................................105 Figure 3.17. Stopped flow studies of the NADPH concentration dependence of FMN reduction in wild type and variant forms of PETNR.....................................................................................................106 Figure 3.18. Studies of the temperature dependence of FMN reduction for wild type PETNR and variants with NADH/D.......................................................................................................................107 Figure 3.19. Studies of the temperature dependence of FMN reduction for wild type PETNR and variants with NADH/D.......................................................................................................................108 Figure 3.20. KIEs observed with wild type PETNR and variants with NADH/D................................109 Figure 3.21. KIEs observed with wild type PETNR and variants with NADH/D................................110 Figure 3.22. 1H NMR spectrum of (R)-[4-2H]-NADH (NADD) ...........................................................115 Figure 3.23. 1H NMR spectrum of (R)-[4-2H]-NADPH (NADPD) ......................................................116
Figure 4.1. Table of Contents artwork...............................................................................................118 Figure 4.2. The catalytic cycle of PETNR and the structure of the natural coenzymes and NCBs...121 Figure 4.3. Eyring plots and the temperature dependence of the KIEs for the reactions of the ERs with natural coenzymes and synthetic coenzyme mimics.................................................................125 Figure 4.4. The relationship between apparent activation enthalpy and activation entropy reactions of ene-reductases with natural coenzymes and NCBs.........................................................................125 Figure 4.5. The relationship between ∆H‡H, ∆∆H‡ and the observed rate constant for reactions of ene-reductases with natural coenzymes and NCBs.........................................................................126 Figure 4.6. NMR spectra for 1-Benzyl-4-deuterio-1,4-dihydronicotinamide......................................131 Figure 4.7. NMR spectra for 1-Benzyl-4,4-dideuterio-1,4-dihydronicotinamide................................133 Figure 4.8. NMR spectra for 1-Butyl-4,4-dideuterio-1,4-dihydronicotinamide (D-mBu) ...................136 Figure 4.9. Eyring plots for reactions of PETNR with natural coenzymes and NCBs.......................140 Figure 4.10. Eyring plots for reactions of TOYE with natural coenzymes and NCBs........................141
8
Figure 4.11. Eyring plots for reactions of XenA with natural coenzymes and NCBs........................142 Figure 4.12. KIEs observed with natural coenzymes NADPH(D)/NADH(D).....................................143 Figure 4.13. KIEs observed with NCBs (D)-mNH2/(D)-mBu.............................................................144 Figure 4.14. The relationship between ∆S‡H, ∆∆S‡ and the observed rate constant for reactions of ene-reductases with natural coenzymes and NCBs.........................................................................148 Figure 4.15. The relationship between ∆H‡D and the observed rate constant for reactions of ene-reductases with natural coenzymes and NCBs.................................................................................149 Figure 4.16. Optimized gas phase geometries of the natural nicotinamide coenzymes and NCBS.150 Figure 4.17. Relaxed potential energy scans of the C4-H bond lengths from DFT models..............152 Figure 4.18. X-ray crystal structures of the ER-1,2,5,6-tetrahydrocoenzyme complexes of XenA-NADPH, TOYE-NADH and PETNR-NADH.......................................................................................153 Figure 4.19. Crystal structures of XenA when oxidized and in complex with NADPH4....................154
Figure 5.1 Schematic diagram of the STD-NMR experiment............................................................160 Figure 5.2. Cα Connectivity ..............................................................................................................162 Figure 5.3. Cβ Connectivity plot........................................................................................................163 Figure 5.4. Cβ Connectivity plot (Part 2) ..........................................................................................164 Figure 5.5. Assigned 1H-15N-HSQC spectrum of PETNR.................................................................165 Figure 5.6. Primary structure and secondary structural topology of PETNR....................................166 Figure 5.7. 1H-15N spectra displaying PETNR/ NADPH4 titration......................................................169 Figure 5.8. 1H-15N spectra displaying PETNR/nicotinamide titration.................................................170 Figure 5.9. Chemical shift changes of peaks assigned to active site residues and key secondary structural features in response to the addition of Nicotinamide and NADPH4..................................171 Figure 5.10. Active site diagram showing PETNR and bound NADH coenzyme..............................172 Figure 5.11. 1H NMR spectra of nicotinamide...................................................................................177 Figure 5.12. 1H NMR spectra of PETNR-nicotinamide.....................................................................178 Figure 5.13.STD-NMR measurements for PETNR-Nicotinamide.....................................................179 Figure 5.14.STD-NMR with PETNR-nicotinamide and varied durations of saturation at -0.35 ppm.180 Figure 5.15.STD-NMR with PETNR-nicotinamide and varied durations of saturation at 12.7 ppm..181 Figure 5.16. STD amplification factors plotted against saturation time.............................................182 Figure 5.17. FMN cofactor, Thr27 and the NADH4 substrate from crystal structure coordinates.....184 Figure 5.18. Trial of Gauss, Reburp and Sinc pulse shapes for selective excitation........................188 Figure 5.19. Trial of different pulse powers for selective excitation..................................................189 Figure 5.20. Selective excitation of resonances at 12.89 and 13.05 ppm.........................................190 Figure 5.21. Selective NOE spectra collected with excitation of peaks between 11-14 ppm............191 Figure 5.22. 1H NMR spectra of NADPH4.........................................................................................192 Figure 5.23. NOE build-up recorded with excitation pulse at 12.47 ppm..........................................194 Figure 5.25. 1H spectra of the PETNR-NADPH4 complex.................................................................197 Figure 5.26. Selective NOE spectrum recorded at 1 bar with excitation at 12.4 ppm.......................198 Figure 5.27. Selective NOE spectrum recorded at 2500 bar with excitation at 12.35 ppm...............199 Figure 5.28. Solvent accessible cavity in the active site of the PETNR-NADH4 complex.................203 Figure 5.29. 1H NMR spectra for NADPH4........................................................................................206

9
Tables
Table 2.1. Primers used to synthesize PETNR variants during site‐directed mutagenesis................67
Table 3.1. Data collection statistics for the crystal structures of PETNR variant................................85 Table 3.2. Kinetic parameters extracted from NAD(P)H concentration dependence studies of FMN reduction with wild-type and variant forms of PETNR........................................................................ 90 Table 3.3. Stopped flow kinetic parameters for FMN reduction with NADH/D in wild-type and variant forms of PETNR..................................................................................................................................94 Table 3.4. Stopped flow kinetic parameters for FMN reduction with NADPH/D in wild-type and variant forms of PETNR..................................................................................................................................95 Table 3.5. Temperature dependence of KIEs observed with wild type and variant forms of PETNR with NAD(P)H/D as determined from slope of KIE plot.......................................................................98 Table 3.6. Reactions of wild-type PETNR with NADH/D..................................................................111 Table 3.7. Reactions of wild-type PETNR with NADPH/D................................................................111 Table 3.8. Reactions of L25V PETNR with NADH/D........................................................................111 Table 3.9. Reactions of L25V PETNR with NADPH/D......................................................................111 Table 3.10. Reactions of L25I PETNR with NADH/D........................................................................112 Table 3.11. Reactions of L25I PETNR with NADPH/D.................................................................112 Table 3.12. Reactions of L25A PETNR with NADH/D......................................................................112 Table 3.13. Reactions of L25A PETNR with NADPH/D....................................................................113 Table 3.14. Reactions of I107A PETNR with NADH/D.....................................................................113 Table 3.15. Reactions of I107A PETNR with NADPH/D...................................................................113 Table 3.16. Reactions of I107L PETNR with NADH/D......................................................................113 Table 3.17. Reactions of I107L PETNR with NADPH/D...................................................................114 Table 3.18. Reactions of I107V PETNR with NADH/D.....................................................................114 Table 3.19. Reactions of I107V PETNR with NADPH/D...................................................................114
Table 4.1. Kinetic Parameters for ERs with Natural and Biomimetic Coenzymes............................139 Table 4.2. Reactions of PETNR with natural coenzymes.................................................................145 Table 4.3. Reactions of TOYE with natural coenzymes....................................................................145 Table 4.4. Reactions of XenA with natural coenzymes.....................................................................145 Table 4.5. Reactions of PETNR with NCBs.....................................................................................146 Table 4.6. Reactions of TOYE with NCBs........................................................................................146 Table 4.7. Reactions of XenA with NCBs.........................................................................................146 Table 4.8. Parameters for ERs with NADH.......................................................................................147 Table 4.9. Parameters for ERs with NADPH.....................................................................................147 Table 4.10. Parameters for ERs with (D)-mNH2...............................................................................147 Table 4.11. Parameters for ERs with (D)-mBu..................................................................................147 Table 4.12. Summary of DFT results...............................................................................................151
Table 5.1. STD amplification factors for PETNR-nicotinamide with presaturation at -0.35 ppm.......183 Table 5.2. STD amplification factors for PETNR-nicotinamide with presaturation at 12.7 ppm........183 Table 5.3. Absolute and relative peak integral values recorded using selective excitation and Selective NOE experiments recorded at 1 bar and 2500 bar...........................................................200 Table 5.4. Integrated peak values for STD-NMR with saturation at -0.35 ppm.................................204 Table 5.5. Integrated peak values for STD NMR control experiment with saturation at -0.35 ppm..204 Table 5.6. STD-Amplification factors for STD NMR experiment with saturation at -0.35 ppm..........204 Table 5.7. Integrated peak values for STD-NMR with presaturation at 12.7 ppm.............................205 Table 5.8. Integrated peak values for STD NMR control experiment with saturation at 12.7 ppm...205 Table 5.9. STD-Amplification factor for STD NMR experiment with presaturation at 12.7 ppm........205
10
Equations Equation 1.1 Kinetic Isotope Effect.....................................................................................................36
Equation 1.2 Full tunneling/Marcus-like model...................................................................................38
Equation 1.3 Franck-Condon term......................................................................................................38
Equation 1.4 Pressure dependence of KIEs.......................................................................................42
Equation 1.5 Nuclear Angular Momentum..........................................................................................46
Equation 1.6 Nuclear Angular Frequency (Larmor Frequency) .........................................................46
Equation 1.7 Spin state energy difference..........................................................................................46
Equation 1.8 Chemical shift................................................................................................................48
Equation 1.9 NOE buidup...................................................................................................................49
Equation 1.10 Cross-relaxation rate....................................................................................................49
Equation 2.1 Beer Lambert Equation..................................................................................................69
Equation 2.2 Single exponential expression.......................................................................................69
Equation 2.3 Rate against concentration equation.............................................................................70
Equation 3.1 Eyring Equation..............................................................................................................91
Equation 3.2 Heat Capacity................................................................................................................91
Equation 3.3 Modified Eyring equation with heat capacity term..........................................................91
Equation 3.4 Modified Eyring equation with heat capacity term (Part 2) ............................................91
Equation 5.1 Saturation transfer difference - Amplification Factor....................................................174
Equation 5.2 Saturation transfer difference - Rate of saturation buildup..........................................175

11
Abbreviations
1D One-dimensional 2D Two-dimensional 3D Three-dimensional AADH Aromatic amine dehydrogenase CSA Chemical shift anisotropy DHFR Dihydrofolate reductase DD Dipole-dipole DA Donor-acceptor DAD Donor acceptor distance EDTA Ethylenediaminetetraacetic acid ee Enantiomeric excess FAD Flavin adenine dinucleotide FMN Flavin mononucleotide F.C. Franck-Condon IPTG Isopropyl β-D-1-thiogalactopyranoside KIE Kinetic Isotope Effect KD Dissociation constant kcat Turnover Number kobs Observed rate ksat Rate of saturation transfer
LB Lauria-broth MD Molecular dynamics MR Morphinone reductase Mr Relative molecular weight MWCO Molecular weight cut-off NADH Nicotinamide adenine dinucleotide NADPH Nicotinamide adenine dinucleotide phosphate NCB Nicotinamide coenzyme biomimetic NMR Nuclear magnetic resonance NOE Nuclear Overhauser effect NTA Nitrilotriacetic acid OD600 Optical density at 600 nm OYE Old yellow enzyme PEG Polyethylene glycol PES Polyethersulfone PETNR Pentaerythritol tetranitrate reductase QMT Quantum mechanical tunneling SDS-PAGE Sodium dodecyl sulfate polyacrylamide gel electrophoresis SEC Size exclusion chromatography SLO Soybean lipoxygenase STD Saturation transfer difference STDmax Maximal STD intensity STDAF STD-Amplification Factor TOYE Thermophilic old yellow enzyme TRS Tunnelling-ready state TSP trimethylsilyl propionate TST Transition state (TST) Tsat Saturation pulse duration XenA Xenobiotic reductase A YT Yeast extract and tryptone
12
Abstract
Dynamic structural fluctuations occurring over a broad range of timescales are now known to
facilitate the catalytic function of enzymes, but there is less comprehensive experimental evidence
linking fast-timescale, high frequency motions to the reaction coordinate. Interest in the role of such
motions has recently surged and been the subject of intensive experimental efforts, in part due to the
identification of enzymatic hydride tunnelling reactions. This mechanism involves transiently
degenerate product and reactant states, which enable H-transfer to occur instantaneously without
the need to surmount the activation barrier associated with traditional transition-state based models
of enzyme catalysis. The primary gauge of tunnelling in enzyme-catalysed reactions is the
identification of temperature dependent kinetic isotope effects (KIEs), i.e. the relative rates of a
reaction where the transferred atom is substituted for an alternate isotope. The identification of
temperature-, and also pressure-, dependent KIEs has resulted in the emergence of new models of
describing enzymatic H-transfer. These invoke a role for fast-timescale protein motions that
‘promote’ transfer via tunnelling. A popular model system for studying enzymatic H-tunnelling
reactions is Pentaerythritol tetranitrate reductase, which belongs to the Old Yellow Enzyme (OYE)
family of ene-reductases. These nicotinamide coenzyme dependent oxidoreductases catalyse the
stereospecific reduction of α/β-unsaturated alkene containing substrates. Here, the importance of
donor-acceptor distances in determining the observed rate of PETNR reduction with NAD(P)H is
probed via a detailed structural and kinetic analysis of site-directed variants. In addition, an
investigation of distance-dependent Nuclear Overhauser effects via Nuclear Magnetic Resonance
(NMR) spectroscopy is undertaken to assess active site organisation and measure donor-acceptor
distances in PETNR-substrate complexes. A variable pressure NMR study reveals how NOE build-
up is perturbed in high-energy conformers favoured as a result of the application of increased
hydrostatic pressures. Recently there has been interest in exploiting the stereoselective properties of
reactions catalysed by ene-reductase enzymes for use in biocatalytic reactions to produce
industrially valuable compounds from renewable sources. The reactions of PETNR and additional
OYE enzymes, Thermophilic old yellow enzyme and Xenobiotic reductase A, with both natural
coenzymes and a set of synthetic Nicotinamide Coenzyme Biomimetics (NCBs) are also
characterised. The NCBs represent affordable and fast-reacting alternatives to the physiological
coenzymes. Reactions with NCBS are also shown to proceed via a tunnelling mechanism and
furthermore, that enhanced donor-acceptor sampling correlates with the faster reactivity seen with
these compounds.
13
Declaration
No portion of the work referred to in the thesis has been submitted in support of an application for
another degree or qualification of this or any other university or other institute of learning.
Copyright statements
(i) The author of this thesis (including any appendices and/or schedules to this thesis) owns
certain copyright or related rights in it (the “Copyright”) and s/he has given The
University of Manchester certain rights to use such Copyright, including for
administrative purposes.
(ii) Copies of this thesis, either in full or in extracts and whether in hard or electronic copy,
may be made only in accordance with the Copyright, Designs and Patents Act 1988 (as
amended) and regulations issued under it or, where appropriate, in accordance with
licensing agreements which the University has from time to time. This page must form
part of any such copies made.
(iii) The ownership of certain Copyright, patents, designs, trade marks and other intellectual
property (the “Intellectual Property”) and any reproductions of copyright works in the
thesis, for example graphs and tables (“Reproductions”), which may be described in this
thesis, may not be owned by the author and may be owned by third parties. Such
Intellectual Property and Reproductions cannot and must not be made available for use
without the prior written permission of the owner(s) of the relevant Intellectual Property
and/or Reproductions.
(iv) Further information on the conditions under which disclosure, publication and
commercialisation of this thesis, the Copyright and any Intellectual Property and/or
reproductions described in it may take place is available in The University IP Policy, in
any relevant Thesis restriction declarations deposited in the University Library, The
University Library’s regulations and in The University’s policy on presentation of Theses.

14
Preface to the alternative format
The thesis is being presented in the alternative format in accordance with the rules and regulations
of the University of Manchester. The results chapters presented herein are in manuscript form in the
style suitable for their intended journal of submission. However, elements have been reformatted
(with permission from the publishers) to ensure these form a cohesive body of work.
Individual contributions to results chapters and manuscripts are:
Chapter 3: A structural and kinetic characterization of mutagenic variants of PETNR
Contributions: Alex Geddes, Andreea Iorgu, Sam Hay, Jon Waltho & Nigel Scrutton designed the
research.
This Manuscript is not currently submitted to any journal.
Alex Geddes performed molecular biology, protein expression and purification, and structural and
kinetic characterisation of PETNR variants. X-ray diffraction data was collected by Colin Levy and
Alex Geddes completed model building and refinement. Andreea Iorgu performed NMR studies on
PENTR-NAD(P)H4 complexes.
Alex Geddes wrote the manuscript
Chapter 4: Donor-Acceptor Distance Sampling Enhances the Performance of “Better
than Nature” Nicotinamide Coenzyme Biomimetics
Alexander Geddes, Caroline E. Paul, Sam Hay Frank Hollman and Nigel S. Scrutton. J. Am. Chem.
Soc., 2016, 138 (35), pp 11089–11092
Contributions: Alex Geddes, Caroline E. Paul, Sam Hay, Frank Hollman & Nigel Scrutton designed
the research.
Alex Geddes carried out protein expression and purification, and kinetic experiments. Substrates
were synthesized by Caroline E. Paul. Computational modelling/DFT calculations were performed by
Sam Hay.
Alex Geddes, Sam Hay and Nigel Scrutton wrote the manuscript.
Chapter 5: An Investigation of Hydride Donor-Acceptor Distances Within PETNR
Ligand Complexes as a Function of Pressure Using Intermoleculer Nuclear Overhauser Effect NMR Spectroscopy Contributions: Alex Geddes, Nicky Baxter, Matt Cliff, Jon Waltho, Sam Hay & Nigel Scrutton
designed the research.
This Manuscript is not currently submitted to any journal.
Alex Geddes performed protein expression and purification, and carried out all NMR experiments.
Alex Geddes wrote the manuscript.
15
Chapter 1
1.1 Enzyme catalysis and fast-timescale protein dynamics
The most prevalent of all enzyme-catalyzed reactions observed throughout biology are those
involving the transfer of hydrogen. Oxidoreductases and hydrolases alone represent over 50 % of all
known enzymes.1 These enzymes are involved in the fundamental biochemical processes that
underpin life; including the conversion of solar energy into complex sugars during photosynthesis
and the provision of cellular energy in the form of molecular carriers following respiration.2,3 The
complex three-dimensional structures of redox enzymes have evolved to enable precise spatial
control of interacting species, exact tuning of the electrostatic properties of reactant molecules and
dynamic modulation of the reaction coordinate. Compelling evidence now links the flexible properties
of enzymes, or protein dynamics, to the catalytic function of enzymes.4 A wide array of motions
occurring across a broad range of timescales have now been shown to facilitate substrate binding,
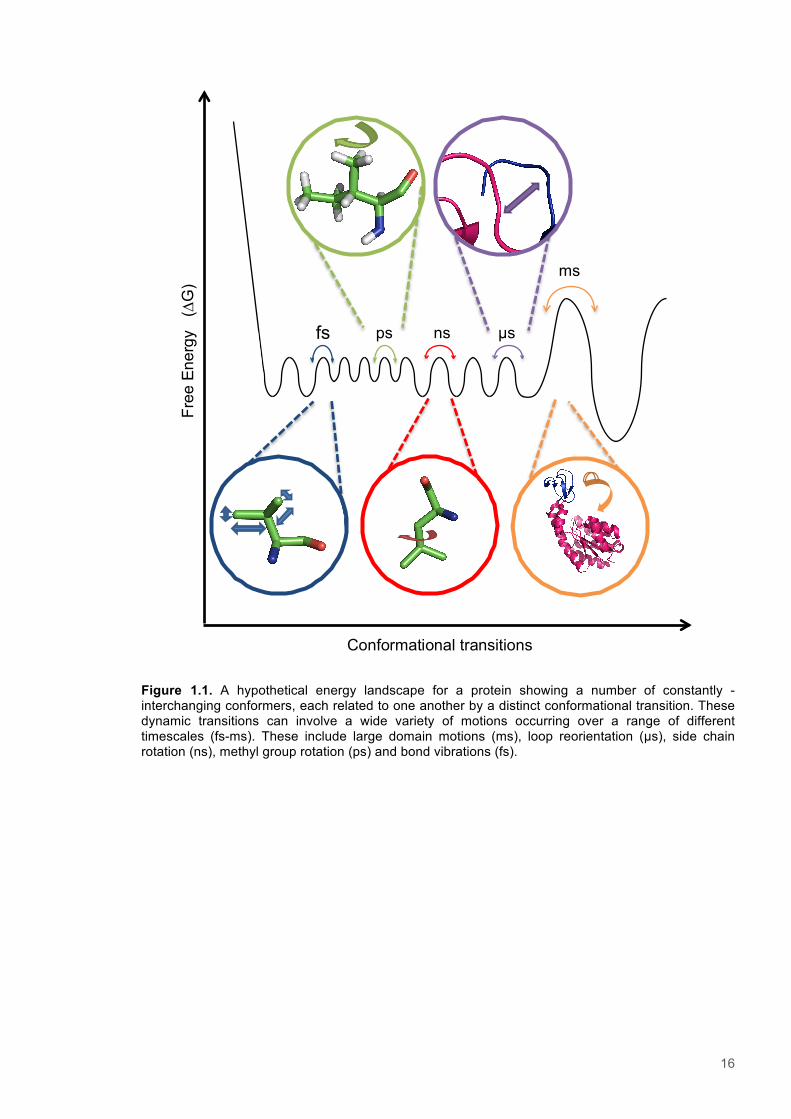
product release, and rate-limiting chemistry during catalytic turnover (Figure 1.1).5 For example, the
opening and closing of the lid domain in adenylate kinase occurs over a µs–ms timescale and is
shown to be rate limiting for catalysis, but arises through the combined effects of sub-ps motions
occurring in a critical hinge region.6 Despite the apparently simplistic chemistry of oxidoreductase
enzymes, there is still much dispute over the mechanisms of enzymatic H-transfer and the utility of
faster-timescale protein motions.7-9
Under physiological conditions, enzymes exist as a constantly interchanging population of
conformers undergoing a range of motions.4 The magnitude and timescale of motions observed is
determined by the protein fold and environmental conditions, but can also be influenced by
interactions with substrate molecules.10 Catalytic roles have been established for many of the
‘slower’ conformational transitions seen in enzyme-substrate complexes, such as domain
reorientation (µs-ms) and loop restructuring (ns-µs).6 More contentious is the role that motions
occurring closer to the timescale of H-transfer reactions perform, in particular sub picosecond bond
vibrations.7-9 Probing the role of such motions experimentally is more challenging using the currently
available array of kinetic and spectroscopic techniques. As a result, much of our current
understanding arises from indirect methods of probing the chemical step and computational
modeling of enzyme reactions.11,12 Based on these approaches, some argue that networks of
thermally equilibrated vibrational motions are involved in sampling of the donor to acceptor distance
in order to facilitate H-transfer reactions.13,14 This debate is stimulating the generation of novel
theoretical models to describe enzyme catalysis, which incorporate a role for protein dynamics
through consideration of the quantum mechanical properties of H-transfer reactions, and is helping to
advance our understanding of the enzymatic process.7,15
16
Figure 1.1. A hypothetical energy landscape for a protein showing a number of constantly -interchanging conformers, each related to one another by a distinct conformational transition. These dynamic transitions can involve a wide variety of motions occurring over a range of different timescales (fs-ms). These include large domain motions (ms), loop reorientation (µs), side chain rotation (ns), methyl group rotation (ps) and bond vibrations (fs).
Free
Ene
rgy
(∆G
)
Conformational transitions
ms
µs ns ps fs
17
1.2 The Old Yellow Enzyme family
1.2.1 Discovery of the Flavin-dependent family of ene-reductases
The first member of the Old Yellow Enzyme family was isolated from Saccharomyces pastorianus by
Warburg & Christian in 1932, and the name has since become synonymous with the growing family
of flavoprotein oxidoreductases.16 However, It was not until the discovery of a second ‘new’ yellow
enzyme that the ‘old’ prefix was added and the enzyme was initially known simply as the
gelbeferment, or yellow enzyme, due to its characteristic colored cofactor.17 This was later shown to
be a separate chemical entity to the colorless apoprotein and is now known to be Flavin
mononucleotide (FMN; Figure 1.2).18 Experiments performed on flavoenzyme systems were among
the first to employ the steady-state and stopped-flow approaches that are still employed ubiquitously
across the fields of biology and biochemistry.19 These studies enabled us to begin to decipher the
complex mechanistic details of enzyme catalysis. For example, Massey’s work on dihydrolipoamide
dehydrogenase showed that the catalytic cycles of FMN-dependent enzymes could be separated
into two half reactions and later, through experiments with flavoprotein hydroxylases, that transient
intermediates in enzymatic reactions could be resolved by stopped-flow techniques.19 The FMN
cofactor has remained an important experimental system in mechanistic enzymology ever since and
enzymes containing it are now known to participate in a wide range of biological processes including
drug metabolism, steroid hormone synthesis and photosynthesis.20-22
The identification of closely related homologues of the original Old Yellow Enzyme (OYE1) in
Saccharomyces carlesbergensis and later in Saccharomyces cerevisiae represented the beginning
of the discovery of numerous proteins belonging to the expanding OYE enzyme family.23,24 The
family now corresponds with almost 500 distinct proteins in the Uniprot protein database.25 These
represent proteins from a wide range of different phyla, including marine bacteria (Hoeflea
phototrophica), Plants (Arabidopsis thaliana), and also thermophilic bacteria (Archaeoglobus
fulgidus).26-28 Some of these are important for the metabolic processing of sulphur and reductive
denitrification in bacteria found in oil fields and on explosive contaminated environments,
respectively.29 These include Pentaeryhtritol tetranitrate reductase (Enterobacter cloacae PB2),
Morphinone reductase (Pseudomonas putida M10) and Thermophilic old yellow enzyme
(pseudethanolicus E39).29,30
Although they essentially participate solely in the reduction of α/β-unsaturated alkene bonds, the
OYE family enzymes are able to act upon a wide array of alkene-group containing chemical
moieties. More recently, the number of known family members has continued to increase, largely
due to enhanced interest in the family as a result of their suitability as enantioseletive ene-
reductases for biocatalytic applications.16 Some of these more recent additions are from the
cyanobacterial genera of Gloeobacter, Synechococcus, Cyanothece and Acaryochloris were
discovered through a combination of culture screening techniques and searches of the growing
numbers of genomes available in sequence databases.31,32 These latest discoveries include LacER
18
(Lactobacillus caseistr) that includes aldehydes, ketones and anhydrides among its functionally
permissive substrate functionalilities.33 Also OYERo2 (Rhodococcus opacus 1CP) that acts upon
cyclic enone and maleimide groups.34 Another recently discovered OYE-relative Achr-OYE4
(Achromobacter sp. JA81), acts upon ester- and cyano- derivative groups, as well as α/β-
unsaturated nitroalkenes.35
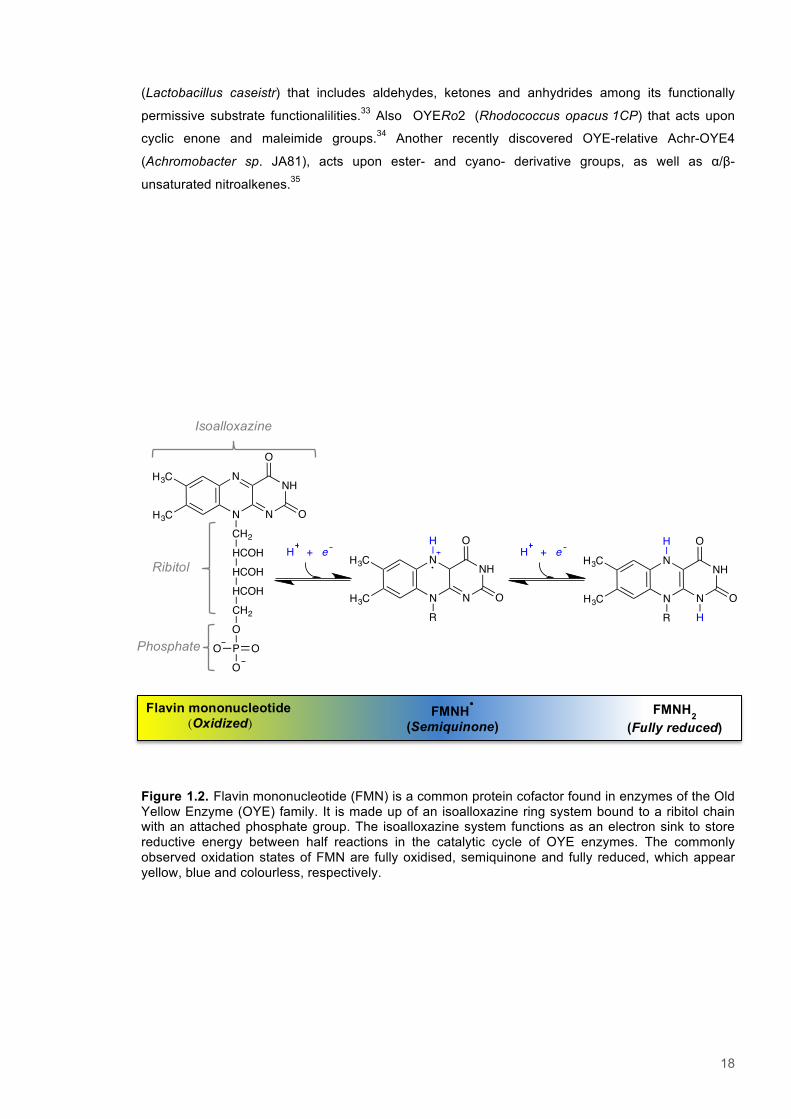
Figure 1.2. Flavin mononucleotide (FMN) is a common protein cofactor found in enzymes of the Old Yellow Enzyme (OYE) family. It is made up of an isoalloxazine ring system bound to a ribitol chain with an attached phosphate group. The isoalloxazine system functions as an electron sink to store reductive energy between half reactions in the catalytic cycle of OYE enzymes. The commonly observed oxidation states of FMN are fully oxidised, semiquinone and fully reduced, which appear yellow, blue and colourless, respectively.
Isoalloxazine
N
N
NH
NH3C
H3C
O
O
R
H
N
N
NH
NH3C
H3C
OCH2
O
HCOHHCOHHCOHCH2OP OOO
N
N
NH
NH3C
H3C
O
O
R
H
H
Ribitol
Phosphate
Flavin mononucleotide (Oxidized)
FMNH�
(Semiquinone) FMNH2
(Fully reduced)
H + eH + e
19
1.2.2 The mechanism of catalysis
OYEs are oxidoreductase enzymes that facilitate the transfer of a hydride, i.e. proton with two
electrons attached, and utilize an FMN cofactor to shuttle reductive power from a nicotinamide
coenzyme to a variety of substrates. The mechanism of catalysis is consistent with a ping-pong, or
double-displacement, type.36-38 This consists of the first substrate binding and transferring a reactive
substituent to the enzyme, or enzyme-bound cofactor. This is followed by dissociation of the first
substrate, before the second binds and receives the reactive group from the enzyme.39 After the
second substrate is released, the enzyme and/or cofactors are returned to the original state and are
ready to repeat the catalytic cycle.
OYEs participate in a two-step cycle that initiates with reduction of the non-covalently bound FMN
cofactor by a nicotinamide coenzyme, such as NADPH or NADH. Binding of the coenzyme results in
the formation of a charge transfer complex (CTC) that absorbs light in the 520–600 nm range and
has maximal absorbance at 555 nm.40,41 A hydride is then transferred from the C4-pro R position of
the nicotinamide coenzyme to the N5 atom of FMN.42 The magnitude of the Kinetic Isotope Effects
(KIE) observed for H-transfers in the reductive half reaction for a number of OYEs implicates a
quantum mechanical tunneling mechanism.13,43 Furthermore, analysis of the temperature and
pressure dependencies of KIEs in OYE enzymes has provided evidence for reaction coupled, or
promoting, motions important for facilitating H-transfer via tunneling.13 Upon completion of the
reductive half reaction a two electron, or fully reduced form of the prosthetic FMN group is realized
(Figure 1.3).44 As this takes place, a simultaneous bleaching of absorbance corresponding with the
fully oxidised FMN occurs at 464 nm.41 The decay of the CTC and concomitant loss of 555 nm
absorbance is kinetically indistinguishable from flavin reduction, indicating that CTC dissociation
occurs as a consequence of FMN reduction, which is rate-limiting.45 The phosphorylated form of the
coenzyme is largely thought to be the physiological reductant for the majority OYEs.46,47 This has
been inferred as a result of the favourable, i.e. faster, reactivity seen with NADPH. However, there is
at least one family member with which NADH is known to react fastest and thus is understood to be
the true physiological reductant.48 Interestingly, it has been observed OYE itself exhibits a slight
preference for the less common α-anomer of NADPH.49
The second, or oxidative, phase of the reaction cycle involves the stereospecific reduction of a α/β-
unsaturated alkene moiety. This phase proceeds via a nucleophilic hydride attack at the β-carbon of
the alkene bond and culminates with protonation of the α-carbon.45 The second proton is donated by
a highly conserved active site tyrosine residue in some OYEs, but is sourced from ordered water
molecule in others.50 During substrate reduction the highly electronegative activating substituents
facilitate a net anti-, or trans-addition of two protons in place of the alkene bond.51 This step in the
reaction cycle is the slowest and is therefore rate limiting in terms of catalytic turnover.38 The
oxidative substrate profile for OYE family enzymes is incredibly broad.52 Elucidation of the exact
physiological role of OYE enzymes is therefore difficult, but some studies have noted the tight
20
binding of bulky phenol and steroid compounds and therefore suggested they function during yeast
sterol metabolism.24,53 Among the permissible substrate groups identified for OYE enzymes are
aldehydes, carboxylic acids, enals, enones, enamides, ketones, nitroalkenes, nitroolefins, cyclic
triazines many more associated derivatives.52,54-60 They are also capable of cleaving nitrate ester
groups, although this is proposed to occur via radical-based mechanism.53
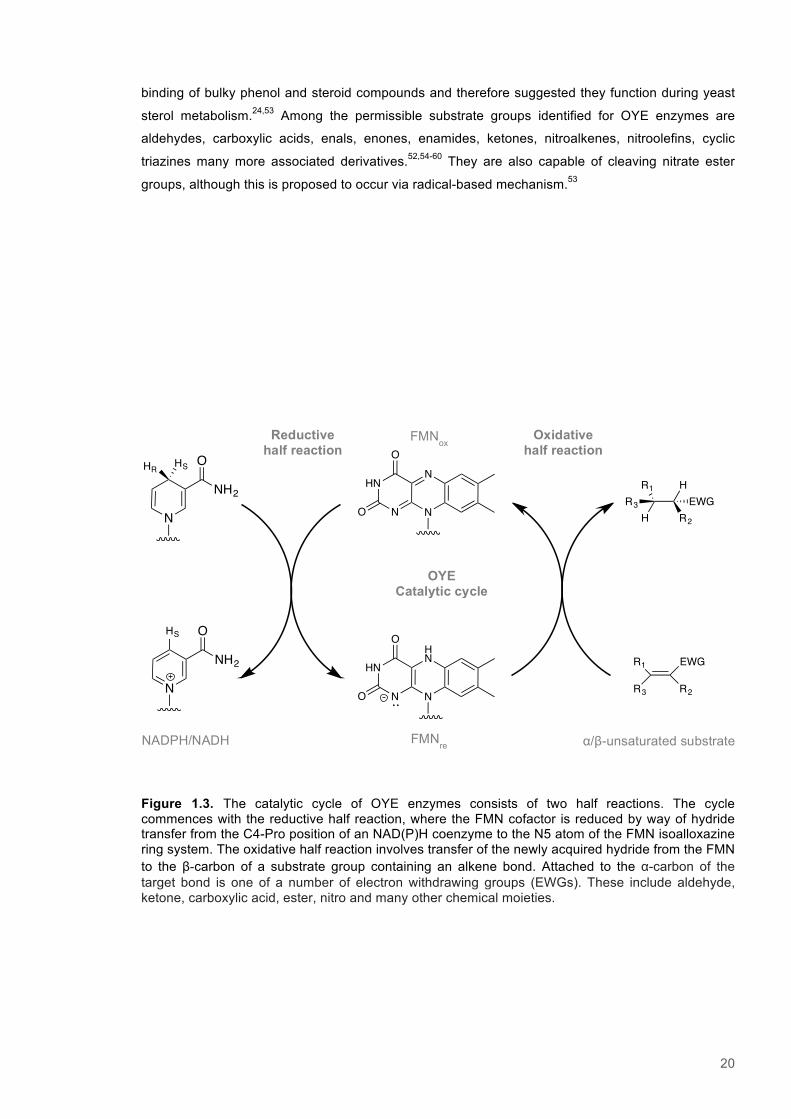
Figure 1.3. The catalytic cycle of OYE enzymes consists of two half reactions. The cycle commences with the reductive half reaction, where the FMN cofactor is reduced by way of hydride transfer from the C4-Pro position of an NAD(P)H coenzyme to the N5 atom of the FMN isoalloxazine ring system. The oxidative half reaction involves transfer of the newly acquired hydride from the FMN to the β-carbon of a substrate group containing an alkene bond. Attached to the α-carbon of the target bond is one of a number of electron withdrawing groups (EWGs). These include aldehyde, ketone, carboxylic acid, ester, nitro and many other chemical moieties.
OYE Catalytic cycle
Oxidative half reaction
Reductive half reaction
FMNox
FMNre
NADPH/NADH α/β-unsaturated substrate
N
N
HN
NO
O
N
O
NH2
HR HS
N
O
NH2
HS
HN
N
HN
NO
O
R1 EWG
R3 R2
R1 H
H R2
R3 EWG
N
N
HN
NO
O
N
O
NH2
HR HS
N
O
NH2
HS
HN
N
HN
NO
O
R1 EWG
R3 R2
R1 H
H R2
R3 EWG
N
N
HN
NO
O
N
O
NH2
HR HS
N
O
NH2
HS
HN
N
HN
NO
O
R1 EWG
R3 R2
R1 H
H R2
R3 EWG
21
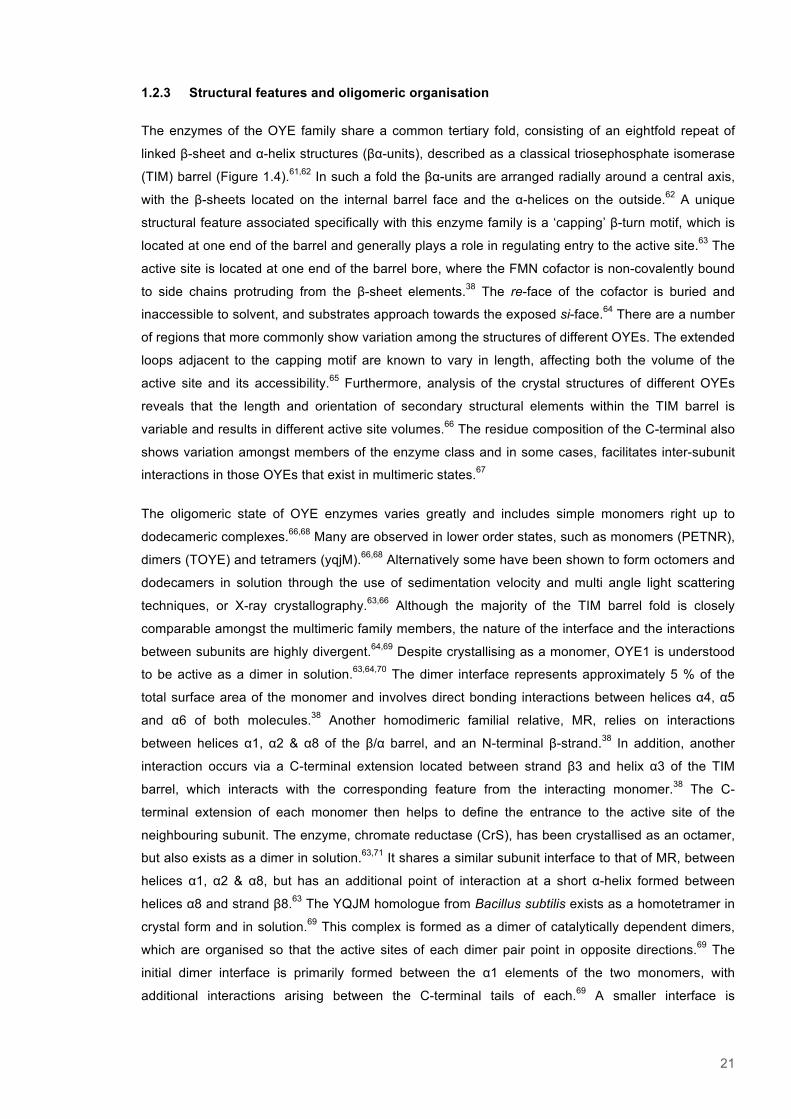
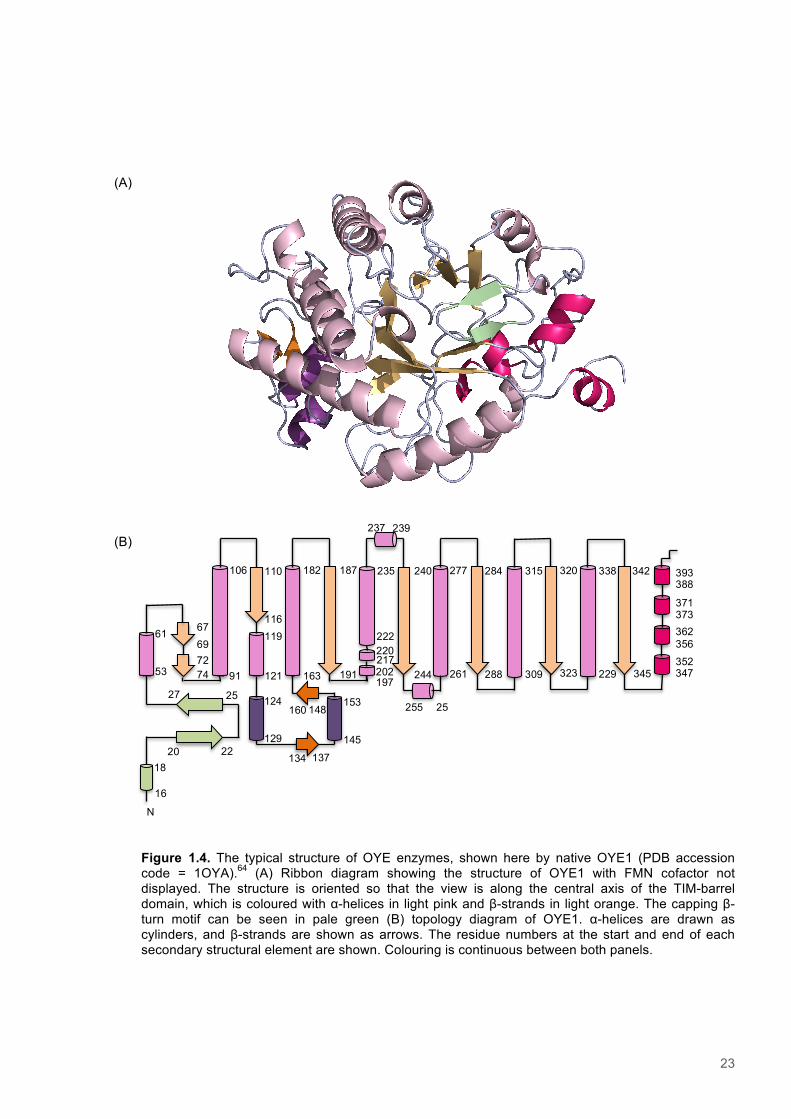
1.2.3 Structural features and oligomeric organisation
The enzymes of the OYE family share a common tertiary fold, consisting of an eightfold repeat of
linked β-sheet and α-helix structures (βα-units), described as a classical triosephosphate isomerase
(TIM) barrel (Figure 1.4).61,62 In such a fold the βα-units are arranged radially around a central axis,
with the β-sheets located on the internal barrel face and the α-helices on the outside.62 A unique
structural feature associated specifically with this enzyme family is a ‘capping’ β-turn motif, which is
located at one end of the barrel and generally plays a role in regulating entry to the active site.63 The
active site is located at one end of the barrel bore, where the FMN cofactor is non-covalently bound
to side chains protruding from the β-sheet elements.38 The re-face of the cofactor is buried and
inaccessible to solvent, and substrates approach towards the exposed si-face.64 There are a number
of regions that more commonly show variation among the structures of different OYEs. The extended
loops adjacent to the capping motif are known to vary in length, affecting both the volume of the
active site and its accessibility.65 Furthermore, analysis of the crystal structures of different OYEs
reveals that the length and orientation of secondary structural elements within the TIM barrel is
variable and results in different active site volumes.66 The residue composition of the C-terminal also
shows variation amongst members of the enzyme class and in some cases, facilitates inter-subunit
interactions in those OYEs that exist in multimeric states.67
The oligomeric state of OYE enzymes varies greatly and includes simple monomers right up to
dodecameric complexes.66,68 Many are observed in lower order states, such as monomers (PETNR),
dimers (TOYE) and tetramers (yqjM).66,68 Alternatively some have been shown to form octomers and
dodecamers in solution through the use of sedimentation velocity and multi angle light scattering
techniques, or X-ray crystallography.63,66 Although the majority of the TIM barrel fold is closely
comparable amongst the multimeric family members, the nature of the interface and the interactions
between subunits are highly divergent.64,69 Despite crystallising as a monomer, OYE1 is understood
to be active as a dimer in solution.63,64,70 The dimer interface represents approximately 5 % of the
total surface area of the monomer and involves direct bonding interactions between helices α4, α5
and α6 of both molecules.38 Another homodimeric familial relative, MR, relies on interactions
between helices α1, α2 & α8 of the β/α barrel, and an N-terminal β-strand.38 In addition, another
interaction occurs via a C-terminal extension located between strand β3 and helix α3 of the TIM
barrel, which interacts with the corresponding feature from the interacting monomer.38 The C-
terminal extension of each monomer then helps to define the entrance to the active site of the
neighbouring subunit. The enzyme, chromate reductase (CrS), has been crystallised as an octamer,
but also exists as a dimer in solution.63,71 It shares a similar subunit interface to that of MR, between
helices α1, α2 & α8, but has an additional point of interaction at a short α-helix formed between
helices α8 and strand β8.63 The YQJM homologue from Bacillus subtilis exists as a homotetramer in
crystal form and in solution.69 This complex is formed as a dimer of catalytically dependent dimers,
which are organised so that the active sites of each dimer pair point in opposite directions.69 The
initial dimer interface is primarily formed between the α1 elements of the two monomers, with
additional interactions arising between the C-terminal tails of each.69 A smaller interface is

22
responsible for linking the dimeric units, which involves the helix-loop-helix motifs of α6 and α7, and
is facilitated predominantly by hydrophobic interactions.69 The tetrameric OYE proteins have been
identified via sequence analysis to form part of a subclass of OYE proteins, commonly described as
the ‘thermophilic-like’ OYE class.69
23
Figure 1.4. The typical structure of OYE enzymes, shown here by native OYE1 (PDB accession code = 1OYA).64 (A) Ribbon diagram showing the structure of OYE1 with FMN cofactor not displayed. The structure is oriented so that the view is along the central axis of the TIM-barrel domain, which is coloured with α-helices in light pink and β-strands in light orange. The capping β-turn motif can be seen in pale green (B) topology diagram of OYE1. α-helices are drawn as cylinders, and β-strands are shown as arrows. The residue numbers at the start and end of each secondary structural element are shown. Colouring is continuous between both panels.
16
18
20 22
27 25
53
61
69 67
74 72
91
106
116
110
121
119
129
124
137 134
145
153
160 148
163
182
191
187
197 202 217 220
N
222
235
239 237
244
240
261
277
257
255
284
288
315
309
320
323
338
229
342
345
347 352 356 362 373 371 388 393
(A)
(B)
24
1.2.4 Conserved features within the active site of OYE enzymes
The organisation and architecture of functionally important active site residues is moderately
conserved throughout the OYE enzyme class. A highly conserved region of residues approximately
40 amino acids in length is responsible for cofactor and coenzyme interactions, as well as facilitating
catalytic chemistry (Figure 1.5).46 The composition of residues in the substrate-binding region along
with the overall size of active site are thought to be the key determinants of substrate specificity.64,69
The active site is also encompassed within a region of predominantly hydrophobic residues, which
protects active site chemistry from interactions with the bulk solvent.72,38 Access to the active site is
via the substrate access channel, essentially the TIM-barrel bore, which is lined with predominately
hydrophobic amino acid residues in all OYE homologues.38,68,73
A unifying feature of the active site of OYE enzymes is the nature of the FMN-binding interactions
and subsequent orientation of the cofactor. The re-face of the FMN is buried within the protein and is
tethered by an extensive network in hydrogen bonds with the side chains of Thr/Cys26, His191,
Arg243, and Arg348 (OYE1 numbering).66,74 These residues are highly conserved amongst
members of the OYE family, including both the classical and thermophilic-like subclasses.74 The
FMN-coordinating residues also play a role in modulating the structure and redox properties of the
cofactor. A conserved active residue, Thr26 in OYE1, is directly bound to the FMN-O4 atom and
influences the redox potential of the flavin through stabilization of the reduced, and negatively
charged form of the flavin.44 In OYEs, the bound FMN exhibits a bend along the isoalloxazine axis,
termed a ‘butterfly’ bend, which results in a 1.6 Å displacement of the dimethylbenzyl group.64,66,69,75
This feature is also seen extensively in many other flavoenzyme classes and the magnitude of the
bend is thought to correlate with the redox potential of the cofactor.76,77
A number of key side chains are involved in binding both oxidative and reductive substrates are
present throughout the majority of OYEs.78 A His191 and His/Asn194 residue pair (OYE1 numbering)
are essential for binding both oxidative and reductive substrates in all OYE enzymes. Various studies
employing mutagenesis of these two residues have been performed in a number of OYEs.36,40,68
Introducing mutations at these two positions generally lead to a decrease in substrate-binding affinity
and decreased charge-transfer absorbance, but the enzymes were still catalytically functional.40 The
His191 residue is fully conserved within the class and, in OYE1 binds directly to the carbonyl oxygen
of α/β-unsaturated carbonyl substrates and positions the β carbon atom in suitable alignment above
the FMN N5.40 At the second position, 194, there is either a histidine, or aspartate residue. Those
with a histidine at this position include Yqjm, XenA, and PETNR, whereas in NerA, OYE1 and MR
there is an asparagine residue.78 The same dyad is also responsible binding the nicotinamide
substrates during the reductive phase of the catalytic cycle.40 Crystal structure coordinates suggest
that the amide oxygen of the nicotinamide portion of coenzyme is suitably positioned to H-bond to
the side chains of His191/Asn194.61 An additional contribution to the stability of the substrate bound
complex comes from the π–orbital stacking interaction between the FMN-isoalloxazine and aromatic
substituents of both oxidative and reductive substrates.13 This gives rise to the customary charge
25
transfer complex (CTC) absorbance at 555 nm in both reductive and oxidative stages of the reaction
cycle.64,79 An active site tyrosine, Tyr194 in OYE1, is also reasonably well conserved in OYE
enzymes and functions as the proton donor alongside the FMN-N5 to provide two protons for the
reduction of α/β-unsaturated alkenes. In some instances mutations of this residue lead to the
enzyme being unable to facilitate reduction of the target moiety.46,80 However, in PETNR an ordered
water molecule is thought to serve as the proton donor and performs this function.50
1.2.5 Characteristic features of the OYE subclasses
The division of the OYE enzymes into ‘classical’ and ‘thermophilic-like’ subclasses was justified
largely on the basis of comparative sequence analysis of the related enzymes.69 Enzymes belonging
to the two subclasses show differential substrate selectivity and quaternary structural arrangements.
On the whole classical OYEs, which represent the greater proportion of the enzyme family, tend to
be monomeric (PETNR), or dimeric proteins (MR).24,68 Whereas the thermophilic-like subclass
enzymes favour higher order states, such as tetramers (Yqjm) and octamers (TOYE).69 A
comparison of steady parameters observed with oxidative substrates revealed that classical OYEs
appeared to have a slightly broader substrate profile.66 For example, a comparison PETNR versus
TOYE and Yqjm revealed that the former showed activity towards a broader range substrates
containing ketone and cyclic enone functionalities.66 Unsurprisingly the thermophilic enzymes
showed greater activity towards the cyclic enone, 2-methyl cyclopentenone, when the temperature
was increased from 25 to 50 °C. Both PETNR and TOYE were highly active toward maleimide,
nitroalkene and enal groups.66 The difference in substrate preference is observed as a result of the
change in the residue composition and volume of the active site of the thermophilic-like enzymes
compared to the classical OYEs.
The enzymes identified as members of the ‘thermophilic-like’ class of OYEs include TOYE, Yqjm,
and also NADH-dependent oxidoreductase enzymes from Geobacillus kaustophilus and
Coprothermobacter proteolyticus.66,69,81,82 The enzymes of this family have larger and therefore more
solvent accessible active sites than the classical subclass members.69 The tetrameric enzymes, such
as Yqjm, exhibit a remarkable ‘shared’ active site. This involves a C-terminal arginine-finger (Arg336
in Yqjm) that projects into the active site of the neighbouring subunit and is involved in substrate
recognition.69 There is a high level of sequence similarity between enzymes of both classes in the
residue range 145-200, within which are many side chains that facilitate interactions with the FMN
cofactor (Yqjm numbering; Figure 1.2.5). However, there is conservation of a different subset of
active site residues among thermophilic-like OYEs, namely Cys26, Tyr28, Lys109, and Arg336 in
Yqjm.69 These subtle differences within the active site result in altered redox properties of the FMN
cofactor in the different subclasses.69,83 The most notable difference in the residue composition of
the active site of thermophilic OYEs is presence of Cys26 in place of the active site threonine seen in
members of the mesophilic subclass.69,84 In classical OYEs the hydroxyl group of this side chain is
known to H-bond directly to the FMN-O4 and helps control the redox potential the FMN cofactor.64
Analysis of the crystal structure of Yqjm reveals the equivlent side chain of Cys26 adopts mutliple

26
conformers and is able to bind either to the FMN-O4, or the FMN-O5.69 It has been suggested that
the cysteine residue may be capable of acting as a sensor and selectively modulate the redox
potential of the FMN upon substrate binding. A mutagenic study involving Xenobiotic reductase A
(Xen A) concluded that conversion of the corresponding cysteine (Cys27) did not significantly perturb
the catalytic properties of the enzyme, but instead influenced the substrate specificity and redox
properties of the cofactor.84 The presence of multiple copies of the gene encoding XenA, some with
an alanine at position 27 lead the authors to suggest the different isoforms with reduced side chain
bulk at this position are present to tailor the active site for binding larger substrates.
27
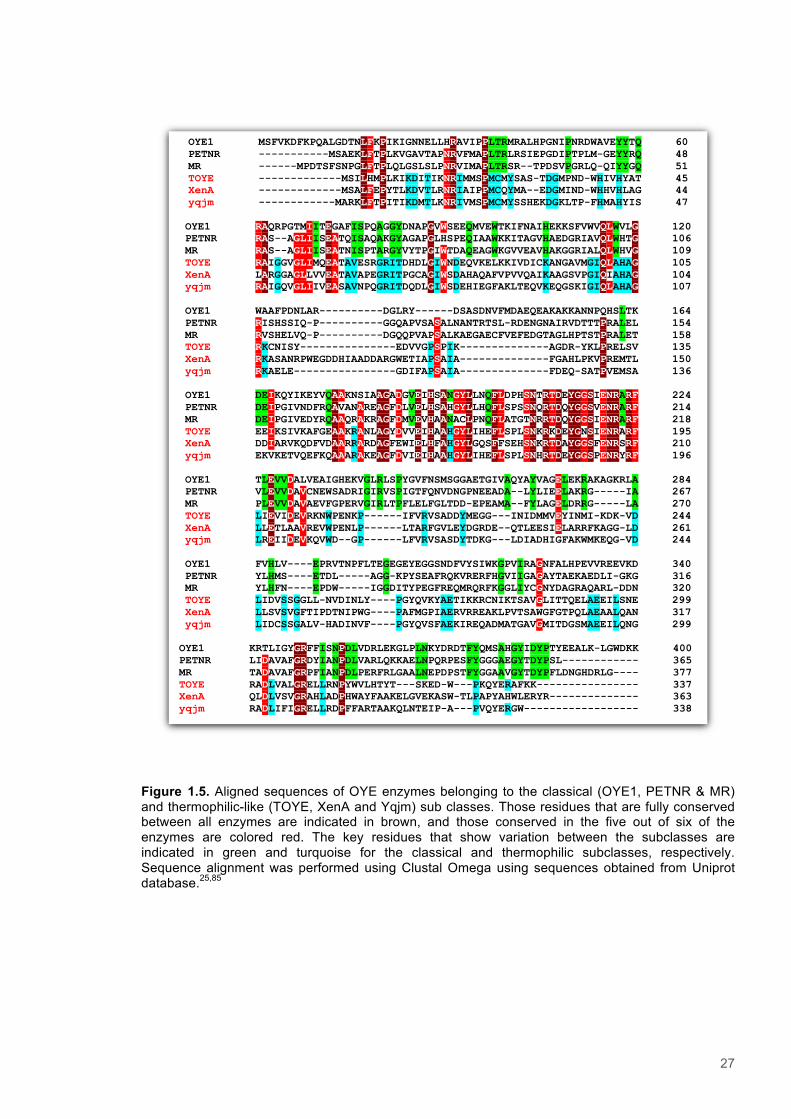
Figure 1.5. Aligned sequences of OYE enzymes belonging to the classical (OYE1, PETNR & MR) and thermophilic-like (TOYE, XenA and Yqjm) sub classes. Those residues that are fully conserved between all enzymes are indicated in brown, and those conserved in the five out of six of the enzymes are colored red. The key residues that show variation between the subclasses are indicated in green and turquoise for the classical and thermophilic subclasses, respectively. Sequence alignment was performed using Clustal Omega using sequences obtained from Uniprot database.25,85
OYE1 MSFVKDFKPQALGDTNLFKPIKIGNNELLHRAVIPPLTRMRALHPGNIPNRDWAVEYYTQ 60 PETNR -----------MSAEKLFTPLKVGAVTAPNRVFMAPLTRLRSIEPGDIPTPLM-GEYYRQ 48 MR ------MPDTSFSNPGLFTPLQLGSLSLPNRVIMAPLTRSR--TPDSVPGRLQ-QIYYGQ 51 TOYE -------------MSILHMPLKIKDITIKNRIMMSPMCMYSAS-TDGMPND-WHIVHYAT 45 XenA -------------MSALFEPYTLKDVTLRNRIAIPPMCQYMA--EDGMIND-WHHVHLAG 44 yqjm ------------MARKLFTPITIKDMTLKNRIVMSPMCMYSSHEKDGKLTP-FHMAHYIS 47
OYE1 RAQRPGTMIITEGAFISPQAGGYDNAPGVWSEEQMVEWTKIFNAIHEKKSFVWVQLWVLG 120 PETNR RAS--AGLIISEATQISAQAKGYAGAPGLHSPEQIAAWKKITAGVHAEDGRIAVQLWHTG 106 MR RAS--AGLIISEATNISPTARGYVYTPGIWTDAQEAGWKGVVEAVHAKGGRIALQLWHVG 109 TOYE RAIGGVGLIMQEATAVESRGRITDHDLGIWNDEQVKELKKIVDICKANGAVMGIQLAHAG 105 XenA LARGGAGLLVVEATAVAPEGRITPGCAGIWSDAHAQAFVPVVQAIKAAGSVPGIQIAHAG 104 yqjm RAIGQVGLIIVEASAVNPQGRITDQDLGIWSDEHIEGFAKLTEQVKEQGSKIGIQLAHAG 107
OYE1 WAAFPDNLAR----------DGLRY------DSASDNVFMDAEQEAKAKKANNPQHSLTK 164 PETNR RISHSSIQ-P----------GGQAPVSASALNANTRTSL-RDENGNAIRVDTTTPRALEL 154 MR RVSHELVQ-P----------DGQQPVAPSALKAEGAECFVEFEDGTAGLHPTSTPRALET 158 TOYE RKCNISY---------------EDVVGPSPIK--------------AGDR-YKLPRELSV 135 XenA RKASANRPWEGDDHIAADDARGWETIAPSAIA--------------FGAHLPKVPREMTL 150 yqjm RKAELE----------------GDIFAPSAIA--------------FDEQ-SATPVEMSA 136
OYE1 DEIKQYIKEYVQAAKNSIAAGADGVEIHSANGYLLNQFLDPHSNTRTDEYGGSIENRARF 224 PETNR DEIPGIVNDFRQAVANAREAGFDLVELHSAHGYLLHQFLSPSSNQRTDQYGGSVENRARF 214 MR DEIPGIVEDYRQAAQRAKRAGFDMVEVHAANACLPNQFLATGTNRRTDQYGGSIENRARF 218 TOYE EEIKSIVKAFGEAAKRANLAGYDVVEIHAAHGYLIHEFLSPLSNKRKDEYGNSIENRARF 195 XenA DDIARVKQDFVDAARRARDAGFEWIELHFAHGYLGQSFFSEHSNKRTDAYGGSFENRSRF 210 yqjm EKVKETVQEFKQAAARAKEAGFDVIEIHAAHGYLIHEFLSPLSNHRTDEYGGSPENRYRF 196
OYE1 TLEVVDALVEAIGHEKVGLRLSPYGVFNSMSGGAETGIVAQYAYVAGELEKRAKAGKRLA 284 PETNR VLEVVDAVCNEWSADRIGIRVSPIGTFQNVDNGPNEEADA--LYLIEELAKRG-----IA 267 MR PLEVVDAVAEVFGPERVGIRLTPFLELFGLTDD-EPEAMA--FYLAGELDRRG-----LA 270 TOYE LIEVIDEVRKNWPENKP------IFVRVSADDYMEGG---INIDMMVEYINMI-KDK-VD 244 XenA LLETLAAVREVWPENLP------LTARFGVLEYDGRDE--QTLEESIELARRFKAGG-LD 261 yqjm LREIIDEVKQVWD--GP------LFVRVSASDYTDKG---LDIADHIGFAKWMKEQG-VD 244
OYE1 FVHLV----EPRVTNPFLTEGEGEYEGGSNDFVYSIWKGPVIRAGNFALHPEVVREEVKD 340 PETNR YLHMS----ETDL-----AGG-KPYSEAFRQKVRERFHGVIIGAGAYTAEKAEDLI-GKG 316 MR YLHFN----EPDW-----IGGDITYPEGFREQMRQRFKGGLIYCGNYDAGRAQARL-DDN 320 TOYE LIDVSSGGLL-NVDINLY----PGYQVKYAETIKKRCNIKTSAVGLITTQELAEEILSNE 299 XenA LLSVSVGFTIPDTNIPWG----PAFMGPIAERVRREAKLPVTSAWGFGTPQLAEAALQAN 317 yqjm LIDCSSGALV-HADINVF----PGYQVSFAEKIREQADMATGAVGMITDGSMAEEILQNG 299
OYE1 KRTLIGYGRFFISNPDLVDRLEKGLPLNKYDRDTFYQMSAHGYIDYPTYEEALK-LGWDKK 400 PETNR LIDAVAFGRDYIANPDLVARLQKKAELNPQRPESFYGGGAEGYTDYPSL------------ 365 MR TADAVAFGRPFIANPDLPERFRLGAALNEPDPSTFYGGAAVGYTDYPFLDNGHDRLG---- 377 TOYE RADLVALGRELLRNPYWVLHTYT---SKED-W---PKQYERAFKK---------------- 337 XenA QLDLVSVGRAHLADPHWAYFAAKELGVEKASW-TLPAPYAHWLERYR-------------- 363 yqjm RADLIFIGRELLRDPFFARTAAKQLNTEIP-A---PVQYERGW------------------ 338
28
1.3 Pentaerythritol tetranitrate reductase (PETNR)
1.3.1 Structure & function
The enzyme Pentaerythritol tetranitrate reductase (PETNR) is a monomeric flavin mononucleotide
(FMN) cofactor containing oxidoreductase enzyme that weighs 39,489 KDa and belongs to the OYE
class.45 The enzyme was isolated from Enterobacter cloacae PB2, which was discovered in a site
contaminated with nitrogenous explosives. Remarkably the bacteria was able to survive with nitrate
esters, such as pentaerythritol tetranitrate (PETN), as the sole source of nitrogen.29 The enzyme is
typical of the OYE class, as it utilizes a reduced nicotinamide adenine dinucleotide phosphate
(NADPH) coenzyme for hydride donation, and catalyzes the reduction of a chemically diverse range
of substrates.68,86 Targets for catalysis include α/β unsaturated alkene-, ketone-, aldehyde-
nitroalkene-, maleimide-, carbonyl-, aromatic- and nitro- groups.52,86-89 The physiological substrate for
PETNR remains unidentified.89 Although the close evolutionary relationship PETNR shares with an
estrogen-binding protein from Candida albicans, BaiH, supports the suggestion that unsaturated
carbonyls may be the true target for catalysis.68
Crystal structures of the holoenzyme and PETNR in complex with NADH4 and various oxidative
substrates have been elucidated at atomic resolution using x-ray diffraction studies.13,68,87 The overall
fold is closely comparable to that of other enzymes in the OYE family, as the globular PETNR-protein
contains the characteristic 8-fold β/α-barrel domain and a non-covalently associated FMN cofactor
(Figure 1.6).64 45 Distinguishing features of the PETNR fold are the presence of a large β-hairpin
motif at the N-terminal barrel end and the externally positioned helix α8.68 The active site is situated
in a ≈ 20 Å-deep hydrophobic cavity that leads to the solvent exposed si-face of the FMN-cofactor.68
The substrate access channel is located between two antiparallel β-strands situated between strand
β3 and helix α3 of the barrel-domain.68 The channel is lined with hydrophobic tyrosine residues
(Tyr68, Tyr351) and capped by a β-hairpin motif that may regulate entry to the active site.88 Also
located within the active site are the NADPH-coenzyme and substrate binding sites.68
1.3.2 FMN cofactor and substrate binding sites within PETNR
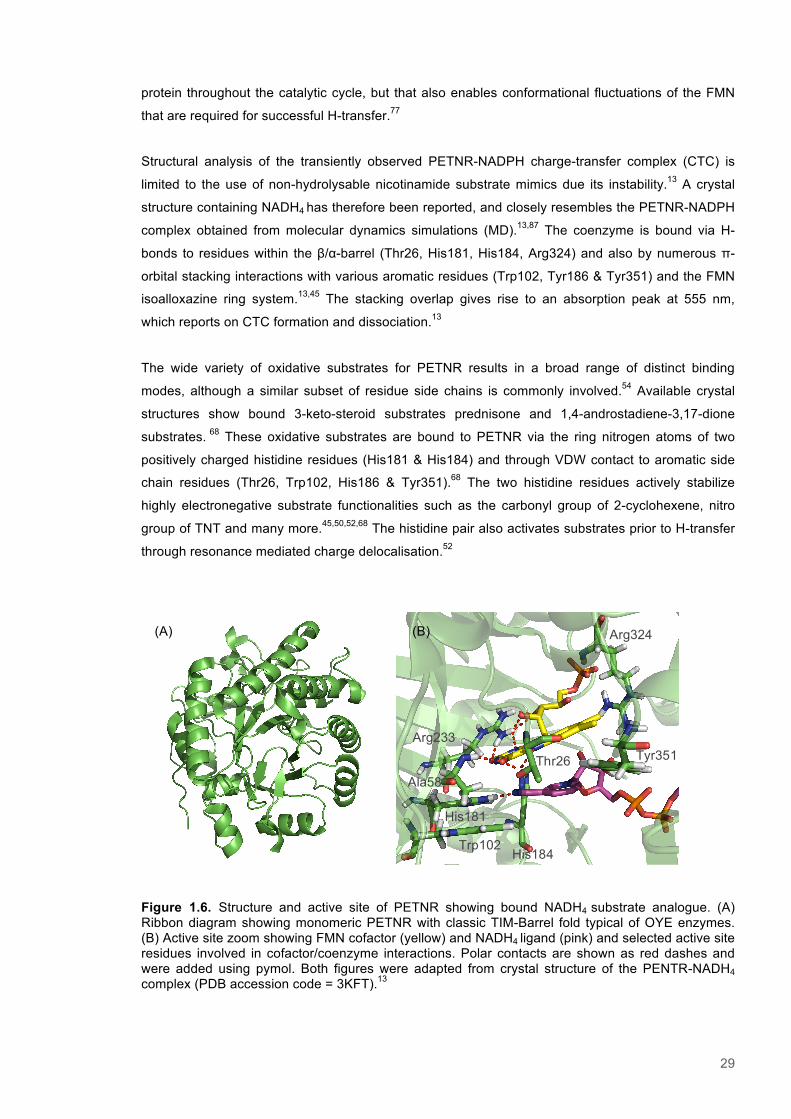
The FMN is positioned near to the centre of the β/α-barrel motif and bound mostly via H-bond
contacts between the isoalloxazine ring and residues within the central β-strands (Tyr26, Ala58,
His181, Arg233 & Tyr351; Figure 1.6).45,68 Further binding contacts are between the phosphate
substituent and the external helix located between Helix α8 and strand β8.68 Lastly, an entropic
contribution to FMN-binding is provided by numerous Van der Waals (VDW) interactions between
aliphatic residues and either the isoalloxazine system itself, or ring-bound methyl groups.68 A
tyrosine residue, Tyr351, interacts via a VDW contact area with the dimethylbenzene portion of the
FMN.68 The prosthetic group is bound in a manner that ensures it remains tightly bound to the
29
protein throughout the catalytic cycle, but that also enables conformational fluctuations of the FMN
that are required for successful H-transfer.77
Structural analysis of the transiently observed PETNR-NADPH charge-transfer complex (CTC) is
limited to the use of non-hydrolysable nicotinamide substrate mimics due its instability.13 A crystal
structure containing NADH4 has therefore been reported, and closely resembles the PETNR-NADPH
complex obtained from molecular dynamics simulations (MD).13,87 The coenzyme is bound via H-
bonds to residues within the β/α-barrel (Thr26, His181, His184, Arg324) and also by numerous π-
orbital stacking interactions with various aromatic residues (Trp102, Tyr186 & Tyr351) and the FMN
isoalloxazine ring system.13,45 The stacking overlap gives rise to an absorption peak at 555 nm,
which reports on CTC formation and dissociation.13
The wide variety of oxidative substrates for PETNR results in a broad range of distinct binding
modes, although a similar subset of residue side chains is commonly involved.54 Available crystal
structures show bound 3-keto-steroid substrates prednisone and 1,4-androstadiene-3,17-dione
substrates. 68 These oxidative substrates are bound to PETNR via the ring nitrogen atoms of two
positively charged histidine residues (His181 & His184) and through VDW contact to aromatic side
chain residues (Thr26, Trp102, His186 & Tyr351).68 The two histidine residues actively stabilize
highly electronegative substrate functionalities such as the carbonyl group of 2-cyclohexene, nitro
group of TNT and many more.45,50,52,68 The histidine pair also activates substrates prior to H-transfer
through resonance mediated charge delocalisation.52
Figure 1.6. Structure and active site of PETNR showing bound NADH4 substrate analogue. (A) Ribbon diagram showing monomeric PETNR with classic TIM-Barrel fold typical of OYE enzymes. (B) Active site zoom showing FMN cofactor (yellow) and NADH4 ligand (pink) and selected active site residues involved in cofactor/coenzyme interactions. Polar contacts are shown as red dashes and were added using pymol. Both figures were adapted from crystal structure of the PENTR-NADH4 complex (PDB accession code = 3KFT).13
Trp102 His184
His181
Ala58
Arg233
Arg324
Tyr351
(A) (B)
Thr26

30
1.4 Thermophilic Old Yellow enzyme (TOYE)
1.4.1 Structure & function
A more recently discovered OYE homologue is the thermophilic old yellow enzyme (TOYE) from
Thermoanaerobacter pseudethanolicus E39, which was isolated from a heterotrophic anaerobe
found in Yellowstone National Park.90 The bacterial strain is described as an extreme thermophile,
and was found to grow best at temperatures between 37 and 78 °C and from pH 4.4 to 9.8.91 In
addition to increased stability at high temperature, TOYE is also shown to be more stable in the
presence of water miscible solvents compared to classical OYEs.66 This enzyme has been shown to
act upon and reduce α/β-unsaturated ketones, aldehydes and nitroalkene substrate groups.66
The crystal structures of the holo-enzyme and NADH4 bound forms of TOYE have been
determined.66 Again the protein demonstrates a characteristic 8-fold β/α-barrel domain, or TIM
barrel, as that described for other OYE relatives (Figure 1.7).66 As for other thermophilic-like
enzymes, the protein exists as tetramer, or dimer of dimers.66 The subunit arrangement is virtually
identical to that of the another member of the subclass, Yqjm, and has water filled cavity at the
centre of the tetramer, where the entrances to the four active sites are located.66 The dimeric subunit
interaction is facilitated by a H-bond network between the same residues located on the C-terminal
tail of either subunit (Gln330, Tyr331 & Ala334) that are conserved amongst thermophilic-like
OYEs.66 There are also additional H-bonding interactions between the side chains of other residues
(Ser28/His42/Arg46 interact with Gln330/Tyr331/Tyr315 on the neighbouring subunit).66 The C-
terminal of each subunit contains an arginine finger that projects into, and forms part of, the active of
the neighbouring subunit, as has been observed in other thermophile-like OYEs.66 However, the
organisation of the C-terminus and the conformation of helix α8 is different to that seen in other
enzymes of the subclass. The C-terminal region shows undefined electron density in the available
crystal structures and is therefore thought to be significantly disordered within the central cavity.66
The interaction between the two sets of dimers is facilitated by residues from helix α6 and α7.66 This
involves both H-bonding interactions between the same side chains on opposing subunits (Tyr261,
Gly263, Lys267, Thr287, T288, Glu290 & Asn298) and also hydrophobic interactions between a
small number of residues (Tyr261, Pro262, Tyr264 and Leu291).66 In addition, there are a number of
salt bridges between a certain subset of side chains (Lys267, Glu270 and Arg300) that further
stabilize the interaction.66
1.4.2 FMN cofactor and substrate binding sites within TOYE
The active site of TOYE is larger and more open than its classical OYE relatives, owing to the
different lengths and arrangements two turn elements located between strands β6 and β7, and
between strand β5 and helix α5.66 Despite these differences, the residues involved in FMN
coordination are highly conserved and similar to those of other OYE relatives.30,44,69 The conserved
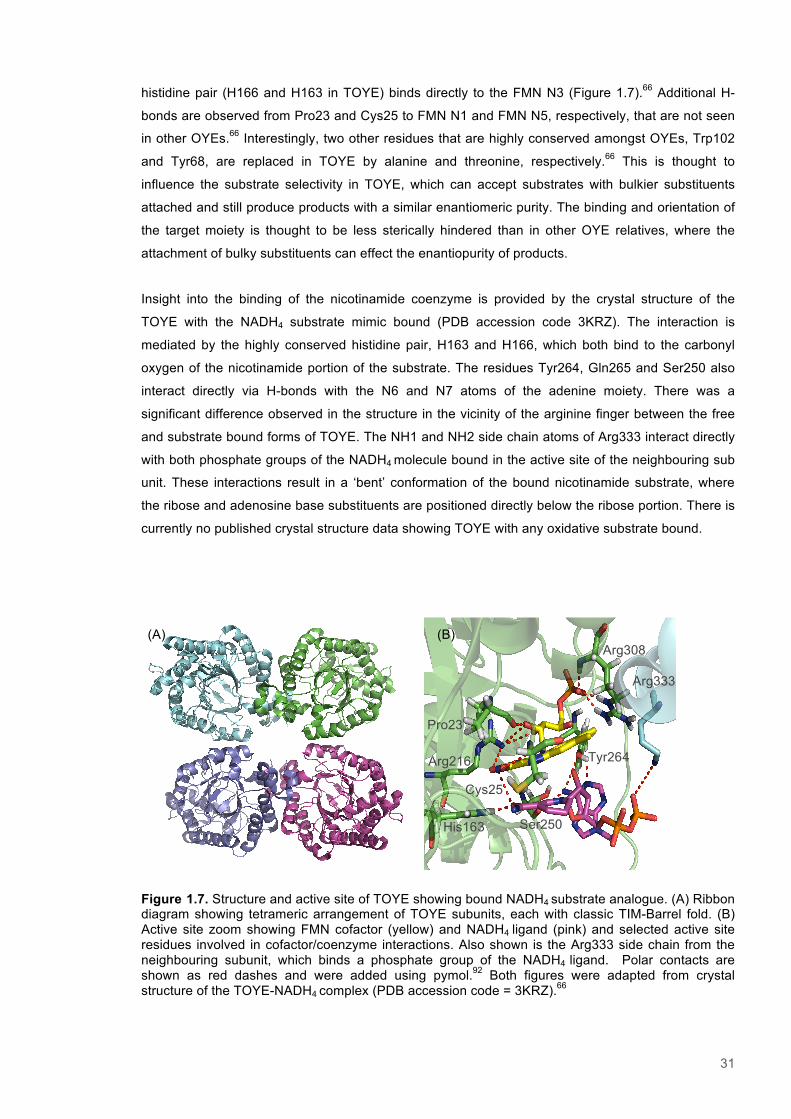
31
histidine pair (H166 and H163 in TOYE) binds directly to the FMN N3 (Figure 1.7).66 Additional H-
bonds are observed from Pro23 and Cys25 to FMN N1 and FMN N5, respectively, that are not seen
in other OYEs.66 Interestingly, two other residues that are highly conserved amongst OYEs, Trp102
and Tyr68, are replaced in TOYE by alanine and threonine, respectively.66 This is thought to
influence the substrate selectivity in TOYE, which can accept substrates with bulkier substituents
attached and still produce products with a similar enantiomeric purity. The binding and orientation of
the target moiety is thought to be less sterically hindered than in other OYE relatives, where the
attachment of bulky substituents can effect the enantiopurity of products.
Insight into the binding of the nicotinamide coenzyme is provided by the crystal structure of the
TOYE with the NADH4 substrate mimic bound (PDB accession code 3KRZ). The interaction is
mediated by the highly conserved histidine pair, H163 and H166, which both bind to the carbonyl
oxygen of the nicotinamide portion of the substrate. The residues Tyr264, Gln265 and Ser250 also
interact directly via H-bonds with the N6 and N7 atoms of the adenine moiety. There was a
significant difference observed in the structure in the vicinity of the arginine finger between the free
and substrate bound forms of TOYE. The NH1 and NH2 side chain atoms of Arg333 interact directly
with both phosphate groups of the NADH4 molecule bound in the active site of the neighbouring sub
unit. These interactions result in a ‘bent’ conformation of the bound nicotinamide substrate, where
the ribose and adenosine base substituents are positioned directly below the ribose portion. There is
currently no published crystal structure data showing TOYE with any oxidative substrate bound.
Figure 1.7. Structure and active site of TOYE showing bound NADH4 substrate analogue. (A) Ribbon diagram showing tetrameric arrangement of TOYE subunits, each with classic TIM-Barrel fold. (B) Active site zoom showing FMN cofactor (yellow) and NADH4 ligand (pink) and selected active site residues involved in cofactor/coenzyme interactions. Also shown is the Arg333 side chain from the neighbouring subunit, which binds a phosphate group of the NADH4 ligand. Polar contacts are shown as red dashes and were added using pymol.92 Both figures were adapted from crystal structure of the TOYE-NADH4 complex (PDB accession code = 3KRZ).66
His163
Arg216
Pro23
Cys25
Ser250
Tyr264
Arg308
Arg333
(A) (B)
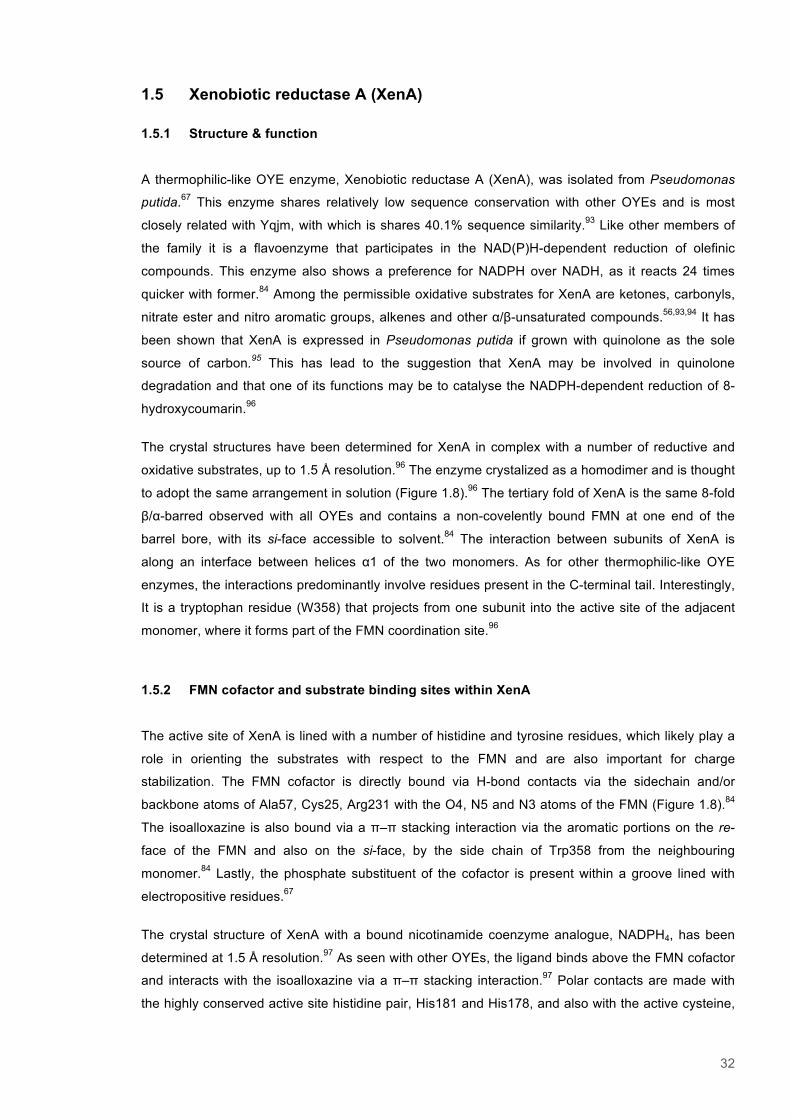
32
1.5 Xenobiotic reductase A (XenA)
1.5.1 Structure & function
A thermophilic-like OYE enzyme, Xenobiotic reductase A (XenA), was isolated from Pseudomonas
putida.67 This enzyme shares relatively low sequence conservation with other OYEs and is most
closely related with Yqjm, with which is shares 40.1% sequence similarity.93 Like other members of
the family it is a flavoenzyme that participates in the NAD(P)H-dependent reduction of olefinic
compounds. This enzyme also shows a preference for NADPH over NADH, as it reacts 24 times
quicker with former.84 Among the permissible oxidative substrates for XenA are ketones, carbonyls,
nitrate ester and nitro aromatic groups, alkenes and other α/β-unsaturated compounds.56,93,94 It has
been shown that XenA is expressed in Pseudomonas putida if grown with quinolone as the sole
source of carbon.95 This has lead to the suggestion that XenA may be involved in quinolone
degradation and that one of its functions may be to catalyse the NADPH-dependent reduction of 8-
hydroxycoumarin.96
The crystal structures have been determined for XenA in complex with a number of reductive and
oxidative substrates, up to 1.5 Å resolution.96 The enzyme crystalized as a homodimer and is thought
to adopt the same arrangement in solution (Figure 1.8).96 The tertiary fold of XenA is the same 8-fold
β/α-barred observed with all OYEs and contains a non-covelently bound FMN at one end of the
barrel bore, with its si-face accessible to solvent.84 The interaction between subunits of XenA is
along an interface between helices α1 of the two monomers. As for other thermophilic-like OYE
enzymes, the interactions predominantly involve residues present in the C-terminal tail. Interestingly,
It is a tryptophan residue (W358) that projects from one subunit into the active site of the adjacent
monomer, where it forms part of the FMN coordination site.96
1.5.2 FMN cofactor and substrate binding sites within XenA
The active site of XenA is lined with a number of histidine and tyrosine residues, which likely play a
role in orienting the substrates with respect to the FMN and are also important for charge
stabilization. The FMN cofactor is directly bound via H-bond contacts via the sidechain and/or
backbone atoms of Ala57, Cys25, Arg231 with the O4, N5 and N3 atoms of the FMN (Figure 1.8).84
The isoalloxazine is also bound via a π–π stacking interaction via the aromatic portions on the re-
face of the FMN and also on the si-face, by the side chain of Trp358 from the neighbouring
monomer.84 Lastly, the phosphate substituent of the cofactor is present within a groove lined with
electropositive residues.67
The crystal structure of XenA with a bound nicotinamide coenzyme analogue, NADPH4, has been
determined at 1.5 Å resolution.97 As seen with other OYEs, the ligand binds above the FMN cofactor
and interacts with the isoalloxazine via a π–π stacking interaction.97 Polar contacts are made with
the highly conserved active site histidine pair, His181 and His178, and also with the active cysteine,
33
Cys25, which is conserved amongst the thermophilic-like OYE class.97 Crystal structure coordinates
for XenA in complex with Nicotinamide Coenzyme Biomimetics (NCBs) are also available.97 These
mimetics are essentially nicotinamide rings with differing substituents attached at the nicotinamide
ring nitrogen.97 The arrangement of active site residues is virtually identical in the NCB-bound
complexes to that seen when in complex with the natural coenzyme. The only significant difference
is the conformation of the Trp302 side chain, which adopts a different conformation and reduces the
size of the active site void.97
Analysis of the binding of oxidative substrates to XenA is limited to metabolites of the quinolone
degradation pathway, coumourin and 8-Hydroxycoumarin.96 These two complexes both show
identical π−π stacking interactions between substrate and the isoalloxazine ring system of the FMN
cofactor.96 Interestingly, the only polar contacts observed are those from the His178 and His181,
which bind to the carbonyl oxygen of the substrates.96 It has been observed that there are close
contacts with the FMN cofactor on both faces of the isoalloxazine ring.84 The β carbon of coumarin is
located close to the FMN N5 on the si-face of the FMN, whereas the carbonyl oxygen of Pro23
presses against the FMN C4 and C10 atoms.84 It has been suggested these close contacts may be
important for facilitating compression of the FMN N5 to coumarin distance to facilitate hydride
transfer.
Figure 1.8. Structure and active site of XenA showing bound NADPH4 substrate analogue. (A) Ribbon diagram showing dimeric crystal arrangement of XenA subunits showing TIM-barrel fold (B) Active site zoom showing FMN cofactor (yellow) and NADPH4 ligand (pink) and selected active site residues involved in cofactor/coenzyme interactions. Also shown is the ribbon diagram of neighbouring subunit (light blue) from the neighbouring subunit, which defines one side of the active site. Polar contacts are shown as red dashes and were added using pymol.92 Both figures were adapted from crystal structure of the XenA-NADPH4 complex (PDB accession code = 3CPM).97
(A) (B)
His181
His178
Ala57
Arg231
Arg326 Met24
Cys25
34
1.6 Uses of OYE enzymes in synthetic biology and biocatalysis
1.6.1 Biocatalytic applications of stereoselective ene-reductases
There is growing interest in harnessing the catalytic power of enzymes for industrial applications
including the synthesis of commercially valuable chemicals, such as pharmaceutical compounds,
agrochemicals and biofuels.98,99 Synthetic biology has the potential to reduce our dependence on
petrochemicals and reduce the wastage of valuable resources and precious metals used in chemical
synthesis. The broad substrate specificity and stereoselective ene-reductase activity make OYE
enzymes an attractive tool for industrial applications.100 One of the major advantages of enzyme-
catalysed reactions is the high degree of stereoselectivity and the resultant entiomeric purity of
products, which can be difficult to achieve using traditional chemical synthesis routes. Asymmetric
hydrogenation reactions, such as those catalysed by OYE enzymes, can generate multiple chiral
centres and are important steps in the production of many industrially valuable compounds.52
Furthermore, the high stability of OYEs, the mild environmental conditions required (in terms of pH
and temperature etc.) and the ability to produce them in large amounts, thanks to developments in
cloning and expression procedures, makes them economically viable options for industrial scale
synthesis.52 It has been demonstrated that the substrate specificity and stereochemistry of ene-
reductase enzymes can be manipulated via directed-evolution.101 This approach has the potential to
further expand the range of substrates accessible to OYE enzymes. Other biotechnological
applications for OYEs have also been explored. The possibility of exploiting the nitrate-ester
reductase activity of OYEs for the phytoremediation of explosive contaminated sites has also been
investigated.71
The potential uses of OYE enzymes in the production of intermediate compounds for use in the
synthesis of pharmaceuticals has been documented. Nitroalkenes are particularly important
precursors in pharmaceuticals synthesis as they are used for nitro-, and amino group additions.102
They are also useful for the joining larger molecules, for example, in the production of bucindolol, a
beta blocker developed for the treatment of heart failure.103 The production of enantiomerically pure
nitroalkenes represents one area where OYE enzyme activities could be exploited for the production
of useful precursor compounds for chemicals synthesis. In addition, the OYE enzyme, MR, acts in
the degradation of codeine and morphine and one day could be adapted for the production synthetic
opiate drugs.48
1.6.2 The importance of natural coenzyme biomimetics A significant problem with the use of OYEs in biotechnology, and the many other enzyme types, is
the requirement for the nicotinamide coenzymes, NADH and NADPH, which are needed to supply
hydride substituents for alkene reduction. The nicotinamide coenzymes are both expensive and
unstable, meaning they are a limiting factor preventing the proliferation of enzyme-based chemical
35
synthesis techniques in industry.97 As a result, many alternate methods for either reducing ene-
reductase enzymes directly, or recycling reduced cofactors have been trialled.88 Coenzyme recycling
systems rely on the activity of additional enzymes to maintain a supply of reduced NAD(P)H.
Glucose dehydrogenase, or glucose-6-phosphate dehydrogenase are commonly used in such
systems but require NADP+ and an excess of glucose order to ensure regeneration of the cofactor.
Recycling systems have also been developed which rely on the activities of formate dehydrogenase,
alcohol dehydrogenase and phosphite dehydrogenase enzymes.104-106 The type of recycling system
used has been shown to effect the yield and enantioselectivity of biotransformation reactions.58 The
use of electrochemistry for reductive coenzyme regeneration is also an attractive option, as
electricity is one of the cheapest sources of redox equivalents available.104 Directing the reductive
energy towards coenzyme regeneration is not trivial and has been attempted by various means
including direct cathodic transfer to NAD(P)H, or via enzymatic relay systems with additional
compounds acting as electron shuttles. However, the former resulted in the formation of undesired
dimeric side products and was highly inefficient due to non-specific electron transfer.104
An alternate strategy for maintaining a supply of reductive energy for NAD(P)H dependent
biocatalysts is via the provision of Nicotinamide Coenzyme Biomimetics (NCBs), which can replace
the natural counterparts and act as electron donors.107,108 A range of NCBs have been developed
with small alkyl-, or aryl- groups attached to the nitrogen atom of the nicotinamide ring, in place of
the ribose sugar and remainder of the coenzyme.108 In addition, analogue compounds with acetyl-,
cyano- and thioamide- groups in placed of the amide functionality have also been produced in an
effort to tune the redox properties of the nicotinamide ring.109 These NCBs offer the advantage that
they are reasonably cheap and easy to produce, as well as small and therefore highly atom efficient.
Recently the reactions of a range NCBs and OYE enzymes, including TOYE, XenA and PETNR,
have been characterised. It was shown that in the majority of cases, rates of enzyme reduction with
the NCBs were faster than those observed with the natural coenzymes.97 The reasons for the
favourable kinetic properties of these NCB compounds are not yet clear. However, they may offer a
suitable alternative to natural coenzymes provided a suitable means of large-scale synthesis and/or
in-situ NCB regeneration can be developed. Successful regeneration of the NCBs has been
achieved using a rhodium complex [Cp*Rh(bpy)(H2O)]2+ and formate as the source of hydride.110
More recently another set of fluoro-substituted pyrydidine/dyhydropyridine cofactor analogues with
interesting reactive and optical properties were reported.107 The inclusion of a fluorine atom was
shown to lower the reduction potential and enhance the fluorescent properties of the mimics. The
latter enabled the development of a novel fluorescence-based activity assay.
36
1.7 Quantum Mechanical Tunnelling in enzyme systems
The transfer of hydrogen via Quantum Mechanical Tunnelling (QMT) in enzyme systems leads to
faster kinetics than can be satisfactorily explained using traditional ‘over the barrier’ models, such as
transition state theory, which implies that favourable transition state binding and a lowering of the
activation energy for a reaction leads to catalytic rate enhancements (Figure 1.9, panel A).111,112
Therefore novel theoretical models incorporating enzymatic QMT that consider additional quantum
aspects to explain the rates of such reactions have been proposed.15 The phenomenon of QMT
arises due to the wave particle duality of matter and the uncertainty principle, which states that the
position and momentum of a particle cannot both be simultaneously measured.113,114 For a light
element, such as hydrogen, there is a relatively large positional uncertainty, which is indicated by its
associated deBroglie wavelength (0.63 Å for protium, if a total particle energy of 20 kJ mol-1 is
assumed).113 Considering that the distance over which hydrogen is commonly transferred in enzyme
reactions is <1 Å, often referred to as the ‘barrier-width’, the positional uncertainty is of appreciable
significance and results in ‘nonclassical’ characteristics for hydrogen transfer.113 As the kinetic
energy of a particle changes so does the associated deBroglie wavelength.115 Furthermore, as a
reacting bond ascends the activation energy barrier, it reaches a point where the wavelength of its
particle surpasses the barrier width.115 In simplistic terms, the hydrogen atom can then transfer
instantaneously to form product, without ever having obtained the energy of the transition state (TS).
Thus the atom is said to have tunnelled through the activation barrier.
The identification and investigation of QMT in enzyme systems has largely centred around the study
of kinetic isotope effects (KIEs).116 Primary KIEs are determined as the ratio of the rate constants
determined for a reaction that are observed when the transferred atom is substituted for a alternate
isotope with a different mass, for example the rate of hydrogen transfer (kH) divided by that observed
with deuterium (kD; See equation 1.1).117 Note that rate constant for the lighter isotope is divided by
that for the heavier one. 2° KIEs are observed when the bond involving the substituted atom is not
actually cleaved during the reaction, but is directly adjacent to that which is.118 It was observation of
the 2° KIEs, and their diversion from the behaviour predicted by TST theory, that lead to the
suggestion that motion at the 1° and 2° positions was interconnected and that tunnelling may
contribute to the observed rate of H-transfer.119,120 It was shown that the kinetic value for the 2°
isotope effect exceeded that of the equilibrium value, which was opposite to the trend expected
within the confines of TST.119 In a later study tritium to hydrogen and deuterium isotope effects were
evaluated and compared for a model reaction.121 It was expected that the size of the 2° KIEs should
be related by the respective changes in mass, i.e. T->D and T->H, but the magnitude of the isotope
effects were shown not to be related to the changes in mass.121 The Bell correction is a corrected-
TST model that incorporates a role for tunnelling in an attempt to rationalize the unexpected
behaviour of 2° KIEs.122
!"# = !!!!
(Equation 1.1)
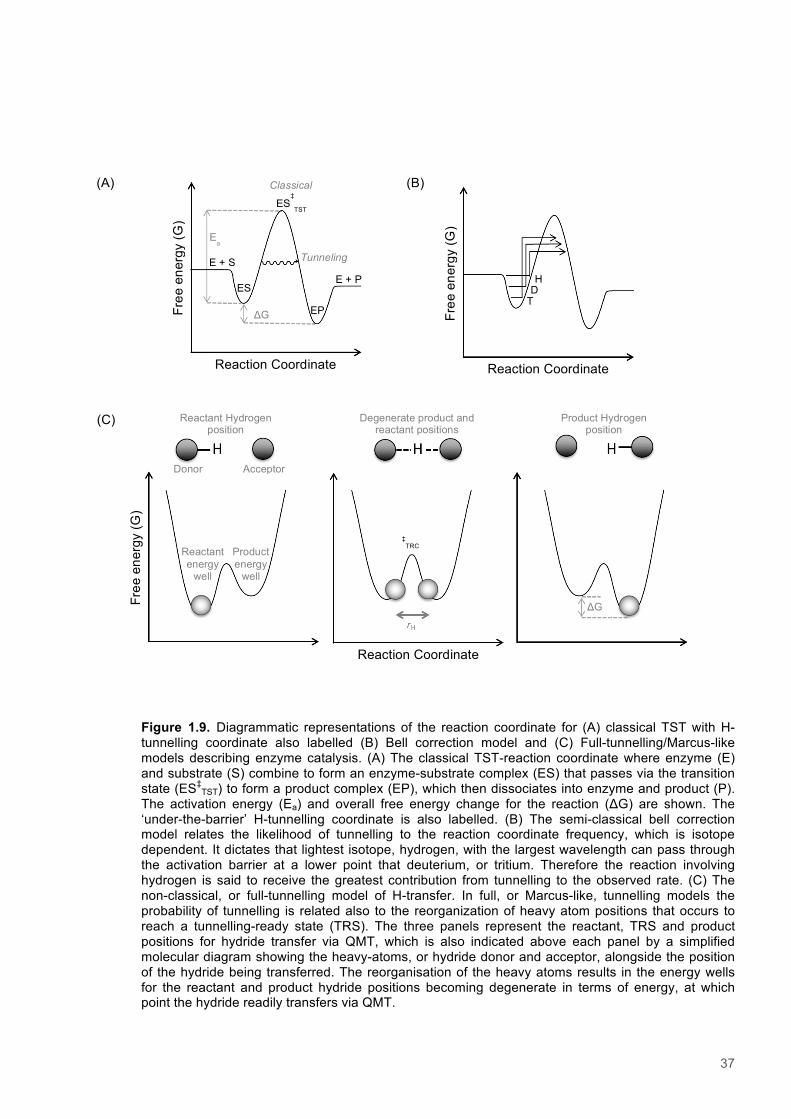
37
Figure 1.9. Diagrammatic representations of the reaction coordinate for (A) classical TST with H-tunnelling coordinate also labelled (B) Bell correction model and (C) Full-tunnelling/Marcus-like models describing enzyme catalysis. (A) The classical TST-reaction coordinate where enzyme (E) and substrate (S) combine to form an enzyme-substrate complex (ES) that passes via the transition state (ES‡
TST) to form a product complex (EP), which then dissociates into enzyme and product (P). The activation energy (Ea) and overall free energy change for the reaction (ΔG) are shown. The ‘under-the-barrier’ H-tunnelling coordinate is also labelled. (B) The semi-classical bell correction model relates the likelihood of tunnelling to the reaction coordinate frequency, which is isotope dependent. It dictates that lightest isotope, hydrogen, with the largest wavelength can pass through the activation barrier at a lower point that deuterium, or tritium. Therefore the reaction involving hydrogen is said to receive the greatest contribution from tunnelling to the observed rate. (C) The non-classical, or full-tunnelling model of H-transfer. In full, or Marcus-like, tunnelling models the probability of tunnelling is related also to the reorganization of heavy atom positions that occurs to reach a tunnelling-ready state (TRS). The three panels represent the reactant, TRS and product positions for hydride transfer via QMT, which is also indicated above each panel by a simplified molecular diagram showing the heavy-atoms, or hydride donor and acceptor, alongside the position of the hydride being transferred. The reorganisation of the heavy atoms results in the energy wells for the reactant and product hydride positions becoming degenerate in terms of energy, at which point the hydride readily transfers via QMT.
ES‡
TST
EP Free
ene
rgy
(G)
Ea
Tunneling
Classical
E + S E + P
ΔG
Reaction Coordinate
ES T
H D
Free
ene
rgy
(G)
Reaction Coordinate
Free
ene
rgy
(G)
(A) (B)
Product energy
well
Reactant energy
well
‡TRC
ΔG
Reaction Coordinate
Degenerate product and reactant positions
Reactant Hydrogen position
Product Hydrogen position
(C)
Donor Acceptor
38
1.7.1 The Bell correction model
In the Bell model, a quantum tunnelling correction factor (Q) is introduced into the Arrhenius equation
that describes reaction kinetics and relates measurable reaction parameters to the probability of
tunnelling.122 The tunnelling correction factor is dependent on the reaction coordinate frequency,
which is determined by the mass of the isotope and the temperature (T), as well as the Boltzmann
(!!) and Planck’s constants (ℏ).122 The model dictates that tunnelling occurs just prior to reaching the
classical TST and modifies the rate according to the extent of tunnelling, which depends on the
isotope involved (Figure 1.9, panel B). For example, all isotopes of hydrogen can pass through the
reaction barrier, but protium can pass through at a lower and wider point that the deuterium or tritium
isotopes.123 The model is associated with deviations from semi classical behaviour, such as inflated
KIEs above the semi classical limit (i.e. kH/kD KIEs > 7) and an inverse isotope effect on the
Arrhenius prefactor ratios (AH/AD < 1).124 The observation of tunnelling reactions with temperature-
independent KIEs and Arrhenius prefactor ratios greater than unity (AH/AD ≫ 1) could not be
explained within the Bell, or other corrected TST models.125,126,127 This led to the proposal of a ‘full-
tunnelling’ model that implied all isotopes were transferred via a tunnelling mechanism, that the size
of the energy barrier was dictated by motions of relevant heavier atoms and that modulation of the
hydrogen donor to acceptor distance was necessary to facilitate wave function overlap, the extent of
which was isotope dependent.128
1.7.2 Full-tunnelling Marcus-like models
A number of theoretical models have been proposed in which the hydrogen transfer reactions are
described fully quantum-mechanically.129,130 Such theories are heavily based on Marcus models that
focus on the environmental changes important for facilitating the electron transfer via tunnelling, in
this instance.131 However, such approaches are also suitable for understanding the transfer
dynamics of light particles, such as hydrogen and its isotopes.132 Albeit that the distance over which
the tunnelling of electrons (10–30 Å) is expected to occur differs significantly to that for hydrogen
atoms (0.6–0.7 Å).133 Models based upon this framework are commonly dubbed ‘Marcus-like’, due to
their reliance on the earlier work relating to electron transfer. According to Marcus type models
describing H-transfer, heavy atom reorganization leads to a tunnelling-ready state (TRS) in which the
energy levels of the reactant and product become transiently degenerate (Figure 1.9, panel C).14,128
This causes the overlap of the donor and acceptor wave functions and enhances the rate of H-
transfer via tunnelling (See equations 1.2 & 1.3).
! = !(!) [!]!
ℏ!
!!!T!!(∆!°!!)!/!!!!!)× F. C.
!
!term!,!!!(!(!!)/!!!)!!!
(Equation 1.2) !.!. !"#$!,! = !(!!!!!!!/!ℏ)
(Equation 1.3)
39
The term before the integral contains the electronic coupling (V), the reaction-driving force (∆G◦), the
reorganization energy (λ), the absolute temperature (T) and the proportion of enzyme-substrate
complexes that are able to form product (C(T)), and Boltzmann (!!) and Planck’s constants (ℏ). This
portion of the equation bears a resemblance to the Marcus theory describing the rate of reaching the
TST. The Franck-Condon (F.C.) term, which appears within the integral, describes the dependence
of the wave function overlap for the initial and final states of hydrogen on the mass (!H), frequency
(!H), and transfer distance (r) of the transferred nucleus. The exponential portion within the F.C.
term contains the energetic barrier for donor-acceptor distance (DAD) fluctuation, which is
dependent on the collective mass (mx) and the frequency (ωx) of the heavy atoms involved in DAD
sampling. Marcus-like models are able to account for those KIEs that are apparently temperature
independent, even if the observed rate of the reaction does exhibit temperature dependence. This is
because the pre-exponential term describing the thermally driven motions required reach the TRS, or
‘gating motions’, is independent of the F.C. term describing the probability of tunnelling occurring
over different donor acceptor distances (DADs).134 The latter term is related to the mass of the
isotope being transferred and is also temperature dependent, as the heavier particles may require
greater DAD sampling to reach degenerate reactant and product states. Therefore when extensive
DAD sampling at the TRS is required, the KIE becomes more dependent on temperature. These
models are therefore able to rationalize a broad range of KIEs that have been observed
experimentally, and the differential temperature dependencies, which are inconsistent with corrected-
TS approaches. The idea that the movement of heavy atoms facilitates distance sampling and
enhances the rate of tunnelling is commonly referred to as the ‘promoting motions’ hypothesis.13,14
1.7.3 Promoting motions
The existence of promoting motions and the importance of their contribution for enhancing H-transfer
via tunnelling has been the source of much recent debate and experimentation.7,8,134 Due to the
proposed nature of the motions involved, i.e. fast-timescale and small in amplitude, they are difficult
to observe directly via current approaches. Investigations have therefore tended to focus on the
interpretation of KIEs, aided by the use of hydrostatic pressure, temperature and mutagenesis as
experimental tools for perturbing the tunnelling reaction coordinate.123,135,136 Combined experimental
and computational approaches, involving molecular dynamics simulations and numerical modelling,
have also proved a useful aide for identifying putative promoting motions and providing quantitative
insight into KIE trends observed.137,138 But what constitutes a promoting motion? They can be
defined as some type of motion along the reaction coordinate that leads to a transient compression
of the activation barrier that enhances the rate of H-transfer via tunnelling.7 They are thought to
influence the rate of a reaction both by compression of the barrier width, essentially the H-transfer
distance, and a reduction in the height of the barrier. Generally they are thought to be fast-timescale
(ps-fs) motions, such as bond vibrations, that are on a par with TST lifetimes.4,139 It has also been
suggested that changes in the energetic barrier shape may involve dynamic modes inherent to the
substrate and/or cofactor.7 It is worth noting that the rate of DAD sampling does not necessarily
40
determine the observed reaction rate, as extensive DAD sampling may first be required prior to
successful crossing of the activation barrier. However, if tunnelling occurs faster that the rate of DAD
sampling and therefore instantaneously upon attainment of the right conditions and DA orientation,
the KIE will therefore report directly upon the promoting vibrations.
1.7.4 The temperature dependence of Kinetic Isotope Effects
The influence of protein dynamics occurring on a ps-ns timescale with amplitude in the sub-Å range,
such as those that may be a requirement for tunnelling, are difficult to interrogate directly. The roles
of these motions in catalysis are therefore generally probed by perturbing dynamic modes within the
protein and interpreting deviations in enzyme kinetics. Variable temperature studies serve as a
means of altering the conformational landscape and dynamic modes in proteins.7 The temperature
dependence of the KIE, if associated with a rate-limiting step, therefore serves as a useful means of
assessing the requirement for distance sampling on H-tunnelling kinetics. One advantage of using
KIEs is that they offer precise spatial resolution, as specific isotope labelling of substrates means
that deviations in kinetics can be directly attributed to the substituted atom.134 The temperature
dependence of the KIE is thought to be correlated with the extent of distance sampling required to
reach the TRS for different isotopes of different mass. A highly temperature-dependent KIE is
therefore associated with a reaction where there is a considerable requirement for distance sampling
to reach the TRS. Temperature dependent KIEs have been documented for a number of enzyme
systems.13,43,140,141
KIEs have been reported for a wide range of enzymatic reactions, and vary widely in both size and
the extent of temperature dependence exhibited. In the model system, soybean lipoxygenase (SLO),
a massive KIE is observed at ambient temperature (kH/kD KIE = 81 at room temperature) that is also
weakly temperature dependent.141 Theoretical assessment indicated that the large KIE is proposed
to arise as a result of tunnelling mainly occurring between the ground vibronic states of the donor
and acceptor (DA), and the significant overlap of the corresponding vibrational wavefunctions.142
Furthermore, the low temperature dependence of the KIE is suggested to occur as a result of the
dominance of local DA motions. Authors have therefore inferred that SLO contains an optimized
active site with an ideal arrangement for tunnelling and a fixed DA distance, which undergoes
minimal distance modulation, in part, due to a high frequency gating motion.142 Mutagenic variants of
SLO exhibiting a greater equilibrium distribution of DADs produced more highly temperature
dependent KIEs.143 This is thought to reflect the increased need for thermal energy input to facilitate
distance sampling over a greater range of distances.
The temperature dependence of KIEs observed with PETNR and two reductive substrates NADH/D
and NADPH/D have also been characterised.13 Interestingly the two substrates behave differently,
despite producing KIEs of comparable magnitude at 25 °C (KIE = 7.0 ± 0.04 for NADPH/D, 8.12 ±
0.09 with NADH/D).13 The reaction with NADPH is moderately temperature dependent, but that with
41
NADH is much less so.43 In this instance, the observed difference in KIE kinetics was attributed to
different vibrational modes present in the enzyme-substrate complexes. The more temperature
dependent KIE observed with NADPH/D is thought to arise as a result of a ‘softer’ vibrational mode
for the promoting motion, i.e. with a smaller force constant.13 An elegant means of probing the link
between fast-timescale dynamics and KIE kinetics is the use of ‘heavy’ proteins, where non-
exchangeable 1H, 12C and 14N atoms are replaced with heavier isotopes. A comparison of KIEs
observed with heavy (2H, 15N and 13C labelled), intermediate (15N labelled) and light (Unlabelled)
forms of PETNR showed a progressive increase the temperature dependence with increasing
mass.144 This demonstrates a link between enzyme kinetics and the frequency of protein vibrational
modes, which are affected through isotopic labelling, as other reaction parameters (protein structure,
substrate, temperature etc) were constant.
In a comparable study involving mass-modulated forms of Dihydrofolate reductase (DHFR) from
Escherichia coli the heavy and light enzymes exhibited markedly different KIE temperature
dependencies.145 The light form of DHFR produced a temperature-independent KIE across whole the
range studied (5−45 °C). Alternatively the heavy DHFR enzyme behaved similarly above 25 °C, but
showed temperature dependence from 5-25 °C. This was initially interpreted as likely to have been
caused by the perturbation of ‘promoting’ dynamics as a result of isotopic substitution in the heavy
enzyme, such as a change in the spread of D/A distances within the TRS. However, further analysis
of pre-steady-state, steady-state, and ligand binding kinetics indicated that isotope labelling affected
both the protein stability and substrate affinity.140 In the case of DHFR, it was therefore concluded
that the cumulative effect of extensive isotope labelling throughout the protein, such as changes in
C-H bond geometry, most likely led to the differences in the kinetic profiles of the heavy and light
enzymes.
1.7.5 The pressure dependence of Kinetic Isotope Effects
The pressure dependence of KIEs has also been studied in order to investigate tunnelling and
coupling of protein motions to reaction chemistry in a number of enzyme systems.146’147 Hydrostatic
pressure represents a useful experimental tool as it shifts pre-existing conformational equilibria. It
affects protein structure, favouring those conformers with reduced molar volume and causing
compression of H-bond vectors.148 As a result, if there are numerous catalytically functional
conformations for a reaction proceeding via tunnelling, as has been previously suggested for a
number of enzymes, then pressure may effect the rate constants and/or KIEs observed by favouring
certain trajectories along the reaction coordinate.146,149,150 Pressure has also been observed to affect
protein dynamics, such as the relatively slow (~ms timescale) loop and domain conformational
transitions that are associated with changes in volume.148 Interestingly, the semi-classical models of
H-transfer imply that KIEs should not be greatly affected by pressure changes in the kbar range, as
they are determined by differences in zero-point energies and vibrational frequencies of the
transferred atoms.135,151 The observation of pressure-dependent isotope effects is therefore seen as
42
further evidence of the coupling of dynamics to the tunnelling reaction coordinate.152 The pressure
dependence of the KIE is related to differences in the relative activation volumes, which is
predominantly influenced by the effect of pressure on the barrier width (r) and also the frequency of
vibrational modes involved in promoting motions (E(rx)).153,127 Assuming a full-tunneling model, then
the effect of isotopic substitution on the reaction volume can be described within the context of
equation 1.2 (See equation 1.4).134 Equation 1.4 is essentially the term inside the integral part of
equation 1.2 for protium divided by the same term for deuterium.
KIE p,T = KIE!×{!
! !!!!!!! ! !/!ℏ)}!!! !! ! !/!!!!"!{!
! !!!!!!! ! !/!ℏ)}!!! !! ! !/!!!!"!
(Equation 1.4)
In experiments performed on morphinone reductase the magnitude of the 1° KIE for H-transfer
(kH/kD) in the reductive half reaction was observed to increase, from 4.0 to 5.2 at 25°C, when the
pressure was increased from 1 bar to 2 kbar.152 It was predicted that shortening of the tunnelling
distance would result in increased reaction rate, as was observed. However, the changes in pressure
had no observable effect on the rate of CT complex formation, or the temperature dependence of the
KIE (as indicated by ΔΔH‡ = ΔH‡D-H‡
H). Numerical modelling was performed, assuming an
environmentally coupled model of H-transfer, but was not able to reproduce these data by simply
varying the equilibrium D-A distance. However, permitting variation in the force constant of the gating
vibration, which also determines the frequency of the gating motion, enabled reproduction of the
experimental data.152 It was postulated that an escalation of the force constant at increased
pressures, as well as a shortening of the H-transfer distance, contributed to the observed increase of
the KIE. Based on this work, a generalized expression was developed to describe the KIE pressure
response for a tunnelling enzyme within an environmentally coupled framework.153 This model
proposed accurately described data for the reaction of MR with NADH, and also that from earlier
data from studies of the chloranil reduction by leuco crystal violet.135,154
Later studies on the closely related enzyme, PETNR, examined the pressure dependences of the
reaction with either NADH, or NADPH, and the KIEs observed with both substrates.13 The rates of
FMN reduction (kred) increased with increasing hydrostatic pressure in all cases. The KIEs for the two
substrates, however, showed different trends, as was the case in response to variations in
temperature. For the reaction with NADH, there was a linear decrease in the KIE as pressure was
increased. Alternatively, with NADPH there was clear curvature observed the plot of KIE vs
pressure.13 As it had previously been proposed that the degree of curvature may be an indicator of
magnitude of the force constant for promoting vibrations.153 The trend observed with NADPH
appeared to support the conclusions drawn from temperature dependence studies, which highlighted
the differences in the promoting mode for the reaction with NADPH, i.e. with a smaller force
constant.13

43
More recently there have been combined pressure and temperature (p−T) dependence studies
carried out to investigate the reactions of aromatic amine dehydrogenase (AADH). AADH is a
tetrameric protein that functions in the oxidative deamination of aromatic primary amines to form
aldehydes.155 Previously, AADH-catalysed proton transfer reactions involving tryptamine have been
shown to exhibit a sizeable isotope effect (KIE = 55 at 25 °C) and are therefore thought to occur
predominantly via H-tunneling.156 The reaction of AADH with phenylethylamine is ~100-fold slower
than that with tryptamine, possibly due to a decrease in the driving force, but H-transfer is still
understood to be fully rate limiting.146,157 In addition, the magnitude of the KIE (~10-20) observed with
phenylethylamine is smaller than that seen with tryptamine.146 Identical experiments were recorded
to assess the pressure dependence of proton transfer for AADH with phenylethylamine at four
separate temperatures. At all temperatures studied, there was an apparent decrease in both the
observed rate of proton transfer (kobs) and the KIE with increased pressure.146 As expected,
molecular dynamics (MD) indicated the increases in pressure lead to a reduction in the overall
volume, or radius of gyration, of each subunit and the AADH tetramer as a whole.146 Further analysis
of the absolute changes in atomic coordinates for the AADH subunit revealed a pressure-induced
decompression along certain vectors. It indicated that the reduction in the radius of gyration occurred
predominantly over one dimension. It was therefore adjudged that changes in the D-A distance might
have been minimal, due to the anisotropic response of the structure of AADH to increased
hydrostatic pressure. Unlike the reaction involving MR and NADH, for AADH with phenylethylamine
the temperature dependence of the KIE (ΔΔH‡) appeared to reduce with pressure. In addition,
spectral-density analysis from MD-simulations of the AADH:phenylethylamine complex implied that
pressure resulted in a decrease in the frequency of the putative promoting vibrations. The observed
kinetic trends were therefore explainable within the context of environmental coupled models of H-
tunnelling, but only once the effects of pressure on the system were comprehended through
simulation.146 Furthermore, a recent review examined correlations in kinetic parameters for all
currently available p−T KIE datasets, including protochlorophyllide oxidoreductase (POR) as well as
those already described.122 There appears to be no unifying trend relating the p−T dependence of
KIEs across all the enzyme systems studied, highlighting the need for atomistic understanding and
simulation in order to interpret experimental data.
1.7.6 KIEs studies in mutagenic variants
One experimental approach that has been employed in order to investigate hydride tunneling in
enzyme systems is the mutagenesis of structurally pertinent residues within the active site and a
subsequent structural and kinetic characterization of variants.158,159 Subtle structural alterations, often
selected with the intention of inducing changes in the hydride transfer distance, have enabled
investigation of the importance of factors such as DA distance changes, conformational
heterogeneity (in both the ground and reactive ensembles) and the vibrational properties, or zero
point energies, of DA hydride positions for determining the observed rates of H-transfer.141,136,160
Analysis of the temperature dependence of KIEs currently serves as the most informative tool for

44
deciphering the effects of such mutations, which have helped to improve our understanding of the
tunneling mechanism and the perceived role that enzyme mediated dynamics play in facilitating
hydride transfer. Of relevance to this study are those previous examples in which the variation of
hydrophobic side chain bulk has been used to perturb the H-transfer distance, in the hope of
minimalizing any effects brought about as a result in changes in electrostatics and/or binding.136 The
results of such mutations are greatly varied and have, in cases, lead to a change in the rate of H-
transfer by as much as 5 orders of magnitude.161 Also apparent, however, is the apparent
insensitivity of many enzymes to such mutations.136,158,159 These enzymes, including MR of the OYE
family, seem able to counteract the effects of variations in active site residue side chain length and
maintain catalytic rates near to those of their respective wild type enzymes.160
The mutation of hydrophobic residues within, or near the active site appears to have noticeable
effects on the magnitude and temperature dependence of KIEs.161 Which, in light of Marcus-like
theories describing enzymatic H-tunneling, are thought to reflect the tunneling barrier (essentially the
transfer distance) and the requirement for dynamic modulation of that barrier (promoting motions).141
In a number of studies, a decrease in the rate of hydride transfer (kobs) was observed alongside a
much more highly temperature dependent KIE.136,161 The studies concluded that the introduction of
the mutations had induced a larger range of DA distances within the enzyme-substrate complex, a
smaller proportion of which were reactive and thus, the steeper temperature dependence of the KIE
reported on the need to search a greater range of conformational space before the reaction readily
proceeded. Interestingly, the alteration of side chains far from the reaction site of Thymidylate
synthase is seen to have similar, but lessened effects on the temperature dependence of the KIE.162
Although the increase in the temperature dependence of the KIE was small, the variant displayed an
increased enthalpy of activation. This lead the author to infer that the changes were predominantly
caused by the disruption of a network of environmentally coupled concerted motions involved in
bringing the donor and acceptor together to facilitate H-transfer, and not due to changes in the DA
distance. Arrhenius and Eyring fits of temperature dependent data provide a means of quantifying
the relative effects of any structural or environmental perturbations on the thermodynamic
parameters associated with a tunneling reaction, and also comparing these effects for the transfer
different isotopes.123 For example, Eyring fits provide the relative entropies (∆S) and enthalpies (∆H)
of activation for a particular reaction, and enable comparison of reactions involving variants, under
different environmental conditions, or with alternate substrates.163,160
It is important when investigating the effects enzyme mutations to also assess any structural
differences between the wild type and variant enzymes in order to understand how any changes in
the structure and/or flexibility of the protein fold may also impact upon the reaction. High resolution
crystallographic data has previously been used to confirm that fold authenticity is maintained
between SLO enzyme variants, as indicated by a RMSD values (0.3 Å Cα-RMSD), and helped
identify small sub-Å changes in the hydride transfer distance and the geometry of immobilized Fe-
coordinating shells161. Although it is difficult to make inferences regarding the dynamic profiles of
variants from static crystal structures, one study provides some insight via assessment of the dual
45
occupancy of sidechain rotamers and through comparison of anisotropic B-factors relating to specific
secondary structural elements.162 Alternate spectroscopic methods of assessing DA distances for
MR variants in complex with a nonreactive substrate analogue, via measuring CTC absorbance at
555 nm, have also been employed.160 The latter technique has the advantage of providing insight
into the solution behavior of the enzyme-substrate complex, however, is limited by the fact that it is
an ensemble-averaged measurement of DA distances. The common drawback for these approaches
is that they are restricted to analysis of the ground state structures of the holoenzyme, or substrate
mimic bound forms. They therefore do not provide direct analysis of the tunneling ready
conformation (TRC), which is approached following thermal activation of the substrate complex, and
whether or not this process is affected within variants.134 Computational modeling has proven useful
for interpreting kinetic data in terms of the dynamic behavior of enzyme variants,, but there is still
much debate about which of the various viable models posited most suitably describes the observed
enzymatic behavior.11,164,8
1.8 Nuclear Magnetic Resonance Spectroscopy
Nuclear magnetic resonance (NMR) spectroscopy is a technique that can be used to study the
structure and dynamic behavior of proteins in solution at high resolution. Some of the commonly
used applications of NMR in biochemistry include studying ligand binding via chemical shift
perturbation studies, fragment screening during drug discovery, analysis of protein dynamics via
measurement of T1/T2 relaxation parameters and also, protein structure determination.165-168 NMR is
particularly effective for characterizing protein dynamics in solution as it enables the acquisition of
site specific information regarding movements occurring over a wide spectrum of timescales (ps-
ms).166 Sample specifications for most NMR experiments include a requirement for isotopically
labeled samples and an upper size limit of ~ 40 KDa for proteins in order to avoid extensive
overlapping of NMR signals.167 An awareness of the underlying principles of NMR spectroscopy is
necessary to facilitate a greater understanding of the physical basis for those experiments used
here.
1.8.1 Fundamental Principles of NMR spectroscopy
Nuclear magnetic resonance (NMR) spectroscopy is a method of quantifying an inherent nuclear
property, known as spin, which gives rise to the magnetic properties of nuclei.169 Nuclear spin is a
measure of the total angular momentum of an atomic nucleus, and is represented by the nuclear
spin quantum number (I). By virtue of the fact that all nuclei carry a charge, and an associated
angular momentum (P), they therefore give rise to a magnetic dipole moment (µ). The angular
momentum is directly proportional to the dipole moment and is related via the gyromagnetic ratio (γ;
See equation 1.5). This property is unique and constant for different atomic species.170

46
! = γP
(Equation 1.5)
If an external magnetic field (B0) is applied then nuclei with a spin quantum number of ½ (i.e. 1H, 13C, 15N etc.), often referred to as ‘NMR active’, can populate one of two discrete energy levels. These
high and low energy levels are aligned parallel (α), or anti-parallel (β) with respect to external
magnetic field, respectively. Upon attainment of a thermal equilibrium, NMR active nuclei will adopt a
Boltzmann distribution across the two spin states. However, there will be a slight excess of spins
occupying the lower energy orientation, which results in a net magnetization (M) for a population of
nuclei that is aligned with the B0 field, or z-axis.171
Another effect of the B0 field is that it causes the magnetic moment of NMR active nuclei to precess
about the z-axis (Figure 1.10). A nucleus with angular momentum precesses around an external field
with an angular frequency, known as the Larmor frequency (vL), which is dependent on the external
magnetic field (B0) and the gyromagnetic ratio of the nuclei in question (γ ; See equation 1.6). The
Larmor frequency also determines the energy gap (∆E) between the α and β spin states for a
particular nucleus (See equation 1.7).171
!! = γB!2!
(Equation 1.6)
∆! = !!!
(Equation 1.7)
If a radiofrequency pulse (B1) is applied at the Larmor frequency of a particular nucleus, the energy
is absorbed and it stimulates transitions between the two energy levels, or spin states (Figure 1.11).
This absorption of energy, or more precisely the relaxation of spins back their original equilibrium
state, is what is measured during an NMR experiment. The sensitivity of an NMR experiment is thus
directly dependent on the gyromagnetic ratio of the nucleus being detected.172 The B1 radiofrequency
field is applied perpendicular to the axis of the B0 field, inline with the x/y-axes, and causes rotation of
the net magnetization around the x-axis. If the duration of the x-pulse is sufficient then all the z-
magnetization is converted to y-magnetization. This is known as a 90° excitation pulse and is a
critical component of NMR pulse sequences.172 In order to help understand the orientation of pulses
with respect to the B0 and B1 fields, we refer to them relative a rotating frame of reference. The B0
field is aligned with the z-axis, the B1 is applied along the x/y-axes and the detector is also positioned
along the x/y-axes. NMR spectrometers acquire signals in quadrature, and therefore record both the
x and y components of the magnetization.
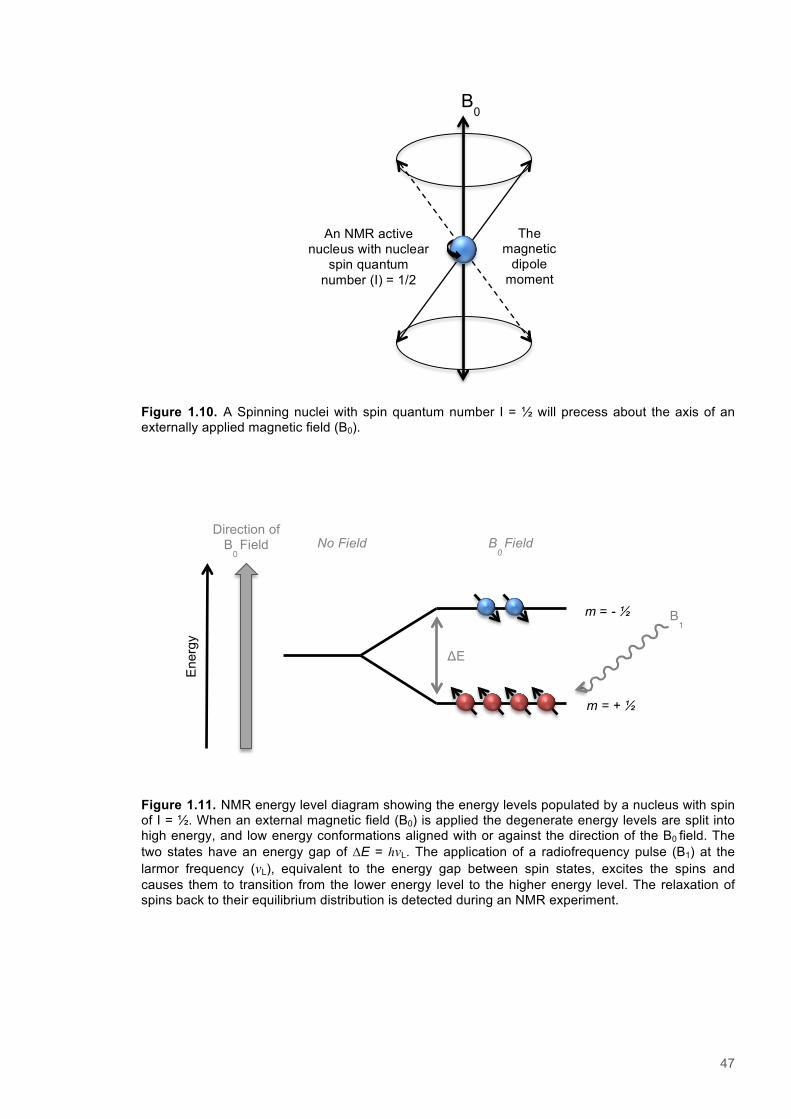
47
Figure 1.10. A Spinning nuclei with spin quantum number I = ½ will precess about the axis of an externally applied magnetic field (B0).
Figure 1.11. NMR energy level diagram showing the energy levels populated by a nucleus with spin of I = ½. When an external magnetic field (B0) is applied the degenerate energy levels are split into high energy, and low energy conformations aligned with or against the direction of the B0 field. The two states have an energy gap of ∆E = hvL. The application of a radiofrequency pulse (B1) at the larmor frequency (vL), equivalent to the energy gap between spin states, excites the spins and causes them to transition from the lower energy level to the higher energy level. The relaxation of spins back to their equilibrium distribution is detected during an NMR experiment.
Ene
rgy
Direction of B
0 Field
ΔE
m = - ½
m = + ½
No Field B0 Field
B1
An NMR active
nucleus with nuclear spin quantum
number (I) = 1/2
B0
The magnetic
dipole moment
precesses

48
1.8.2 Relaxation of Nuclear spins
Relaxation is the process by which a population of spin states returns to the equilibrium distribution,
for example, by a 90° rf-pulse. The equilibrium state is that in which the relative populations of spin
states are those predicted by a Boltzmann distribution and there is no transverse magnetization, i.e.
net magnetization has returned the z-axis.171 The processes by which these two factors return to
equilibrium are distinct. The return on of net magnetization to the z-axis is termed longitudinal or
spin-lattice relaxation, which is described a specific relaxation time (T1) and relaxation rate (R1 =
1/T1).173 Moreover, the loss of the x and y components of magnetization is designated transverse
relaxation or spin-spin relaxation, and is described by a separate relaxation time (T2) and rate (T2 =
1/T2). The loss of phase coherence in the x/y plane is detected as a free induction decay (FID) signal.
The FID is recorded as a function of time, and the signal is then Fourier transformed (FT) to convert
the time-dependent FID signal into a frequency domain function. The frequency of relaxation for a
particular nucleus is referred to as its chemical shift (δ), which is the resonant frequency of a nucleus
reported in parts per million (ppm) relative to that of a reference compound (vref) and is independent
of the spectrometer frequency (vspec ; See equation 1.8).172 The chemical shift of a nucleus can be
modulated by its local electronic environment, which offers shielding from the external magnetic field
(B0) and changes the Larmor frequency for a particular spin. As the environments of different nuclei
vary they appear at different chemical shifts and thus, detailed insight into bonding organisation and
structure can be obtained from chemical shift values.169
! !!" = !!"!"#$ − !!"#!!"#$×10!
(Equation 1.8)
1.8.3 Mechanisms of nuclear spin relaxation
Relaxation is the process whereby spins interact with their surroundings and reach thermal
equilibrium following excitation. There are multiple means by which nuclear spin relaxation
predominantly occurs.173 Dipole-dipole relaxation arises as a result of the interaction of the magnetic
field of two nuclei. There are two forms of DD-relaxation, Scaler (J) coupling and dipole-dipole (DD)
coupling. J-coupling is mediated through the bonds of interconnected spins and occurs indirectly as
a result of the hyperfine interaction of between two interacting nuclei and the local electrons.172 DD-
coupling occurs through space and is dependent on the distance separating the two nuclei and the
angle of the internuclear vector with respect to the magnetic field (B0). For molecules in solution DD-
coupling averages to zero due to molecular tumbling. Nonetheless it is still a major contributor to
relaxation, because as a molecule tumbles the random fluctuations in DD-coupling can create a local
magnetic field that, if occurring at the Larmor frequency, can act as a nuclear relaxation pathway.174
The interaction of two spins via DD-coupling gives rise to the Nuclear Overhauser Effect (NOE).
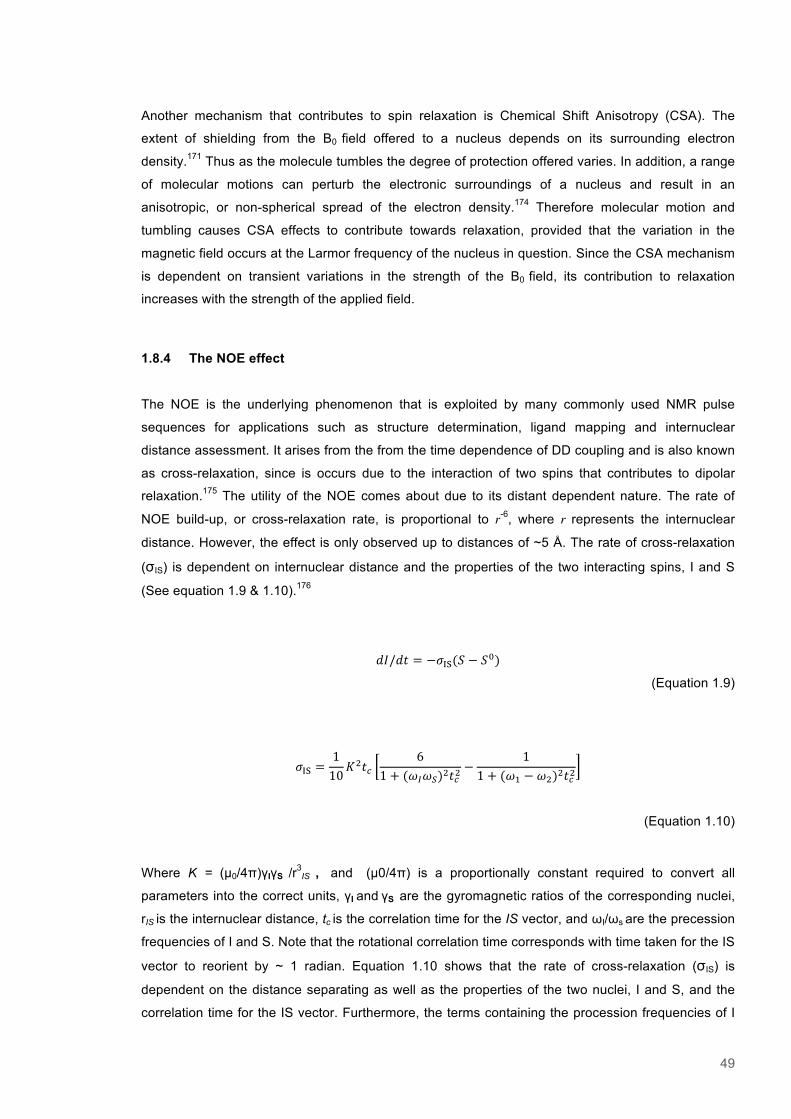
49
Another mechanism that contributes to spin relaxation is Chemical Shift Anisotropy (CSA). The
extent of shielding from the B0 field offered to a nucleus depends on its surrounding electron
density.171 Thus as the molecule tumbles the degree of protection offered varies. In addition, a range
of molecular motions can perturb the electronic surroundings of a nucleus and result in an
anisotropic, or non-spherical spread of the electron density.174 Therefore molecular motion and
tumbling causes CSA effects to contribute towards relaxation, provided that the variation in the
magnetic field occurs at the Larmor frequency of the nucleus in question. Since the CSA mechanism
is dependent on transient variations in the strength of the B0 field, its contribution to relaxation
increases with the strength of the applied field.
1.8.4 The NOE effect
The NOE is the underlying phenomenon that is exploited by many commonly used NMR pulse
sequences for applications such as structure determination, ligand mapping and internuclear
distance assessment. It arises from the from the time dependence of DD coupling and is also known
as cross-relaxation, since is occurs due to the interaction of two spins that contributes to dipolar
relaxation.175 The utility of the NOE comes about due to its distant dependent nature. The rate of
NOE build-up, or cross-relaxation rate, is proportional to r-6, where r represents the internuclear
distance. However, the effect is only observed up to distances of ~5 Å. The rate of cross-relaxation
(σIS) is dependent on internuclear distance and the properties of the two interacting spins, I and S
(See equation 1.9 & 1.10).176
!"/!" = −!!"(! − !!) (Equation 1.9)
!!" =110!
!!!6
1 + (!!!!)!!!!− 11 + (!! − !!)!!!!
(Equation 1.10)
Where K = (µ0/4π)γIγS /r3IS , and (µ0/4π) is a proportionally constant required to convert all
parameters into the correct units, γI and γS are the gyromagnetic ratios of the corresponding nuclei,
rIS is the internuclear distance, tc is the correlation time for the IS vector, and ωI/ωs are the precession
frequencies of I and S. Note that the rotational correlation time corresponds with time taken for the IS
vector to reorient by ~ 1 radian. Equation 1.10 shows that the rate of cross-relaxation (σIS) is
dependent on the distance separating as well as the properties of the two nuclei, I and S, and the
correlation time for the IS vector. Furthermore, the terms containing the procession frequencies of I
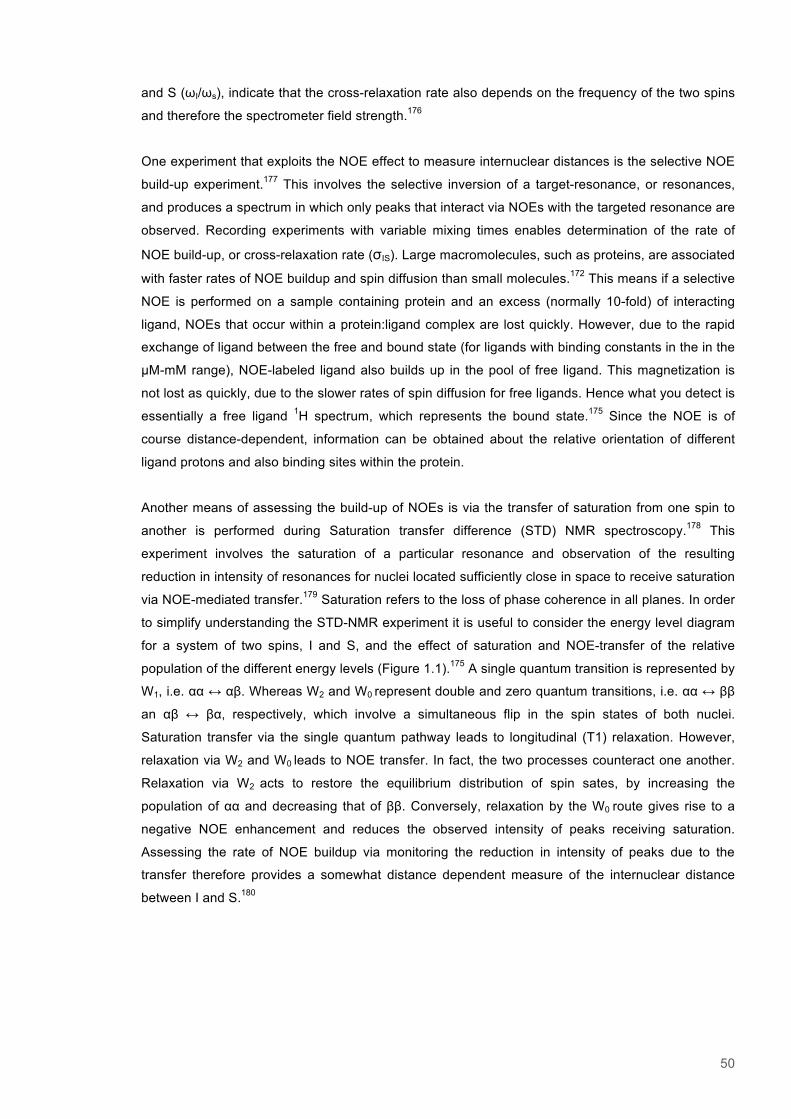
50
and S (ωI/ωs), indicate that the cross-relaxation rate also depends on the frequency of the two spins
and therefore the spectrometer field strength.176
One experiment that exploits the NOE effect to measure internuclear distances is the selective NOE
build-up experiment.177 This involves the selective inversion of a target-resonance, or resonances,
and produces a spectrum in which only peaks that interact via NOEs with the targeted resonance are
observed. Recording experiments with variable mixing times enables determination of the rate of
NOE build-up, or cross-relaxation rate (σIS). Large macromolecules, such as proteins, are associated
with faster rates of NOE buildup and spin diffusion than small molecules.172 This means if a selective
NOE is performed on a sample containing protein and an excess (normally 10-fold) of interacting
ligand, NOEs that occur within a protein:ligand complex are lost quickly. However, due to the rapid
exchange of ligand between the free and bound state (for ligands with binding constants in the in the
µM-mM range), NOE-labeled ligand also builds up in the pool of free ligand. This magnetization is
not lost as quickly, due to the slower rates of spin diffusion for free ligands. Hence what you detect is
essentially a free ligand 1H spectrum, which represents the bound state.175 Since the NOE is of
course distance-dependent, information can be obtained about the relative orientation of different
ligand protons and also binding sites within the protein.
Another means of assessing the build-up of NOEs is via the transfer of saturation from one spin to
another is performed during Saturation transfer difference (STD) NMR spectroscopy.178 This
experiment involves the saturation of a particular resonance and observation of the resulting
reduction in intensity of resonances for nuclei located sufficiently close in space to receive saturation
via NOE-mediated transfer.179 Saturation refers to the loss of phase coherence in all planes. In order
to simplify understanding the STD-NMR experiment it is useful to consider the energy level diagram
for a system of two spins, I and S, and the effect of saturation and NOE-transfer of the relative
population of the different energy levels (Figure 1.1).175 A single quantum transition is represented by
W1, i.e. αα ↔ αβ. Whereas W2 and W0 represent double and zero quantum transitions, i.e. αα ↔ ββ
an αβ ↔ βα, respectively, which involve a simultaneous flip in the spin states of both nuclei.
Saturation transfer via the single quantum pathway leads to longitudinal (T1) relaxation. However,
relaxation via W2 and W0 leads to NOE transfer. In fact, the two processes counteract one another.
Relaxation via W2 acts to restore the equilibrium distribution of spin sates, by increasing the
population of αα and decreasing that of ββ. Conversely, relaxation by the W0 route gives rise to a
negative NOE enhancement and reduces the observed intensity of peaks receiving saturation.
Assessing the rate of NOE buildup via monitoring the reduction in intensity of peaks due to the
transfer therefore provides a somewhat distance dependent measure of the internuclear distance
between I and S.180
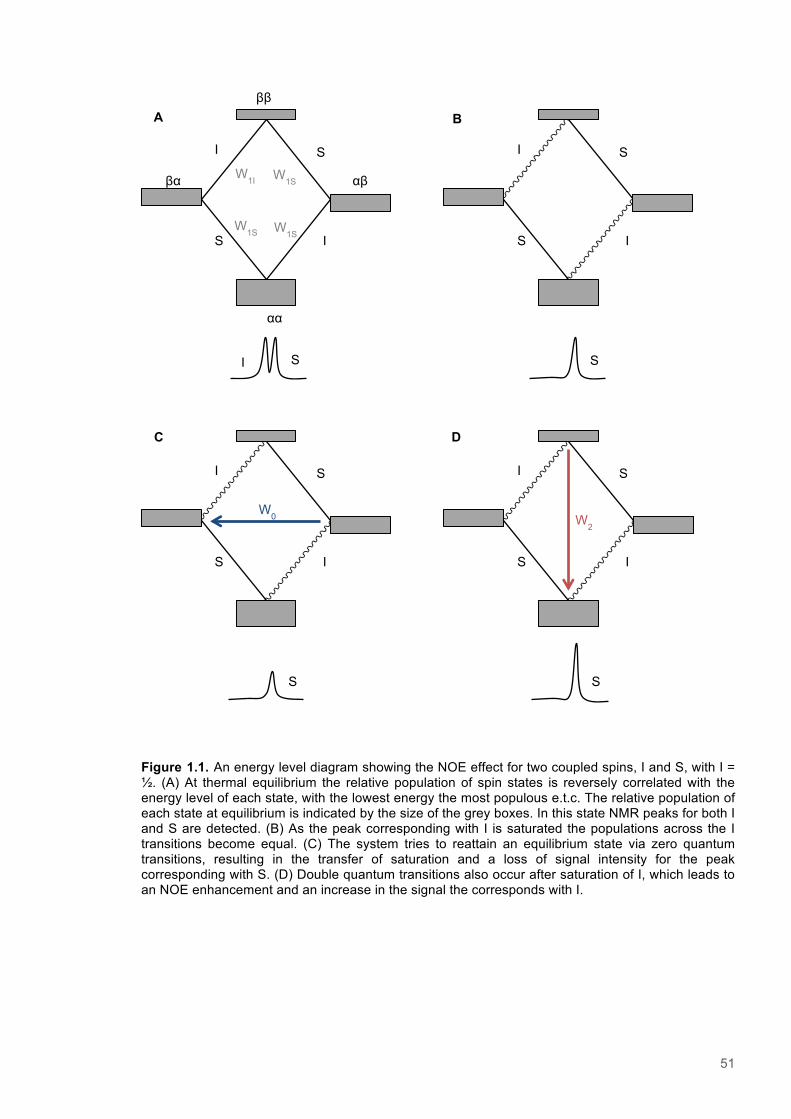
51
Figure 1.1. An energy level diagram showing the NOE effect for two coupled spins, I and S, with I = ½. (A) At thermal equilibrium the relative population of spin states is reversely correlated with the energy level of each state, with the lowest energy the most populous e.t.c. The relative population of each state at equilibrium is indicated by the size of the grey boxes. In this state NMR peaks for both I and S are detected. (B) As the peak corresponding with I is saturated the populations across the I transitions become equal. (C) The system tries to reattain an equilibrium state via zero quantum transitions, resulting in the transfer of saturation and a loss of signal intensity for the peak corresponding with S. (D) Double quantum transitions also occur after saturation of I, which leads to an NOE enhancement and an increase in the signal the corresponds with I.
ββ
αβ βα
αα
W1I
I S
I S
W1S
W1S W1S
I S
I S
I S
S
I S
I S
S
I S
I S
S
W0 W2
A B
C D
52
1.8.5 Multidimensional NMR pulse sequences
The same building blocks are used in combination to build NMR pulse sequences for a range of
different applications. Generally they contain a number of rf-pulses interspersed between time delays
followed by an acquisition period in which the FID is recorded and digitalized.181 There are a number
of different types of pulse, these include hard pulses that are have a wider bandwidth than the
spectral width of the experiment and are designed to hit the resonant frequencies of nuclei
precessing at a range of different Larmor frequencies.182 Hard pulses are generally short and
rectangular. Soft, or shaped pulses are generally used for the selective excitation of a particular
frequency or bandwidth range. The desired effect of a pulse, i.e. the degree of rotation of the net
magnetization, can be determined by the length of the respective pulse. Additional components of
pulse sequences include gradients, which used for dephasing spins for quantum filters and in some
forms of water suppression. A fundamental part of the majority of multidimensional pulse sequences
is the Insensitive nuclei enhanced by polarization transfer (INEPT) sequence.172
The INEPT sequence enhances the sensitivity of NMR experiments for nuclei by converting the large
Boltzmann population distributions observed for NMR sensitive nuclei, such as 1H, and converting
this to less sensitive NMR nuclei, such as 13C and 15N. The conversion of magnetization from one
nucleus to another occurs by first creating antiphase magnitization and then transferring this via
through bond, or J-couping, to another nucleus.183 The interpulse delay has to be precisely calibrated
for each J-coupling constant. A 2D experiment, such as a 1H-15N HSQC, involves the transfer of
magnetization via an INEPT sequence from proton to nitrogen and then back to proton, prior to
acquisition. In order to correlate the spins of hydrogen and nitrogen, a variable evolution period is
included which allows the chemical shift of nitrogen to evolve. Following this period the nitrogen
magnetization is converted back to proton, but the signal is phase-modulated with the chemical shift
of the nitrogen atom. The chemical shift of the proton is then recorded, as it would be during a
normal 1D NMR experiment.183
Multidimensional NMR pulse sequences enable the chemical shift of one nucleus to be correlated
with the chemical shift(s) of another nucleus, or two others in the case of 3D experiments.181 There
are pulse sequences available to link the chemical shifts of atoms directly bound to one another (e.g.
HSQC & TOCSY), as well those for correlating atoms close in space (NOESY & ROESY).172 These
pulse sequences offer greater resolution, as they enable individual peaks to be resolved in regions
that may show multiple overlapping peaks in 1D experiments. The development of multidimensional
NMR approaches has many implications for NMR spectroscopy of biomolecules such as proteins.
The use of 2D 1H-15N HSQC experiments, alongside perdeuterated isotope labelling regimes, greatly
reduces the overlap of amide peaks in protein spectra and thus has increased the size of proteins
that can easily be studied via NMR, up to ~50 kDa.184,185 Although more recently, the development of
selective amino acid sidechain labelling and 4D NMR approaches has enabled structural information
to be obtained for proteins close to 100 kDa.186 The primary use of 3D NMR experiments in
biological NMR spectroscopy is for the assignment of amide peaks in 1H-15N HSQC spectra.183 This

53
involves correlating the hydrogen and nitrogen chemical shifts of amide groups with the 13C chemical
shifts of Cα, Cβ and CO groups of neighbouring residues. After an amide assignment for a protein 1H-15N HSQC spectra has been obtained, then accurate studies of ligand binding via chemical shift
perturbation, or NMR structure derivation via NOE experiments, can be performed.
54
1.9 Protein crystallography
X-ray crystallography is the most popular method of protein determining protein structures at, or
near, atomic resolution and is now a tool used in the majority of structural biology labs. The
technique relies on the scattering of X-rays by electrons present in crystallized protein samples.
There are now over 80,000 X-ray diffraction derived protein structure available in the PDB
database.187 Recent major developments in experimental hardware and data collection and
procession methodologies have helped speed up the rate of structure deposition into the PDB
database. Most notably, the development of synchrotron radiation sources has revolutionized data
collection for X-ray crystallography and massively improved both the exposure times for data
collection and the resolution that can be obtained for protein structures.188 In the near future, the
availability of X-ray free-electron lasers (X-FELs), with high intensity and short duration pulses,
promises to further enhance, for example, the temporal resolution of time-resolved x-ray
crystallography and enable the collection of diffraction data using micro crystals.189
1.9.1 Protein crystallisation
The preparation of crystallized samples for data collection requires highly purified proteins and
screening of conditions in order to find those suitable for crystallization to occur. When screening for
suitable conditions, factors such as temperature, pH and concentrations of both precipitants and
protein will be varied. The aim of screening is to identify conditions that bring the protein solution into
a supersaturated state, where the protein will readily crystallize.190 For successful crystallization, an
aqueous protein solution must enter a supersaturated state, in which the initial formation of
microcrystals, or nucleation, occurs (Figure 1.2). The formation of microcrystals causes the protein
concentration to decrease and hopefully enter the metastable zone, where the growth of protein
crystals occurs at the microcrystal nuclei.191 It is not uncommon for protein samples to precipitate
when screening crystallization conditions, as the conditions that can induce crystal nucleation are not
dissimilar to those that result in precipitation.
One commonly employed method of achieving crystallisation is to gradually increase the
concentration of precipitants. The vapour diffusion method achieves this by allowing the
concentration of precipitants, such as Polyethylene glycol (PEG) and/or ammonium sulphate, in a
mother liquor to equilibrate with a droplet of purified protein sample. The gradual increase of
precipitants means there are less solvent molecules available to the protein, which will lead to self-
association of protein molecules and either crystallization, or precipitation.192 This can be achieved
either by hanging-drop or sitting-drop methods. The approaches are essentially identical except that
the protein solution is either placed on a cover slip above the mother liquor reservoir (Hanging drop),
or in a separate well above the mother liquor (Sitting drop).193
The advent of robots capable of quickly and accurately dispensing small volumes of mother liquor
and aqueous protein samples has resulted in the sitting-drop method becoming highly popular.
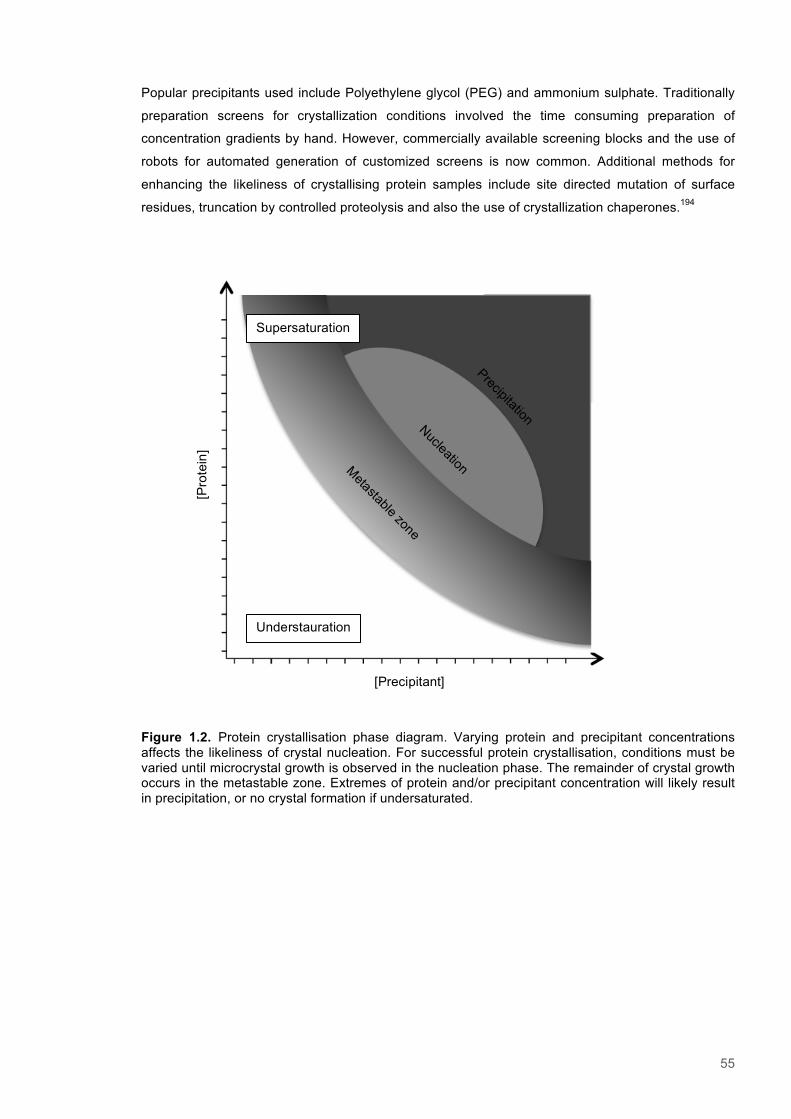
55
Popular precipitants used include Polyethylene glycol (PEG) and ammonium sulphate. Traditionally
preparation screens for crystallization conditions involved the time consuming preparation of
concentration gradients by hand. However, commercially available screening blocks and the use of
robots for automated generation of customized screens is now common. Additional methods for
enhancing the likeliness of crystallising protein samples include site directed mutation of surface
residues, truncation by controlled proteolysis and also the use of crystallization chaperones.194
Figure 1.2. Protein crystallisation phase diagram. Varying protein and precipitant concentrations affects the likeliness of crystal nucleation. For successful protein crystallisation, conditions must be varied until microcrystal growth is observed in the nucleation phase. The remainder of crystal growth occurs in the metastable zone. Extremes of protein and/or precipitant concentration will likely result in precipitation, or no crystal formation if undersaturated.
[Pro
tein
]
[Precipitant]
Understauration
Supersaturation
Metastable zone
Nucleation
Precipitation
56
1.9.2 Data collection
Protein crystals can be thought of repeating structural motifs, or unit cells, that make up the crystal
and act as a 3D diffraction gating when X-rays are focused on them. The diffraction of X-rays is
dependent on the orientation of the crystal with respect to the beam, and is enhanced in certain
directions and diminished in others.195 This is determined by the crystal unit cell geometry, and also
the wavelength of the X-ray beam. Furthermore, the arrangement of atoms within each unit cell
influences the effectiveness of interference of the X-ray beam at different orientations and therefore
the intensity of the diffracted beam.195 The structure of the crystal is therefore encoded within the
pattern of diffracted X-rays. As the intensity of each reflection is dependent on the arrangement of all
the atoms present, it is not possible to solve part of a crystal structure without modelling each and
every atom present. Typically a large number of reflections are recorded per crystal, some of which
are redundant and have equivalent intensities. Recording multiple redundant reflections is important
as it cancels out random error associated with each individual reflection. Recording more reflections
does however come at a cost, as prolonged exposure to the X-ray beam can damage and even
destroy crystallized protein samples. Radiation damage commonly leads to the decarboxylation of
acidic groups and breaking of disulphide bonds. The collection and processing of X-ray diffraction
data is now generally performed using specifically designed computer software and well established
protocols. Data affected by a number of crystal-related issues such as twinning and/or
pseudosymmetry still require human input to be successfully solved.196
The processing of crystal structure data involves a number of distinct steps, including integration and
scaling, solving the phase of reflections and then model building and refinement (Figure 1.3).197 The
first step consists of determining the phase of experimental reflections. The individual reflections
each have an associated phase and amplitude. The latter corresponds with the square root of the
measured intensity for each reflection. Diffraction data does not provide information regarding the
reflection phases, but this is required for the determination of electron density maps.198 There are a
number methods for solving the phases of X-ray data, including molecular replacement and direct
methods. Molecular replacement is generally used for those cases where structures have been
determined for structurally similar proteins, or protein domains. This method relies upon calculating
an estimate of the phases for a new data set from the previously known structural coordinates.199
Once an electron density map has been determined, a model of protein structure must be built to fit
within it. The electron density map is acquired by Fourier summation of the observed reflection
amplitudes (Fobs) and is refined against the reflection calculation amplitudes from the model (Fcalc).
Refinement of the model is generally carried out using a 2Fobs – Fcalc difference map, which reveal
differences between the observed data and the molecular model.199 The refinement process involves
iterative rounds of automated optimization of refined parameters and manual improvement of the fit
of the molecular model to the electron density map. This involves variation of parameters including
the coordinates (XYZ coordinates) and B-factors for each atom. The B-factor describes the extent to
57
which the electron density spreads out around the structure and generally represents the dynamic
mobility of an atom.195
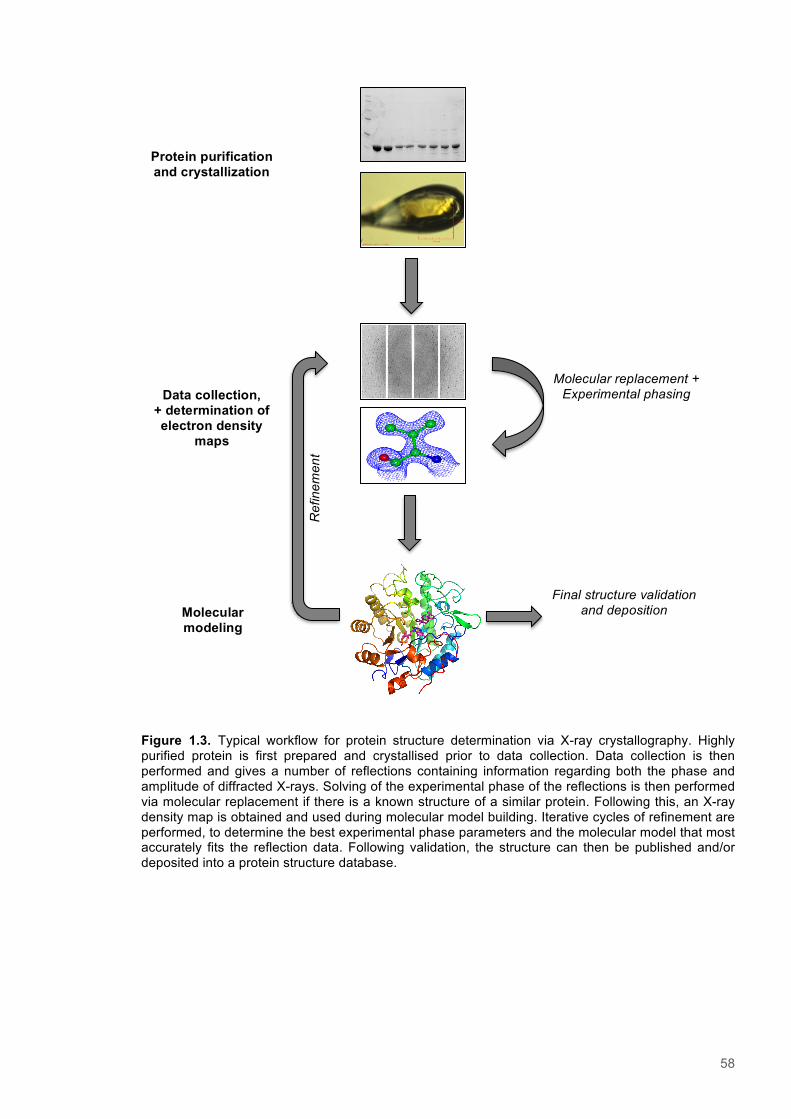
58
Figure 1.3. Typical workflow for protein structure determination via X-ray crystallography. Highly purified protein is first prepared and crystallised prior to data collection. Data collection is then performed and gives a number of reflections containing information regarding both the phase and amplitude of diffracted X-rays. Solving of the experimental phase of the reflections is then performed via molecular replacement if there is a known structure of a similar protein. Following this, an X-ray density map is obtained and used during molecular model building. Iterative cycles of refinement are performed, to determine the best experimental phase parameters and the molecular model that most accurately fits the reflection data. Following validation, the structure can then be published and/or deposited into a protein structure database.
Protein purification and crystallization
Data collection, + determination of electron density
maps
Molecular replacement + Experimental phasing
Molecular modeling
R
efin
emen
t
Final structure validation and deposition
59
1.10 Aims and synopsis of the thesis
The main objective of the current project is to investigate catalytically relevant protein dynamics in
the reductive half reactions of ene-reductase enzymes of the OYE family. Specifically this study will
focus on investigating the role of ‘fast’ timescale (fs-ps) motions that are thought to play a role in
promoting H-transfer via hydride tunnelling. Through the combined usage of structural biology
approaches and detailed analysis of enzyme kinetics, the work undertaken here provides novel
insight into the mechanism of enzyme-mediated H-tunnelling.
Chapter 3 describes the structural and kinetic analysis of set of mutagenic variants of PETNR. The
rationale for these mutations arose from an NMR-based analysis of protein flexibility in the free and
ligand bound structures. Interestingly it was observed that mutagenesis had marginal effects on the
observed rates of catalytic chemistry, due to the compensatory effects of thermodynamic activation
parameters. In addition, a non-classical treatment of variant enzyme kinetics is applied, which
incorporates consideration of heat capacity into the Eyring equation.
Chapter 4 documents analysis of Kinetic isotope effects (KIEs) for PETNR, TOYE and XenA, with
both natural coenzymes and nicotinamide coenzyme biomimetics. This is the first time that isotope
effects for OYE enzymes with the fast reacting mimetic compounds have been characterised. The
observation of highly temperature dependent isotope effects for these compounds and a correlation
between observed rates of reduction and activation enthalpies highlighted the role of extensive
hydride donor-acceptor distance sampling for stimulating H-transfer in the systems studied.
Chapter 5 outlines the investigation of nuclear Overhauser effects (NOE) within PETNR-ligand
complexes using NMR spectroscopy. The identification of intermolecular NOE measurements
between the holoenzyme and substrate was undertaken to provide a distance dependent measure,
which was then used to study the effect of pressure on structural organisation within the active site.
60
Chapter 2
Material & Methods
2.1 Materials and reagents The methods and compounds used during this study are presented below. Where applicable, the
manufacturers of experimental equipment and lab-materials suppliers are documented.
Reagent/Compound Supplier
Agarose Fisher Scientific
Alcohol dehydrogenase (Saccharomyces cerevisiae) Sigma-Aldrich
Aldehyde dehydrogenase (Saccharomyces cerevisiae) Sigma-Aldrich
Ammonium Bicarbonate (NH4HCO3) Sigma-Aldrich
BL21(DE3) Cells Sigma-Aldrich
Boric acid Sigma-Aldrich
Bromophenol blue Melford
Calcium chloride dihydrate Sigma-Aldrich
Carbenicillin Melford
Cobalt(II) chloride hexahydrate Sigma-Aldrich
Copper(II) sulphate Sigma-Aldrich
2-cyclohexen-1-one Sigma-Aldrich
Dithiothreitol Fisher scientific
DNase 1 Sigma-Aldrich
Deuterium oxide Goss Scientific Instruments Ltd
Ethylenediaminetetraacetic Acid, disodium Salt Fisher Scientific
Ethanol (Deuterated) Cambridge Isotope Laboratories
Ethylenediaminetetraacetic acid (EDTA) Sigma-Aldrich Glycerol Fisher Scientific
Glycine Formedium
Hydrogen gas
IPTG - Isopropyl β-D-1-thiogalactopyranoside Formedium
Imidazole Sigma-Aldrich
Isopropanol Fisher Scientific
Isopropanol (Deuterated) Cambridge Isotope Laboratories
JM109 Cells Sigma-Aldrich
Luria Bertani Agar Sigma-Aldrich
Luria Bertani growth medium (Miller) Sigma-Aldrich
Lysozyme Fisher Scientific

61
β-Mercaptoethanol Sigma-Aldrich
Manganese(II) sulfate monohydrate Sigma-Aldrich
MgCl2 Fisher Scientific
NaCl Fisher Scientific
NADP+ Melford Laboratories
NADP+-dependent alcohol dehydrogenase (Thermoanaerobacter brokii)
NAD+ Melford Laboratories
Polyethylene glycol 3000 Fisher Scientific
Potassium dihydrogen phosphate Fisher Scientific
Potassium hydride Fisher Scientific
Potassium hydroxide Sigma-Aldrich
Potassium iodide Sigma-Aldrich
Protease Complete™ EDTA-free inhibitor tablet Roche
SOC Medium
Sodium molybdate dehydrate Sigma-Aldrich Sodium cacodylate, pH 6.5 Molecular dimensions
Sodium chloride Sigma-Aldrich Sodium dodecyl sulphate Fisher Scientific
Trimethlysilyl propionate Sigma-Aldrich
Tris base – Tris(hydroxymethyl)aminomethane Formedium
Tris(hydroxymethyl)aminomethane hydrochloride Formedium
Tris-acetate Fisher Scientific
Trisodium citrate dihydrate Sigma-Aldrich
Tryptone Formedium
Yeast extract Formedium
Zinc sulfate heptahydrate
62
2.2 Protein expression and purification methods
2.2.1 Bacterial transformation The expression of both wild type and variant forms of PETNR was performed using JM109 cells.
After thawing, the cells incubated on ice for 10 minutes and then 0.1–50 ng of pONR1 plasmid
(derived from pBlueScript II SK(+)) was added. The mixture was subsequently incubated on ice for
30 minutes. Samples were then heat shocked at 42 °C for 45 seconds and then incubated on ice for
a further 2 minutes. 500 µl of pre-warmed SOC medium was added, and the cells were incubated at
37 °C, while shaking at 200 rpm, for ~1 hour. The cells were then plated on Luria Broth (LB)-Agar
plates supplemented with 100 µg ml-1 carbenicillin and incubated overnight at 37 °C. For the
expression of TOYE/XenA proteins, BL21(DE3) cells were preferred. The transformation protocol
was identical to that described for JM109 cells, except the heat shock duration was reduced to 10
seconds. The BL21(DE3) cells transformed with TOYE/XenA plasmid constructs were plated on
Luria Broth (LB)-Agar supplemented with 100 µg ml-1 ampicillin.
2.2.2 PETNR Expression
For PETNR expression competent JM109 E. coli cells were transformed with recombinant onr from
Enterobacter cloacae PB2 contained in the pONR1 plasmid (derived from pBlueScript II SK(+)) (see
materials & methods 2.2.1). E. coli cultures were grown in 2 × Yeast extract and Tryptone (2 × YT)
medium supplemented with 50 µg ml-1 carbenicillin and incubated at 37 °C, while shaking at 200
rpm. A single transformed colony was picked to inoculate a 5 ml small-scale culture, which was
incubated for ~5 hours. 50 µl of the small-scale culture was subsequently used to inoculate a 200 ml
intermediate culture, which was incubated for ~16 hours. 5 ml of the intermediate culture was used
to inoculate 12 × 2 l flasks, each containing 500 ml of 2 × YT Medium. Large-scale E. coli cultures
were incubated until an OD600 of ~0.6 was reached, PETNR overexpression was then induced by
adding 250 µl of IPTG (1 M), to give a final concentration of 0.5 mM IPTG. Cells were harvested via
centrifugation at 6000 x g using a JLA8.1 rotor (Beckman) at 4 °C, for 10 minutes. The cell pellet was
frozen at -20 °C.
2.2.3 Isolation of PETNR
Purified PETNR was isolated using a procedure based on that previously described.68 The cell pellet
was thawed at room temperature and resuspended in 1 ml · g-1 (wet cell mass) of lysis buffer A (10
mM KH2PO4//K2HPO4, pH 6.5) containing 0.1 mg/ml DNase I, 0.1 mg/ml lysozyme, 50 mM MgCl2
and 1 protease Complete™ EDTA-free inhibitor tablet per 100 ml of solution. After being left to stir
for 1 hour at 4 °C the cell extract was placed on ice and sonicated with 15 second pulses at 50 %
power. This was repeated 20 times, with 45 second pauses in between pulses. The cell lysate was
clarified by centrifugation at 35000 x g in a 50.2 Ti rotor (Beckman) for 60 minutes at 4 °C. The
supernatant was dialysed overnight into 10 L of lysis buffer.

63
All chromatography was performed at 4 °C. The dialysate was applied onto an 8 x 5 cm column
containing 160 ml of Mimetic Orange 2 A6XL resin (Affinity Chromatography Ltd) pre-equilibrated
with 5 column volumes of lysis buffer A. The unbound protein was removed by washing with 5
column volumes of lysis buffer A. Bound protein was eluted with lysis buffer A containing 250 mM
NaCl, and 3 ml elution fractions were collected using a Redifrac™ fraction collector (Pharmacia
Biotech). The purity of elution fractions was assayed using SDS-PAGE and spectrophotometry (See
sections 2.4.1; 2.5.1). The purest fractions, with anAbs280:Abs464 < 10, were combined and then
concentrated using a 350ml Amicon™ ultrafiltration stirred cell (Millipore) fitted with a
polyethersulfone (PES) membrane, molecular weight cut-off (MWCO) = 10 kDa (Generon). The
concentrated eluent was dialysed overnight into 10 L of loading buffer (20 mM Tris/HCl, pH 8 at 4
°C). The dialysate was applied onto a 1.6 cm x 60 cm column containing 96 ml of Source-Q anion
exchange/affinity resin pre-equilibrated with 10 x column volumes of loading buffer. The column was
washed with 10 column volumes of loading buffer and 20 ml wash fractions collected. Bound protein
was eluted with loading buffer containing 50 mM NaCl and 3 ml elution fractions were collected. The
purity of the wash and elution fractions was assayed using SDS-PAGE and spectrophotometry.
Fractions which ran as a single band and had an Abs280:Abs464 < 5 were combined, and retained for
crystallography. Fractions which had an Abs280:Abs464 = 7-10 were combined and retained for kinetic
studies. Combined fractions were concentrated to a final volume of ~1ml using a Vivaspin-20
concentrator, MWCO = 30 kDa (Sartorius). Protein samples were frozen in liquid nitrogen and stored
at -80 °C.
2.2.4 Preparation of isotope labelled PETNR protein
The production of uniformly 15N labelled protein was achieved by expressing PETNR in the bacterial
cultures grown in M9 minimal medium containing a 15NH4Cl compound as the sole source of
nitrogen. The preparation of M9 minimal medium is documented in this section. The remainder of
the expression and purification protocols are identical to those described for unlabelled PETNR,
unless otherwise stated (see materials & methods 2.2.1-2.2.2).
A trace elements stock solution was prepared by dissolving; 550 mg CaCl2.2H2O, 140 mg
MnS04.H2O, 40 mg CuSO4.7H20, 220 mg ZnSO4.7H20, 45 mg CoCl2.6H20, 26 mg Na2MoO4.2H2O,
40 mg H3Bo4 and 26 mg KI in 70 ml of MQ (Milli-Q) H2O. The pH was adjusted to 8.0 prior to the
addition of 500 mg ethylenediaminetetraacetic acid (EDTA). The pH was then readjusted to 8.0
before the addition of 375 mg FeSO4.7H20. The solution was made up to 100 ml with MQ H2O before
being filter sterilized using a 0.2 µm Minisart® syringe filter (Sartorius). Stock solutions of 1M CaCl2
and 1M MgSO4 were prepared in MQ H2O and autoclaved, and 0.2 g ml-1 15NH4Cl and 0.2 g ml-1 D-
glucose solutions were also prepared in MQ H2O and filter sterilized using 0.2 µm Minisart® syringe
filter (Sartorius).
64
To assemble ~1 l of M9 minimal media, 6g Na2HPO4, 3g KH2PO4 and 0.5g NaCl2 were first dissolved
in 1 l MQ H2O. The pH was then adjusted to 7.4 using KOH and the solution was autoclaved. This
was followed by the addition of 650 µl of the trace elements stock solution, 100 µl CaCl2 (1 M), 1ml
MgSO4 (1M), 1 ml carbenicillin (50 mg ml-1), 7.5 ml 15NH4Cl (0.2 g ml-1) and 15 ml D-glucose (0.2 g
ml-1). The solution was shaken immediately after adding CaCl2 in order to prevent precipate
formation.
2.2.5 Expression of 15N-labelled PETNR
For 15N-PETNR expression a single colony of JM109 E. coli cells transformed with the pONR1
plasmid was used to inoculate a 5 ml starter culture of LB broth supplemented with 50 µg ml-1
carbenicillin. Inoculated cultures were incubated for ~5 hours at 37°C with shaking at 200 rpm. 50 µl
of this culture was used to inoculate 4 × 500 ml flasks, each containing 200 ml of LB broth
supplemented with 50 µg ml-1 carbenicillin. The 200 ml cultures were then divided into 50 ml aliquots
and centrifuged at 2,500 g for 10 minutes at 25 °C, and the supernatant discarded. The cell pellets
were then re-suspended in 10 ml of warm (37 °C) M9 minimal medium and used to inoculate 12 × 2 l
flasks, each containing 500 ml of M9 minimal medium. These cultures were then grown at 37°C with
shaking at 200 rpm until an OD600 of ~0.6 was reached. Protein expression was then induced by
adding 250 µl of IPTG (1 M), to give a final concentration of 0.5 mM. Induced cultures were
incubated for ~18 h at 37 °C with shaking at 200 rpm before cells were harvested by centrifuging at
6000 x g with a JLA8.1 rotor (Beckman) at 4 °C, for 10 minutes. The cell pellet was frozen at -20 °C.
2.2.6 TOYE & XenA Expression
Copies of both the TOYE and XenA encoding genes were obtained as N-terminal His10-Tagged
constructs. The TOYE gene from Thermoanaerobacter pseudethanolicus in the pET21b (Novagen)
vector at the NdeI/XhoI restriction sites, and the XenA gene from Pseudomonas putida in the
pET21a (Novagen) vector at the NdeI/NotI sites. For expression of both TOYE and XenA,
BL21(DE3) E. coli cells were transformed with the suitable plasmid construct and grown LB broth
supplemented with 50 µg mL−1 ampicillin and incubated at 37 °C, while shaking at 200 rpm. Volumes
used during the scaling up of bacterial growth from an initial single colony to small, intermediate and
large scale cultures were identical to those used during PETNR expression (Methods 2.2.1). Large-scale E. coli cultures were incubated until an OD600 of ~0.6 was reached, and the overexpression of
both TOYE and XenA was then induced by the addition of 250µl of IPTG (1 M), to give a final
concentration of 0.5 mM IPTG. Cells were harvested via centrifugation at 6000 x g using a JLA8.1
rotor (Beckman) at 4 °C, for 10 minutes. The cell pellet was frozen at -20 °C.
65
2.2.7 Isolation of TOYE & XenA
The TOYE and XenA enzymes used during this study were purified using Ni-NTA (Nitrilotriacetic
acid) affinity chromatography as described previously.63,97 The cell pellet was thawed at room
temperature and resuspended in 1 ml · g-1 (wet cell mass) of lysis buffer B (50 mM KH2PO4/K2HPO4,
300 mM NaCl, 10 mM imidazole, pH 8.0) containing and 1 protease Complete™ EDTA-free inhibitor
tablet per 100 ml of solution. Cell disruption was performed using sonication, and the cell lysate was
clarified by centrifugation, as previously described (Methods 2.2.2). The filtered supernatant was
loaded onto a column containing 100 ml of Ni-NTA affinity resin (QIAGEN) preequilibrated with Lysis
buffer B. The column was washed with 5 column volumes of wash buffer (50 mM KH2PO4/K2HPO4,
300 mM NaCl, 25 mM imidazole, pH 8.0). Bound protein was eluted with elution buffer (50 mM
KH2PO4/K2HPO4, 300 mM NaCl, 200 mM imidazole, pH 8.0) and 5 ml elution fractions were collected
using a Redifrac™ fraction collector (Pharmacia Biotech). The purity of elution fractions were
assayed using SDS-PAGE (See sections 2.4.1), and the purest fractions combined.
An additional chromatographic step was performed using a prepacked HiLoad® 26/60 Superdex gel
filtration column (GE Healthcare) preequilibrated with two column volumes of Size Exclusion
Chromatography (SEC) Buffer (50 mM KH2PO4/K2HPO4, 300 mM, NaCl 200 mM imidazole, pH 8.0).
The eluate obtained after Ni-NTA affinity chromatography was dialysed overnight into into 10 L of
SEC buffer, and subsequently loaded onto the column. Elution fractions were collected and the
purity assayed using SDS-PAGE (See sections 2.4.1). Sufficiently purified fractions were combined
and concentrated using a Vivaspin-20 concentrator, MWCO = 30 kDa (Sartorius), and then frozen in
liquid nitrogen and stored at -80 °C.
66
2.3 Molecular biology techniques
2.3.1 Plasmid DNA purification
Plasmid DNA was purified from E. coli cell extracts using the miniprep kit (Qiagen Ltd) according to
the instructions provided. 5 ml cultures of E. coli transformed with the desired plasmid were grown
overnight in LB-medium supplemented with appropriate antibiotic. Cells were then pelleted via
centrifugation at 4000 rpm for 10 minutes. Cell extracts were then suspended in buffer P1 and the
cells lysed via alkaline lysis through the addition of buffer P2. Neutralization of the cell lysate was
performed via adding buffer N3, which contains a high salt concentration. The lysate was then
centrifuged at 13000 rpm for 10 minutes and the pellet discarded. The supernatant was then added
to a Qiagen spin column, which contains a silica membrane to bind plasmid DNA. Washing of the
spin column was performed by adding PE and PB buffers to remove salt and endonuclease
enzymes. The purified plasmid DNA was then eluted from the spin column via the addition of EB
buffer. Note, after buffer addition step the Qiagen spin column was centrifuged at 13000 rpm for 1
minute. Plasmid DNA was stored at - 80 °C.
2.3.2 Site-directed mutagenesis
The desired mutations were introduced into the pONR1 plasmid using the QuikChange™ II Site-Directed Mutagenesis method (Stratagene) and custom primers (ordered from Eurofins; Table 2.1).
The template pONR-1 plasmid was harvested from a culture of E. coli JM109/pONR-1, grown in 5 ml
of 2 x YT media supplemented with 50 µg ml-1 carbenicillin, using a QIAprep Spin Miniprep Kit
(Qiagen). A polymerase chain reaction (PCR) reaction was set up in a 3 PRIME Thermal Cycler
(Techne), according the QuikChange™ method (Stratagene), to synthesize mutant copies of the
pONR1 template plasmid.
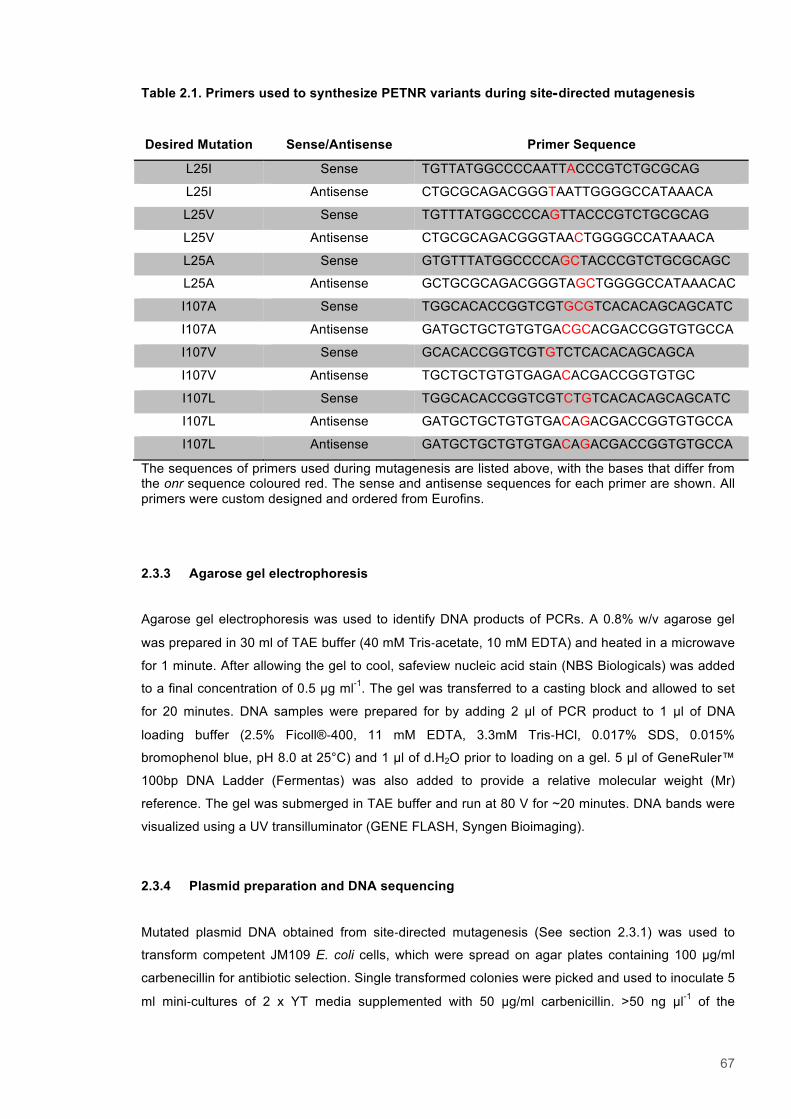
67
Table 2.1. Primers used to synthesize PETNR variants during site-directed mutagenesis
Desired Mutation Sense/Antisense Primer Sequence
L25I Sense TGTTATGGCCCCAATTACCCGTCTGCGCAG
L25I Antisense CTGCGCAGACGGGTAATTGGGGCCATAAACA
L25V Sense TGTTTATGGCCCCAGTTACCCGTCTGCGCAG
L25V Antisense CTGCGCAGACGGGTAACTGGGGCCATAAACA
L25A Sense GTGTTTATGGCCCCAGCTACCCGTCTGCGCAGC
L25A Antisense GCTGCGCAGACGGGTAGCTGGGGCCATAAACAC
I107A Sense TGGCACACCGGTCGTGCGTCACACAGCAGCATC
I107A Antisense GATGCTGCTGTGTGACGCACGACCGGTGTGCCA
I107V Sense GCACACCGGTCGTGTCTCACACAGCAGCA
I107V Antisense TGCTGCTGTGTGAGACACGACCGGTGTGC
I107L Sense TGGCACACCGGTCGTCTGTCACACAGCAGCATC
I107L Antisense GATGCTGCTGTGTGACAGACGACCGGTGTGCCA
I107L Antisense GATGCTGCTGTGTGACAGACGACCGGTGTGCCA
The sequences of primers used during mutagenesis are listed above, with the bases that differ from the onr sequence coloured red. The sense and antisense sequences for each primer are shown. All primers were custom designed and ordered from Eurofins.
2.3.3 Agarose gel electrophoresis
Agarose gel electrophoresis was used to identify DNA products of PCRs. A 0.8% w/v agarose gel
was prepared in 30 ml of TAE buffer (40 mM Tris-acetate, 10 mM EDTA) and heated in a microwave
for 1 minute. After allowing the gel to cool, safeview nucleic acid stain (NBS Biologicals) was added
to a final concentration of 0.5 µg ml-1. The gel was transferred to a casting block and allowed to set
for 20 minutes. DNA samples were prepared for by adding 2 µl of PCR product to 1 µl of DNA
loading buffer (2.5% Ficoll®-400, 11 mM EDTA, 3.3mM Tris-HCl, 0.017% SDS, 0.015%
bromophenol blue, pH 8.0 at 25°C) and 1 µl of d.H2O prior to loading on a gel. 5 µl of GeneRuler™
100bp DNA Ladder (Fermentas) was also added to provide a relative molecular weight (Mr)
reference. The gel was submerged in TAE buffer and run at 80 V for ~20 minutes. DNA bands were
visualized using a UV transilluminator (GENE FLASH, Syngen Bioimaging).
2.3.4 Plasmid preparation and DNA sequencing
Mutated plasmid DNA obtained from site-directed mutagenesis (See section 2.3.1) was used to
transform competent JM109 E. coli cells, which were spread on agar plates containing 100 µg/ml
carbenecillin for antibiotic selection. Single transformed colonies were picked and used to inoculate 5
ml mini-cultures of 2 x YT media supplemented with 50 µg/ml carbenicillin. >50 ng µl-1 of the
68
modified plasmids was harvested from the mini cultures using a QIAGEN miniprep kit (Qiagen; See
section 2.3.1). The plasmid sequences were verified by value read sequencing (Eurofins) from the
T3 promoter to confirm the presence of the desired mutation.
2.4 Protein techniques
2.4.1 Sodium dodecyl sulphate polyacrylamide gel electrophoresis
SDS-PAGE was used to assess the purity of fractions obtained during chromatographic protein
purification procedures (See section 2.2.2). A 12 % Mini-PROTEAN® TGX™ Stain-Free™ precast
gel (Biorad) was run at a constant voltage of 300 V for ~25 minutes, or until the dye front neared the
bottom of the gel. The gel was run in 1x SDS buffer (25 mM Tris/HCL, 192 mM glycine, 0.1% SDS,
pH 8.3). 20 µl of protein sample was mixed with 20 µl of 2 x SDS sample buffer (50mM Tris/HCl,
100mM DTT, 2% SDS (w/v), 0.1% Bromophenol blue (w/v), 10% Glycerol (v/v), 2-mercapthoethanol)
and then heated for 5 minutes at 95 °C prior to beingloaded onto the gel. 5 µl of Precision Plus
Protein™ Standard Unstained marker (Bio-Rad) was also loaded to the gel to provide a relative
molecular weight (Mr) reference. The gel was analysed in a Gel Doc EZ Imager, using Image Lab
3.0.1 software (Bio-Rad).
2.4.2 Crystallography
Protein for crystallography was prepared as described (see section 2.2). The crystallisation
conditions used here were based on those previously reported.38 Crystals were obtained by mixing
200 nl of 15 mg/ml protein in 20 mM Tris/HCl, pH 8 at 4 °C, with 400 nl of a reservoir containing 25
% (w/v) PEG 3000, 17 % (v/v) isopropanol, 0.1 M trisodium citrate, 0.1 M cacodylic acid (pH 6.5),
using the sitting-drop vapour diffusion method. All trays were incubated at ~23 °C and crystal
formation was observed after 48 hours. The crystals were flash frozen before data collection to 1.5 Å
resolution at the diamond synchrotron facility (Diamond House, Harwell Science and Innovation
Campus). Data collection was carried out by Colin Levy (Manchester Institute of Biotechnology, The
University of Manchester).
69
2.5 Spectroscopy
2.5.1 UV-Vis spectroscopy
UV-Vis spectra were acquired using a Cary 50 UV/Vis spectrophotometer (Varian). All spectra were
recorded over a wavelength range of 250-700 nm, with baseline correction against buffer. The
Abs280:Abs464 ratio was calculated to give an indication of PETNR purity, and absorbance at 465 nm
was used to calculate protein concentration using the Beer-Lambert equation to (See equation
2.1).200
! = !"# (Equation 2.1)
Where A is absorbance, c is the protein concentration, l is the cell path length and ε is the molar
absorption coefficient.
2.5.2 Stopped-flow experiments
All stopped-flow experiments were performed inside a glovebox (Belle Technology) under anaerobic
conditions (<5 ppm O2). Anaerobic buffer was prepared by bubbling nitrogen gas through solutions
for ~1 hour and subsequently being placed in the glovebox overnight. Protein samples were made
anaerobic by applying them to a CentriPure P5 gel filtration column (Generon), which was contained
within the glovebox and had been pre-equilibrated with anaerobic buffer. Spectroscopic
measurements were recorded using a U-1800 UV⁄ Vis spectrophotometer (Lambda Advanced
Technology) and a cuvette with a 1 cm light path, under anaerobic conditions in the glove box.
Experiments were performed in anaerobic reaction buffer (50 mM potassium phosphate, pH 7.0).
The reaction mixtures consisted of ~20 µM PETNR and incremental increases of NADPH coenzyme,
from 100-1000 µM. This range of coenzyme concentrations was selected to include a near
stoichiometric amount to 50-fold excess to ensure pseudo-first order reaction kinetics.
Rapid mixing kinetic experiments were carried out using an SX.18MV-R stopped-flow
spectrophotometer (Applied photophysics) housed in the glovebox. Spectral absorption changes at
465 nm were recorded over 2 seconds to measure flavin reduction. Absorption traces were fit to
single exponential expression (See equation 2.2) using Pro-Data Viewer software (Applied
Photophysics Ltd.).41
∆! = !!!!!"#!
(Equation 2.2)
70
Where kobs is the observed rate constant and A is the amplitude of each kinetic phase extracted from
the transient kinetic trace, and ΔA is the total change in absorbance observed. The rate constants
reported are mean averages of 4, or 5 measurements taken under each set of reaction conditions.
The error reported for each rate constant is the standard deviation of the values contributing to each
averaged figure. The average observed rate constants were analysed by fitting to a rate against
concentration equation using origin 8.5 pro software (Microcal; Equation 2.3).41
!!"# =!!"#[S]!![S]
(Equation 2.3)
2.5. NMR spectroscopy
All data sets were processed and analysed using TopSpin (Bruker). Proton chemical shifts were
referenced relative to TSP at 0.0 ppm. 15N and 13C chemical shifts were calculated indirectly by
using the following gyromagnetic ratios: 15N/1H 0.101329118 and 13C/1H 0.251449530.
2.5.1 1H-15N HSQC NMR spectroscopy
1H-15N HSQC NMR spectra were acquired on 1 mM 15N-PETNR prepared in 50 mM potassium
phosphate buffer, pH 7, unless stated otherwise. NMR samples included 1 mM trimethylsilyl
propionate (TSP) to provide a chemical shift reference, and 10% 2H2O for sample lock. HSQC
spectra were acquired at 298 K on a 800 MHz spectrometer (Bruker). Shimming was done via
automatic gradient shimming using Topshim.
2.5.2 Resonance assignment
Assignment of the chemical shifts of 1H, 15N, 13C’, 13Cα and 13Cβ nuclei of PETNR was based on
2D-1H15N-TROSY and 3D TROSY spectra 2D-1H15N-TROSY, 3D-HNCO, 3D-HNCACB, 3D-
HN(CO)CA, 3D-HN(CA)CO, CBCACONH and HNCA. 201-208 NMR spectra used for assignment were
recorded on 1 mM 2H 13C 15N PETNR in 50 mM potassium phosphate buffer, pH 7. The
perdeuterated 2H 13C 15N PETNR protein was kindly provided by C. Fernandez. Experiments were
acquired at 298 K on an Avance 800 MHz spectrometer equipped with a TCI Cryoprobe (Bruker).
Sequential assignment of the backbone peaks involved connecting the 1H, and 15N frequencies of
each peak in the 1H‐15N HSQC spectrum with 13Cα and 13Cβ frequencies from the HNCA,
HN(CO)CA, HNCACB and HN(CO)CACB spectra. The HNCA spectrum displays cross peaks for the
Cα atom, at the 1H and 15N frequencies of the amide group of that residue. The HN(CO)CA spectra,
however, shows a cross peak for the Cα atom of the previous residue in the protein sequence, but at
the 1H and 15N frequencies of the current residue. The HNCACB experiment shows the Cα and Cβ of
71
both the current and previous residues, but at the 1H and 15N frequencies of the current residue.
Lastly, the HN(CO)CACB experiment displays cross peaks at the Cα and Cβ chemical shifts at 1H and 15N frequencies of amide group of the previous residue. The 13C’ resonances of the current and
previous residues were then acquired from the HN(CA)CO spectrum at the 1H and 15N frequencies of
the current residue. The 13C’ frequencies assigned in the HN(CA)CO spectrum were subsequently
matched to related peaks in the HNCO spectrum, which shows cross peaks for the previous residue
only. The analysis and assignment of these spectra was undertaken using CCPNMR analysis
software using a semi-automated protocol.209
2.5.3 Saturation Transfer Difference (STD) NMR
STD NMR spectra were acquired on 1 mM PETNR, 10 mM nicotinamide, prepared in 50 mM
potassium phosphate buffer, pH 7. Control experiments were performed using a sample of 10 mM
nicotinamide, prepared in 50 mM potassium phosphate buffer, pH 7. NMR samples included 1 mM
trimethylsilyl propionate (TSP) to provide a chemical shift reference, and 10% 2H2O for sample lock.
Spectra were acquired at 298 K on an Avance 800 MHz spectrometer equipped with TCI Cryoprobe
(Bruker). Shimming was done via automatic gradient shimming using Topshim. STD NMR spectra
were acquired using either a stdiffesgp, or stdiffesgp.3 pulse sequences.210 Experiments involving
the latter included a 15 ms T1ρ spin-lock pulse for the suppression of protein resonances. An
irradiation power of 47.05 Hz and a train of 12.5 ms Gauss.1.1000 shaped pulse were used to for
saturation pulses in all STD NMR experiments. The total duration of the presaturation period was
varied between 0.2 s and 5 s. A relaxation delay of 6 s was also used for all experiments. Water
suppression was achieved using excitation sculpting with gradients. The on-resonance irradiation
was applied at chemical shifts of -0.35, for the protein, and at 12.7 ppm, for the FMN-H3. The off-
resonance irradiation was performed at 40 ppm, where no protein signals were observed. The
differences between the on-resonance and off-resonance spectra were determined manually. This
involved integrating the ligand peaks observed, using identical integral ranges for both spectra, and
then subtracting the on-resonance integrals from the off resonance integrals. Control experiments
were recorded on a sample containing ligand alone. The STD values determined from the control
experiments were also subtracted from the STD values to account off-resonance saturation
artefacts. All STD NMR spectra were processed identically. The spectra were multiplied by an
exponential linebroadening function of 0.3 Hz prior to fourier transformation. A ‘quad’ baseline
correction mod was used. Spectra were then phased manually using topspin.
2.5.4 Selective NOE NMR
Selective NOE experiments were acquired on a sample containing 1 mM PETNR, 10 mM NADPH4,
in 50 mM potassium phosphate buffer, pH 7. NMR samples included 10% 2H2O for sample lock.
Spectra were acquired at with a 600 MHz spectrometer equipped with a cryoprobe probe (Bruker) at
298 K. The SELGPSE pulse sequence was used for calibration and referencing of the selective
72
pulse, and the SELNOGP pulse sequence for acquiring selective NOE spectra.211 For both, a 10 ms
long sinc1.1000 shaped pulse was used for selective excitation, except where stated as different.
The irradiation power level for the selective pulse was calculated for each experiment using on the
basis of the 90° degree pulse length determined for each sample, the desired total rotation of the
selective pulse (i.e. 180°), the desired pulse length (10 ms) and the integration factor for the
sinc.1.1000 pulse shape. A mixing time of 0.07 s was used unless stated otherwise. The offset
frequencies used for the selective pulse were 13.84 ppm, 12.89 ppm, 12.47 ppm, 11.828 ppm and
11.685 ppm. All selective NOE spectra were multiplied by an exponential linebroadening function of
5 Hz prior to fourier transformation. Automated phase correction (pk) and baseline correction (q-fill)
modes were also used during processing of the spectra.
2.6 Preparation of NAD(P)H isotopologues and nonreactive analogues
2.6.1 (R)-[4-2H]-NAD(P)H preparation
The deuterated NAD(P)H substrates were produced via enzymatic stereospecific reduction of
NAD(P)+, via a method based on that previously described.212 The production of both (R)-[4-2H]-
NADH and (R)-[4-2H]-NADPH was performed in 10 mM NH4HCO3, with the pH adjusted to 8.5 using
liquid ammonia. For (R)-[4-2H]-NADH, 1 g of 1-[2H6]-ethanol, 100 U aldehyde dehydrogenase and
200 U yeast alcohol dehydrogenase were added to the buffered solution. Then 500 mg of NAD+ was
slowly added to this mixture in a stepwise manner, whilst readjusting the pH to 8.5 after each
addition. For (R)-[4-2H]-NADPH, 100 U of NADP+-dependent alcohol dehydrogenase (from
Thermoanaerobacter brokii) and 1 g of 1-[2H6]-isopropanol were added to the buffered solution. 500
mg of NADP+ was then slowly added, whilst readjusting the pH to 8.5 after each addition. The
reactions were then monitored until the pH had stopped decreasing and the absorbance ratio
A280:A340 had reached ~2.3.
2.6.2 1,4,5,6-tetrahydroNAD(P)H [NAD(P)H4] preparation
The nonreactive NAD(P)H4 coenzyme mimics were prepared by the reduction of NAD(P)H with
hydrogen in the presence of palladium on activated charcoal. 30 mg of palladium on activated
charcoal and 500 mg of NAD(P)H were added to 20 ml of NH4HCO3, with the pH adjusted to 8.5
using liquid ammonia, and the mixture was placed on ice and constantly stirred. A ~1.2 bar pressure
of hydrogen gas (> 99 %) was applied to the reaction mixture and maintained for ~ 2 hours, until the
absorbance ratio A266:A288 nm = 1.1 and there was no longer a peak observed at 340 nm. The peak
at 340 nm corresponds to the C4 methylene of the nicotinamide moiety. The loss of the peak at 340
nm and the corresponding gain in absorbance at 288 nm, to roughly the same height as that
corresponding to the adenine substituent at 260 nm, shows that the tetrahydro reduced form has
73
been produced. The absorbance at 288 nm is believed to correspond to the tetrahydro reduced form
of the pyridine ring.
2.6.4 Purification of Coenzyme isotopologues and nonreactive analogues
The deuterated (R)-[4-2H]-NAD(P)H coenzymes and the 1,4,5,6-tetrahydroNAD(P)H nonreactive
analogues were purified from the reaction mixtures by anion-exchange chromatography. The
reaction mixture was first loaded onto a 20 ml Q-Sepharose column (GE Healthcare) pre-equilibrated
with 10 mM NH4HCO3, pH 8.5. After washing the column with 5 column volumes of 10 mM NH4HCO3
to remove unbound impurities, the (R)-[4-2H]-NAD(P)H coenzymes and 1,4,5,6-tetrahydroNAD(P)H
nonreactive analogues were eluted with 200 mM and 500 mM NH4HCO3, pH 8.5, respectively.
Following purification, the elution fractions were flash frozen in liquid nitrogen and then lypophylized
using a Heto PowerDry PL3000 Freeze Dryer (Thermo Fisher). The identity of the all coenzyme
isotopologues and nonreactive analogues were confirmed using 1H NMR (See section 2.5.1). The
concentration of coenzymes were determined using extinction coefficients of 16.8 mM-1 cm-1 at 289
nm for NAD(P)H4 and 6.22 mM-1 cm-1 at 340 nm for the NAD(P)H isotopologues.
74
Chapter 3
A structural and kinetic characterization of mutagenic variants of PETNR
Authors: Alexander Geddes, Andreea Iorgu, Sam Hay and Nigel S. Scrutton
Affiliations: Manchester Institute of Biology and School of Chemistry, The University of Manchester,
131 Princess Street, Manchester, M1 7DN, United Kingdom.
Manuscript in preparation
75
3.1 Abstract
Pentaerythtritol tetranitrate reductase (PETNR) is a flavin dependent oxidoreductase that utilizes a
reduced nicotinamde cofactor for hydride donation and catalyses H-transfer via a nuclear quantum
tunneling mechanism. The drive to find experimental evidence linking fast time-scale ‘promoting’
dynamics to the reaction coordinate has so far focused on studies of temperature- and pressure-
dependent kinetic isotope effects (KIEs), and the perturbation of vibrational motion by heavy isotope
labeling. Here, a set of active site side chains are targeted for truncation via mutagenesis. A set of
site-directed mutants with progressively truncated side chains in place residues I107 and L25 were
created with the intention of perturbing the H-transfer coordinate and the capacity for modulation of
the donor to acceptor distance. A subsequent kinetic and structural characterization reveals that the
robust active site of PETNR is able to withstand subtle alterations in active site structure without a
penalty in terms of the observed rate of catalysis, despite apparent shifts in the temperature
dependence of KIEs. However, the nonclasssical kinetic profiles exhibited by the variants are
addressed using a recently presented model that incorporates consideration of heat capacity
changes occurring during catalysis.
76
3.2 Introduction
That hydride tunneling contributes to the observed rate of H-transfer in many enzyme systems is
now broadly accepted within the field. This has been inferred largely on the basis of temperature
dependent kinetic isotope effects, the so called ‘gold standard’ for identifying enzymatic H-
tunneling.1-3 However, the notional coupling of dynamic networks to catalytic chemistry is still
disputed, with some interpreting available data sets in light of the ‘promoting motions’ hypothesis and
others favoring modified transition state models that attribute trends observed to electrostatic
effects.4-6 The drive to find irrefutable evidence of a link between fast-timescale vibrational motions
and rates of H-transfer has lead researchers to explore a wide array of experimental approaches as
a means of perturbing the reaction coordinate and explicating theoretical models describing H-
transfer. These include pressure and temperature dependence KIE studies, computational modeling,
and mutagenesis.6-9
Many of the popular model systems for studying enzymatic H-tunneling have been scrutinized
through the mutagenesis of catalytically, or structurally pertinent residues and a subsequent
characterisation of variants. In one such study involving DHFR, the effects of altering hydrophobic
side chains located either directly within the folate-binding region, or 3-4 residues from it, were
explored.10 The nonadditivity of the effects of introducing mutations at either site (such as changes in
kobs) led to the conclusion that the dynamic networks must link the two sites, and later modeling of
the variant kinetics led to the identification of a network of small amplitude motions involved in
promoting hydride transfer.11 The systematic variation of hydrophobic side chain lengths, for residues
located distally to the active site of DHFR, lead to a progressive increase in the temperature
dependence of the KIE. The perturbation of kinetics correlated with the change in side chain bulk,
and is thought to have occured due to the introduction of broader range of DADs in the active sites of
the variants and a greater need for thermally activated motions to promote H-transfer.12 Mutagenesis
of hydrophobic residues within the active site of another popular model system, SLO, led to a slight
increase in the temperature dependence of the KIE. However, distal mutations showed a substantial
increase in the KIE temperature dependence. The differential behaviour of SLO variants was
rationalized by relative changes in the preorganisation energy required to reach the TRC and the
promoting motions required to facilitate H-transfer. With the more temperature dependent KIEs
associated with those variants that require more extensive DAD sampling.3 Interestingly, the
alteration of side chains far from the reaction site of Thymidylate Synthase (TS) is seen to have
similar, but lessened effects on the temperature dependence of the KIE.13 Although the increase in
the temperature dependence of the KIE was small, the variants displayed increased activation
enthalpies. This led the authors to infer that the changes were predominantly caused by the
disruption of a network of environmentally coupled concerted motions involved in bringing the donor
and acceptor together to facilitate H-transfer, and not due to changes in the donor acceptor distance.
In this study, X-ray crystal structures of the variant enzymes indicated that the mutations had no
significant effect on the overall structure of the enzyme. It is important when studying enzymatic
variants to also understand effects of the mutation on protein structure, and also substrate-binding
77
interactions, before any changes in kinetics can accurately be assigned to the chemical step. X-ray
crystallography is the most commonly employed technique for comparing the structures of variant
enzymes.12-14
The only study of KIE temperature dependence undertaken with variants of an OYE family enzyme
was performed on MR.15 Interestingly, the temperature dependence of the KIE was actually reduced
in the variant enzymes, despite the fact that spectroscopic measurements of CTC absorbance
indicated an apparent change in equilibrium population of DADs. Analysed in light of Marcus-like
models describing H-transfer, the differences in KIE kinetics were ascribed to changes in the force
constant of vibrational motions involved in facilitating H-transfer. There are a number of studies
published in which variants of another OYE homologue, PETNR, have been analysed.16,17,18
However, the focus of these studies were to elucidate mechanistic details, alter substrate specificity,
or modify the FMN redox potential. Never before has a study been performed in which PETNR
variants have been analyzed in order to probe the effects of hydrophobic side chain mutations on the
temperature dependence of the KIE and the observed rate of H-tunneling.
In the present study, the capability of PETNR to impart the conformational rearrangements required
to bring into closer proximity the hydride donor and acceptor atoms within a substrate bound
complex is investigated through mutagenesis and a subsequent structural and kinetic
characterization of the variants. Two nonpolar residues are selected as targets for mutagenesis, L25
and I107. The rationale for targeting these residues arises from NMR studies performed on PETNR-
NAD(P)H4 complexes (Figure 3.13). Upon binding of the coenzymes significant chemical shift
changes are localised to residues within a number of specific structural features, which implies their
local environment, or structures are effected by ligand binding. Two of these features, the T26 and
T104 loops, are positioned close to the active site, but on the cofactor and coenzyme sides,
respectively. We have identified L25 and I107 because they are within structures effected by
substrate mimic binding, positioned in line with the H-transfer coordinate and non-polar, hence,
therefore unlikely to effect electrostatic interactions within the active site (Figure 3.1). One residue
close to the FMN cofactor and one near to the coenzyme-binding site were chosen to avoid bias. In
addition, analysis of changes in relative line broadening for amide resonances for each complex can
provide insight into those regions undergoing dynamic transitions on the µs-ms timescale (Figure
3.14). Resonances in both the T26 and T104 loops show broadening behavior in the holoenzyme.
However, upon binding of the substrates a widespread freezing out of the µs-ms dynamics observed,
likely as a result of the more rigid nature of the enzyme-substrate complex. Interestingly, this is true
for resonances of the T104 loop, but not those corresponding with T26 loop. Comparing variants at
either position will therefore also provide a means of probing the relevance of these slower timescale
motions in terms of H-transfer kinetics.
The more rigid active site region observed when PETNR is in complex with coenzyme may be
necessary to provide a stable framework upon which the enzyme can exert conformational influence
on the cofactor and coenzyme so as to bring about a searching of D-A distances. Upon the mutation
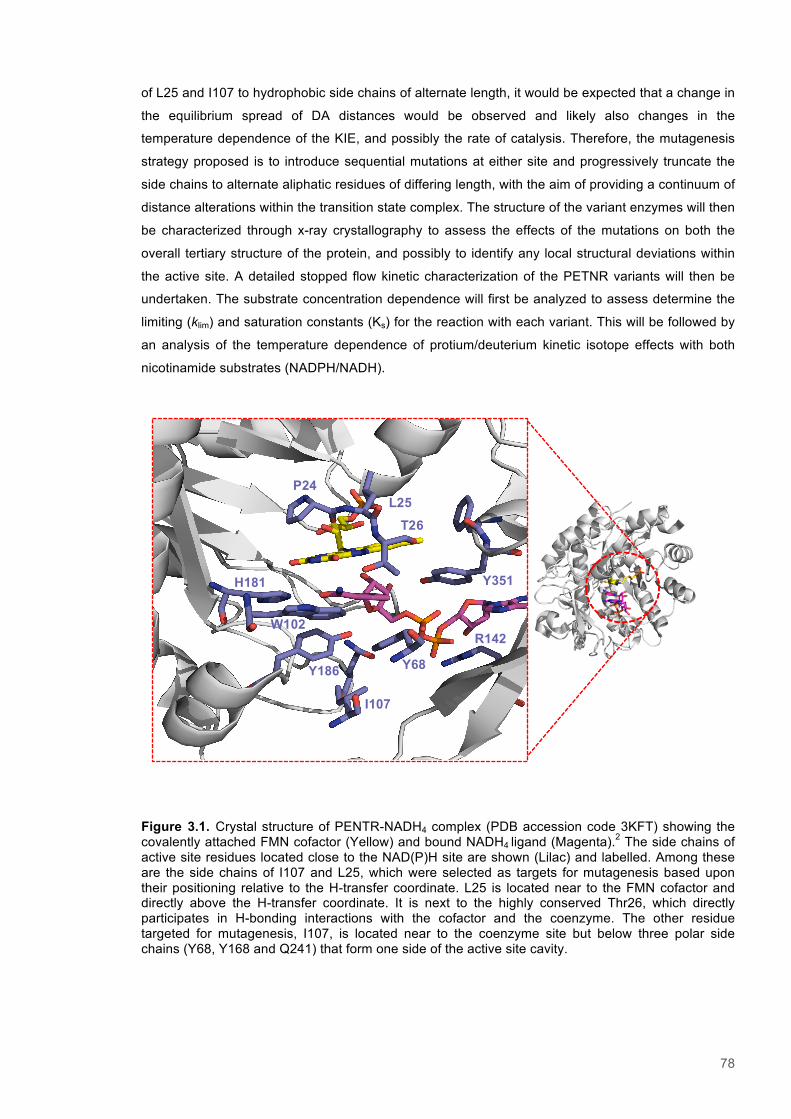
78
of L25 and I107 to hydrophobic side chains of alternate length, it would be expected that a change in
the equilibrium spread of DA distances would be observed and likely also changes in the
temperature dependence of the KIE, and possibly the rate of catalysis. Therefore, the mutagenesis
strategy proposed is to introduce sequential mutations at either site and progressively truncate the
side chains to alternate aliphatic residues of differing length, with the aim of providing a continuum of
distance alterations within the transition state complex. The structure of the variant enzymes will then
be characterized through x-ray crystallography to assess the effects of the mutations on both the
overall tertiary structure of the protein, and possibly to identify any local structural deviations within
the active site. A detailed stopped flow kinetic characterization of the PETNR variants will then be
undertaken. The substrate concentration dependence will first be analyzed to assess determine the
limiting (klim) and saturation constants (Ks) for the reaction with each variant. This will be followed by
an analysis of the temperature dependence of protium/deuterium kinetic isotope effects with both
nicotinamide substrates (NADPH/NADH).
Figure 3.1. Crystal structure of PENTR-NADH4 complex (PDB accession code 3KFT) showing the covalently attached FMN cofactor (Yellow) and bound NADH4 ligand (Magenta).2 The side chains of active site residues located close to the NAD(P)H site are shown (Lilac) and labelled. Among these are the side chains of I107 and L25, which were selected as targets for mutagenesis based upon their positioning relative to the H-transfer coordinate. L25 is located near to the FMN cofactor and directly above the H-transfer coordinate. It is next to the highly conserved Thr26, which directly participates in H-bonding interactions with the cofactor and the coenzyme. The other residue targeted for mutagenesis, I107, is located near to the coenzyme site but below three polar side chains (Y68, Y168 and Q241) that form one side of the active site cavity.
P24
T26 L25
I107
Y68 Y186
W102 R142
H181 Y351
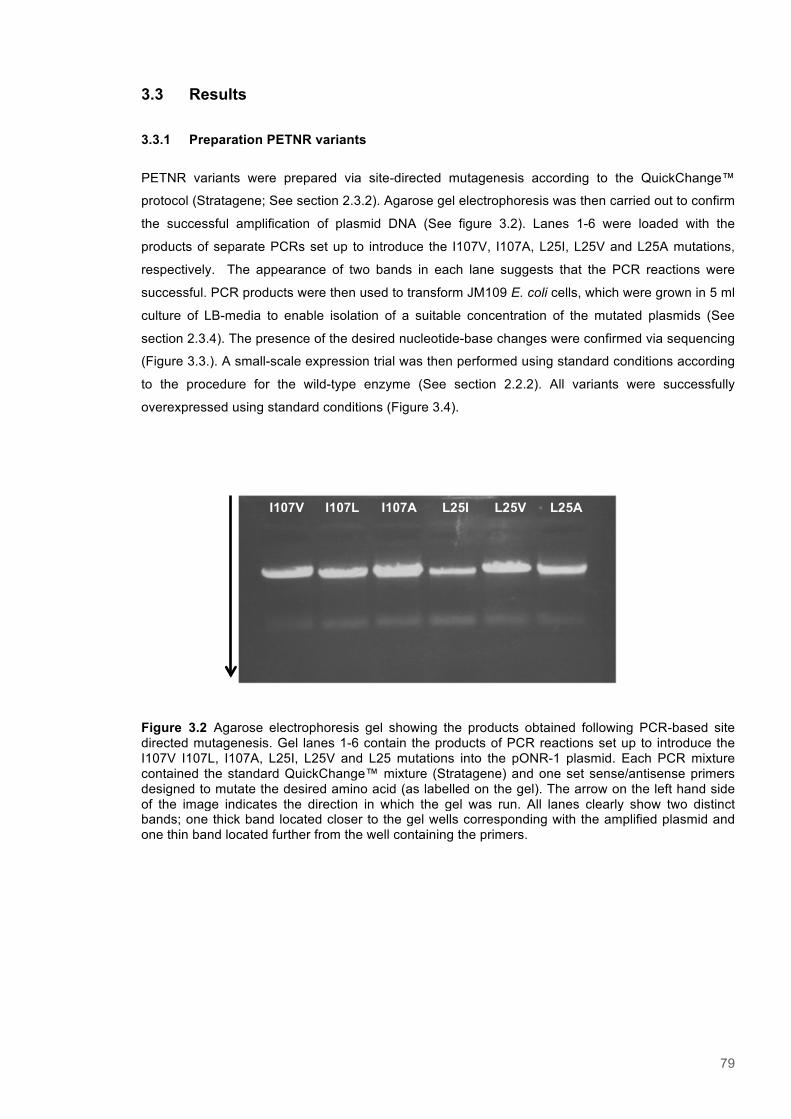
79
3.3 Results
3.3.1 Preparation PETNR variants
PETNR variants were prepared via site-directed mutagenesis according to the QuickChange™
protocol (Stratagene; See section 2.3.2). Agarose gel electrophoresis was then carried out to confirm
the successful amplification of plasmid DNA (See figure 3.2). Lanes 1-6 were loaded with the
products of separate PCRs set up to introduce the I107V, I107A, L25I, L25V and L25A mutations,
respectively. The appearance of two bands in each lane suggests that the PCR reactions were
successful. PCR products were then used to transform JM109 E. coli cells, which were grown in 5 ml
culture of LB-media to enable isolation of a suitable concentration of the mutated plasmids (See
section 2.3.4). The presence of the desired nucleotide-base changes were confirmed via sequencing
(Figure 3.3.). A small-scale expression trial was then performed using standard conditions according
to the procedure for the wild-type enzyme (See section 2.2.2). All variants were successfully
overexpressed using standard conditions (Figure 3.4).
Figure 3.2 Agarose electrophoresis gel showing the products obtained following PCR-based site directed mutagenesis. Gel lanes 1-6 contain the products of PCR reactions set up to introduce the I107V I107L, I107A, L25I, L25V and L25 mutations into the pONR-1 plasmid. Each PCR mixture contained the standard QuickChange™ mixture (Stratagene) and one set sense/antisense primers designed to mutate the desired amino acid (as labelled on the gel). The arrow on the left hand side of the image indicates the direction in which the gel was run. All lanes clearly show two distinct bands; one thick band located closer to the gel wells corresponding with the amplified plasmid and one thin band located further from the well containing the primers.
I107V I107L I107A L25I L25V L25A
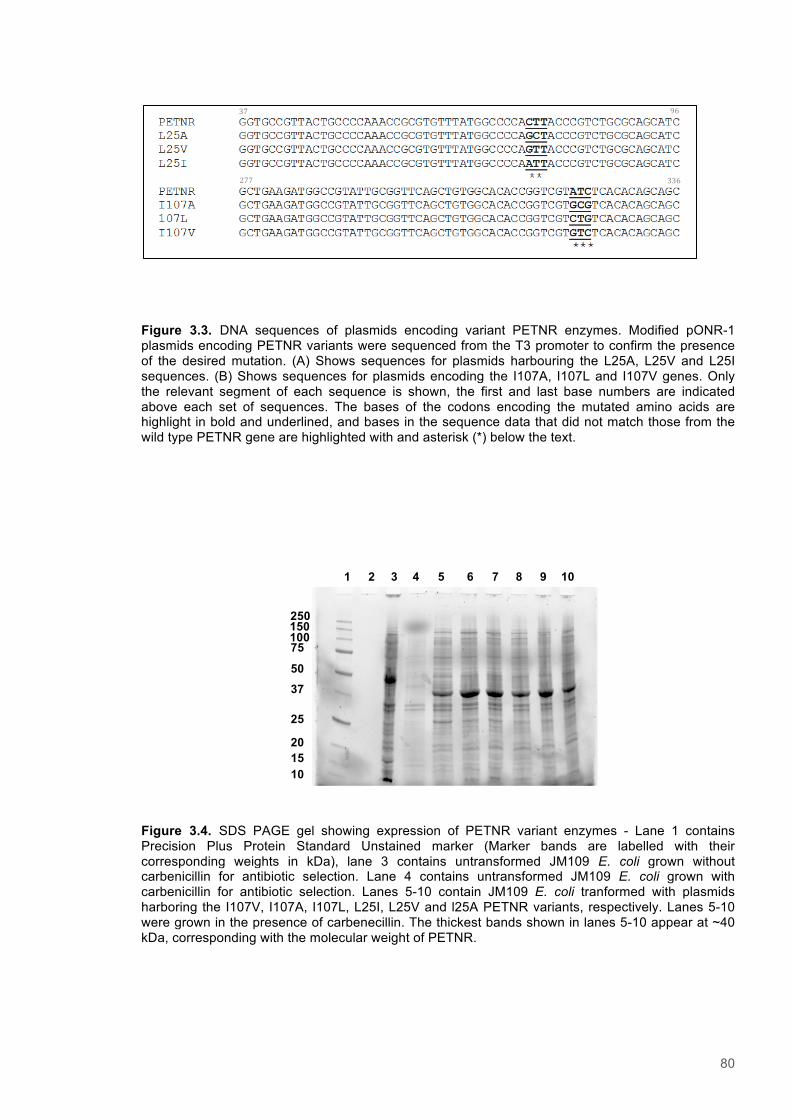
80
Figure 3.3. DNA sequences of plasmids encoding variant PETNR enzymes. Modified pONR-1 plasmids encoding PETNR variants were sequenced from the T3 promoter to confirm the presence of the desired mutation. (A) Shows sequences for plasmids harbouring the L25A, L25V and L25I sequences. (B) Shows sequences for plasmids encoding the I107A, I107L and I107V genes. Only the relevant segment of each sequence is shown, the first and last base numbers are indicated above each set of sequences. The bases of the codons encoding the mutated amino acids are highlight in bold and underlined, and bases in the sequence data that did not match those from the wild type PETNR gene are highlighted with and asterisk (*) below the text.
Figure 3.4. SDS PAGE gel showing expression of PETNR variant enzymes - Lane 1 contains Precision Plus Protein Standard Unstained marker (Marker bands are labelled with their corresponding weights in kDa), lane 3 contains untransformed JM109 E. coli grown without carbenicillin for antibiotic selection. Lane 4 contains untransformed JM109 E. coli grown with carbenicillin for antibiotic selection. Lanes 5-10 contain JM109 E. coli tranformed with plasmids harboring the I107V, I107A, I107L, L25I, L25V and l25A PETNR variants, respectively. Lanes 5-10 were grown in the presence of carbenecillin. The thickest bands shown in lanes 5-10 appear at ~40 kDa, corresponding with the molecular weight of PETNR.
37 96
336277
1 2 3 4 5 6 7 8 9 10
50
150 75
37
25
20 15 10
250 100
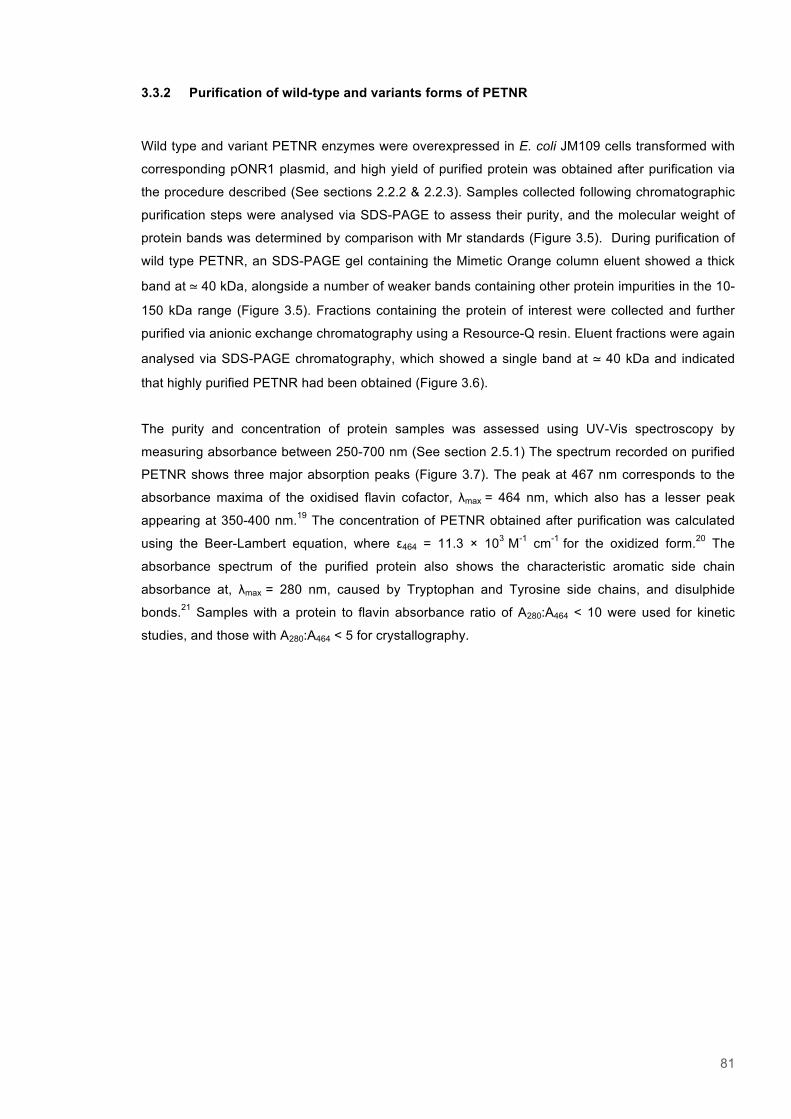
81
3.3.2 Purification of wild-type and variants forms of PETNR
Wild type and variant PETNR enzymes were overexpressed in E. coli JM109 cells transformed with
corresponding pONR1 plasmid, and high yield of purified protein was obtained after purification via
the procedure described (See sections 2.2.2 & 2.2.3). Samples collected following chromatographic
purification steps were analysed via SDS-PAGE to assess their purity, and the molecular weight of
protein bands was determined by comparison with Mr standards (Figure 3.5). During purification of
wild type PETNR, an SDS-PAGE gel containing the Mimetic Orange column eluent showed a thick
band at ≃ 40 kDa, alongside a number of weaker bands containing other protein impurities in the 10-
150 kDa range (Figure 3.5). Fractions containing the protein of interest were collected and further
purified via anionic exchange chromatography using a Resource-Q resin. Eluent fractions were again
analysed via SDS-PAGE chromatography, which showed a single band at ≃ 40 kDa and indicated
that highly purified PETNR had been obtained (Figure 3.6).
The purity and concentration of protein samples was assessed using UV-Vis spectroscopy by
measuring absorbance between 250-700 nm (See section 2.5.1) The spectrum recorded on purified
PETNR shows three major absorption peaks (Figure 3.7). The peak at 467 nm corresponds to the
absorbance maxima of the oxidised flavin cofactor, λmax = 464 nm, which also has a lesser peak
appearing at 350-400 nm.19 The concentration of PETNR obtained after purification was calculated
using the Beer-Lambert equation, where ε464 = 11.3 × 10³ M-1 cm-1 for the oxidized form.20 The
absorbance spectrum of the purified protein also shows the characteristic aromatic side chain
absorbance at, λmax = 280 nm, caused by Tryptophan and Tyrosine side chains, and disulphide
bonds.21 Samples with a protein to flavin absorbance ratio of A280:A464 < 10 were used for kinetic
studies, and those with A280:A464 < 5 for crystallography.
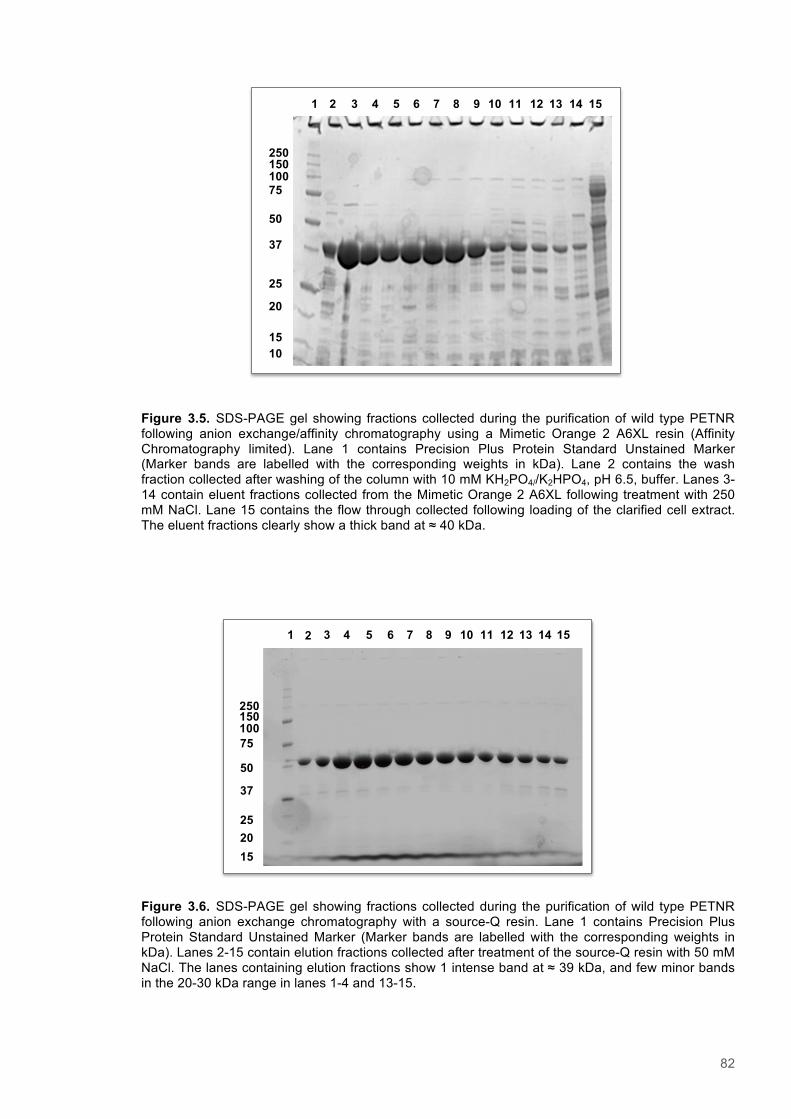
82
Figure 3.5. SDS-PAGE gel showing fractions collected during the purification of wild type PETNR following anion exchange/affinity chromatography using a Mimetic Orange 2 A6XL resin (Affinity Chromatography limited). Lane 1 contains Precision Plus Protein Standard Unstained Marker (Marker bands are labelled with the corresponding weights in kDa). Lane 2 contains the wash fraction collected after washing of the column with 10 mM KH2PO4//K2HPO4, pH 6.5, buffer. Lanes 3-14 contain eluent fractions collected from the Mimetic Orange 2 A6XL following treatment with 250 mM NaCl. Lane 15 contains the flow through collected following loading of the clarified cell extract. The eluent fractions clearly show a thick band at ≈ 40 kDa.
Figure 3.6. SDS-PAGE gel showing fractions collected during the purification of wild type PETNR following anion exchange chromatography with a source-Q resin. Lane 1 contains Precision Plus Protein Standard Unstained Marker (Marker bands are labelled with the corresponding weights in kDa). Lanes 2-15 contain elution fractions collected after treatment of the source-Q resin with 50 mM NaCl. The lanes containing elution fractions show 1 intense band at ≈ 39 kDa, and few minor bands in the 20-30 kDa range in lanes 1-4 and 13-15.
50
150
75
37
25 20 15
250
100
1 2 3 4 5 6 7 8 9 10 11 12 13 14 15
50
150
75
37
25
20
15 10
250
100
1 2 3 4 5 6 7 8 9 10 11 12 13 14 15
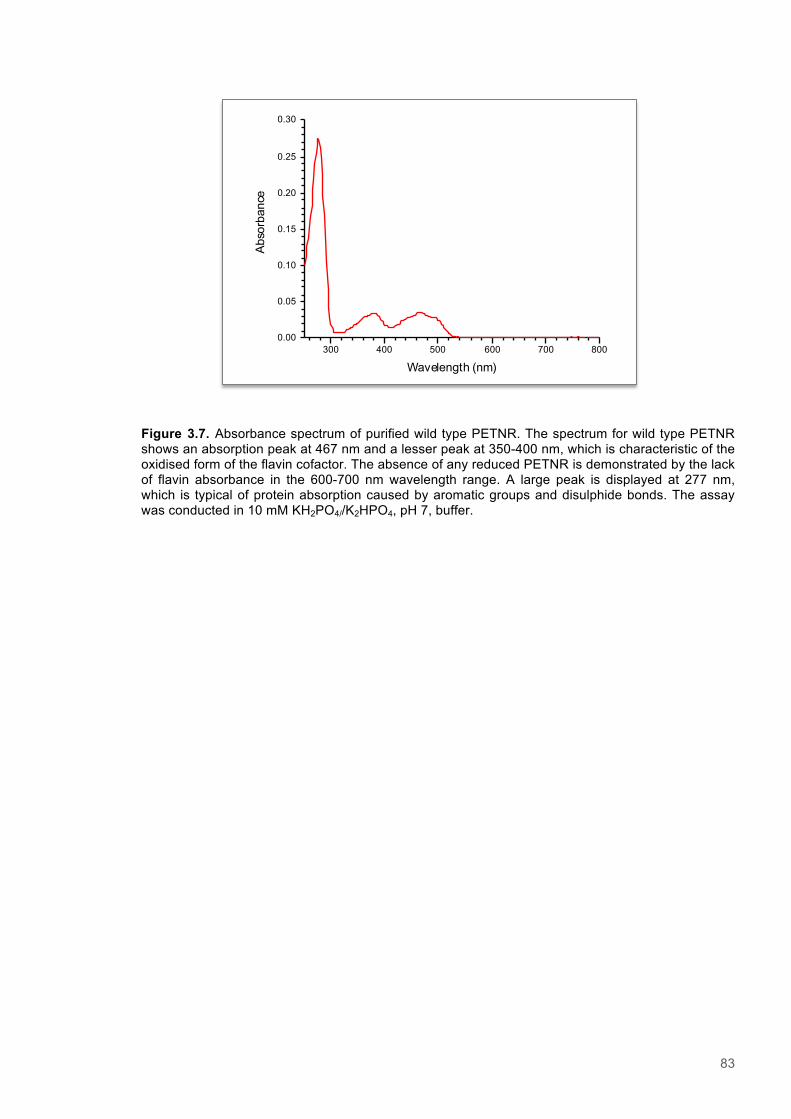
83
Figure 3.7. Absorbance spectrum of purified wild type PETNR. The spectrum for wild type PETNR shows an absorption peak at 467 nm and a lesser peak at 350-400 nm, which is characteristic of the oxidised form of the flavin cofactor. The absence of any reduced PETNR is demonstrated by the lack of flavin absorbance in the 600-700 nm wavelength range. A large peak is displayed at 277 nm, which is typical of protein absorption caused by aromatic groups and disulphide bonds. The assay was conducted in 10 mM KH2PO4//K2HPO4, pH 7, buffer.
300 400 500 600 700 8000.00
0.05
0.10
0.15
0.20
0.25
0.30
Abs
orba
nce
Wavelength (nm)
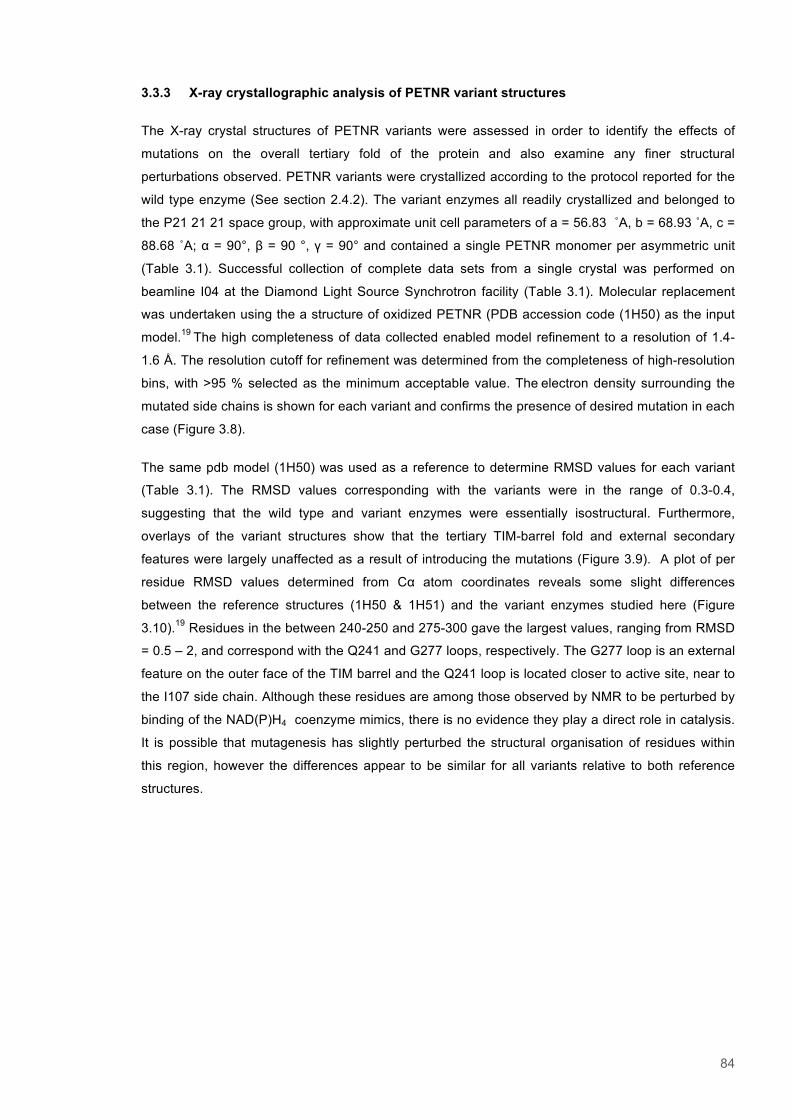
84
3.3.3 X-ray crystallographic analysis of PETNR variant structures
The X-ray crystal structures of PETNR variants were assessed in order to identify the effects of
mutations on the overall tertiary fold of the protein and also examine any finer structural
perturbations observed. PETNR variants were crystallized according to the protocol reported for the
wild type enzyme (See section 2.4.2). The variant enzymes all readily crystallized and belonged to
the P21 21 21 space group, with approximate unit cell parameters of a = 56.83 ˚A, b = 68.93 ˚A, c =
88.68 ˚A; α = 90°, β = 90 °, γ = 90° and contained a single PETNR monomer per asymmetric unit
(Table 3.1). Successful collection of complete data sets from a single crystal was performed on
beamline I04 at the Diamond Light Source Synchrotron facility (Table 3.1). Molecular replacement
was undertaken using the a structure of oxidized PETNR (PDB accession code (1H50) as the input
model.19 The high completeness of data collected enabled model refinement to a resolution of 1.4-
1.6 Å. The resolution cutoff for refinement was determined from the completeness of high-resolution
bins, with >95 % selected as the minimum acceptable value. The electron density surrounding the
mutated side chains is shown for each variant and confirms the presence of desired mutation in each
case (Figure 3.8).
The same pdb model (1H50) was used as a reference to determine RMSD values for each variant
(Table 3.1). The RMSD values corresponding with the variants were in the range of 0.3-0.4,
suggesting that the wild type and variant enzymes were essentially isostructural. Furthermore,
overlays of the variant structures show that the tertiary TIM-barrel fold and external secondary
features were largely unaffected as a result of introducing the mutations (Figure 3.9). A plot of per
residue RMSD values determined from Cα atom coordinates reveals some slight differences
between the reference structures (1H50 & 1H51) and the variant enzymes studied here (Figure
3.10).19 Residues in the between 240-250 and 275-300 gave the largest values, ranging from RMSD
= 0.5 – 2, and correspond with the Q241 and G277 loops, respectively. The G277 loop is an external
feature on the outer face of the TIM barrel and the Q241 loop is located closer to active site, near to
the I107 side chain. Although these residues are among those observed by NMR to be perturbed by
binding of the NAD(P)H4 coenzyme mimics, there is no evidence they play a direct role in catalysis.
It is possible that mutagenesis has slightly perturbed the structural organisation of residues within
this region, however the differences appear to be similar for all variants relative to both reference
structures.
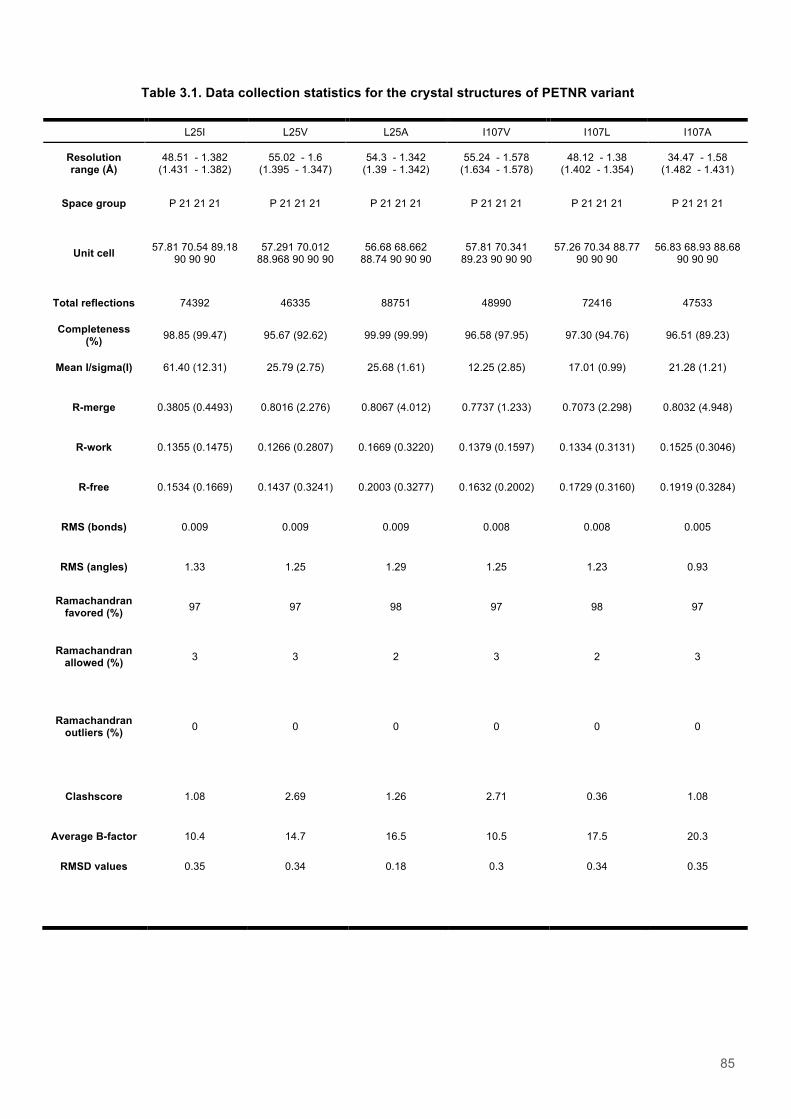
85
Table 3.1. Data collection statistics for the crystal structures of PETNR variant
L25I L25V L25A I107V I107L I107A
Resolution range (Å)
48.51 - 1.382 (1.431 - 1.382)
55.02 - 1.6 (1.395 - 1.347)
54.3 - 1.342 (1.39 - 1.342)
55.24 - 1.578 (1.634 - 1.578)
48.12 - 1.38 (1.402 - 1.354)
34.47 - 1.58 (1.482 - 1.431)
Space group P 21 21 21 P 21 21 21 P 21 21 21 P 21 21 21 P 21 21 21 P 21 21 21
Unit cell 57.81 70.54 89.18 90 90 90
57.291 70.012 88.968 90 90 90
56.68 68.662 88.74 90 90 90
57.81 70.341 89.23 90 90 90
57.26 70.34 88.77 90 90 90
56.83 68.93 88.68 90 90 90
Total reflections 74392 46335 88751 48990 72416 47533
Completeness (%) 98.85 (99.47) 95.67 (92.62) 99.99 (99.99) 96.58 (97.95) 97.30 (94.76) 96.51 (89.23)
Mean I/sigma(I) 61.40 (12.31) 25.79 (2.75) 25.68 (1.61) 12.25 (2.85) 17.01 (0.99) 21.28 (1.21)
R-merge 0.3805 (0.4493) 0.8016 (2.276) 0.8067 (4.012) 0.7737 (1.233) 0.7073 (2.298) 0.8032 (4.948)
R-work 0.1355 (0.1475) 0.1266 (0.2807) 0.1669 (0.3220) 0.1379 (0.1597) 0.1334 (0.3131) 0.1525 (0.3046)
R-free 0.1534 (0.1669) 0.1437 (0.3241) 0.2003 (0.3277) 0.1632 (0.2002) 0.1729 (0.3160) 0.1919 (0.3284)
RMS (bonds) 0.009 0.009 0.009 0.008 0.008 0.005
RMS (angles) 1.33 1.25 1.29 1.25 1.23 0.93
Ramachandran favored (%) 97 97 98 97 98 97
Ramachandran allowed (%) 3 3 2 3 2 3
Ramachandran outliers (%) 0 0 0 0 0 0
Clashscore 1.08 2.69 1.26 2.71 0.36 1.08
Average B-factor 10.4 14.7 16.5 10.5 17.5 20.3
RMSD values 0.35 0.34 0.18 0.3 0.34 0.35
86
Figure 3.8. Mutated residues and encompassing electron density for X-ray crystal structures of variant forms of PETNR. The variant side chains of (A) L25A (B) L25I (C) L25V (D) I107A (E) I107L and (F) I107V are shown as ball and stick diagrams within the encompassing Fo-Fc electron density map (Green). Maps were calculated with the occupancy of the mutated residue set to zero avoid biased interpretation of electron density. Atoms are color coded; Carbon (Magenta), Hydrogen (Gray), Oxygen (Red) and Nitrogen (Blue).
(A) (B) (C)
(A) (E) (F)
L25V L25I L25A
I107V I107L I107A
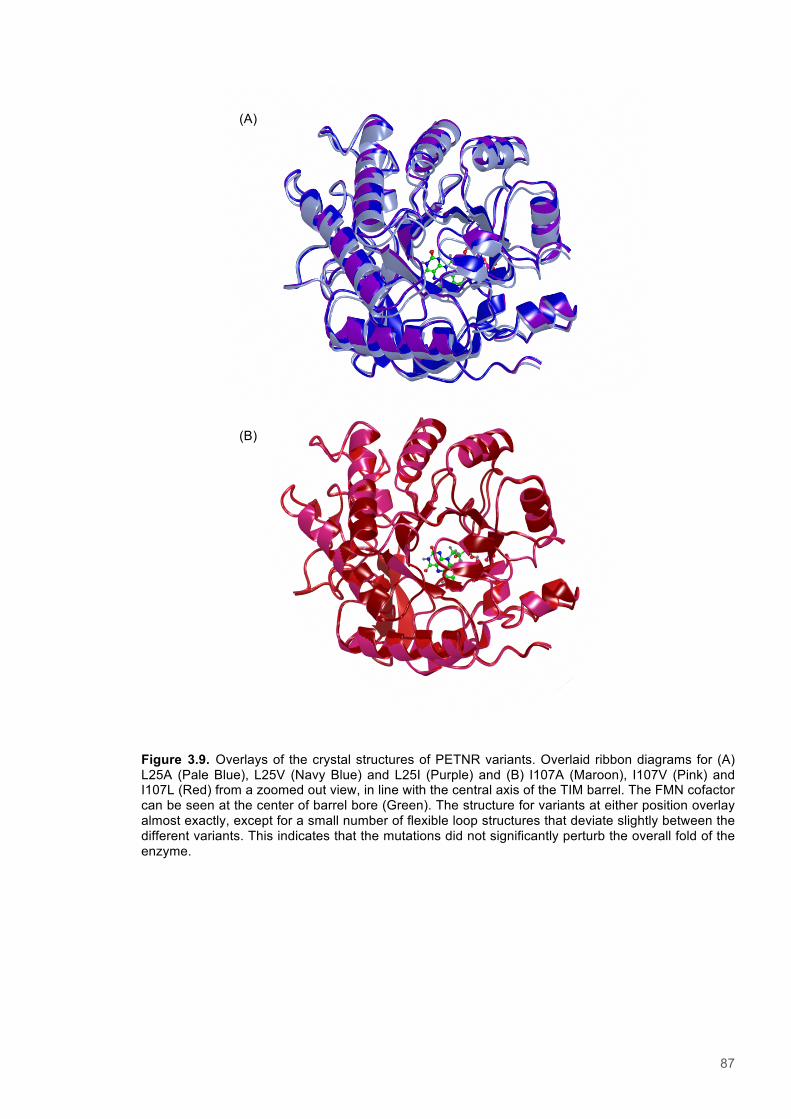
87
Figure 3.9. Overlays of the crystal structures of PETNR variants. Overlaid ribbon diagrams for (A) L25A (Pale Blue), L25V (Navy Blue) and L25I (Purple) and (B) I107A (Maroon), I107V (Pink) and I107L (Red) from a zoomed out view, in line with the central axis of the TIM barrel. The FMN cofactor can be seen at the center of barrel bore (Green). The structure for variants at either position overlay almost exactly, except for a small number of flexible loop structures that deviate slightly between the different variants. This indicates that the mutations did not significantly perturb the overall fold of the enzyme.
(A)
(B)
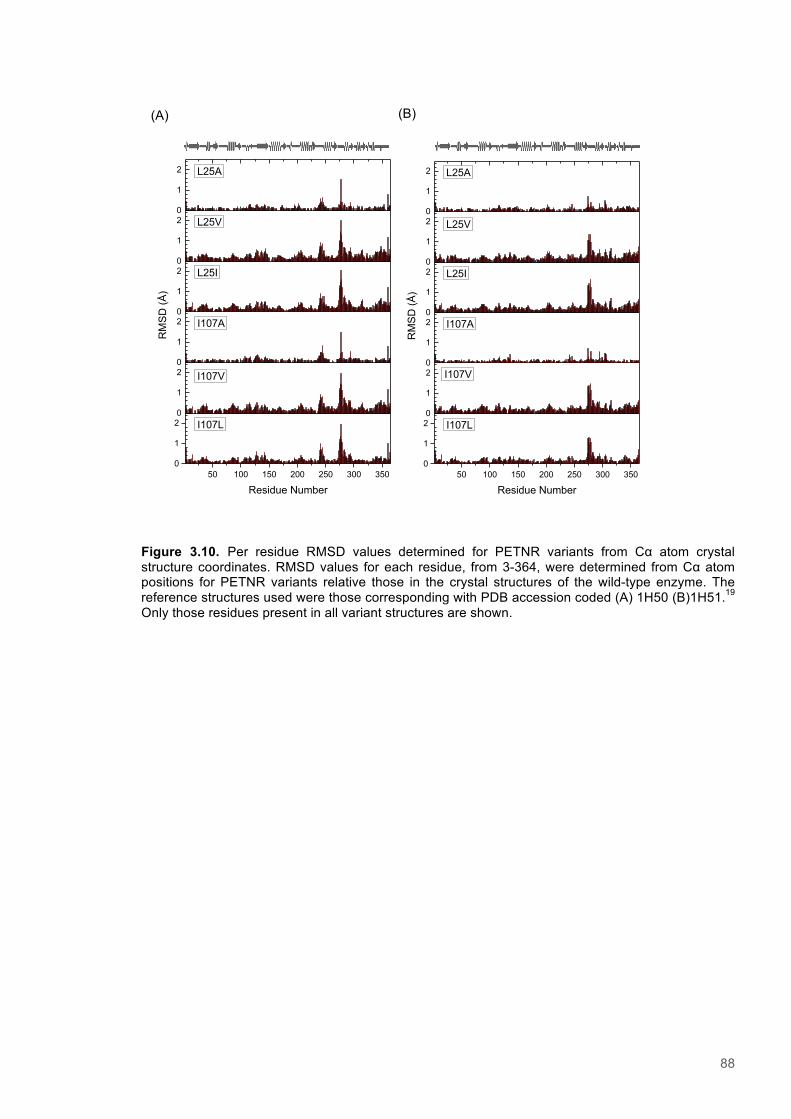
88
Figure 3.10. Per residue RMSD values determined for PETNR variants from Cα atom crystal structure coordinates. RMSD values for each residue, from 3-364, were determined from Cα atom positions for PETNR variants relative those in the crystal structures of the wild-type enzyme. The reference structures used were those corresponding with PDB accession coded (A) 1H50 (B)1H51.19 Only those residues present in all variant structures are shown.
0
1
2
0
1
2
0
1
2
0
1
2
0
1
2
50 100 150 200 250 300 3500
1
2
L25A
L25V
L25I
I107V
I107A
RM
SD
(Å)
Residue Number
I107L
0
1
2
0
1
2
0
1
2
0
1
2
0
1
2
50 100 150 200 250 300 3500
1
2
L25A
L25V
L25I
I107A
I107V
RM
SD
(Å)
Residue Number
I107L
(A) (B)
89
3.3.4 Concentration dependence of FMN reduction with NADPH/NADH in wild type and
variant forms of PETNR
The concentration dependence of FMN reduction with NADPH and NADH was investigated for wild
type PETNR and site directed mutants via stopped flow spectroscopy (Figures 3.15 & 3.16). Kinetic
transients recorded with both coenzymes showed a loss of absorbance at 465 nm, which is
characteristic of flavin reduction. The absorbance transients fit most accurately to a single
exponential function, indicating the reaction is monophasic. Fitting observed rates (kobs) versus
coenzyme concentration enable determination of limiting rates of reduction (klim) and saturation
constants (Ks) for each variant.
The majority of PETNR variants studied exhibited a slower rate of FMN reduction with NADH than
was observed with the wild type enzyme (kfor = 2.20 ± 0.1 s-1; Table 3.2). Enzyme variants at the L25
position showed the greatest variation in observed rates. The slowest observed was for L25V (kfor =
1.36 ± 0.01 s-1), followed by L25I (kfor = 1.79 ± 0.06 s-1), whereas the rate for the L25A variant was
similar within error margins to that determined for the wild type. The I107 variants exhibited rates of
FMN reduction with NADH that were more closely comparable (kfor = 1.71 ± 0.02 to 2.01 ± 0.02 s-1)
and all slower than the wild type. Introduction of mutations resulted in Ks values that were reduced by
up to 50 % compared that determined for the wild type, except for I107V that displayed by far the
lowest value (Ks = 305.89 ± 30.56 µM).
With the phosphorylated form of the coenzyme, NADPH, the slowest rates of reduction were
observed with L25A (kfor = 27.08 ± 1.13 s-1) and I107A (kfor = 18.65 ± 0.35 s-1), whereas the greatest
was for L25V (kfor = 37.05 ± 1.19 s-1). The remainder of the mutations resulted in rates of reduction
with NADPH that were approximately similar to that observed with the wild type enzyme (kfor = 31.50
± 1.13 s-1; Table 3.2). The saturation constant with NADPH was not significantly effected by
introducing mutations at the I107 position, and Ks values for variants at this position were similar
within error margins to the wild type (Ks = 92.11 ± 14.33 µM). The L25 variants, however, all
exhibited Ks values that were greater than those observed for the wild type. The largest values were
observed with L25A (Ks = 196.55 ± 26.26 µM) and L25I (Ks = 120.74 ± 13.94 µM).
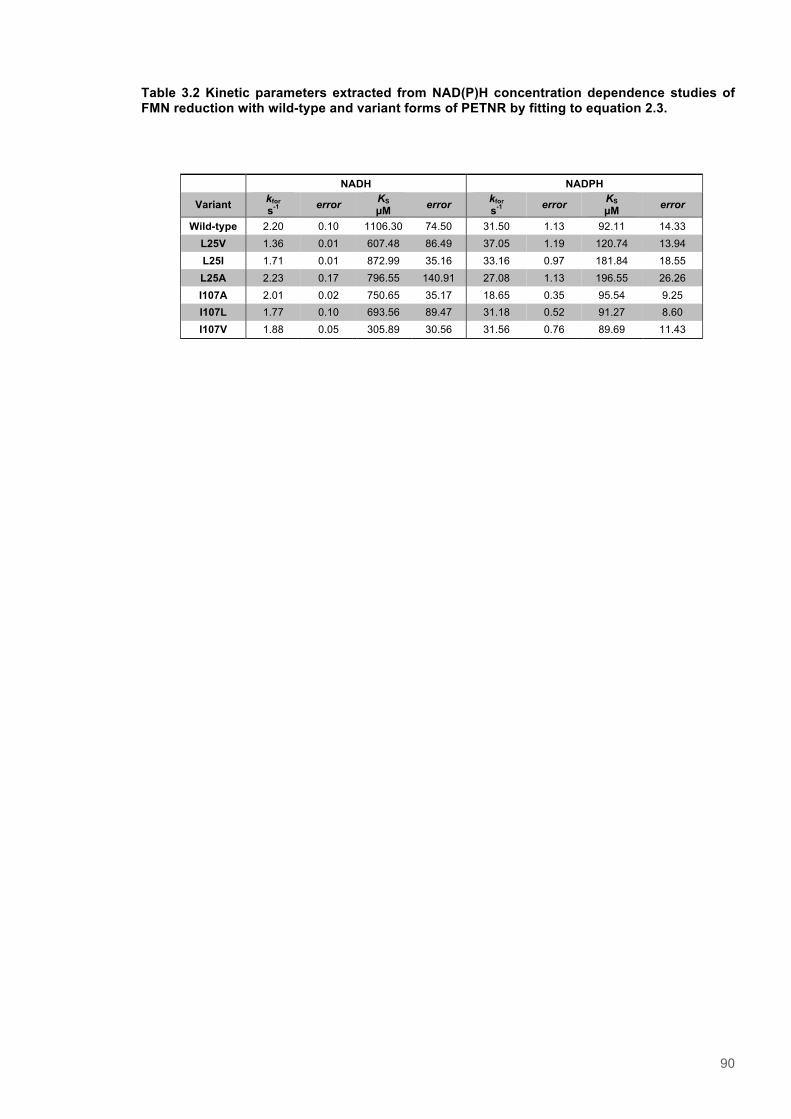
90
Table 3.2 Kinetic parameters extracted from NAD(P)H concentration dependence studies of FMN reduction with wild-type and variant forms of PETNR by fitting to equation 2.3.
NADH NADPH
Variant kfor s-1 error KS
µM error kfor s-1 error KS
µM error
Wild-type 2.20 0.10 1106.30 74.50 31.50 1.13 92.11 14.33 L25V 1.36 0.01 607.48 86.49 37.05 1.19 120.74 13.94 L25I 1.71 0.01 872.99 35.16 33.16 0.97 181.84 18.55 L25A 2.23 0.17 796.55 140.91 27.08 1.13 196.55 26.26 I107A 2.01 0.02 750.65 35.17 18.65 0.35 95.54 9.25 I107L 1.77 0.10 693.56 89.47 31.18 0.52 91.27 8.60 I107V 1.88 0.05 305.89 30.56 31.56 0.76 89.69 11.43
91
3.3.5 Analysis of the temperature dependence of Kinetic Isotope Effects observed for wild-
type and variants forms of PETNR with NAD(P)H
The temperature dependence of KIEs observed for FMN reduction in PETNR variants with NADPH
and NADH, and their deuterated counterparts, was investigating using stopped flow spectroscopy
(Figures 3.17 & 3.18) Deuterated nicotinamide coenzymes, NADH ((R)-[4-2H]-NADH) and NADPH
((R)-[4-2H]-NADPH), were synthesized as described and the products confirmed via NMR
spectroscopy (See section 2.6; Figures 3.21 & 3.22). By recording absorption changes at 464 nm
and fitting kinetic transients to single exponential expression, the observed rates (kobs) for reactions
involving PETNR variants over a temperature range from 5–40 °C was obtained. Coenzyme
concentrations of 5 mM for NADPH/D, and 25 mM for NADH/D were chosen to ensure experiments
were recorded under saturating conditions. The observed rates (kobs) of reduction for the majority of
variants with NADH/D generally increased with increasing temperature up until 40 °C (Figure 3.17). However, with NADPH/D the observed rates (kobs) rates increased up until 35 °C and then decreased
slightly at 40 °C (Figures 3.18). Subsequent fitting of the temperature dependent data to the Eyring
equation highlighted the apparent unsuitability of this model to accurately describe it, due to the
apparent curvature in Ln(k) vs T plot (Equation 3.1). The standard criteria used to judge to accuracy
of the fits and select the model best suited to describe the data included: autocorrelation functions
values, residuals and the R2 value (statistical goodness-of-fit parameter). Heat capacity is a
thermodynamic parameter that describes the temperature dependence of the entropy and enthalpy
(Equation 3.2). Incorporation of heat capacity, or equation 3.2, into the equation 3.1 equation yields a
modified non-linear form of the Eyring equation (Equation 3.3). Due to the apparent unsuitability of
equation 3.1 to describe the temperature dependent data recorded here, the modified non-linear
form of the Eyring equation was used to analyze the data (Equations 3.3 & 3.4).22,23
! = !!!ℎ !!
∆!‡!"
(Equation 3.1)
∆!‡ = [∆!!!‡ + ∆!!‡ ! − !! ]
(Equation 3.2)
ln!!"# = ln !!!ℎ − (∆!!!! + ∆!!! ! − !! )/!" + (∆!!!! + ∆!!! ln! − ln!! )/!
(Equation 3.3)
ΔG!!! = Δ!!!! − !! Δ!!!! (Equation 3.4)
Where ΔHT0, ΔST0 and ΔCp are the difference in enthalpy, entropy and heat capacity between the
ground state and the transition state, respectively, at T0. kB, h and R are the Boltzmann, Planck and
ideal gas constants and the reference temperature T0 is 298 K. This equation incorporates a term for
92
the heat capacity of the system into the Eyring equation, ΔCp‡, which essentially describes the
temperature dependence of the enthalpy (H) and entropy (S) change between the ground and
transition states. It is proposed that a difference in heat capacity between a loosely bound enzyme-
substrate complex and more rigid enzyme-transition state leads to a negative value of ΔCp‡ for an
enzyme catalyzed reaction. The thermodynamic activation parameters presented in this section were
obtained from fits of the temperature dependent data to the modified non-linear form of the Eyring
equation. It is also important to note that the rates observed with the I107A PETNR variant seemed
to decrease significantly above 35 °C with NADH/D, and 30 °C with NADPH/D (Figure 3.17, panel 2
& Figure 3.18, panel 2), and the associated KIEs also appeared to significantly diverge from the
expected trend with regard to temperature (Figure 3.19, panel 2 & Figure 3.20, panel 2). These
points are therefore not included in fits of the temperature dependent data, but are included in the
plots and highlighted.
Variations in side chain length at the L25 and I107 positions resulted in modest changes in rates
observed at 25 °C with either set of nicotinamide coenzymes (Tables 3.3 & 3.4). The fastest rate
observed with NADH was for the wild-type enzyme (kobs = 2.02 ± 0.07 s-1). The slowest reacting of
the variants, L25I, showed a 42 % slower rate of reduction with NADH. There appears to be no
correlation between the extent of the change in rates with NADH and either the change in side chain
bulk, or effect of introducing mutations at either position. Furthermore, the rates of reduction
observed with NADPH varied by < 40 % either side of the value determined for the wild type enzyme
(kobs = 34.42 ± 0.41 s-1). The quickest rate with NADPH was that observed with the L25A (kobs
=
46.03 ± 0.72 s-1), and the slowest was with I107A (kobs = 20.79 ± 0.28 s-1). Generally those enzymes
variant at the I107 position reacted slower with NADPH than the L25 variants.
Analysis of the relationship between the enthalpies and entropies of activation for the PETNR
variants reveals a clear correlation for parameters obtained with both sets of substrates (Figure
3.11). This implies that the effect of introducing mutations at either position is counteracted through
an entropy-enthalpy compensation effect, which results in the similar rates of reduction observed for
the variants compared to the wild type. Interestingly, the wild type enzyme consistently appears at
one extreme, and corresponds with one of the largest ΔH and lowest ΔS values of all the enzyme
forms studied, with both NADH and NADPH. There also appears to be some correlation between the
perturbation of thermodynamic activation parameters and the extent of side chain truncation. The
alanine mutants at both positions, which represent the greatest change in side chain bulk, show the
lowest activation entropy and highest activation enthalpy with both NADH and NADPH.
The ΔC‡p values observed with wild type and variant forms of PETNR with NADH were generally
small in magnitude (from ΔCp‡ = 0.38 ± 0.12 J mol-1 K-1 for wild type to ΔCp
‡ = -1.77 ± 0.44 J mol-1 K-1
for I107A; Tables 3.3 & 3.4). However, with NADPH -ΔCp‡ values calculated were greater for every
variant studied (from ΔCp‡ = -0.89 ± 0.12 J mol-1 K-1 for wild type to ΔCp
‡ = -2.45 ± 0.28 J mol-1 K-1 for
I107A). Furthermore, with both NADH/D and NADPH/D there was a greater change in heat capacity
observed with all variants relative to the wild type. In addition, the apparent heat capacity change
93
(ΔCp‡) also correlates strongly with the entropies and enthalpies of activation determined with
NADPH/D and to a lesser extent for those determined with NADH/D (Figure 3.12).
The temperature dependence of the KIEs observed with PETNR variants and NAD(P)H/D substrates
was calculated from Eyring fits of temperature dependent KIE data (Table 3.5). The temperature
dependence of KIEs observed with PETNR variants and NADH/D varied by approximately 30 %
either side of the value for the wild-type enzyme (ΔΔH‡ = 4.41 ± 0.14 kJ mol-1). The smallest value
obtained with NADH/D was that for L25A (ΔΔH‡ = 3.27 ± 0.12 kJ mol-1) and the largest value was
observed with I107L (ΔΔH‡ = 5.70 ± 0.23 kJ mol-1). The temperature dependence of the KIEs
observed with NADPH/D showed greater variation. The most temperature dependent variant was
L25A (ΔΔH‡ = 5.62 ± 0.27 kJ mol-1), and the least temperature dependent was I107A (ΔΔH‡ = 2.86 ±
0.35 kJ mol-1). There is no unifying trend observed between the change in side chain bulk and the
change in KIE temperature dependences observed for mutants at both sites with either NADH/D, or
NADPH/D. However, the loss of side chain bulk at the I107 position seemed to cause a significant
drop in the temperature dependence for the KIE observed with NADPH/D of the KIE, as indicated by
I107A (ΔΔH‡ = 2.86 ± 0.35 kJ mol-1) and I107V (ΔΔH‡ = 3.22 ± 0.12 kJ mol-1).
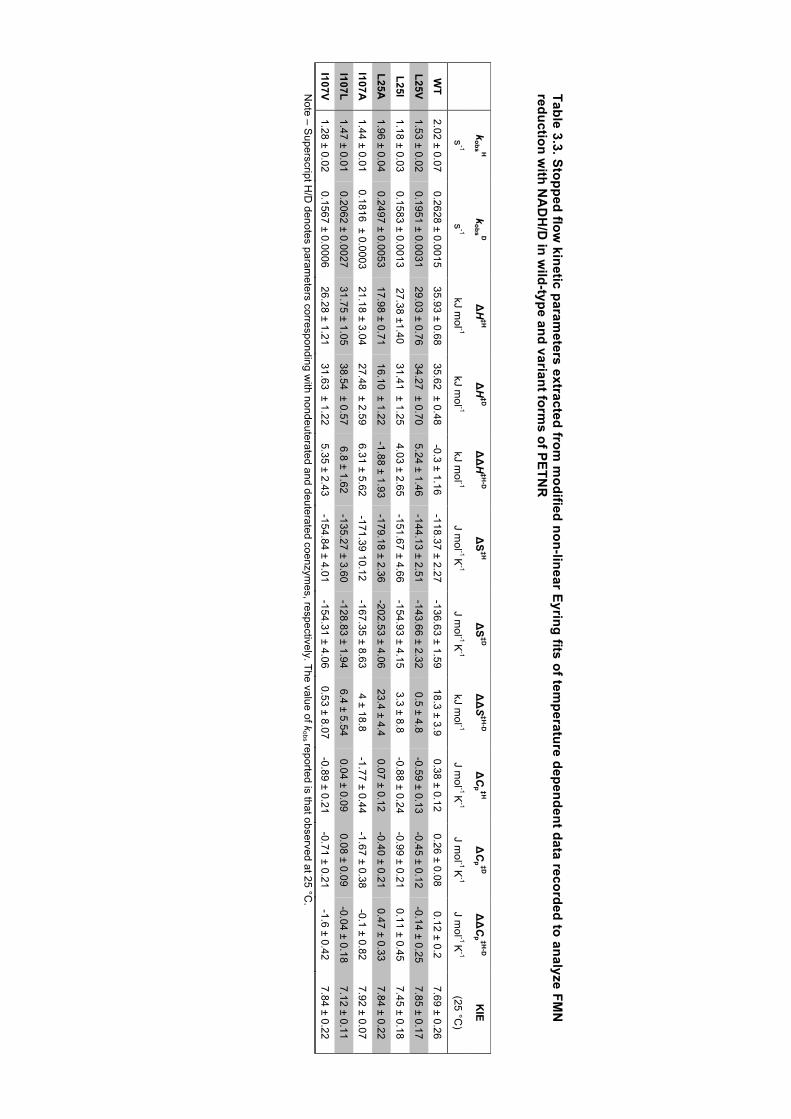
Table 3.3. Stopped flow
kinetic parameters extracted from
modified non-linear E
yring fits of temperature dependent data recorded to analyze FM
N
reduction with N
AD
H/D
in wild-type and variant form
s of PE
TNR
N
ote – Superscript H
/D denotes param
eters corresponding with nondeuterated and deuterated coenzym
es, respectively. The value of kobs reported is that observed at 25 °C
.
kobs H
kobs D
ΔH
‡H Δ
H‡D
ΔΔ
H‡H
-D Δ
S‡H
ΔS
‡D ΔΔ
S‡H
-D Δ
Cp ‡H
ΔC
p ‡D ΔΔ
Cp ‡H
-D K
IE
s-1
s-1
kJ mol -1
kJ mol -1
kJ mol -1
J mol -1 K
-1 J m
ol -1 K-1
kJ mol -1
J mol -1 K
-1 J m
ol -1 K-1
J mol -1 K
-1 (25 °C
)
WT
2.02 ± 0.07 0.2628 ± 0.0015
35.93 ± 0.68 35.62 ± 0.48
-0.3 ± 1.16 -118.37 ± 2.27
-136.63 ± 1.59 18.3 ± 3.9
0.38 ± 0.12 0.26 ± 0.08
0.12 ± 0.2 7.69 ± 0.26
L25V
1.53 ± 0.02 0.1951 ± 0.0031
29.03 ± 0.76 34.27 ± 0.70
5.24 ± 1.46 -144.13 ± 2.51
-143.66 ± 2.32 0.5 ± 4.8
-0.59 ± 0.13 -0.45 ± 0.12
-0.14 ± 0.25 7.85 ± 0.17
L25I 1.18 ± 0.03
0.1583 ± 0.0013 27.38 ±1.40
31.41 ± 1.25 4.03 ± 2.65
-151.67 ± 4.66 -154.93 ± 4.15
3.3 ± 8.8 -0.88 ± 0.24
-0.99 ± 0.21 0.11 ± 0.45
7.45 ± 0.18
L25A
1.96 ± 0.04 0.2497 ± 0.0053
17.98 ± 0.71 16.10 ± 1.22
-1.88 ± 1.93 -179.18 ± 2.36
-202.53 ± 4.06 23.4 ± 4.4
0.07 ± 0.12 -0.40 ± 0.21
0.47 ± 0.33 7.84 ± 0.22
I107A
1.44 ± 0.01 0.1816 ± 0.0003
21.18 ± 3.04 27.48 ± 2.59
6.31 ± 5.62 -171.39 10.12
-167.35 ± 8.63 4 ± 18.8
-1.77 ± 0.44 -1.67 ± 0.38
-0.1 ± 0.82 7.92 ± 0.07
I107L 1.47 ± 0.01
0.2062 ± 0.0027 31.75 ± 1.05
38.54 ± 0.57 6.8 ± 1.62
-135.27 ± 3.60 -128.83 ± 1.94
6.4 ± 5.54 0.04 ± 0.09
0.08 ± 0.09 -0.04 ± 0.18
7.12 ± 0.11
I107V
1.28 ± 0.02 0.1567 ± 0.0006
26.28 ± 1.21 31.63 ± 1.22
5.35 ± 2.43 -154.84 ± 4.01
-154.31 ± 4.06 0.53 ± 8.07
-0.89 ± 0.21 -0.71 ± 0.21
-1.6 ± 0.42 7.84 ± 0.22
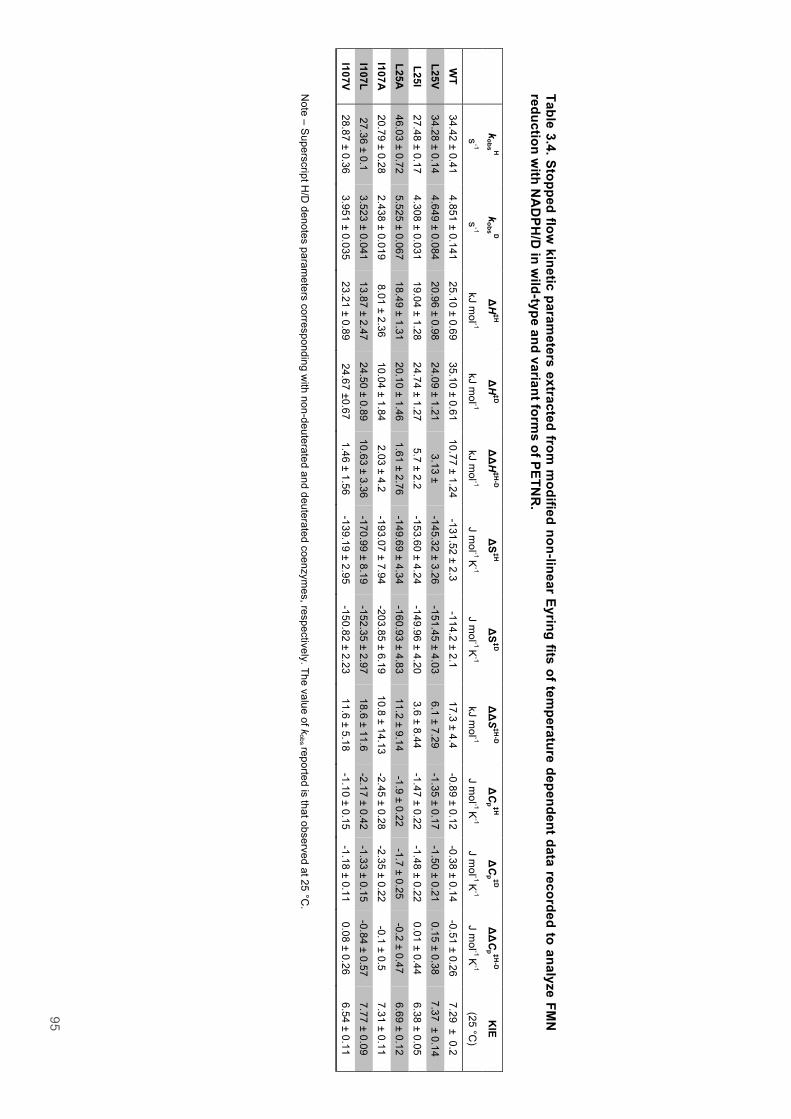
95
Table 3.4. Stopped flow
kinetic parameters extracted from
modified non-linear E
yring fits of temperature dependent data recorded to analyze FM
N
reduction with N
AD
PH
/D in w
ild-type and variant forms of P
ETN
R.
N
ote – Superscript H
/D denotes param
eters corresponding with non-deuterated and deuterated coenzym
es, respectively. The value of kobs reported is that observed at 25 °C
.
k
obs H k
obs D Δ
H‡H
ΔH
‡D ΔΔ
H‡H
-D Δ
S‡H
ΔS
‡D ΔΔ
S‡H
-D Δ
Cp ‡H
ΔC
p ‡D ΔΔ
Cp ‡H
-D K
IE
s-1
s-1
kJ mol -1
kJ mol -1
kJ mol -1
J mol -1 K
-1 J m
ol -1 K-1
kJ mol -1
J mol -1 K
-1 J m
ol -1 K-1
J mol -1 K
-1 (25 °C
)
WT
34.42 ± 0.41 4.851 ± 0.141
25.10 ± 0.69 35.10 ± 0.61
10.77 ± 1.24 -131.52 ± 2.3
-114.2 ± 2.1 17.3 ± 4.4
-0.89 ± 0.12 -0.38 ± 0.14
-0.51 ± 0.26 7.29 ± 0.2
L25V
34.28 ± 0.14 4.649 ± 0.084
20.96 ± 0.98 24.09 ± 1.21
3.13 ± -145.32 ± 3.26
-151.45 ± 4.03 6.1 ± 7.29
-1.35 ± 0.17 -1.50 ± 0.21
0.15 ± 0.38 7.37 ± 0.14
L25I 27.48 ± 0.17
4.308 ± 0.031 19.04 ± 1.28
24.74 ± 1.27 5.7 ± 2.2
-153.60 ± 4.24 -149.96 ± 4.20
3.6 ± 8.44 -1.47 ± 0.22
-1.48 ± 0.22 0.01 ± 0.44
6.38 ± 0.05
L25A
46.03 ± 0.72 5.525 ± 0.067
18.49 ± 1.31 20.10 ± 1.46
1.61 ± 2.76 -149.69 ± 4.34
-160.93 ± 4.83 11.2 ± 9.14
-1.9 ± 0.22 -1.7 ± 0.25
-0.2 ± 0.47 6.69 ± 0.12
I107A
20.79 ± 0.28 2.438 ± 0.019
8.01 ± 2.36 10.04 ± 1.84
2.03 ± 4.2 -193.07 ± 7.94
-203.85 ± 6.19 10.8 ± 14.13
-2.45 ± 0.28 -2.35 ± 0.22
-0.1 ± 0.5 7.31 ± 0.11
I107L 27.36 ± 0.1
3.523 ± 0.041 13.87 ± 2.47
24.50 ± 0.89 10.63 ± 3.36
-170.99 ± 8.19 -152.35 ± 2.97
18.6 ± 11.6 -2.17 ± 0.42
-1.33 ± 0.15 -0.84 ± 0.57
7.77 ± 0.09
I107V
28.87 ± 0.36 3.951 ± 0.035
23.21 ± 0.89 24.67 ±0.67
1.46 ± 1.56 -139.19 ± 2.95
-150.82 ± 2.23 11.6 ± 5.18
-1.10 ± 0.15 -1.18 ± 0.11
0.08 ± 0.26 6.54 ± 0.11
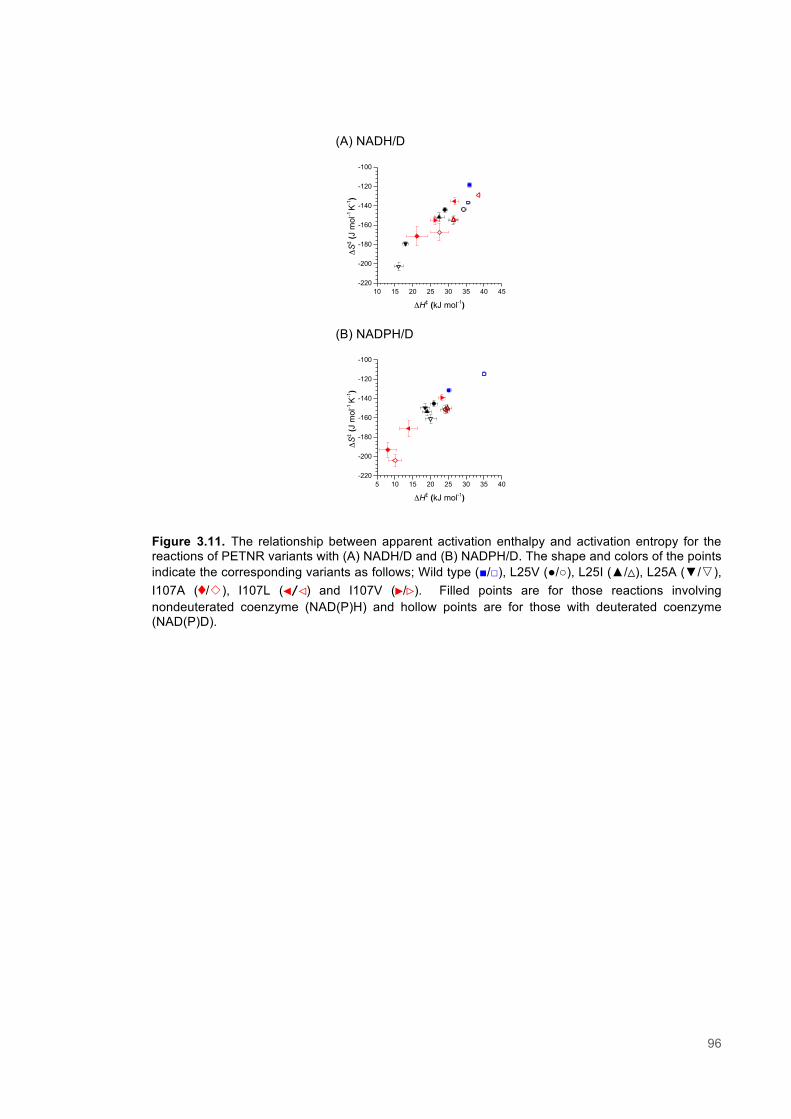
96
(A) NADH/D
(B) NADPH/D
Figure 3.11. The relationship between apparent activation enthalpy and activation entropy for the reactions of PETNR variants with (A) NADH/D and (B) NADPH/D. The shape and colors of the points indicate the corresponding variants as follows; Wild type (■/□), L25V (●/○), L25I (▲/△), L25A (▼/�), I107A (◊/�), I107L (◀/◁) and I107V (▶/▷). Filled points are for those reactions involving nondeuterated coenzyme (NAD(P)H) and hollow points are for those with deuterated coenzyme (NAD(P)D).
10 15 20 25 30 35 40 45-220
-200
-180
-160
-140
-120
-100
ΔS
‡ (J m
ol-1
K-1)
ΔH‡ (kJ mol-1)
5 10 15 20 25 30 35 40-220
-200
-180
-160
-140
-120
-100ΔS
‡ (J m
ol-1
K-1)
ΔH‡ (kJ mol-1)

97
(A) NADH/D
(B) NADPH/D
Figure 3.12 The relationship between apparent activation enthalpy/entropy changes and change in heat capacity for PETNR variants with (A) NADH/D and (B) NADPH/D. Black squares (■) are for those reactions involving nondeuterated coenzyme (NAD(P)H) and red circles (●) are for those with deuterated coenzyme (NAD(P)D).
5 10 15 20 25 30 35 40-3.0
-2.5
-2.0
-1.5
-1.0
-0.5
0.0
0.5
1.0
ΔC
p‡ (kJ
mol
-1)
ΔH‡ (kJ mol-1)-220 -200 -180 -160 -140 -120 -100
-2.5
-2.0
-1.5
-1.0
-0.5
0.0
0.5
1.0
ΔC
p‡ (kJ
mol
-1)
ΔS‡ (kJ mol-1)
5 10 15 20 25 30 35 40-3.0
-2.5
-2.0
-1.5
-1.0
-0.5
0.0
0.5
1.0
ΔC
p‡ (kJ
mol
-1)
ΔH‡ (kJ mol-1)-220 -200 -180 -160 -140 -120 -100
-3.0
-2.5
-2.0
-1.5
-1.0
-0.5
0.0
ΔC
p‡ (kJ
mol
-1)
ΔS‡ (kJ mol-1)
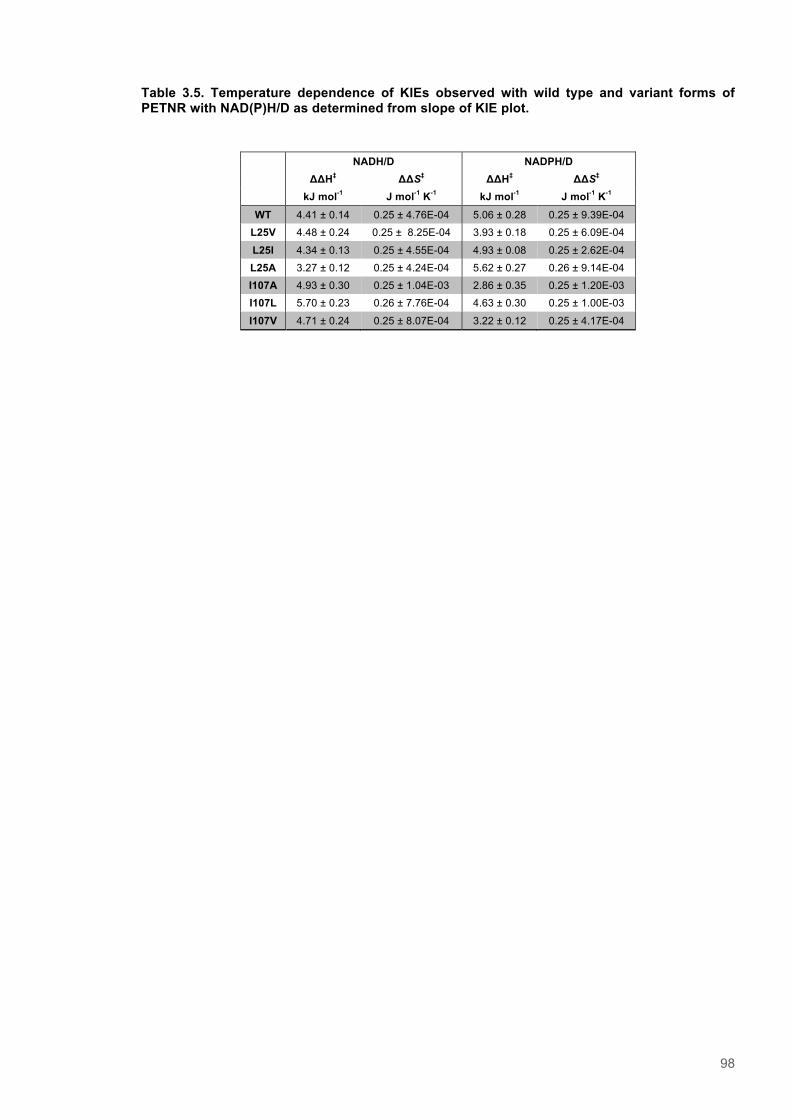
98
Table 3.5. Temperature dependence of KIEs observed with wild type and variant forms of PETNR with NAD(P)H/D as determined from slope of KIE plot.
NADH/D NADPH/D
ΔΔH‡ ΔΔS‡ ΔΔH‡ ΔΔS‡
kJ mol-1 J mol-1 K-1 kJ mol-1 J mol-1 K-1 WT 4.41 ± 0.14 0.25 ± 4.76E-04 5.06 ± 0.28 0.25 ± 9.39E-04
L25V 4.48 ± 0.24 0.25 ± 8.25E-04 3.93 ± 0.18 0.25 ± 6.09E-04
L25I 4.34 ± 0.13 0.25 ± 4.55E-04 4.93 ± 0.08 0.25 ± 2.62E-04
L25A 3.27 ± 0.12 0.25 ± 4.24E-04 5.62 ± 0.27 0.26 ± 9.14E-04
I107A 4.93 ± 0.30 0.25 ± 1.04E-03 2.86 ± 0.35 0.25 ± 1.20E-03
I107L 5.70 ± 0.23 0.26 ± 7.76E-04 4.63 ± 0.30 0.25 ± 1.00E-03
I107V 4.71 ± 0.24 0.25 ± 8.07E-04 3.22 ± 0.12 0.25 ± 4.17E-04
99
3.4 Discussion The work carried out in this chapter was undertaken to investigate the capacity by which PETNR is
able to influence the observed rate of hydride tunnelling facilitated H-transfer, through dynamic
modulation of the donor and acceptor positions within the enzyme-substrate complex. The
experimental strategy employed here was to introduce mutations at the I107 and L25 positions,
substituting in a range of hydrophobic amino acids with differing side chain lengths, and then to
undertake a detailed kinetic characterisation of the reactions with NADH and NADPH (See section
3.2). These specific residues were selected based on NMR studies of ligand binding, which indicated
they were present in regions that undergo both structural perturbation and a loss of µs-ms exchange
dynamics upon complexation. The coenzyme concentration dependence of FMN reduction with
PETNR variants was investigated, and also the temperature dependence of Kinetic Isotope Effects.
In addition to the kinetic studies, crystal structures for PETNR variants were determined and
compared with the wild type in order to understand the effects of introducing mutations on the overall
fold and active site structure. The aim was probe the importance of side chains I107 and L25 and the
surrounding networks for determining the observed rate of hydride transfer and the temperature
dependence of the KIE and thus, determine the extent of any involvement in environmentally
coupled motions involved in donor-acceptor distance modulation.24 Never before has a combined
structural and kinetic characterisation of mutagenic variants of PETNR been undertaken, despite this
enzyme being extensively used as a model system for studies of enzymatic hydride tunnelling.1,24
The structures of PETNR variants were assessed via X-ray Crystallography (See section 3.3.3). The
average RMSD values of < 0.4 indicated that the tertiary structure of the PETNR variants was not
significantly altered compared to the wild-type enzyme models used as a reference (PDB accession
codes 1H50/1H51; Table 3.1). Overlays of ribbon diagrams further confirmed that the overall
structural topology of both sets of variants, at position 25 and 107, was not noticeably effected as a
result of mutagenesis (Figure 3.9). Although secondary structural α-Helices and β-Sheets forming
part of the central TIM barrel overlaid almost exactly, there was some variation in the positions of the
interconnecting loops regions. A comparison of Cα RMSD values highlighted two specific regions,
between 240-250 and 275-300, that diverged from the reference structure (1H50). As these regions
do not form part of the active site and/or contain residues involved in forming interactions with
substrate, it was judged that mutations at I107 and L25 variants were essentially isostructural.
Coenzyme concentration dependence studies were then performed in order to determine saturating
enzyme concentrations for KIE studies (See section 3.3.2). An assessment of Ks values was
necessary to ensure that later temperature dependent studies are recorded at fully saturating
coenzyme concentrations, and under pseudo-first order conditions. The rate constant determined for
the reaction with NADH (kfor = 2.20 ± 0.10 s-1) differed slightly from that previously published (kfor =
2.00 ± 0.02 s-1; Table 3.2).25 However, The saturation constant for FMN reduction observed with the
wild type enzyme and NADH (Ks = 1106.3 ± 74.5 µM) was identical within error limits to the value
previously published (Ks = 1100 ± 100 µM).25 The equivalent values observed for wild type PETNR
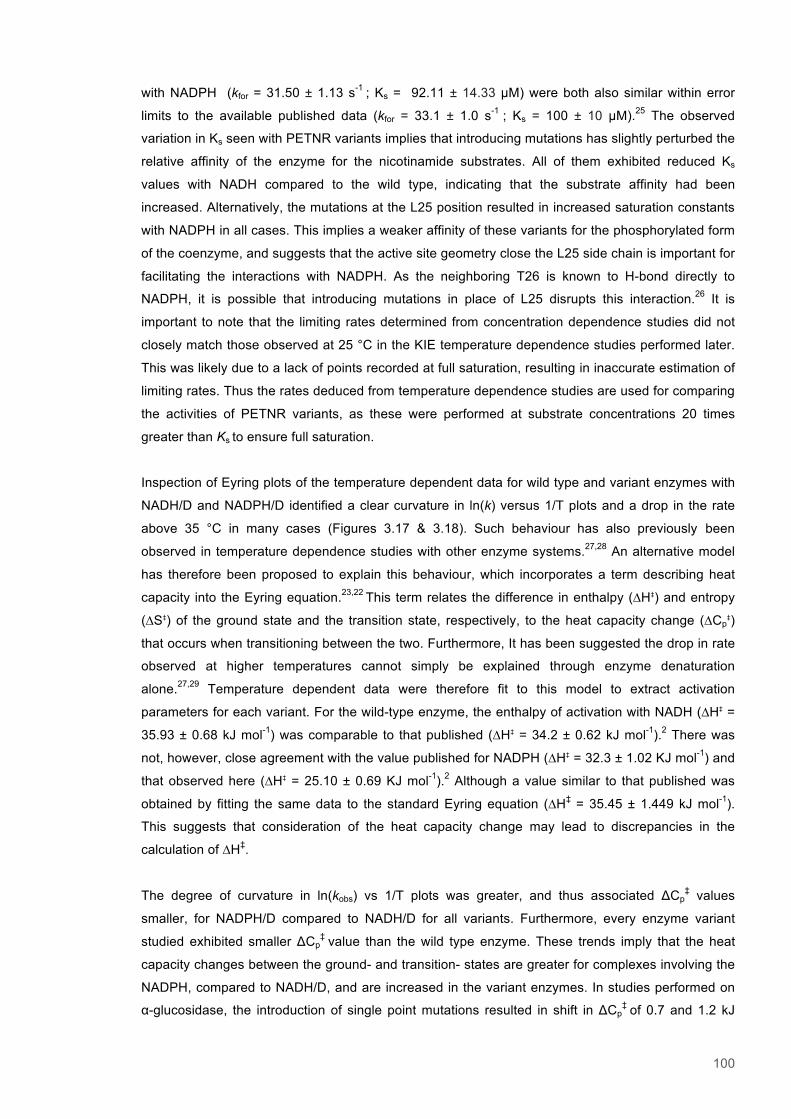
100
with NADPH (kfor = 31.50 ± 1.13 s-1 ; Ks = 92.11 ± 14.33 µM) were both also similar within error
limits to the available published data (kfor = 33.1 ± 1.0 s-1 ; Ks = 100 ± 10 µM).25 The observed
variation in Ks seen with PETNR variants implies that introducing mutations has slightly perturbed the
relative affinity of the enzyme for the nicotinamide substrates. All of them exhibited reduced Ks
values with NADH compared to the wild type, indicating that the substrate affinity had been
increased. Alternatively, the mutations at the L25 position resulted in increased saturation constants
with NADPH in all cases. This implies a weaker affinity of these variants for the phosphorylated form
of the coenzyme, and suggests that the active site geometry close the L25 side chain is important for
facilitating the interactions with NADPH. As the neighboring T26 is known to H-bond directly to
NADPH, it is possible that introducing mutations in place of L25 disrupts this interaction.26 It is
important to note that the limiting rates determined from concentration dependence studies did not
closely match those observed at 25 °C in the KIE temperature dependence studies performed later.
This was likely due to a lack of points recorded at full saturation, resulting in inaccurate estimation of
limiting rates. Thus the rates deduced from temperature dependence studies are used for comparing
the activities of PETNR variants, as these were performed at substrate concentrations 20 times
greater than Ks to ensure full saturation.
Inspection of Eyring plots of the temperature dependent data for wild type and variant enzymes with
NADH/D and NADPH/D identified a clear curvature in ln(k) versus 1/T plots and a drop in the rate
above 35 °C in many cases (Figures 3.17 & 3.18). Such behaviour has also previously been
observed in temperature dependence studies with other enzyme systems.27,28 An alternative model
has therefore been proposed to explain this behaviour, which incorporates a term describing heat
capacity into the Eyring equation.23,22 This term relates the difference in enthalpy (∆H‡) and entropy
(∆S‡) of the ground state and the transition state, respectively, to the heat capacity change (∆Cp‡)
that occurs when transitioning between the two. Furthermore, It has been suggested the drop in rate
observed at higher temperatures cannot simply be explained through enzyme denaturation
alone.27,29 Temperature dependent data were therefore fit to this model to extract activation
parameters for each variant. For the wild-type enzyme, the enthalpy of activation with NADH (∆H‡ =
35.93 ± 0.68 kJ mol-1) was comparable to that published (∆H‡ = 34.2 ± 0.62 kJ mol-1).2 There was
not, however, close agreement with the value published for NADPH (∆H‡ = 32.3 ± 1.02 KJ mol-1) and
that observed here (∆H‡ = 25.10 ± 0.69 KJ mol-1).2 Although a value similar to that published was
obtained by fitting the same data to the standard Eyring equation (∆H‡ = 35.45 ± 1.449 kJ mol-1).
This suggests that consideration of the heat capacity change may lead to discrepancies in the
calculation of ∆H‡.
The degree of curvature in ln(kobs) vs 1/T plots was greater, and thus associated ΔCp‡ values
smaller, for NADPH/D compared to NADH/D for all variants. Furthermore, every enzyme variant
studied exhibited smaller ΔCp‡ value than the wild type enzyme. These trends imply that the heat
capacity changes between the ground- and transition- states are greater for complexes involving the
NADPH, compared to NADH/D, and are increased in the variant enzymes. In studies performed on
α-glucosidase, the introduction of single point mutations resulted in shift in ΔCp‡ of 0.7 and 1.2 kJ
101
mol-1 for the V200T and V200A variants, respectively.23,30 Comparable shifts in ΔCp‡, from that of the
wild type, were observed for the I107A (1.56 kJ mol-1) and I107L (1.28 kJ mol-1), which were the
most greatly perturbed of the PETNR variants analysed. The behaviour of the α-glucosidase variants
appeared to correlate with a shift in the temperature optima for the reaction (Topt), i.e. the
temperature that gives the maximal observed rate. It is possible then that the enhanced curvature
observed here with PETNR variants may have arisen due to a shift in Topt. This effect is likely to have
been more pronounced for NADPH, the faster reacting of the two substrates, because of the greater
curvature, or ΔCp‡ values, observed for reactions involving this substrate. One explanation offered to
explain -ΔCp‡ values for enzyme reactions is that the tighter binding of the transition state results in a
reduction of the number of low frequency vibrational modes for this state in comparison to the
weaker bound enzyme-substrate ground state complex.23,30 Assuming this to be true, then the trends
seen here then suggest that mutagenesis results is a greater difference in the relative mobility of the
ground- and transition- state complexes for the PETNR variants. It is possible this could also be the
underlying basis for a strong correlation of ΔCp‡ with both of ΔS‡ and ΔH‡ (Figure 3.12). If a less rigid,
or more flexible, complex is formed between the variants and the coenzyme, due the introduction of
conformational freedom via mutation, then the entropy of ground state complex would be expected
to increase.31,32 This would be expected to coincide with an increased entropy of activation, as is
seen with the PETNR variants. It may have also resulted in a lessened requirement for the input of
thermal energy to drive the search for the transition state in the more loosely bound complex and
hence, the reduced activation enthalpies also observed.
The rates of reduction with nicotinamide coenzymes at 25 °C were not greatly affected as a result of
altering hydrophobic side chain length at the L25, or I107 positions (See section 3.2.5). This
maintenance of the rate of catalysis in PETNR variants occurred despite apparently significant
changes in the temperature dependence of the KIEs. In previous studies changes in the temperature
dependence of the KIE have generally been attributed to shifts in the equilibrium distribution of DA
distances, or modification of the force constants for promoting modes.9,15 Without computational
analysis of the effects of mutation on the promoting modes and the spread of DA distances it is
difficult to interpret the shifts in KIE temperature dependence seen here at the molecular level.
However, the change in KIE temperature dependences suggests that size of side chains at the
I107/L25 positions effects the environmental coupling of motions involved in DAD sampling. Analysis
of kinetic activation parameters, ΔH‡ and ΔS‡, indicated a compensatory effect between the
activation entropy and enthalpy was responsible for maintaining the rates of catalysis in the PETNR
variants studied here. Entropy-enthalpy compensation effects have also been previously observed
for other protein interactions, such as metal-ion coordination, peptide binding by Src kinase enzymes
and binding of variant cAMP receptor proteins to RNA-polymerase, following perturbation of these
systems.33-35 Generally the compensation effects result in equivalent changes in ΔH and ΔS resulting
a minimal overall change in ΔG, as is observed for the free energy change upon reactions with
PETNR variants observed here.36 Generally the rates observed with PETNR variants varied by
approximately 40 % either side of that observed with wild type. This is a small shift in comparison to
those rate changes observed in similar studies performed on other tunneling enzymes.3,12,13 For
102
example, with DHFR the introduction of active site mutations resulted in up to a 1000-fold change in
kobs, and with TS a 400-fold shift in kcat was observed with variants.12,13 Conversely, the mutation of
polar residues near to the active site of the homologous and structurally similar MR also resulted in a
negligible shift in kobs (The largest was from kobs = 56.4 ± 0.77 s-1 for the wild type, to kobs = 36.1 ± 2.5
s-1).15 This indicates that the structures of OYE enzymes are more resistant to small changes in
active site geometry than, for example, DHFR and TS. If these enzymes function in the detoxification
of electrophilic compounds, as has been suggested, then broad substrate-specificity becomes
advantageous.37 Hence, evolutionary pressures may have adapted the active site to resist subtle
changes in substrate geometry, without adverse effects on the rate of catalysis. This makes OYE
enzymes an attractive tool for biocatalysis, because modification of the substrate specificity through
mutagenesis should be feasible without loss of activity.
The work undertaken in this chapter has provided a detailed insight into the effects of mutating non-
polar side chains on the observed kinetic parameters and KIEs associated the reaction of PETNR
with NADPH and NADH. Truncating the side chains of L25 and I107 generally resulted in a shifts the
in the temperature dependence of the KIE and thermodynamic activation parameters, without a
major change in the observed rate. This suggests that these side chains, and the structure of the
directly encompassing regions, are involved in dynamic networks that promote hydride transfer and
hence determine the temperature dependence of the KIE. Lastly, temperature dependent KIE data
was analysed using a model that accounts for an additional thermodynamic parameter, heat
capacity, which is not addressed in more traditional Eyring/Arrhenius treatment of enzyme kinetics.
This approach suggests a shift in the relative heat capacities of the ground- and/or transition- state
complexes involving the PETNR-variants relative to that of the wild type.
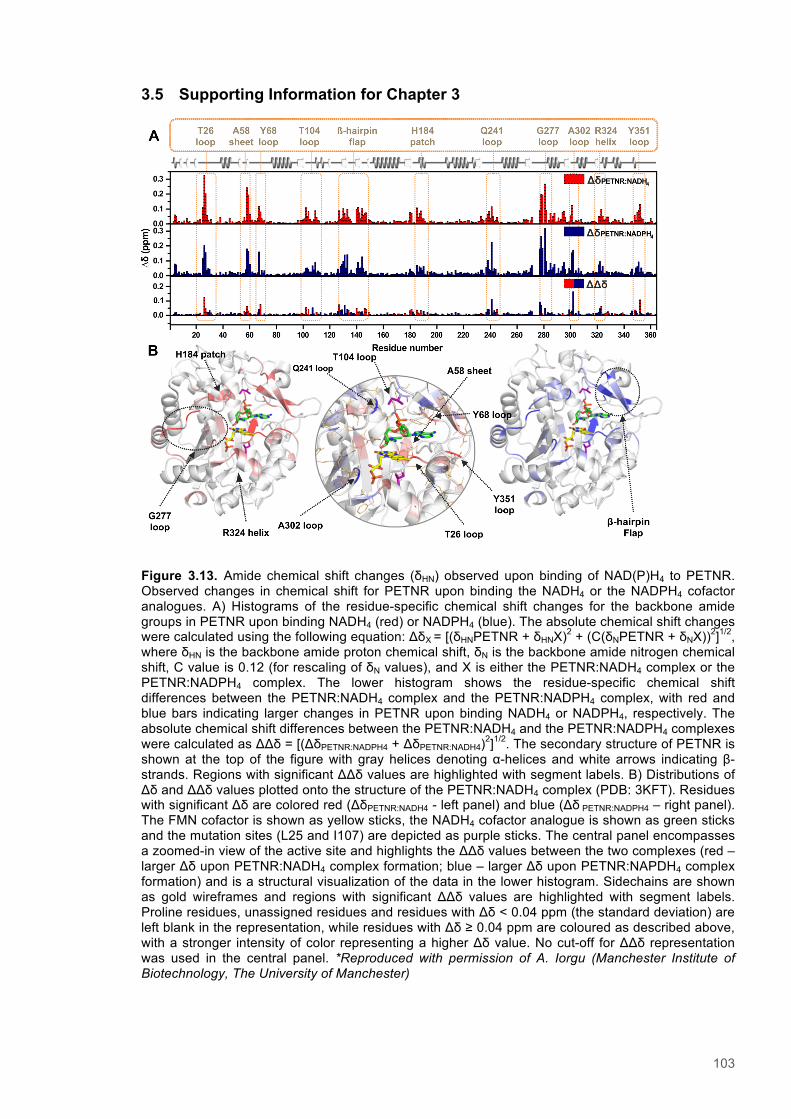
103
3.5 Supporting Information for Chapter 3
Figure 3.13. Amide chemical shift changes (δHN) observed upon binding of NAD(P)H4 to PETNR. Observed changes in chemical shift for PETNR upon binding the NADH4 or the NADPH4 cofactor analogues. A) Histograms of the residue-specific chemical shift changes for the backbone amide groups in PETNR upon binding NADH4 (red) or NADPH4 (blue). The absolute chemical shift changes were calculated using the following equation: ΔδX = [(δHNPETNR + δHNX)2 + (C(δNPETNR + δNX))2]1/2, where δHN is the backbone amide proton chemical shift, δN is the backbone amide nitrogen chemical shift, C value is 0.12 (for rescaling of δN values), and X is either the PETNR:NADH4 complex or the PETNR:NADPH4 complex. The lower histogram shows the residue-specific chemical shift differences between the PETNR:NADH4 complex and the PETNR:NADPH4 complex, with red and blue bars indicating larger changes in PETNR upon binding NADH4 or NADPH4, respectively. The absolute chemical shift differences between the PETNR:NADH4 and the PETNR:NADPH4 complexes were calculated as ΔΔδ = [(ΔδPETNR:NADPH4 + ΔδPETNR:NADH4)2]1/2. The secondary structure of PETNR is shown at the top of the figure with gray helices denoting α-helices and white arrows indicating β-strands. Regions with significant ΔΔδ values are highlighted with segment labels. B) Distributions of Δδ and ΔΔδ values plotted onto the structure of the PETNR:NADH4 complex (PDB: 3KFT). Residues with significant Δδ are colored red (ΔδPETNR:NADH4 - left panel) and blue (Δδ PETNR:NADPH4 – right panel). The FMN cofactor is shown as yellow sticks, the NADH4 cofactor analogue is shown as green sticks and the mutation sites (L25 and I107) are depicted as purple sticks. The central panel encompasses a zoomed-in view of the active site and highlights the ΔΔδ values between the two complexes (red – larger Δδ upon PETNR:NADH4 complex formation; blue – larger Δδ upon PETNR:NAPDH4 complex formation) and is a structural visualization of the data in the lower histogram. Sidechains are shown as gold wireframes and regions with significant ΔΔδ values are highlighted with segment labels. Proline residues, unassigned residues and residues with Δδ < 0.04 ppm (the standard deviation) are left blank in the representation, while residues with Δδ ≥ 0.04 ppm are coloured as described above, with a stronger intensity of color representing a higher Δδ value. No cut-off for ΔΔδ representation was used in the central panel. *Reproduced with permission of A. Iorgu (Manchester Institute of Biotechnology, The University of Manchester)
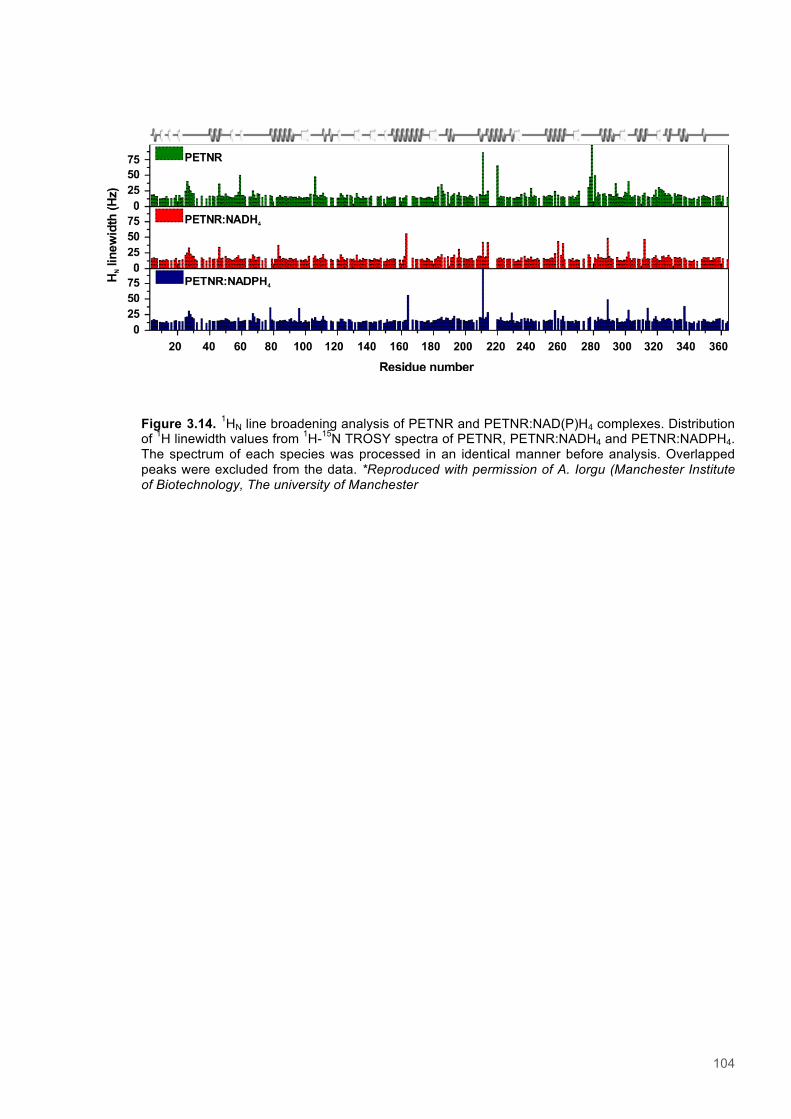
104
Figure 3.14. 1HN line broadening analysis of PETNR and PETNR:NAD(P)H4 complexes. Distribution of 1H linewidth values from 1H-15N TROSY spectra of PETNR, PETNR:NADH4 and PETNR:NADPH4. The spectrum of each species was processed in an identical manner before analysis. Overlapped peaks were excluded from the data. *Reproduced with permission of A. Iorgu (Manchester Institute of Biotechnology, The university of Manchester
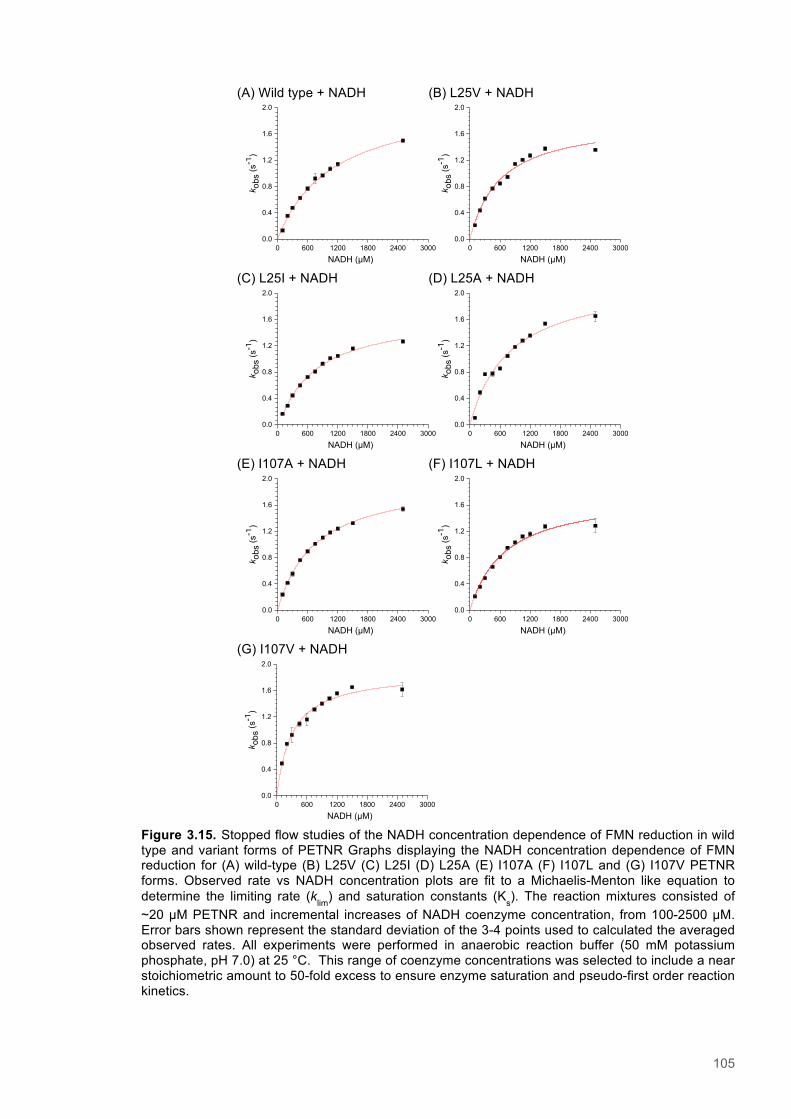
105
(A) Wild type + NADH (B) L25V + NADH
(C) L25I + NADH (D) L25A + NADH
(E) I107A + NADH (F) I107L + NADH
(G) I107V + NADH
Figure 3.15. Stopped flow studies of the NADH concentration dependence of FMN reduction in wild type and variant forms of PETNR Graphs displaying the NADH concentration dependence of FMN reduction for (A) wild-type (B) L25V (C) L25I (D) L25A (E) I107A (F) I107L and (G) I107V PETNR forms. Observed rate vs NADH concentration plots are fit to a Michaelis-Menton like equation to determine the limiting rate (klim) and saturation constants (Ks). The reaction mixtures consisted of ~20 µM PETNR and incremental increases of NADH coenzyme concentration, from 100-2500 µM. Error bars shown represent the standard deviation of the 3-4 points used to calculated the averaged observed rates. All experiments were performed in anaerobic reaction buffer (50 mM potassium phosphate, pH 7.0) at 25 °C. This range of coenzyme concentrations was selected to include a near stoichiometric amount to 50-fold excess to ensure enzyme saturation and pseudo-first order reaction kinetics.
0 600 1200 1800 2400 30000.0
0.4
0.8
1.2
1.6
2.0
k obs
(s-1
)NADH (µM)
0 600 1200 1800 2400 30000.0
0.4
0.8
1.2
1.6
2.0
k obs
(s-1
)
NADH (µM)
0 600 1200 1800 2400 30000.0
0.4
0.8
1.2
1.6
2.0
k obs
(s-1
)
NADH (µM)0 600 1200 1800 2400 3000
0.0
0.4
0.8
1.2
1.6
2.0
k obs
(s-1
)NADH (µM)
0 600 1200 1800 2400 30000.0
0.4
0.8
1.2
1.6
2.0
k obs
(s-1
)
NADH (µM)0 600 1200 1800 2400 3000
0.0
0.4
0.8
1.2
1.6
2.0
k obs
(s-1
)
NADH (µM)
0 600 1200 1800 2400 30000.0
0.4
0.8
1.2
1.6
2.0
k obs
(s-1
)
NADH (µM)
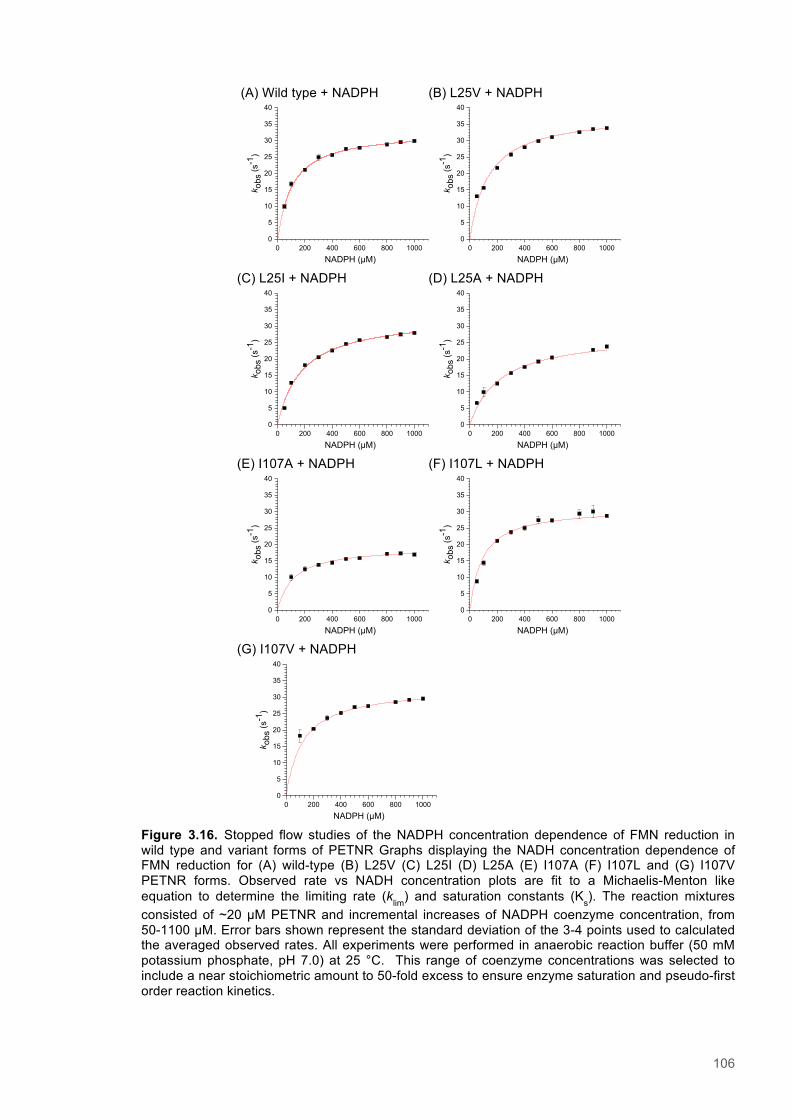
106
(A) Wild type + NADPH (B) L25V + NADPH
(C) L25I + NADPH (D) L25A + NADPH
(E) I107A + NADPH (F) I107L + NADPH
(G) I107V + NADPH
Figure 3.16. Stopped flow studies of the NADPH concentration dependence of FMN reduction in wild type and variant forms of PETNR Graphs displaying the NADH concentration dependence of FMN reduction for (A) wild-type (B) L25V (C) L25I (D) L25A (E) I107A (F) I107L and (G) I107V PETNR forms. Observed rate vs NADH concentration plots are fit to a Michaelis-Menton like equation to determine the limiting rate (klim) and saturation constants (Ks). The reaction mixtures consisted of ~20 µM PETNR and incremental increases of NADPH coenzyme concentration, from 50-1100 µM. Error bars shown represent the standard deviation of the 3-4 points used to calculated the averaged observed rates. All experiments were performed in anaerobic reaction buffer (50 mM potassium phosphate, pH 7.0) at 25 °C. This range of coenzyme concentrations was selected to include a near stoichiometric amount to 50-fold excess to ensure enzyme saturation and pseudo-first order reaction kinetics.
0 200 400 600 800 10000
5
10
15
20
25
30
35
40
k obs
(s-1
)NADPH (µM)
0 200 400 600 800 10000
5
10
15
20
25
30
35
40
k obs
(s-1
)
NADPH (µM)
0 200 400 600 800 10000
5
10
15
20
25
30
35
40
k obs
(s-1
)
NADPH (µM)0 200 400 600 800 1000
0
5
10
15
20
25
30
35
40
k obs
(s-1
)NADPH (µM)
0 200 400 600 800 10000
5
10
15
20
25
30
35
40
k obs
(s-1
)
NADPH (µM)0 200 400 600 800 1000
0
5
10
15
20
25
30
35
40
k obs
(s-1
)
NADPH (µM)
0 200 400 600 800 10000
5
10
15
20
25
30
35
40
k obs
(s-1
)
NADPH (µM)
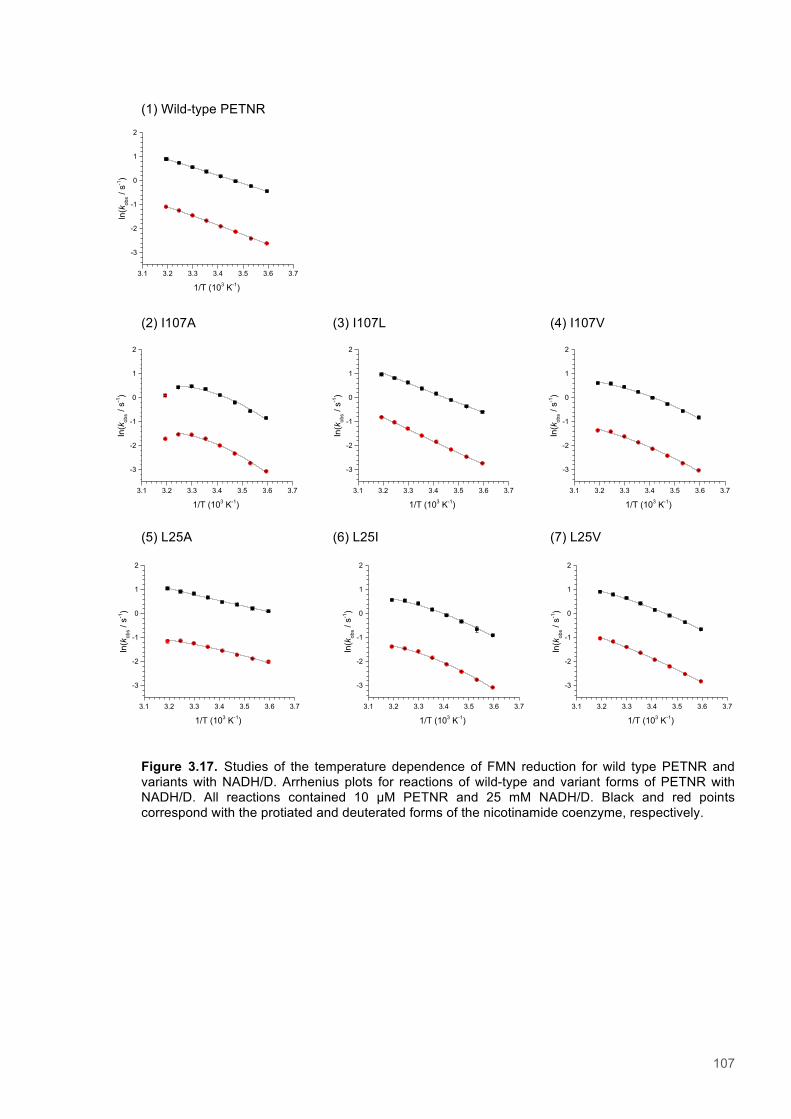
107
(1) Wild-type PETNR
(2) I107A (3) I107L (4) I107V
(5) L25A (6) L25I (7) L25V Figure 3.17. Studies of the temperature dependence of FMN reduction for wild type PETNR and variants with NADH/D. Arrhenius plots for reactions of wild-type and variant forms of PETNR with NADH/D. All reactions contained 10 µM PETNR and 25 mM NADH/D. Black and red points correspond with the protiated and deuterated forms of the nicotinamide coenzyme, respectively.
3.1 3.2 3.3 3.4 3.5 3.6 3.7
-3
-2
-1
0
1
2
ln(k
obs /
s-1)
1/T (103 K-1)
3.1 3.2 3.3 3.4 3.5 3.6 3.7
-3
-2
-1
0
1
2
ln(k
obs /
s-1)
1/T (103 K-1)
3.1 3.2 3.3 3.4 3.5 3.6 3.7
-3
-2
-1
0
1
2
ln(k
obs /
s-1)
1/T (103 K-1)
3.1 3.2 3.3 3.4 3.5 3.6 3.7
-3
-2
-1
0
1
2
ln(k
obs /
s-1)
1/T (103 K-1)
3.1 3.2 3.3 3.4 3.5 3.6 3.7
-3
-2
-1
0
1
2
ln(k
obs /
s-1)
1/T (103 K-1)
3.1 3.2 3.3 3.4 3.5 3.6 3.7
-3
-2
-1
0
1
2
ln(k
obs /
s-1)
1/T (103 K-1)
3.1 3.2 3.3 3.4 3.5 3.6 3.7
-3
-2
-1
0
1
2ln
(kob
s / s
-1)
1/T (103 K-1)
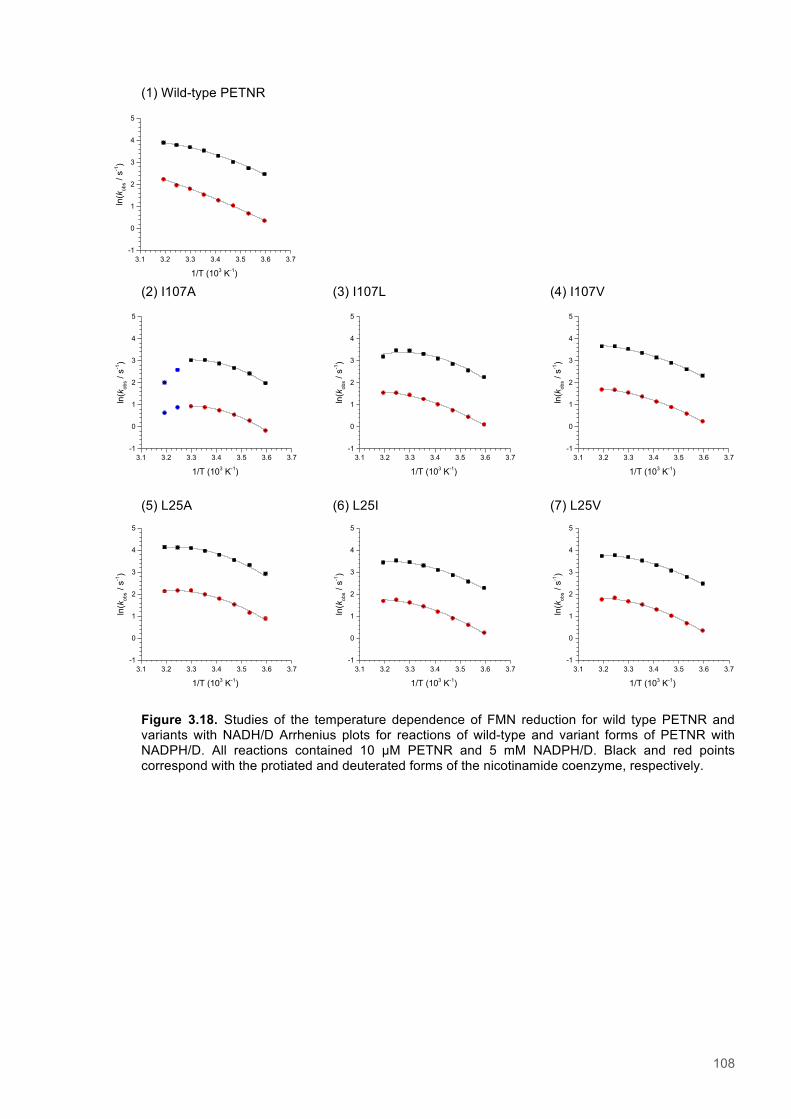
108
(1) Wild-type PETNR
(2) I107A (3) I107L (4) I107V (5) L25A (6) L25I (7) L25V Figure 3.18. Studies of the temperature dependence of FMN reduction for wild type PETNR and variants with NADH/D Arrhenius plots for reactions of wild-type and variant forms of PETNR with NADPH/D. All reactions contained 10 µM PETNR and 5 mM NADPH/D. Black and red points correspond with the protiated and deuterated forms of the nicotinamide coenzyme, respectively.
3.1 3.2 3.3 3.4 3.5 3.6 3.7-1
0
1
2
3
4
5ln
(kob
s / s
-1)
1/T (103 K-1)
3.1 3.2 3.3 3.4 3.5 3.6 3.7-1
0
1
2
3
4
5
ln(k
obs /
s-1)
1/T (103 K-1)
3.1 3.2 3.3 3.4 3.5 3.6 3.7-1
0
1
2
3
4
5
ln(k
obs /
s-1)
1/T (103 K-1)
3.1 3.2 3.3 3.4 3.5 3.6 3.7-1
0
1
2
3
4
5
ln(k
obs /
s-1)
1/T (103 K-1)
3.1 3.2 3.3 3.4 3.5 3.6 3.7-1
0
1
2
3
4
5
ln(k
obs /
s-1)
1/T (103 K-1)
3.1 3.2 3.3 3.4 3.5 3.6 3.7-1
0
1
2
3
4
5
ln(k
obs /
s-1)
1/T (103 K-1)
3.1 3.2 3.3 3.4 3.5 3.6 3.7-1
0
1
2
3
4
5
ln(k
obs /
s-1)
1/T (103 K-1)

109
(1) Wild-type PETNR
(2) I107A (3) I107L (4) I107V
(5) L25A (6) L25I (7) L25V
Figure 3.19. KIEs observed with wild type PETNR and variants with NADH/D
3.1 3.2 3.3 3.4 3.5 3.6 3.70
1
2
3
4
5
6
7
8
9
10
11K
IE
1/T (10-3K-1)
3.1 3.2 3.3 3.4 3.5 3.6 3.70
1
2
3
4
5
6
7
8
9
10
11
KIE
1/T (10-3K-1)
3.1 3.2 3.3 3.4 3.5 3.6 3.70
1
2
3
4
5
6
7
8
9
10
11
KIE
1/T (10-3K-1)
3.1 3.2 3.3 3.4 3.5 3.6 3.70
1
2
3
4
5
6
7
8
9
10
11
KIE
1/T (10-3K-1)
3.1 3.2 3.3 3.4 3.5 3.6 3.70
1
2
3
4
5
6
7
8
9
10
11
KIE
1/T (10-3K-1)
3.1 3.2 3.3 3.4 3.5 3.6 3.70
1
2
3
4
5
6
7
8
9
10
11
KIE
1/T (10-3K-1)
3.1 3.2 3.3 3.4 3.5 3.6 3.70
1
2
3
4
5
6
7
8
9
10
11
KIE
1/T (10-3K-1)
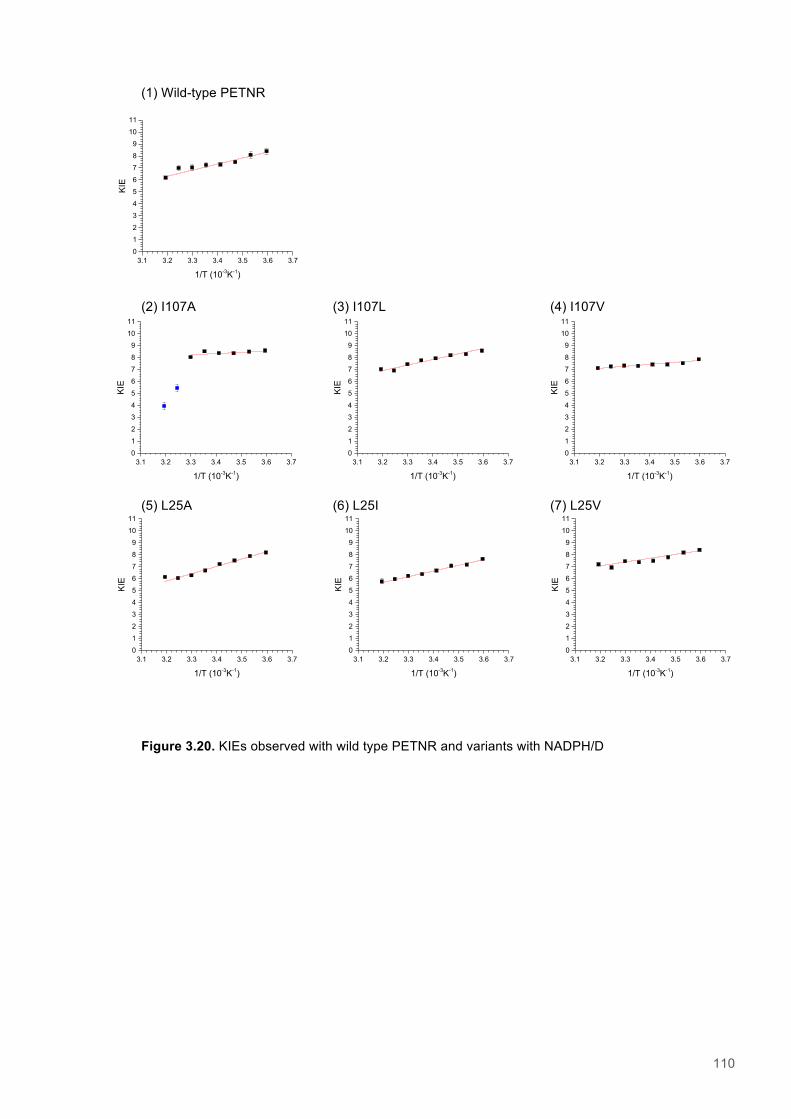
110
(1) Wild-type PETNR
(2) I107A (3) I107L (4) I107V
(5) L25A (6) L25I (7) L25V
Figure 3.20. KIEs observed with wild type PETNR and variants with NADPH/D
3.1 3.2 3.3 3.4 3.5 3.6 3.70
1
2
3
4
5
6
7
8
9
10
11K
IE
1/T (10-3K-1)
3.1 3.2 3.3 3.4 3.5 3.6 3.70
1
2
3
4
5
6
7
8
9
10
11
KIE
1/T (10-3K-1)
3.1 3.2 3.3 3.4 3.5 3.6 3.70
1
2
3
4
5
6
7
8
9
10
11
KIE
1/T (10-3K-1)
3.1 3.2 3.3 3.4 3.5 3.6 3.70
1
2
3
4
5
6
7
8
9
10
11
KIE
1/T (10-3K-1)
3.1 3.2 3.3 3.4 3.5 3.6 3.70
1
2
3
4
5
6
7
8
9
10
11
KIE
1/T (10-3K-1)
3.1 3.2 3.3 3.4 3.5 3.6 3.70
1
2
3
4
5
6
7
8
9
10
11
KIE
1/T (10-3K-1)
3.1 3.2 3.3 3.4 3.5 3.6 3.70
1
2
3
4
5
6
7
8
9
10
11
KIE
1/T (10-3K-1)
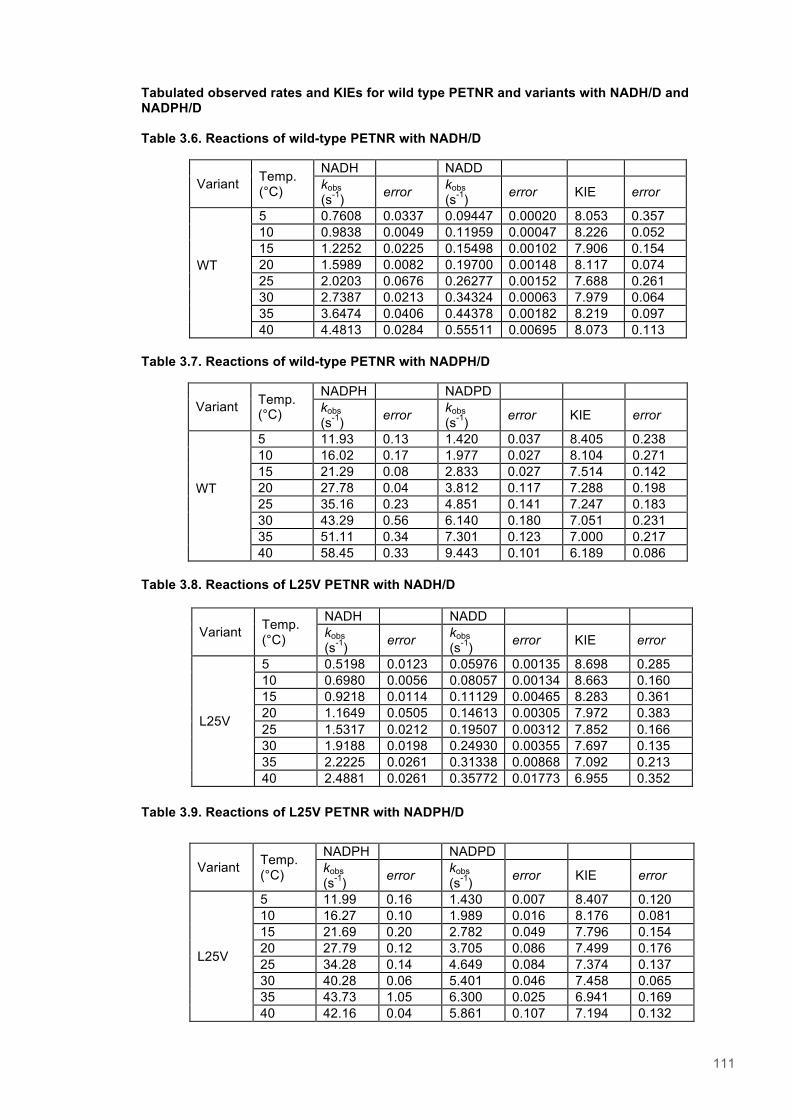
111
Tabulated observed rates and KIEs for wild type PETNR and variants with NADH/D and NADPH/D Table 3.6. Reactions of wild-type PETNR with NADH/D
Variant Temp. (°C)
NADH NADD kobs (s-1) error kobs
(s-1) error KIE error
WT
5 0.7608 0.0337 0.09447 0.00020 8.053 0.357 10 0.9838 0.0049 0.11959 0.00047 8.226 0.052 15 1.2252 0.0225 0.15498 0.00102 7.906 0.154 20 1.5989 0.0082 0.19700 0.00148 8.117 0.074 25 2.0203 0.0676 0.26277 0.00152 7.688 0.261 30 2.7387 0.0213 0.34324 0.00063 7.979 0.064 35 3.6474 0.0406 0.44378 0.00182 8.219 0.097 40 4.4813 0.0284 0.55511 0.00695 8.073 0.113
Table 3.7. Reactions of wild-type PETNR with NADPH/D
Variant Temp. (°C)
NADPH NADPD kobs (s-1) error kobs
(s-1) error KIE error
WT
5 11.93 0.13 1.420 0.037 8.405 0.238 10 16.02 0.17 1.977 0.027 8.104 0.271 15 21.29 0.08 2.833 0.027 7.514 0.142 20 27.78 0.04 3.812 0.117 7.288 0.198 25 35.16 0.23 4.851 0.141 7.247 0.183 30 43.29 0.56 6.140 0.180 7.051 0.231 35 51.11 0.34 7.301 0.123 7.000 0.217 40 58.45 0.33 9.443 0.101 6.189 0.086
Table 3.8. Reactions of L25V PETNR with NADH/D
Table 3.9. Reactions of L25V PETNR with NADPH/D
Variant Temp. (°C)
NADH NADD kobs (s-1) error kobs
(s-1) error KIE error
L25V
5 0.5198 0.0123 0.05976 0.00135 8.698 0.285 10 0.6980 0.0056 0.08057 0.00134 8.663 0.160 15 0.9218 0.0114 0.11129 0.00465 8.283 0.361 20 1.1649 0.0505 0.14613 0.00305 7.972 0.383 25 1.5317 0.0212 0.19507 0.00312 7.852 0.166 30 1.9188 0.0198 0.24930 0.00355 7.697 0.135 35 2.2225 0.0261 0.31338 0.00868 7.092 0.213 40 2.4881 0.0261 0.35772 0.01773 6.955 0.352
Variant Temp. (°C)
NADPH NADPD kobs (s-1) error kobs
(s-1) error KIE error
L25V
5 11.99 0.16 1.430 0.007 8.407 0.120 10 16.27 0.10 1.989 0.016 8.176 0.081 15 21.69 0.20 2.782 0.049 7.796 0.154 20 27.79 0.12 3.705 0.086 7.499 0.176 25 34.28 0.14 4.649 0.084 7.374 0.137 30 40.28 0.06 5.401 0.046 7.458 0.065 35 43.73 1.05 6.300 0.025 6.941 0.169 40 42.16 0.04 5.861 0.107 7.194 0.132

112
Table 3.10. Reactions of L25I PETNR with NADH/D
Variant Temp. (°C)
NADH NADD kobs (s-1) error kobs
(s-1) error KIE error
L25V
5 0.4053 0.0102 0.04630 0.00054 8.7553 0.2422 10 0.5211 0.0045 0.06334 0.00053 8.2263 0.0982 15 0.7208 0.0053 0.08858 0.00058 8.1372 0.0801 20 0.9305 0.0130 0.12134 0.00168 7.6683 0.1508 25 1.1809 0.0269 0.15833 0.00131 7.4582 0.1805 30 1.5333 0.0109 0.20857 0.00203 7.3513 0.0884 35 1.7101 0.0566 0.23471 0.00254 7.2862 0.2537 40 1.7671 0.0306 0.25266 0.00374 6.9940 0.1594
Table 3.11. Reactions of L25I PETNR with NADPH/D
Table 3.12. Reactions of L25A PETNR with NADH/D
Table 3.13. Reactions of L25A PETNR with NADPH/D
Variant Temp. (°C)
NADPH NADPD kobs (s-1) error kobs
(s-1) error KIE error
L25I
5 9.880 0.007 1.290 0.004 7.654 0.077 10 13.191 0.013 1.839 0.007 7.174 0.091 15 17.667 0.049 2.497 0.055 7.075 0.176 20 22.302 0.042 3.336 0.020 6.684 0.069 25 27.483 0.072 4.308 0.031 6.379 0.062 30 31.923 0.026 5.119 0.095 6.236 0.117 35 34.454 0.118 5.774 0.093 5.967 0.101 40 31.503 0.102 5.459 0.190 5.771 0.204
Variant Temp. (°C)
NADH NADD kobs (s-1) error kobs
(s-1) error KIE error
L25A
5 1.105 0.008 0.1340 0.0093 8.490 0.176 10 1.241 0.027 0.1525 0.0016 8.136 0.196 15 1.456 0.045 0.1788 0.0044 8.141 0.323 20 1.619 0.015 0.2125 0.0066 7.824 0.261 25 1.957 0.037 0.2497 0.0053 7.837 0.222 30 2.298 0.045 0.2916 0.0049 7.881 0.202 35 2.498 0.012 0.3216 0.0077 7.768 0.189 40 2.750 0.099 0.3599 0.0281 7.639 0.623
Variant Temp. (°C)
NADPH NADPD kobs (s-1) error kobs
(s-1) error KIE error
L25A
5 18.83 0.18 2.298 0.001 8.193 0.078 10 25.33 0.18 3.212 0.043 7.885 0.120 15 32.62 0.06 4.341 0.023 7.516 0.042 20 40.70 0.25 5.525 0.067 7.224 0.097 25 46.03 0.72 5.525 0.067 6.693 0.123 30 47.26 0.27 7.527 0.026 6.278 0.042 35 33.96 0.34 6.200 0.094 6.051 0.100 40 13.06 16.97 0.730 0.084 6.147 0.089

113
Table 3.14. Reactions of I107A PETNR with NADH/D
Variant Temp. (°C)
NADH NADD kobs (s-1) error kobs
(s-1) error KIE error
I107A
5 0.4310 0.0009 0.04684 0.00077 9.202 0.152 10 0.5729 0.0026 0.06564 0.00078 8.728 0.111 15 0.8237 0.0034 0.09764 0.00021 8.436 0.039 20 1.1168 0.0089 0.13694 0.00057 8.155 0.073 25 1.4382 0.0132 0.18156 0.00026 7.921 0.074 30 1.6130 0.0142 0.21399 0.00121 7.538 0.079 35 1.5475 0.0598 0.21783 0.00216 7.104 0.283 40 1.0992 0.0483 0.18039 0.00112 6.093 0.271
Table 3.15. Reactions of I107A PETNR with NADPH/D
Table 3.16. Reactions of I107L PETNR with NADH/D
Table 3.17. Reactions of I107L PETNR with NADPH/D
Variant Temp. (°C)
NADPH NADPD kobs (s-1) error kobs
(s-1) error KIE error
I107A
5 7.217 0.550 0.8401 0.0059 8.590 0.152 10 11.240 0.261 1.3229 0.0165 8.497 0.111 15 14.446 0.135 1.7275 0.0138 8.363 0.039 20 17.690 0.266 2.1131 0.0076 8.372 0.073 25 20.788 0.277 2.4380 0.0191 8.527 0.074 30 20.527 0.063 2.5512 0.0152 8.046 0.079 35 13.232 0.882 2.4235 0.0700 5.460 0.283 40 7.416 0.094 1.8755 0.0626 3.954 0.271
Variant Temp. (°C)
NADH NADD kobs (s-1) error kobs
(s-1) error KIE error
I107L
5 0.5539 0.0096 0.06542 0.00138 8.467 0.231 10 0.7002 0.0061 0.08535 0.00165 8.204 0.174 15 0.9112 0.0115 0.11581 0.00056 7.868 0.107 20 1.1834 0.0137 0.15920 0.00715 7.433 0.345 25 1.4688 0.0130 0.20616 0.00270 7.125 0.113 30 1.8949 0.0309 0.27728 0.00715 6.834 0.209 35 2.2652 0.0506 0.36233 0.01544 6.252 0.301 40 2.6502 0.0075 0.47883 0.01230 5.941 0.165
Variant Temp. (°C)
NADPH NADPD kobs (s-1) error kobs
(s-1) error KIE error
I107L
5 9.543 0.050 1.112 0.017 8.583 0.140 10 12.956 0.040 1.564 0.029 8.286 0.155 15 17.342 0.042 2.118 0.030 8.189 0.119 20 22.096 0.091 2.783 0.022 7.939 0.070 25 27.360 0.096 3.523 0.041 7.766 0.094 30 31.633 0.171 4.244 0.036 7.454 0.075 35 32.267 0.248 4.657 0.028 6.929 0.068 40 24.593 0.517 3.500 0.030 7.026 0.159
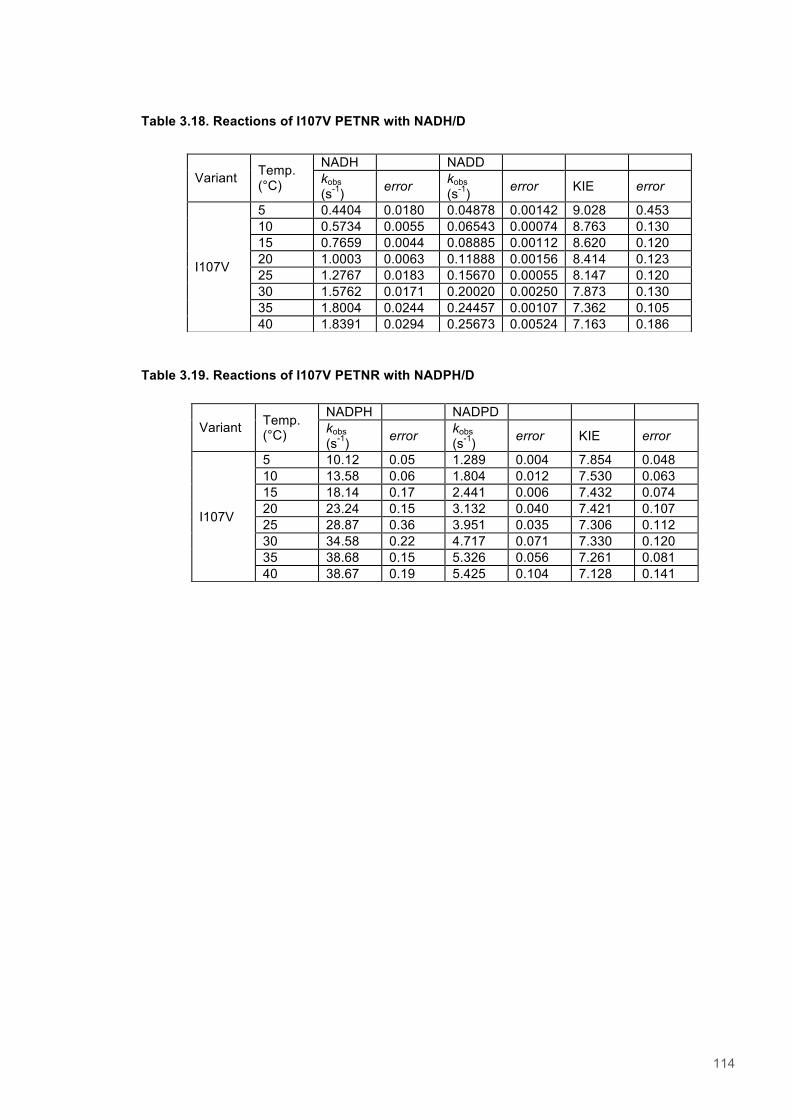
114
Table 3.18. Reactions of I107V PETNR with NADH/D
Table 3.19. Reactions of I107V PETNR with NADPH/D
Variant Temp. (°C)
NADH NADD kobs (s-1) error kobs
(s-1) error KIE error
I107V
5 0.4404 0.0180 0.04878 0.00142 9.028 0.453 10 0.5734 0.0055 0.06543 0.00074 8.763 0.130 15 0.7659 0.0044 0.08885 0.00112 8.620 0.120 20 1.0003 0.0063 0.11888 0.00156 8.414 0.123 25 1.2767 0.0183 0.15670 0.00055 8.147 0.120 30 1.5762 0.0171 0.20020 0.00250 7.873 0.130 35 1.8004 0.0244 0.24457 0.00107 7.362 0.105 40 1.8391 0.0294 0.25673 0.00524 7.163 0.186
Variant Temp. (°C)
NADPH NADPD kobs (s-1) error kobs
(s-1) error KIE error
I107V
5 10.12 0.05 1.289 0.004 7.854 0.048 10 13.58 0.06 1.804 0.012 7.530 0.063 15 18.14 0.17 2.441 0.006 7.432 0.074 20 23.24 0.15 3.132 0.040 7.421 0.107 25 28.87 0.36 3.951 0.035 7.306 0.112 30 34.58 0.22 4.717 0.071 7.330 0.120 35 38.68 0.15 5.326 0.056 7.261 0.081 40 38.67 0.19 5.425 0.104 7.128 0.141
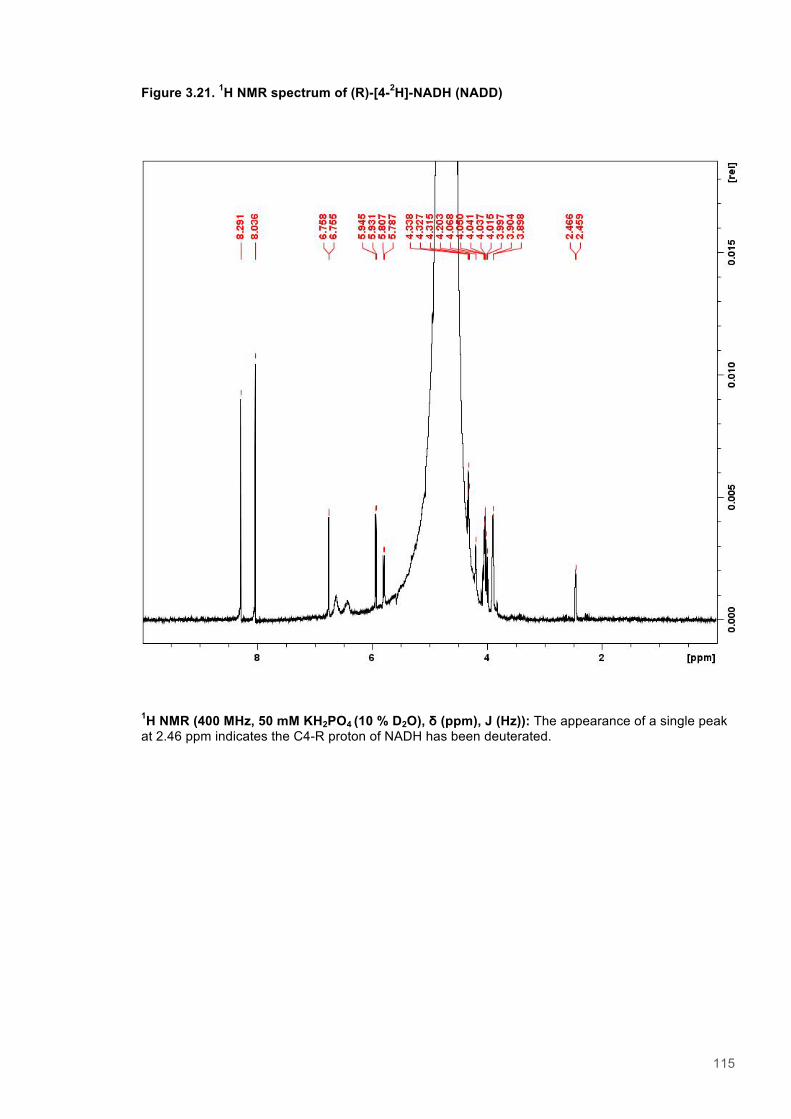
115
Figure 3.21. 1H NMR spectrum of (R)-[4-2H]-NADH (NADD)
1H NMR (400 MHz, 50 mM KH2PO4 (10 % D2O), δ (ppm), J (Hz)): The appearance of a single peak at 2.46 ppm indicates the C4-R proton of NADH has been deuterated.
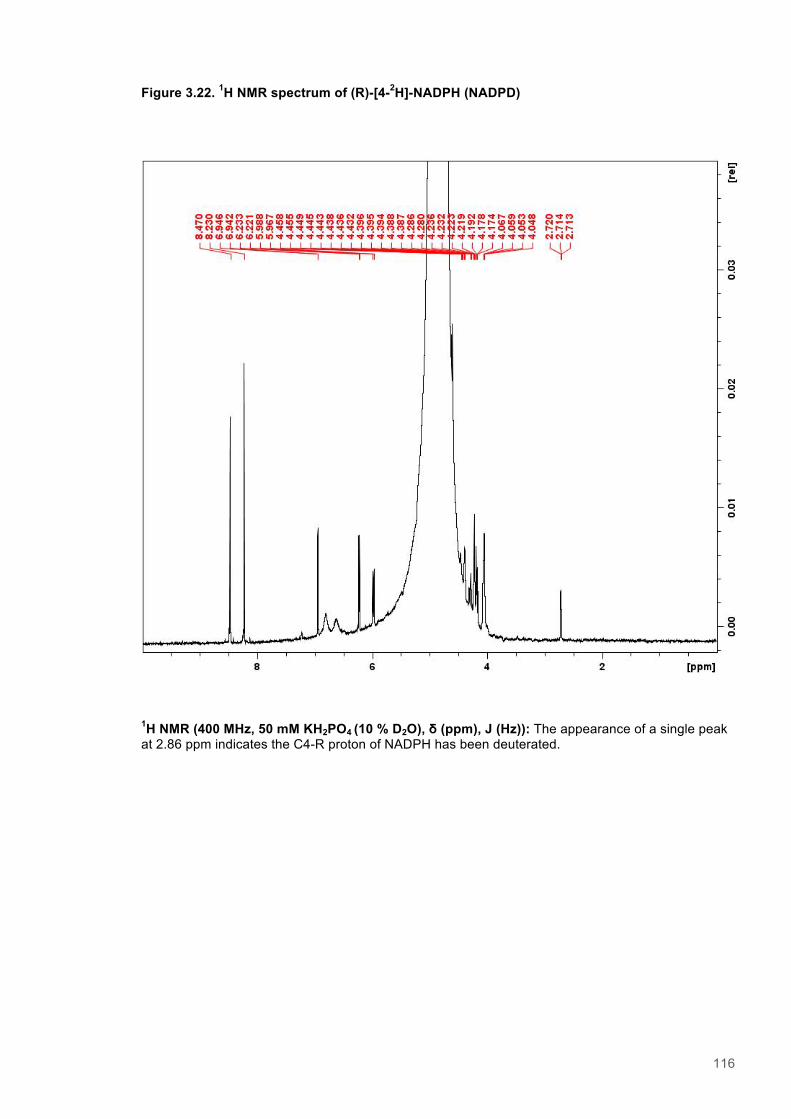
116
Figure 3.22. 1H NMR spectrum of (R)-[4-2H]-NADPH (NADPD)
1H NMR (400 MHz, 50 mM KH2PO4 (10 % D2O), δ (ppm), J (Hz)): The appearance of a single peak at 2.86 ppm indicates the C4-R proton of NADPH has been deuterated.
117
Chapter 4
Donor-Acceptor Distance Sampling Enhances the Performance of “Better than Nature” Nicotinamide
Coenzyme Biomimetics
Authors: Alexander Geddes, Caroline E. Paul, Sam Hay, Frank Hollmann and Nigel S. Scrutton
Affiliations: BBSRC/EPSRC Centre for Synthetic Biology of Fine and Speciality Chemicals
(SYNBIOCHEM), Manchester Institute of Biology and School of Chemistry, The University of
Manchester, 131 Princess Street, Manchester, M1 7DN, United Kingdom. Department of
Biotechnology, Delft University of Technology, Julianalaan 136, 2628BL Delft, The Netherlands
Published in: Journal of the American Chemical Society (2016) 138 (35), 11089–11092 Reproduced
with permission from ACS publications
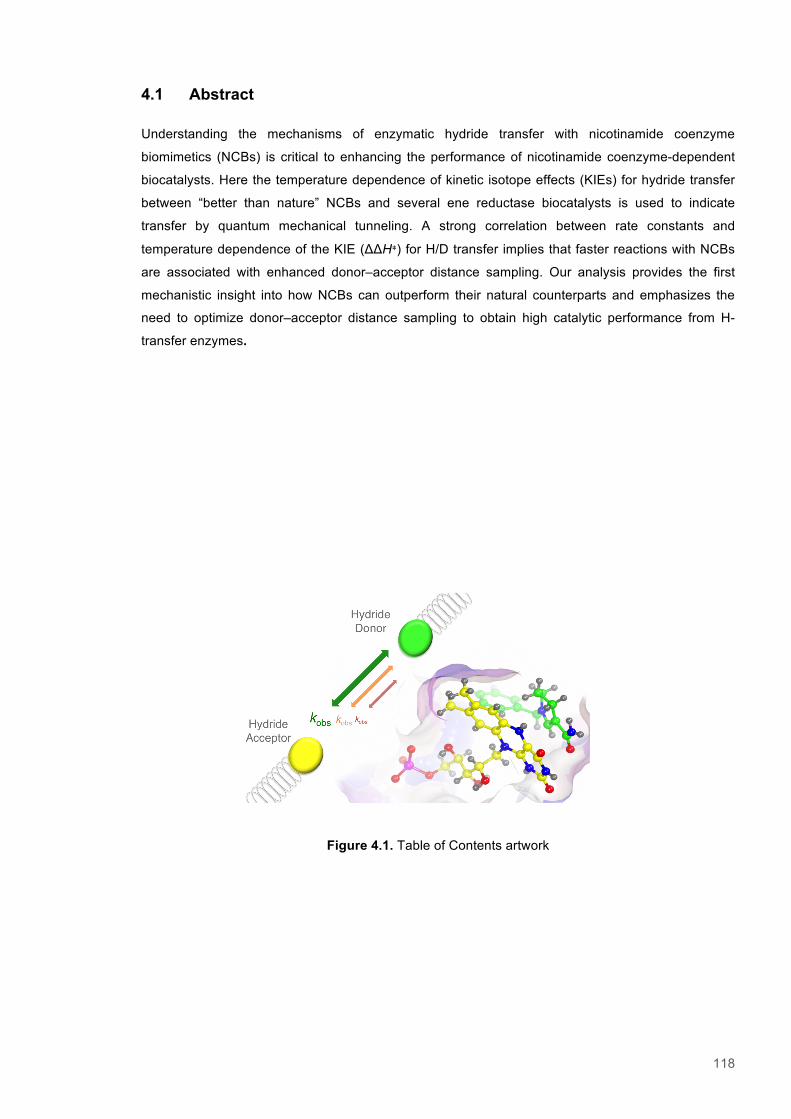
118
4.1 Abstract
Understanding the mechanisms of enzymatic hydride transfer with nicotinamide coenzyme
biomimetics (NCBs) is critical to enhancing the performance of nicotinamide coenzyme-dependent
biocatalysts. Here the temperature dependence of kinetic isotope effects (KIEs) for hydride transfer
between “better than nature” NCBs and several ene reductase biocatalysts is used to indicate
transfer by quantum mechanical tunneling. A strong correlation between rate constants and
temperature dependence of the KIE (ΔΔH⧧) for H/D transfer implies that faster reactions with NCBs
are associated with enhanced donor–acceptor distance sampling. Our analysis provides the first
mechanistic insight into how NCBs can outperform their natural counterparts and emphasizes the
need to optimize donor–acceptor distance sampling to obtain high catalytic performance from H-
transfer enzymes.
Figure 4.1. Table of Contents artwork
119
4.2 Introduction
The search for synthetic biomimetics that can replace natural nicotinamide coenzymes has been
driven by the instability and expense of NAD(P)H. This has prevented widespread use of natural
coenzymes, for example in biocatalytic manufacture of fine and speciality chemicals. The use of in
situ regeneration systems to replenish natural coenzymes during catalytic turnover (e.g. using
enzymatic, photo- and electro-chemical approaches1-6), or through the use of hydrogen borrowing
biocatalytic cascades,7-11 is one solution; an alternative is to develop synthetic nicotinamide
coenzyme biomimetics (NCBs) that are stable and can be regenerated, and that have the potential to
operate generally with biological oxidoreductases that normally function with NAD(P)H.12 The
development of NCBs that are catalytically efficient, easily synthesized, interfaced readily with
oxidoreductases and capable of in situ regeneration would be a game changer in the green
manufacture of chemicals. NCBs are now emerging that begin to satisfy these requirements and
they offer real hope for chemicals manufacture manufacture using oxidoreductases that catalyze a
wide range of chemical transformations.13
NCBs support biocatalytic turnover with many ene reductases (ERs),12,14,15 which belong to the Old
Yellow Enzyme family (EC 1.3.1.31). These are broad specificity oxidoreductases that catalyze the
asymmetric reduction of activated C=C bonds.15 Their broad specificity and ability to introduce new
stereogenic centers makes them especially attractive targets for industrial biocatalysis/chemicals
manufacture. Cognizant of these properties we have reported crystal structures of selected ER-NCB
complexes, a comprehensive analysis of the reactions catalyzed by 12 ERs with 5 synthetic NCBs,
and coenzyme analog recycling to demonstrate the overall effectiveness of these NCBs in
supporting ER-catalyzed biotransformations.14 Of particular note was the finding that some NCBs
outperformed the natural coenzymes in terms of their catalytic efficiency for enzyme reduction.14 The
origin(s) of this enhanced catalytic performance for these ‘Better than Nature’ NCBs is unknown.
This knowledge is important, not only for our understanding of the physical basis of catalysis, but
also for the development of related biomimetics with high catalytic potential to be used with related
and/or other classes of oxidoreductase biocatalysts.16-19
The ERs have been the subject of intensive study in recent years from the viewpoint of H-transfer
mechanism and the physical basis of catalysis.20,21 This has been aided in part by the availability of
high-resolution crystal structures of several ERs and substrate/ligand complexes, and the
accessibility of the reaction cycle that comprises two half-reactions (Figure 4.2).14,22-28 Consequently,
the kinetics of the complete reaction cycle have been derived with a number of ER-substrate
combinations, and in selected cases extended to obtain free energy profiles for the reactions
catalyzed. Notable has been the demonstration that hydride transfer from natural nicotinamide
coenzymes (NADH and/or NADPH) to the enzyme-bound flavin (flavin mononucleotide, FMN)
involves significant quantum mechanical tunneling (QMT).27 Further, the observation of highly
temperature-dependent kinetic isotope effects (KIEs) on a range of enzymatic H-transfer reactions
has led to the promoting vibration hypothesis, where enzyme/substrate dynamics
120
(conformational/distance sampling) are coupled to the reaction (H-transfer) coordinate29-32 – a model
that has been developed extensively in relation to ER-catalyzed H-transfer reactions.27,33,34 There are
now important questions to be addressed in the reactions of ER-catalyzed oxidation of NCBs,
especially in relation to the ‘Better than Nature’ performance of selected ERs/NCBs.14 We set out
here to ascertain the mechanistic origin of this enhanced performance with selected NCBs by
studying the isotope dependence of reaction rate as a function of temperature.20,21,28,35 The
temperature dependence of KIEs is a key descriptor for distinguishing between semi-classical and
QM mechanisms of transfer, and for uncovering the relative and inferred importance of distance
sampling/conformational coupling to the reaction coordinate.29,32

121
Figure 4.2. The catalytic cycle of PETNR and the structure of the natural coenzymes and their synthetic biomimetics. A) The reaction proceeds via a reductive half-reaction, involving hydride transfer from the C4 pro-R position of the nicotinamide moiety of NAD(P)H, or synthetic coenzymes mimics, to the FMN N5 resulting in bleached flavin absorbance at 464 nm. The cycle culminates with hydride transfer from the dihydroFMN N5 and proton transfer from solvent to the oxidative substrate. B) The structure of natural coenzymes, NADPH and NADH, alongside the structure of the synthetic coenzyme mimics 1‐benzyl‐1,4- dihydronicotinamide (mNH2) and 1‐butyl‐1,4-dihydronicotinamide (mBu).
122
4.3 Results and discussion
The temperature dependence of hydride transfer during the reductive half-reactions of the three ERs
PETNR, XenA and thermophilic OYE (TOYE) were measured with saturating concentrations of four
coenzymes and NCBs: NADH, NADPH, 1-benzyl-1,4-dihydronicotinamide (mNH2) and 1-butyl-1,4-
dihydronicotinamide (mBu) by stopped-flow spectroscopy that monitors the loss of oxidized FMN
absorbance at 464 nm. Observed rate constants are given in tables 4.2-4.7 and Eyring plots of these
data are shown in figure 4.3 (and in expanded format in figures 4.9-4.11). The observed rate
constants vary by 200-fold at 25 °C, from 2 s-1 (PETNR:NADH) to 434 s-1 (TOYE:mBu). In all 3
enzymes, NADH is the slowest substrate and mBu is the fastest. The apparent activation enthalpy
(∆H‡) varies by a factor of 2.5-fold from 22.8 ± 1.2 kJ mol-1 (TOYE:mBu) to 58.5 ± 1.8 kJ mol-1
(XenA:NADH) (Figure 4.4; tables 4.8-4.11). Some enthalpy-entropy compensation is apparent and
the apparent activation entropy (∆S‡) varies from -124 ± 2 kJ mol-1 K-1 (TOYE:mNH2) to -42 ± 6 kJ
mol-1 K-1 (XenA:NADH).
In the TOYE and XenA reactions, there is some correlation between logkobs and ∆H‡ for hydride
(Figure 4.15) and deuteride (Table 4.7) transfer, consistent with both transition state theory (TST)
and models of enzymatic nonadiabatic H-transfer (i.e. by QMT). The PETNR reactions do not show
this correlation, suggesting that the origin(s) of the reduction in activation enthalpy on the TOYE and
XenA reactions must involve the enzyme and do not solely originate from differing properties of the
coenzymes/NCBs. In all cases, there is less correlation between logkobs and ∆S‡ (Figure 4.14),
suggesting that enthalpy effects dominate the rate of reaction.
The primary KIEs on these 12 reactions were next measured using (R)-[4-2H]-NADH, (R)-[4-2H]-
NADPH, [4-2H2]-mNH2 and [4-2H2]-mBu (Figure 4.3). Dideuterated NCBs were synthesized by
sequential dithionite reduction, chloranil oxidation and re-reduction with dithionite in D2O as
described (see Supporting Information). NMR indicated the NCBs were 98% dideuterated at C4.
There is relatively little variation in the magnitude of the observed KIE at 25 °C (Figure 4.3). All KIEs
fall within the range of 7–9, except those measured with XenA and the natural coenzymes: KIE =
4.74 ± 0.13 and 5.09 ± 0.48 with NADH with NADPH, respectively. The α-secondary deuterium KIEs
have been previously measured on several OYE ERs including PETNR. The observed KIEs on the
PETNR reactions with (S)-[4-2H]-NADH and (S)-[4-2H]-NADPH are 1.16 – 1.20 and are not
significantly temperature dependent.36 It is unlikely that the α-2o KIEs on the reactions of the ERs
with mNH2 or mBu will be much larger than 1.20, so the observed KIEs measured with dideuterated
mNH2 and mBu are unlikely to exceed the primary KIE by more than 20%.
The temperature-dependence of the KIEs varies widely from 0–18 kJ mol-1 (PETNR:NADH and
XenA:mBu, respectively; Figures 4.3, 4.5, figures 4.12-4.13). Five combinations of enzyme/reductant
(XenA:mBu, TOYE:mBu, PETNR:mBu, XenA:mNH2 and PETNR:mNH2) have reactions with ∆∆H‡ >
10 kJ mol-1. This is good evidence for H transfer by significant QMT as such large values of ∆∆H‡ are

123
not consistent with either TST or Bell-type models of H-transfer where QMT occurs near the
transition state.37,38
In all three enzymes, there is some correlation between observed rate constant and ∆∆H‡ (Figure
4.5), with the faster reactions typically having more temperature-dependent KIEs. This suggests that
whatever gives rise to the temperature dependence of the KIEs – e.g. conformation/distance
sampling within the promoting vibrations hypothesis – may also enhance the rate of H-transfer/FMN
reduction in the three ERs investigated here. As the most temperature dependent KIEs are observed
on reactions involving NCBs, an alternative explanation is that the differences in kinetics arise
through chemical differences between the coenzymes and NCBs.
Density function theory models of NAD(P)H and the two NCBs show that while the C4-H stretching
frequencies and gas phase bond dissociation energies (Figure 4.17) are very similar between NCBs
and natural coenzymes, the methyl benzene and butyl (“tail”) moieties of the NCBs having greater
electron withdrawing properties than the (2’-phospho)adenosine diphosphate ribose moieties of
NAD(P)H (Table 4.12). This is expected to make the NCBs easier to oxidize due to stabilization of
the positive charge buildup in the oxidized species. The redox potentials of NAD(P)H, mNH2 and the
mBu analog 1‐propyl‐1,4-dihydronicotinamide have been reported.13,39 These are in qualitative
agreement with our DFT calculations (Table 4.12) and thus the likely order of reduction potentials
are: NADPH = NADH > mNH2 > mBu. Consistent with this, hydride self exchange reactions in
acetonitrile show the reactivity order mBu > mNH2 > NAD(P)H analogs.40 The reduced reduction
potentials/increased driving force in the NCBs relative to natural coenzymes may explain some of the
observed rate enhancement of the ER-NCB reactions. However, the reduction potentials of NADH
and NADPH are not significantly different, yet the reactions of all three ERs with NADPH are 10-20-
fold faster than with NADH. Further, in both PETNR and XenA, NADPH reacts as fast, or faster, than
mNH2, despite the likely larger driving force of the mNH2 reaction. Modest changes to the reaction
driving force are also not expected to alter the magnitude of the KIE,31,41 so the kinetic differences
observed between natural and biomimetic coenzymes do not appear to solely arise through differing
reaction driving force.
ER active sites are evolutionarily constrained by the necessity to bind both oxidative and reductive
substrates within the same active site region, thus the evolution of improved NAD(P)H binding may
have been constrained to the binding of the coenzyme 'tail' on the periphery of the active site,
beyond the reach of oxidative substrates.22-26 While this allows viable coenzyme capture, the Km and
KS values are relatively large (cf. other flavoproteins where the adenosyl ribose moiety of the
coenzyme is a key factor in binding).42 We hypothesize that by removing or reducing the size of the
‘tail’, NCBs can bind and react in a manner more similar to the oxidative substrates of ERs. These
differences must be subtle as X-ray crystal structures of NCB-and coenzyme-bound ERs show the
nicotinamide moieties to be essentially superimposed (Figures 4.18-4.19).
124
We note that the NCBs typically have lower activation enthalpies compared to their natural
counterparts (Figure 4.4). However this comes at the expense of higher activation entropies, which
suggests that the enzyme–NCB complexes may be more disordered than the physiological enzyme–
coenzyme complex. The temperature dependence of the primary KIE is often interpreted in terms of
environmental coupling between the protein and reaction coordinate, e.g. via promoting vibrations.32
Within this framework, thermally activated distance sampling of the donor-acceptor coordinate (i.e.
nicotinamide C4 to FMN N5) is reflected in the temperature dependence of the KIE. Others have
shown in variant enzymes that the reaction is often slower and has a more strongly temperature
dependent KIE than in wild-type enzymes.30,43,44 However, we have previously shown the opposite
behavior in PETNR28 and this is now further corroborated in reactions with NCBs. Together, this
work shows that distance sampling may play both a compensatory (i.e. in variant enzymes) and
promoting role and this is likely to be enzyme-specific.
In conclusion we have shown a correlation between the rates of hydride transfer and the temperature
dependence of KIEs that suggest donor-acceptor sampling is a factor in enhancing the performance
of NCBs beyond that observed by the natural nicotinamide coenzymes. Further efforts to optimize
the performance of NCBs with ERs and other oxidoreductases that take into account the importance
of QMT and donor-acceptor sampling are currently underway.
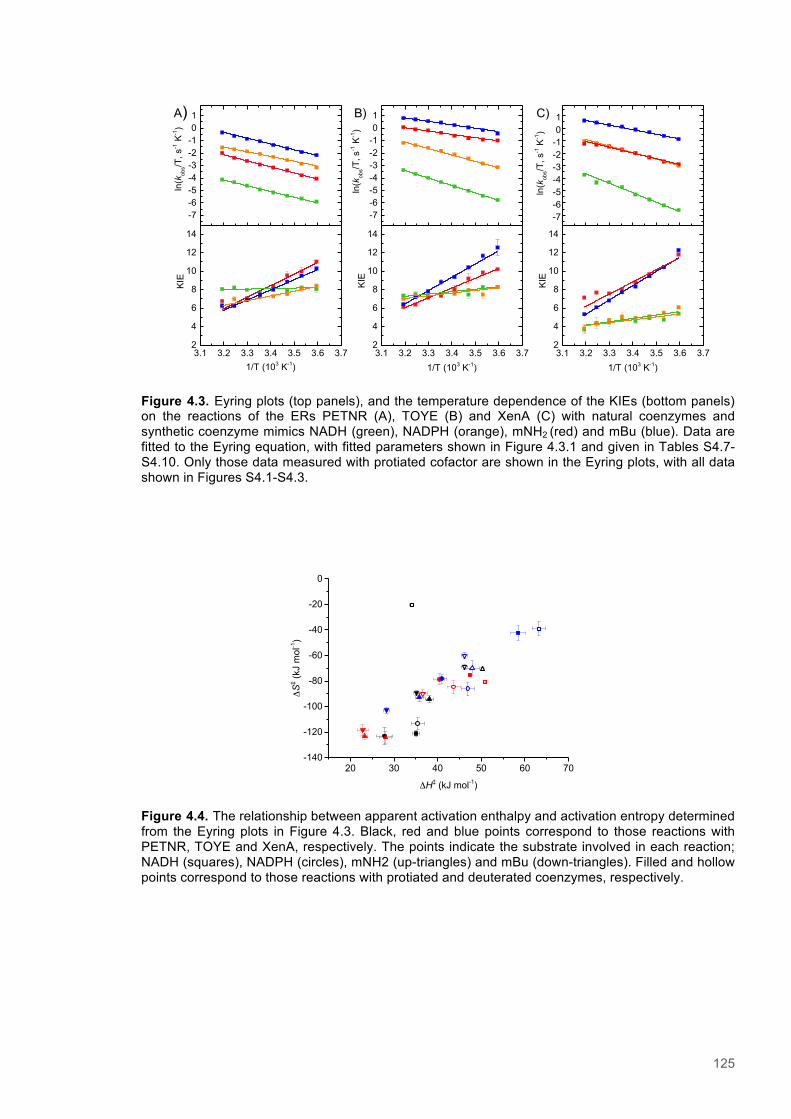
125
-7-6-5-4-3-2-101
3.1 3.2 3.3 3.4 3.5 3.6 3.72
4
6
8
10
12
14
-7-6-5-4-3-2-101
3.1 3.2 3.3 3.4 3.5 3.6 3.72
4
6
8
10
12
14
-7-6-5-4-3-2-101
3.1 3.2 3.3 3.4 3.5 3.6 3.72
4
6
8
10
12
14
ln(k
obs/T
, s-1 K
-1)
KIE
1/T (103 K-1)
ln(k
obs/T
, s-1 K
-1)
KIE
1/T (103 K-1)
ln
(kob
s/T, s
-1 K
-1)
KIE
1/T (103 K-1)
A) B) C)
Figure 4.3. Eyring plots (top panels), and the temperature dependence of the KIEs (bottom panels) on the reactions of the ERs PETNR (A), TOYE (B) and XenA (C) with natural coenzymes and synthetic coenzyme mimics NADH (green), NADPH (orange), mNH2 (red) and mBu (blue). Data are fitted to the Eyring equation, with fitted parameters shown in Figure 4.3.1 and given in Tables S4.7-S4.10. Only those data measured with protiated cofactor are shown in the Eyring plots, with all data shown in Figures S4.1-S4.3.
20 30 40 50 60 70-140
-120
-100
-80
-60
-40
-20
0
ΔS
‡ (kJ
mol
-1)
ΔH‡ (kJ mol-1)
Figure 4.4. The relationship between apparent activation enthalpy and activation entropy determined from the Eyring plots in Figure 4.3. Black, red and blue points correspond to those reactions with PETNR, TOYE and XenA, respectively. The points indicate the substrate involved in each reaction; NADH (squares), NADPH (circles), mNH2 (up-triangles) and mBu (down-triangles). Filled and hollow points correspond to those reactions with protiated and deuterated coenzymes, respectively.

126
Figure 4.5. The relationship between ∆H‡H (upper panel; equivalent plot for ∆H‡D given in Figure S4.7) and ∆∆H‡ (∆∆H‡ = ∆H‡D – ∆H‡H; lower panel) and the observed rate constant for each hydride transfer reaction at 25 °C. Black, red and blue points correspond to those reactions with PETNR, TOYE and XenA, respectively. The points indicate the substrate involved in each reaction; NADH (squares), NADPH (circles), mNH2 (up-triangles) and mBu (down-triangles).
0
10
20
30
40
50
60
70
0 1 2 3 4 5 6 7-5
0
5
10
15
20
ΔH
‡H (k
J m
ol-1)
ΔΔH
‡ (kJ
mol
-1)
ln(kobs)
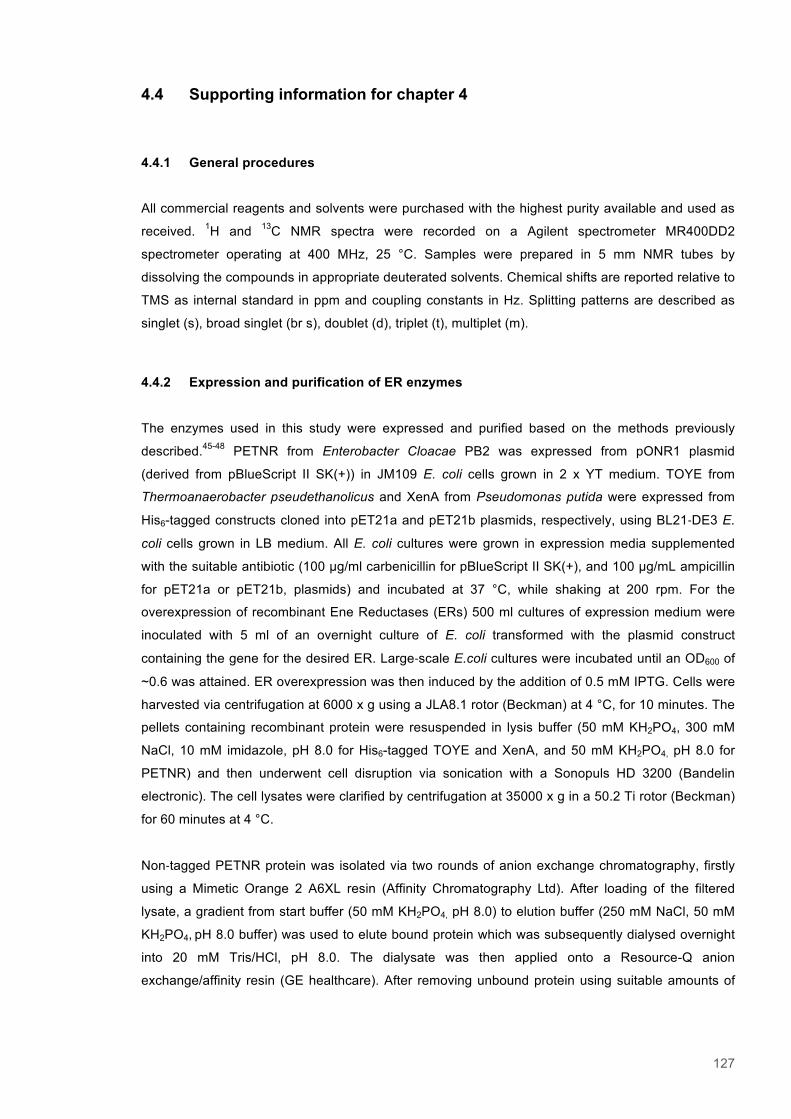
127
4.4 Supporting information for chapter 4
4.4.1 General procedures
All commercial reagents and solvents were purchased with the highest purity available and used as
received. 1H and 13C NMR spectra were recorded on a Agilent spectrometer MR400DD2
spectrometer operating at 400 MHz, 25 °C. Samples were prepared in 5 mm NMR tubes by
dissolving the compounds in appropriate deuterated solvents. Chemical shifts are reported relative to
TMS as internal standard in ppm and coupling constants in Hz. Splitting patterns are described as
singlet (s), broad singlet (br s), doublet (d), triplet (t), multiplet (m).
4.4.2 Expression and purification of ER enzymes
The enzymes used in this study were expressed and purified based on the methods previously
described.45-48 PETNR from Enterobacter Cloacae PB2 was expressed from pONR1 plasmid
(derived from pBlueScript II SK(+)) in JM109 E. coli cells grown in 2 x YT medium. TOYE from
Thermoanaerobacter pseudethanolicus and XenA from Pseudomonas putida were expressed from
His6-tagged constructs cloned into pET21a and pET21b plasmids, respectively, using BL21‐DE3 E.
coli cells grown in LB medium. All E. coli cultures were grown in expression media supplemented
with the suitable antibiotic (100 µg/ml carbenicillin for pBlueScript II SK(+), and 100 µg/mL ampicillin
for pET21a or pET21b, plasmids) and incubated at 37 °C, while shaking at 200 rpm. For the
overexpression of recombinant Ene Reductases (ERs) 500 ml cultures of expression medium were
inoculated with 5 ml of an overnight culture of E. coli transformed with the plasmid construct
containing the gene for the desired ER. Large‐scale E.coli cultures were incubated until an OD600 of
~0.6 was attained. ER overexpression was then induced by the addition of 0.5 mM IPTG. Cells were
harvested via centrifugation at 6000 x g using a JLA8.1 rotor (Beckman) at 4 °C, for 10 minutes. The
pellets containing recombinant protein were resuspended in lysis buffer (50 mM KH2PO4, 300 mM
NaCl, 10 mM imidazole, pH 8.0 for His6-tagged TOYE and XenA, and 50 mM KH2PO4, pH 8.0 for
PETNR) and then underwent cell disruption via sonication with a Sonopuls HD 3200 (Bandelin
electronic). The cell lysates were clarified by centrifugation at 35000 x g in a 50.2 Ti rotor (Beckman)
for 60 minutes at 4 °C.
Non‐tagged PETNR protein was isolated via two rounds of anion exchange chromatography, firstly
using a Mimetic Orange 2 A6XL resin (Affinity Chromatography Ltd). After loading of the filtered
lysate, a gradient from start buffer (50 mM KH2PO4, pH 8.0) to elution buffer (250 mM NaCl, 50 mM
KH2PO4, pH 8.0 buffer) was used to elute bound protein which was subsequently dialysed overnight
into 20 mM Tris/HCl, pH 8.0. The dialysate was then applied onto a Resource-Q anion
exchange/affinity resin (GE healthcare). After removing unbound protein using suitable amounts of

128
wash buffer (20 mM Tris/HCl, pH 8.0), the elution of bound protein was performed using a gradient
from wash buffer to elution buffer (50 mM NaCl, 20 mM Tris/HCl, pH 8.0).
His6-tagged TOYE and XenA proteins were purified via Ni‐NTA affinity chromatography using Ni-
NTA agarose resin (Qiagen). The Cell lysate was loaded onto a column preequilibrated with start
buffer (50 mM KH2PO4, 300 mM NaCl, 10 mM imidazole, pH 8.0), which was then washed with
sufficient amounts of wash buffer (50 mM KH2PO4, 300 mM NaCl, 25 mM imidazole, pH 8.0). The
bound protein was retrieved using elution buffer (50 mM KH2PO4, 300 mM NaCl, 200 mM imidazole,
pH 8.0). All purified protein extracts were dialysed into storage buffer (50 mM KH2PO4, pH 7.0),
concentrated using a Vivaspin-20 concentrator, Molecular Weight Cut-Off (MWCO) = 10 kDa
(Sartorious) and stored at -80 °C.
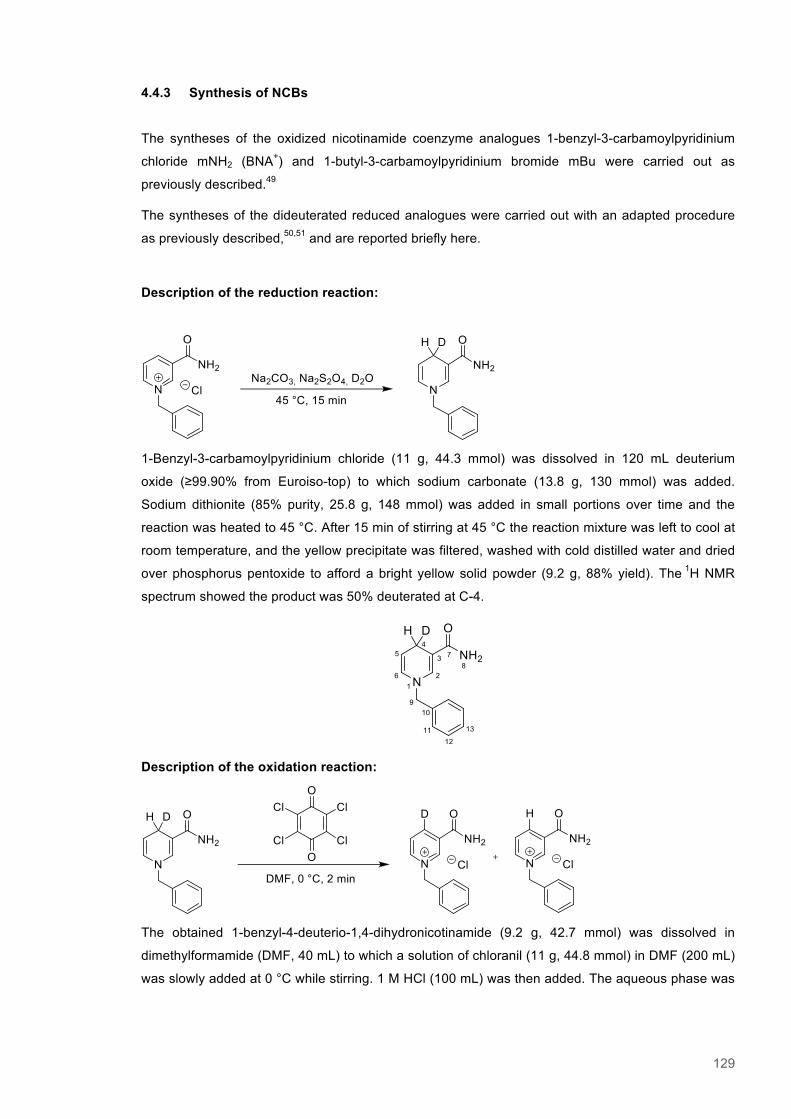
129
4.4.3 Synthesis of NCBs
The syntheses of the oxidized nicotinamide coenzyme analogues 1-benzyl-3-carbamoylpyridinium
chloride mNH2 (BNA+) and 1-butyl-3-carbamoylpyridinium bromide mBu were carried out as
previously described.49
The syntheses of the dideuterated reduced analogues were carried out with an adapted procedure
as previously described,50,51 and are reported briefly here.
Description of the reduction reaction:
1-Benzyl-3-carbamoylpyridinium chloride (11 g, 44.3 mmol) was dissolved in 120 mL deuterium
oxide (≥99.90% from Euroiso-top) to which sodium carbonate (13.8 g, 130 mmol) was added.
Sodium dithionite (85% purity, 25.8 g, 148 mmol) was added in small portions over time and the
reaction was heated to 45 °C. After 15 min of stirring at 45 °C the reaction mixture was left to cool at
room temperature, and the yellow precipitate was filtered, washed with cold distilled water and dried
over phosphorus pentoxide to afford a bright yellow solid powder (9.2 g, 88% yield). The 1H NMR
spectrum showed the product was 50% deuterated at C-4.
Description of the oxidation reaction:
The obtained 1-benzyl-4-deuterio-1,4-dihydronicotinamide (9.2 g, 42.7 mmol) was dissolved in
dimethylformamide (DMF, 40 mL) to which a solution of chloranil (11 g, 44.8 mmol) in DMF (200 mL)
was slowly added at 0 °C while stirring. 1 M HCl (100 mL) was then added. The aqueous phase was
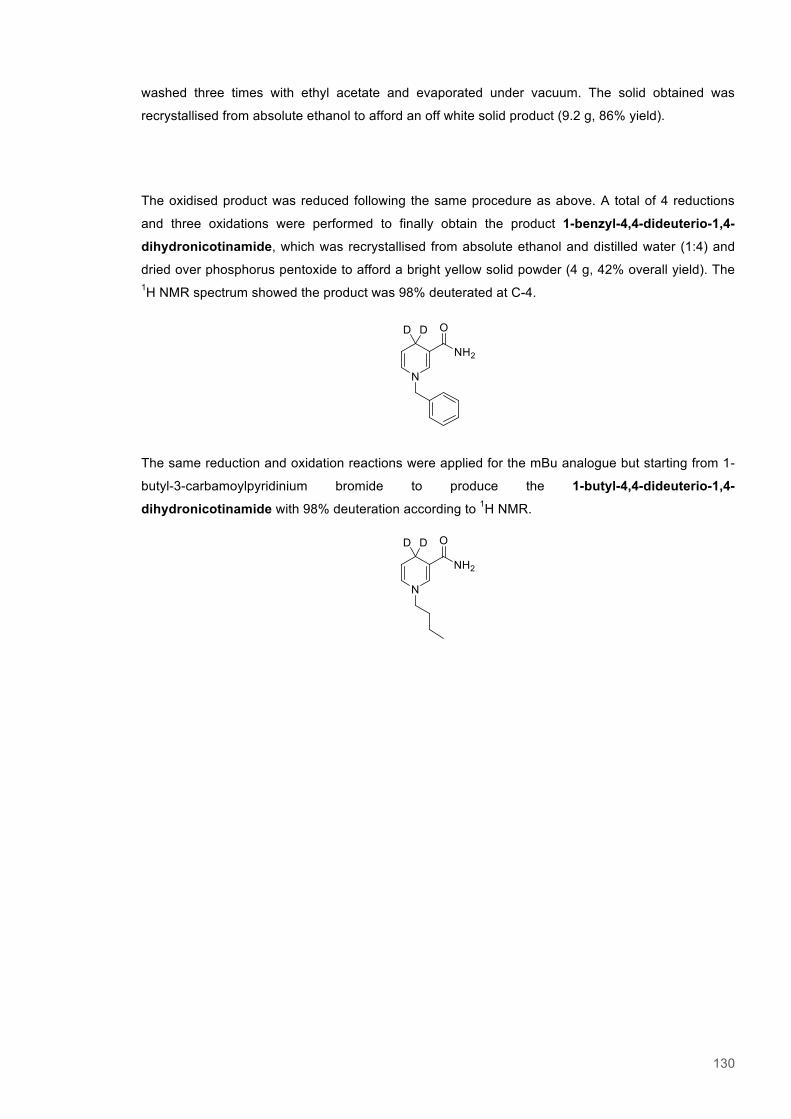
130
washed three times with ethyl acetate and evaporated under vacuum. The solid obtained was
recrystallised from absolute ethanol to afford an off white solid product (9.2 g, 86% yield).
The oxidised product was reduced following the same procedure as above. A total of 4 reductions
and three oxidations were performed to finally obtain the product 1-benzyl-4,4-dideuterio-1,4-
dihydronicotinamide, which was recrystallised from absolute ethanol and distilled water (1:4) and
dried over phosphorus pentoxide to afford a bright yellow solid powder (4 g, 42% overall yield). The
1H NMR spectrum showed the product was 98% deuterated at C-4.
The same reduction and oxidation reactions were applied for the mBu analogue but starting from 1-
butyl-3-carbamoylpyridinium bromide to produce the 1-butyl-4,4-dideuterio-1,4-
dihydronicotinamide with 98% deuteration according to 1H NMR.
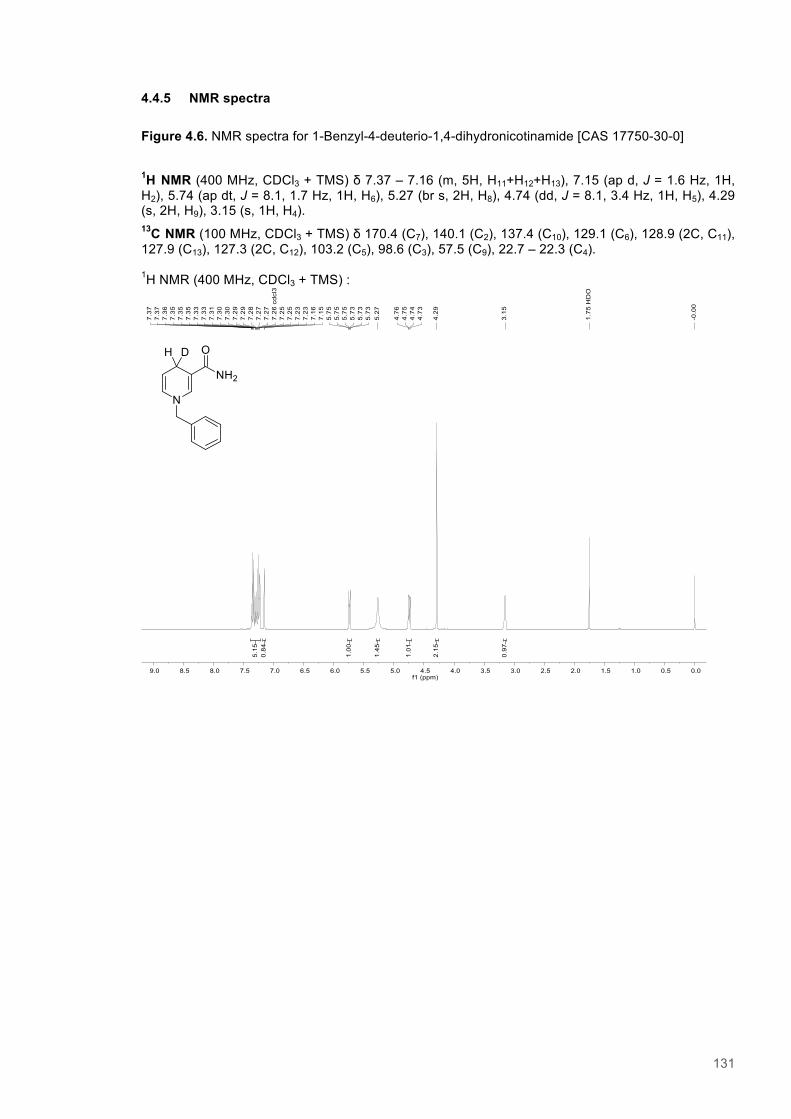
131
4.4.5 NMR spectra Figure 4.6. NMR spectra for 1-Benzyl-4-deuterio-1,4-dihydronicotinamide [CAS 17750-30-0]
1H NMR (400 MHz, CDCl3 + TMS) δ 7.37 – 7.16 (m, 5H, H11+H12+H13), 7.15 (ap d, J = 1.6 Hz, 1H, H2), 5.74 (ap dt, J = 8.1, 1.7 Hz, 1H, H6), 5.27 (br s, 2H, H8), 4.74 (dd, J = 8.1, 3.4 Hz, 1H, H5), 4.29 (s, 2H, H9), 3.15 (s, 1H, H4). 13C NMR (100 MHz, CDCl3 + TMS) δ 170.4 (C7), 140.1 (C2), 137.4 (C10), 129.1 (C6), 128.9 (2C, C11), 127.9 (C13), 127.3 (2C, C12), 103.2 (C5), 98.6 (C3), 57.5 (C9), 22.7 – 22.3 (C4). 1H NMR (400 MHz, CDCl3 + TMS) :
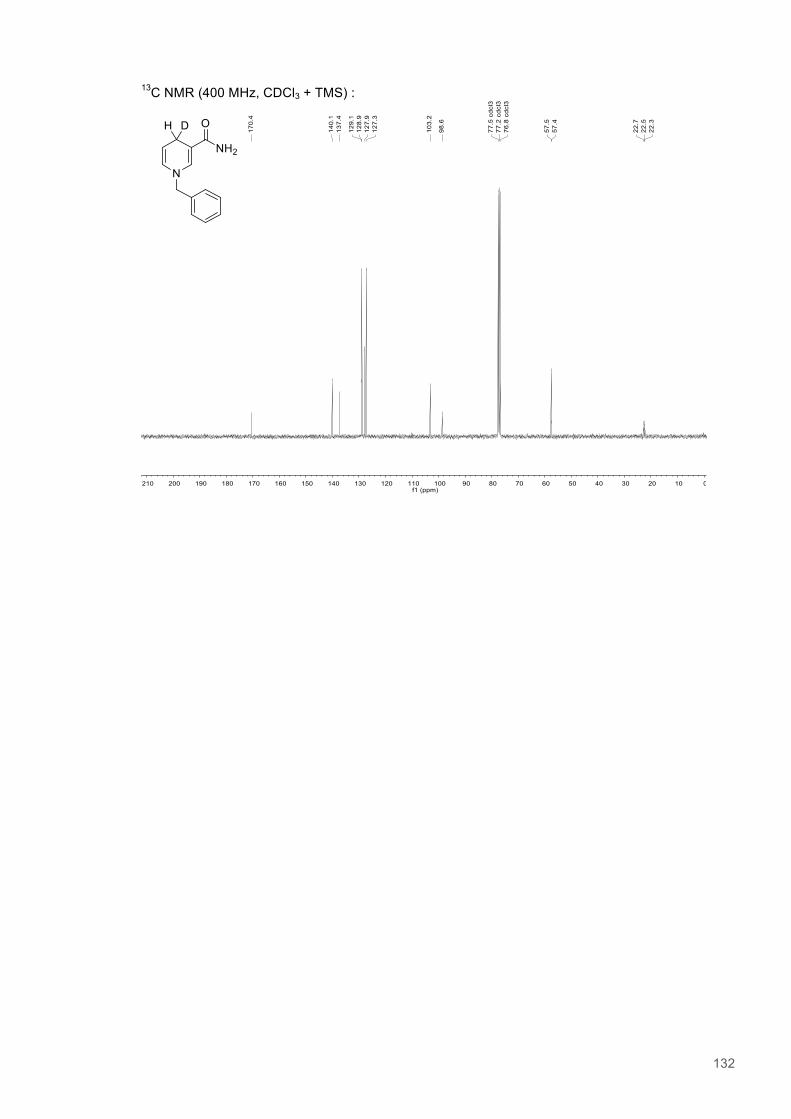
132
13C NMR (400 MHz, CDCl3 + TMS) :

133
Figure 4.7. NMR spectra for1-Benzyl-4,4-dideuterio-1,4-dihydronicotinamide [CAS 601794- 3] (D-mNH2)
1H NMR (400 MHz, CDCl3 + TMS) δ 7.40 – 7.21 (m, 5H), 7.16 (d, 1H), 5.75 (d, J = 8.1 Hz, 1H), 5.28 (br s, 2H), 4.74 (d, J = 8.0 Hz, 1H), 4.29 (s, 2H). 13C NMR (100 MHz, CDCl3 + TMS) δ 170.3, 140.2, 137.4, 129.18, 129.16, 129.0, 127.9, 127.3, 103.1, 57.6, 57.5.
1H NMR (400 MHz, DMSO-d6) δ 7.39 – 7.35 (m, 2H), 7.30 – 7.27 (m, 3H), 6.99 (d, 1H), 6.55 (s, 2H), 5.93 (dd, J = 8.0, 1.7 Hz, 1H), 4.60 (d, J = 8.1 Hz, 1H), 4.31 (s, 2H). 13C NMR (100 MHz, DMSO-d6) δ 169.1, 138.6, 138.0, 129.82, 129.79, 128.6, 127.4, 127.3, 101.68, 101.66, 100.2, 100.1, 55.9, 55.8.
1H NMR (400 MHz, CDCl3 + TMS) :
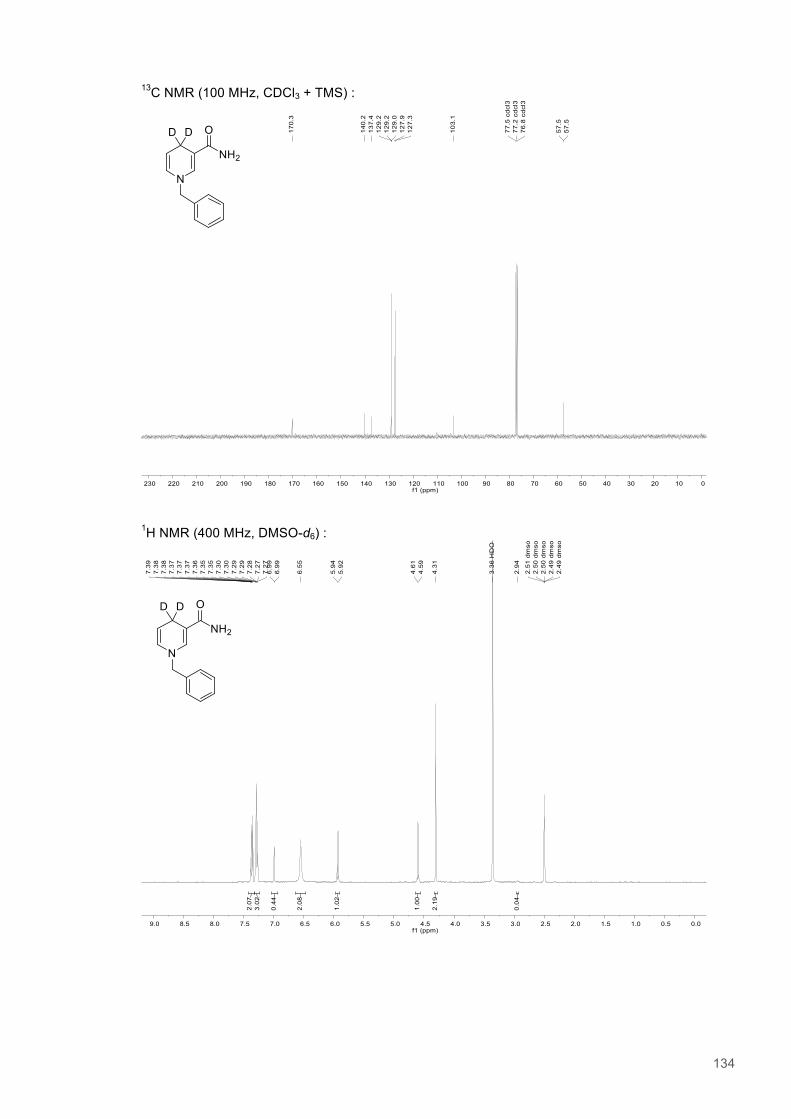
134
13C NMR (100 MHz, CDCl3 + TMS) :
1H NMR (400 MHz, DMSO-d6) :
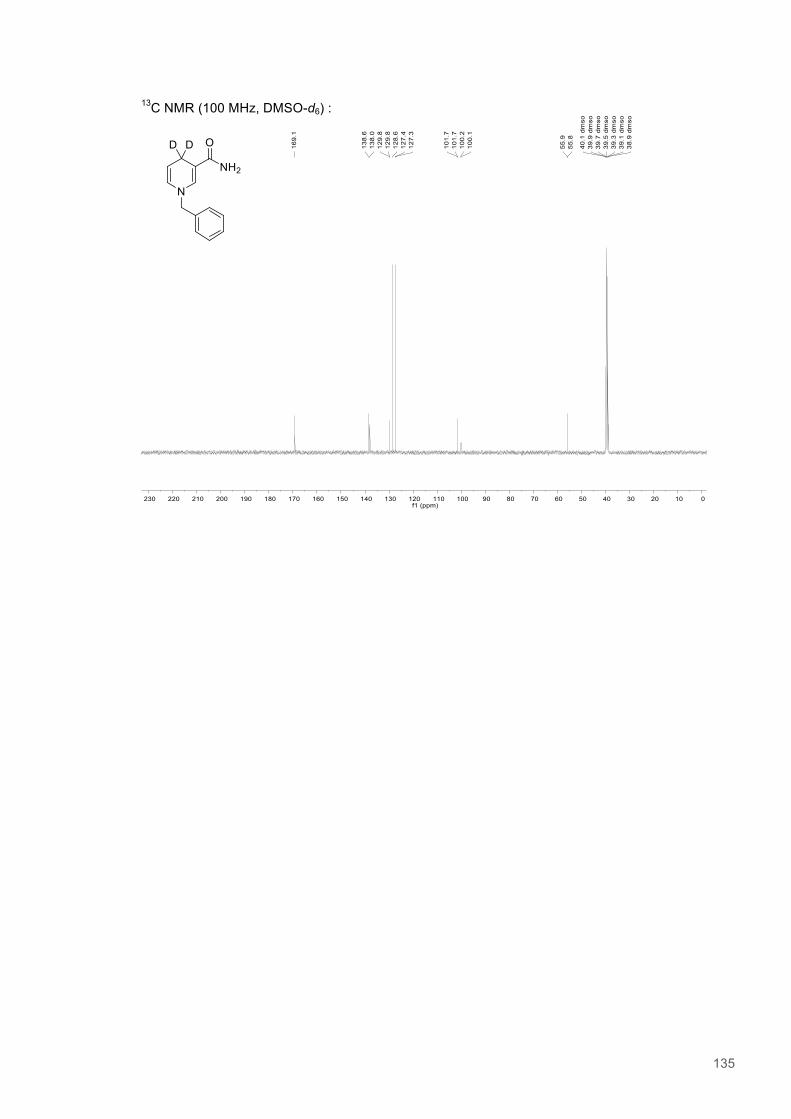
135
13C NMR (100 MHz, DMSO-d6) :
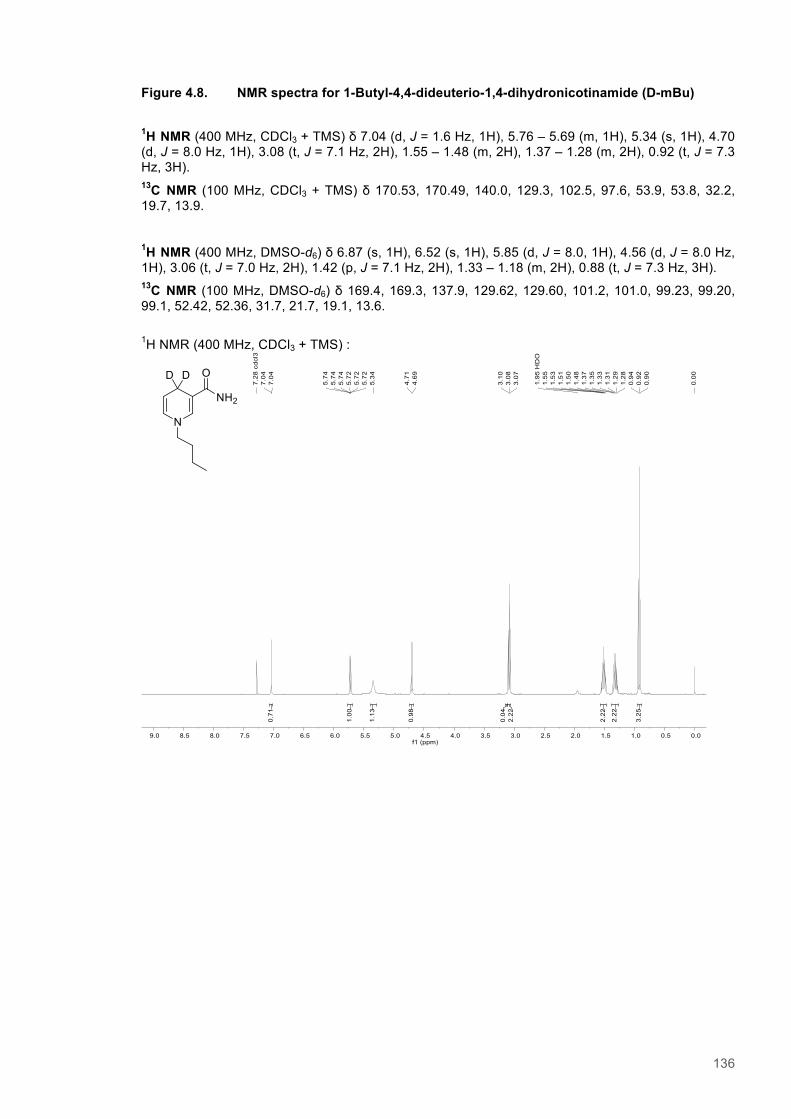
136
Figure 4.8. NMR spectra for 1-Butyl-4,4-dideuterio-1,4-dihydronicotinamide (D-mBu)
1H NMR (400 MHz, CDCl3 + TMS) δ 7.04 (d, J = 1.6 Hz, 1H), 5.76 – 5.69 (m, 1H), 5.34 (s, 1H), 4.70 (d, J = 8.0 Hz, 1H), 3.08 (t, J = 7.1 Hz, 2H), 1.55 – 1.48 (m, 2H), 1.37 – 1.28 (m, 2H), 0.92 (t, J = 7.3 Hz, 3H). 13C NMR (100 MHz, CDCl3 + TMS) δ 170.53, 170.49, 140.0, 129.3, 102.5, 97.6, 53.9, 53.8, 32.2, 19.7, 13.9.
1H NMR (400 MHz, DMSO-d6) δ 6.87 (s, 1H), 6.52 (s, 1H), 5.85 (d, J = 8.0, 1H), 4.56 (d, J = 8.0 Hz, 1H), 3.06 (t, J = 7.0 Hz, 2H), 1.42 (p, J = 7.1 Hz, 2H), 1.33 – 1.18 (m, 2H), 0.88 (t, J = 7.3 Hz, 3H). 13C NMR (100 MHz, DMSO-d6) δ 169.4, 169.3, 137.9, 129.62, 129.60, 101.2, 101.0, 99.23, 99.20, 99.1, 52.42, 52.36, 31.7, 21.7, 19.1, 13.6.
1H NMR (400 MHz, CDCl3 + TMS) :
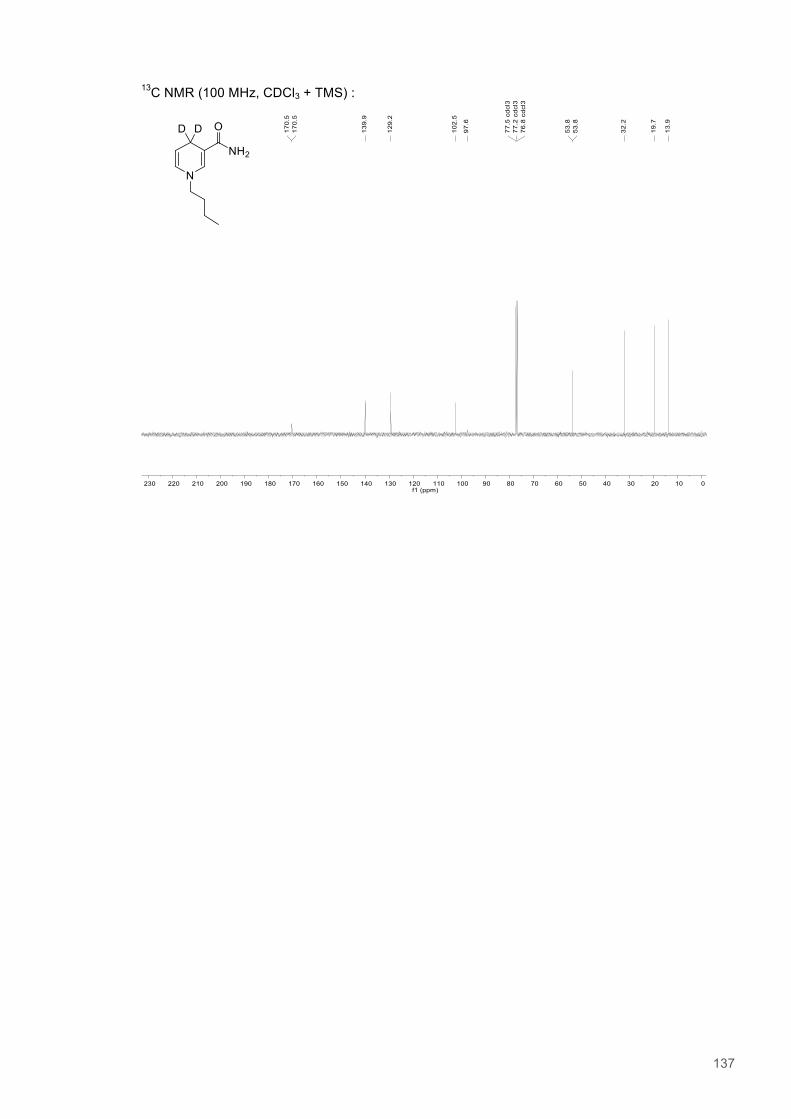
137
13C NMR (100 MHz, CDCl3 + TMS) :

138
1H NMR (400 MHz, DMSO-d6) :
13C NMR (100 MHz, DMSO-d6) :
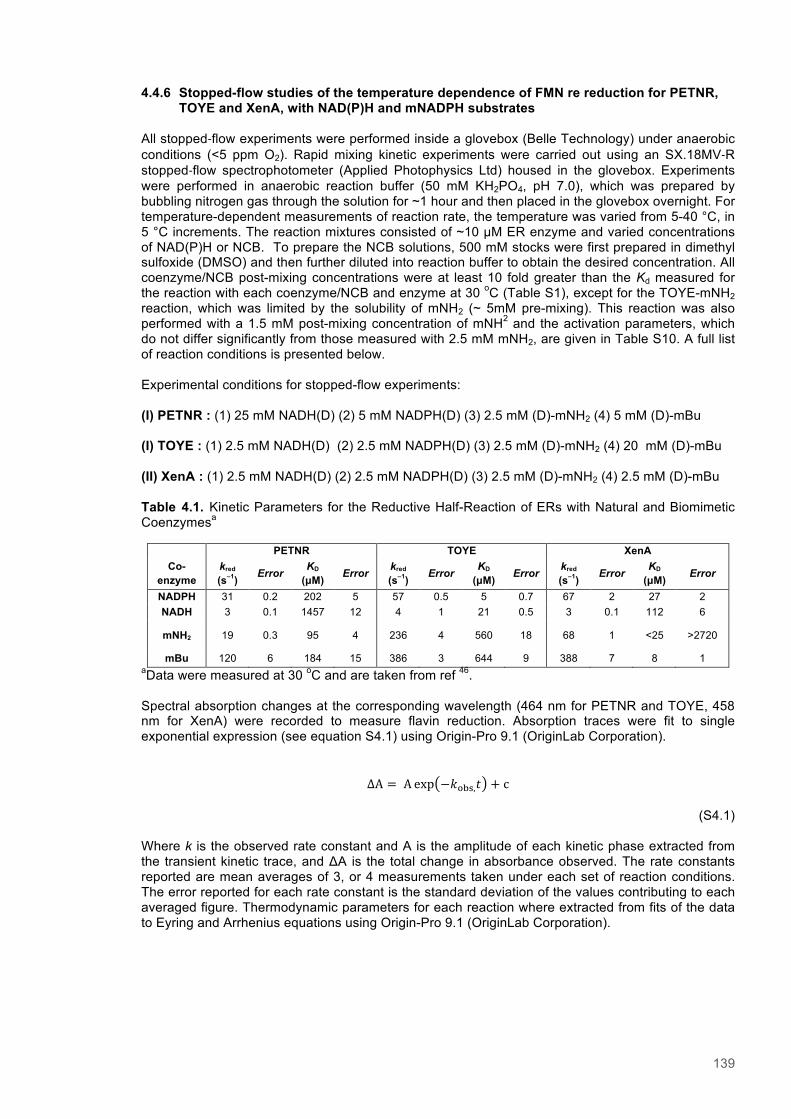
139
4.4.6 Stopped-flow studies of the temperature dependence of FMN re reduction for PETNR, TOYE and XenA, with NAD(P)H and mNADPH substrates
All stopped‐flow experiments were performed inside a glovebox (Belle Technology) under anaerobic conditions (<5 ppm O2). Rapid mixing kinetic experiments were carried out using an SX.18MV‐R stopped‐flow spectrophotometer (Applied Photophysics Ltd) housed in the glovebox. Experiments were performed in anaerobic reaction buffer (50 mM KH2PO4, pH 7.0), which was prepared by bubbling nitrogen gas through the solution for ~1 hour and then placed in the glovebox overnight. For temperature-dependent measurements of reaction rate, the temperature was varied from 5-40 °C, in 5 °C increments. The reaction mixtures consisted of ~10 µM ER enzyme and varied concentrations of NAD(P)H or NCB. To prepare the NCB solutions, 500 mM stocks were first prepared in dimethyl sulfoxide (DMSO) and then further diluted into reaction buffer to obtain the desired concentration. All coenzyme/NCB post-mixing concentrations were at least 10 fold greater than the Kd measured for the reaction with each coenzyme/NCB and enzyme at 30 oC (Table S1), except for the TOYE-mNH2 reaction, which was limited by the solubility of mNH2 (~ 5mM pre-mixing). This reaction was also performed with a 1.5 mM post-mixing concentration of mNH2 and the activation parameters, which do not differ significantly from those measured with 2.5 mM mNH2, are given in Table S10. A full list of reaction conditions is presented below. Experimental conditions for stopped-flow experiments: (I) PETNR : (1) 25 mM NADH(D) (2) 5 mM NADPH(D) (3) 2.5 mM (D)-mNH2 (4) 5 mM (D)-mBu (I) TOYE : (1) 2.5 mM NADH(D) (2) 2.5 mM NADPH(D) (3) 2.5 mM (D)-mNH2 (4) 20 mM (D)-mBu (II) XenA : (1) 2.5 mM NADH(D) (2) 2.5 mM NADPH(D) (3) 2.5 mM (D)-mNH2 (4) 2.5 mM (D)-mBu Table 4.1. Kinetic Parameters for the Reductive Half-Reaction of ERs with Natural and Biomimetic Coenzymesa
PETNR TOYE XenA Co-
enzyme kred (s–1) Error KD
(µM) Error kred (s–1) Error KD
(µM) Error kred (s–1) Error KD
(µM) Error
NADPH 31 0.2 202 5 57 0.5 5 0.7 67 2 27 2 NADH 3 0.1 1457 12 4 1 21 0.5 3 0.1 112 6
mNH2 19 0.3 95 4 236 4 560 18 68 1 <25 >2720
mBu 120 6 184 15 386 3 644 9 388 7 8 1 aData were measured at 30 oC and are taken from ref 46. Spectral absorption changes at the corresponding wavelength (464 nm for PETNR and TOYE, 458 nm for XenA) were recorded to measure flavin reduction. Absorption traces were fit to single exponential expression (see equation S4.1) using Origin-Pro 9.1 (OriginLab Corporation).
∆A = A exp −!!"#,! + c
(S4.1)
Where k is the observed rate constant and A is the amplitude of each kinetic phase extracted from the transient kinetic trace, and ΔA is the total change in absorbance observed. The rate constants reported are mean averages of 3, or 4 measurements taken under each set of reaction conditions. The error reported for each rate constant is the standard deviation of the values contributing to each averaged figure. Thermodynamic parameters for each reaction where extracted from fits of the data to Eyring and Arrhenius equations using Origin-Pro 9.1 (OriginLab Corporation).
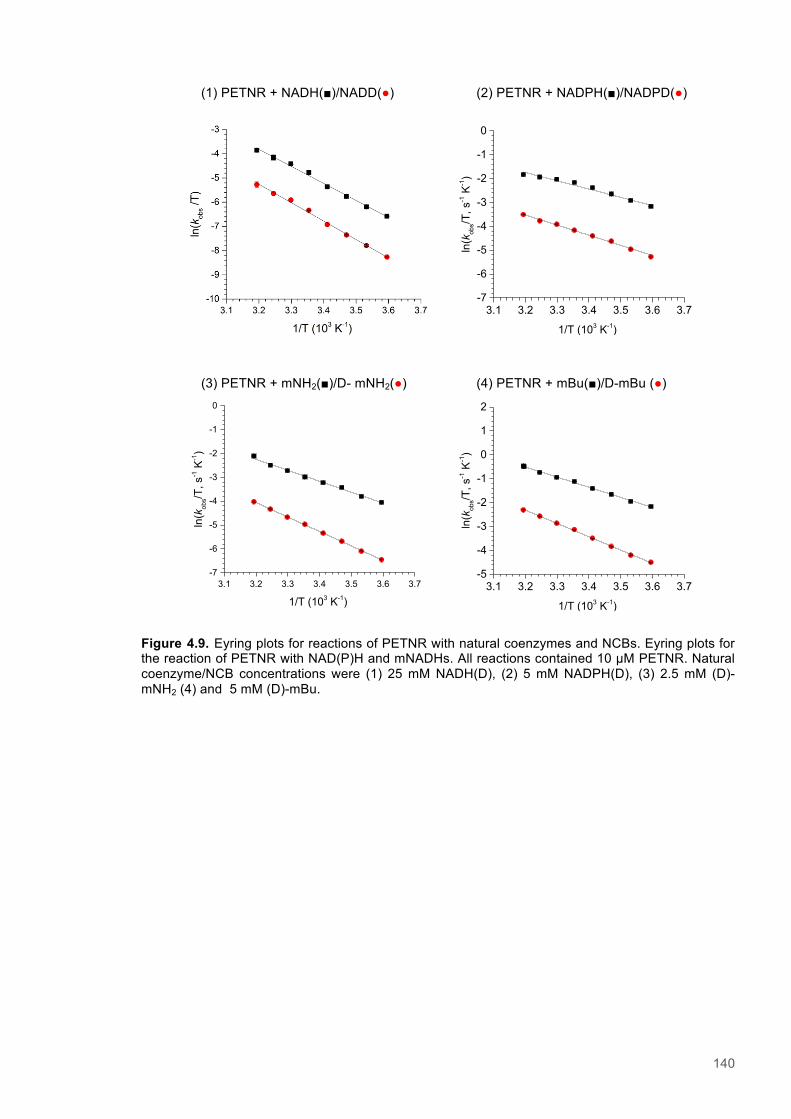
140
(1) PETNR + NADH(■)/NADD(●) (2) PETNR + NADPH(■)/NADPD(●)
(3) PETNR + mNH2(■)/D- mNH2(●) (4) PETNR + mBu(■)/D-mBu (●)
Figure 4.9. Eyring plots for reactions of PETNR with natural coenzymes and NCBs. Eyring plots for the reaction of PETNR with NAD(P)H and mNADHs. All reactions contained 10 µM PETNR. Natural coenzyme/NCB concentrations were (1) 25 mM NADH(D), (2) 5 mM NADPH(D), (3) 2.5 mM (D)- mNH2 (4) and 5 mM (D)-mBu.
3.1 3.2 3.3 3.4 3.5 3.6 3.7-5
-4
-3
-2
-1
0
1
2
ln(k
obs/T
, s-1 K
-1)
1/T (103 K-1)
3.1 3.2 3.3 3.4 3.5 3.6 3.7-7
-6
-5
-4
-3
-2
-1
0
ln(k
obs/T
, s-1 K
-1)
1/T (103 K-1)
3.1 3.2 3.3 3.4 3.5 3.6 3.7-7
-6
-5
-4
-3
-2
-1
0
ln(k
obs/T
, s-1 K
-1)
1/T (103 K-1)
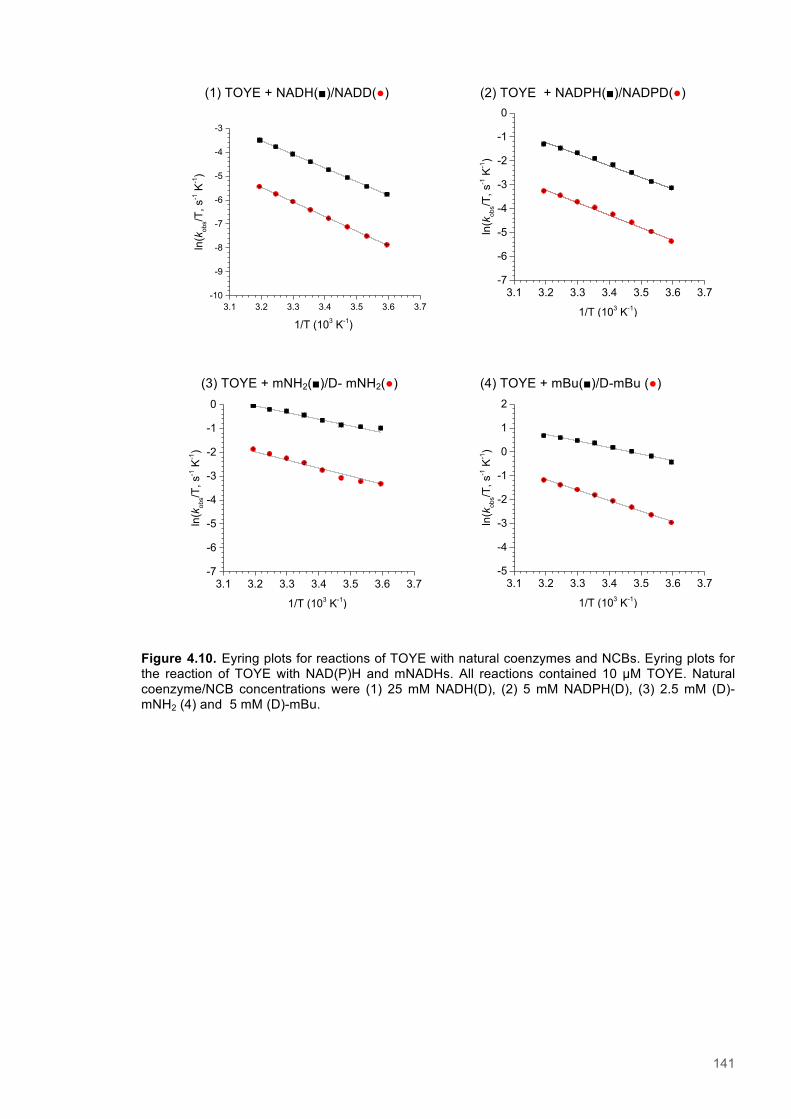
141
(1) TOYE + NADH(■)/NADD(●) (2) TOYE + NADPH(■)/NADPD(●)
(3) TOYE + mNH2(■)/D- mNH2(●) (4) TOYE + mBu(■)/D-mBu (●)
Figure 4.10. Eyring plots for reactions of TOYE with natural coenzymes and NCBs. Eyring plots for the reaction of TOYE with NAD(P)H and mNADHs. All reactions contained 10 µM TOYE. Natural coenzyme/NCB concentrations were (1) 25 mM NADH(D), (2) 5 mM NADPH(D), (3) 2.5 mM (D)- mNH2 (4) and 5 mM (D)-mBu.
3.1 3.2 3.3 3.4 3.5 3.6 3.7-5
-4
-3
-2
-1
0
1
2
ln(k
obs/T
, s-1 K
-1)
1/T (103 K-1)
3.1 3.2 3.3 3.4 3.5 3.6 3.7-10
-9
-8
-7
-6
-5
-4
-3
ln(k
obs/T
, s-1 K
-1)
1/T (103 K-1)
3.1 3.2 3.3 3.4 3.5 3.6 3.7-7
-6
-5
-4
-3
-2
-1
0
ln(k
obs/T
, s-1 K
-1)
1/T (103 K-1)
3.1 3.2 3.3 3.4 3.5 3.6 3.7-7
-6
-5
-4
-3
-2
-1
0
ln(k
obs/T
, s-1 K
-1)
1/T (103 K-1)
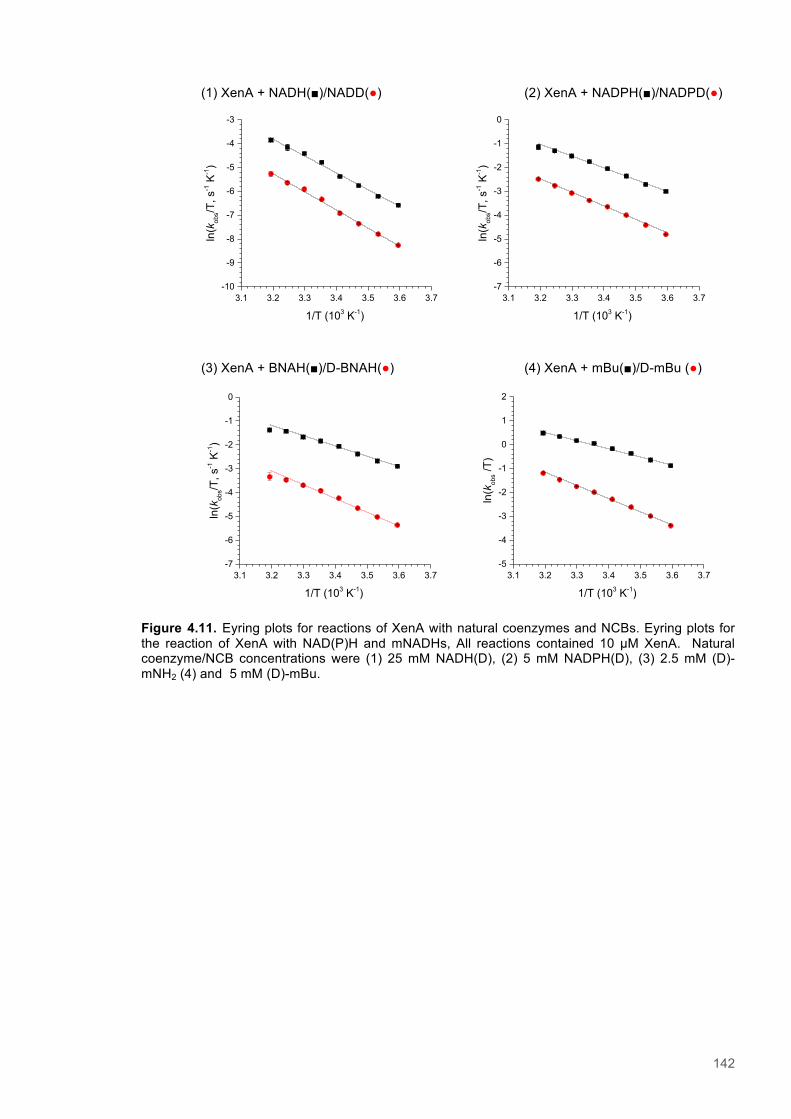
142
3.1 3.2 3.3 3.4 3.5 3.6 3.7-7
-6
-5
-4
-3
-2
-1
0
ln(k
obs/T
, s-1 K
-1)
1/T (103 K-1)
(1) XenA + NADH(■)/NADD(●) (2) XenA + NADPH(■)/NADPD(●)
(3) XenA + BNAH(■)/D-BNAH(●) (4) XenA + mBu(■)/D-mBu (●)
Figure 4.11. Eyring plots for reactions of XenA with natural coenzymes and NCBs. Eyring plots for the reaction of XenA with NAD(P)H and mNADHs, All reactions contained 10 µM XenA. Natural coenzyme/NCB concentrations were (1) 25 mM NADH(D), (2) 5 mM NADPH(D), (3) 2.5 mM (D)- mNH2 (4) and 5 mM (D)-mBu.
3.1 3.2 3.3 3.4 3.5 3.6 3.7-7
-6
-5
-4
-3
-2
-1
0
ln(k
obs/T
, s-1 K
-1)
1/T (103 K-1)
3.1 3.2 3.3 3.4 3.5 3.6 3.7-10
-9
-8
-7
-6
-5
-4
-3
ln(k
obs/T
, s-1 K
-1)
1/T (103 K-1)
3.1 3.2 3.3 3.4 3.5 3.6 3.7-5
-4
-3
-2
-1
0
1
2
ln(k
obs /
T)
1/T (103 K-1)
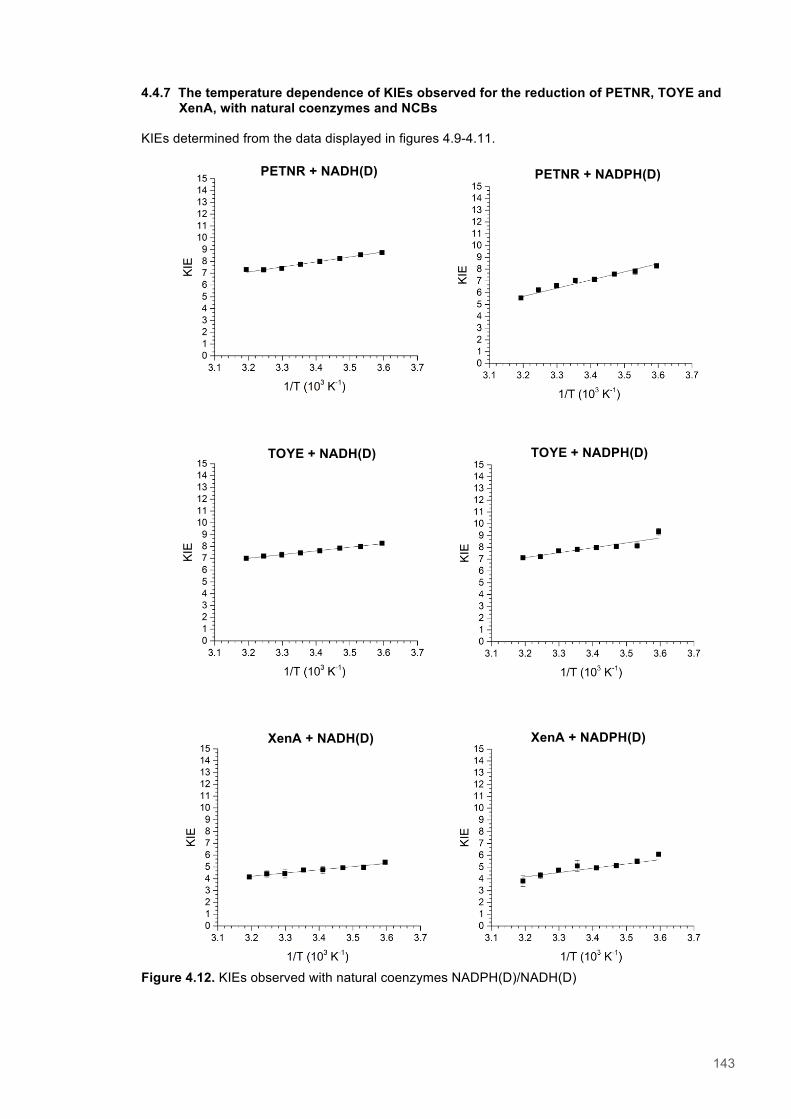
143
4.4.7 The temperature dependence of KIEs observed for the reduction of PETNR, TOYE and XenA, with natural coenzymes and NCBs
KIEs determined from the data displayed in figures 4.9-4.11.
.
Figure 4.12. KIEs observed with natural coenzymes NADPH(D)/NADH(D)
PETNR + NADH(D)
TOYE + NADH(D)
XenA + NADH(D)
TOYE + NADPH(D)
XenA + NADPH(D)
PETNR + NADPH(D)

144
Figure 4.13. KIEs observed with NCBs (D)-mNH2/(D)-mBu.
TOYE + (D)-mNH2
XenA + (D)-mNH2
TOYE + (D)-mBu
XenA + (D)-mBu
PETNR + (D)-mNH2 PETNR + (D)-mBu
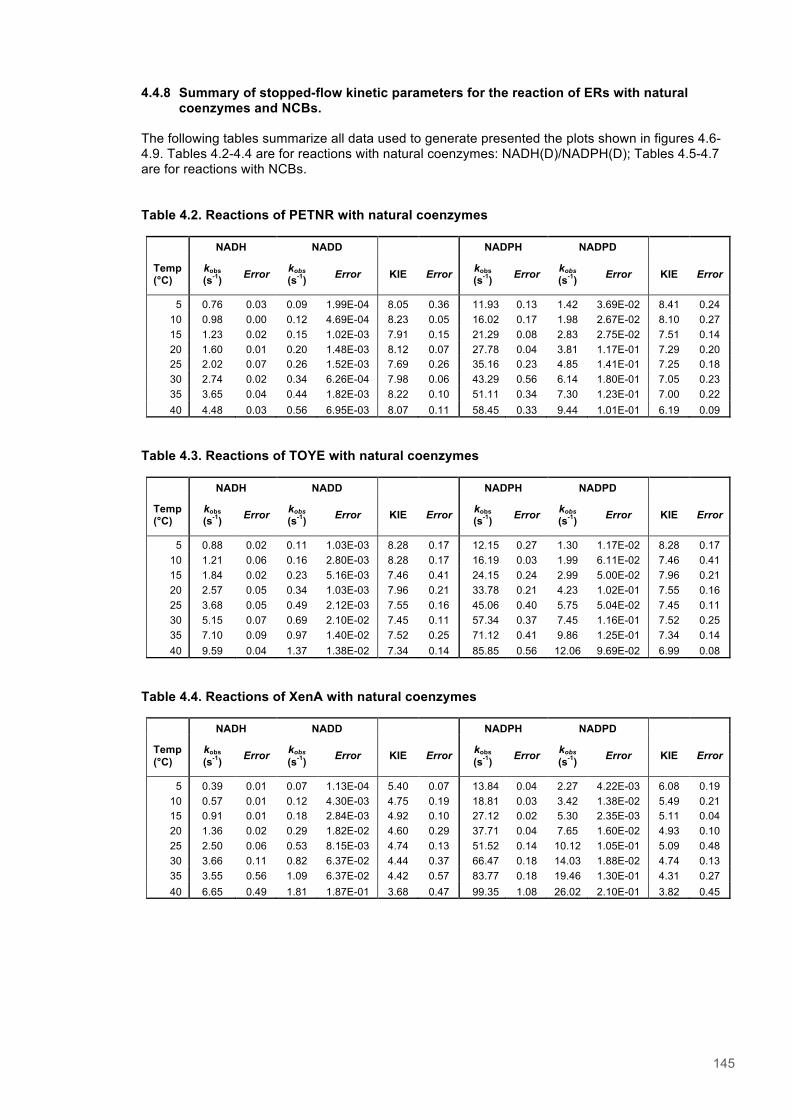
145
4.4.8 Summary of stopped-flow kinetic parameters for the reaction of ERs with natural coenzymes and NCBs.
The following tables summarize all data used to generate presented the plots shown in figures 4.6-4.9. Tables 4.2-4.4 are for reactions with natural coenzymes: NADH(D)/NADPH(D); Tables 4.5-4.7 are for reactions with NCBs. Table 4.2. Reactions of PETNR with natural coenzymes
NADH NADD NADPH NADPD
Temp (°C)
kobs (s-1) Error kobs
(s-1) Error KIE Error kobs (s-1) Error kobs
(s-1) Error KIE Error
5 0.76 0.03 0.09 1.99E-04 8.05 0.36 11.93 0.13 1.42 3.69E-02 8.41 0.24 10 0.98 0.00 0.12 4.69E-04 8.23 0.05 16.02 0.17 1.98 2.67E-02 8.10 0.27 15 1.23 0.02 0.15 1.02E-03 7.91 0.15 21.29 0.08 2.83 2.75E-02 7.51 0.14 20 1.60 0.01 0.20 1.48E-03 8.12 0.07 27.78 0.04 3.81 1.17E-01 7.29 0.20 25 2.02 0.07 0.26 1.52E-03 7.69 0.26 35.16 0.23 4.85 1.41E-01 7.25 0.18 30 2.74 0.02 0.34 6.26E-04 7.98 0.06 43.29 0.56 6.14 1.80E-01 7.05 0.23 35 3.65 0.04 0.44 1.82E-03 8.22 0.10 51.11 0.34 7.30 1.23E-01 7.00 0.22 40 4.48 0.03 0.56 6.95E-03 8.07 0.11 58.45 0.33 9.44 1.01E-01 6.19 0.09
Table 4.3. Reactions of TOYE with natural coenzymes
NADH NADD NADPH NADPD
Temp (°C)
kobs (s-1) Error kobs
(s-1) Error KIE Error kobs (s-1) Error kobs
(s-1) Error KIE Error
5 0.88 0.02 0.11 1.03E-03 8.28 0.17 12.15 0.27 1.30 1.17E-02 8.28 0.17 10 1.21 0.06 0.16 2.80E-03 8.28 0.17 16.19 0.03 1.99 6.11E-02 7.46 0.41 15 1.84 0.02 0.23 5.16E-03 7.46 0.41 24.15 0.24 2.99 5.00E-02 7.96 0.21 20 2.57 0.05 0.34 1.03E-03 7.96 0.21 33.78 0.21 4.23 1.02E-01 7.55 0.16 25 3.68 0.05 0.49 2.12E-03 7.55 0.16 45.06 0.40 5.75 5.04E-02 7.45 0.11 30 5.15 0.07 0.69 2.10E-02 7.45 0.11 57.34 0.37 7.45 1.16E-01 7.52 0.25 35 7.10 0.09 0.97 1.40E-02 7.52 0.25 71.12 0.41 9.86 1.25E-01 7.34 0.14 40 9.59 0.04 1.37 1.38E-02 7.34 0.14 85.85 0.56 12.06 9.69E-02 6.99 0.08
Table 4.4. Reactions of XenA with natural coenzymes
NADH NADD NADPH NADPD
Temp (°C)
kobs
(s-1) Error kobs
(s-1) Error KIE Error kobs
(s-1) Error kobs
(s-1) Error KIE Error
5 0.39 0.01 0.07 1.13E-04 5.40 0.07 13.84 0.04 2.27 4.22E-03 6.08 0.19 10 0.57 0.01 0.12 4.30E-03 4.75 0.19 18.81 0.03 3.42 1.38E-02 5.49 0.21 15 0.91 0.01 0.18 2.84E-03 4.92 0.10 27.12 0.02 5.30 2.35E-03 5.11 0.04 20 1.36 0.02 0.29 1.82E-02 4.60 0.29 37.71 0.04 7.65 1.60E-02 4.93 0.10 25 2.50 0.06 0.53 8.15E-03 4.74 0.13 51.52 0.14 10.12 1.05E-01 5.09 0.48 30 3.66 0.11 0.82 6.37E-02 4.44 0.37 66.47 0.18 14.03 1.88E-02 4.74 0.13 35 3.55 0.56 1.09 6.37E-02 4.42 0.57 83.77 0.18 19.46 1.30E-01 4.31 0.27 40 6.65 0.49 1.81 1.87E-01 3.68 0.47 99.35 1.08 26.02 2.10E-01 3.82 0.45
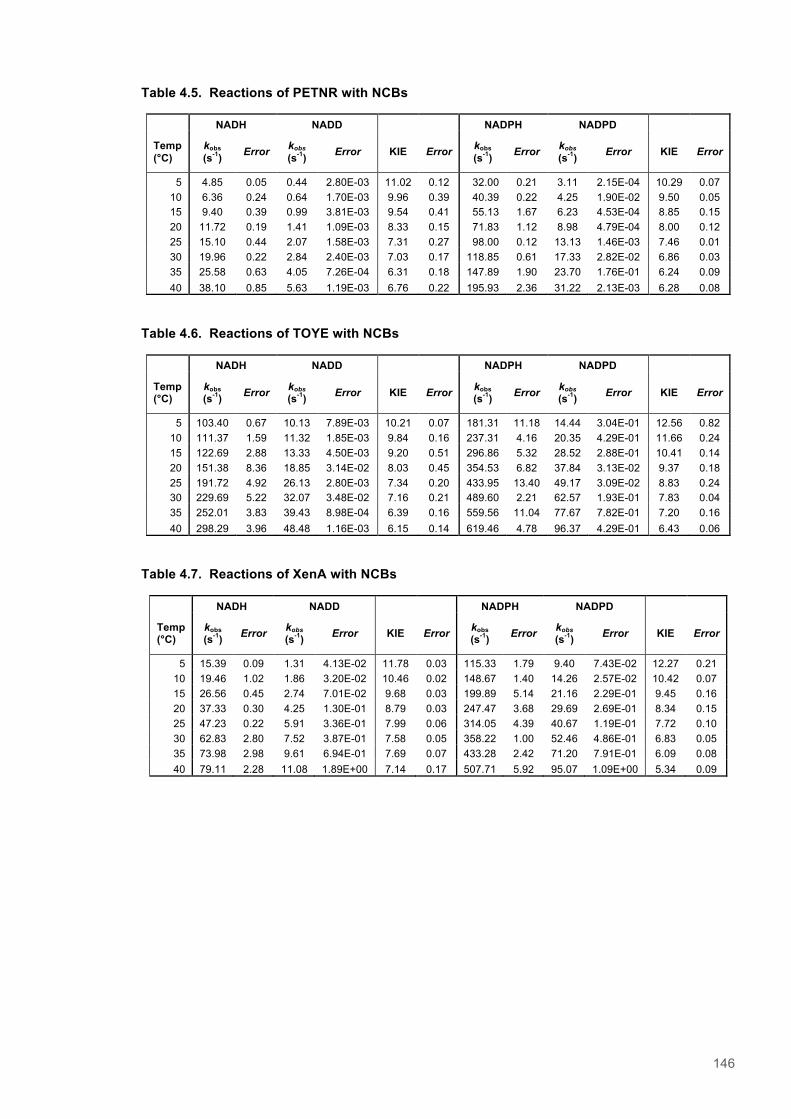
146
Table 4.5. Reactions of PETNR with NCBs
NADH NADD NADPH NADPD
Temp (°C)
kobs
(s-1) Error kobs
(s-1) Error KIE Error kobs
(s-1) Error kobs
(s-1) Error KIE Error
5 4.85 0.05 0.44 2.80E-03 11.02 0.12 32.00 0.21 3.11 2.15E-04 10.29 0.07 10 6.36 0.24 0.64 1.70E-03 9.96 0.39 40.39 0.22 4.25 1.90E-02 9.50 0.05 15 9.40 0.39 0.99 3.81E-03 9.54 0.41 55.13 1.67 6.23 4.53E-04 8.85 0.15 20 11.72 0.19 1.41 1.09E-03 8.33 0.15 71.83 1.12 8.98 4.79E-04 8.00 0.12 25 15.10 0.44 2.07 1.58E-03 7.31 0.27 98.00 0.12 13.13 1.46E-03 7.46 0.01 30 19.96 0.22 2.84 2.40E-03 7.03 0.17 118.85 0.61 17.33 2.82E-02 6.86 0.03 35 25.58 0.63 4.05 7.26E-04 6.31 0.18 147.89 1.90 23.70 1.76E-01 6.24 0.09 40 38.10 0.85 5.63 1.19E-03 6.76 0.22 195.93 2.36 31.22 2.13E-03 6.28 0.08
Table 4.6. Reactions of TOYE with NCBs
NADH NADD NADPH NADPD
Temp (°C)
kobs (s-1) Error kobs
(s-1) Error KIE Error kobs (s-1) Error kobs
(s-1) Error KIE Error
5 103.40 0.67 10.13 7.89E-03 10.21 0.07 181.31 11.18 14.44 3.04E-01 12.56 0.82 10 111.37 1.59 11.32 1.85E-03 9.84 0.16 237.31 4.16 20.35 4.29E-01 11.66 0.24 15 122.69 2.88 13.33 4.50E-03 9.20 0.51 296.86 5.32 28.52 2.88E-01 10.41 0.14 20 151.38 8.36 18.85 3.14E-02 8.03 0.45 354.53 6.82 37.84 3.13E-02 9.37 0.18 25 191.72 4.92 26.13 2.80E-03 7.34 0.20 433.95 13.40 49.17 3.09E-02 8.83 0.24 30 229.69 5.22 32.07 3.48E-02 7.16 0.21 489.60 2.21 62.57 1.93E-01 7.83 0.04 35 252.01 3.83 39.43 8.98E-04 6.39 0.16 559.56 11.04 77.67 7.82E-01 7.20 0.16 40 298.29 3.96 48.48 1.16E-03 6.15 0.14 619.46 4.78 96.37 4.29E-01 6.43 0.06
Table 4.7. Reactions of XenA with NCBs
NADH NADD NADPH NADPD
Temp (°C)
kobs (s-1) Error kobs
(s-1) Error KIE Error kobs (s-1) Error kobs
(s-1) Error KIE Error
5 15.39 0.09 1.31 4.13E-02 11.78 0.03 115.33 1.79 9.40 7.43E-02 12.27 0.21 10 19.46 1.02 1.86 3.20E-02 10.46 0.02 148.67 1.40 14.26 2.57E-02 10.42 0.07 15 26.56 0.45 2.74 7.01E-02 9.68 0.03 199.89 5.14 21.16 2.29E-01 9.45 0.16 20 37.33 0.30 4.25 1.30E-01 8.79 0.03 247.47 3.68 29.69 2.69E-01 8.34 0.15 25 47.23 0.22 5.91 3.36E-01 7.99 0.06 314.05 4.39 40.67 1.19E-01 7.72 0.10 30 62.83 2.80 7.52 3.87E-01 7.58 0.05 358.22 1.00 52.46 4.86E-01 6.83 0.05 35 73.98 2.98 9.61 6.94E-01 7.69 0.07 433.28 2.42 71.20 7.91E-01 6.09 0.08 40 79.11 2.28 11.08 1.89E+00 7.14 0.17 507.71 5.92 95.07 1.09E+00 5.34 0.09
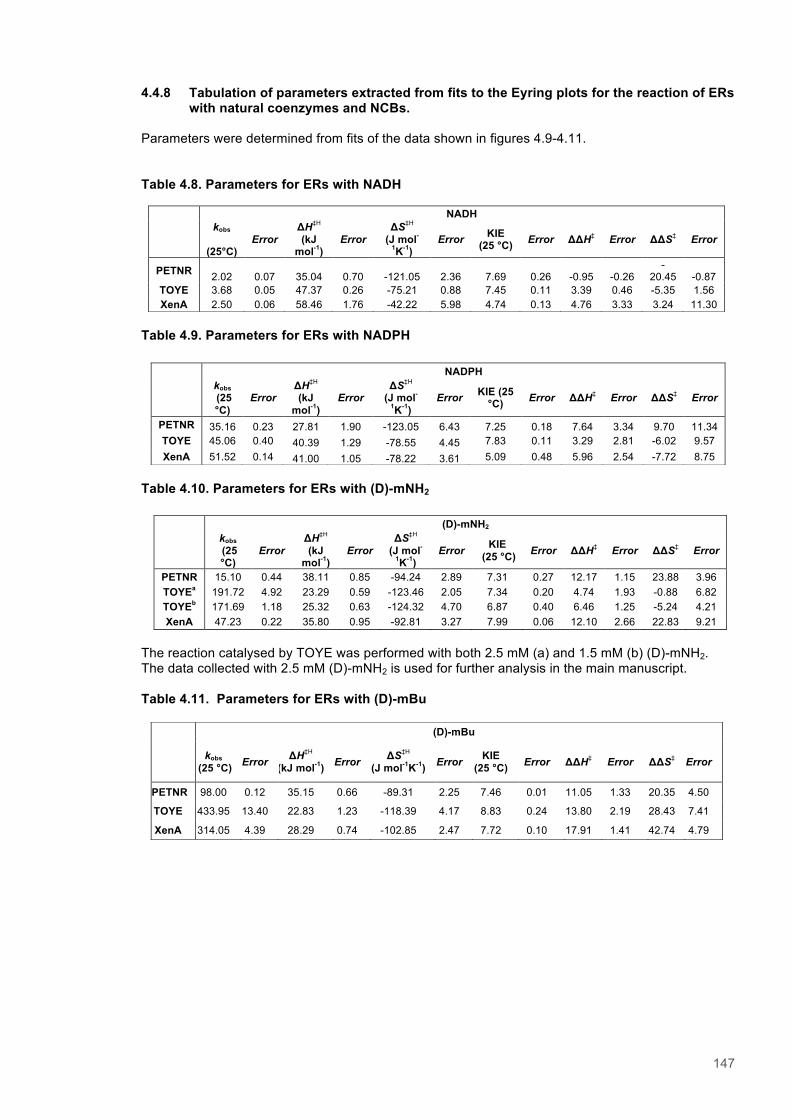
147
4.4.8 Tabulation of parameters extracted from fits to the Eyring plots for the reaction of ERs with natural coenzymes and NCBs. Parameters were determined from fits of the data shown in figures 4.9-4.11. Table 4.8. Parameters for ERs with NADH
Table 4.9. Parameters for ERs with NADPH
Table 4.10. Parameters for ERs with (D)-mNH2
The reaction catalysed by TOYE was performed with both 2.5 mM (a) and 1.5 mM (b) (D)-mNH2. The data collected with 2.5 mM (D)-mNH2 is used for further analysis in the main manuscript. Table 4.11. Parameters for ERs with (D)-mBu
NADH
kobs
(25°C) Error
ΔH‡H (kJ
mol-1) Error
ΔS‡H (J mol-
1K-1) Error KIE
(25 °C) Error ΔΔH‡ Error ΔΔS‡ Error
PETNR 2.02 0.07 35.04 0.70 -121.05 2.36 7.69 0.26 -0.95 -0.26 -
20.45 -0.87 TOYE 3.68 0.05 47.37 0.26 -75.21 0.88 7.45 0.11 3.39 0.46 -5.35 1.56 XenA 2.50 0.06 58.46 1.76 -42.22 5.98 4.74 0.13 4.76 3.33 3.24 11.30
NADPH
kobs (25 °C)
Error ΔH‡H (kJ
mol-1) Error
ΔS‡H (J mol-
1K-1) Error KIE (25
°C) Error ΔΔH‡ Error ΔΔS‡ Error
PETNR 35.16 0.23 27.81 1.90 -123.05 6.43 7.25 0.18 7.64 3.34 9.70 11.34 TOYE 45.06 0.40 40.39 1.29 -78.55 4.45 7.83 0.11 3.29 2.81 -6.02 9.57 XenA 51.52 0.14 41.00 1.05 -78.22 3.61 5.09 0.48 5.96 2.54 -7.72 8.75
(D)-mNH2
kobs (25 °C)
Error ΔH‡H (kJ
mol-1) Error
ΔS‡H (J mol-
1K-1) Error KIE
(25 °C) Error ΔΔH‡ Error ΔΔS‡ Error
PETNR 15.10 0.44 38.11 0.85 -94.24 2.89 7.31 0.27 12.17 1.15 23.88 3.96 TOYEa 191.72 4.92 23.29 0.59 -123.46 2.05 7.34 0.20 4.74 1.93 -0.88 6.82 TOYEb 171.69 1.18 25.32 0.63 -124.32 4.70 6.87 0.40 6.46 1.25 -5.24 4.21 XenA 47.23 0.22 35.80 0.95 -92.81 3.27 7.99 0.06 12.10 2.66 22.83 9.21
(D)-mBu
kobs
(25 °C) Error ΔH‡H (kJ mol-1) Error ΔS‡H
(J mol-1K-1) Error KIE (25 °C) Error ΔΔH‡ Error ΔΔS‡ Error
PETNR 98.00 0.12 35.15 0.66 -89.31 2.25 7.46 0.01 11.05 1.33 20.35 4.50
TOYE 433.95 13.40 22.83 1.23 -118.39 4.17 8.83 0.24 13.80 2.19 28.43 7.41
XenA 314.05 4.39 28.29 0.74 -102.85 2.47 7.72 0.10 17.91 1.41 42.74 4.79
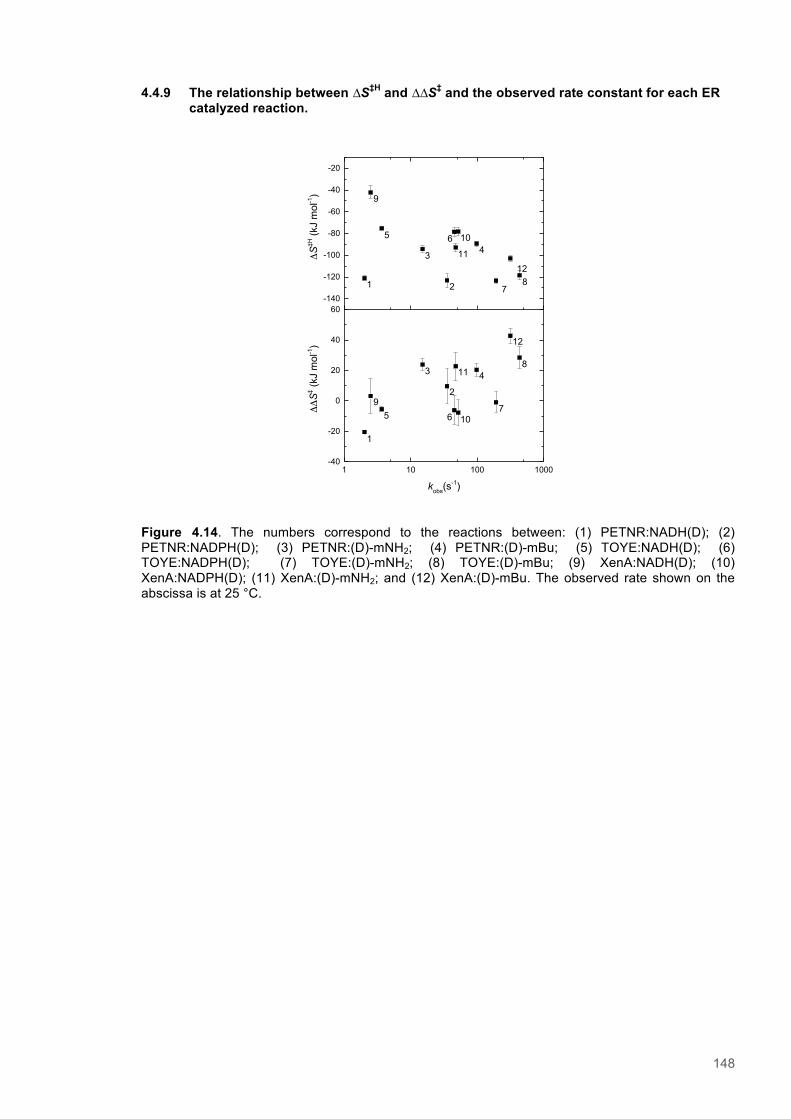
148
4.4.9 The relationship between ∆S‡H and ∆∆S‡ and the observed rate constant for each ER catalyzed reaction.
Figure 4.14. The numbers correspond to the reactions between: (1) PETNR:NADH(D); (2) PETNR:NADPH(D); (3) PETNR:(D)-mNH2; (4) PETNR:(D)-mBu; (5) TOYE:NADH(D); (6) TOYE:NADPH(D); (7) TOYE:(D)-mNH2; (8) TOYE:(D)-mBu; (9) XenA:NADH(D); (10) XenA:NADPH(D); (11) XenA:(D)-mNH2; and (12) XenA:(D)-mBu. The observed rate shown on the abscissa is at 25 °C.
-140
-120
-100
-80
-60
-40
-20
1 10 100 1000-40
-20
0
20
40
60
8
12
11
6
2
2
3
5
5
9
1
ΔS
‡H (k
J m
ol-1)
12
7
7
4
8
4
10
10
11
6
3
9
ΔΔS
‡ (kJ
mol
-1)
kobs(s-1)
1
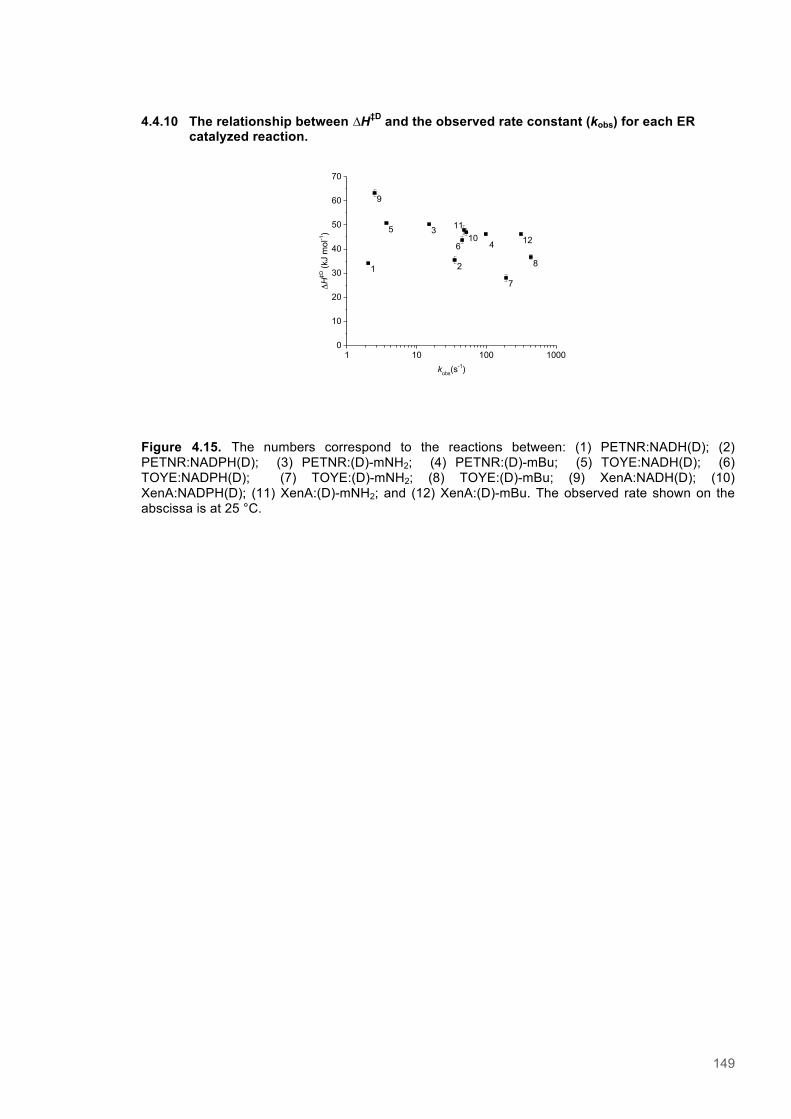
149
4.4.10 The relationship between ∆H‡D and the observed rate constant (kobs) for each ER catalyzed reaction.
Figure 4.15. The numbers correspond to the reactions between: (1) PETNR:NADH(D); (2) PETNR:NADPH(D); (3) PETNR:(D)-mNH2; (4) PETNR:(D)-mBu; (5) TOYE:NADH(D); (6) TOYE:NADPH(D); (7) TOYE:(D)-mNH2; (8) TOYE:(D)-mBu; (9) XenA:NADH(D); (10) XenA:NADPH(D); (11) XenA:(D)-mNH2; and (12) XenA:(D)-mBu. The observed rate shown on the abscissa is at 25 °C.
1 10 100 10000
10
20
30
40
50
60
70
8
124
7
1110
6
2
35
9
ΔH
‡D (k
J m
ol-1)
kobs(s-1)
1
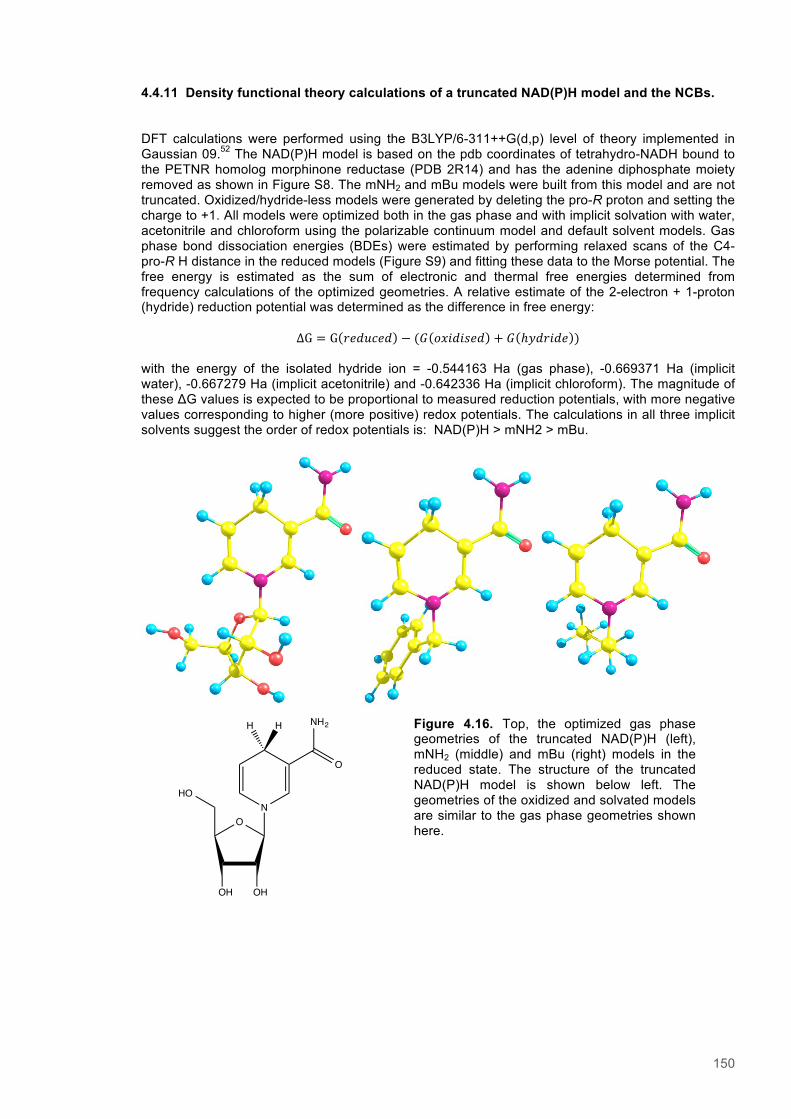
150
4.4.11 Density functional theory calculations of a truncated NAD(P)H model and the NCBs.
DFT calculations were performed using the B3LYP/6-311++G(d,p) level of theory implemented in Gaussian 09.52 The NAD(P)H model is based on the pdb coordinates of tetrahydro-NADH bound to the PETNR homolog morphinone reductase (PDB 2R14) and has the adenine diphosphate moiety removed as shown in Figure S8. The mNH2 and mBu models were built from this model and are not truncated. Oxidized/hydride-less models were generated by deleting the pro-R proton and setting the charge to +1. All models were optimized both in the gas phase and with implicit solvation with water, acetonitrile and chloroform using the polarizable continuum model and default solvent models. Gas phase bond dissociation energies (BDEs) were estimated by performing relaxed scans of the C4-pro-R H distance in the reduced models (Figure S9) and fitting these data to the Morse potential. The free energy is estimated as the sum of electronic and thermal free energies determined from frequency calculations of the optimized geometries. A relative estimate of the 2-electron + 1-proton (hydride) reduction potential was determined as the difference in free energy:
∆G = G !"#$%"# − (! !"#$#%&$ + ! ℎ!"#$"% ) with the energy of the isolated hydride ion = -0.544163 Ha (gas phase), -0.669371 Ha (implicit water), -0.667279 Ha (implicit acetonitrile) and -0.642336 Ha (implicit chloroform). The magnitude of these ΔG values is expected to be proportional to measured reduction potentials, with more negative values corresponding to higher (more positive) redox potentials. The calculations in all three implicit solvents suggest the order of redox potentials is: NAD(P)H > mNH2 > mBu.
Figure 4.16. Top, the optimized gas phase geometries of the truncated NAD(P)H (left), mNH2 (middle) and mBu (right) models in the reduced state. The structure of the truncated NAD(P)H model is shown below left. The geometries of the oxidized and solvated models are similar to the gas phase geometries shown here.
N
O
NH2HH
O
OHOH
HO
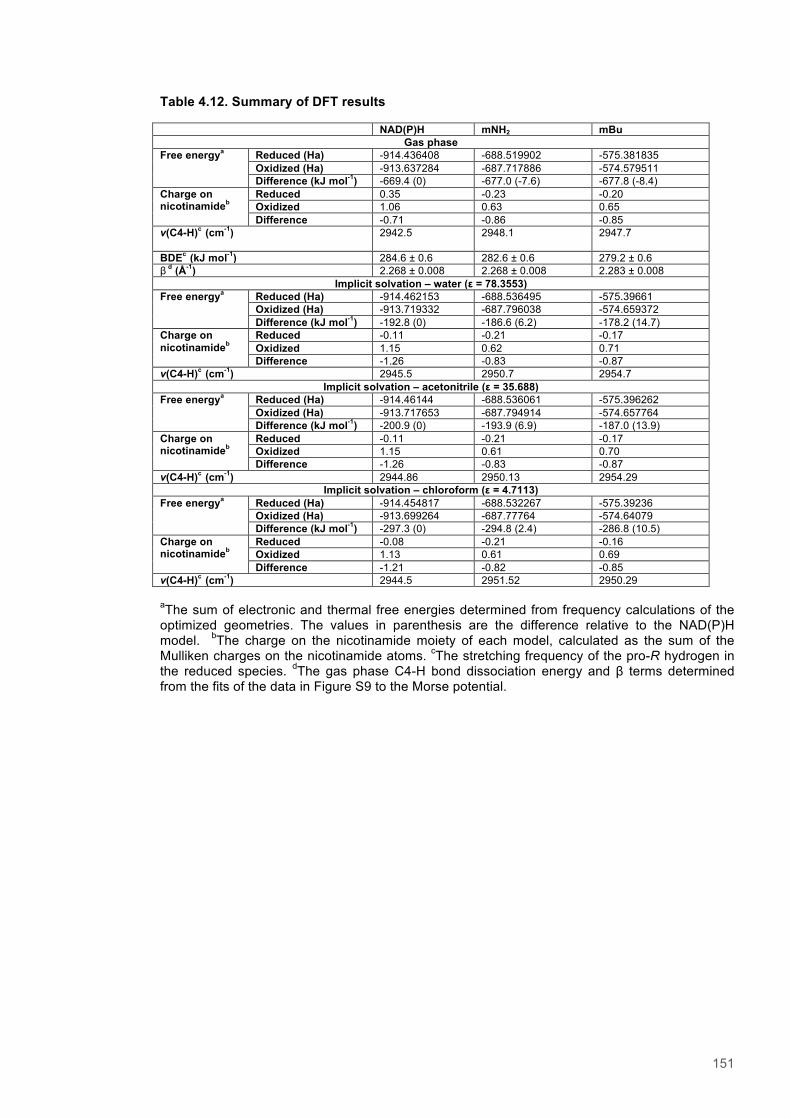
151
Table 4.12. Summary of DFT results
NAD(P)H mNH2 mBu Gas phase
Free energya Reduced (Ha) -914.436408 -688.519902 -575.381835 Oxidized (Ha) -913.637284 -687.717886 -574.579511 Difference (kJ mol-1) -669.4 (0) -677.0 (-7.6) -677.8 (-8.4)
Charge on nicotinamideb
Reduced 0.35 -0.23 -0.20 Oxidized 1.06 0.63 0.65 Difference -0.71 -0.86 -0.85
ν(C4-H)c (cm-1)
2942.5 2948.1 2947.7
BDEc (kJ mol-1) 284.6 ± 0.6 282.6 ± 0.6 279.2 ± 0.6 β d (Å-1) 2.268 ± 0.008 2.268 ± 0.008 2.283 ± 0.008
Implicit solvation – water (ε = 78.3553) Free energya Reduced (Ha) -914.462153 -688.536495 -575.39661
Oxidized (Ha) -913.719332 -687.796038 -574.659372 Difference (kJ mol-1) -192.8 (0) -186.6 (6.2) -178.2 (14.7)
Charge on nicotinamideb
Reduced -0.11 -0.21 -0.17 Oxidized 1.15 0.62 0.71 Difference -1.26 -0.83 -0.87
ν(C4-H)c (cm-1) 2945.5 2950.7 2954.7 Implicit solvation – acetonitrile (ε = 35.688)
Free energya Reduced (Ha) -914.46144 -688.536061 -575.396262 Oxidized (Ha) -913.717653 -687.794914 -574.657764 Difference (kJ mol-1) -200.9 (0) -193.9 (6.9) -187.0 (13.9)
Charge on nicotinamideb
Reduced -0.11 -0.21 -0.17 Oxidized 1.15 0.61 0.70 Difference -1.26 -0.83 -0.87
ν(C4-H)c (cm-1) 2944.86 2950.13 2954.29 Implicit solvation – chloroform (ε = 4.7113)
Free energya Reduced (Ha) -914.454817 -688.532267 -575.39236 Oxidized (Ha) -913.699264 -687.77764 -574.64079 Difference (kJ mol-1) -297.3 (0) -294.8 (2.4) -286.8 (10.5)
Charge on nicotinamideb
Reduced -0.08 -0.21 -0.16 Oxidized 1.13 0.61 0.69 Difference -1.21 -0.82 -0.85
ν(C4-H)c (cm-1) 2944.5 2951.52 2950.29
aThe sum of electronic and thermal free energies determined from frequency calculations of the optimized geometries. The values in parenthesis are the difference relative to the NAD(P)H model. bThe charge on the nicotinamide moiety of each model, calculated as the sum of the Mulliken charges on the nicotinamide atoms. cThe stretching frequency of the pro-R hydrogen in the reduced species. dThe gas phase C4-H bond dissociation energy and β terms determined from the fits of the data in Figure S9 to the Morse potential.
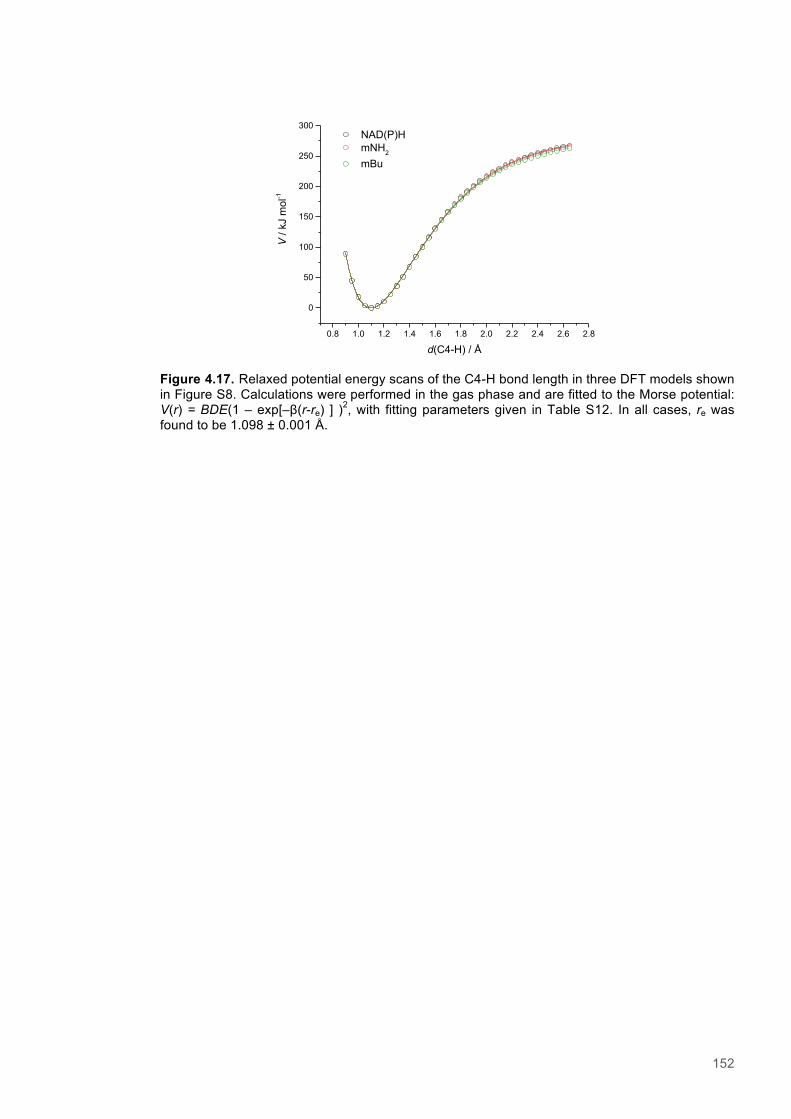
152
0.8 1.0 1.2 1.4 1.6 1.8 2.0 2.2 2.4 2.6 2.8
0
50
100
150
200
250
300
V /
kJ m
ol-1
d(C4-H) / Å
NAD(P)H mNH2
mBu
Figure 4.17. Relaxed potential energy scans of the C4-H bond length in three DFT models shown in Figure S8. Calculations were performed in the gas phase and are fitted to the Morse potential: V(r) = BDE(1 – exp[–β(r-re) ] )2, with fitting parameters given in Table S12. In all cases, re was found to be 1.098 ± 0.001 Å.
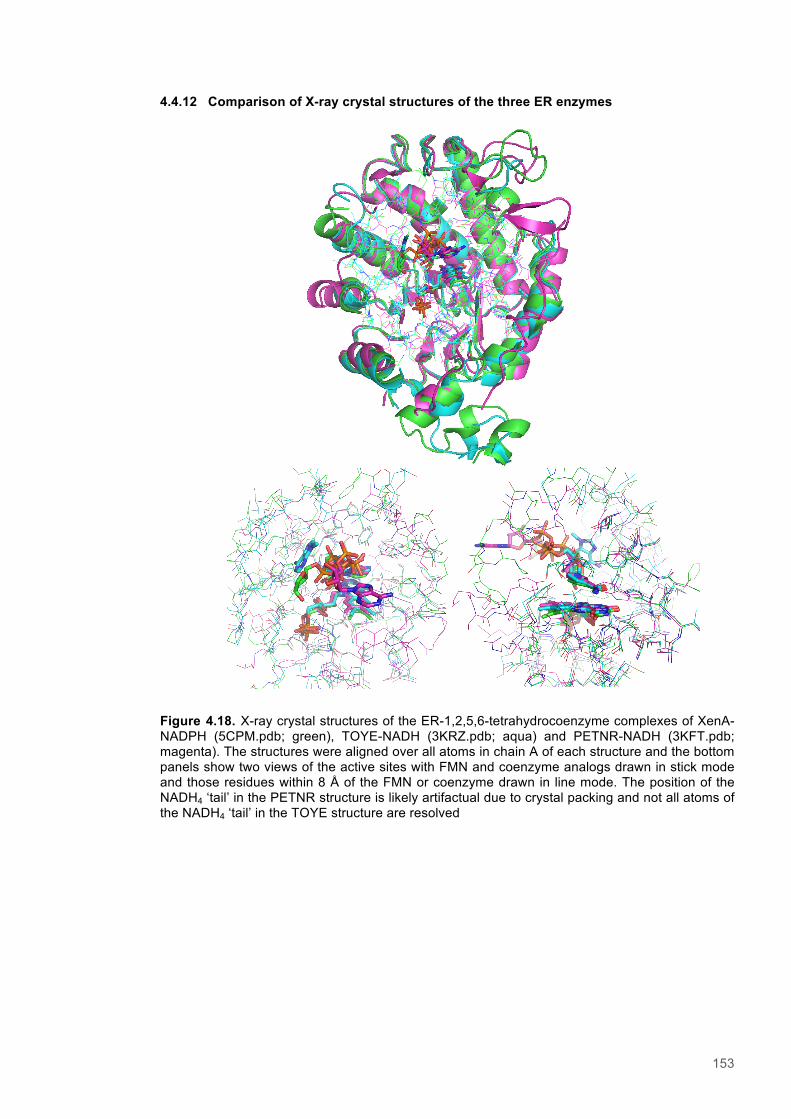
153
4.4.12 Comparison of X-ray crystal structures of the three ER enzymes
Figure 4.18. X-ray crystal structures of the ER-1,2,5,6-tetrahydrocoenzyme complexes of XenA-NADPH (5CPM.pdb; green), TOYE-NADH (3KRZ.pdb; aqua) and PETNR-NADH (3KFT.pdb; magenta). The structures were aligned over all atoms in chain A of each structure and the bottom panels show two views of the active sites with FMN and coenzyme analogs drawn in stick mode and those residues within 8 Å of the FMN or coenzyme drawn in line mode. The position of the NADH4 ‘tail’ in the PETNR structure is likely artifactual due to crystal packing and not all atoms of the NADH4 ‘tail’ in the TOYE structure are resolved
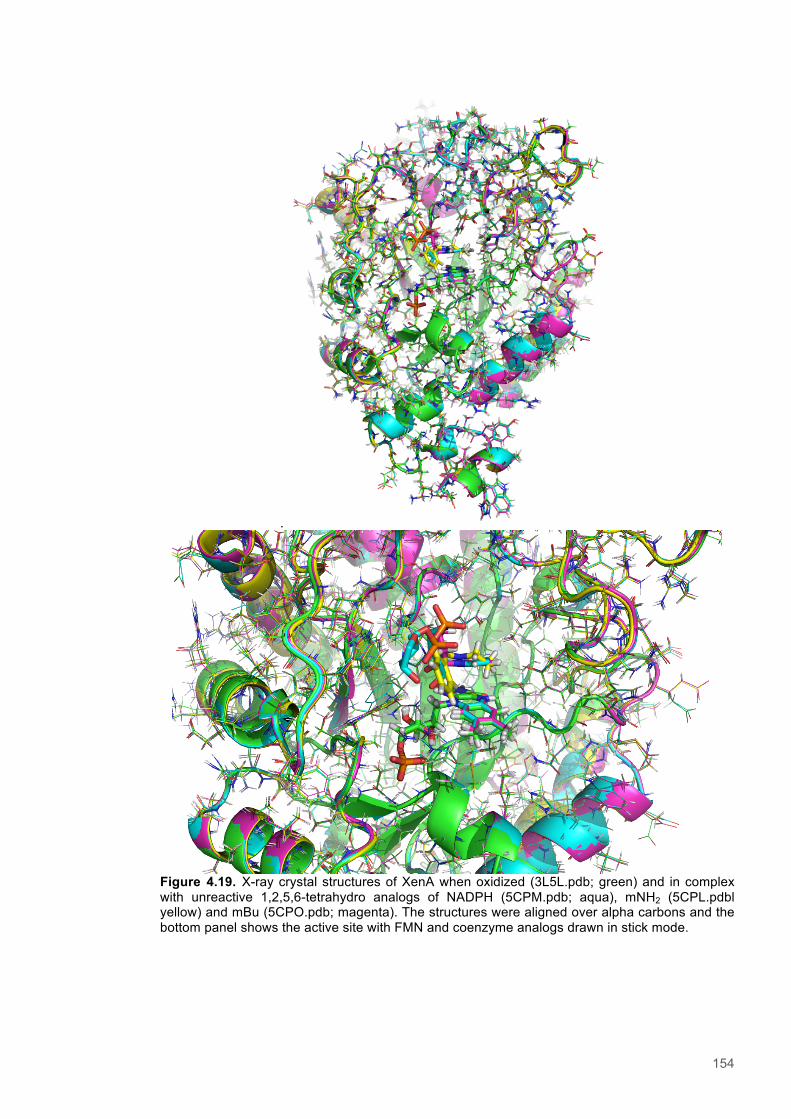
154
.
Figure 4.19. X-ray crystal structures of XenA when oxidized (3L5L.pdb; green) and in complex with unreactive 1,2,5,6-tetrahydro analogs of NADPH (5CPM.pdb; aqua), mNH2 (5CPL.pdbl yellow) and mBu (5CPO.pdb; magenta). The structures were aligned over alpha carbons and the bottom panel shows the active site with FMN and coenzyme analogs drawn in stick mode.
155
Chapter 5
An Investigation of Hydride Donor-Acceptor Distances Within PETNR Ligand Complexes as a
Function of Pressure Using Intermoleculer Nuclear Overhauser Effect NMR Spectroscopy
Authors: Alexander Geddes, Matt Cliff, Jon Waltho, Sam Hay and Nigel S. Scrutton
Affiliations: Manchester Institute of Biotechnology and School of Chemistry, The university of
Manchester, 131 Princess Street, Manchester, M1 7DN, United Kingdom.
156
5.1 Abstract
Precise measurement of donor-acceptor distances and direct observation of catalytically relevant
‘promoting’ motions’ in H-tunneling enzymes is experimentally challenging. The suggested small
amplitude and fast time-scale of putative promoting modes means that the current array of time-
resolved techniques for studying protein structures may not offer the spatial and temporal
resolution required. Nuclear magnetic resonance (NMR) spectroscopy offers the opportunity to
study proteins in solution at near atomic resolution and the observation of motions occurring over
broad range of timescales, from ps-ms. Nuclear Overhauser Effect (NOE) based NMR methods
exploit distance-dependent dipolar interactions to provide precise assessment of internuclear
distances. In the current study, both saturation transfer difference (STD) and selective-NOE
experiments are exploited to assess rates of NOE buildup in various PETNR-ligand complexes,
as a measure of donor to acceptor distances. The effect of increased hydrostatic pressure on the
structure of the active site, and therefore the rate of NOE buildup, is then investigated using duel
high-pressure NMR studies.
157
5.2 Introduction
The role of protein motions in enhancing hydride tunnelling mediated H-transfer has been
intensively scrutinized using a multitude of techniques.1-3 The exact roles of compressive
‘promoting’ motions directly involved in stimulating transfer, and those involved in
‘preorganization’ of the active site into a tunneling ready conformation are still not fully
understood.4 Models addressing enzymatic hydride tunneling and the influence of such motions
on observed rates of H-transfer hinge on a number of interconnected factors; The reduction of
barrier heights due to overlap of donor/acceptor (DA) wave functions, the relative vibrational
properties, or zero point energies of the atoms involved, and also the H-transfer distance. 5 The
determination of the exact H-transfer distance is difficult as it requires analysis of the transition
state and consideration of any thermally driven conformational changes occurring within it, but is
thought to be close to a single bond length. 6 This means measurement of the H-transfer distance
and associated changes cannot easily be achieved with atomic resolution in a time resolved
manner using the currently available techniques and approaches. The influence of high frequency
motions on observed rates of hydride transfer has therefore largely been inferred indirectly, either
from studies of the temperature dependence of KIEs, or the computational models that are
referenced against such measurements.6
One experimental tool exploited to perturb DA distances in tunneling enzymes in order to
investigate the catalytic relevance of protein motions is the application of hydrostatic pressure.7-9
The application of increased pressures leads to general compression of a protein and favoring of
a higher density structures with smaller overall volumes.10 This results in the modulation of the
existing equilibrium of conformational states, and thus enables investigation of the effects of
changes in the DA distance on the rate hydride transfer.11 The semi-classical description of KIEs
implies that they should be insensitive to pressure changes over the experimentally accessible
range.12 The observed pressure dependence of KIEs is therefore seen as further evidence for
environmental coupling of H-transfer chemistry. Pressure dependent KIEs have been
documented for a handful of tunneling enzymes.13-15 It has been proposed that the pressure
responses are mediated through changes in the equilibrium DA distance and also the vibrational
frequency of putative promoting motions. The 1° KIEs observed for FMN reduction in PETNR with
NADH and NADPH are both pressure dependent, however, the nature of the pressure response
varies for the two substrates.13 The plot of pressure versus KIE for the reaction involving NADPH
exhibits marked curvature, which is thought to reflect a smaller force constant for vibrational
motions involved in promoting H-transfer. The application of increased hydrostatic pressure is not
thought to lead to a shortening of DA distance for all enzymes. However, the precise effect of
pressure on enzyme systems and the reaction coordinate is not always clear.14 In studies
involving aromatic amine dehydrogenase (AADH) the KIE for the reaction with phenylethylamine
decreased with increasing pressure, as did the observed rate of reduction (kobs).16 Molecular
dynamic simulations indicated that the application of pressure had a minimal effect on the transfer
coordinate in this instance, and the observed kinetic changes were simply due to changes in

158
vibrational properties of DA modes. A direct means of experimentally interrogating the effects of
pressure on the transfer distance would therefore be useful for corroborating conclusions drawn
from kinetic data and computational models.
NMR spectroscopy provides the opportunity to study proteins in solution at atomic resolution, and
has previously been used to study samples over variable pressure ranges 17-20 There are many
NMR-based approaches for studying different aspects of protein-ligand interactions. Monitoring
the displacement of amide group chemical shifts upon the addition of ligand, often termed
chemical shift perturbation studies, enables determination of ligand interaction sites and binding
affinities.21 Alternate methods for studying protein-ligand interactions that can provide more
precise measurement of specific inter-, or intra-, atomic distances are those based on
measurement of Nuclear Overhauser Effects (NOEs). The NOE occurs as a consequence of
dipole-dipole (DD) relaxation.22 If the equilibrium distribution of spin states for a nucleus is
perturbed then magnetization is transferred through space to others nearby, through mutual
flipping of the two spins, as the system returns to equilibrium. This, in turn, results in a change in
the relative populations spin states for the surrounding nuclei. As DD-relaxation is heavily
dependent on the distance separating two interacting spins, the NOE effect between them is also
distance dependent. The NOE effect, also known as the cross-relaxation rate, is thus proportional
to r6, where r is the internuclear distance.22 In addition, the relaxation rate is also dependent on
the Larmor frequencies of the nuclei involved and the correlation time of the interspin vector. The
initial perturbation of spin states can be stimulated by one of two means. Driven methods involve
saturation of a proton spins whereas transient NOE methods involve the selective inversion of the
target resonance(s).
One approach that exploits the NOE effect as a measure of internuclear distances is Saturation
Transfer Difference NMR spectroscopy (STD-NMR).23 This approach is commonly used for
fragment selection during drug discovery and also for analysis of the bound conformation of
protein ligands.24,25 The STD-NMR experiment involves the subtraction of a spectra where
presaturation has been applied to a peak of interest (on resonance spectrum) from a spectra
where the same saturating pulse is placed at a frequency well away from any resonances in the
system (off resonance spectrum; Figure 5.1).23 When a resonance is saturated the populations of
high (α) and low (β) energy spin states are equalized and no NMR signal is observed for the
corresponding resonance. Owing to the fact that proteins are large molecules with short
correlation times and fast longitudinal relaxation rates, they experience rapid NOE buildup and
extensive spin diffusion. Conversely, ligands are small molecules and therefore have slow NOE
buildup and little spin diffusion. This means that intramolecular NOEs within the protein-ligand
complex buildup quickly, but are also lost rapidly. For relatively weakly binding ligands with
adequately high off rates (KD between 10-8 M to 10-3 M) there will be sufficient exchange between
free and bound ligand.23 As the relaxation of small and fast-tumbling molecules is much slower
than the off-rate of a weakly binding ligand, there will be accumulation of saturation in the pool of
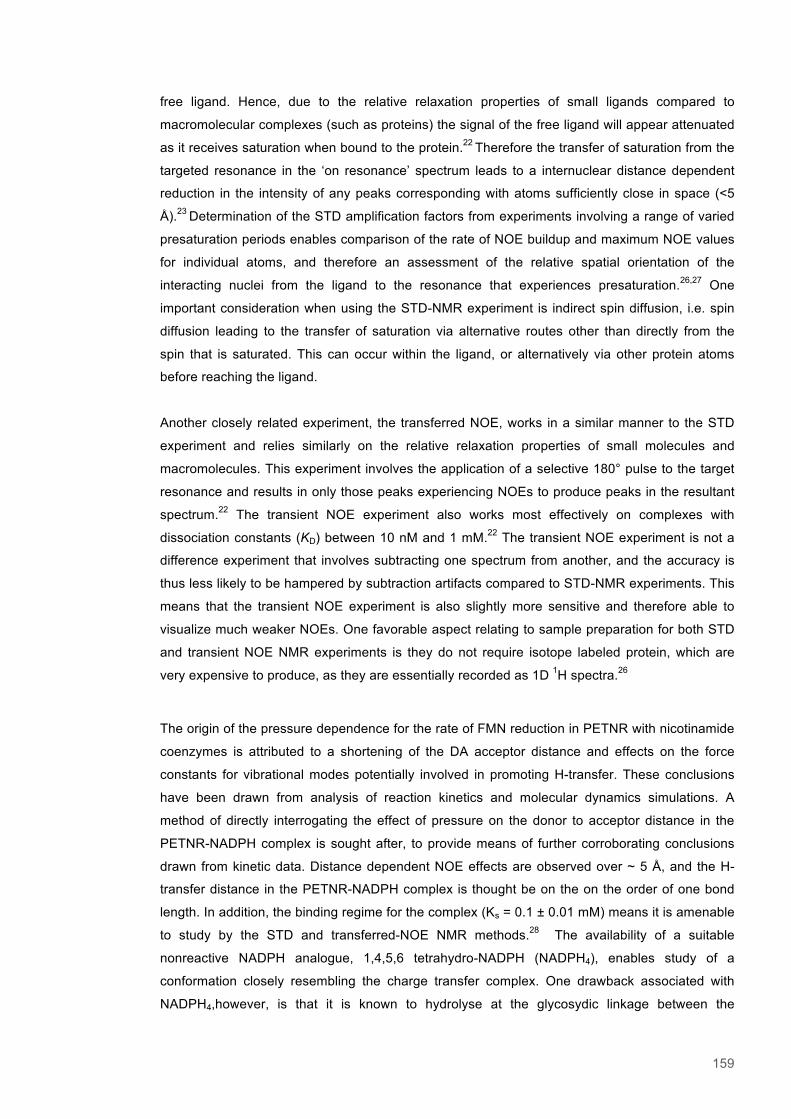
159
free ligand. Hence, due to the relative relaxation properties of small ligands compared to
macromolecular complexes (such as proteins) the signal of the free ligand will appear attenuated
as it receives saturation when bound to the protein.22 Therefore the transfer of saturation from the
targeted resonance in the ‘on resonance’ spectrum leads to a internuclear distance dependent
reduction in the intensity of any peaks corresponding with atoms sufficiently close in space (<5
Å).23 Determination of the STD amplification factors from experiments involving a range of varied
presaturation periods enables comparison of the rate of NOE buildup and maximum NOE values
for individual atoms, and therefore an assessment of the relative spatial orientation of the
interacting nuclei from the ligand to the resonance that experiences presaturation.26,27 One
important consideration when using the STD-NMR experiment is indirect spin diffusion, i.e. spin
diffusion leading to the transfer of saturation via alternative routes other than directly from the
spin that is saturated. This can occur within the ligand, or alternatively via other protein atoms
before reaching the ligand.
Another closely related experiment, the transferred NOE, works in a similar manner to the STD
experiment and relies similarly on the relative relaxation properties of small molecules and
macromolecules. This experiment involves the application of a selective 180° pulse to the target
resonance and results in only those peaks experiencing NOEs to produce peaks in the resultant
spectrum.22 The transient NOE experiment also works most effectively on complexes with
dissociation constants (KD) between 10 nM and 1 mM.22 The transient NOE experiment is not a
difference experiment that involves subtracting one spectrum from another, and the accuracy is
thus less likely to be hampered by subtraction artifacts compared to STD-NMR experiments. This
means that the transient NOE experiment is also slightly more sensitive and therefore able to
visualize much weaker NOEs. One favorable aspect relating to sample preparation for both STD
and transient NOE NMR experiments is they do not require isotope labeled protein, which are
very expensive to produce, as they are essentially recorded as 1D 1H spectra.26
The origin of the pressure dependence for the rate of FMN reduction in PETNR with nicotinamide
coenzymes is attributed to a shortening of the DA acceptor distance and effects on the force
constants for vibrational modes potentially involved in promoting H-transfer. These conclusions
have been drawn from analysis of reaction kinetics and molecular dynamics simulations. A
method of directly interrogating the effect of pressure on the donor to acceptor distance in the
PETNR-NADPH complex is sought after, to provide means of further corroborating conclusions
drawn from kinetic data. Distance dependent NOE effects are observed over ~ 5 Å, and the H-
transfer distance in the PETNR-NADPH complex is thought be on the on the order of one bond
length. In addition, the binding regime for the complex (Ks = 0.1 ± 0.01 mM) means it is amenable
to study by the STD and transferred-NOE NMR methods.28 The availability of a suitable
nonreactive NADPH analogue, 1,4,5,6 tetrahydro-NADPH (NADPH4), enables study of a
conformation closely resembling the charge transfer complex. One drawback associated with
NADPH4,however, is that it is known to hydrolyse at the glycosydic linkage between the
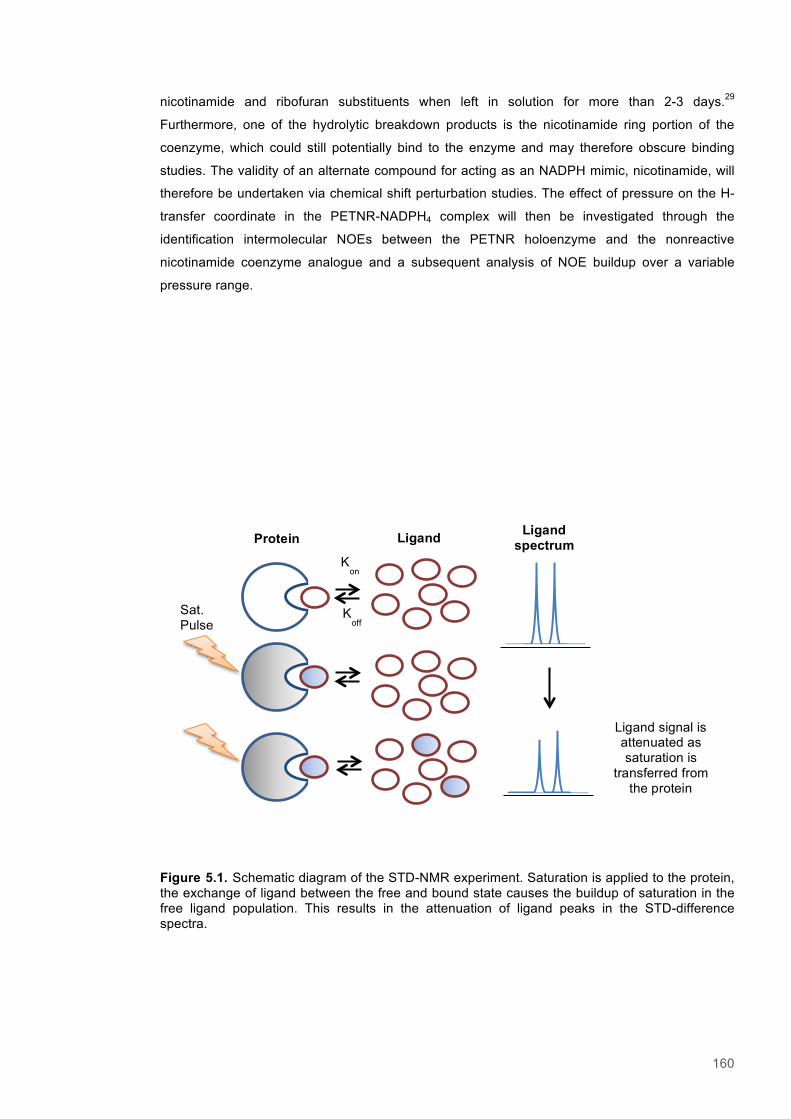
160
nicotinamide and ribofuran substituents when left in solution for more than 2-3 days.29
Furthermore, one of the hydrolytic breakdown products is the nicotinamide ring portion of the
coenzyme, which could still potentially bind to the enzyme and may therefore obscure binding
studies. The validity of an alternate compound for acting as an NADPH mimic, nicotinamide, will
therefore be undertaken via chemical shift perturbation studies. The effect of pressure on the H-
transfer coordinate in the PETNR-NADPH4 complex will then be investigated through the
identification intermolecular NOEs between the PETNR holoenzyme and the nonreactive
nicotinamide coenzyme analogue and a subsequent analysis of NOE buildup over a variable
pressure range.
Figure 5.1. Schematic diagram of the STD-NMR experiment. Saturation is applied to the protein, the exchange of ligand between the free and bound state causes the buildup of saturation in the free ligand population. This results in the attenuation of ligand peaks in the STD-difference spectra.
Ligand signal is attenuated as saturation is
transferred from the protein
Kon
Koff
Sat. Pulse
Protein Ligand
Ligand spectrum

161
5.3 Results
5.3.1 Resonance assignment
The assignment of backbone amide 1H-15N resonances was performed using a 1 mM 2H13C15N-
labelled, perdeuterated PETNR sample at 298 K, pH 7. The peaks observed in the 2D-1H15N-
TROSY spectrum provided the starting point for assignment, each corresponding with a different
backbone amide group. The CO, Cα and Cβ resonances from the three-dimensional spectra
were then grouped into spin systems with the corresponding 1H15N-TROSY peak appearing at the
same 1H and 15N chemical shifts. The spin systems were then sequentially linked on the basis of
the resonances of adjacent Cα and CO atoms (Figures 5.2-5.4). The characteristic chemical
shifts of the side chain carbon atoms of serine, threonine, alanine and glycine were then used to
identify the corresponding stretch of amino acids in the primary sequence of PETNR.30,31 The
average chemical shifts of Cα and Cβ atoms for the majority of amino acid side chains appeared
around 50-60 ppm (Figure 5.2) and 30-40 ppm (Figure 5.3), respectively. Spin systems
corresponding with glycines were easily identifiable from their side chain resonances due to the
absence of a Cβ peak and by a Cα peak appearing close to 45 ppm (Figure 5.2). For threonines
and serines, the Cβ atom resonances appeared downfield of those of the Cα atoms, at around
60-75 ppm, due to the influence of the highly electronegative hydroxyl group (Figure 5.4). For
alanine residues, characteristic upfield Cβ resonances were observed at around 15-25 ppm
(Figure 5.4).
The spectra acquired had an adequate signal to noise that enabled the majority of the expected
backbone peaks to be observed. A 90 % assignment of the expected 344 peaks, total residues
minus the 20 prolines, was achieved (Figure 5.5). Out of the 322 peaks observed in total, there
were 310 peaks that were successfully assigned to the corresponding residue. Meaning that
there were 12 peaks that were present, but not assigned and 22 peaks that were absent from the 1H-15N HSQC spectrum. The majority of those residues that were not assigned appeared to be
within regions of β-strand, or α-helical topology (Figure 5.6). These may have been more
resistant to unfolding and therefore not have undergone fully complete deuterium to protium back
exchange.32 It has been shown previously that backbone proton exchange rates can vary by over
eight orders of magnitude.32 This variation has been attributed to involvement in H-bonded
structures, such as β-sheets and α-helices, and relative solvent accessibility, or the extent to
which they are buried within the protein structure.33-35 For most of the residues that defied
assignment, it is conceivable that they would have been resistant to exchange, as they are
located within the secondary structural elements located within the largely solvent inaccessible
walls of the central TIM-barrel fold. There was one stretch of residues, 272-276, which defied
assignment, but does appear within a secondary structural element. The 90 % assignment did,
however, include all active site residues and therefore provided a suitable basis for analysis of
chemical shift perturbations upon ligand binding.
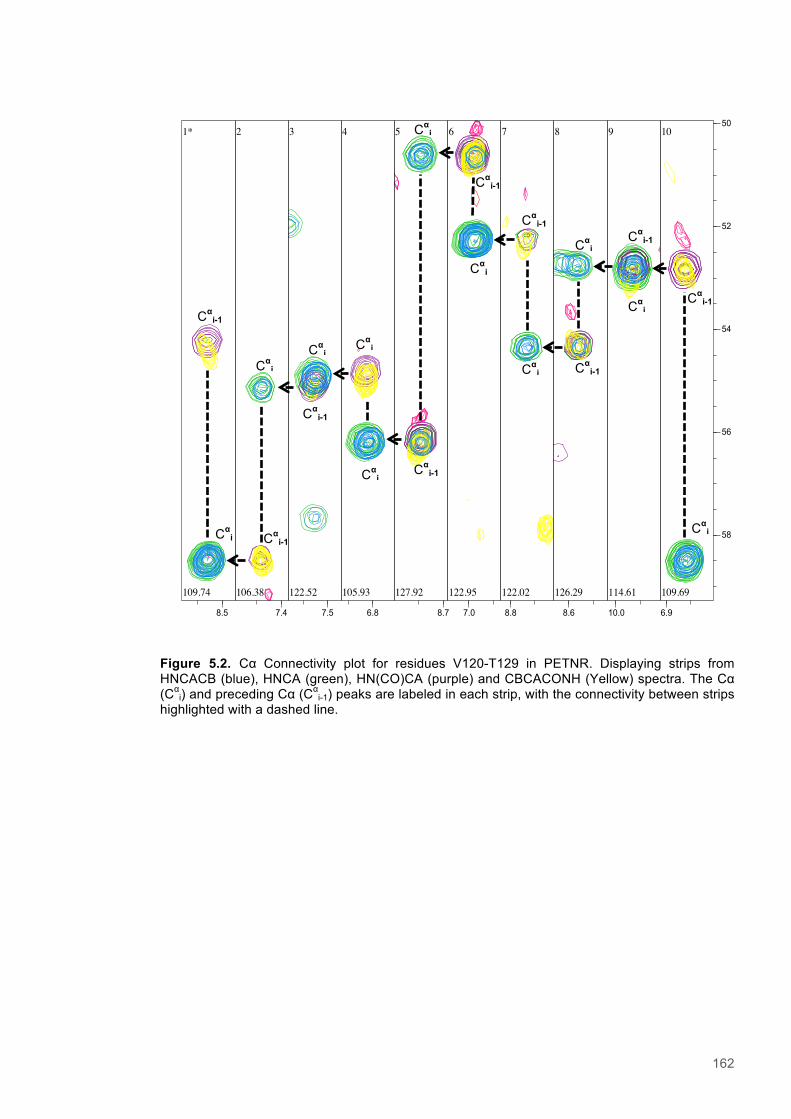
162
Figure 5.2. Cα Connectivity plot for residues V120-T129 in PETNR. Displaying strips from HNCACB (blue), HNCA (green), HN(CO)CA (purple) and CBCACONH (Yellow) spectra. The Cα (Cα
i) and preceding Cα (Cαi-1) peaks are labeled in each strip, with the connectivity between strips
highlighted with a dashed line.
1*
109.74
2
106.38
3
122.52
4
105.93
5
127.92
6
122.95
7
122.02
8
126.29
9
114.61
10
109.69
8.5 7.4 7.5 6.8 8.7 7.0 8.8 8.6 10.0 6.9
50
52
54
56
58Cαi
Cαi
Cαi
Cαi
Cαi
Cαi
Cαi
Cαi
Cαi
Cαi Cα
i-1
Cαi-1
Cαi-1
Cαi-1
Cαi-1
Cαi-1
Cαi-1
Cαi-1
Cαi-1
Cαi
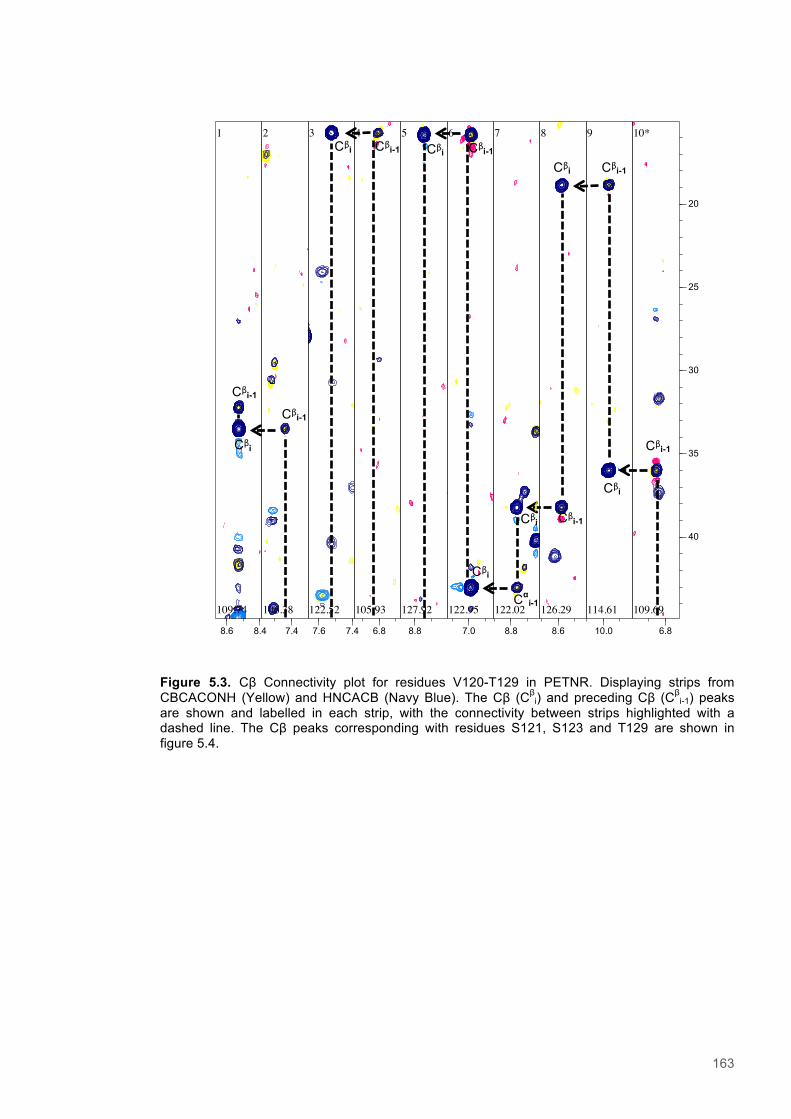
163
Figure 5.3. Cβ Connectivity plot for residues V120-T129 in PETNR. Displaying strips from CBCACONH (Yellow) and HNCACB (Navy Blue). The Cβ (Cβ
i) and preceding Cβ (Cβi-1) peaks
are shown and labelled in each strip, with the connectivity between strips highlighted with a dashed line. The Cβ peaks corresponding with residues S121, S123 and T129 are shown in figure 5.4.
1
109.74
2
106.38
3
122.52
4
105.93
5
127.92
6
122.95
7
122.02
8
126.29
9
114.61
10*
109.69
8.48.6 7.4 7.47.6 6.8 8.8 7.0 8.8 8.6 10.0 6.8
20
25
30
35
40
Cβi-1
Cβi-1
Cβi-1 Cβi-1
Cβi-1
Cβi
Cβi Cβi
Cβi
Cβi
Cβi
Cβi
Cβi-1
Cαi-1
Cβi-1
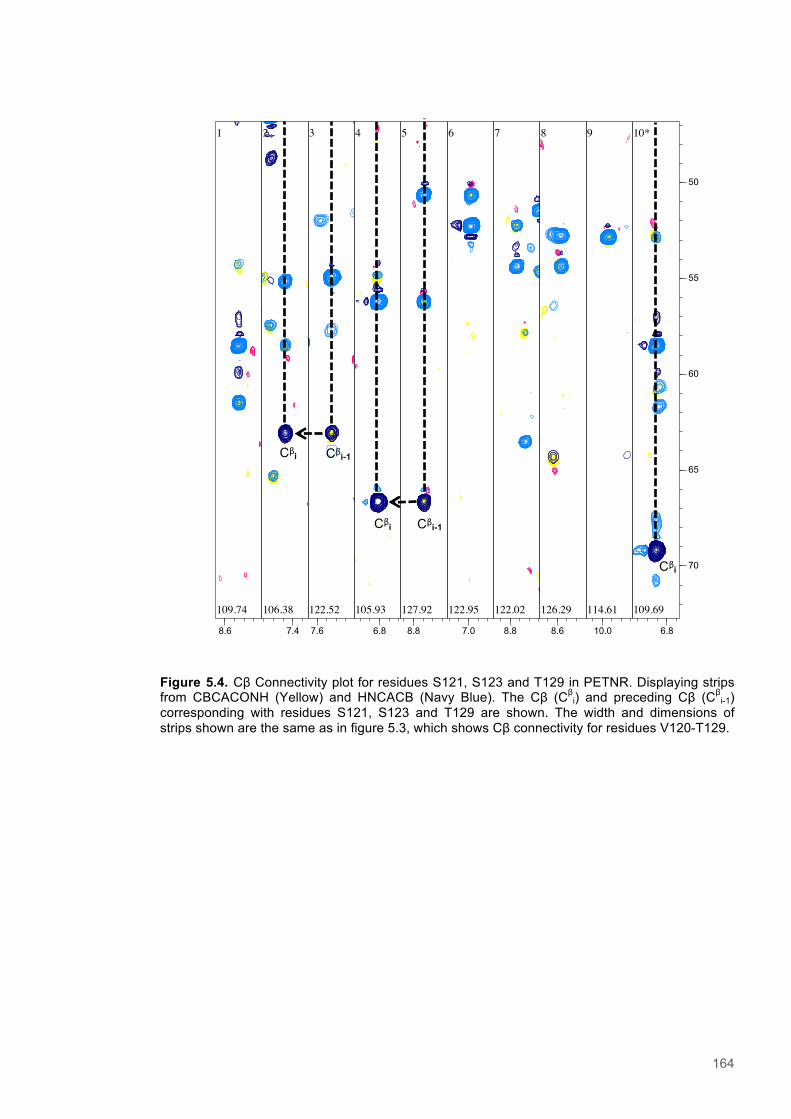
164
Figure 5.4. Cβ Connectivity plot for residues S121, S123 and T129 in PETNR. Displaying strips from CBCACONH (Yellow) and HNCACB (Navy Blue). The Cβ (Cβ
i) and preceding Cβ (Cβi-1)
corresponding with residues S121, S123 and T129 are shown. The width and dimensions of strips shown are the same as in figure 5.3, which shows Cβ connectivity for residues V120-T129.
1
109.74
2
106.38
3
122.52
4
105.93
5
127.92
6
122.95
7
122.02
8
126.29
9
114.61
10*
109.69
8.6 7.4 7.6 6.8 8.8 7.0 8.8 8.6 10.0 6.8
50
55
60
65
70
Cβi-1
Cβi-1
Cβi
Cβi
Cβi
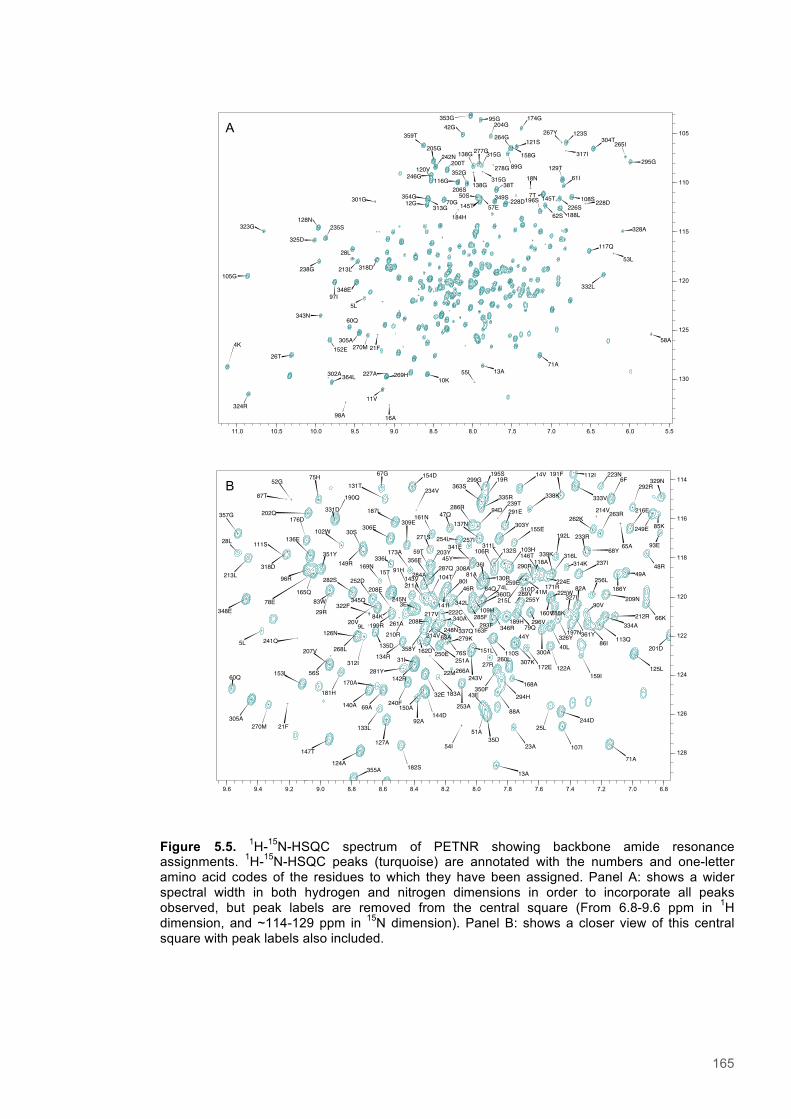
165
Figure 5.5. 1H-15N-HSQC spectrum of PETNR showing backbone amide resonance assignments. 1H-15N-HSQC peaks (turquoise) are annotated with the numbers and one-letter amino acid codes of the residues to which they have been assigned. Panel A: shows a wider spectral width in both hydrogen and nitrogen dimensions in order to incorporate all peaks observed, but peak labels are removed from the central square (From 6.8-9.6 ppm in 1H dimension, and ~114-129 ppm in 15N dimension). Panel B: shows a closer view of this central square with peak labels also included.
355A 13A
124A182S
71A147T
{264}
23A 107I127A
244D133L 25L270M
305A 92A88A
140A 69A
60Q 153L170A
253A240F294H
168A183A32E181H 350F
281Y
207V
142R
27R
159I125L172E
251A122A
134R 250E162D241Q
76S 110S
126N
312I
201D135D5L358Y 300A
40L
9L
113Q
208E337Q 197N
326Y346R
189H
361Y334A
212R199R
210R79Q
327I90V
296V
345Q
288K
82A
66K
284A
255Y342L
74L
348E
252D 104T
109H
91H256L
209N
282S
29R
287Q169N
310D
356E146T
186Y
237I
49A
118A
96R
173A 106R351Y103H
314K
203Y336L
341E
213L
192L111S
136E
48R
28L68Y
271S102W
309E
257I
155E176D
254L
306E 137N 303Y357G 161N 263R
262K216E
47Q286R
291E
65A
187L 214V202Q
249E
234V338K
292R363S52G
75H131T
6F 329N191F67G 14V154D 195S
333V
223N112I
94D
245N
30S
149R
93E
331D
190Q
85K
335R
19R
35D
15T
43E
51A
144D150A
243V
151L
44Y
307K
214V248N
340A
86I
222C3E
293F285F
360D
143V46R 64Q
225W
160V
308A
141I
80I
36I81A
290R
224E
316L
165Q78E
59T
31I
132S
130R
322F
21F
20V
208E
22M
83W
87T
54I
56S
311L
163F
211A
279K
41M
339K
261A
260L
45Y
63A
84K
171R
215L
217V
233R
239T
259E
266A
268L
289V
299G
318D
6.87.07.27.47.67.88.08.28.48.68.89.09.29.49.6
114
116
118
120
122
124
126
128
324R11V
364L 227A10K
4K
13A
26T71A
152E 270M58A305A
60Q343N
5L97I
348E
105G
332L
238G 213L
28L117Q
325D
235S323G 328A128N
196S
188L
12G
62S
228D 228D349S
145T145T70G
226S
50S 7T38T
61I352G
116G
120V 129T246G
200T242N 138G 315G277G
295G
205G 265I
89G
264G 304T121S359T 123S
204G42G174G95G353G
57E
354G 108S
158G
16A
18N
21F
53L
55I
98A
184H
278G
302A
313G
317I
267Y
138G315G
269H
301G
318D
206S
5.56.06.57.07.58.08.59.09.510.010.511.0
105
110
115
120
125
130
A
B
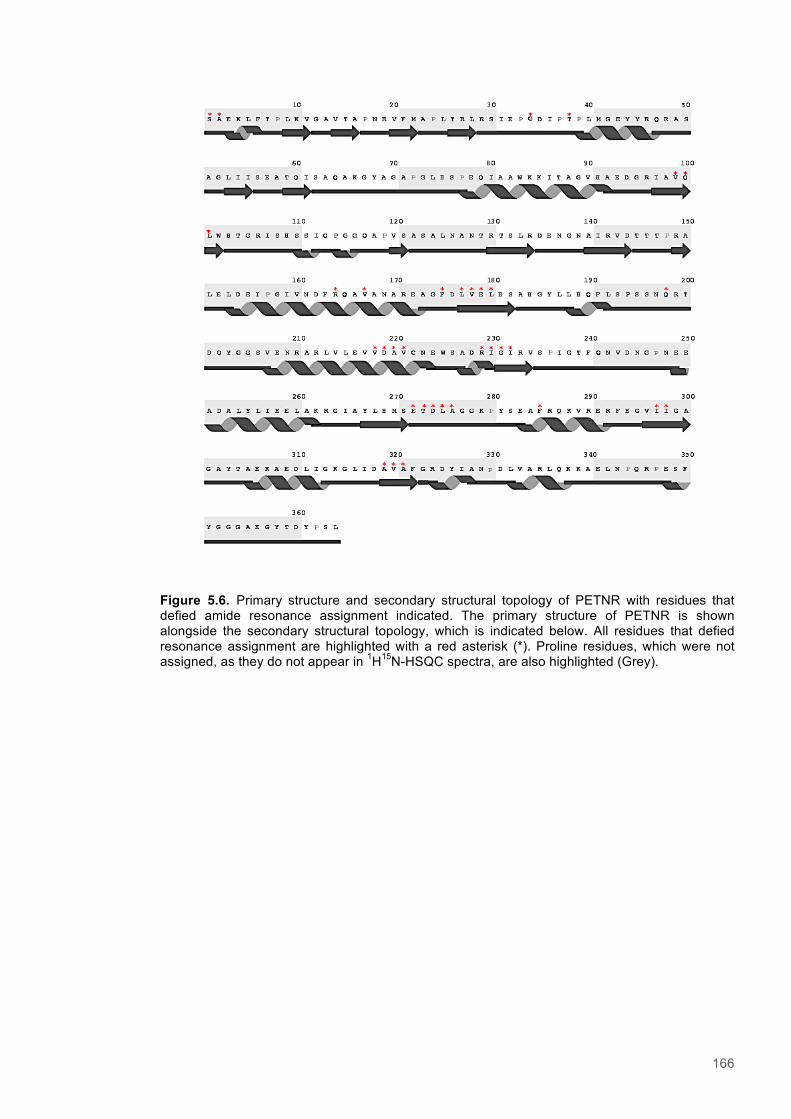
166
Figure 5.6. Primary structure and secondary structural topology of PETNR with residues that defied amide resonance assignment indicated. The primary structure of PETNR is shown alongside the secondary structural topology, which is indicated below. All residues that defied resonance assignment are highlighted with a red asterisk (*). Proline residues, which were not assigned, as they do not appear in 1H15N-HSQC spectra, are also highlighted (Grey).
167
5.3.2 Chemical shift perturbation studies to assess ligand binding to PETNR
Chemical shift perturbation studies were performed to analyse the binding of NADPH4 to PETNR
and confirm the formation of a suitable charge-transfer complex, with the coenzyme bound within
the active site, prior undertaking further experiments (Figure 5.7). This consisted of adding 10
mM, 20 mM and 30 mM NADPH4 to a sample of 1 mM 15N PETNR, pH 7, and recording 1H-15N
HSQC spectra prior to and after each addition of substrate. In addition, the binding of
nicotinamide to PETNR was also assessed. This was done by adding 10 mM, 20 mM and 30 mM
nicotinamide, to a sample of 1 mM 15N PETNR, pH 7, and recording 1H-15N HSQC spectra of the
unbound enzyme sample and after each addition of the substrate (Figure 5.8). Nicotinamide was
chosen as candidate to act as a ligand mimic as it closely resembles the reactive substituent of
NADPH, but lacks the glycosidic linkage between nicotinamide and ribofuran portions that is
known to hydrolyse in solution.
A previous study identified a sub-set of residues to be effected by NADPH4 binding.29 A selection
of residues from this set was chosen to compare the chemical shift perturbations recorded here
(Figure 5.9). Those residues selected are from the Thr26 Loop (Thr26, Arg27), the Tyr68 Loop
(Lys66, Tyr68), the β-hairpin flap (Thr129, Arg130), His184 patch (His181, His184), the Gln241
loop (Arg233) and the Tyr351 loop (Y351). The majority of these residues showed similar
chemical shift changes upon the addition of both ligands; this was the case for Thr26, Lys66,
Trp102, Tyr68, Thr129, Arg130, His184, Arg133 and Tyr351. Conversely, the peaks
corresponding with Tyr68, Arg48 and Arg233 showed no noticeable chemical shift change upon
the addition of either ligand. The response of the peaks assigned to Thr26 and His184, which are
thought to directly H-bond to the coenzyme from available crystal structure coordinates, indicated
the formation of stable complexes with ligands bound within the active site.9,36 All resonances
analysed maintained a similar intensity throughout the ligand titrations and remained as single
peaks. This implicates a fast-exchange regime between the ligand-free and ligand-bound forms of
the enzyme for both complexes relative to the experimental timescale of the NMR
measurements.37
Three of the residues selected for comparison showed markedly different responses to the
presence of the two ligands. Two of these, H181 and Y351, showed a noticeable chemical shift
change following the addition of NADPH4, but not nicotinamide. By contrast, the peak for Arg27
showed a large chemical shift change following the addition of nicotinamide, but only a minor
chemical shift response to the addition of NADPH4. Both His181 and Tyr351 line the active site
close to the substrate binding region and are proposed to play a role in determining ligand
specificity. His181 is directly H-bonded to the amide group of the nicotinamide substituent.9 The
side chain of Y351 is located in between the nicotinamide, phosphate and ribose portions of
NADH in the crystal structure of this complex and interacts via a VDW contact area with both the
coenzyme and the edge of the isoalloxazine portion of the FMN (Figure 5.10).9,38,39 It is feasible
that the binding of the bulkier substrate, NADPH4, which is essentially nicotinamide plus
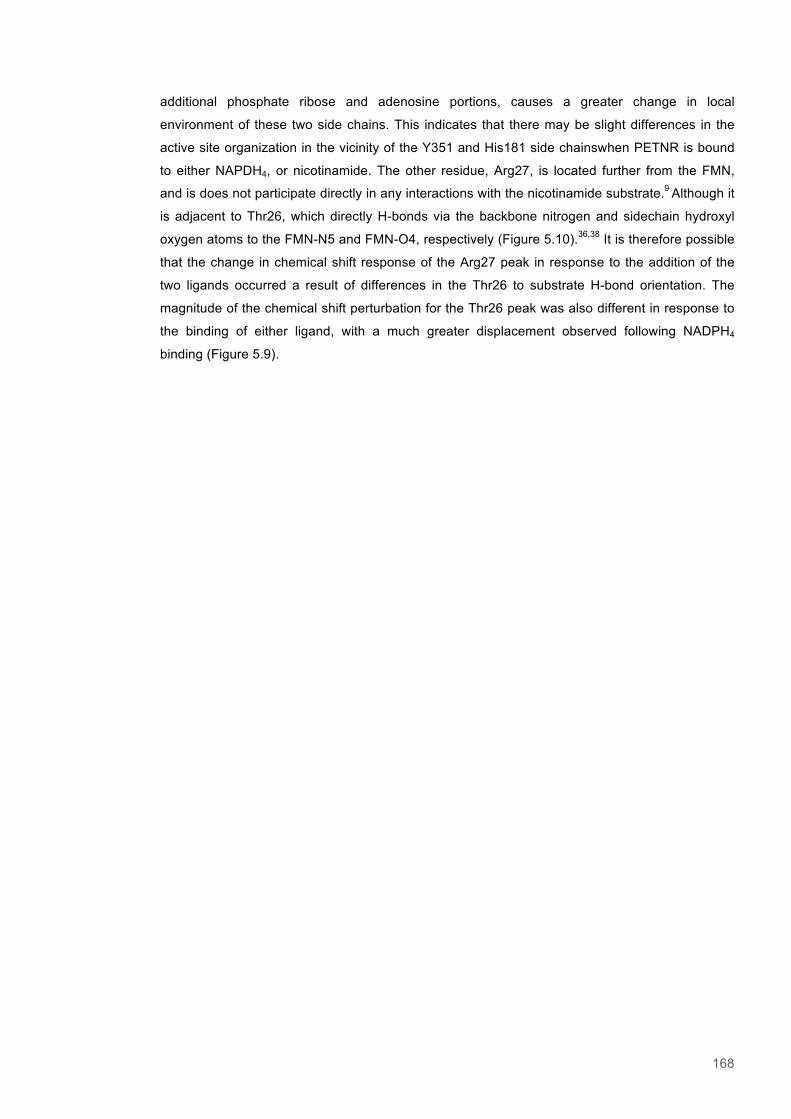
168
additional phosphate ribose and adenosine portions, causes a greater change in local
environment of these two side chains. This indicates that there may be slight differences in the
active site organization in the vicinity of the Y351 and His181 side chainswhen PETNR is bound
to either NAPDH4, or nicotinamide. The other residue, Arg27, is located further from the FMN,
and is does not participate directly in any interactions with the nicotinamide substrate.9 Although it
is adjacent to Thr26, which directly H-bonds via the backbone nitrogen and sidechain hydroxyl
oxygen atoms to the FMN-N5 and FMN-O4, respectively (Figure 5.10).36,38 It is therefore possible
that the change in chemical shift response of the Arg27 peak in response to the addition of the
two ligands occurred a result of differences in the Thr26 to substrate H-bond orientation. The
magnitude of the chemical shift perturbation for the Thr26 peak was also different in response to
the binding of either ligand, with a much greater displacement observed following NADPH4
binding (Figure 5.9).

169
Figure 5.7. 1H-15N spectra displaying chemical shift dispersions observed upon the addition of NADPH4 to PETNR. Overlays of 1H-15N HSQC spectra recorded on a sample of 1 mM 15N-PETNR (Blue) after the addition of 10 mM (Red), 20 mM (Green) and 30 mM (Purple) concentrations of NADPH4.
1H Chemical Shift
15N
Che
mic
al S
hift
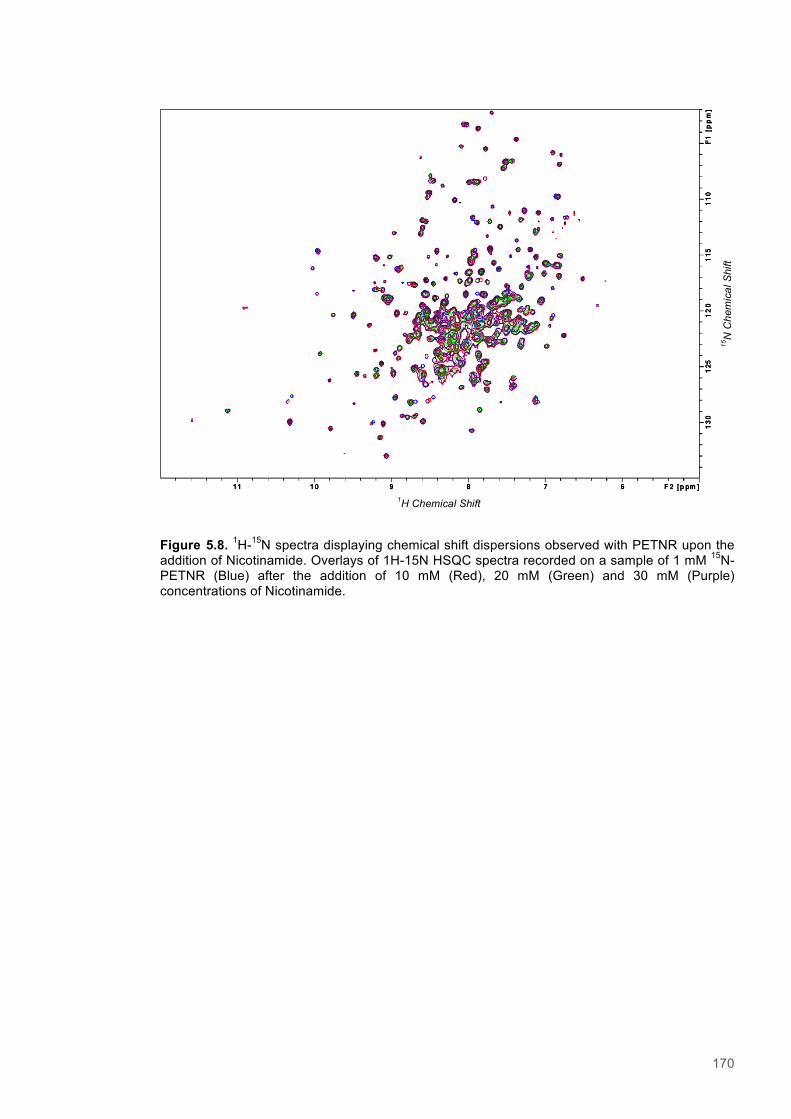
170
Figure 5.8. 1H-15N spectra displaying chemical shift dispersions observed with PETNR upon the addition of Nicotinamide. Overlays of 1H-15N HSQC spectra recorded on a sample of 1 mM 15N-PETNR (Blue) after the addition of 10 mM (Red), 20 mM (Green) and 30 mM (Purple) concentrations of Nicotinamide.
1H Chemical Shift
15N
Che
mic
al S
hift

171
Figure 5.9. Chemical shift changes of peaks assigned to active site residues and key secondary structural features in response to the addition of Nicotinamide and NADPH4. The chemical shift changes of peaks corresponding to active site residues and other key secondary structural features upon the addition of Nicotinamide (Residue labels in black) and NADPH4 (Residue labels in red) are shown. The panels show 1H-15N HSQC spectra of a ligand free 1 mM sample of 15N-PETNR (Blue) and those recorded after the addition 10 mM (Red), 20 mM (Green) and 30 mM (Purple) concentrations of each ligand (Nicotinamide/NADPH4). For each panel, 1H chemical shift in ppm is labeled on the Y-axis and 15N chemical shifts in ppm are labeled on the 1H axis.
PETNR:Nicotinamide PETNR:NADPH4 PETNR:Nicotinamide PETNR:NADPH4
T26
10.1 10.3 10.5
129
128
R27
7.95 8 8.05
123.
8 12
3.4
R27
7.95 8 8.05
122.
8 12
3.4
10.1 10.3 10.5
129
128
T26
6.85 6.90 6.95
120.
8 12
0.4
K66
6.85 6.90 6.95
118.
4 11
8
R48
6.8 6.85 6.9
118.
4 11
8
R48
6.85 6.9 6.95
120.
8 12
0.4
K66
8.75 8.8 8.85
118
117.
6 W102
7.2 7.25 7.3 11
8.4
118 Y68
8.7 8.75 8.88
118
117.
6 W102
7.2 7.25 7.3
118.
6 11
8.2
Y68
8.3 8.35 8.2
112.
6 11
2.2
H184
8.3 8.35 8.4
112.
6 11
2.2 H184
8.75 8.85 8.95
124.
4 12
4
H181 H181
7.85 7.9 7.95
119.
8 11
9.4
R130
6.75 6.8 6.85
110.
4 11
0
T129
6.75 6.8 6.85
110.
4 11
0 T129
7.85 7.9 7.95
119.
8 11
9.4 R130
Y351
8.9 9 9.1
120
119
Y351
8.95 9.
9.05
120
119
7.2 7.25 7.3
118.
4 11
8
7.25 7.3 7.35
118.
2 11
7.8
R233 R233
8.95 8.85 8.75
124
124.
4
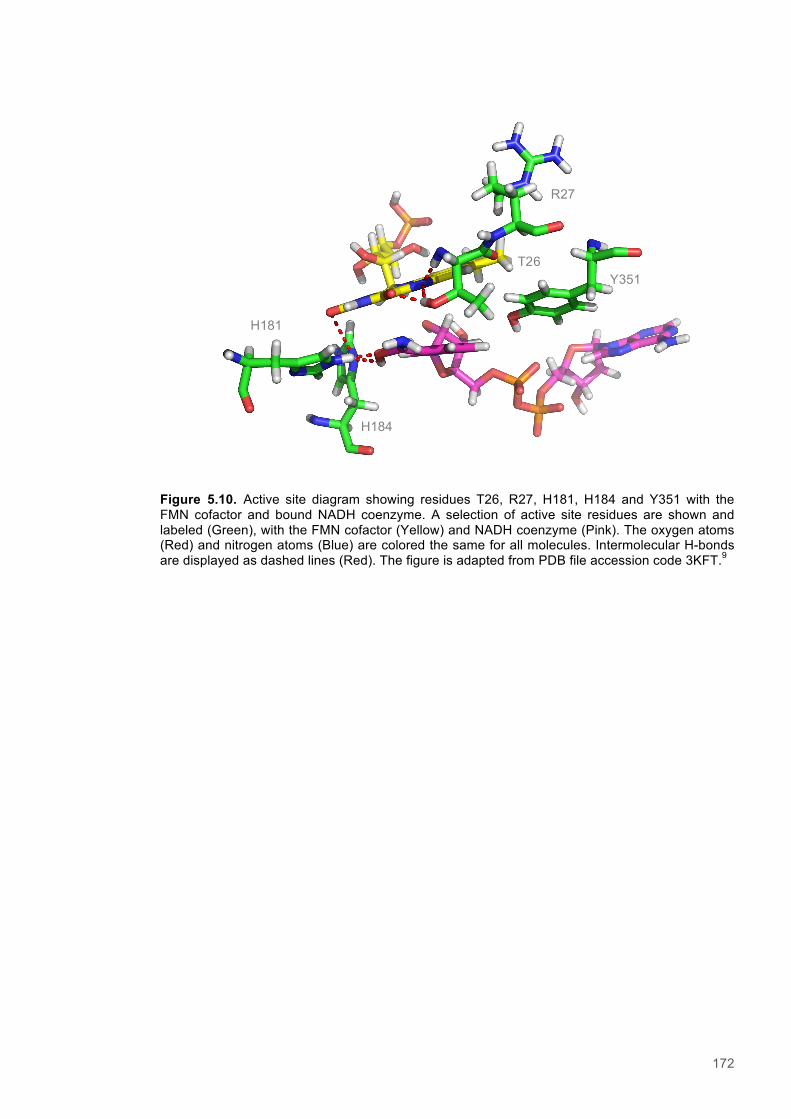
172
Figure 5.10. Active site diagram showing residues T26, R27, H181, H184 and Y351 with the FMN cofactor and bound NADH coenzyme. A selection of active site residues are shown and labeled (Green), with the FMN cofactor (Yellow) and NADH coenzyme (Pink). The oxygen atoms (Red) and nitrogen atoms (Blue) are colored the same for all molecules. Intermolecular H-bonds are displayed as dashed lines (Red). The figure is adapted from PDB file accession code 3KFT.9
T26
R27
Y351
H181
H184
173
5.5.3 A Saturation Transfer Difference (STD) NMR based study of cofactor to coenzyme
distances within the PETNR:Nicotinamide complex
Investigation of protein to substrate distances within the PETNR-nicotinamide complex was
undertaken using STD-NMR. Nicotinamide was chosen as a ligand mimic, as it closely resembles
the reactive portion of the NADPH substrate and was demonstrated via chemical shift
perturbation studies to bind in the active site of PETNR (See section 5.2.2). Furthermore,
nicotinamide lacks the glycosidic bond that can undergo hydrolysis and contribute to the
breakdown of an alternate ligand mimic, NADPH4. The relative build-up of STD intensities for the
four protons of nicotinamide were analysed by recording experiments with varied presaturation
pulse durations irradiating at either -0.35 ppm to target the protein side chain methyl groups, or
12.7 ppm to target the FMN-H3 resonance.30,40 The latter targets was chosen with the intention of
observing NOEs occurring over a distance representative of the H-transfer coordinate. The FMN-
H3 is the most suitable of the cofactor protons as it appears in a sparsely populated region of the 1H spectrum and therefore does not overlap with any other protein, or ligand peaks (Figures 5.11
& 5.12). The two FMN methyl groups were also attractive targets, but with chemical shifts of 1.9
ppm and 2.3 ppm, respectively, appear in a crowded region of the 1H spectrum.40 It would
therefore have been difficult to selectively target these methyl group resonances. Parallel
experiments with the saturation pulse offset set to target resonances of protein side chain methyl
groups (-0.35 ppm) were recorded to provide a comparison. Observing a difference in the transfer
of saturation to the nicotinamide in the two experiments, as indicated by the differential
attenuation of the ligand peaks, confirmed that magnetization transfer was occurring directly from
the FMN to the ligand and not by indirectly by alternate routes of spin diffusion.
After recording the NOE spectra, subsequent integration of the STD peaks corresponding with
the nicotinamide enabled quantification of the relative rates of saturation transfer for each ligand
proton (Figures 5.11 & 5.12). Varying the duration of the presaturation pulse (D2=0.2 s to D2=5 s)
enabled the saturation-time dependent buildup of the NOE to be observed, and determination of
the cross relaxation rate (ksat). A train of 12.5 ms long gauss-shaped pulses with B1 field strength
47.05 Hz was used for saturating pulses in all STD NMR experiments.27 Observing a difference in
the transfer of saturation to the nicotinamide in the two experiments, as indicated by the
differential attenuation of the ligand peaks, provided confidence that magnetization transfer was
occurring directly from the target resonances to the ligand and not indirectly by alternate routes of
spin diffusion. The off-resonance control was placed at the same frequency for all experiments
(40 ppm), where no protein or ligand signals are observed.
Initially, a Bruker STD-NMR pulse sequence (stddiffesgp) with a shaped pulse train for saturation
alternating between on and off resonance and a spoil pulse to destroy unwanted magnetization
was used. The sequence also includes solvent suppression via excitation sculpting with
gradients. The on-resonance irradiation pulse was placed at 12.7 ppm and the duration varied
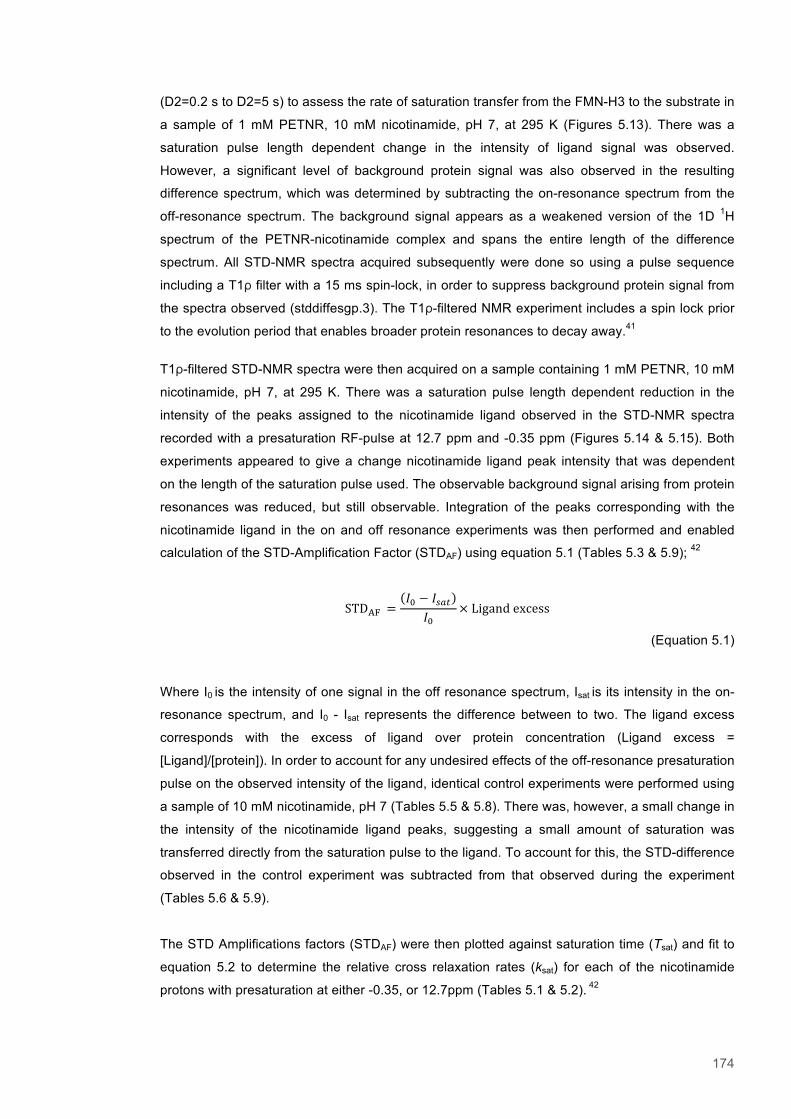
174
(D2=0.2 s to D2=5 s) to assess the rate of saturation transfer from the FMN-H3 to the substrate in
a sample of 1 mM PETNR, 10 mM nicotinamide, pH 7, at 295 K (Figures 5.13). There was a
saturation pulse length dependent change in the intensity of ligand signal was observed.
However, a significant level of background protein signal was also observed in the resulting
difference spectrum, which was determined by subtracting the on-resonance spectrum from the
off-resonance spectrum. The background signal appears as a weakened version of the 1D 1H
spectrum of the PETNR-nicotinamide complex and spans the entire length of the difference
spectrum. All STD-NMR spectra acquired subsequently were done so using a pulse sequence
including a T1ρ filter with a 15 ms spin-lock, in order to suppress background protein signal from
the spectra observed (stddiffesgp.3). The T1ρ-filtered NMR experiment includes a spin lock prior
to the evolution period that enables broader protein resonances to decay away.41
T1ρ-filtered STD-NMR spectra were then acquired on a sample containing 1 mM PETNR, 10 mM
nicotinamide, pH 7, at 295 K. There was a saturation pulse length dependent reduction in the
intensity of the peaks assigned to the nicotinamide ligand observed in the STD-NMR spectra
recorded with a presaturation RF-pulse at 12.7 ppm and -0.35 ppm (Figures 5.14 & 5.15). Both
experiments appeared to give a change nicotinamide ligand peak intensity that was dependent
on the length of the saturation pulse used. The observable background signal arising from protein
resonances was reduced, but still observable. Integration of the peaks corresponding with the
nicotinamide ligand in the on and off resonance experiments was then performed and enabled
calculation of the STD-Amplification Factor (STDAF) using equation 5.1 (Tables 5.3 & 5.9); 42
STD!" =!! − !!"#
!!× Ligand excess
(Equation 5.1)
Where I0 is the intensity of one signal in the off resonance spectrum, Isat is its intensity in the on-
resonance spectrum, and I0 - Isat represents the difference between to two. The ligand excess
corresponds with the excess of ligand over protein concentration (Ligand excess =
[Ligand]/[protein]). In order to account for any undesired effects of the off-resonance presaturation
pulse on the observed intensity of the ligand, identical control experiments were performed using
a sample of 10 mM nicotinamide, pH 7 (Tables 5.5 & 5.8). There was, however, a small change in
the intensity of the nicotinamide ligand peaks, suggesting a small amount of saturation was
transferred directly from the saturation pulse to the ligand. To account for this, the STD-difference
observed in the control experiment was subtracted from that observed during the experiment
(Tables 5.6 & 5.9).
The STD Amplifications factors (STDAF) were then plotted against saturation time (Tsat) and fit to
equation 5.2 to determine the relative cross relaxation rates (ksat) for each of the nicotinamide
protons with presaturation at either -0.35, or 12.7ppm (Tables 5.1 & 5.2). 42
175
STD!" = STD!"#(1 − exp −!!"#!!"# )
(Equation 5.2)
Where STD stands for the saturation transfer difference corresponding with a given proton at
saturation time, STDmax is the maximal STD intensity, Tsat is the saturation time used and ksat is the
observed saturation rate constant. The initial rates (ksat) of saturation build-up observed for the
four nicotinamide protons varied between 0.08 and 0.75 when on resonance irradiation was
placed at -0.35 ppm (Table 5.1). The greatest rates of saturation transfer were determined for the
H4 (ksat = 0.51 s-1) and H5 protons (ksat = 0.54 s-1), and the next largest was for H6 (ksat = 0.3).
However, the lowest value obtained with presaturation at -0.35 ppm was for the H2 and was
negligible (ksat = 0.08 s-1). The rates were greater for all protons, varying between 1.16 and 1.72,
with irradiation at 12.7 ppm (Table 5.2). The rates of saturation build-up for protons H2 (ksat = 1.09
s-1) and H4 (ksat = 0.84 s-1) were greatest, and the rates corresponding with protons H5 (ksat = 0.54
s-1) and H6 (ksat = 0.75 s-1) were the smallest, but significantly larger than those observed with
presaturation at -0.35 ppm. The differences observed under each of conditions were significant,
i.e. outside the error values determined for parameters from exponential fits. This indicates that
the route by which magnetization was transferred to the ligand was different in either experiment,
and suggests that saturation may have transferred directly from the FMN-H3 to the ligand protons
when presaturation was placed at 12.7 ppm.
The interproton distances from FMN-H3 to the four-nicotinamide ring protons were measured
from the coordinates of the most suitable crystal structure available, showing PETNR with NADH4
bound (Figure 5.17, panel A). A comparison of the rate of saturation build-up for the nicotinamide
ring protons versus the corresponding interproton distances shows a reasonably strong negative
correlation for the three shortest NOE distances (Figure 5.17, panel B). The fastest rate of
saturation transfer was observed for the H2 proton, which is located only 5.3 Å from the FMN-H3
and is the closest of the nicotinamide ring protons. The next two fastest rates of saturation build-
up correlated with next shortest NOE distances, corresponding with protons H4 and H5.
However, the largest NOE distance, 8.6 Å for proton H6, did not correspond with slowest rate of
saturation build-up. The poor correlation between rate of saturation build-up and interproton
distance observed here could indicate that the conformation of the bound nicotinamide is not
identical to that of the nicotinamide portion of the NADH4 in the available crystal structure and the
distance over which the transfer of saturation is occurring is different to that measured within the
PENTR:NADH4 complex. However, the distances above 6 Å are beyond that which direct NOE
transfer is expected to occur.22 In addition, saturation is known to propagate quickly through large
proteins.43 Hence It is not possible to rule out some contribution of indirect transfer of
magnetization via alternate routes of spin diffusion, which may have obscured the correlation
between observed rates of saturation transfer and interproton distances. Due to the weak
correlation between interproton distance and the possibility that the measurement was affected
176
by spin diffusion effects, it was decided to pursue an alternative relaxation-based distance
measure.
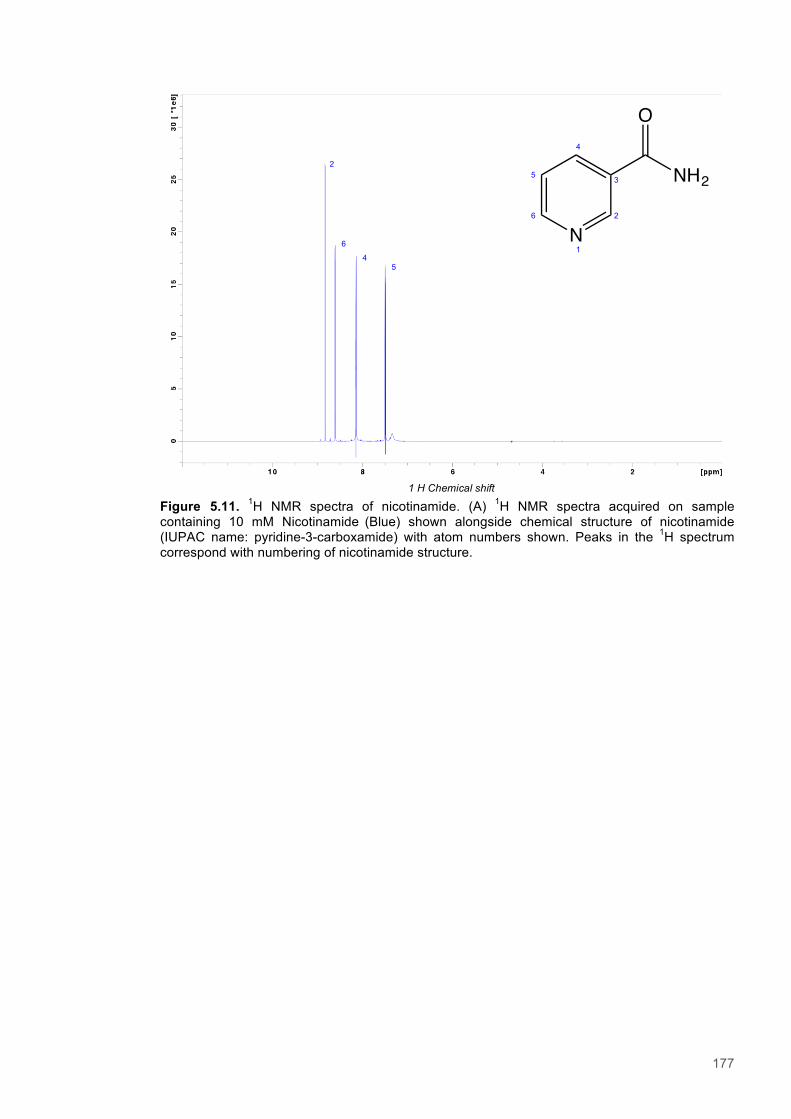
177
Figure 5.11. 1H NMR spectra of nicotinamide. (A) 1H NMR spectra acquired on sample containing 10 mM Nicotinamide (Blue) shown alongside chemical structure of nicotinamide (IUPAC name: pyridine-3-carboxamide) with atom numbers shown. Peaks in the 1H spectrum correspond with numbering of nicotinamide structure.
N
O
NH2
1
6
5
4
3
2
2
6
5 4
1 H Chemical shift
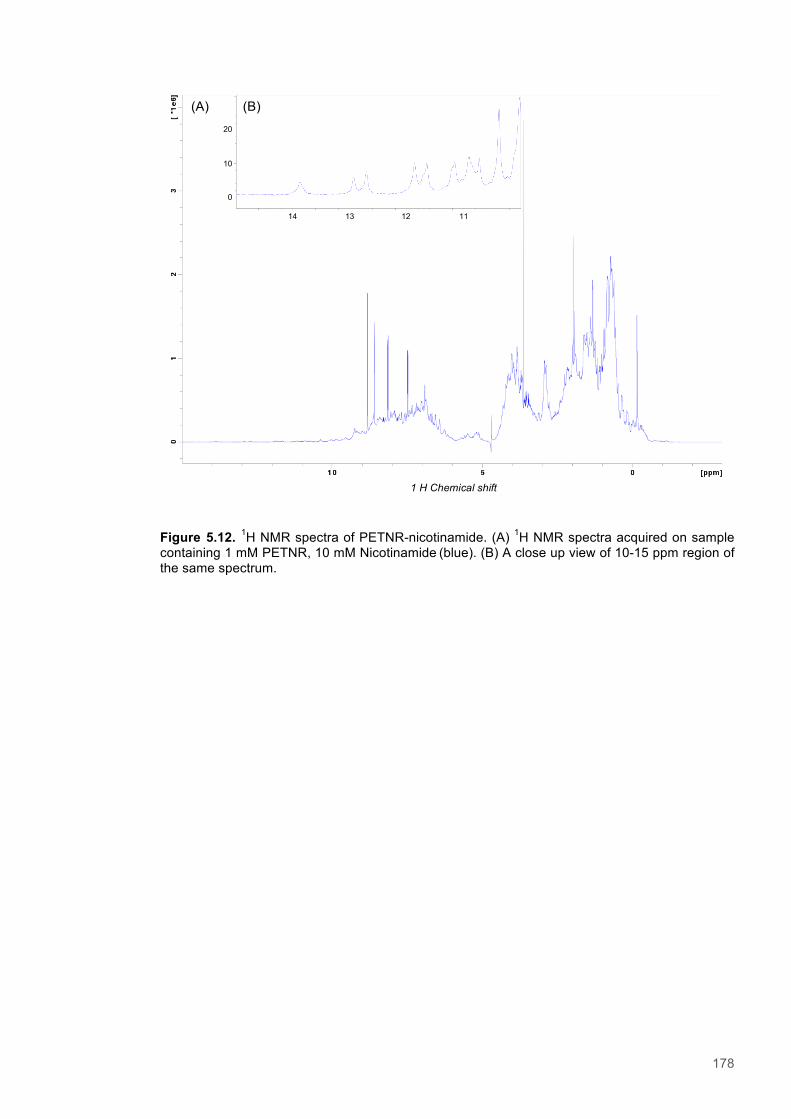
178
Figure 5.12. 1H NMR spectra of PETNR-nicotinamide. (A) 1H NMR spectra acquired on sample containing 1 mM PETNR, 10 mM Nicotinamide (blue). (B) A close up view of 10-15 ppm region of the same spectrum.
(A)
10
0
20
(B)
14 13 12 11
1 H Chemical shift
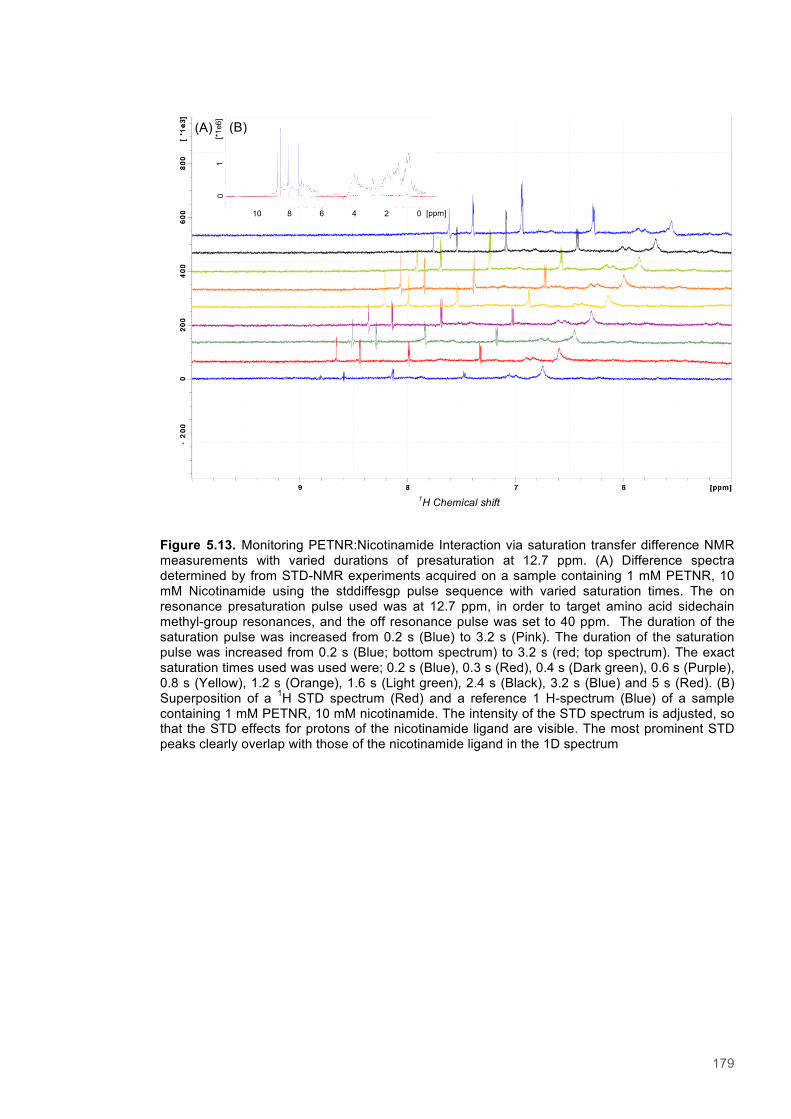
179
Figure 5.13. Monitoring PETNR:Nicotinamide Interaction via saturation transfer difference NMR measurements with varied durations of presaturation at 12.7 ppm. (A) Difference spectra determined by from STD-NMR experiments acquired on a sample containing 1 mM PETNR, 10 mM Nicotinamide using the stddiffesgp pulse sequence with varied saturation times. The on resonance presaturation pulse used was at 12.7 ppm, in order to target amino acid sidechain methyl-group resonances, and the off resonance pulse was set to 40 ppm. The duration of the saturation pulse was increased from 0.2 s (Blue) to 3.2 s (Pink). The duration of the saturation pulse was increased from 0.2 s (Blue; bottom spectrum) to 3.2 s (red; top spectrum). The exact saturation times used was used were; 0.2 s (Blue), 0.3 s (Red), 0.4 s (Dark green), 0.6 s (Purple), 0.8 s (Yellow), 1.2 s (Orange), 1.6 s (Light green), 2.4 s (Black), 3.2 s (Blue) and 5 s (Red). (B) Superposition of a 1H STD spectrum (Red) and a reference 1 H-spectrum (Blue) of a sample containing 1 mM PETNR, 10 mM nicotinamide. The intensity of the STD spectrum is adjusted, so that the STD effects for protons of the nicotinamide ligand are visible. The most prominent STD peaks clearly overlap with those of the nicotinamide ligand in the 1D spectrum
(A) (B)
10 8 6 4 2 0 [ppm] 0
1 [*
1e6]
1H Chemical shift
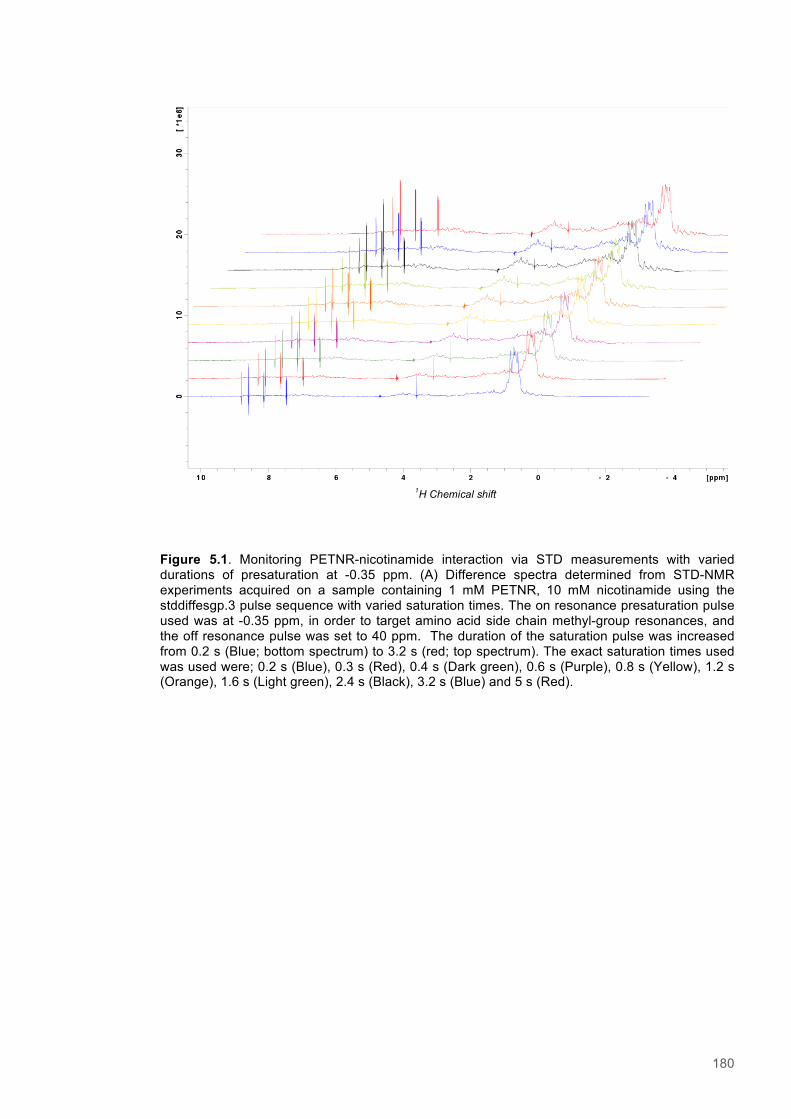
180
Figure 5.1. Monitoring PETNR-nicotinamide interaction via STD measurements with varied durations of presaturation at -0.35 ppm. (A) Difference spectra determined from STD-NMR experiments acquired on a sample containing 1 mM PETNR, 10 mM nicotinamide using the stddiffesgp.3 pulse sequence with varied saturation times. The on resonance presaturation pulse used was at -0.35 ppm, in order to target amino acid side chain methyl-group resonances, and the off resonance pulse was set to 40 ppm. The duration of the saturation pulse was increased from 0.2 s (Blue; bottom spectrum) to 3.2 s (red; top spectrum). The exact saturation times used was used were; 0.2 s (Blue), 0.3 s (Red), 0.4 s (Dark green), 0.6 s (Purple), 0.8 s (Yellow), 1.2 s (Orange), 1.6 s (Light green), 2.4 s (Black), 3.2 s (Blue) and 5 s (Red).
1H Chemical shift
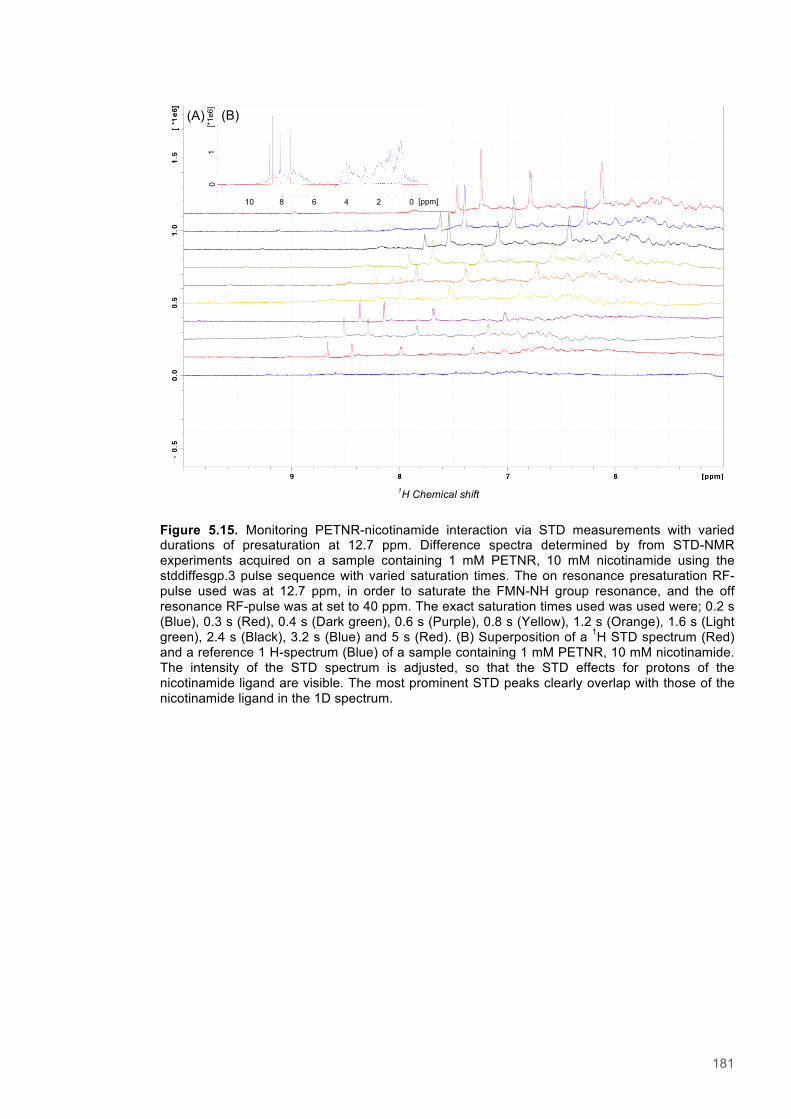
181
Figure 5.15. Monitoring PETNR-nicotinamide interaction via STD measurements with varied durations of presaturation at 12.7 ppm. Difference spectra determined by from STD-NMR experiments acquired on a sample containing 1 mM PETNR, 10 mM nicotinamide using the stddiffesgp.3 pulse sequence with varied saturation times. The on resonance presaturation RF-pulse used was at 12.7 ppm, in order to saturate the FMN-NH group resonance, and the off resonance RF-pulse was at set to 40 ppm. The exact saturation times used was used were; 0.2 s (Blue), 0.3 s (Red), 0.4 s (Dark green), 0.6 s (Purple), 0.8 s (Yellow), 1.2 s (Orange), 1.6 s (Light green), 2.4 s (Black), 3.2 s (Blue) and 5 s (Red). (B) Superposition of a 1H STD spectrum (Red) and a reference 1 H-spectrum (Blue) of a sample containing 1 mM PETNR, 10 mM nicotinamide. The intensity of the STD spectrum is adjusted, so that the STD effects for protons of the nicotinamide ligand are visible. The most prominent STD peaks clearly overlap with those of the nicotinamide ligand in the 1D spectrum.
(A) (B)
10 8 6 4 2 0 [ppm] 0
1 [*
1e6]
1H Chemical shift
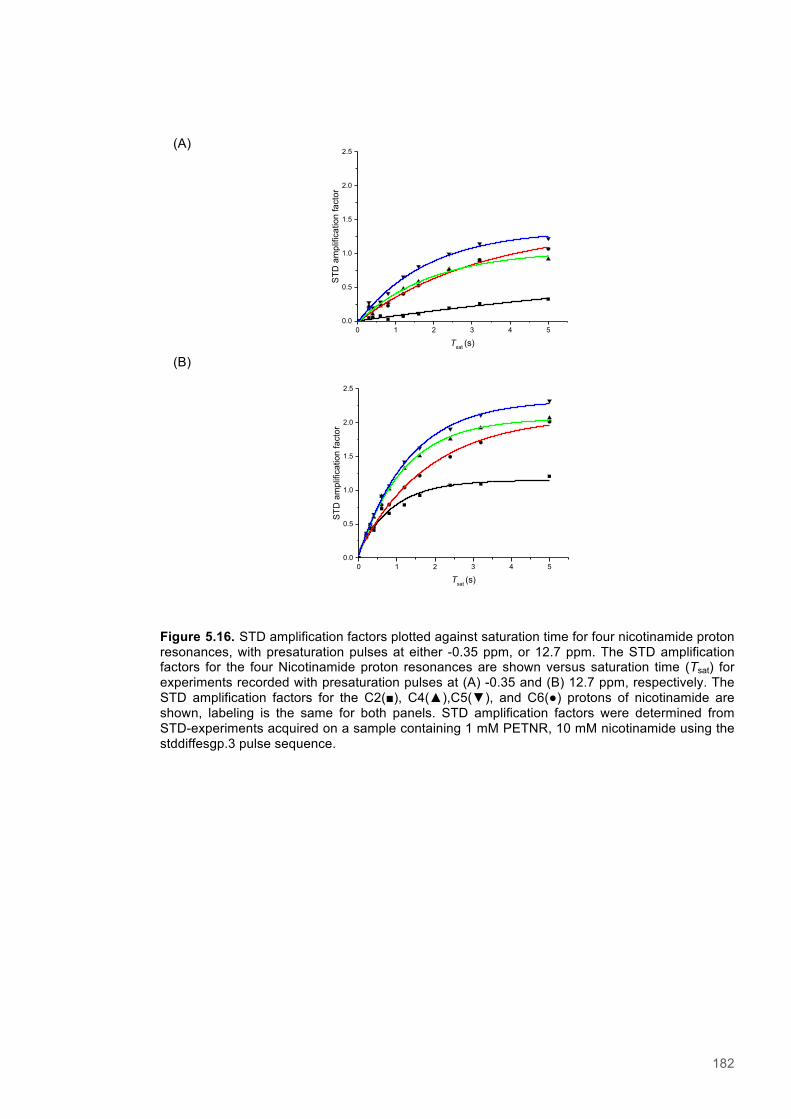
182
Figure 5.16. STD amplification factors plotted against saturation time for four nicotinamide proton resonances, with presaturation pulses at either -0.35 ppm, or 12.7 ppm. The STD amplification factors for the four Nicotinamide proton resonances are shown versus saturation time (Tsat) for experiments recorded with presaturation pulses at (A) -0.35 and (B) 12.7 ppm, respectively. The STD amplification factors for the C2(■), C4(▲),C5(▼), and C6(●) protons of nicotinamide are shown, labeling is the same for both panels. STD amplification factors were determined from STD-experiments acquired on a sample containing 1 mM PETNR, 10 mM nicotinamide using the stddiffesgp.3 pulse sequence.
0 1 2 3 4 50.0
0.5
1.0
1.5
2.0
2.5
STD
am
plifi
catio
n fa
ctor
Tsat (s)
0 1 2 3 4 50.0
0.5
1.0
1.5
2.0
2.5
STD
am
plifi
catio
n fa
ctor
Tsat (s)
(A)
(B)
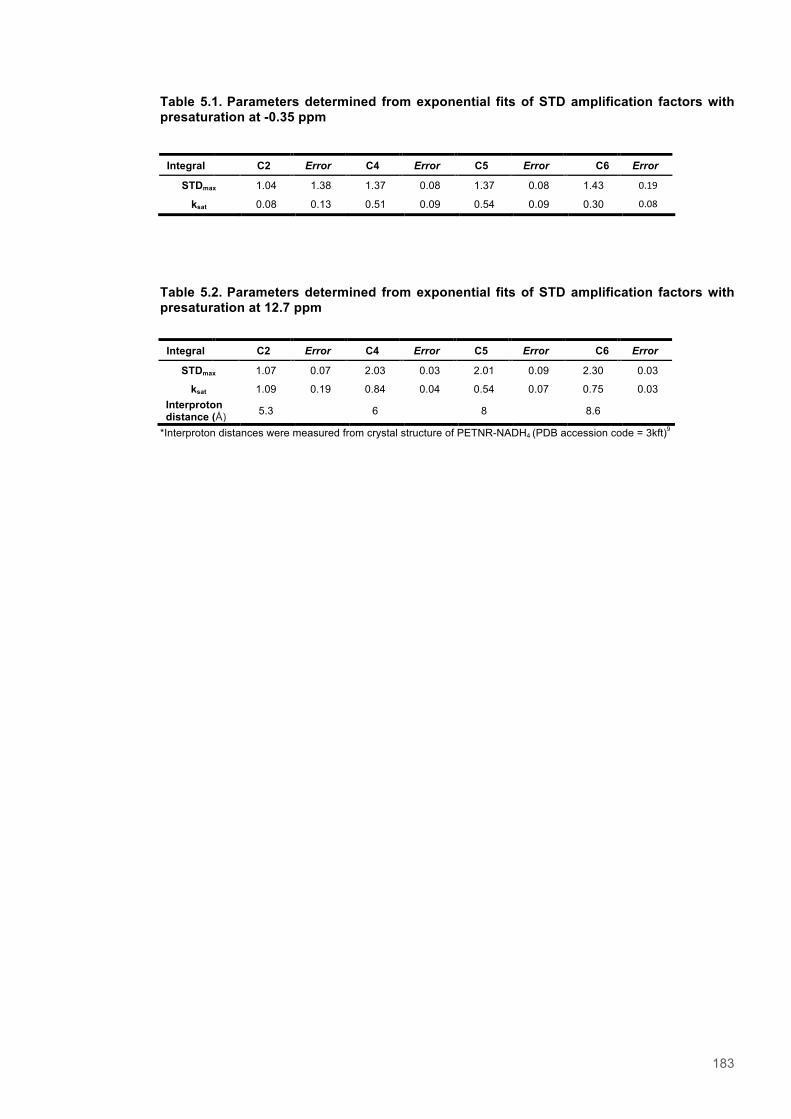
183
Table 5.1. Parameters determined from exponential fits of STD amplification factors with presaturation at -0.35 ppm
Integral C2 Error C4 Error C5 Error C6 Error
STDmax 1.04 1.38 1.37 0.08 1.37 0.08 1.43 0.19
ksat 0.08 0.13 0.51 0.09 0.54 0.09 0.30 0.08
Table 5.2. Parameters determined from exponential fits of STD amplification factors with presaturation at 12.7 ppm
*Interproton distances were measured from crystal structure of PETNR-NADH4 (PDB accession code = 3kft)9
Integral C2 Error C4 Error C5 Error C6 Error
STDmax 1.07 0.07 2.03 0.03 2.01 0.09 2.30 0.03
ksat 1.09 0.19 0.84 0.04 0.54 0.07 0.75 0.03 Interproton distance (Å) 5.3 6 8 8.6
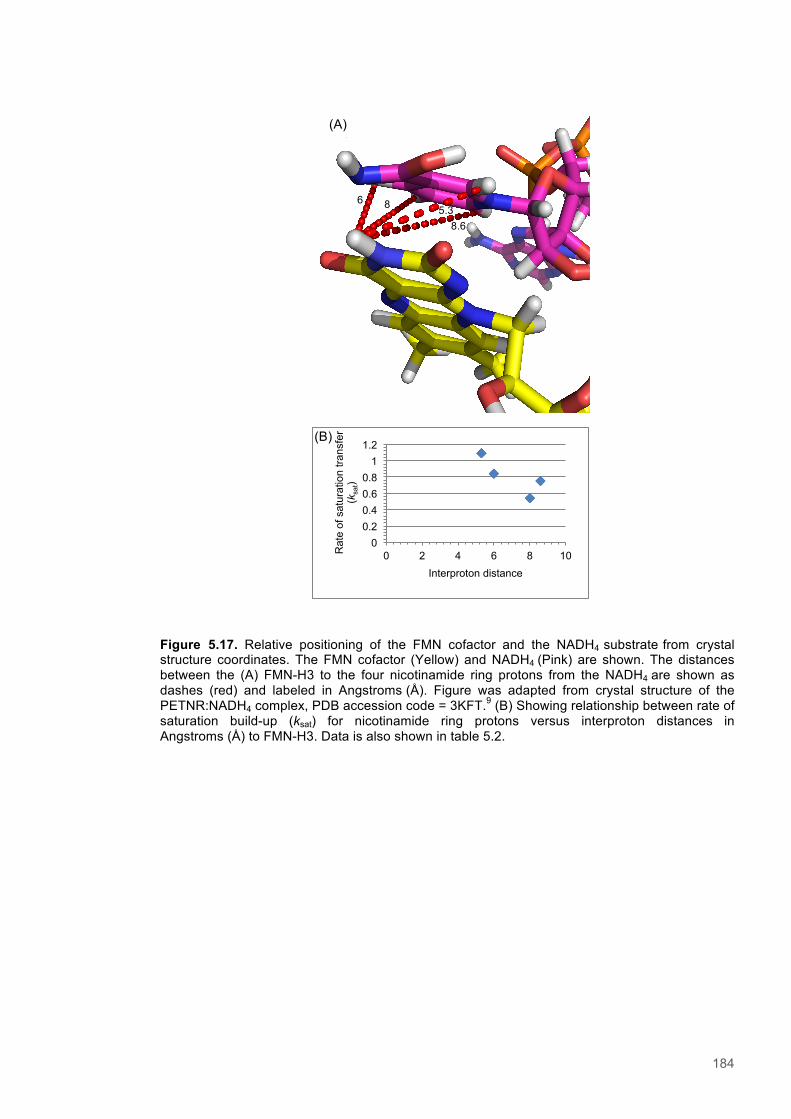
184
Figure 5.17. Relative positioning of the FMN cofactor and the NADH4 substrate from crystal structure coordinates. The FMN cofactor (Yellow) and NADH4 (Pink) are shown. The distances between the (A) FMN-H3 to the four nicotinamide ring protons from the NADH4 are shown as dashes (red) and labeled in Angstroms (Å). Figure was adapted from crystal structure of the PETNR:NADH4 complex, PDB accession code = 3KFT.9 (B) Showing relationship between rate of saturation build-up (ksat) for nicotinamide ring protons versus interproton distances in Angstroms (Å) to FMN-H3. Data is also shown in table 5.2.
(A)
0 0.2 0.4 0.6 0.8
1 1.2
0 2 4 6 8 10 Rat
e of
sat
urat
ion
trans
fer
(ksa
t)
Interproton distance
(B)
6 8 5.3 8.6

185
5.3.4 A study of selective Nuclear Overhauser effects (NOE) within the PETNR:NADPH4
complex
An investigation of NOE buildup as a means of assessing intermolecular distances within the
PENTR-NADPH4 complex was undertaken using a selective NOE pulse sequence (selnogp). All
experiments were therefore performed on a sample of 1 mM PENTR, 10 mM NADPH4, pH 7 at
295 K. NADPH4 was prepared using the standard protocol described and the identity of the
product confirmed via 1H NMR (See section 2.6.2; Figure 5.29). The irradiation power level (B1)
for the selective pulse was calculated for each experiment on the basis of the 90° degree pulse
length determined for each sample, the desired total rotation of the selective pulse (i.e. 180°), the
desired pulse length (10 ms) and the integration factor for the shaped pulse. It is worth noting that
the same experiment was also trialled with the PETNR-nicotinamide complex, however, no NOE
peaks were observed. It is suspected that a slightly weaker binding regime for the nicotinamide
complex compared to that for NADPH4, means that the dissociation constant is outside of the 10
nM to 1 mM range amenable to study via selective NOE experiments.22 The PETNR-NADPH4
complex (KD = 100 µM) is near the limit of those complexes that can be studied.9 The reason for
this optimal binding constant range for selective-NOE experiments is that weaker binding leads to
greater rates of exchange for exchangeable protons in the active site, which in turn leads to faster
relaxation of nuclear spins.44 As the selective inversion pulse used in selective NOE experiments
is of lower power and shorter duration than the saturation pulse used in STD-NMR experiments,
the magnetization is completely lost before the development of NOE peaks can occur.
The first step during this investigation was to determine the optimal experimental setup in order to
observe a strong and highly selective NOE signal. Firstly, a range of pulse shapes
(Gauss1_180r.1000, Reburp.1000 and Sinc.1.1000) were trialled for the selective excitation of a
peak at 13.75 ppm (Figure 5.18). The pulse sequence used during this trial (selgpse) contains a
selective 180° pulse equivalent to that used during the selective NOE experiment and results in
only the peak(s) targeted by the selective pulse being visible in the final spectrum. The greatest
NOE enhancement observed was achieved using a 10 ms, sinc (sinc1.1000) pulse. Using this
pulse shape, a range of different pulse powers were then tested and the suitability for selectively
exciting one of two closely located peaks, at 13.05 ppm and 12.89 ppm, was examined (Figure
5.19). The pulse power was increased incrementally from 18 Hz to 78 Hz. The strongest pulse
clearly resulted in some undesired excitation of the neighboring peak. A 10 ms long Sinc.1.1000
shaped pulse with a B1 field strength of 48.4 Hz was therefore used for all selective NOE
experiments, and was used for excitation of the resonances at 12.89 ppm and at 13.05 ppm
(Figure 5.20).
The identification of NOEs arising when a number of peaks appearing from 11.68 ppm to 13.8
ppm were selectively irradiated was then undertaken (Figure 5.21). This region of the spectrum is
where peaks arising from the FMN isoalloxazine ring system are expected to appear.45 Targeting
the resonant peak observed at 13.84 ppm with the selective pulse resulted in the observation of a
186
weak NOE peak at 6.75 ppm. Another peak targeted for selective irradiation was that present at
12.8 ppm, which has been confirmed via previous studies of NOEs to side chain protons in the
active site to be that attached to the FMN-N3 atom.40 This is downfield of the chemical shift of the
corresponding atom previously reported for protein-bound FMN, 10.49 ppm, likely as a result of
different active site configuration and the relative influences on the electronic
configuration/shielding of the FMN.45 Targeting the resonance at 12.8 ppm lead to the observation
of weak and broad NOE peaks at 6.75 ppm and 7.9 ppm (Figure 5.21). Examination of those side
chains atoms near to the FMN-H3 in the crystal structure of the PETNR:NADH4 complex reveals
the closest to be Q100-Hε2, which appears approximately 2.5 Å from the target group (Figure
5.24, panel A). It is there possible that the NOE peak observed at 6.75 ppm is from Q100-Hε2, as
this side chain atom also has a mean average resonance of 7.04 ± 0.94 ppm.30 The selective
excitation of the resonant peak at 11.82 ppm resulted in weak NOE peaks being observed at 7.90
ppm and 8.85 ppm. Lastly, targeting the peak at 11.68 ppm resulted in the appearance of weak
NOE peaks at 7.1 and 7.5 ppm. The NOE peaks observed during these experiments were all
relatively weak and broad. These properties suggested that the NOEs might have been
intramolecular protein NOEs, such as those from one side chain to another. In the absence of a
full assignment of side chain resonances, it is difficult to attribute these unambiguously to one
specific residue.
When the resonant peak at 12.47 ppm was selectively irradiated, however, there was a strong
and sharp NOE peak observed at 7.2 ppm, which appeared at the same chemical shift as that of
the C2-H proton of NADPH4 (Figure 5.22). The sharp nature of this peak indicates that it arose
from a small molecule, likely to be the unbound NADPH4 in this instance. It has been previously
observed that the peak at 12.47 ppm is only observed only after the addition of ligand.40 This
observation lead to the conclusion that the resonance likely corresponds with the His181-Hε2
atom, which H-bonds directly to the nicotinamide substrate and is therefore protected from
exchange in the ligand-bound complex. The available PDB crystal structure coordinates reveals
the presence of the His181-Hε2 atom side chain atom is located 4.1 Å from the C2H proton of
NADPH4 (Figure 5.24, panel B). The close proximity of the ligand proton to the histidine Hε2 atom
implioes that the NOE observed in this instance is likely from the His181-Hε2 to NADPH4-C2H.
The NOE peak at 7.2 ppm was accompanied by three weaker and broader peaks, which
appeared at 8.4 ppm, 6.8 ppm, and 6.5 ppm. The peak appearing at 8.4 ppm overlays precisely
with the peak assigned to an adenine proton (A-C8-H) of NADPH4 and therefore likely
corresponds with this atom (See figure 5.22, for assignment of NADPH4 1H NMR spectrum).
However, the A-C8-H proton is located at 16.2 Å away from His181-Hε2, which is a greater
distance than NOE mediated spin-spin coupling is expected to occur and therefore contribute to
relaxation of the His181-Hε2 atom.46 The appearance of the A-C8-H NOE peak could have
occurred either due to non-specific binding of the ligand, where the adenine ring system binds
within, or near to, the active site. Alternatively, it is also possible that some intra-ligand
magnetization transfer occurs between nicotinamide protons, from those that are within NOE
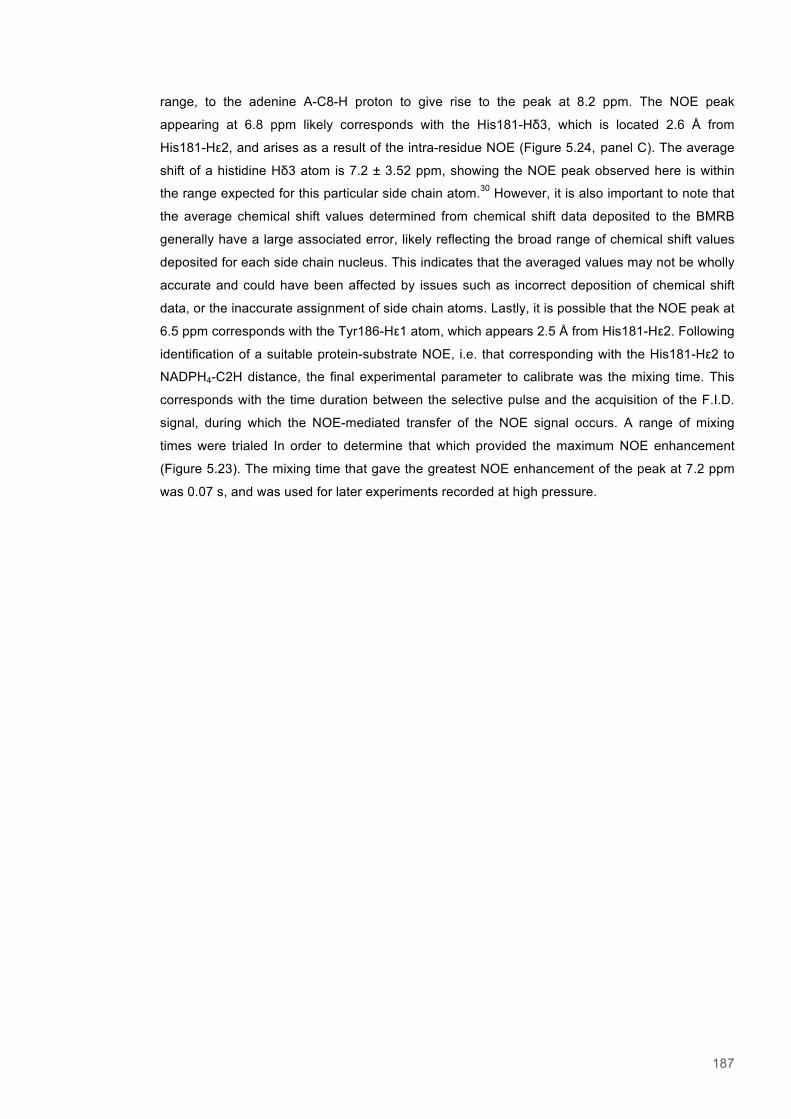
187
range, to the adenine A-C8-H proton to give rise to the peak at 8.2 ppm. The NOE peak
appearing at 6.8 ppm likely corresponds with the His181-Hδ3, which is located 2.6 Å from
His181-Hε2, and arises as a result of the intra-residue NOE (Figure 5.24, panel C). The average
shift of a histidine Hδ3 atom is 7.2 ± 3.52 ppm, showing the NOE peak observed here is within
the range expected for this particular side chain atom.30 However, it is also important to note that
the average chemical shift values determined from chemical shift data deposited to the BMRB
generally have a large associated error, likely reflecting the broad range of chemical shift values
deposited for each side chain nucleus. This indicates that the averaged values may not be wholly
accurate and could have been affected by issues such as incorrect deposition of chemical shift
data, or the inaccurate assignment of side chain atoms. Lastly, it is possible that the NOE peak at
6.5 ppm corresponds with the Tyr186-Hε1 atom, which appears 2.5 Å from His181-Hε2. Following
identification of a suitable protein-substrate NOE, i.e. that corresponding with the His181-Hε2 to
NADPH4-C2H distance, the final experimental parameter to calibrate was the mixing time. This
corresponds with the time duration between the selective pulse and the acquisition of the F.I.D.
signal, during which the NOE-mediated transfer of the NOE signal occurs. A range of mixing
times were trialed In order to determine that which provided the maximum NOE enhancement
(Figure 5.23). The mixing time that gave the greatest NOE enhancement of the peak at 7.2 ppm
was 0.07 s, and was used for later experiments recorded at high pressure.
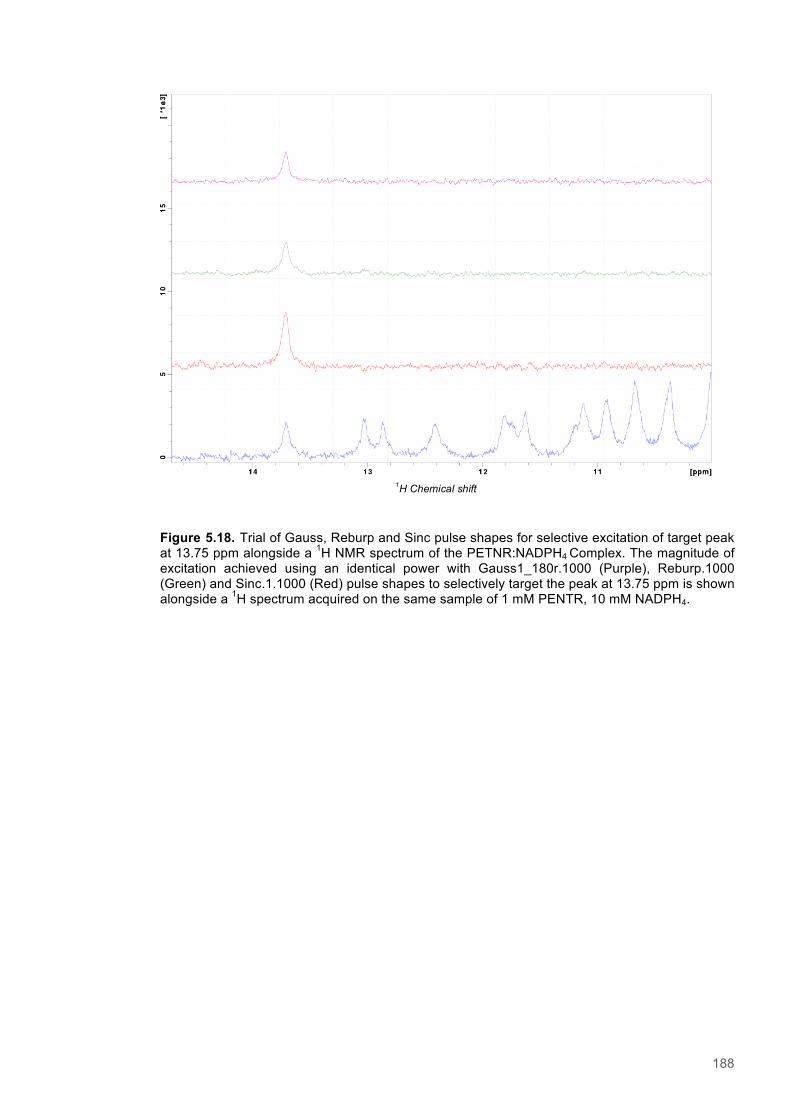
188
Figure 5.18. Trial of Gauss, Reburp and Sinc pulse shapes for selective excitation of target peak at 13.75 ppm alongside a 1H NMR spectrum of the PETNR:NADPH4 Complex. The magnitude of excitation achieved using an identical power with Gauss1_180r.1000 (Purple), Reburp.1000 (Green) and Sinc.1.1000 (Red) pulse shapes to selectively target the peak at 13.75 ppm is shown alongside a 1H spectrum acquired on the same sample of 1 mM PENTR, 10 mM NADPH4.
1H Chemical shift
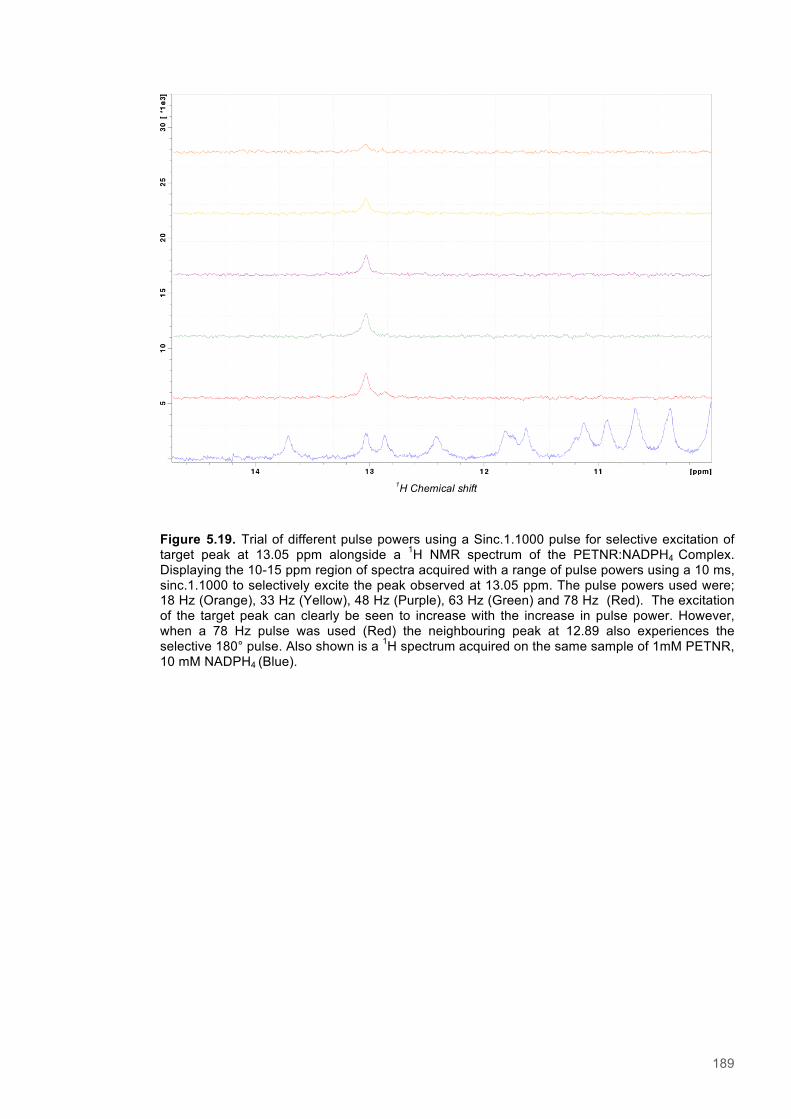
189
Figure 5.19. Trial of different pulse powers using a Sinc.1.1000 pulse for selective excitation of target peak at 13.05 ppm alongside a 1H NMR spectrum of the PETNR:NADPH4 Complex. Displaying the 10-15 ppm region of spectra acquired with a range of pulse powers using a 10 ms, sinc.1.1000 to selectively excite the peak observed at 13.05 ppm. The pulse powers used were; 18 Hz (Orange), 33 Hz (Yellow), 48 Hz (Purple), 63 Hz (Green) and 78 Hz (Red). The excitation of the target peak can clearly be seen to increase with the increase in pulse power. However, when a 78 Hz pulse was used (Red) the neighbouring peak at 12.89 also experiences the selective 180° pulse. Also shown is a 1H spectrum acquired on the same sample of 1mM PETNR, 10 mM NADPH4 (Blue).
1H Chemical shift
190
Figure 5.20. Selective excitation of resonances at using a Sinc.1.100 pulse shape to target peaks at 12.89 and 13.05 ppm. Spectra acquired using a 48.4 Hz sinc.1.1000 pulse to selectively excite two closely located peaks, at 12.89 ppm (Red) and 13.05 ppm (Green), are shown. These two peaks were targeted for excitation in order to assess the degree of selectivity of the excitation pulse. A 1H NMR spectrum acquired on the same sample of 1 mM PETNR, 10 mM NADPH4 is also shown (Blue).
1H Chemical shift
200
(B)
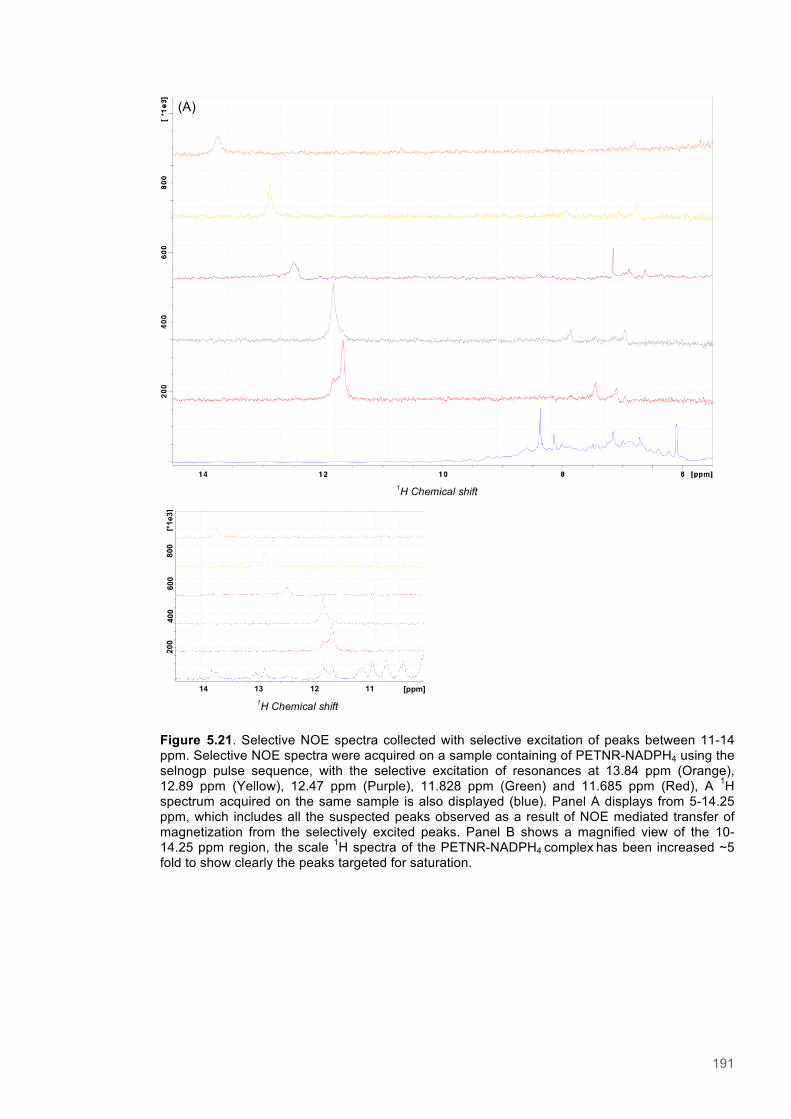
191
Figure 5.21. Selective NOE spectra collected with selective excitation of peaks between 11-14 ppm. Selective NOE spectra were acquired on a sample containing of PETNR-NADPH4 using the selnogp pulse sequence, with the selective excitation of resonances at 13.84 ppm (Orange), 12.89 ppm (Yellow), 12.47 ppm (Purple), 11.828 ppm (Green) and 11.685 ppm (Red), A 1H spectrum acquired on the same sample is also displayed (blue). Panel A displays from 5-14.25 ppm, which includes all the suspected peaks observed as a result of NOE mediated transfer of magnetization from the selectively excited peaks. Panel B shows a magnified view of the 10-14.25 ppm region, the scale 1H spectra of the PETNR-NADPH4 complex has been increased ~5 fold to show clearly the peaks targeted for saturation.
(A)
1H Chemical shift
200
400
600
800
[*1e
3]
14 13 12 11 [ppm] 1H Chemical shift

192
Figure 5.22. 1H NMR spectra of NADPH4. (A) 1H NMR spectra acquired on sample containing 1 mM NADPH4 (Blue) shown alongside chemical structure of NADPH4 with standard heteroaromatic atom numbers shown. The furanose sugars are denoted with a prime, and the adenosine atoms labeled with an A. Peaks in the 1H spectrum correspond with numbering of NADPH4 structure. Those proton peaks that can be confidently and unambiguously assigned have been labeled with the heteroatom numbers to which they are bound.
A-C8-H
A-C2-H
C4-H
C2-H
C5-H
O N
OP
O
O
O
PO
O
OOH OH
O
OH O
PO
O
O
N
N N
N
O
NH2
NH2
N1
C2
C3 C4
C5
C6
C7
O7
N7
C-1’
C-2’ C-3’
C-4’
C-5’
O-5’ O-2
O-1
O-3
O-1
A-C-4’
A-C-3’ A-C-2’
A-C-1’
A-O-4’
A-N1
A-C2
A-C$
A-C4
A-0-5’ O-2
A-C3
A-N7 A-C6
A-N6
A-C8
A-N9
A-C-1’
1H Chemical shift
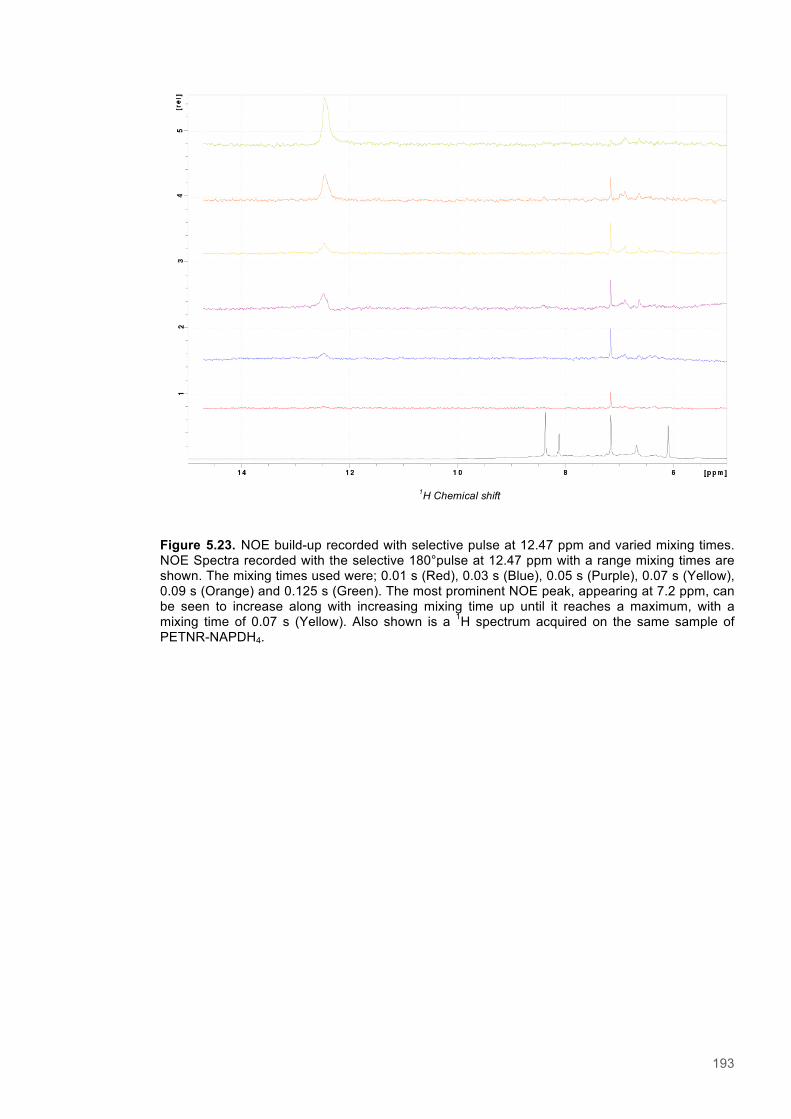
193
Figure 5.23. NOE build-up recorded with selective pulse at 12.47 ppm and varied mixing times. NOE Spectra recorded with the selective 180°pulse at 12.47 ppm with a range mixing times are shown. The mixing times used were; 0.01 s (Red), 0.03 s (Blue), 0.05 s (Purple), 0.07 s (Yellow), 0.09 s (Orange) and 0.125 s (Green). The most prominent NOE peak, appearing at 7.2 ppm, can be seen to increase along with increasing mixing time up until it reaches a maximum, with a mixing time of 0.07 s (Yellow). Also shown is a 1H spectrum acquired on the same sample of PETNR-NAPDH4.
1H Chemical shift
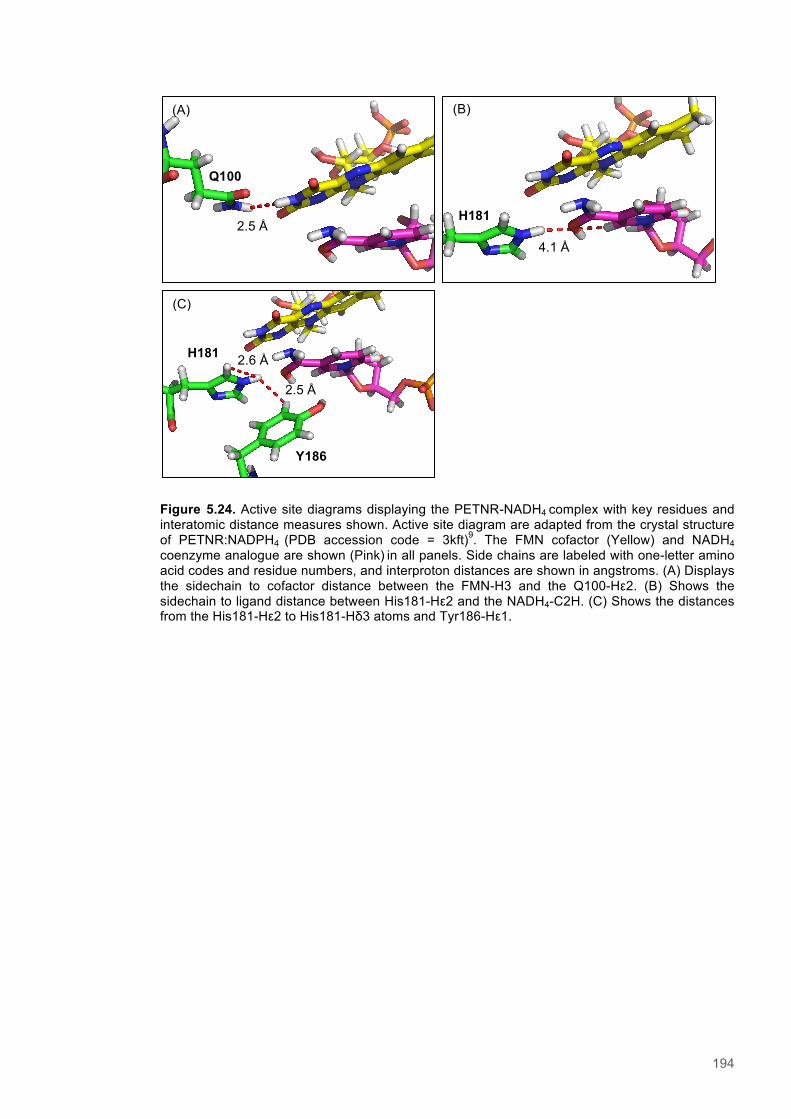
194
Figure 5.24. Active site diagrams displaying the PETNR-NADH4 complex with key residues and interatomic distance measures shown. Active site diagram are adapted from the crystal structure of PETNR:NADPH4 (PDB accession code = 3kft)9. The FMN cofactor (Yellow) and NADH4 coenzyme analogue are shown (Pink) in all panels. Side chains are labeled with one-letter amino acid codes and residue numbers, and interproton distances are shown in angstroms. (A) Displays the sidechain to cofactor distance between the FMN-H3 and the Q100-Hε2. (B) Shows the sidechain to ligand distance between His181-Hε2 and the NADH4-C2H. (C) Shows the distances from the His181-Hε2 to His181-Hδ3 atoms and Tyr186-Hε1.
(A) (B)
4.1 Å 2.5 Å
2.6 Å
Q100
H181
H181
H181
Y186
2.6 Å
2.5 Å
H181
Y186
(C)
195
5.3.5 A variable pressure study of selective Nuclear Overhauser effects (NOE) within the
PETNR:NADPH4 complex
Experiments were performed to assess differences in the buildup of NOEs over a variable
pressure range, in order to analyse pressure-induced changes in active site organisation within
the PETNR-NADPH4 complex. Previously, an intermolecular NOE believed to be from the
His181-Hε2 atom (12.8 ppm) to the NADPH4-C2H atom (7.2 ppm) was identified to report on the
protein-substrate distance (See section 5.3.4). The build-up of this NOE was therefore
investigated at 1 bar and 2500 bar. Prior to recording experiment it was observed that a change
in pressure from 1 to 2500 bar caused an upfield shift in the peak at 12.4 ppm (Figure 2.25). As
this peak is the target for the selective 180° pulse, the offset of the pulse was altered from 12.4
ppm to 12.35 ppm for the experiment recorded at 2500 bar. At each pressure studied, the
selective excitation experiments (selgpse) were recorded before and after the selective NOE
experiment (selnogp) in order to give a reference for the level of excitation of the target peak
observed.
During the selective NOE experiments recorded at 1 bar and 2500 bar, with selective irradiation
of the resonance at 12.4-12.35 ppm, there were four NOE peaks observed alongside that of the
target peak (Figures 5.26 & 5.27). These peaks appeared at 8.4 ppm, 7.2 ppm, 6.8 ppm and 6.5
ppm. By far the strongest NOE enhancement observed was for the sharp peak appearing at 7.2
ppm, which corresponds with the C2-H peak of NADPH4. The remaining peaks appeared
progressively more broadened and smaller in magnitude. The NOE peak integrals were then
measured, as well as those of the target resonance during the reference experiments recorded
before and after the NOE experiment (Table 5.3). It is important to note that there was a change
in the magnitude of target peak excitation in the reference experiments recorded at 1 bar and
2500 bar. For consistency and to provide a suitable reference for the experiments recorded at
either pressure, it was decided to analyse all NOE peak heights relative to the height of the target
peak in the reference experiment recorded prior to the selective NOE. The relative peak height of
the NOE at 7.2 ppm, which corresponds with the C2-H peak of NADPH4, appeared to increase as
the pressure was increased from 1 bar to 2500 bar (Table 5.3). The ratio of this peak increased
from 51 % of the reference peak height at 1 bar, to 81 % at 2500 bar. This suggests that
pressure-induced compression of the protein leads to shortening of the His184 side chain to
nicotinamide distance. The intensity of the NOE peak at 8.4 ppm also increased along with the
increase in pressure, by approximately 54 %. As this peak is assigned to NADPH4-A-C8-H and is
thought to arise due to intramolecular transfer of magnetization via the ligand protons, it is
expected that the intensity of this NOE peak should increase along with that at observed 7.2 ppm.
However, the NOEs appearing at 6.5 ppm and 6.8 ppm both displayed a decrease in intensity as
the pressure was increased from 1 to 2500 bar. The NOE at 6.5 ppm decreased from 112 %
relative to reference to 26 %, and that at 6.8 ppm decreased from 41 % of the reference to 6 %.
As the latter is though to represent the His181-Hδ3 to His181-Hε2 distance, which should not
change with pressure, it is likely that the change in intensity of the NOE peak is due to undesired
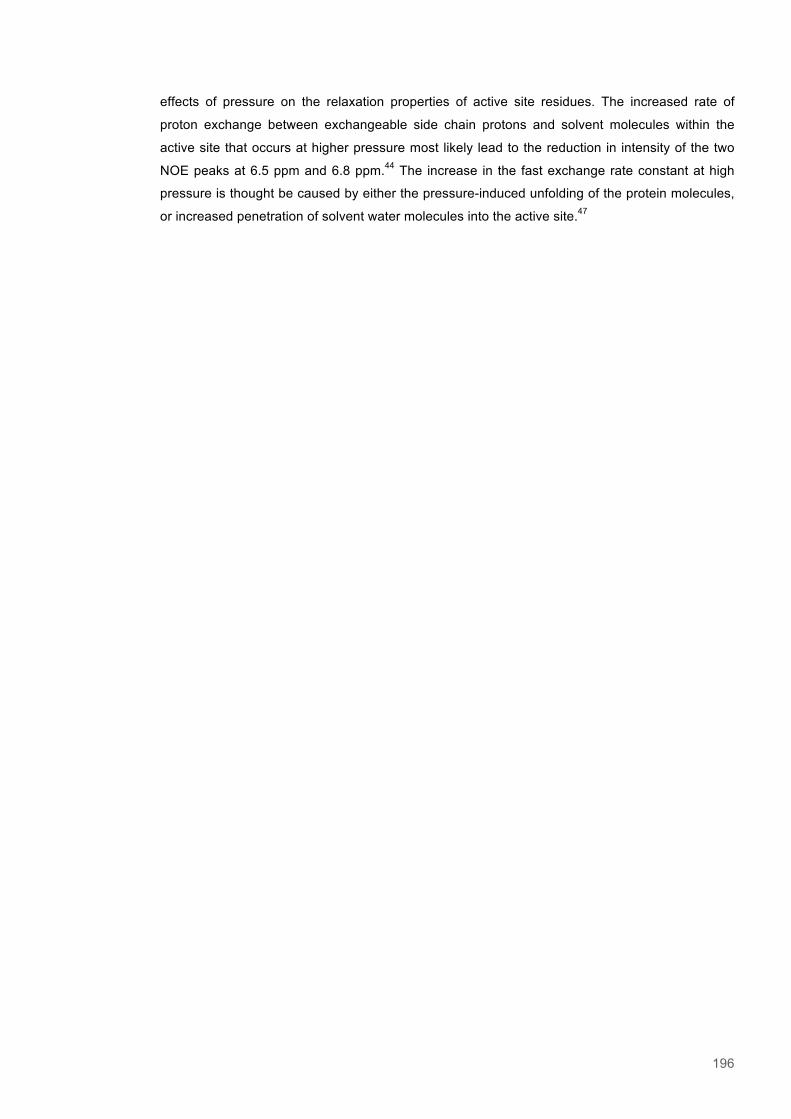
196
effects of pressure on the relaxation properties of active site residues. The increased rate of
proton exchange between exchangeable side chain protons and solvent molecules within the
active site that occurs at higher pressure most likely lead to the reduction in intensity of the two
NOE peaks at 6.5 ppm and 6.8 ppm.44 The increase in the fast exchange rate constant at high
pressure is thought be caused by either the pressure-induced unfolding of the protein molecules,
or increased penetration of solvent water molecules into the active site.47
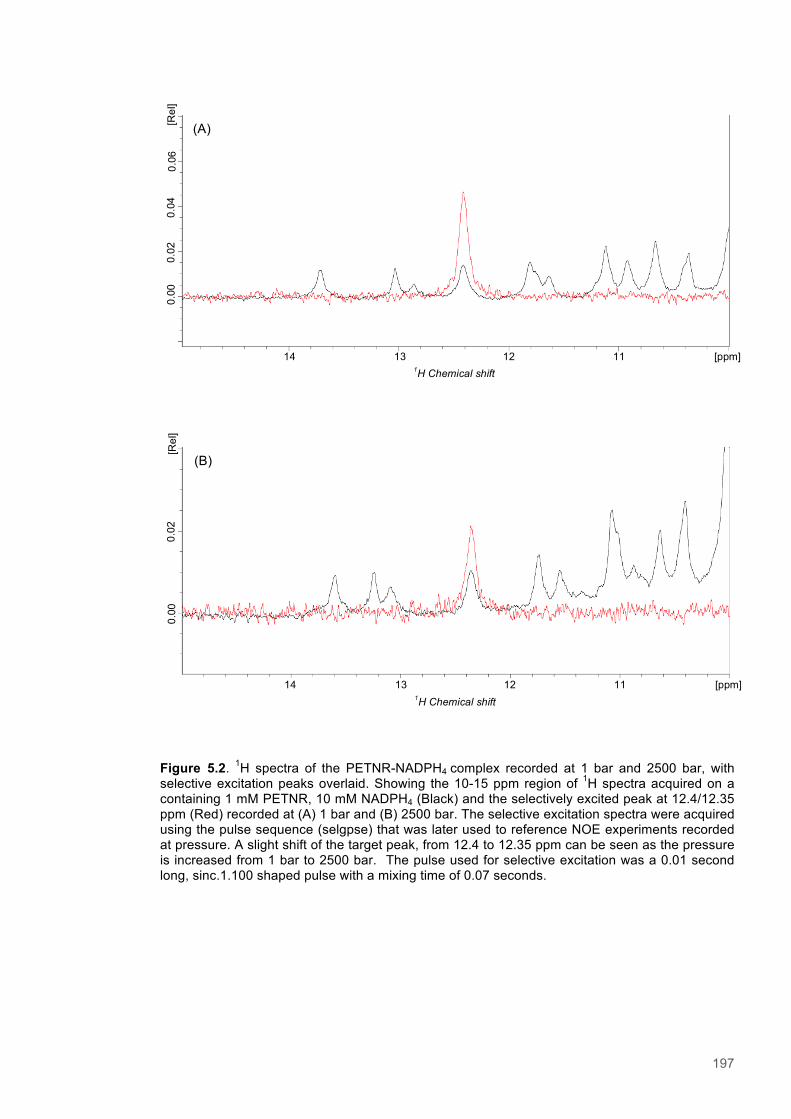
197
Figure 5.2. 1H spectra of the PETNR-NADPH4 complex recorded at 1 bar and 2500 bar, with selective excitation peaks overlaid. Showing the 10-15 ppm region of 1H spectra acquired on a containing 1 mM PETNR, 10 mM NADPH4 (Black) and the selectively excited peak at 12.4/12.35 ppm (Red) recorded at (A) 1 bar and (B) 2500 bar. The selective excitation spectra were acquired using the pulse sequence (selgpse) that was later used to reference NOE experiments recorded at pressure. A slight shift of the target peak, from 12.4 to 12.35 ppm can be seen as the pressure is increased from 1 bar to 2500 bar. The pulse used for selective excitation was a 0.01 second long, sinc.1.100 shaped pulse with a mixing time of 0.07 seconds.
0.00
0.
02
0.04
0.
06
[Rel
]
11 12 13 14 [ppm] 1H Chemical shift
0.00
0.
02
[Rel
]
11 12 13 14 [ppm] 1H Chemical shift
(A)
(B)

198
Figure 5.3. Selective NOE spectrum recorded at 1 bar with selective excitation at 12.4 ppm. The spectrum acquired using a selective NOE pulse sequence (selnogp) on a sample containing 1 mM PETNR, 10 mM NADPH4 at 1 bar pressure (Black). Overlaid are the reference spectra observed using the selective excitation pulse (selgpse) before (Blue) and after (Red) the selective NOE spectrum was recorded. The pulse used for selective excitation with both pulse sequences was a 0.01 second long, sinc.1.100 shaped pulse with a mixing time of 0.07 seconds.
1H Chemical shift
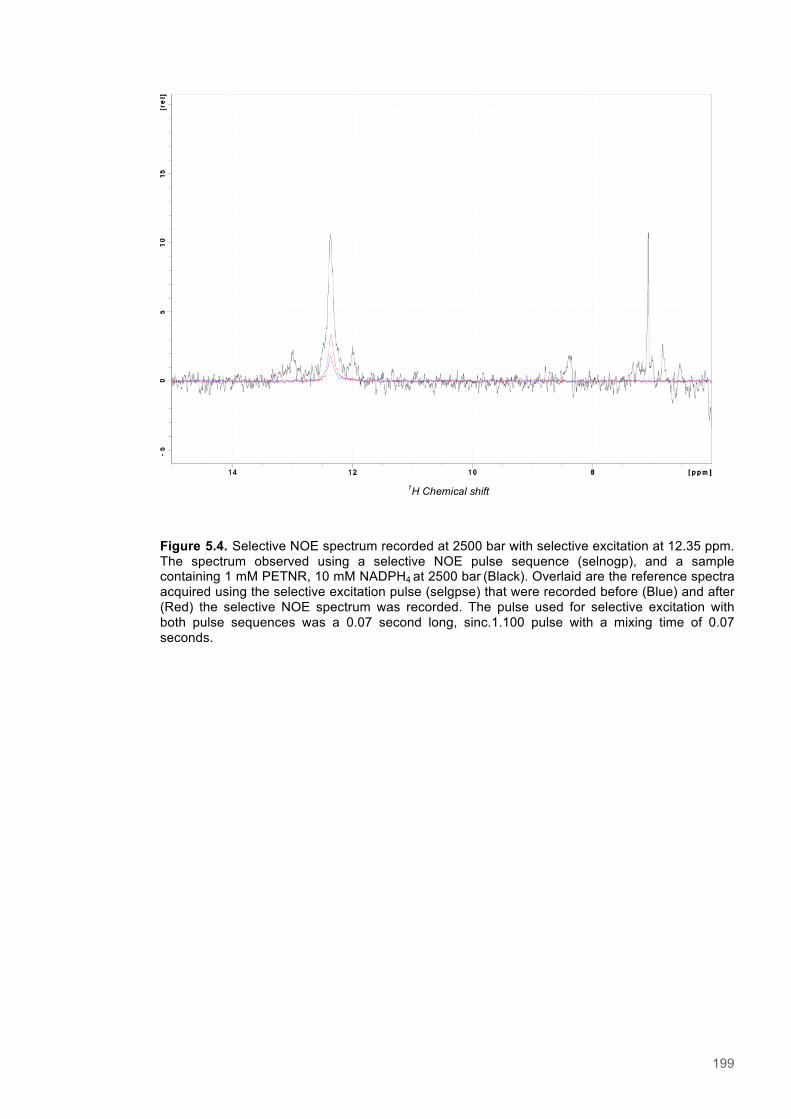
199
Figure 5.4. Selective NOE spectrum recorded at 2500 bar with selective excitation at 12.35 ppm. The spectrum observed using a selective NOE pulse sequence (selnogp), and a sample containing 1 mM PETNR, 10 mM NADPH4 at 2500 bar (Black). Overlaid are the reference spectra acquired using the selective excitation pulse (selgpse) that were recorded before (Blue) and after (Red) the selective NOE spectrum was recorded. The pulse used for selective excitation with both pulse sequences was a 0.07 second long, sinc.1.100 pulse with a mixing time of 0.07 seconds.
1H Chemical shift
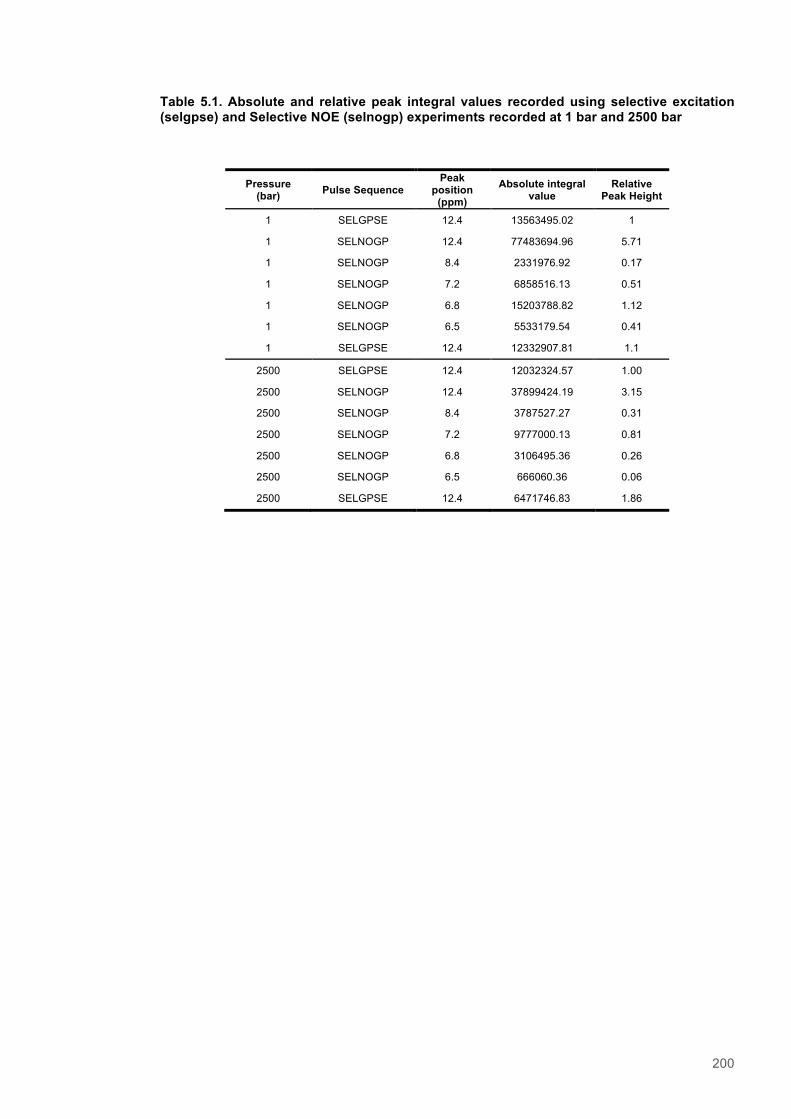
200
Table 5.1. Absolute and relative peak integral values recorded using selective excitation (selgpse) and Selective NOE (selnogp) experiments recorded at 1 bar and 2500 bar
Pressure (bar) Pulse Sequence
Peak position
(ppm) Absolute integral
value Relative
Peak Height
1 SELGPSE 12.4 13563495.02 1
1 SELNOGP 12.4 77483694.96 5.71
1 SELNOGP 8.4 2331976.92 0.17
1 SELNOGP 7.2 6858516.13 0.51
1 SELNOGP 6.8 15203788.82 1.12
1 SELNOGP 6.5 5533179.54 0.41
1 SELGPSE 12.4 12332907.81 1.1
2500 SELGPSE 12.4 12032324.57 1.00
2500 SELNOGP 12.4 37899424.19 3.15
2500 SELNOGP 8.4 3787527.27 0.31
2500 SELNOGP 7.2 9777000.13 0.81
2500 SELNOGP 6.8 3106495.36 0.26
2500 SELNOGP 6.5 666060.36 0.06
2500 SELGPSE 12.4 6471746.83 1.86

201
5.4 Discussion
The work undertaken in this chapter was performed to investigate the structural capacity for
modulation of the hydride donor-acceptor distance in PETNR-ligand complexes using variable
pressure NMR studies.48 The importance of donor-acceptor distance changes for facilitating
hydride tunneling in the reductive phase of the catalytic cycle, where the FMN cofactor is reduced
via reacting with a nicotinamide coenzyme, is still not fully understood.1 The main aim of the
current study was to devise a direct measure to report on the donor acceptor distance in the
PETNR-ligand complexes using NMR, and then to investigate changes in this distance in higher-
energy conformers observed when the system is under increased hydrostatic pressure.49 The first
stage in this investigation involved the assignment of NMR resonances for the backbone amide
groups of ligand-free PETNR (See section 5.2.1). These assignments were then used to monitor
the binding of two ligands, NADPH4 (1,4,5,6 tetrahydro-NADPH) and nicotinamide (pyridine-3-
carboxamide), and to confirm the suitability of these compounds to act as non-reactive coenzyme
analogues for studying a transition-state complex representative of that formed between PETNR
and NADPH (See section 5.2.2). Two NOE-based NMR approaches were then used to
investigate enzyme to substrate distances; including STD-NMR, which involves measurement of
saturation transfer of saturation from one resonance to another, and selective-NOE buildup, in
which a target resonance is inverted using selective 180° pulse resulting in the generation of
NOE peaks (See sections 5.2.3 & 5.2.4).50,51 The latter approach was then employed to
investigate how side chain to ligand distances were affected within the PETNR-NADPH4 complex
when under increased hydrostatic pressure (See section 5.2.5). The selective NOE approach was
favoured because the resulting spectra did not show any background protein resonances and
also due to the reduced likelihood of indirect spin diffusion effects. Furthermore, the NADPH4
ligand was chosen as a reductive substrate mimic because the binding regime is within the range
suitable for study via selective NOE experiments and because it closely resembles the natural
coenzyme.
The protein to substrate distance relationship was investigated as a function of pressure by
analyzing the buildup of selective NOEs with the PETNR-NADPH4 complex (See section 5.2.5).
The dissociation constant (KD) for this complex is 100 µM and is right at the limit of the affinities
for complexes that are amenable to study via transient NOE experiments, which is between 10
nM and 100 µM.22,28 The calibration of a suitable pulse shape and power, as well as an optimal
mixing time was undertaken to determine the best possible experimental setup for achieving a
maximal NOE enhancement. The optimal experimental setup was achieved using a B1 field
strength of 48.4 Hz and a 10 ms long, sinc.1.1000 shaped pulse with a mixing time of 0.07 s. The
sinc pulse shape is known to give a square excitation profile, without the appearance of side-
wings at the edge of the excited region after Fourier transformation, and in this case appeared to
give good and highly specific excitation of the target resonance (Figure 5.18).52 A mixing time of
0.07 s was chosen, as this was the point at which the NOE passed through a maximum (Figure
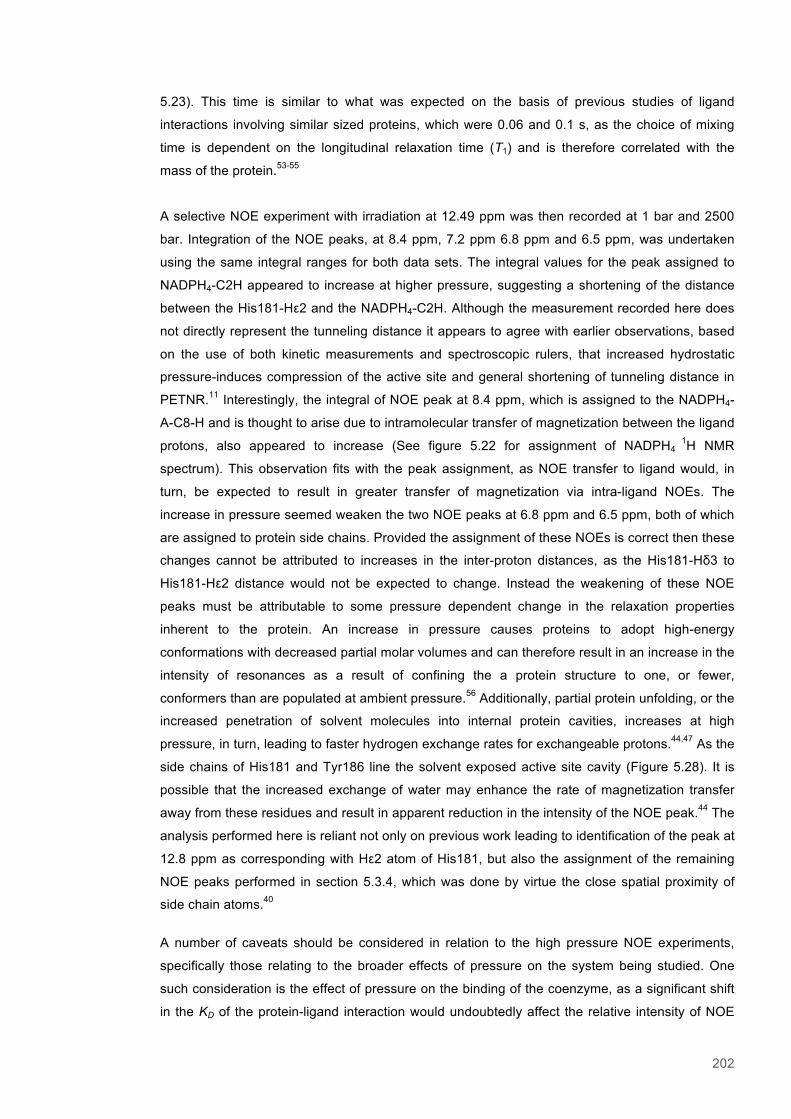
202
5.23). This time is similar to what was expected on the basis of previous studies of ligand
interactions involving similar sized proteins, which were 0.06 and 0.1 s, as the choice of mixing
time is dependent on the longitudinal relaxation time (T1) and is therefore correlated with the
mass of the protein.53-55
A selective NOE experiment with irradiation at 12.49 ppm was then recorded at 1 bar and 2500
bar. Integration of the NOE peaks, at 8.4 ppm, 7.2 ppm 6.8 ppm and 6.5 ppm, was undertaken
using the same integral ranges for both data sets. The integral values for the peak assigned to
NADPH4-C2H appeared to increase at higher pressure, suggesting a shortening of the distance
between the His181-Hε2 and the NADPH4-C2H. Although the measurement recorded here does
not directly represent the tunneling distance it appears to agree with earlier observations, based
on the use of both kinetic measurements and spectroscopic rulers, that increased hydrostatic
pressure-induces compression of the active site and general shortening of tunneling distance in
PETNR.11 Interestingly, the integral of NOE peak at 8.4 ppm, which is assigned to the NADPH4-
A-C8-H and is thought to arise due to intramolecular transfer of magnetization between the ligand
protons, also appeared to increase (See figure 5.22 for assignment of NADPH4 1H NMR
spectrum). This observation fits with the peak assignment, as NOE transfer to ligand would, in
turn, be expected to result in greater transfer of magnetization via intra-ligand NOEs. The
increase in pressure seemed weaken the two NOE peaks at 6.8 ppm and 6.5 ppm, both of which
are assigned to protein side chains. Provided the assignment of these NOEs is correct then these
changes cannot be attributed to increases in the inter-proton distances, as the His181-Hδ3 to
His181-Hε2 distance would not be expected to change. Instead the weakening of these NOE
peaks must be attributable to some pressure dependent change in the relaxation properties
inherent to the protein. An increase in pressure causes proteins to adopt high-energy
conformations with decreased partial molar volumes and can therefore result in an increase in the
intensity of resonances as a result of confining the a protein structure to one, or fewer,
conformers than are populated at ambient pressure.56 Additionally, partial protein unfolding, or the
increased penetration of solvent molecules into internal protein cavities, increases at high
pressure, in turn, leading to faster hydrogen exchange rates for exchangeable protons.44,47 As the
side chains of His181 and Tyr186 line the solvent exposed active site cavity (Figure 5.28). It is
possible that the increased exchange of water may enhance the rate of magnetization transfer
away from these residues and result in apparent reduction in the intensity of the NOE peak.44 The
analysis performed here is reliant not only on previous work leading to identification of the peak at
12.8 ppm as corresponding with Hε2 atom of His181, but also the assignment of the remaining
NOE peaks performed in section 5.3.4, which was done by virtue the close spatial proximity of
side chain atoms.40
A number of caveats should be considered in relation to the high pressure NOE experiments,
specifically those relating to the broader effects of pressure on the system being studied. One
such consideration is the effect of pressure on the binding of the coenzyme, as a significant shift
in the KD of the protein-ligand interaction would undoubtedly affect the relative intensity of NOE
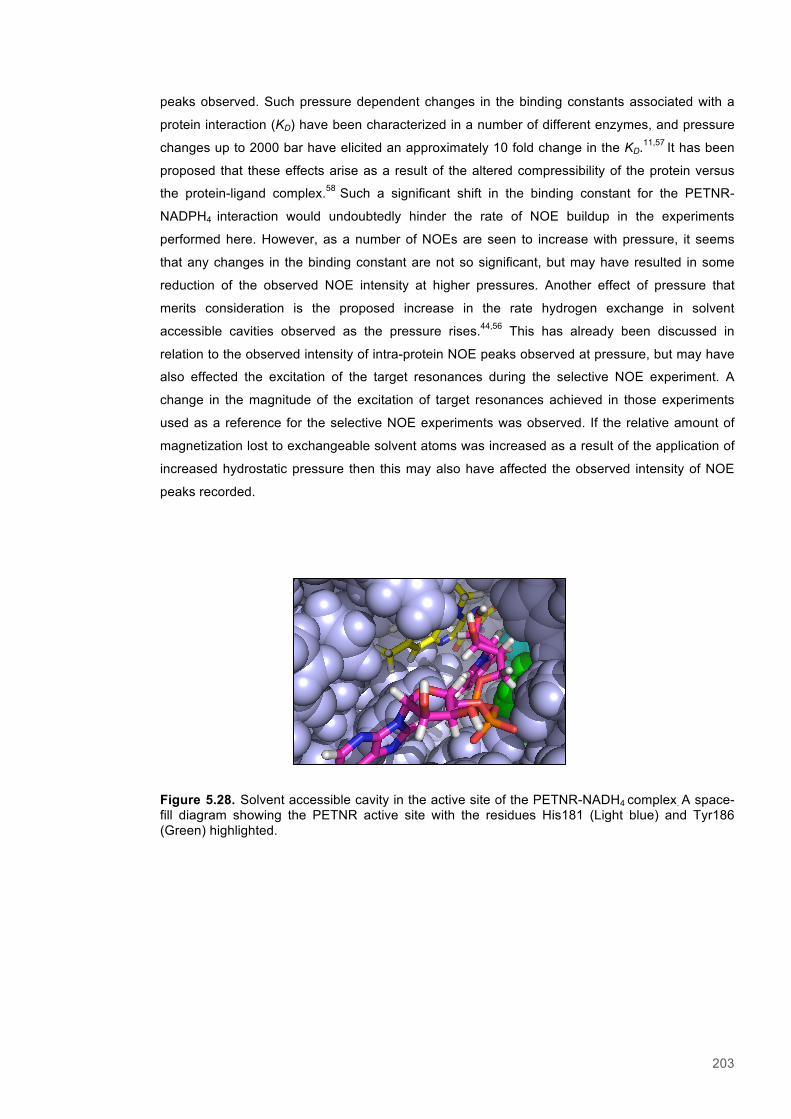
203
peaks observed. Such pressure dependent changes in the binding constants associated with a
protein interaction (KD) have been characterized in a number of different enzymes, and pressure
changes up to 2000 bar have elicited an approximately 10 fold change in the KD.11,57 It has been
proposed that these effects arise as a result of the altered compressibility of the protein versus
the protein-ligand complex.58 Such a significant shift in the binding constant for the PETNR-
NADPH4 interaction would undoubtedly hinder the rate of NOE buildup in the experiments
performed here. However, as a number of NOEs are seen to increase with pressure, it seems
that any changes in the binding constant are not so significant, but may have resulted in some
reduction of the observed NOE intensity at higher pressures. Another effect of pressure that
merits consideration is the proposed increase in the rate hydrogen exchange in solvent
accessible cavities observed as the pressure rises.44,56 This has already been discussed in
relation to the observed intensity of intra-protein NOE peaks observed at pressure, but may have
also effected the excitation of the target resonances during the selective NOE experiment. A
change in the magnitude of the excitation of target resonances achieved in those experiments
used as a reference for the selective NOE experiments was observed. If the relative amount of
magnetization lost to exchangeable solvent atoms was increased as a result of the application of
increased hydrostatic pressure then this may also have affected the observed intensity of NOE
peaks recorded.
Figure 5.28. Solvent accessible cavity in the active site of the PETNR-NADH4 complex. A space-fill diagram showing the PETNR active site with the residues His181 (Light blue) and Tyr186 (Green) highlighted.
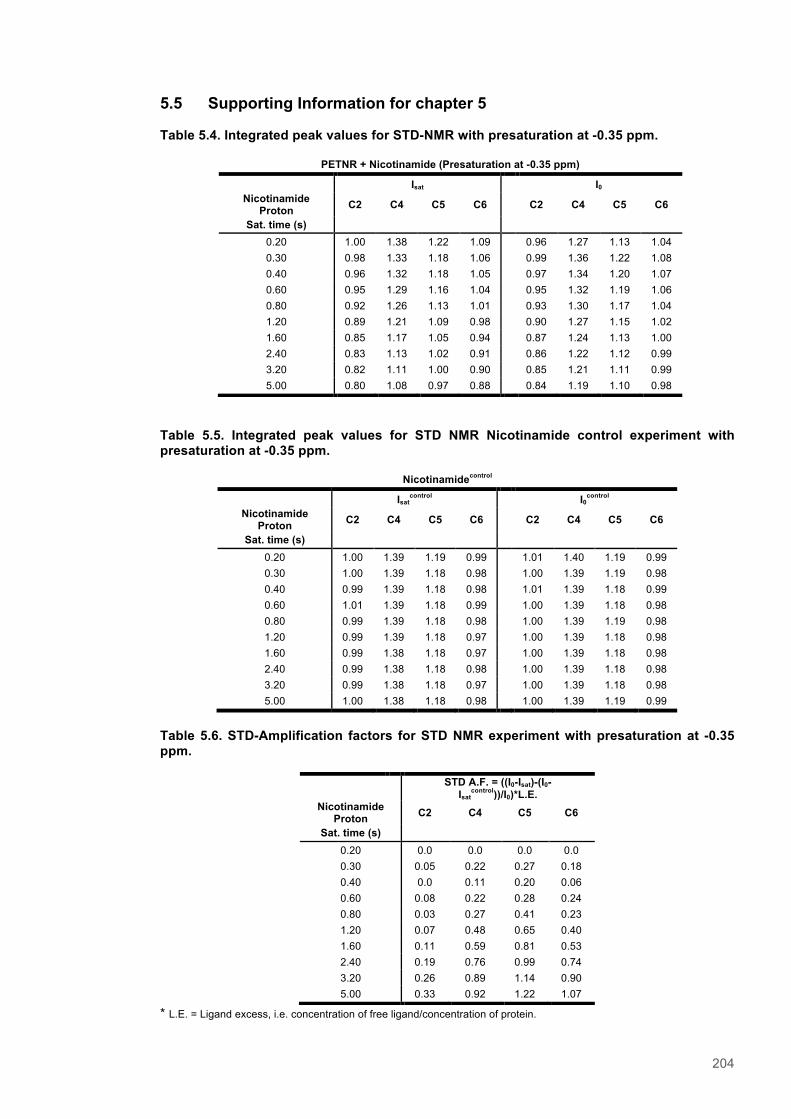
204
5.5 Supporting Information for chapter 5 Table 5.4. Integrated peak values for STD-NMR with presaturation at -0.35 ppm.
Table 5.5. Integrated peak values for STD NMR Nicotinamide control experiment with presaturation at -0.35 ppm.
Nicotinamidecontrol
Isatcontrol
I0control
Nicotinamide Proton C2 C4 C5 C6 C2 C4 C5 C6
Sat. time (s) 0.20 1.00 1.39 1.19 0.99 1.01 1.40 1.19 0.99 0.30 1.00 1.39 1.18 0.98 1.00 1.39 1.19 0.98 0.40 0.99 1.39 1.18 0.98 1.01 1.39 1.18 0.99 0.60 1.01 1.39 1.18 0.99 1.00 1.39 1.18 0.98 0.80 0.99 1.39 1.18 0.98 1.00 1.39 1.19 0.98 1.20 0.99 1.39 1.18 0.97 1.00 1.39 1.18 0.98 1.60 0.99 1.38 1.18 0.97 1.00 1.39 1.18 0.98 2.40 0.99 1.38 1.18 0.98 1.00 1.39 1.18 0.98 3.20 0.99 1.38 1.18 0.97 1.00 1.39 1.18 0.98 5.00 1.00 1.38 1.18 0.98 1.00 1.39 1.19 0.99
Table 5.6. STD-Amplification factors for STD NMR experiment with presaturation at -0.35 ppm.
* L.E. = Ligand excess, i.e. concentration of free ligand/concentration of protein.
PETNR + Nicotinamide (Presaturation at -0.35 ppm)
Isat I0 Nicotinamide
Proton C2 C4 C5 C6 C2 C4 C5 C6
Sat. time (s) 0.20 1.00 1.38 1.22 1.09 0.96 1.27 1.13 1.04 0.30 0.98 1.33 1.18 1.06 0.99 1.36 1.22 1.08 0.40 0.96 1.32 1.18 1.05 0.97 1.34 1.20 1.07 0.60 0.95 1.29 1.16 1.04 0.95 1.32 1.19 1.06 0.80 0.92 1.26 1.13 1.01 0.93 1.30 1.17 1.04 1.20 0.89 1.21 1.09 0.98 0.90 1.27 1.15 1.02 1.60 0.85 1.17 1.05 0.94 0.87 1.24 1.13 1.00 2.40 0.83 1.13 1.02 0.91 0.86 1.22 1.12 0.99 3.20 0.82 1.11 1.00 0.90 0.85 1.21 1.11 0.99 5.00 0.80 1.08 0.97 0.88 0.84 1.19 1.10 0.98
STD A.F. = ((I0-Isat)-(I0-Isat
control))/I0)*L.E. Nicotinamide
Proton C2 C4 C5 C6
Sat. time (s) 0.20 0.0 0.0 0.0 0.0 0.30 0.05 0.22 0.27 0.18 0.40 0.0 0.11 0.20 0.06 0.60 0.08 0.22 0.28 0.24 0.80 0.03 0.27 0.41 0.23 1.20 0.07 0.48 0.65 0.40 1.60 0.11 0.59 0.81 0.53 2.40 0.19 0.76 0.99 0.74 3.20 0.26 0.89 1.14 0.90 5.00 0.33 0.92 1.22 1.07
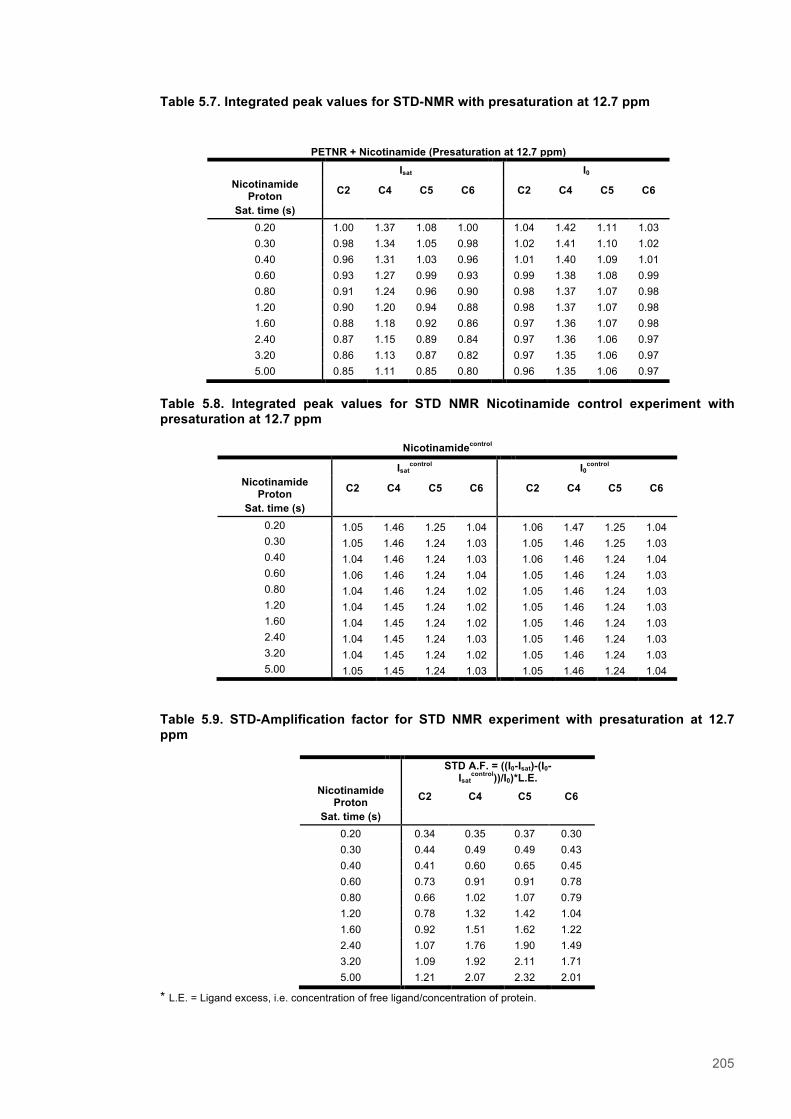
205
Table 5.7. Integrated peak values for STD-NMR with presaturation at 12.7 ppm
Table 5.8. Integrated peak values for STD NMR Nicotinamide control experiment with presaturation at 12.7 ppm
Nicotinamidecontrol
Isatcontrol
I0control
Nicotinamide Proton C2 C4 C5 C6 C2 C4 C5 C6
Sat. time (s) 0.20 1.05 1.46 1.25 1.04
1.06 1.47 1.25 1.04
0.30 1.05 1.46 1.24 1.03
1.05 1.46 1.25 1.03 0.40 1.04 1.46 1.24 1.03
1.06 1.46 1.24 1.04
0.60 1.06 1.46 1.24 1.04
1.05 1.46 1.24 1.03 0.80 1.04 1.46 1.24 1.02
1.05 1.46 1.24 1.03
1.20 1.04 1.45 1.24 1.02
1.05 1.46 1.24 1.03 1.60 1.04 1.45 1.24 1.02
1.05 1.46 1.24 1.03
2.40 1.04 1.45 1.24 1.03
1.05 1.46 1.24 1.03 3.20 1.04 1.45 1.24 1.02
1.05 1.46 1.24 1.03
5.00 1.05 1.45 1.24 1.03
1.05 1.46 1.24 1.04
Table 5.9. STD-Amplification factor for STD NMR experiment with presaturation at 12.7 ppm
STD A.F. = ((I0-Isat)-(I0-Isat
control))/I0)*L.E. Nicotinamide
Proton C2 C4 C5 C6
Sat. time (s) 0.20 0.34 0.35 0.37 0.30 0.30 0.44 0.49 0.49 0.43 0.40 0.41 0.60 0.65 0.45 0.60 0.73 0.91 0.91 0.78 0.80 0.66 1.02 1.07 0.79 1.20 0.78 1.32 1.42 1.04 1.60 0.92 1.51 1.62 1.22 2.40 1.07 1.76 1.90 1.49 3.20 1.09 1.92 2.11 1.71 5.00 1.21 2.07 2.32 2.01
* L.E. = Ligand excess, i.e. concentration of free ligand/concentration of protein.
PETNR + Nicotinamide (Presaturation at 12.7 ppm)
Isat I0 Nicotinamide
Proton C2 C4 C5 C6 C2 C4 C5 C6
Sat. time (s) 0.20 1.00 1.37 1.08 1.00 1.04 1.42 1.11 1.03 0.30 0.98 1.34 1.05 0.98 1.02 1.41 1.10 1.02 0.40 0.96 1.31 1.03 0.96 1.01 1.40 1.09 1.01 0.60 0.93 1.27 0.99 0.93 0.99 1.38 1.08 0.99 0.80 0.91 1.24 0.96 0.90 0.98 1.37 1.07 0.98 1.20 0.90 1.20 0.94 0.88 0.98 1.37 1.07 0.98 1.60 0.88 1.18 0.92 0.86 0.97 1.36 1.07 0.98 2.40 0.87 1.15 0.89 0.84 0.97 1.36 1.06 0.97 3.20 0.86 1.13 0.87 0.82 0.97 1.35 1.06 0.97 5.00 0.85 1.11 0.85 0.80 0.96 1.35 1.06 0.97
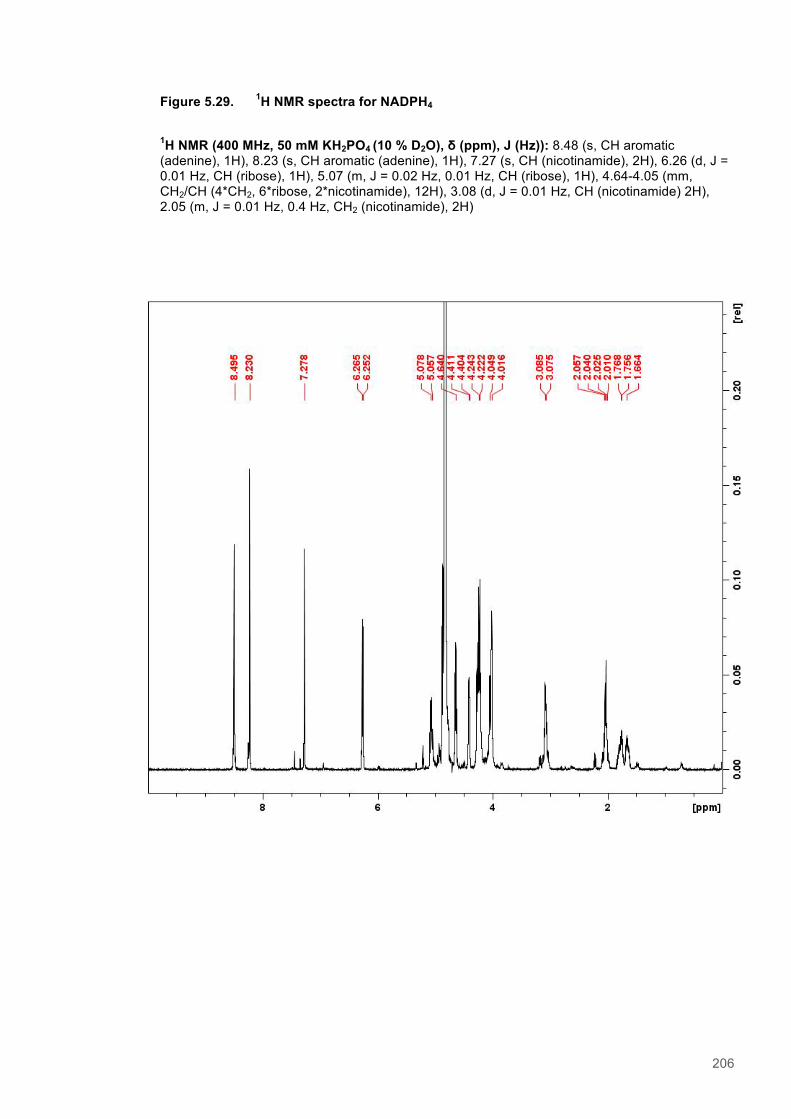
206
Figure 5.29. 1H NMR spectra for NADPH4
1H NMR (400 MHz, 50 mM KH2PO4 (10 % D2O), δ (ppm), J (Hz)): 8.48 (s, CH aromatic (adenine), 1H), 8.23 (s, CH aromatic (adenine), 1H), 7.27 (s, CH (nicotinamide), 2H), 6.26 (d, J = 0.01 Hz, CH (ribose), 1H), 5.07 (m, J = 0.02 Hz, 0.01 Hz, CH (ribose), 1H), 4.64-4.05 (mm, CH2/CH (4*CH2, 6*ribose, 2*nicotinamide), 12H), 3.08 (d, J = 0.01 Hz, CH (nicotinamide) 2H), 2.05 (m, J = 0.01 Hz, 0.4 Hz, CH2 (nicotinamide), 2H)
207
Chapter 6
Discussion 6.1 Discussion and future prospects
The initial aim of the work described in this thesis was to address the role of putative promoting
dynamics in H-transfer reactions catalysed by Pentaerythritol tetranitrate reductase, a well-
characterised and popular model system for the study of enzymatic H-tunnelling. This consisted
of applying traditional approaches for elucidating enzyme mechanisms, including the creation and
characterisation of enzyme variants, as well as more novel strategies, such as the investigation of
intermolecular NOEs to assess donor-acceptor distance relationships as a function of hydrostatic
pressure. The investigation expanded to include other members of the OYE family and also to
address the physical basis for the enhanced reactivity of these enzymes with a set of novel
Nicotinamide Coenzyme Biomimetic (NCB) compounds. There has recently been a surge in the
popularity of this enzyme family, due to its utility as a broad-specificity ene-reductase for various
biosynthetic applications. Potential uses include catalysing steps in pathways for the synthesis of
lactones used in the production of biodegradable plastics, ketones that are important
pharmaceutical synthons and even in biosynthetic cascades for making drugs to treat Alzheimers
disease and type 2 diabetes.1 In addition, the nitroreductase activity of PETNR has also been
tested for use in the bioremediation of explosive-contaminated sites.2 The work described here
therefore makes use of experimental techniques normally reserved for studying H-tunnelling to
deduce information regarding systems of relevance to more applied branches of biochemistry. In
the near future, the exploitation of advanced biophysical approaches and the enhanced
mechanistic understanding of enzyme catalysis offered will be vital for the development of cost-
effective, sustainable and industrially viable biocatalysts. The broader applications of which may
one day include renewable fuel sources and alternatives to resource intensive chemical synthesis
techniques.
6.1.1 The use of enzymatic variants for the study of H-transfer kinetics in PETNR
The use of site-directed mutagenesis for the study of enzyme mechanisms and more specifically,
better understanding the relationship between H-transfer distances and the observed rate of
tunnelling has been well documented. Here the creation of variants with truncated hydrophobic
side chain lengths was pursued to probe the importance of active site structure and catalytically
relevant dynamic networks in PETNR for the first time. The changed KIE temperature
dependences observed with PETNR variants indicated that the environmental coupling of H-
transfer had been disrupted, likely due to the perturbation of promoting dynamics. The rate of
catalysis was however largely unaffected as a result of mutagenesis, due to compensatory shift in
the entropies and enthalpies of activation. This further demonstrates the suitability of OYE
208
enzymes to act as robust biocatalysts that are able to withstand attempts to modify, for example,
substrate specificity, but without a incurring a significant cost in terms of observed rates of
catalysis. The X-ray crystal structures of PETNR variants were also examined, but failed to
provide any clear molecular basis for the change in the temperature dependence of the KIE
observed. Further characterisation of the variants may also include MD/QM simulations
benchmarked against the available experimental data to investigate the effect of mutation on the
networks vibrational modes and donor-acceptor distances within the active site. Dual pressure-
temperature dependence studies may also offer a chance to understand in more detail the effect
of the changes in DADs via mutagenesis and their modulation via promoting dynamics.3,4
However, it is atomistic understanding that is truly sought after. Therefore the development and
proliferation of time-resolved structural approaches, with improved spatial resolution, offers an
attractive opportunity. The development of third-generation X-ray free electron (XFELs) sources
offers the chance to study at atomic resolution the structure of enzymes and also understand
dynamics occurring over the sub-ps timescale.5,6 As PETNR readily crystallises and provides high
quality diffraction data, time-resolved studies of mutagenic variants may offer the opportunity to
correlate changes in reaction kinetics with subtle perturbations in vibrational dynamics.7 Terahertz
spectroscopy, ultrafast transient absorption and/or NMR (T1/T2) relaxation studies may provide
an opportunity to characterise and compare motions, in the PETNR variants, of a suitable
amplitude and timescale to be relevant to H-transfer.8-10 Lastly, the difference in the relative heat
capacity changes observed for reactions of the PETNR variants was also explored through the
use of a modified Eyring model.11 In light of this analysis, it seemed that changes in optimal
temperature for catalysis were realised upon mutagenesis, possibly as a result in changes in the
relative flexibility of ground- and transition- states of the PETNR-substrate complex. 11 The use of
a modified Eyring model helped to clarify the effects of mutations on the kinetic profile of PETNR
in this instance. In the future, attempts to understand the molecular basis underpinning changes
in heat capacity seen during enzyme catalysis may provide further insight into the complex
temperature dependences of other model systems that exhibit non-classical Arrhenius behavior.
6.1.2 Novel cofactor analogues and newish enzymes for biocatalysis
The proliferation of enzyme based approaches in chemicals manufacture hinges on a wide range
of issues. Of course these include developing the know-how to synthesise tailored expression
platforms, the ability to accurately modify enzyme substrate specificities and the expertise to
produce recombinant protein on an industrial scale. There is also, however, a need to develop
strategies to circumvent the demand for expensive cofactors and the associated cofactor-
recycling systems. Here, the KIE kinetics of a range of ene-rductase enzymes with a set of novel
NCB compounds has been characterised.12 These compounds are attractive as they are small
and cheap to produce, do not contain expensive phosphate groups and also, in many cases, out
–perform the natural coenzyme counterparts.13 The reactions of both TOYE and XenA were
shown to also proceed via H-tunnelling, with both natural coenzymes and the synthetic
209
analogues. Furthermore, the enhanced performance of the mimetic compounds was shown to
correlate with the enthalpy of activation, suggesting enhanced DAD sampling is important. This
demonstrates that the understanding of tunnelling mediated H-transfer in reactions is important
for reactions ene-reductases with NCBs and that the optimization of additional reaction
parameters, such as average DADs with relevant substrates, may also help in the modification of
enzymes an cofactors for biocatalytic approaches. Whether, or not, NCBs become a feasible
alternative to natural cofactor-based sources of reductive energy will be dependent on the
development of maintainable sources of reduced and stable biomimetic compounds, such as via
in-situ regeneration.14 The high similarity of the NCB compounds studied here to those pyridine
compounds found naturally in biology, such as Vitamin B3 (nicotinic acid), raises the possibility of
repurposing natural enzymes to create a biosynthetic production route.13,15,16 Alternatively, it may
be more beneficial to focus on developing more highly stable NCBs that can be cheaply mass
produced.
6.1.3 Studying donor acceptor distances via NOE spectroscopy
The assignment of amide resonances was first carried out with unbound PETNR. This enabled
characterisation of the binding of various ligands, and an assessment of their suitability to act as
reductive substrate mimics.17 Measurement of NOEs occurring between substrate and protein
was then undertaken to assess structural changes affecting the donor-acceptor distance in the
PETNR-nicotinamide, and PETNR-NADPH4, complexes. The former was investigated using STD-
NMR, which indicated the presence of suitable intermolecular NOEs. Subsequent
characterisation of NOEs for the PETNR-NADPH4 complex was carried via studying selective
NOE build up. Following identification of a suitable intermolecular NOE, similar experiments were
performed at 1 and 2500 bar. The application of hydrostatic pressure appeared to affect the rate
of NOE build up, as a result of compression of the active site. Variable pressure-NOE studies
were therefore shown to be of potential use for investigating structural changes observed in
PETNR in a solvated environment. The measurement is, however, subject to the broader affects
of pressure on the experimental system, such as shifts in the KD of protein-ligand interaction and
relative rates of solvent proton exchange at different pressures. Future studies should therefore
be concerned with further developing the approach for accurate measurement of NOEs over a
variable pressure range. One approach could be to modify the selective NOE pulse sequence.
Shortening the duration of selective excitation pulse could be achieved by removal of spin-echo
sequence, so that it is less likely to be influenced by pressure induced changes in exchange in
solvent exchange rates. Furthermore, analysing multiple NOEs of interest between the protein
and ligand as a function of pressure would enable accurate triangulation of the substrate position
and measurement of small distance changes. The use of 2D selective NOE pulse sequences
would enable the specific targeting of otherwise overlapped resonances, and therefore provide
more potential target resonances for identifying NOEs.18 It would also be advisable to confirm the
assignment of the NOE peaks to provide confidence in the NOE relationships being assessed.
210
Chapter 7
References
7.1 References for Chapters 1 & 2
(1) Horton,H.R.PrinciplesofBiochemistry;PrenticeHallPTR,2006. (2) Schägger,H.;Pfeiffer,K.TheEMBOJournal2000,19,1777. (3) Yacoby,I.;Pochekailov,S.;Toporik,H.;Ghirardi,M.L.;King,P.W.;Zhang,S.ProceedingsoftheNationalAcademyofSciences2011,108,9396. (4) Henzler-Wildman,K.;Kern,D.Nature2007,450,964. (5) Boehr,D.D.;Dyson,H.J.;Wright,P.E.ChemicalReviews2006,106,3055. (6) Henzler-Wildman,K.A.;Lei,M.;Thai,V.;Kerns,S.J.;Karplus,M.;Kern,D.Nature2007,450,913. (7) Hay,S.;Scrutton,N.S.NatChem2012,4,161. (8) Glowacki,D.R.;Harvey,J.N.;Mulholland,A.J.NatChem2012,4,169. (9) Kamerlin,S.C.L.;Mavri,J.;Warshel,A.FEBSLetters2010,584,2759. (10) Venkitakrishnan,R.P.;Zaborowski,E.;McElheny,D.;Benkovic,S.J.;Dyson,H.J.;Wright,P.E.Biochemistry2004,43,16046. (11) Hay,S.;Pudney,C.;Hothi,P.;Johannissen,LinusO.;Masgrau,L.;Pang,J.;Leys,D.;Sutcliffe,MichaelJ.;Scrutton,NigelS.BiochemicalSocietyTransactions2008,36,16. (12) Schwartz,S.D.;Schramm,V.L.NatChemBiol2009,5,551. (13) Pudney,C.R.;Hay,S.;Levy,C.;Pang,J.;Sutcliffe,M.J.;Leys,D.;Scrutton,N.S.JournaloftheAmericanChemicalSociety2009,131,17072. (14) Nagel,Z.D.;Klinman,J.P.ChemicalReviews2006,106,3095. (15) Amnon,K.K.,J.P.;Chemistry&Biology1999,6,191. (16) Warburg,O.;Christian,W.Naturwissenschaften1932,20,688. (17) Haas,E.BiochemZ1938,298,378. (18) Theorell,H.1955;Vol.2016. (19) Ballou,D.P.;Williams,C.H.;Coon,M.J.TrendsBiochem.Sci2002,27,641. (20) Vermilion,J.L.;Coon,M.J.JournalofBiologicalChemistry1978,253,8812. (21) Munro,A.W.;Leys,D.G.;McLean,K.J.;Marshall,K.R.;Ost,T.W.B.;Daff,S.;Miles,C.S.;Chapman,S.K.;Lysek,D.A.;Moser,C.C.;Page,C.C.;Dutton,P.L.TrendsinBiochemicalSciences2002,27,250. (22) Medina,M.FEBSJournal2009,276,3942. (23) Saito,K.;Thiele,D.J.;Davio,M.;Lockridge,O.;Massey,V.JournalofBiologicalChemistry1991,266,20720. (24) Stott,K.;Saito,K.;Thiele,D.J.;Massey,V.JournalofBiologicalChemistry1993,268,6097. (25) Consortium,T.U.NucleicAcidsRes.2015,43,D204. (26) Biebl,H.;Tindall,B.J.;Pukall,R.;Lünsdorf,H.;Allgaier,M.;Wagner-Döbler,I.InternationalJournalofSystematicandEvolutionaryMicrobiology2006,56,821. (27) Schaller,F.;Weiler,E.W.JournalofBiologicalChemistry1997,272,28066. (28) Klenk,H.-P.;Clayton,R.A.;Tomb,J.-F.;White,O.;Nelson,K.E.;Ketchum,K.A.;Dodson,R.J.;Gwinn,M.;Hickey,E.K.;Peterson,J.D.;Richardson,D.L.;Kerlavage,A.R.;Graham,D.E.;Kyrpides,N.C.;Fleischmann,R.D.;Quackenbush,J.;Lee,N.H.;Sutton,G.G.;Gill,S.;Kirkness,E.F.;Dougherty,B.A.;McKenney,K.;Adams,M.D.;Loftus,B.;Peterson,S.;Reich,C.I.;McNeil,L.K.;Badger,J.H.;Glodek,A.;Zhou,L.;Overbeek,R.;Gocayne,J.D.;Weidman,J.F.;McDonald,L.;Utterback,T.;Cotton,M.D.;Spriggs,T.;Artiach,P.;Kaine,B.P.;Sykes,S.M.;Sadow,P.W.;D'Andrea,K.P.;Bowman,C.;Fujii,C.;Garland,S.A.;Mason,T.M.;Olsen,G.J.;Fraser,C.M.;Smith,H.O.;Woese,C.R.;Venter,J.C.Nature1997,390,364. (29) French,C.E.;Nicklin,S.;Bruce,N.C.JournalofBacteriology1996,178,6623. (30) French,C.E.;Bruce,N.C.BiochemicalJournal1994,301,97. (31) Toogood,H.S.;Scrutton,N.S.CurrentOpinioninChemicalBiology2014,19,107.
211
(32) Fu,Y.;Castiglione,K.;Weuster-Botz,D.BiotechnologyandBioengineering2013,110,1293. (33) Gao,X.;Ren,J.;Wu,Q.;Zhu,D.EnzymeandMicrobialTechnology2012,51,26. (34) FuY;HoelschK;D,W.-B.Process.Biochem.2012,47,1988. (35) Liu,Y.-J.;Pei,X.-Q.;Lin,H.;Gai,P.;Liu,Y.-C.;Wu,Z.-L.AppliedMicrobiologyandBiotechnology2012,95,635. (36) Marshall,S.J.;Krause,D.;Blencowe,D.K.;White,G.F.JournalofBacteriology2004,186,1802. (37) Meah,Y.;Massey,V.ProceedingsoftheNationalAcademyofSciencesoftheUnitedStatesofAmerica2000,97,10733. (38) Barna,T.;Messiha,H.L.;Petosa,C.;Bruce,N.C.;Scrutton,N.S.;Moody,P.C.E.JournalofBiologicalChemistry2002,277,30976. (39) Keir,H.M.BiochemicalEducation1975,3. (40) Brown,B.J.;Deng,Z.;Karplus,P.A.;Massey,V.JournalofBiologicalChemistry1998,273,32753. (41) Pudney,C.R.;Hay,S.;Scrutton,N.S.FEBSJournal2009,276,4780. (42) Vaz,A.D.N.;Chakraborty,S.;Massey,V.Biochemistry1995,34,4246. (43) Basran,J.;Harris,R.J.;Sutcliffe,M.J.;Scrutton,N.S.JournalofBiologicalChemistry2003,278,43973. (44) Xu,D.;Kohli,R.M.;Massey,V.ProceedingsoftheNationalAcademyofSciences1999,96,3556. (45) Khan,H.;Harris,R.J.;Barna,T.;Craig,D.H.;Bruce,N.C.;Munro,A.W.;Moody,P.C.E.;Scrutton,N.S.JournalofBiologicalChemistry2002,27721906. (46) Williams,R.E.;Bruce,N.C.Microbiology2002,148,1607. (47) Massey,V.;Schopfer,L.M.JournalofBiologicalChemistry1986,261,1215. (48) Craig,D.H.;Moody,P.C.E.;Bruce,N.C.;Scrutton,N.S.Biochemistry1998,37,7598. (49) Massey,V.;Schopfer,L.M.journalofbiologicalChemistry1986,261,1215. (50) Khan,H.;Barna,T.;Bruce,N.C.;Munro,A.W.;Leys,D.;Scrutton,N.S.FEBSJournal2005,272,4660. (51) Stuermer,R.;Hauer,B.;Hall,M.;Faber,K.CurrentOpinioninChemicalBiology2007,11,203. (52) Toogood,H.S.;Gardiner,J.M.;Scrutton,N.S.ChemCatChem2010,2,892. (53) Meah,Y.;Brown,B.J.;Chakraborty,S.;Massey,V.ProceedingsoftheNationalAcademyofSciences2001,98,8560. (54) Reetz,M.T.;Bocola,M.;Wang,L.-W.;Sanchis,J.;Cronin,A.;Arand,M.;Zou,J.;Archelas,A.;Bottalla,A.-L.;Naworyta,A.;Mowbray,S.L.JournaloftheAmericanChemicalSociety2009,131,7334. (55) Fronza,G.;Fuganti,C.;Mendozza,M.;Rigoni,R.;Servia,S.;Zucchi,G.PureandAppliedChemistry2009,68,2065. (56) Chaparro-Riggers,J.F.;Rogers,T.A.;Vazquez-Figueroa,E.;Polizzi,K.M.;Bommarius,A.S.AdvancedSynthesis&Catalysis2007,349,1521. (57) Fryszkowska,A.;Toogood,H.;Sakuma,M.;Gardiner,J.M.;Stephens,G.M.;Scrutton,N.S.AdvancedSynthesis&Catalysis2009,351,2976. (58) Hall,M.;Stueckler,C.;Ehammer,H.;Pointner,E.;Oberdorfer,G.;Gruber,K.;Hauer,B.;Stuermer,R.;Kroutil,W.;Macheroux,P.;Faber,K.AdvancedSynthesis&Catalysis2008,350,411. (59) Hall,M.;Stueckler,C.;Hauer,B.;Stuermer,R.;Friedrich,T.;Breuer,M.;Kroutil,W.;Faber,K.EuropeanJournalofOrganicChemistry2008,2008,1511. (60) Hall,M.;Stueckler,C.;Kroutil,W.;Macheroux,P.;Faber,K.AngewandteChemie2007,119,4008. (61) Karplus,P.A.;Fox,K.M.;Massey,V.TheFASEBJournal1995,9,1518. (62) Wierenga,R.K.FEBSLetters2001,492,193. (63) Opperman,D.J.;Sewell,B.T.;Litthauer,D.;Isupov,M.N.;Littlechild,J.A.;vanHeerden,E.BiochemicalandBiophysicalResearchCommunications2010,393,426. (64) Fox,K.M.;Karplus,P.A.Structure1994,2,1089. (65) Murakami,M.T.;Rodrigues,N.C.;Gava,L.M.;Honorato,R.V.;Canduri,F.;Barbosa,L.R.S.;Oliva,G.;Borges,J.C.BiophysicalChemistry2013,184,44. (66) Adalbjörnsson,B.V.;Toogood,H.S.;Fryszkowska,A.;Pudney,C.R.;Jowitt,T.A.;Leys,D.;Scrutton,N.S.ChemBioChem2010,11,197.
212
(67) Spiegelhauer,O.;Dickert,F.;Mende,S.;Niks,D.;Hille,R.;Ullmann,M.;Dobbek,H.Biochemistry2009,48,11412. (68) Barna,T.M.;Khan,H.;Bruce,N.C.;Barsukov,I.;Scrutton,N.S.;Moody,P.C.E.JournalofMolecularBiology2001,310,433. (69) Kitzing,K.;Fitzpatrick,T.B.;Wilken,C.;Sawa,J.;Bourenkov,G.P.;Macheroux,P.;Clausen,T.JournalofBiologicalChemistry2005,280,27904. (70) Schopfer,F.M.;Massey,V.OldYellowEnzyme.InAStudyofEnzymes;CRCPress:Cleveland,Ohio,1991. (71) Williams,R.E.;Rathbone,D.A.;Scrutton,N.S.;Bruce,N.C.AppliedandEnvironmentalMicrobiology2004,70,3566. (72) Oberdorfer,G.;Binter,A.;Wallner,S.;Durchschein,K.;Hall,M.;Faber,K.;Macheroux,P.;Gruber,K.Chembiochem2013,14,836. (73) Breithaupt,C.;Strassner,J.;Breitinger,U.;Huber,R.;Macheroux,P.;Schaller,A.;Clausen,T.Structure2001,9,419. (74) Fitzpatrick,T.B.;Auweter,S.;Kitzing,K.;Clausen,T.;Amrhein,N.;Macheroux,P.ProteinExpressionandPurification2004,36,280. (75) vandenHemel,D.;Brigé,A.;Savvides,S.N.;VanBeeumen,J.JournalofBiologicalChemistry2006,281,28152. (76) Joseph,D.W.;Miller,A.F.JournalofMolecularStructure2003,623185. (77) Fraaije,M.W.;Mattevi,A.TrendsinBiochemicalSciences2000,25,126. (78) Blehert,D.S.;Fox,B.G.;Chambliss,G.H.JournalofBacteriology1999,181,6254. (79) Abramovitz,A.S.;Massey,V.JournalofBiologicalChemistry1976,251,5327. (80) Kohli,R.M.;Massey,V.JournalofBiologicalChemistry1998,273,32763. (81) Nazina,T.N.;Tourova,T.P.;Poltaraus,A.B.;Novikova,E.V.;Grigoryan,A.A.;Ivanova,A.E.;Lysenko,A.M.;Petrunyaka,V.V.;Osipov,G.A.;Belyaev,S.S.;Ivanov,M.V.InternationalJournalofSystematicandEvolutionaryMicrobiology2001,51,433. (82) Rainey,F.A.;Stackebrandt,E.Int.J.Syst.Bacteriol1993,43,857. (83) Fitzpatrick,T.B.;Amrhein,N.;Macheroux,P.JournalofBiologicalChemistry2003,278,19891. (84) Spiegelhauer,O.;Mende,S.;Dickert,F.;Knauer,S.H.;Ullmann,G.M.;Dobbek,H.JournalofMolecularBiology2010,398,66. (85) Sievers,F.;Wilm,A.;Dineen,D.;Gibson,T.J.;Karplus,K.;Li,W.;Lopez,R.;McWilliam,H.;Remmert,M.;Söding,J.;Thompson,J.D.;Higgins,D.G.MolecularSystemsBiology2011,7,539. (86) Mueller,N.J.;Stueckler,C.;Hauer,B.;Baudendistel,N.;Housden,H.;Bruce,N.C.;Faber,K.AdvancedSynthesis&Catalysis2010,352,387. (87) Fryszkowska,A.;Toogood,H.;Sakuma,M.;Stephens,G.M.;Gardiner,J.M.;Scrutton,N.S.CatalysisScience&Technology2011,1,948. (88) Toogood,H.S.;Fryszkowska,A.;Hulley,M.;Sakuma,M.;Mansell,D.;Stephens,G.M.;Gardiner,J.M.;Scrutton,N.S.ChemBioChem2011,12,738. (89) Nivinskas,H.;Koder,R.L.;Anusevičius,Ž.;Šarlauskas,J.;Miller,A.-F.;Č≐nas,N.ArchivesofBiochemistryandBiophysics2001,385,170. (90) Onyenwoke,R.U.;Kevbrin,V.V.;Lysenko,A.M.;Wiegel,J.IntJSystEvolMicrobiol2007,57,2191. (91) Wiegel,J.;Ljungdahl,L.G.ArchivesofMicrobiology1981,128,343. (92) Delano,W.L.2002. (93) Yanto,Y.;Yu,H.-H.;Hall,M.;Bommarius,A.S.ChemicalCommunications2010,46,8809. (94) Blehert,D.S.;Fox,B.G.;Chambliss,G.H.JournalofBacteriology1999,181,6254. (95) Fetzner,S.;Tshisuaka,B.;Lingens,F.;Kappl,R.;Hüttermann,J.AngewandteChemieInternationalEdition1998,37,576. (96) Griese,J.J.;P.Jakob,R.;Schwarzinger,S.;Dobbek,H.JournalofMolecularBiology2006,361,140. (97) Knaus,T.;Paul,C.E.;Levy,C.W.;deVries,S.;Mutti,F.G.;Hollmann,F.;Scrutton,N.S.JournaloftheAmericanChemicalSociety2016,138,1033. (98) Rabinovitch-Deere,C.A.;Oliver,J.W.K.;Rodriguez,G.M.;Atsumi,S.ChemicalReviews2013,113,4611. (99) Turner,N.J.TrendsinBiotechnology2003,21,474.
213
(100) Knaus,T.;Toogood,H.S.;Scrutton,N.S.InGreenBiocatalysis;JohnWiley&Sons,Inc:2016,p473. (101) Lygidakis,A.;Karuppiah,V.;Hoeven,R.;NíCheallaigh,A.;Leys,D.;Gardiner,J.M.;Toogood,H.S.;Scrutton,N.S.AngewandteChemieInternationalEdition2016,55,9596. (102) Feuer,H.N.,A.;OrganicNitroChemistrySeries;Wiley-VCH:Weinheim,1990. (103) Dolak,T.M.;Kreighbaum,W.E.;Johnson,P.C.;Covington,R.R.JournalofLabelledCompoundsandRadiopharmaceuticals1983,20,1183. (104) Hollmann,F.;Arends,I.W.C.E.;Buehler,K.ChemCatChem2010,2,762. (105) Zhao,H.;vanderDonk,W.A.CurrentOpinioninBiotechnology2003,14,583. (106) Kroutil,W.;Mang,H.;Edegger,K.;Faber,K.AdvancedSynthesis&Catalysis2004,346,125. (107) Zhang,L.;Yuan,J.;Xu,Y.;Zhang,Y.H.P.;Qian,X.ChemicalCommunications2016,52,6471. (108) Paul,C.E.;Gargiulo,S.;Opperman,D.J.;Lavandera,I.;Gotor-Fernández,V.;Gotor,V.;Taglieber,A.;Arends,I.W.C.E.;Hollmann,F.OrganicLetters2013,15,180. (109) Paul,C.E.;Arends,I.W.C.E.;Hollmann,F.ACSCatalysis2014,4,788. (110) Lo,H.C.;Leiva,C.;Buriez,O.;Kerr,J.B.;Olmstead,M.M.;Fish,R.H.InorganicChemistry2001,40,6705. (111) Eyring,H.J.Chem.Phys.1935,3,107. (112) Pauling,L.Chemical&EngineeringNewsArchive1946,24,1375. (113) Cha,Y.;Murray,C.;Klinman,J.Science1989,243,1325. (114) Heisenberg,W.Z.Phys.1927,43,172. (115) Kohen,A.;Klinman,J.P.Chemistry&Biology1999,6,191. (116) Basran,J.M.,L;Sutcliffe,MJ;Scrutton,NS;InIsotopeeffectsinChemistryandBiology;Kohen,A.L.,HH;,Ed.;TaylorandFrancis:2005,p671. (117) Bagshaw,C.R.InEncyclopediaofBiophysics;Roberts,G.C.K.,Ed.;SpringerBerlinHeidelberg:Berlin,Heidelberg,2013,p1200. (118) Hay,S.;Pudney,C.R.;Sutcliffe,M.J.;Scrutton,N.S.JournalofPhysicalOrganicChemistry2010,23,696. (119) Kurz,L.C.;Frieden,C.JournaloftheAmericanChemicalSociety1980,102,4198. (120) Huskey,W.P.;Schowen,R.L.JournaloftheAmericanChemicalSociety1983,105,5704. (121) Saunders,W.H.JournaloftheAmericanChemicalSociety1985,107,164. (122) Bell,R.JournalofMolecularStructure1980,74,356. (123) Sharma,S.C.;Klinman,J.P.JournaloftheAmericanChemicalSociety2008,130,17632. (124) Westheimer,F.H.ChemicalReviews1961,61,265. (125) Sikorski,R.S.;Wang,L.;Markham,K.A.;Rajagopalan,P.T.R.;Benkovic,S.J.;Kohen,A.JournaloftheAmericanChemicalSociety2004,126,4778. (126) Basran,J.;Sutcliffe,M.J.;Scrutton,N.S.Biochemistry1999,38,3218. (127) Glickman,M.H.;Wiseman,J.S.;Klinman,J.P.JournaloftheAmericanChemicalSociety1994,116,793. (128) Bruno,W.J.;Bialek,W.BiophysicalJournal1992,63,689. (129) Borgis,D.;Hynes,J.T.ChemicalPhysics1993,170,315. (130) Kuznetsov,A.M.U.,J.;CanadianJournalofChemistry1999,77,1085. (131) Marcus,R.A.S.,N.;BiochimicaetBiophysicaActa1985,811,265. (132) Silverman,D.N.BiochimicaetBiophysicaActa(BBA)-Bioenergetics2000,1458,88. (133) Klinman,J.P.BiochimicaetBiophysicaActa(BBA)-Bioenergetics2006,1757,981. (134) Klinman,J.P.;Kohen,A.Annualreviewofbiochemistry2013,82,471. (135) Hoeven,R.;Heyes,D.J.;Hay,S.;Scrutton,N.S.FEBSJournal2015,282,3243. (136) Stojković,V.;Perissinotti,L.L.;Willmer,D.;Benkovic,S.J.;Kohen,A.JournaloftheAmericanChemicalSociety2012,134,1738. (137) Caratzoulas,S.;Mincer,J.S.;Schwartz,S.D.JournaloftheAmericanChemicalSociety2002,124,3270. (138) Johannissen,L.O.;Scrutton,N.S.;Sutcliffe,M.J.AngewandteChemieInternationalEdition2011,50,2129. (139) Schwartz,S.D.;Schramm,V.L.Naturechemicalbiology2009,5,551. (140) Wang,Z.;Antoniou,D.;Schwartz,S.D.;Schramm,V.L.Biochemistry2016,55,157.
214
(141) Knapp,M.J.;Rickert,K.;Klinman,J.P.JournaloftheAmericanChemicalSociety2002,124,3865. (142) Hatcher,E.;Soudackov,A.V.;Hammes-Schiffer,S.JournaloftheAmericanChemicalSociety2007,129,187. (143) Meyer,M.P.;Klinman,J.P.Chemicalphysics2005,319,283. (144) Pudney,C.R.;Guerriero,A.;Baxter,N.J.;Johannissen,L.O.;Waltho,J.P.;Hay,S.;Scrutton,N.S.JournaloftheAmericanChemicalSociety2013,135,2512. (145) Wang,Z.S.,P.;Czekster,C.M.;Kohen,A.;Schramm,V.L.;J.Am.Chem.Soc.2014,136,8333−8341. (146) Hay,S.;Johannissen,L.O.;Hothi,P.;Sutcliffe,M.J.;Scrutton,N.S.JournaloftheAmericanChemicalSociety2012,134,9749. (147) Northrop,D.B.JournaloftheAmericanChemicalSociety1999,121,3521. (148) Akasaka,K.ChemicalReviews2006,106,1814. (149) Nuñez,S.;Tresadern,G.;Hillier,I.H.;Burton,N.A.PhilosophicalTransactionsoftheRoyalSocietyB:BiologicalSciences2006,361,1387. (150) Roston,D.;Cheatum,C.M.;Kohen,A.Biochemistry2012,51,6860. (151) Northrop,D.B.PhilosophicalTransactionsoftheRoyalSocietyofLondonB:BiologicalSciences2006,361,1341. (152) Hay,S.;Sutcliffe,M.J.;Scrutton,N.S.ProceedingsoftheNationalAcademyofSciencesoftheUnitedStatesofAmerica2007,104,507. (153) Hay,S.;Scrutton,N.S.Biochemistry2008,47,9880. (154) Isaacs,N.S.;Javaid,K.;Rannala,E.Nature1977,268,372. (155) Govindaraj,S.;Eisenstein,E.;Jones,L.H.;Sanders-Loehr,J.;Chistoserdov,A.Y.;Davidson,V.L.;Edwards,S.L.JournalofBacteriology1994,176,2922. (156) Masgrau,L.;Roujeinikova,A.;Johannissen,L.O.;Hothi,P.;Basran,J.;Ranaghan,K.E.;Mulholland,A.J.;Sutcliffe,M.J.;Scrutton,N.S.;Leys,D.Science2006,312,237. (157) Hothi,P.;Hay,S.;Roujeinikova,A.;Sutcliffe,M.J.;Lee,M.;Leys,D.;Cullis,P.M.;Scrutton,N.S.ChemBioChem2008,9,2839. (158) Carr,C.A.M.;Klinman,J.P.Biochemistry2014,53,2212. (159) McCusker,K.P.;Klinman,J.P.JournaloftheAmericanChemicalSociety2010,132,5114. (160) Pudney,C.R.;Johannissen,L.O.;Sutcliffe,M.J.;Hay,S.;Scrutton,N.S.JournaloftheAmericanChemicalSociety2010,132,11329. (161) Hu,S.;Sharma,S.C.;Scouras,A.D.;Soudackov,A.V.;Carr,C.A.M.;Hammes-Schiffer,S.;Alber,T.;Klinman,J.P.JournaloftheAmericanChemicalSociety2014,136,8157. (162) Wang,Z.;Abeysinghe,T.;Finer-Moore,J.S.;Stroud,R.M.;Kohen,A.JournaloftheAmericanChemicalSociety2012,134,17722. (163) Pudney,C.R.;Hay,S.;Sutcliffe,M.J.;Scrutton,N.S.JournaloftheAmericanChemicalSociety2006,128,14053. (164) Olsson,M.H.M.;Siegbahn,P.E.M.;Warshel,A.JournaloftheAmericanChemicalSociety2004,126,2820. (165) Wuthrich,K.NatStructMolBiol2001,8,923. (166) Massi,F.;Grey,M.J.;Palmer,A.G.ProteinScience:APublicationoftheProteinSociety2005,14,735. (167) Kay,L.E.JournalofMagneticResonance2005,173,193. (168) Dias,D.M.;Ciulli,A.ProgressinBiophysicsandMolecularBiology2014,116,101. (169) Lambert,J.B.;Mazzola,E.P.NuclearMagneticResonanceSpectroscopy:AnIntroductiontoPrinciples,Applications,andExperimentalMethods;PearsonEducation,2004. (170) Keeler,J.K.UnderstandingNMRSpectroscopy;2ndedned.;JohnWileyandSons:Chichester,2010. (171) Hore,P.J.NuclearMagneticResonance;OxfordUniversityPress,2015. (172) Keeler,J.UnderstandingNMRSpectroscopy;Wiley,2011. (173) Levitt,M.H.SpinDynamics:BasicsofNuclearMagneticResonance;Wiley,2013. (174) Dingley,A.J.;Pascal,S.M.BiomolecularNMRSpectroscopy;IOSPress,2011. (175) Neuhaus,D.W.,M.P.;TheNuclearOverhauserEffectinStructuralandConformationalAnalysis;2ed.;Wiley-VCH:NewYork,2000. (176) Williamson,M.P.AnnualReportsonNMR2009,77. (177) Ni,F.Prog.NMRSpectrosc.1994,517.
215
(178) Viegas,A.;Manso,J.;Nobrega,F.L.;Cabrita,E.J.JournalofChemicalEducation2011,88,990. (179) Jayalakshmi,V.;Krishna,N.R.JournalofMagneticResonance2002,155,106. (180) Yan,J.;Kline,A.D.;Mo,H.;Shapiro,M.J.;Zartler,E.R.JournalofMagneticResonance2003,163,270. (181) Rahman,A.OneandTwoDimensionalNMRSpectroscopy;ElsevierScience,2013. (182) Hore,P.J.;Jones,J.J.A.;Wimperis,S.Nmr:TheToolkit;OxfordUniversityPress,Incorporated,2000. (183) Cavanagh,J.;Fairbrother,W.J.;Palmer,A.G.;Skelton,N.J.;Rance,M.ProteinNMRSpectroscopy:PrinciplesandPractice;ElsevierScience,2010. (184) Howard,M.J.CurrentBiology1998,8,R331. (185) Kay,L.E.JournalofMagneticResonance2011,213,477. (186) Tugarinov,V.;Kay,L.E.ChemBioChem2005,6,1567. (187) Berman,H.M.W.,J.;Feng,Z.;Gilliland,G.;Bhat,T.N.;Weissig,H.;Shindyalov,I.N.;Bourne,P.E.;NucleicAcidsResearch2000,28,235. (188) Phillips,J.C.;Wlodawer,A.;Yevitz,M.M.;Hodgson,K.O.ProceedingsoftheNationalAcademyofSciencesoftheUnitedStatesofAmerica1976,73,128. (189) Schlichting,I.;Miao,J.Currentopinioninstructuralbiology2012,22,613. (190) McPherson,A.CrystallizationofBiologicalMacromolecules;ColdSpringHarborLaboratoryPress:ColdSpringHarbor,NY,1999. (191) Chayen,N.E.CurrentOpinioninStructuralBiology2004,14,577. (192) Bergfors,T.ProteinCrystallization;2ndedn.ed.;InternationalUniversityLine:LaJolla,CA,2009. (193) Chayen,N.E.;Saridakis,E.NatMeth2008,5,147. (194) Bukowska,M.A.;Grütter,M.G.CurrentOpinioninStructuralBiology2013,23,409. (195) Wlodawer,A.;Minor,W.;Dauter,Z.;Jaskolski,M.TheFEBSjournal2008,275,1. (196) Zwart,P.H.;Grosse-Kunstleve,R.W.;Lebedev,A.A.;Murshudov,G.N.;Adams,P.D.ActaCrystallographicaSectionD:BiologicalCrystallography2008,64,99. (197) Otwinowski,Z.;Minor,W.InMethodsinEnzymology;AcademicPress:1997;Vol.Volume276,p307. (198) McCoy,A.J.ActaCrystallographicaSectionD:BiologicalCrystallography2007,63,32. (199) Adams,P.D.;Afonine,P.V.;Bunkoczi,G.;Chen,V.B.;Davis,I.W.;Echols,N.;Headd,J.J.;Hung,L.-W.;Kapral,G.J.;Grosse-Kunstleve,R.W.;McCoy,A.J.;Moriarty,N.W.;Oeffner,R.;Read,R.J.;Richardson,D.C.;Richardson,J.S.;Terwilliger,T.C.;Zwart,P.H.ActaCrystallographicaSectionD2010,66,213. (200) Grimsley,G.R.;Pace,C.N.InCurrentProtocolsinProteinScience;JohnWiley&Sons,Inc.:2001. (201) Wüthrich,K.;Wider,G.;Wagner,G.;Braun,W.JMolBiol1982,155,311. (202) Zhu,G.;Kong,X.M.;Sze,K.H.JournalofBiomolecularNMR1999,13,77. (203) Kay,L.E.;Ikura,M.;Tschudin,R.;Bax,A.JournalofMagneticResonance2011,213,423. (204) Eletsky,A.;Kienhöfer,A.;Pervushin,K.JBiomolNMR200120,177. (205) Schulte-Herbrüggen,T.;Sørensen,O.W.JournalofMagneticResonance2000,144,123. (206) Salzmann,M.;Wider,G.;Pervushin,K.;Senn,H.;Wüthrich,K.JournaloftheAmericanChemicalSociety1999,121,844. (207) Ikura,M.;Kay,L.E.;Bax,A.JBiomolNMR1991,1. (208) Wittekind,M.;Mueller,L.JournalofMagneticResonance1993101,201. (209) Vranken,W.F.;Boucher,W.;Stevens,T.J.;Fogh,R.H.;Pajon,A.;Llinas,M.;Ulrich,E.L.;Markley,J.L.;Ionides,J.;Laue,E.D.Proteins2005,59,687. (210) M.Mayer;B.MeyerAngew.Chem.Int.1999,38,1784. (211) K.Stott;J.Stonehouse;J.Keeler;T.L.Hwang;A.J.ShakaJ.Am.Chem.Soc.1995,117,4199. (212) Viola,R.E.C.,P.F.;Cleland,W.W;AnalBiochem1979,96,334.
216
7.2 References for Chapter 3
(1) Hay,S.;Scrutton,N.S.NatChem2012,4,161. (2) Pudney,C.R.;Hay,S.;Levy,C.;Pang,J.;Sutcliffe,M.J.;Leys,D.;Scrutton,N.S.JournaloftheAmericanChemicalSociety2009,131,17072. (3) Knapp,M.J.;Rickert,K.;Klinman,J.P.JournaloftheAmericanChemicalSociety2002,124,3865. (4) Warshel,A.;Sharma,P.K.;Kato,M.;Xiang,Y.;Liu,H.;Olsson,M.H.M.ChemicalReviews2006,106,3210. (5) Schwartz,S.D.;Schramm,V.L.Naturechemicalbiology2009,5,551. (6) Hay,S.;Sutcliffe,M.J.;Scrutton,N.S.ProceedingsoftheNationalAcademyofSciencesoftheUnitedStatesofAmerica2007,104,507. (7) Klinman,J.P.BiochimicaetBiophysicaActa(BBA)-Bioenergetics2006,1757,981. (8) Johannissen,L.O.;Scrutton,N.S.;Sutcliffe,M.J.AngewandteChemieInternationalEdition2011,50,2129. (9) Meyer,M.P.;Klinman,J.P.Chemicalphysics2005,319,283. (10) Huang,Z.;Wagner,C.R.;Benkovic,S.J.Biochemistry1994,33,11576. (11) Agarwal,P.K.;Billeter,S.R.;Rajagopalan,P.T.R.;Benkovic,S.J.;Hammes-Schiffer,S.ProceedingsoftheNationalAcademyofSciences2002,99,2794. (12) Stojković,V.;Perissinotti,L.L.;Willmer,D.;Benkovic,S.J.;Kohen,A.JournaloftheAmericanChemicalSociety2012,134,1738. (13) Wang,Z.;Abeysinghe,T.;Finer-Moore,J.S.;Stroud,R.M.;Kohen,A.JournaloftheAmericanChemicalSociety2012,134,17722. (14) Hu,S.;Sharma,S.C.;Scouras,A.D.;Soudackov,A.V.;Carr,C.A.M.;Hammes-Schiffer,S.;Alber,T.;Klinman,J.P.JournaloftheAmericanChemicalSociety2014,136,8157. (15) Pudney,C.R.;Johannissen,L.O.;Sutcliffe,M.J.;Hay,S.;Scrutton,N.S.JournaloftheAmericanChemicalSociety2010,132,11329. (16) Toogood,H.S.;Fryszkowska,A.;Hulley,M.;Sakuma,M.;Mansell,D.;Stephens,G.M.;Gardiner,J.M.;Scrutton,N.S.ChemBioChem2011,12,738. (17) Fryszkowska,A.;Toogood,H.;Sakuma,M.;Gardiner,J.M.;Stephens,G.M.;Scrutton,N.S.Advancedsynthesis&catalysis2009,351,2976. (18) Peers,M.K.;Toogood,H.S.;Heyes,D.J.;Mansell,D.;Coe,B.J.;Scrutton,N.S.CatalysisScience&Technology2016,6,169. (19) Barna,T.M.;Khan,H.;Bruce,N.C.;Barsukov,I.;Scrutton,N.S.;Moody,P.C.E.JournalofMolecularBiology2001,310,433. (20) Khan,H.;Barna,T.;Bruce,N.C.;Munro,A.W.;Leys,D.;Scrutton,N.S.FEBSJournal2005,272,4660. (21) Porterfield,J.Z.;Zlotnick,A.Virology2010,407,281. (22) Oliveberg,M.;Fersht,A.R.Biochemistry1996,35,2738. (23) Hobbs,J.K.;Jiao,W.;Easter,A.D.;Parker,E.J.;Schipper,L.A.;Arcus,V.L.ACSChemicalBiology2013,8,2388. (24) Pudney,C.R.;Guerriero,A.;Baxter,N.J.;Johannissen,L.O.;Waltho,J.P.;Hay,S.;Scrutton,N.S.JournaloftheAmericanChemicalSociety2013,135,2512. (25) Pudney,C.R.;Hay,S.;Scrutton,N.S.FEBSJournal2009,276,4780. (26) Khan,H.;Harris,R.J.;Barna,T.;Craig,D.H.;Bruce,N.C.;Munro,A.W.;Moody,P.C.E.;Scrutton,N.S.JournalofBiologicalChemistry2002,27721906. (27) Daniel,R.M.;Danson,M.J.TrendsinBiochemicalSciences2010,35,584. (28) Seewald,M.J.;Pichumani,K.;Stowell,C.;Tibbals,B.V.;Regan,L.;Stone,M.J.ProteinScience:APublicationoftheProteinSociety2000,9,1177. (29) Buchanan,C.L.;Connaris,H.;Danson,M.J.;Reeve,C.D.;Hough,D.W.BiochemicalJournal1999,343,563. (30) Arcus,V.L.;Prentice,E.J.;Hobbs,J.K.;Mulholland,A.J.;VanderKamp,M.W.;Pudney,C.R.;Parker,E.J.;Schipper,L.A.Biochemistry2016,55,1681. (31) D,B.Structure2000,8,77. (32) Villà,J.;Štrajbl,M.;Glennon,T.M.;Sham,Y.Y.;Chu,Z.T.;Warshel,A.ProceedingsoftheNationalAcademyofSciences2000,97,11899. (33) Kuroki,R.;Nitta,K.;Yutani,K.JournalofBiologicalChemistry1992,267,24297. (34) Davidson,J.P.;Lubman,O.;Rose,T.;Waksman,G.;Martin,S.F.JournaloftheAmericanChemicalSociety2002,124,205.
217
(35) Krueger,S.;Gregurick,S.;Shi,Y.;Wang,S.;Wladkowski,B.D.;Schwarz,F.P.Biochemistry2003,42,1958. (36) Sharp,K.ProteinScience:APublicationoftheProteinSociety2001,10,661. (37) Williams,R.E.;Bruce,N.C.Microbiology2002,148,1607.
218
7.3 References for Chapter 4
(1) Fisher,K.;Mohr,S.;Mansell,D.;Goddard,N.J.;Fielden,P.R.;Scrutton,N.S.CatalysisScience&Technology2013,3,1505. (2) Hollmann,F.;Arends,I.W.C.E.;Buehler,K.Chemcatchem2010,2,762. (3) Taglieber,A.;Schulz,F.;Hollmann,F.;Rusek,M.;Reetz,M.T.Chembiochem:aEuropeanjournalofchemicalbiology2008,9,565. (4) Toogood,H.S.;Knaus,T.;Scrutton,N.S.Chemcatchem2014,6,951. (5) Grau,M.M.;vanderToorn,J.C.;Otten,L.G.;Macheroux,P.;Taglieber,A.;Zilly,F.E.;Arends,I.W.C.E.;Hollmann,F.AdvSynthCatal2009,351,3279. (6) Peers,M.K.;Toogood,H.S.;Heyes,D.J.;Mansell,D.;Coe,B.J.;Scrutton,N.S.CatalSciTechnol2016,6,169. (7) Knaus,T.;Mutti,F.G.;Humphreys,L.D.;Turner,N.J.;Scrutton,N.S.OrgBiomolChem2015,13,223. (8) Mutti,F.G.;Knaus,T.;Scrutton,N.S.;Breuer,M.;Turner,N.J.Science2015,349,1525. (9) Schrittwieser,J.H.;Sattler,J.;Resch,V.;Mutti,F.G.;Kroutil,W.CurrOpinChemBiol2011,15,249. (10) Sattler,J.H.;Fuchs,M.;Tauber,K.;Mutti,F.G.;Faber,K.;Pfeffer,J.;Haas,T.;Kroutil,W.AngewChemIntEdit2012,51,9156. (11) Gargiulo,S.;Opperman,D.J.;Hanefeld,U.;Arends,I.W.C.E.;Hollmann,F.ChemCommun2012,48,6630. (12) Paul,C.E.;Gargiulo,S.;Opperman,D.J.;Lavandera,I.;Gotor-Fernandez,V.;Gotor,V.;Taglieber,A.;Arends,I.W.C.E.;Hollmann,F.OrgLett2013,15,180. (13) Paul,C.E.;Arends,I.W.C.E.;Hollmann,F.AcsCatal2014,4,788. (14) Knaus,T.;Paul,C.E.;Levy,C.W.;deVries,S.;Mutti,F.G.;Hollmann,F.;Scrutton,N.S.JournaloftheAmericanChemicalSociety2016,138,1033. (15) Toogood,H.S.;Gardiner,J.M.;Scrutton,N.S.Chemcatchem2010,2,892. (16) Paul,C.E.;Tischler,D.;Riedel,A.;Heine,T.;Itoh,N.;Hollmann,F.AcsCatal2015,5,2961. (17) Ryan,J.D.;Fish,R.H.;Clark,D.S.Chembiochem:aEuropeanjournalofchemicalbiology2008,9,2579. (18) Paul,C.E.;Churakova,E.;Maurits,E.;Girhard,M.;Urlacher,V.B.;Hollmann,F.BioorganMedChem2014,22,5692. (19) Lutz,J.;Hollmann,F.;Ho,T.V.;Schnyder,A.;Fish,R.H.;Schmid,A.JOrganometChem2004,689,4783. (20) Pudney,C.R.;Guerriero,A.;Baxter,N.J.;Johannissen,L.O.;Waltho,J.P.;Hay,S.;Scrutton,N.S.JournaloftheAmericanChemicalSociety2013,135,2512. (21) Pudney,C.R.;Johannissen,L.O.;Sutcliffe,M.J.;Hay,S.;Scrutton,N.S.JournaloftheAmericanChemicalSociety2010,132,11329. (22) Barna,T.M.;Khan,H.;Bruce,N.C.;Barsukov,I.;Scrutton,N.S.;Moody,P.C.Journalofmolecularbiology2001,310,433. (23) Khan,H.;Harris,R.J.;Barna,T.;Craig,D.H.;Bruce,N.C.;Munro,A.W.;Moody,P.C.E.;Scrutton,N.S.JournalofBiologicalChemistry2002,27721906. (24) Adalbjornsson,B.V.;Toogood,H.S.;Fryszkowska,A.;Pudney,C.R.;Jowitt,T.A.;Leys,D.;Scrutton,N.S.Chembiochem:aEuropeanjournalofchemicalbiology2010,11,197. (25) Kitzing,K.;Fitzpatrick,T.B.;Wilken,C.;Sawa,J.;Bourenkov,G.P.;Macheroux,P.;Clausen,T.TheJournalofbiologicalchemistry2005,280,27904. (26) Griese,J.J.;R,P.J.;Schwarzinger,S.;Dobbek,H.Journalofmolecularbiology2006,361,140. (27) Hay,S.;Pudney,C.R.;Scrutton,N.S.TheFEBSjournal2009,276,3930. (28) Pudney,C.R.;Hay,S.;Levy,C.;Pang,J.;Sutcliffe,M.J.;Leys,D.;Scrutton,N.S.JournaloftheAmericanChemicalSociety2009,131,17072. (29) Nagel,Z.D.;Klinman,J.P.Naturechemicalbiology2009,5,543. (30) Klinman,J.P.;Kohen,A.Annualreviewofbiochemistry2013,82,471. (31) Knapp,M.J.;Klinman,J.P.FEBS2002,269,3113. (32) Hay,S.;Scrutton,N.S.Naturechemistry2012,4,161.
219
(33) Hay,S.;Scrutton,N.S.Biochemistry2008,47,9880. (34) Johannissen,L.O.;Hay,S.;Scrutton,N.S.Physicalchemistrychemicalphysics:PCCP2015,17,30775. (35) Pudney,C.R.;Hay,S.;Pang,J.;Costello,C.;Leys,D.;Sutcliffe,M.J.;Scrutton,N.S.JournaloftheAmericanChemicalSociety2007,129,13949. (36) Pudney,C.R.;Hay,S.;Sutcliffe,M.J.;Scrutton,N.S.JournaloftheAmericanChemicalSociety2006,128,14053. (37) Gladstone,S.;Laidler,K.J.;Eyring,H.McGraw-Hill;NewYork1941. (38) Bell,R.JournalofMolecularStructure1980,74,356. (39) Zhang,L.;Yuan,J.;Xu,Y.;Zhang,Y.H.P.;Qian,X.ChemicalCommunications2016,52,6471. (40) Zhu,X.-Q.;Deng,F.-H.;Yang,J.-D.;Li,X.-T.;Chen,Q.;Lei,N.-P.;Meng,F.-K.;Zhao,X.-P.;Han,S.-H.;Hao,E.-J.;Mu,Y.-Y.Organic&BiomolecularChemistry2013,11,6071. (41) Hothi,P.;Hay,S.;Roujeinikova,A.;Sutcliffe,M.J.;Lee,M.;Leys,D.;Cullis,P.M.;Scrutton,N.S.Chembiochem:aEuropeanjournalofchemicalbiology2008,9,2839. (42) Pudney,C.R.;Hay,S.;Scrutton,N.S.TheFEBSjournal2009,276,4780. (43) Basran,J.;Sutcliffe,M.J.;Scrutton,N.S.TheJournalofbiologicalchemistry2001,276,24581. (44) Knapp,M.J.;Rickert,K.;Klinman,J.P.JournaloftheAmericanChemicalSociety2002,124,3865. (45) French,C.E.;Nicklin,S.;Bruce,N.C.JournalofBacteriology1996,178,6623. (46) Knaus,T.;Paul,C.E.;Levy,C.W.;deVries,S.;Mutti,F.G.;Hollmann,F.;Scrutton,N.S.JournaloftheAmericanChemicalSociety2016,138,1033. (47) Opperman,D.J.;Sewell,B.T.;Litthauer,D.;Isupov,M.N.;Littlechild,J.A.;vanHeerden,E.BiochemicalandBiophysicalResearchCommunications2010,393,426. (48) Knaus,T.;Mutti,F.G.;Humphreys,L.D.;Turner,N.J.;Scrutton,N.S.Organic&BiomolecularChemistry2015,13,223. (49) Paul,C.E.;Gargiulo,S.;Opperman,D.J.;Lavandera,I.;Gotor-Fernández,V.;Gotor,V.;Taglieber,A.;Arends,I.W.C.E.;Hollmann,F.Org.Lett.2013,15,180. (50) Caughey,W.S.;Schellenberg,K.A.J.Org.Chem.1966,31,1978. (51) Taylor,K.E.;Jones,J.B.J.Am.Chem.Soc.1976,98,5689. (52) Frisch,X.M.J.etal.Gaussian09(Gaussian,Wallingford,Connecticut,revisionB.01,2010).
220
7.4 References for Chapter 5
(1) Hay,S.;Scrutton,N.S.NatChem2012,4,161. (2) Carr,C.A.M.;Klinman,J.P.Biochemistry2014,53,2212. (3) Hammes-Schiffer,S.AccountsChem.Res.2006,39,93. (4) Pudney,C.R.;Hay,S.;Sutcliffe,M.J.;Scrutton,N.S.JournaloftheAmericanChemicalSociety2006,128,14053. (5) Hay,S.;Pudney,C.;Hothi,P.;Johannissen,LinusO.;Masgrau,L.;Pang,J.;Leys,D.;Sutcliffe,MichaelJ.;Scrutton,NigelS.BiochemicalSocietyTransactions2008,36,16. (6) Fleming,G.R.;Scholes,G.D.;Wit,A.D.;Hay,S.;Scrutton,N.S.ProcediaChemistry2011,3,306. (7) Isaacs,N.S.;Javaid,K.;Rannala,E.Nature1977,268,372. (8) Northrop,D.B.JournaloftheAmericanChemicalSociety1999,121,3521. (9) Pudney,C.R.;Hay,S.;Levy,C.;Pang,J.;Sutcliffe,M.J.;Leys,D.;Scrutton,N.S.JournaloftheAmericanChemicalSociety2009,131,17072. (10) Kornblatt,J.A.;Kornblatt,M.J.BiochimicaetBiophysicaActa(BBA)/ProteinStructureandMolecularEnzymology2002,1595,30. (11) Hoeven,R.;Heyes,D.J.;Hay,S.;Scrutton,N.S.FEBSJournal2015,282,3243. (12) Hay,S.;Pudney,C.R.;McGrory,T.A.;Pang,J.;Sutcliffe,M.J.;Scrutton,N.S.AngewandteChemieInternationalEdition2009,48,1452. (13) Christopher,R.P.;Sam,H.;Colin,L.;Jiayun,P.;Michael,J.S.;David,L.;Nigel,S.S.JournaloftheAmericanChemicalSociety2009,131,17072. (14) Hay,S.;Sutcliffe,M.J.;Scrutton,N.S.ProceedingsoftheNationalAcademyofSciences2007,104,507. (15) Hoeven,R.;Heyes,D.J.;Hay,S.;Scrutton,N.S.TheFebsJournal2015,282,3243. (16) Sam,H.;Linus,O.J.;Parvinder,H.;Michael,J.S.;Nigel,S.S.JournaloftheAmericanChemicalSociety2012,134,9749. (17) Henzler-Wildman,K.;Kern,D.Nature2007,450,964. (18) ArthurG.Palmer,IIIAccountsChem.Res.2015,48,457. (19) LeMaster,D.M.JournaloftheAmericanChemicalSociety1999,121,1726. (20) Jonas,J.;Ballard,L.;Nash,D.BiophysicalJournal1998,75,445. (21) Williamson,M.P.ProgressinNuclearMagneticResonanceSpectroscopy2013,73,1. (22) Williamson,M.P.InModernMagneticResonance;Webb,G.A.,Ed.;SpringerNetherlands:Dordrecht,2006,p1357. (23) Viegas,A.;Manso,J.;Nobrega,F.L.;Cabrita,E.J.JournalofChemicalEducation2011,88,990. (24) Olivier,C.;Isabelle,K.JournalofMedicinalChemistry2015,58,8739. (25) Megy,S.;Bertho,G.;Gharbi-Benarous,J.;Evrard-Todeschi,N.;Coadou,G.;Ségéral,E.;Iehle,C.;Quéméneur,E.;Benarous,R.;Girault,J.-P.JournalofBiologicalChemistry2005,280,29107. (26) Angulo,J.;Enríquez-Navas,P.M.;Nieto,P.M.Chemistry–AEuropeanJournal2010,16,7803. (27) Mayer,M.;Meyer,B.JournaloftheAmericanChemicalSociety2001,123,6108. (28) Pudney,C.R.;Hay,S.;Scrutton,N.S.FEBSJournal2009,276,4780. (29) Guerriero,A.,TheUniversityofManchester,2011. (30) Ulrich,E.L.;Akutsu,H.;Doreleijers,J.F.;Harano,Y.;Ioannidis,Y.E.;Lin,J.;Livny,M.;Mading,S.;Maziuk,D.;Miller,Z.;Nakatani,E.;Schulte,C.F.;Tolmie,D.E.;KentWenger,R.;Yao,H.;Markley,J.L.NucleicAcidsResearch2008,36,D402. (31) Grzesiek,S.;Bax,A.JournalofBiomolecularNMR1993,3,185. (32) Hamuro,Y.;Coales,S.J.;Southern,M.R.;Nemeth-Cawley,J.F.;Stranz,D.D.;Griffin,P.R.JournalofBiomolecularTechniques:JBT2003,14,171. (33) VincentJ.Hilser;ErnestoFreireJournalofMolecularBiology1996,262,756. (34) Resing,K.A.;Hoofnagle,A.N.;Ahn,N.G.JournaloftheAmericanSocietyforMassSpectrometry1999,10,685. (35) Woodward,C.;Li,R.TrendsinBiochemicalSciences,23,379. (36) Khan,H.;Harris,R.J.;Barna,T.;Craig,D.H.;Bruce,N.C.;Munro,A.W.;Moody,P.C.E.;Scrutton,N.S.JournalofBiologicalChemistry2002,27721906. (37) Bain,A.D.ProgressinNuclearMagneticResonanceSpectroscopy2003,43,63.
221
(38) Barna,T.M.;Khan,H.;Bruce,N.C.;Barsukov,I.;Scrutton,N.S.;Moody,P.C.E.JournalofMolecularBiology2001,310,433. (39) Khan,H.;Harris,R.J.;Barna,T.;Craig,D.H.;Bruce,N.C.;Munro,A.W.;Moody,P.C.E.;Scrutton,N.S.JournalofBiologicalChemistry2002,277,21906. (40) Baxter,N.J.;UniversityofSheffield:2010. (41) Scherf,T.;Anglister,J.BiophysicalJournal1993,64,754. (42) Mayer,M.;James,T.L.JournaloftheAmericanChemicalSociety2004,126,4453. (43) Krishnan,V.V.;Murali,N.;Kumar,A.JournalofMagneticResonance1989,84,255. (44) Collins,M.D.;Hummer,G.;Quillin,M.L.;Matthews,B.W.;Gruner,S.M.ProceedingsoftheNationalAcademyofSciencesoftheUnitedStatesofAmerica2005,102,16668. (45) Ponstingl,H.;Otting,G.EuropeanJournalofBiochemistry1997,244,384. (46) MichaeleenDoucleff;MaryHatcher-Skeers;Crane,N.J.PocketGuidetoBiomolecularNMRSpringer:BerlinHeidelberg,2011. (47) Hitchens,T.K.;Bryant,R.G.Biochemistry1998,37,5878. (48) Akasaka,K.InEncyclopediaofBiophysics;Roberts,G.C.K.,Ed.;SpringerBerlinHeidelberg:Berlin,Heidelberg,2013,p983. (49) Collins,M.D.;Kim,C.U.;Gruner,S.M.AnnualReviewofBiophysics2011,40,81. (50) Venkitakrishnan,R.P.;Benard,O.;Max,M.;Markley,J.L.Methodsinmolecularbiology(Clifton,N.J.)2012,914,47. (51) Otting,G.CurrentOpinioninStructuralBiology1993,3,760. (52) Benesi,A.J.APrimerofNMRTheorywithCalculationsinMathematica;8ed.;JohnWiley&SonsInc.:Hoboken,NewJersey,2015. (53) Orts,J.;Wälti,M.A.;Marsh,M.;Vera,L.;Gossert,A.D.;Güntert,P.;Riek,R.JournaloftheAmericanChemicalSociety2016,138,4393. (54) Horst,R.;Wider,G.;Fiaux,J.;Bertelsen,E.B.;Horwich,A.L.;Wüthrich,K.ProceedingsoftheNationalAcademyofSciences2006,103,15445. (55) M.IqbalChoudhary;Rahman,A.-u.-.Structure-activityRelationshipStudiesinDrugDevelopmentbyNMRSpectroscopy;BenthamSciencePublishers,2011;Vol.1. (56) HuaLia;KazuyukiAkasakaBiochimicaetBiophysicaActa2006,1764,331. (57) Merrin,J.;Kumar,P.;Libchaber,A.ProceedingsoftheNationalAcademyofSciences2011,108,19913. (58) Wilton,D.J.;Kitahara,R.;Akasaka,K.;Pandya,M.J.;Williamson,M.P.BiophysicalJournal2009,97,1482.
222
7.5 References for Chapter 6
(1) Toogood,H.S.;Gardiner,J.M.;Scrutton,N.S.ChemCatChem2010,2,892. (2) Williams,R.E.;Rathbone,D.A.;Scrutton,N.S.;Bruce,N.C.AppliedandEnvironmentalMicrobiology2004,70,3566. (3) Kandathil,S.M.;Driscoll,M.D.;Dunn,R.V.;Scrutton,N.S.;Hay,S.PhysicalChemistryChemicalPhysics2014,16,2256. (4) Hoeven,R.;Heyes,D.J.;Hay,S.;Scrutton,N.S.TheFebsJournal2015,282,3243. (5) Keedy,D.A.;Kenner,L.R.;Warkentin,M.;Woldeyes,R.A.;Hopkins,J.B.;Thompson,M.C.;Brewster,A.S.;VanBenschoten,A.H.;Baxter,E.L.;Uervirojnangkoorn,M.;McPhillips,S.E.;Song,J.;Alonso-Mori,R.;Holton,J.M.;Weis,W.I.;Brunger,A.T.;Soltis,S.M.;Lemke,H.;Gonzalez,A.;Sauter,N.K.;Cohen,A.E.;vandenBedem,H.;Thorne,R.E.;Fraser,J.S.eLife2015,4,e07574. (6) Levantino,M.;Yorke,B.A.;Monteiro,D.C.F.;Cammarata,M.;Pearson,A.R.CurrentOpinioninStructuralBiology2015,35,41. (7) Fryszkowska,A.;Toogood,H.;Sakuma,M.;Gardiner,J.M.;Stephens,G.M.;Scrutton,N.S.Advancedsynthesis&catalysis2009,351,2976. (8) Hardman,SamanthaJ.;Pudney,ChristopherR.;Hay,S.;Scrutton,NigelS.BiophysicalJournal2013,105,2549. (9) Falconer,R.J.;Markelz,A.G.JournalofInfrared,Millimeter,andTerahertzWaves2012,33,973. (10) Kleckner,I.R.;Foster,M.P.Biochimicaetbiophysicaacta2011,1814,942. (11) Hobbs,J.K.;Jiao,W.;Easter,A.D.;Parker,E.J.;Schipper,L.A.;Arcus,V.L.ACSChemicalBiology2013,8,2388. (12) Geddes,A.;Paul,C.E.;Hay,S.;Hollmann,F.;Scrutton,N.S.JournaloftheAmericanChemicalSociety2016,138,11089. (13) Knaus,T.;Paul,C.E.;Levy,C.W.;deVries,S.;Mutti,F.G.;Hollmann,F.;Scrutton,N.S.JournaloftheAmericanChemicalSociety2016,138,1033. (14) Okamoto,Y.;Köhler,V.;Paul,C.E.;Hollmann,F.;Ward,T.R.ACSCatalysis2016,6,3553. (15) Abramovitch,R.A.TheChemistryofHeterocyclicCompounds,PyridineandItsDerivatives:Supplement;Wiley,2009. (16) Vandamme,E.J.JChemTechnolBiotechnol1992,53,313. (17) Wüthrich,K.;Wider,G.;Wagner,G.;Braun,W.JMolBiol1982,155,311. (18) Butts,C.P.;Jones,C.R.;Towers,E.C.;Flynn,J.L.;Appleby,L.;Barron,N.J.Organic&BiomolecularChemistry2011,9,177.

223
Acknowledgements
I would firstly like to thank Nigel Scrutton, Jon Waltho & Sam Hay for offering me this opportunity
and Bruker/BBSRC for generous funding of this PhD project. The continued support,
encouragement and guidance offered by my supervisors throughout has been indispensable. I
have great admiration for your dedication to scientific research and feel privileged to have worked
as part of this team.
I must extend my acknowledgements to the members of the Scrutton lab, including all post-docs
and PhD students past and present. Personal thanks go to Marina, Michiyo, Shirley and Derren
for their support regarding all facets of lab work. Their patience and assistance was vital for
helping me to progress. In addition, I would like to thank Hanan, Linus, Samantha and Karl for
insightful discussions, as well as cake and crosswords. Lastly, I would also like to express my
gratitude towards Matt Cliff and Colin Levy for their advice and instruction concerning NMR
spectroscopy and X-ray Crystallography, respectively. I am hugely grateful for the time and tuition
willingly offered by all those I have mentioned.
My family has been hugely supportive throughout my whole life, up to and including the last four
years. They are responsible for inspiring my interest in science and encouraging me to pursue my
ambitions. Without Sue, Neil and Harry there is no doubt that I wouldn’t have been able to
achieve and experience what I have over the past 27 years, and for this I am eternally indebted. I
am also truly grateful to all members of my extended family, Geddes and Symonds, for their
unwavering encouragement throughout this time. Last but not least I would like to thank Zara
Kerwood, my closest companion and greatest supporter, for enduring all the stresses and
successes experienced during this project along with me.
Finally, I reserve a special mention for Joe Micheal Bott, whose friendship I valued immensely
and will never forget.

224
Chapter 9
Published Manuscripts
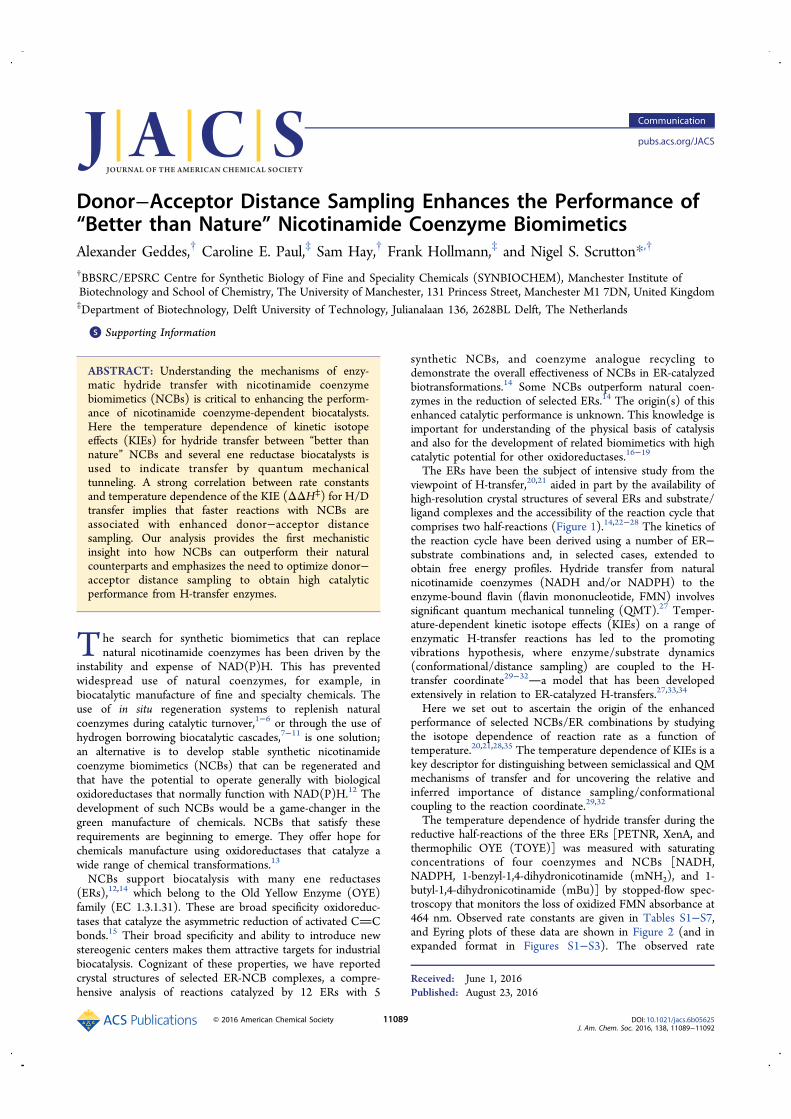
Donor−Acceptor Distance Sampling Enhances the Performance of“Better than Nature” Nicotinamide Coenzyme BiomimeticsAlexander Geddes,† Caroline E. Paul,‡ Sam Hay,† Frank Hollmann,‡ and Nigel S. Scrutton*,†
†BBSRC/EPSRC Centre for Synthetic Biology of Fine and Speciality Chemicals (SYNBIOCHEM), Manchester Institute ofBiotechnology and School of Chemistry, The University of Manchester, 131 Princess Street, Manchester M1 7DN, United Kingdom‡Department of Biotechnology, Delft University of Technology, Julianalaan 136, 2628BL Delft, The Netherlands
*S Supporting Information
ABSTRACT: Understanding the mechanisms of enzy-matic hydride transfer with nicotinamide coenzymebiomimetics (NCBs) is critical to enhancing the perform-ance of nicotinamide coenzyme-dependent biocatalysts.Here the temperature dependence of kinetic isotopeeffects (KIEs) for hydride transfer between “better thannature” NCBs and several ene reductase biocatalysts isused to indicate transfer by quantum mechanicaltunneling. A strong correlation between rate constantsand temperature dependence of the KIE (ΔΔH⧧) for H/Dtransfer implies that faster reactions with NCBs areassociated with enhanced donor−acceptor distancesampling. Our analysis provides the first mechanisticinsight into how NCBs can outperform their naturalcounterparts and emphasizes the need to optimize donor−acceptor distance sampling to obtain high catalyticperformance from H-transfer enzymes.
The search for synthetic biomimetics that can replacenatural nicotinamide coenzymes has been driven by the
instability and expense of NAD(P)H. This has preventedwidespread use of natural coenzymes, for example, inbiocatalytic manufacture of fine and specialty chemicals. Theuse of in situ regeneration systems to replenish naturalcoenzymes during catalytic turnover,1−6 or through the use ofhydrogen borrowing biocatalytic cascades,7−11 is one solution;an alternative is to develop stable synthetic nicotinamidecoenzyme biomimetics (NCBs) that can be regenerated andthat have the potential to operate generally with biologicaloxidoreductases that normally function with NAD(P)H.12 Thedevelopment of such NCBs would be a game-changer in thegreen manufacture of chemicals. NCBs that satisfy theserequirements are beginning to emerge. They offer hope forchemicals manufacture using oxidoreductases that catalyze awide range of chemical transformations.13
NCBs support biocatalysis with many ene reductases(ERs),12,14 which belong to the Old Yellow Enzyme (OYE)family (EC 1.3.1.31). These are broad specificity oxidoreduc-tases that catalyze the asymmetric reduction of activated CCbonds.15 Their broad specificity and ability to introduce newstereogenic centers makes them attractive targets for industrialbiocatalysis. Cognizant of these properties, we have reportedcrystal structures of selected ER-NCB complexes, a compre-hensive analysis of reactions catalyzed by 12 ERs with 5
synthetic NCBs, and coenzyme analogue recycling todemonstrate the overall effectiveness of NCBs in ER-catalyzedbiotransformations.14 Some NCBs outperform natural coen-zymes in the reduction of selected ERs.14 The origin(s) of thisenhanced catalytic performance is unknown. This knowledge isimportant for understanding of the physical basis of catalysisand also for the development of related biomimetics with highcatalytic potential for other oxidoreductases.16−19
The ERs have been the subject of intensive study from theviewpoint of H-transfer,20,21 aided in part by the availability ofhigh-resolution crystal structures of several ERs and substrate/ligand complexes and the accessibility of the reaction cycle thatcomprises two half-reactions (Figure 1).14,22−28 The kinetics ofthe reaction cycle have been derived using a number of ER−substrate combinations and, in selected cases, extended toobtain free energy profiles. Hydride transfer from naturalnicotinamide coenzymes (NADH and/or NADPH) to theenzyme-bound flavin (flavin mononucleotide, FMN) involvessignificant quantum mechanical tunneling (QMT).27 Temper-ature-dependent kinetic isotope effects (KIEs) on a range ofenzymatic H-transfer reactions has led to the promotingvibrations hypothesis, where enzyme/substrate dynamics(conformational/distance sampling) are coupled to the H-transfer coordinate29−32a model that has been developedextensively in relation to ER-catalyzed H-transfers.27,33,34
Here we set out to ascertain the origin of the enhancedperformance of selected NCBs/ER combinations by studyingthe isotope dependence of reaction rate as a function oftemperature.20,21,28,35 The temperature dependence of KIEs is akey descriptor for distinguishing between semiclassical and QMmechanisms of transfer and for uncovering the relative andinferred importance of distance sampling/conformationalcoupling to the reaction coordinate.29,32
The temperature dependence of hydride transfer during thereductive half-reactions of the three ERs [PETNR, XenA, andthermophilic OYE (TOYE)] was measured with saturatingconcentrations of four coenzymes and NCBs [NADH,NADPH, 1-benzyl-1,4-dihydronicotinamide (mNH2), and 1-butyl-1,4-dihydronicotinamide (mBu)] by stopped-flow spec-troscopy that monitors the loss of oxidized FMN absorbance at464 nm. Observed rate constants are given in Tables S1−S7,and Eyring plots of these data are shown in Figure 2 (and inexpanded format in Figures S1−S3). The observed rate
Received: June 1, 2016Published: August 23, 2016
Communication
pubs.acs.org/JACS
© 2016 American Chemical Society 11089 DOI: 10.1021/jacs.6b05625J. Am. Chem. Soc. 2016, 138, 11089−11092
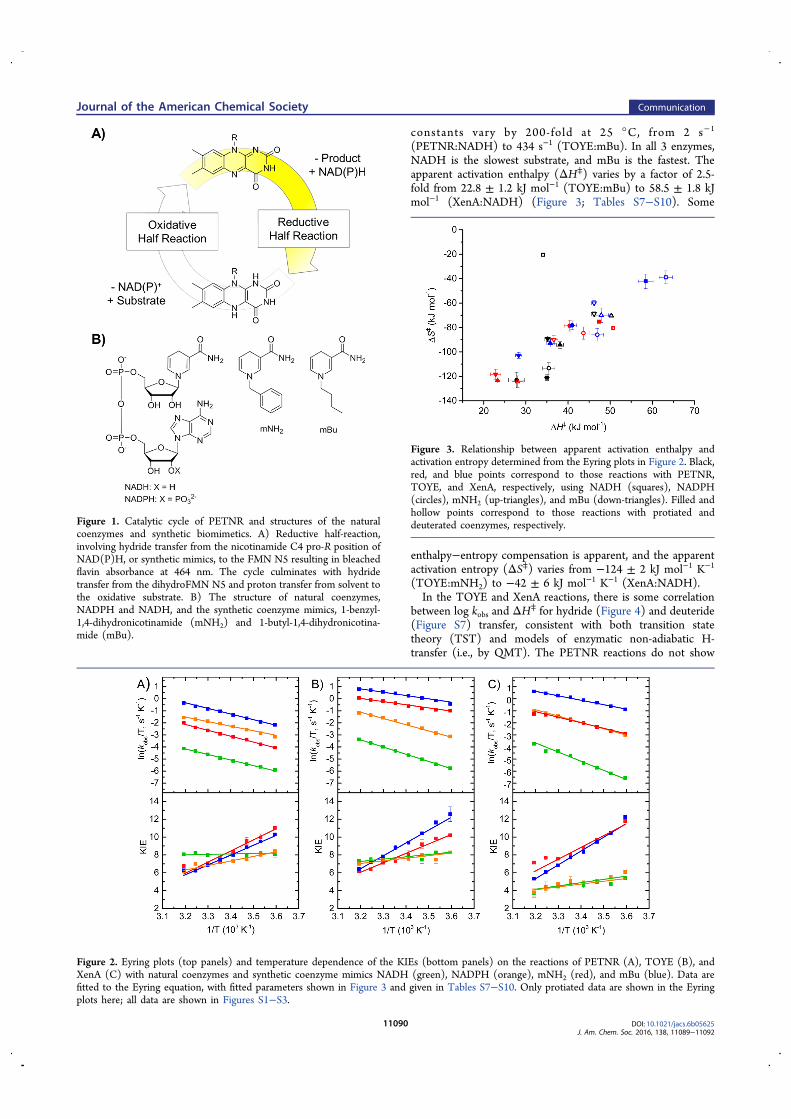
constants vary by 200-fold at 25 °C, from 2 s−1
(PETNR:NADH) to 434 s−1 (TOYE:mBu). In all 3 enzymes,NADH is the slowest substrate, and mBu is the fastest. Theapparent activation enthalpy (ΔH⧧) varies by a factor of 2.5-fold from 22.8 ± 1.2 kJ mol−1 (TOYE:mBu) to 58.5 ± 1.8 kJmol−1 (XenA:NADH) (Figure 3; Tables S7−S10). Some
enthalpy−entropy compensation is apparent, and the apparentactivation entropy (ΔS⧧) varies from −124 ± 2 kJ mol−1 K−1
(TOYE:mNH2) to −42 ± 6 kJ mol−1 K−1 (XenA:NADH).In the TOYE and XenA reactions, there is some correlation
between log kobs and ΔH⧧ for hydride (Figure 4) and deuteride(Figure S7) transfer, consistent with both transition statetheory (TST) and models of enzymatic non-adiabatic H-transfer (i.e., by QMT). The PETNR reactions do not show
Figure 1. Catalytic cycle of PETNR and structures of the naturalcoenzymes and synthetic biomimetics. A) Reductive half-reaction,involving hydride transfer from the nicotinamide C4 pro-R position ofNAD(P)H, or synthetic mimics, to the FMN N5 resulting in bleachedflavin absorbance at 464 nm. The cycle culminates with hydridetransfer from the dihydroFMN N5 and proton transfer from solvent tothe oxidative substrate. B) The structure of natural coenzymes,NADPH and NADH, and the synthetic coenzyme mimics, 1-benzyl-1,4-dihydronicotinamide (mNH2) and 1-butyl-1,4-dihydronicotina-mide (mBu).
Figure 2. Eyring plots (top panels) and temperature dependence of the KIEs (bottom panels) on the reactions of PETNR (A), TOYE (B), andXenA (C) with natural coenzymes and synthetic coenzyme mimics NADH (green), NADPH (orange), mNH2 (red), and mBu (blue). Data arefitted to the Eyring equation, with fitted parameters shown in Figure 3 and given in Tables S7−S10. Only protiated data are shown in the Eyringplots here; all data are shown in Figures S1−S3.
Figure 3. Relationship between apparent activation enthalpy andactivation entropy determined from the Eyring plots in Figure 2. Black,red, and blue points correspond to those reactions with PETNR,TOYE, and XenA, respectively, using NADH (squares), NADPH(circles), mNH2 (up-triangles), and mBu (down-triangles). Filled andhollow points correspond to those reactions with protiated anddeuterated coenzymes, respectively.
Journal of the American Chemical Society Communication
DOI: 10.1021/jacs.6b05625J. Am. Chem. Soc. 2016, 138, 11089−11092
11090
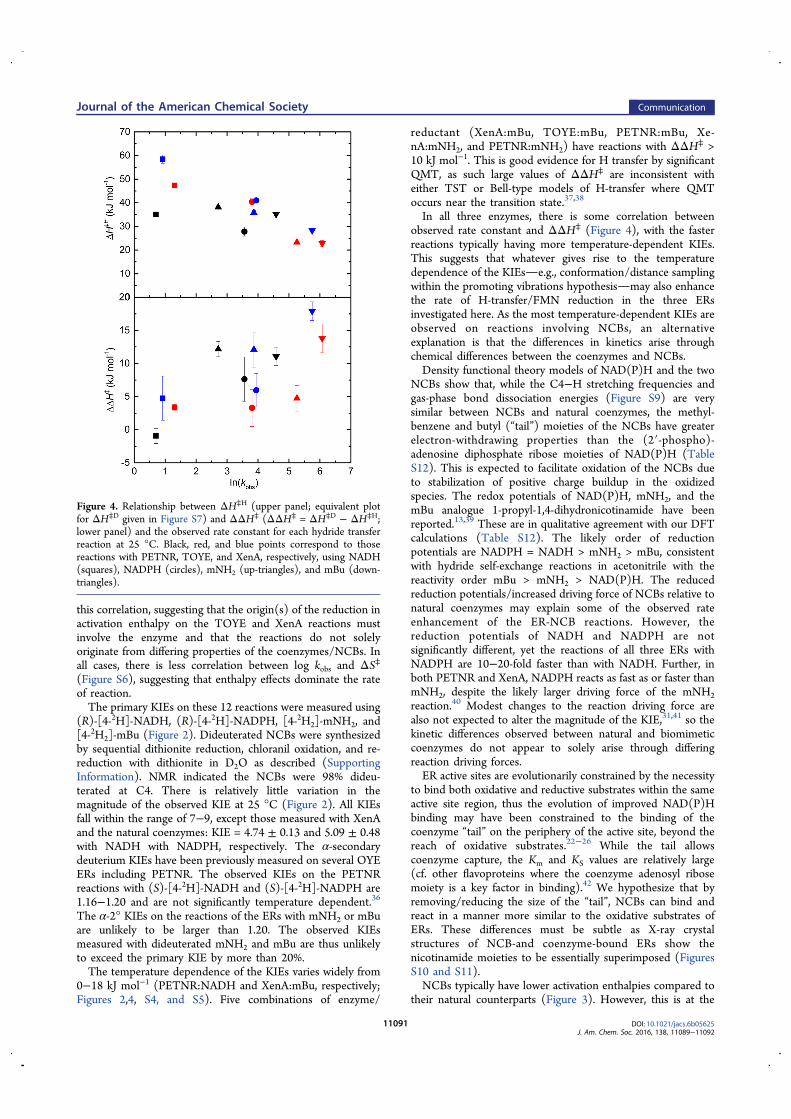
this correlation, suggesting that the origin(s) of the reduction inactivation enthalpy on the TOYE and XenA reactions mustinvolve the enzyme and that the reactions do not solelyoriginate from differing properties of the coenzymes/NCBs. Inall cases, there is less correlation between log kobs and ΔS⧧(Figure S6), suggesting that enthalpy effects dominate the rateof reaction.The primary KIEs on these 12 reactions were measured using
(R)-[4-2H]-NADH, (R)-[4-2H]-NADPH, [4-2H2]-mNH2, and[4-2H2]-mBu (Figure 2). Dideuterated NCBs were synthesizedby sequential dithionite reduction, chloranil oxidation, and re-reduction with dithionite in D2O as described (SupportingInformation). NMR indicated the NCBs were 98% dideu-terated at C4. There is relatively little variation in themagnitude of the observed KIE at 25 °C (Figure 2). All KIEsfall within the range of 7−9, except those measured with XenAand the natural coenzymes: KIE = 4.74 ± 0.13 and 5.09 ± 0.48with NADH with NADPH, respectively. The α-secondarydeuterium KIEs have been previously measured on several OYEERs including PETNR. The observed KIEs on the PETNRreactions with (S)-[4-2H]-NADH and (S)-[4-2H]-NADPH are1.16−1.20 and are not significantly temperature dependent.36
The α-2° KIEs on the reactions of the ERs with mNH2 or mBuare unlikely to be larger than 1.20. The observed KIEsmeasured with dideuterated mNH2 and mBu are thus unlikelyto exceed the primary KIE by more than 20%.The temperature dependence of the KIEs varies widely from
0−18 kJ mol−1 (PETNR:NADH and XenA:mBu, respectively;Figures 2,4, S4, and S5). Five combinations of enzyme/
reductant (XenA:mBu, TOYE:mBu, PETNR:mBu, Xe-nA:mNH2, and PETNR:mNH2) have reactions with ΔΔH⧧ >10 kJ mol−1. This is good evidence for H transfer by significantQMT, as such large values of ΔΔH⧧ are inconsistent witheither TST or Bell-type models of H-transfer where QMToccurs near the transition state.37,38
In all three enzymes, there is some correlation betweenobserved rate constant and ΔΔH⧧ (Figure 4), with the fasterreactions typically having more temperature-dependent KIEs.This suggests that whatever gives rise to the temperaturedependence of the KIEse.g., conformation/distance samplingwithin the promoting vibrations hypothesismay also enhancethe rate of H-transfer/FMN reduction in the three ERsinvestigated here. As the most temperature-dependent KIEs areobserved on reactions involving NCBs, an alternativeexplanation is that the differences in kinetics arise throughchemical differences between the coenzymes and NCBs.Density functional theory models of NAD(P)H and the two
NCBs show that, while the C4−H stretching frequencies andgas-phase bond dissociation energies (Figure S9) are verysimilar between NCBs and natural coenzymes, the methyl-benzene and butyl (“tail”) moieties of the NCBs have greaterelectron-withdrawing properties than the (2′-phospho)-adenosine diphosphate ribose moieties of NAD(P)H (TableS12). This is expected to facilitate oxidation of the NCBs dueto stabilization of positive charge buildup in the oxidizedspecies. The redox potentials of NAD(P)H, mNH2, and themBu analogue 1-propyl-1,4-dihydronicotinamide have beenreported.13,39 These are in qualitative agreement with our DFTcalculations (Table S12). The likely order of reductionpotentials are NADPH = NADH > mNH2 > mBu, consistentwith hydride self-exchange reactions in acetonitrile with thereactivity order mBu > mNH2 > NAD(P)H. The reducedreduction potentials/increased driving force of NCBs relative tonatural coenzymes may explain some of the observed rateenhancement of the ER-NCB reactions. However, thereduction potentials of NADH and NADPH are notsignificantly different, yet the reactions of all three ERs withNADPH are 10−20-fold faster than with NADH. Further, inboth PETNR and XenA, NADPH reacts as fast as or faster thanmNH2, despite the likely larger driving force of the mNH2reaction.40 Modest changes to the reaction driving force arealso not expected to alter the magnitude of the KIE,31,41 so thekinetic differences observed between natural and biomimeticcoenzymes do not appear to solely arise through differingreaction driving forces.ER active sites are evolutionarily constrained by the necessity
to bind both oxidative and reductive substrates within the sameactive site region, thus the evolution of improved NAD(P)Hbinding may have been constrained to the binding of thecoenzyme “tail” on the periphery of the active site, beyond thereach of oxidative substrates.22−26 While the tail allowscoenzyme capture, the Km and KS values are relatively large(cf. other flavoproteins where the coenzyme adenosyl ribosemoiety is a key factor in binding).42 We hypothesize that byremoving/reducing the size of the “tail”, NCBs can bind andreact in a manner more similar to the oxidative substrates ofERs. These differences must be subtle as X-ray crystalstructures of NCB-and coenzyme-bound ERs show thenicotinamide moieties to be essentially superimposed (FiguresS10 and S11).NCBs typically have lower activation enthalpies compared to
their natural counterparts (Figure 3). However, this is at the
Figure 4. Relationship between ΔH⧧H (upper panel; equivalent plotfor ΔH⧧D given in Figure S7) and ΔΔH⧧ (ΔΔH⧧ = ΔH⧧D − ΔH⧧H;lower panel) and the observed rate constant for each hydride transferreaction at 25 °C. Black, red, and blue points correspond to thosereactions with PETNR, TOYE, and XenA, respectively, using NADH(squares), NADPH (circles), mNH2 (up-triangles), and mBu (down-triangles).
Journal of the American Chemical Society Communication
DOI: 10.1021/jacs.6b05625J. Am. Chem. Soc. 2016, 138, 11089−11092
11091
expense of higher activation entropies, which suggests that theenzyme−NCB complexes are more disordered than thephysiological enzyme−coenzyme complex. The temperaturedependence of the primary KIE is often interpreted in terms ofenvironmental coupling between the protein and reactioncoordinate, e.g., via promoting vibrations.32 Within thisframework, thermally activated distance sampling of thedonor−acceptor coordinate is reflected in the temperaturedependence of the KIE. Others have shown with variantenzymes that the reaction is often slower and has a morestrongly temperature-dependent KIE than with wild-typeenzymes.30,43,44 However, we have shown the oppositebehavior in PETNR,28 and this is now further corroboratedin reactions with NCBs. Distance sampling may therefore playboth compensatory (i.e., in variant enzymes) and promotingroles, and this is likely to be enzyme-specific.In conclusion, we have shown a correlation between the rates
of hydride transfer and the temperature dependence of KIEs,suggesting that donor−acceptor sampling is a factor inenhancing the performance of NCBs. Further efforts tooptimize this performance with ERs and other oxidoreductasesthat take into account the importance of QMT and donor−acceptor sampling are underway.
■ ASSOCIATED CONTENT*S Supporting InformationThe Supporting Information is available free of charge on theACS Publications website at DOI: 10.1021/jacs.6b05625.
Experimental details and characterization data, includingFigures S1−S11 and Tables S1−S12 (PDF)
■ AUTHOR INFORMATIONCorresponding Author*[email protected] authors declare no competing financial interest.
■ ACKNOWLEDGMENTSSupported by the UK Biotechnology and Biological SciencesResearch Council (BBSRC; BB/M017702/1) and Bruker UKLtd. (Ph.D. studentship to A.G.). N.S.S. is an Engineering andPhysical Sciences Research Council (EPSRC) EstablishedCareer Fellow (EP/J020192/1).
■ REFERENCES(1) Fisher, K.; Mohr, S.; Mansell, D.; Goddard, N. J.; Fielden, P. R.;Scrutton, N. S. Catal. Sci. Technol. 2013, 3, 1505.(2) Hollmann, F.; Arends, I. W. C. E.; Buehler, K. ChemCatChem2010, 2, 762.(3) Taglieber, A.; Schulz, F.; Hollmann, F.; Rusek, M.; Reetz, M. T.ChemBioChem 2008, 9, 565.(4) Toogood, H. S.; Knaus, T.; Scrutton, N. S. ChemCatChem 2014,6, 951.(5) Grau, M. M.; van der Toorn, J. C.; Otten, L. G.; Macheroux, P.;Taglieber, A.; Zilly, F. E.; Arends, I. W. C. E.; Hollmann, F. Adv. Synth.Catal. 2009, 351, 3279.(6) Peers, M. K.; Toogood, H. S.; Heyes, D. J.; Mansell, D.; Coe, B.J.; Scrutton, N. S. Catal. Sci. Technol. 2016, 6, 169.(7) Knaus, T.; Mutti, F. G.; Humphreys, L. D.; Turner, N. J.;Scrutton, N. S. Org. Biomol. Chem. 2015, 13, 223.(8) Mutti, F. G.; Knaus, T.; Scrutton, N. S.; Breuer, M.; Turner, N. J.Science 2015, 349, 1525.
(9) Schrittwieser, J. H.; Sattler, J.; Resch, V.; Mutti, F. G.; Kroutil, W.Curr. Opin. Chem. Biol. 2011, 15, 249.(10) Sattler, J. H.; Fuchs, M.; Tauber, K.; Mutti, F. G.; Faber, K.;Pfeffer, J.; Haas, T.; Kroutil, W. Angew. Chem., Int. Ed. 2012, 51, 9156.(11) Gargiulo, S.; Opperman, D. J.; Hanefeld, U.; Arends, I. W. C. E.;Hollmann, F. Chem. Commun. 2012, 48, 6630.(12) Paul, C. E.; Gargiulo, S.; Opperman, D. J.; Lavandera, I.; Gotor-Fernandez, V.; Gotor, V.; Taglieber, A.; Arends, I. W. C. E.; Hollmann,F. Org. Lett. 2013, 15, 180.(13) Paul, C. E.; Arends, I. W. C. E.; Hollmann, F. ACS Catal. 2014,4, 788.(14) Knaus, T.; Paul, C. E.; Levy, C. W.; de Vries, S.; Mutti, F. G.;Hollmann, F.; Scrutton, N. S. J. Am. Chem. Soc. 2016, 138, 1033.(15) Toogood, H. S.; Gardiner, J. M.; Scrutton, N. S. ChemCatChem2010, 2, 892.(16) Paul, C. E.; Tischler, D.; Riedel, A.; Heine, T.; Itoh, N.;Hollmann, F. ACS Catal. 2015, 5, 2961.(17) Ryan, J. D.; Fish, R. H.; Clark, D. S. ChemBioChem 2008, 9,2579.(18) Paul, C. E.; Churakova, E.; Maurits, E.; Girhard, M.; Urlacher, V.B.; Hollmann, F. Bioorg. Med. Chem. 2014, 22, 5692.(19) Lutz, J.; Hollmann, F.; Ho, T. V.; Schnyder, A.; Fish, R. H.;Schmid, A. J. Organomet. Chem. 2004, 689, 4783.(20) Pudney, C. R.; Guerriero, A.; Baxter, N. J.; Johannissen, L. O.;Waltho, J. P.; Hay, S.; Scrutton, N. S. J. Am. Chem. Soc. 2013, 135,2512.(21) Pudney, C. R.; Johannissen, L. O.; Sutcliffe, M. J.; Hay, S.;Scrutton, N. S. J. Am. Chem. Soc. 2010, 132, 11329.(22) Barna, T. M.; Khan, H.; Bruce, N. C.; Barsukov, I.; Scrutton, N.S.; Moody, P. C. J. Mol. Biol. 2001, 310, 433.(23) Barna, T.; Messiha, H. L.; Petosa, C.; Bruce, N. C.; Scrutton, N.S.; Moody, P. C. J. Biol. Chem. 2002, 277, 30976.(24) Adalbjornsson, B. V.; Toogood, H. S.; Fryszkowska, A.; Pudney,C. R.; Jowitt, T. A.; Leys, D.; Scrutton, N. S. ChemBioChem 2010, 11,197.(25) Kitzing, K.; Fitzpatrick, T. B.; Wilken, C.; Sawa, J.; Bourenkov,G. P.; Macheroux, P.; Clausen, T. J. Biol. Chem. 2005, 280, 27904.(26) Griese, J. J.; Roman, P. J.; Schwarzinger, S.; Dobbek, H. J. Mol.Biol. 2006, 361, 140.(27) Hay, S.; Pudney, C. R.; Scrutton, N. S. FEBS J. 2009, 276, 3930.(28) Pudney, C. R.; Hay, S.; Levy, C.; Pang, J.; Sutcliffe, M. J.; Leys,D.; Scrutton, N. S. J. Am. Chem. Soc. 2009, 131, 17072.(29) Nagel, Z. D.; Klinman, J. P. Nat. Chem. Biol. 2009, 5, 543.(30) Klinman, J. P.; Kohen, A. Annu. Rev. Biochem. 2013, 82, 471.(31) Knapp, M. J.; Klinman, J. P. Eur. J. Biochem. 2002, 269, 3113.(32) Hay, S.; Scrutton, N. S. Nat. Chem. 2012, 4, 161.(33) Hay, S.; Scrutton, N. S. Biochemistry 2008, 47, 9880.(34) Johannissen, L. O.; Hay, S.; Scrutton, N. S. Phys. Chem. Chem.Phys. 2015, 17, 30775.(35) Pudney, C. R.; Hay, S.; Pang, J.; Costello, C.; Leys, D.; Sutcliffe,M. J.; Scrutton, N. S. J. Am. Chem. Soc. 2007, 129, 13949.(36) Pudney, C. R.; Hay, S.; Sutcliffe, M. J.; Scrutton, N. S. J. Am.Chem. Soc. 2006, 128, 14053.(37) Gladstone, S.; Laidler, K. J.; Eyring, H. The Theory of RateProcesses; McGraw-Hill: New York, 1941; 611 pp.(38) Bell, R. P. The tunnel effect in chemistry; Chapman and Hall:London, 1980.(39) Zhang, L.; Yuan, J.; Xu, Y.; Zhang, Y. H. P.; Qian, X. Chem.Commun. 2016, 52, 6471.(40) Zhu, X.-Q.; Deng, F.-H.; Yang, J.-D.; Li, X.-T.; Chen, Q.; Lei,N.-P.; Meng, F.-K.; Zhao, X.-P.; Han, S.-H.; Hao, E.-J.; Mu, Y.-Y. Org.Biomol. Chem. 2013, 11, 6071.(41) Hothi, P.; Hay, S.; Roujeinikova, A.; Sutcliffe, M. J.; Lee, M.;Leys, D.; Cullis, P. M.; Scrutton, N. S. ChemBioChem 2008, 9, 2839.(42) Pudney, C. R.; Hay, S.; Scrutton, N. S. FEBS J. 2009, 276, 4780.(43) Basran, J.; Sutcliffe, M. J.; Scrutton, N. S. J. Biol. Chem. 2001,276, 24581.(44) Knapp, M. J.; Rickert, K.; Klinman, J. P. J. Am. Chem. Soc. 2002,124, 3865.
Journal of the American Chemical Society Communication
DOI: 10.1021/jacs.6b05625J. Am. Chem. Soc. 2016, 138, 11089−11092
11092