Effect of heat and mass transfer coefficients on the performance of automotive catalytic converters
39
Effect of Heat and Mass Transfer Coefficients on the Performance of Automotive Catalytic Converters Tariq Shamim Department of Mechanical Engineering The University of Michigan-Dearborn Dearborn, MI 48128-1491, USA Full Length Article Corresponding Author T. Shamim Assistant Professor Department of Mechanical Engineering The University of Michigan-Dearborn Dearborn, MI 48128-1491 Phone: (313) 593-0913 Fax : (313) 593-3851 email: [email protected]
Transcript of Effect of heat and mass transfer coefficients on the performance of automotive catalytic converters

Effect of Heat and Mass Transfer Coefficients on thePerformance of Automotive Catalytic Converters
Tariq ShamimDepartment of Mechanical EngineeringThe University of Michigan-Dearborn
Dearborn, MI 48128-1491, USA
Full Length Article
Corresponding Author
T. ShamimAssistant Professor
Department of Mechanical EngineeringThe University of Michigan-Dearborn
Dearborn, MI 48128-1491
Phone: (313) 593-0913Fax : (313) 593-3851
email: [email protected]

1
Effect of Heat and Mass Transfer Coefficients on the Performance of
Automotive Catalytic Converters
Tariq Shamim
Department of Mechanical Engineering
The University of Michigan-Dearborn
Dearborn, MI 48128-1491, USA
Abstract
This paper numerically investigates the role of heat and mass transfer
coefficients on the performance of automotive catalytic converters, which are
employed to reduce engine exhaust emissions. The pollutant conversion performance
of a converter is influenced by a number of physical and chemical processes that take
place in gaseous and solid phases as the exhaust gases flow through the catalyst. A
quantitative predictive understanding of these complex catalyst processes involving
flow dynamics, heterogeneous surface reactions, and heat and mass transport
mechanisms is important in improving the converter design. The role of convective
transport phenomena becomes important at high temperature when the mass transfer
becomes rate limiting to an increasing extent. The objective of the present study is to
elucidate the influence of convective heat and mass transfer mechanisms. The
mathematical model considers the conservation of mass, momentum and energy in
both gaseous and solid phases. In addition to the heterogeneous surface reactions, the

2
model also takes into account the adsorption/desorption of oxygen in the catalyst
during non-stoichiometric composition of air-fuel mixtures. The governing equations
are solved by an implicit scheme using a successive line under relaxation method.
The converter performance under both the steady state and the transient conditions is
analyzed.
Key Words
engine emissions, engine exhaust after-treatment, heat and mass transfer, numerical
simulations.
Nomenclature
Cgj gas phase concentration of species j, mol/m3
Csj surface concentration of species j, mol/m3
cpg specific heat of gas, J/kg·K
cps specific heat of substrate, J/kg·K
Dh hydraulic diameter, m
Dj diffusion coefficient of species j, m2/s
Ga geometric surface area, m2/m3
∆Hk heat of reaction of species k, J/mol
hg heat transfer coefficient between flow and substrate, J/m2·s·K
h∞ heat transfer coefficient between substrate and atmosphere, J/m2·s·K
kmj mass transfer coefficient for species j, m/s
L catalyst length, m
Nu Nusselt number
Pr Prandtl number

3
Rk reaction rate of kth reaction, mol/m2·s
Re Reynolds number
Sc Schmidt number
Sext external surface to volume area ratio, m2/m3
t time, s
T∞ ambient temperature, K
Tg gas temperature, K
Ts substrate temperature, K
vg gas flow velocity, m/s
z coordinate along catalyst axis, m
Greek symbols
ε void volume fraction
λg thermal conductivity of gas, J/m·s·K
λs thermal conductivity of substrate, J/m·s·K
ρg gas density, kg/m3
ρs substrate density, kg/m3
1. Introduction
Emissions from engines are major sources of urban air pollution. The engine
exhaust gases contain oxides of nitrogen (NOx), carbon monoxide (CO), and partially
burned or unburned hydrocarbons (HC). These pollutants have hazardous effects on
environment and living beings. They may cause acid rain, smog, and several
respiratory diseases. Accordingly, they are being subjected to stringent regulations

4
worldwide. In gasoline engine applications, these pollutants can be removed from the
exhaust gases by employing catalytic converters.
Catalytic converters have been used in automobiles for several years and
various types of them are available. They can reduce engine emissions by more than
90%. However, due to progressively stricter emission regulations, the catalytic
converter design and performance need to be continuously improved. The design
improvement efforts require broadening of fundamental understanding of various
physiochemical processes that occur in a catalytic converter. The performance of a
catalyst depends greatly on the heterogeneous chemical reactions between the exhaust
gas and the monolith surface. The effect of these surface reactions has been studied
by many investigators [1]. In addition to chemical reactions, the catalyst performance
is strongly influenced by the transport mechanisms of mass and heat transfer from the
exhaust gases to the catalyst surface. Especially at higher temperatures, the mass
transfer process becomes rate-limiting to an increasing extent [2]. Hence, a correct
description of the mass transfer processes is important in catalyst models.
Most studies modeled the convective heat and mass transfer processes by
using the simplified one-dimensional film model. In the film model, the
dimensionless Nusselt (Nu) and Sherwood (Sh) numbers describe the heat and mass
transfer rates. Without being too much sophisticated, the film model is a good
compromise to obtain a reasonable prediction of the converter efficiency [3].
However, many uncertainties remain about the estimate of Nu and Sh numbers [4].
Some studies [e.g., 5] compute Nu and Sh numbers assuming the flow in monolith
channels is fully developed laminar. Other studies [e.g., 6] include the effect of
developing laminar flow at the channel inlet in the calculation of Nu and Sh numbers.
The effect of initial turbulence in the channel flow has also been proposed to be

5
included in the analysis of transport mechanism [2]. The ignition of reactions inside
the monolith has also been reported to influence the transfer processes [7].
The heat and mass transfer coefficients in monolithic structure were
experimentally determined by Votruba et al. [8]. They found no influence of inlet
effect on the mass transfer coefficient. Their values of Nu number are similar to that
of a recent study by Shayler et al. [9]. Their proposed mass transfer expression gives
values of Sh number approximately three times lower than that predicted by the
Hawthorn [6]’s expression. The mass transfer coefficients proposed by Ullah et al.
[10] are also lower than those of Hawthorn [6]. Ullah et al. proposed a new mass
transfer correlation based on experimental measurements. They reported the increase
in the mass transfer coefficients with an increase of cell density. They also found the
flow disturbance at the monolith inlet to influence the mass transfer process. A much
higher range of Nu and Sh numbers inside a monolith reactor was determined by
Hayes and Kolaczkowski [7]. In their numerical work, they found that at steady state
conditions, the correct value of Nu and Sh number in fully developed region for an
adiabatic cylindrical system is in the range 3.0–4.5. For other geometry, such as
square or triangular ducts, the value may be lower. For sharp transients, they found
that the values of Nu and Sh numbers might exhibit discontinuities. They suspected
incorrect analysis methodology for the substantial underprediction of Nu and Sh
numbers reported in the literature.
Holmgren and Andersson [2], in their experimental study, found that the
values of Sh number to be higher than that predicted by laminar flow calculations.
Their measurements for square monolith channels predicted Sh numbers in the range
3.7–7. They ascribed the higher values of Sh numbers to the turbulence effects. Even
though the Reynolds (Re) numbers in the monolith channel are generally below 600, a
6
certain degree of turbulence is present in the channel. The channel turbulence is
partly created by the presence of turbulence in the entering flow, turbulence generated
by monolith walls at the entrance, and the surface roughness of channels. The
enhancement of the heat and mass transfer processes as a result of the presence of
surface roughness has been documented by several other studies [e.g., 11]. Holmgren
and Andersson concluded that a Sh number below 2 is highly unreasonable as it
means that the film thickness in the film model for mass transfer is greater than half
the channel diameter. Hatton et al. [12] found that the bulk conversion in the catalyst
at high temperatures is not purely mass controlled. They suggested inclusion of a
temperature dependent term into the Sh relationship. In a numerical heat transfer
study, Day et al. [13] reported that the Nu number varies in the range 2.8–8 for a
triangular channel. The value was found to remain close to 3 for most of the channel
length. They also determined that the angle of incidence of the inlet flow to the front
face of a monolith has no net effect on the warm-up of the substrate for an equivalent
mass flow rate.
A critical review of the past studies show that there are contradicting reports
on the values of Nu and Sh numbers in a monolith catalyst. A wide range of the
values of these dimensionless numbers has been used in the past studies. However,
due to differences in the operating conditions and modeling approaches, it is difficult
to assess the effect of these numbers on the catalyst performance. The objective of
the present study is to systematically investigate the effects of heat and mass transfer
coefficients on the catalyst performance. This is done by varying only Nu and Sh
numbers and keeping operating conditions and modeling approach consistent. This
investigation will elucidate the effect of Nu and Sh numbers on the catalyst
performance. The improved understanding of catalyst performance is essential in

7
designing catalysts that can meet the future stringent emission regulations. In
addition to their applications in catalyst modeling, the results can be applied to
general cases of reacting flows in small tube configurations.
2. Mathematical Formulation
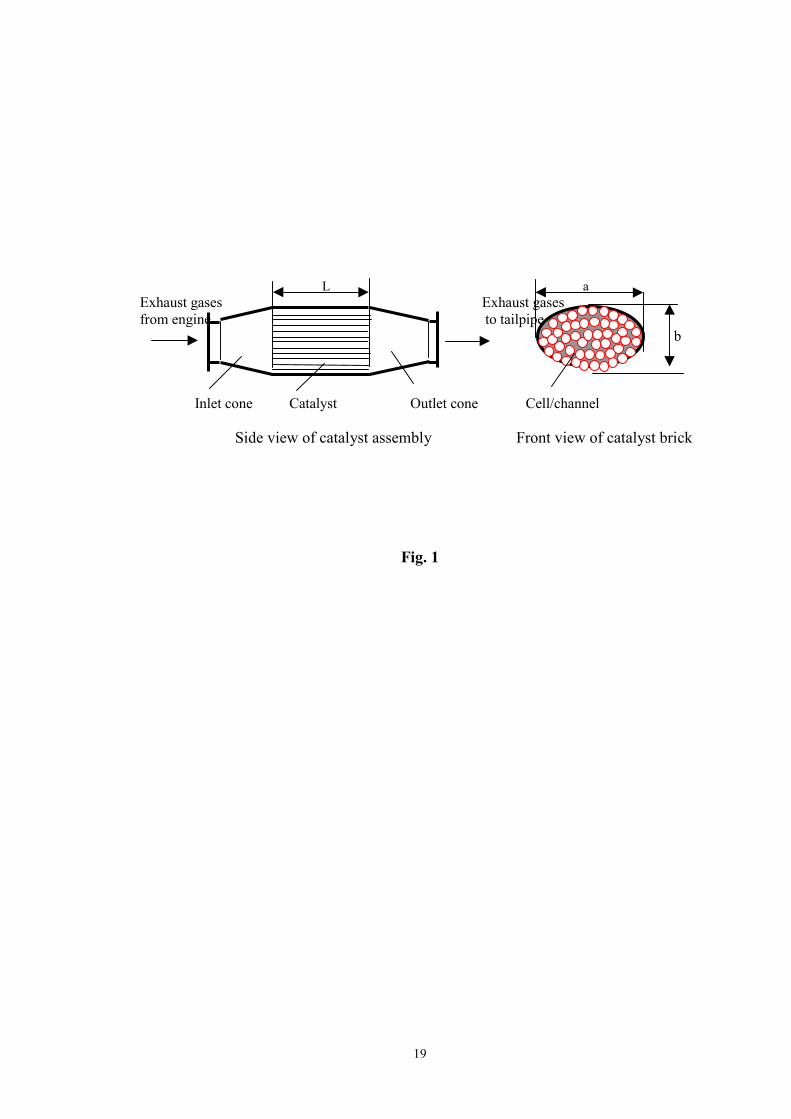
Figure 1 shows schematic of a catalytic converter. The details of mathematical
modeling of various phenomena in three-way catalysts are given elsewhere [14]. The
governing conservation equations are listed below:
The gas phase energy equation:
)()( sgagg
gg
Pg TTGhz
Tv
tT
cg
−−=∂
∂+
∂∂
ερ (1)
The gas phase species equation:
)()( js
jga
jm
jg
g
jg CCGk
zC
vt
C−−=
∂∂
+∂
∂ε (2)
The surface energy equation:
knss
n
ks
ka
sextsgags
ss
Pss
HCCTRG
TTShTTGhzT
tT
c
speciesreaction
∆⋅⋅⋅⋅⋅⋅⋅+
−−−+∂∂
−=∂
∂−
�=
∞∞
),,,(
)()()1()1(
1
1
2
2
λερε (3)
The surface species equation:
),,,()()1( 1 speciesNsss
ja
js
jga
jm
js CCTRGCCGkt
C⋅⋅⋅⋅⋅⋅−−=
∂∂
−ε (4)
where the superscript j varies from 1 to 7 representing, respectively, the following gas
and surface species: CO, NO, NH3, O2, C3H6, H2 and C3H8. The conservation
equation for the surface oxygen storage mechanism can be represented by Eq. (4)
excluding the convective mass transport term. The heat and mass transfer coefficients
(hg and jmk ) in the above equations are calculated from
8
h
gg D
Nuh
λ= (5)
h
jjm D
DShk = (6)
Values of Nu and Sh numbers are obtained from the correlations with Re, Pr and Sc
numbers. In the present study, the model validation was performed by using the
following forms of correlations:
n
zLPrRecNu ��
���
�= (7)
andn
zLScRecSh ��
���
�= (8)
The values of constants c and n used in the model validation part of this study were
based on proprietary information. The typical values of Nu and Sh numbers using the
selected constants are shown in Fig. 2. These values of Nu and Sh numbers yield
good agreement between model results and experimental measurements as described
in the next section.
The governing equations were discretized by using a non-uniform grid and
employing the control volume approach and the central implicit difference scheme in
the spatial direction. Since more chemical reactions take place near the inlet, smaller
grid spacing is used near the inlet and larger spacing near the exit. The equations
were solved by using a standard tri-diagonal matrix algorithm (TDMA) with a
successive line under-relaxation scheme. The surface chemical reactions are modeled
by using a 13-step reaction mechanism. The model also includes an additional 9-step
chemistry to model the oxygen storage capacity of the substrate wash-coat material. A
detailed description of the model, various mechanisms, solution procedure, initial and
boundary conditions are given by Shamim et al. [14].

9
3. Results and discussion
The numerical model was validated using the experimental measurements at
both steady and transient conditions. An excellent agreement (within 5%) between
the model results and the experimental measurements was found [14]. The effect of
heat and mass transfer coefficients was investigated by considering the converter
performance under transient conditions in a 4.6L 2V Lincoln Town car as it was
driven during the FTP cycle. The converter was a palladium-based catalyst, with a
length of 8 cm, cross-sectional area of 86.0254 cm2, cell density of 62 cells/cm2, and
wall thickness of 0.1905 mm. The boundary conditions for the model were obtained
from the experimental measurements, which included the mass flow rates of CO, HC,
NOx and the total gases at the catalyst inlet during the FTP. The measurements were
made at an interval of 1 second; therefore, there were 1372 measured data. The air-
fuel ratio of engine's fresh charge was calculated based on the measured air flow and
fuel supply rates. The ambient temperature for the measurements and simulation was
297 K.
3.1 Effect of Nusselt number
The effect of Nusselt number on the catalyst conversion performance during
the Federal Test Procedure (FTP) was investigated by simulating the catalyst
performance using a constant value of Nu number of 2.89 and comparing it with that
obtained by using a variable Nu number as calculated from Eq. (7). For this
comparison, the Sh number was calculated from Eq. (8). Figure 3 shows the results of
this comparison of constant and variable values of Nu numbers during the FTP. The
results depict that the cumulative emissions are slightly higher for variable Nu
number. Since the average values of Nu number calculated from Eq. (7) is higher

10
than 2.89, the results indicate that an increase of Nu number has a negative effect on
the catalyst pollutant conversion performance. Figure 3 shows that CO emissions
(5% higher than that for constant Nu number) are relatively more influenced than HC
(3.7% higher) and NO (0.8% higher) emissions. During the cold start period, the Nu
number dependence of catalyst performance is negligibly small.
To further investigate the effect of Nu number, a parametric study with
constant value of Nu number ranging from 1 to 10 was conducted. The value of Sh
number for this case also was calculated according to Eq. (8). Figure 4 shows the
cumulative CO, HC, and NO emissions during the FTP for different values of Nu
number. As in the above case, Nu number is shown to have some influence on the
pollutant conversion performance during the legislated cycle. Figure 4a plots the
cumulative CO emission, which is found to be relatively less influenced. The results
show that low Nu numbers produce relatively higher CO emissions during the initial
part of the FTP (first 200 seconds, which represents the cold start conditions).
Compared to Nu number of 10, the CO emission is 7.4% higher for Nu number of
unity. However, beyond 200 seconds, the higher Nu number does not produce low
CO emission. For the whole FTP cycle, Nu number of unity has the lowest CO
emissions. The CO emissions increase with an increase of Nu number. At Nu
number of 10, the emissions are roughly 7.7% higher than that for Nu number of 1.
HC emissions are found to have relatively stronger influence of Nu number
during the cold start conditions, as shown in the inset of Fig. 4b. During the first 200
seconds, the HC emissions are 23% higher for Nu number of unity compared to that
for Nu number of 10. During the entire FTP cycle, however, the Nu number
dependence of HC emissions is much smaller (approximately 3% difference between
values of Nu numbers of unity and 10). For Nu number ranging from 1 to 4, there is

11
no clear pattern of increasing or decreasing effect of Nu number on the catalyst HC
conversion performance. The NO emission results, plotted in Fig. 4c, show that NO
emission is lowest for Nu number of 1 during the first 200 seconds (approximately 7%
lower than that for other Nu numbers). During this cold start period, the other Nu
number results do not show any Nu number dependence. During the entire FTP cycle,
there is also no clear pattern of increasing or decreasing effect of Nu number on the
catalyst NO conversion performance. There is appreciable difference between the
results of Nu numbers of 3 and 4. The NO emission drops by 5% when Nu number is
changed from 3 to 4.
3.1.1 Oxygen Storage Capacity Effect
The effect of oxygen storage capacity (OSC) was investigated by simulating
the catalyst performance without OSC and then comparing it with the OSC case.
Figure 5 shows the cumulative CO, HC, and NO emissions at the exit of a non-
oxygen storage catalyst during the FTP for different Nu numbers. The results show
no significant influence of oxygen storage on Nu number dependence of catalyst
pollutant conversion efficiency. The CO emission pattern is similar to the OSC case –
at low Nu numbers, the CO emissions are higher during the initial part of the FTP and
are lower during the entire FTP cycle. Compared to Nu number of 1, the CO
emissions for Nu number of 10 are 5.4% higher. The Nu number dependence of HC
emission for non-OSC case is also small. However, in this case, there is more clear
decreasing effect of Nu number on HC emissions. The NO emissions, on the other
hand, do not show a clear pattern of increasing or decreasing effect of Nu number.
For different Nu numbers, NO emissions are within 3.5%.
12
3.2 Effect of Sherwood Number
The mass transfer effect on the catalyst conversion performance during the
FTP was investigated by simulating the catalyst performance by using a constant
value of Sh number of 2.89 and comparing it with that obtained by using a variable Sh
number as calculated from Eq. (8). For this comparison, the Nu number was
calculated from Eq. (7). Figure 6 shows the results of this comparison of constant and
variable values of Sh numbers during the FTP. As expected, the results show the Sh
number has much greater influence on the catalyst’s pollutant conversion
performance. The cumulative emissions are significantly lower for variable Sh
number (with the average value higher than 2.89). The CO and HC emissions are
respectively 26.3% and 20.3% lower than that for Sh number of 2.89. The effect of
Sh number on NO emissions, however, is relatively low (approximately 2.7%
difference between the two cases). Similar to the case of Nu number, the Sh number
dependence of CO and HC emissions during the cold start is negligibly small. NO
emissions, on the other hand, show Sh number dependence at much earlier stages of
the FTP. The results clearly show the importance of accurate modeling of Sh number
in determining the catalyst conversion performance.
The effect of Sh number was further investigated by conducting a parametric
study with constant values of Sh numbers ranging from 1 to 10. The value of Nu
number for this case also was calculated according to Eq. (7). Figure 7 shows the
cumulative CO, HC, and NO emissions during the FTP for different values of Sh
number. As expected, the results show a significant influence of Sh number (i.e.,
mass transfer phenomenon) on the catalyst conversion performance. Among the three
pollutants, CO depicts the strongest dependence on Sh number. The CO conversion
performance increases with an increase in Sh number. The cumulative CO emission

13
decreases by roughly 73% when Sh number is increased from a value of 1 to 10. A
strong influence of Sh number is shown even for values of Sh numbers from 2 to 4.
For this range of Sh number, typically used in determining the automotive catalyst
performance, the CO emission may vary by as much as 37%. This result clearly
underscores the importance of correct modeling of mass transfer phenomenon. The
figure shows that Sh number dependence is relatively stronger at low Sh numbers.
The pattern of Sh number dependence is found to be similar during the entire FTP.
The difference between the results of each Sh number becomes large at the later part
of the FTP.
The HC emissions also show strong dependence on Sh number as depicted in
Fig. 7b. The HC conversion performance increases with an increase in Sh number.
The results show a decrease of HC emissions by 75% when Sh number is changed
from a value of 1 to 10. Similar to the case of CO conversion, the Sh number
dependence is stronger at low Sh numbers. The effect of Sh number is also strong for
the range of Sh numbers from 2 to 4, as the emission decreases by 48%. The pattern
of Sh number dependence during the entire FTP is similar to that of the CO case.
Contrary to the cases of CO and HC conversion, the catalyst NO conversion
performance decreases with an increase of Sh number (see Fig. 7c). The cumulative
NO emission increases by 20% when Sh number is increased from a value of 1 to 10.
And there is a maximum 3.3% difference in the NO emissions for the Sh number
range of 2 to 4. The dependence of NO conversion performance on the mass transfer
phenomenon is relatively not as strong as in the cases of CO and HC. For NO also,
the Sh number dependence is stronger at low Sh number.

14
3.2.1 Oxygen Storage Capacity Effect
The coupled effect of mass transfer phenomenon and the OSC was investigated by
simulating the catalyst performance without OSC and then comparing it with the OSC
case of the previous section. Figure 8 shows the cumulative CO, HC, and NO
emissions at the exit of a non-oxygen storage catalyst during the FTP for different Sh
numbers. The results show no significant effect of OSC on CO and HC emissions.
Similar to the OSC case, the emissions of both of these pollutants decrease with an
increase of Sh number. The OSC, however, is found to have a strange effect on NO
emissions. It changes the pattern of NO emissions for some Sh numbers. For the
OSC case, the slope of cumulative NO emissions during the FTP is small, indicating
small amounts of NO production at the later stage of FTP. However for the non-OSC
case, for some Sh numbers (especially for 10), the emission slope becomes steeper,
which indicates a higher production of NO at the later stage of FTP. For Sh number
of 1, the slope is relatively flat. Other than Sh number of 1, the NO emissions
increase with an increase of Sh number. The Sh number dependence of NO emissions
in the non-OSC case is much stronger (the cumulative NO emission increases by 86%
when Sh number is increased from a value of 2 to 10).
4. Conclusions
• The catalyst performance is influenced by both heat and mass transfer
phenomena, with mass transfer playing more substantial role. The influence of
these phenomena is relatively higher at low Nusselt / Sherwood numbers.
• With an increase of Nusselt number (i.e., heat transfer coefficient) CO emissions
increase, HC emissions slightly decrease. NO emissions show no clear pattern of

15
increasing or decreasing effect of Nu number. The increase of Sherwood number,
on the other hand, decreases CO and HC and increases NO emissions.
• The Nu number dependence of emissions during the cold start period may be
different from that during the warm up stage. For example, in contrast to the
warm-up period, the increase of Nu number has a decreasing effect on CO
emissions during the cold start period.
• The oxygen storage capacity (OSC) generally has no significant influence on the
Nu/Sh number dependence of catalyst conversion performance. However, the
OSC decreases the Sh number dependence of NO emissions.
Acknowledgments
The financial supports from the Chemical Engineering Department of the Ford
Scientific Research Laboratory, Office of Sponsored Research and the Center for
Engineering Education and Practice (CEEP) of the University of Michigan - Dearborn
are greatly appreciated.
References
1 Koltsakis, G. C. and Stamatelos, A. M. Catalytic automotive exhaust
aftertreatment. Progress in Energy and Combustion Science, 1997, 23, 1-39.
2 Holmgren, A. and Andersson, B. Mass transfer in monolith catalysts-CO
oxidation experiments and simulation. Chemical Engineering Science, 1998,
53, 2285-2298.
3 Massing, E., Brilhac, J. F., Brillard, A., Gilot, P. and Prado, G. Modelling
of the behaviour of a three way catalytic converter at steady state: Influence of
the propene diffusion inside the catalytic layer. Chemical Engineering

16
Science, 2000, 55, 1707-1716.
4 Ryan, M. J., Becke, E. R. and Zygourakis, K. Light-off performance of
catalytic converters. The effect of heat and mass transfer characteristics. SAE
Technical Paper 910610, 1991.
5 Young, L. C. and Finlayson, B. A. Mathematical models of the monolith
catalytic converter: Part I. Development of model and application of
orthogonal collocation. AIChE Journal, 1976, 22, 331-343.
6 Hawthorn, R. D. Afterburner catalysts – effect of heat and mass transfer
between gas and catalyst surface. AIChE Symposium Ser., 1974, 70, 428-438.
7 Hayes, R. E. and Kolaczkowski, S. T. Mass and heat transfer effects in
catalytic monolith reactors. Chemical Engineering Science, 1994, 49, 3587-
3599.
8 Votruba, J., Mikus, O., Khue Nguen, Hlavacek, V. and Skrivanek, J. Heat
and mass transfer in honeycomb catalysts-II. Chemical Engineering Science,
1975, 30, 201-206.
9 Shayler, P. J., Hayden, D. J. and Ma, T. Exhaust system heat transfer and
catalytic converter performance. SAE Technical Paper 1999-01-0453, 1999.
10 Ullah, U., Waldram, S. P., Bennett, C. J. and Truex, T. Monolithic reactors:
Mass transfer measurements under reacting conditions. Chemical Engineering
Science, 1992, 47, 2413-2418.
11 Mottahed, B. and Molki, M. Artificial roughness effects on turbulent transfer
coefficients in the entrance region of a circular tube. International Journal of
Heat and Mass Transfer, 1996, 39, 2515-2523.
12 Hatton, A., Birkby, N. and Hartick, J. Theoretical and experimental study of
mass transfer effects in automotive catalysts. SAE Technical Paper 1999-01-

17
3474, 1999.
13 Day, E. G. W., Benjamin, S. F. and Roberts, C. A. Simulating heat transfer
in catalyst substrates with triangular and sinusoidal channels and the effect of
oblique inlet flow. SAE Technical Paper 2000-01-0206, 2000.
14 Shamim, T., Shen, H., Sengupta, S., Son, S. and Adamczyk, A. A. A
comprehensive model to predict three-way catalytic converter performance.
ASME Journal of Engineering for Gas Turbines and Power, 2002, 124, 1-8.

18
Figure Captions
Figure 1 Schematic of a three-way catalytic converter
Figure 2 Values of Nu and Sh numbers along the catalytic converter length
Figure 3 Effect of Nu number on catalyst performance. Comparison of
cumulative emissions during the FTP for constant and variable Nu
numbers: (a) CO emissions; (b) HC emissions; (c) NO emissions.
Figure 4 Effect of Nu number on catalyst performance. Comparison of
cumulative emissions during the FTP for different Nu numbers: (a) CO
emissions; (b) HC emissions; (c) NO emissions.
Figure 5 Effect of Nu number on catalyst performance. Comparison of
cumulative emissions during the FTP for different Nu numbers without
oxygen storage capacity: (a) CO emissions; (b) HC emissions; (c) NO
emissions.
Figure 6 Effect of Sh number on catalyst performance. Comparison of
cumulative emissions during the FTP for constant and variable Sh
numbers: (a) CO emissions; (b) HC emissions; (c) NO emissions.
Figure 7 Effect of Sh number on catalyst performance. Comparison of
cumulative emissions during the FTP for different Sh numbers: (a) CO
emissions; (b) HC emissions; (c) NO emissions.
Figure 8 Effect of Sh number on catalyst performance. Comparison of
cumulative emissions during the FTP for constant and variable Sh
numbers without oxygen storage capacity: (a) CO emissions; (b) HC
emissions; (c) NO emissions.
19
L a Exhaust gases Exhaust gases from engine to tailpipe b
Inlet cone Catalyst Outlet cone Cell/channel
Side view of catalyst assembly Front view of catalyst brick
Fig. 1

20
Fig. 2

21
Fig. 3 (a)

22
Fig. 3 (b)

23
Fig. 3 (c)

24
Fig. 4 (a)

25
Fig. 4 (b)

26
Fig. 4 (c)

27
Fig. 5 (a)

Fig. 5 (b)
28

29
Fig. 5 (c)

Fig. 6 (a)
30

Fig. 6 (b)
31

Fig. 6 (c)
32

Fig. 7 (a)
33

Fig. 7 (b)
34

Fig. 7 (c)
35
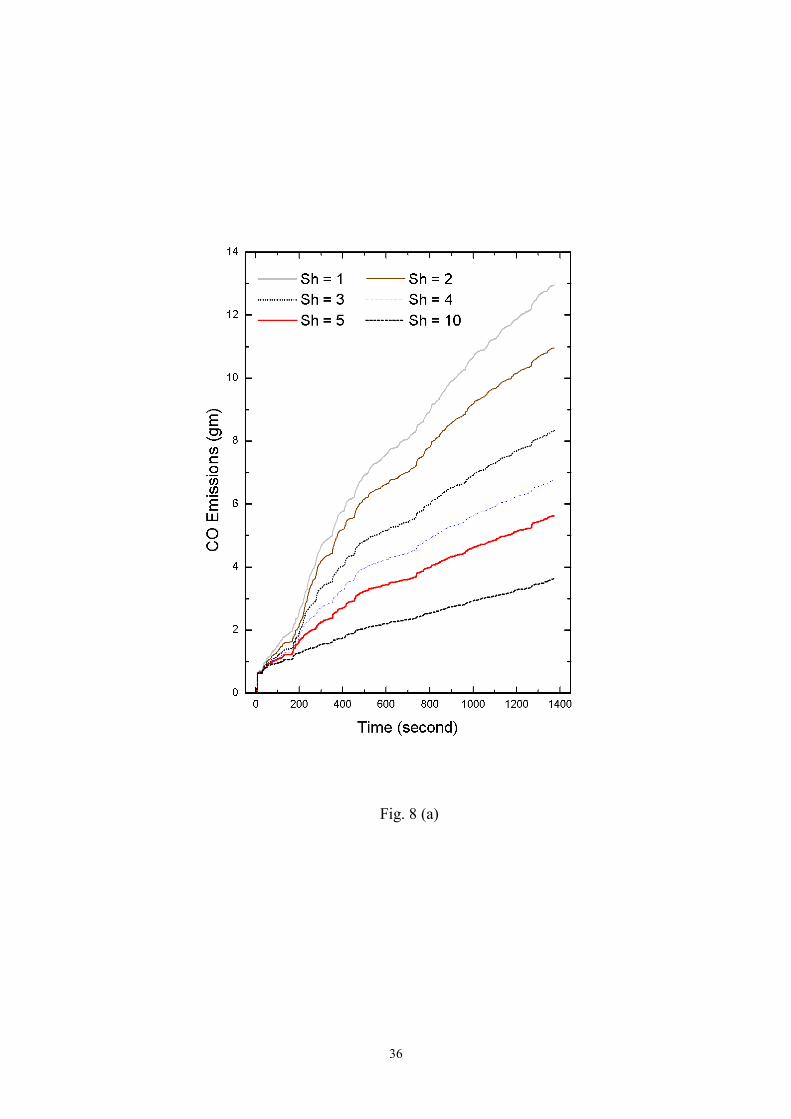
Fig. 8 (a)
36

Fig. 8 (b)
37

38
Fig. 8 (c)