A Stochastic Framework for Optimal Key Frame Extraction from MPEG Video Databases
22
Computer Vision and Image Understanding Vol. 75, Nos. 1/2, July/August, pp. 3–24, 1999 Article ID cviu.1999.0761, available online at http://www.idealibrary.com on A Stochastic Framework for Optimal Key Frame Extraction from MPEG Video Databases Yannis S. Avrithis, * Anastasios D. Doulamis, Nikolaos D. Doulamis, and Stefanos D. Kollias Electrical and Computer Engineering Department, National Technical University of Athens, Zografou 15773, Athens, Greece A video content representation framework is proposed in this paper for extracting limited, but meaningful, information of video data, directly from the MPEG compressed domain. A hierarchical color and motion segmentation scheme is applied to each video shot, transforming the frame-based representation to a feature-based one. The scheme is based on a multiresolution implementation of the re- cursive shortest spanning tree (RSST) algorithm. Then, all segment features are gathered together using a fuzzy multidimensional his- togram to reduce the possibility of classifying similar segments to different classes. Extraction of several key frames is performed for each shot in a content-based rate-sampling framework. Two ap- proaches are examined for key frame extraction. The first is based on examination of the temporal variation of the feature vector tra- jectory; the second is based on minimization of a cross-correlation criterion of the video frames. For efficient implementation of the latter approach, a logarithmic search (along with a stochastic ver- sion) and a genetic algorithm are proposed. Experimental results are presented which illustrate the performance of the proposed techniques, using synthetic and real life MPEG video sequences. c 1999 Academic Press 1. INTRODUCTION Efficient access to video data located on distributed platforms is a very hard task, mainly due to large bandwidth requirements imposed by the large amount of video information. Traditionally, video is represented by numerous consecutive frames, each of which corresponds to a constant time interval. However, such a representation is not adequate for new emerging multimedia ap- plications, such as content-based indexing, retrieval, and video browsing. Moreover, tools and algorithms for effective organi- zation and management of video archives are still limited. For this reason, the MPEG-4 standardization phase aims at effective audiovisual coding, giving a new dimension to creating, access- ing and manipulating video content [25, 34]. Furthermore, the MPEG-7 standard aims at developing an integrated framework for a multimedia content description interface [26], with the ob- jective to specify a set of descriptors that can be used to represent various types of multimedia information [20, 31]. * Corresponding author. E-mail: [email protected]. The active research effort in this area has been reflected in many conferences and special issues of leading journals dedi- cated to this topic [16, 37, 38]. In addition, several prototype systems, such as QBIC [12], Virage [14], VisualSEEK [35], Photobook [30], MARS [32], Netra [21], and VideoQ [4] have already been developed and are now in the first stage of commer- cial exploitation for content-based image manipulation. How- ever, these systems cannot be easily extended to handle video databases, since it is very inefficient and time consuming to perform queries on every video frame. Storage requirements of digitized video information, even in compressed domain, are very large and present challenges to most multimedia servers. To make thinks worse, most video databases are often located on distributed platforms, imposing great transmission bandwidth requirements. For this reason, apart from developing appropri- ate congestion schemes or proposing algorithms for effective network design through modeling of video sources [10], new methods for efficient video content representation should also be implemented. In particular, a “preindexing” stage should be introduced, ex- tracting limited and meaningful information of the video content. The objective is to divide a video sequence into separate repre- sentative shots and then to extract the most characteristic frames (key frames) within the selected shots by means of a content- based sampling algorithm [33]. In this framework, instead of performing a query on all available video frames, one can only consider the selected ones. Video queries can thus be performed faster and more efficiently, since the redundant information is re- jected. Furthermore, key frame extraction also permits fast video browsing and provides a powerful tool for video content sum- marization and visualization. For example, it has been observed in [42] that a 30-min video stream consists of approximately 200 shots. Consequently, using five key frames per shot, only 1000 out of 45,000 frames are required to represent the video content. Some approaches [29, 41] are oriented to detecting shot changes; they can, therefore, be used as the first stage of video visualization algorithms. Video representation based on the ex- traction of frames at regular time instances has been proposed in [23]. This algorithm exploits neither shot information nor frame similarity. Consequently important shots of small duration may have no representatives while shots of longer duration may be represented by multiple frames with similar content. Exploiting 3 1077-3142/99 $30.00 Copyright c 1999 by Academic Press All rights of reproduction in any form reserved.
Transcript of A Stochastic Framework for Optimal Key Frame Extraction from MPEG Video Databases

Computer Vision and Image Understanding
Vol. 75, Nos. 1/2, July/August, pp. 3–24, 1999
Article ID cviu.1999.0761, available online at http://www.idealibrary.com on
A Stochastic Framework for Optimal Key Frame Extractionfrom MPEG Video Databases
Yannis S. Avrithis,∗ Anastasios D. Doulamis, Nikolaos D. Doulamis, and Stefanos D. Kollias
Electrical and Computer Engineering Department, National Technical University of Athens, Zografou 15773, Athens, Greece
A video content representation framework is proposed in thispaper for extracting limited, but meaningful, information of videodata, directly from the MPEG compressed domain. A hierarchicalcolor and motion segmentation scheme is applied to each video shot,transforming the frame-based representation to a feature-based one.The scheme is based on a multiresolution implementation of the re-cursive shortest spanning tree (RSST) algorithm. Then, all segmentfeatures are gathered together using a fuzzy multidimensional his-togram to reduce the possibility of classifying similar segments todifferent classes. Extraction of several key frames is performed foreach shot in a content-based rate-sampling framework. Two ap-proaches are examined for key frame extraction. The first is basedon examination of the temporal variation of the feature vector tra-jectory; the second is based on minimization of a cross-correlationcriterion of the video frames. For efficient implementation of thelatter approach, a logarithmic search (along with a stochastic ver-sion) and a genetic algorithm are proposed. Experimental resultsare presented which illustrate the performance of the proposedtechniques, using synthetic and real life MPEG video sequences.c© 1999 Academic Press
1. INTRODUCTION
c
The active research effort in this area has been reflected inmany conferences and special issues of leading journals dedi-
pe5],vemer-w-videog toentsares. Tod on
idthpri-tiveewalso
ex-nt.pre-
amesnt-ofnlyrmedre-
ideom-rved200000tent.shotvideoex-
ed ineay
y be
Efficient access to video data located on distributed platfois a very hard task, mainly due to large bandwidth requiremeimposed by the large amount of video information. Traditionavideo is represented by numerous consecutive frames, eawhich corresponds to a constant time interval. However, surepresentation is not adequate for new emerging multimediaplications, such as content-based indexing, retrieval, and vbrowsing. Moreover, tools and algorithms for effective orgazation and management of video archives are still limited.this reason, the MPEG-4 standardization phase aims at effeaudiovisual coding, giving a new dimension to creating, acceing and manipulating video content [25, 34]. Furthermore,MPEG-7 standard aims at developing an integrated framewfor a multimedia content description interface [26], with the ojective to specify a set of descriptors that can be used to reprevarious types of multimedia information [20, 31].
∗
Corresponding author. E-mail: [email protected]. ing3
rmsnts
lly,ch ofh aap-
ideoni-Forctivess-
theorkb-sent
cated to this topic [16, 37, 38]. In addition, several prototysystems, such as QBIC [12], Virage [14], VisualSEEK [3Photobook [30], MARS [32], Netra [21], and VideoQ [4] haalready been developed and are now in the first stage of comcial exploitation for content-based image manipulation. Hoever, these systems cannot be easily extended to handledatabases, since it is very inefficient and time consuminperform queries on every video frame. Storage requiremof digitized video information, even in compressed domain,very large and present challenges to most multimedia servermake thinks worse, most video databases are often locatedistributed platforms, imposing great transmission bandwrequirements. For this reason, apart from developing approate congestion schemes or proposing algorithms for effecnetwork design through modeling of video sources [10], nmethods for efficient video content representation shouldbe implemented.
In particular, a “preindexing” stage should be introduced,tracting limited and meaningful information of the video conteThe objective is to divide a video sequence into separate resentative shots and then to extract the most characteristic fr(key frames) within the selected shots by means of a contebased sampling algorithm [33]. In this framework, insteadperforming a query on all available video frames, one can oconsider the selected ones. Video queries can thus be perfofaster and more efficiently, since the redundant information isjected. Furthermore, key frame extraction also permits fast vbrowsing and provides a powerful tool for video content sumarization and visualization. For example, it has been obsein [42] that a 30-min video stream consists of approximatelyshots. Consequently, using five key frames per shot, only 1out of 45,000 frames are required to represent the video con
Some approaches [29, 41] are oriented to detectingchanges; they can, therefore, be used as the first stage ofvisualization algorithms. Video representation based on thetraction of frames at regular time instances has been propos[23]. This algorithm exploits neither shot information nor framsimilarity. Consequently important shots of small duration mhave no representatives while shots of longer duration marepresented by multiple frames with similar content. Exploit
1077-3142/99 $30.00Copyright c© 1999 by Academic Press
All rights of reproduction in any form reserved.
S
tm
jec
hrt
p
Ederso
i
t
faeoo
spe
tedeo
trac-tionenceingrep-
deonted
achm-in
veralngeis-ssed
41]e dcef-esforated
ort.ifi-thereo
4 AVRITHI
shot information and selecting one key frame for each shotbeen presented in [1, 36]. However, a single key frame canprovide sufficient information about the video content of a givshot, especially for shots of long duration. Recently some oapproaches dealing with construction of a compact imageor image mosaics have been described in [17, 40]. In [17]frames of a shot are aligned with respect to the dominant obwhile in [40], a panoramic view of the shot frames is displayAlthough such a representation can be very good for speapplications, it cannot be effectively implemented in real wocomplex shots, where background/foreground changes or cplicated camera effects may appear. A method for analyzvideo and building a pictorial summary for visual represention has been proposed in [42]. This work is concentrated onviding a video sequence into consecutive meaningful segm(story units) and then constructing a video poster for each sunit based on shot dominance, instead of extracting key framOther approaches for content-based video indexing includeworks reported in [5, 15, 28].
In this paper, extraction of several key frames within a sis proposed for efficiently describing the shot content. Fivideo frame-based representation is transformed into a feabased one, which is closer to the semantic characterizatiothe shot. This is accomplished by applying several imagecessing and analysis techniques, exploiting color and moinformation, to each video frame. To reduce the required coputations and simultaneously exploit information existingMPEG video databases, such as block color average andtion vectors, our analysis is performed directly on the MPcompressed domain. In this way, decoding can be omitteperformed with minimal effort. Then, all the aforementionfeatures are gathered together, using a fuzzy feature vectomulation. Two approaches for key frame extraction are propoThe first one is based on temporal variation of feature vectwhile the second relies on minimization of a cross-correlatcriterion.
In order to present the two key frame extraction approacwhich constitute the main originality of the paper, we firsttroduce, in Section 2, the feature-based video representatiocorporated in the proposed framework. The description ofrepresentation includes shot detection, video sequence ana(color and motion segmentation), and fuzzy feature vectormulation. Then, in Section 3, the temporal variation approfor key frame extraction is presented, along with an exampla synthetic video sequence that also demonstrates the prties of the proposed feature vector representation. The theical analysis of the cross-correlation approach is included nin Section 3, while its actual implementation is discussedSection 4. In particular, a deterministic and a stochastic verof a logarithmic search, as well as a genetic algorithm areposed for efficient implementation of this approach. Finally,perimental results on video sequences are presented in Sect
demonstrating the performance of the proposed techniques,Section 6 concludes the paper.ET AL.
hasnotenherap
allect,d.ific
rldom-ingta-di-
entstory
es.the
otst,ure-n ofro-
tionm-inmo-Gor
dfor-ed.rs,
ion
hesn-n in-hislysisor-chofper-ret-extinionro-x-
ion 5,
2. FEATURE-BASED VIDEO REPRESENTATION
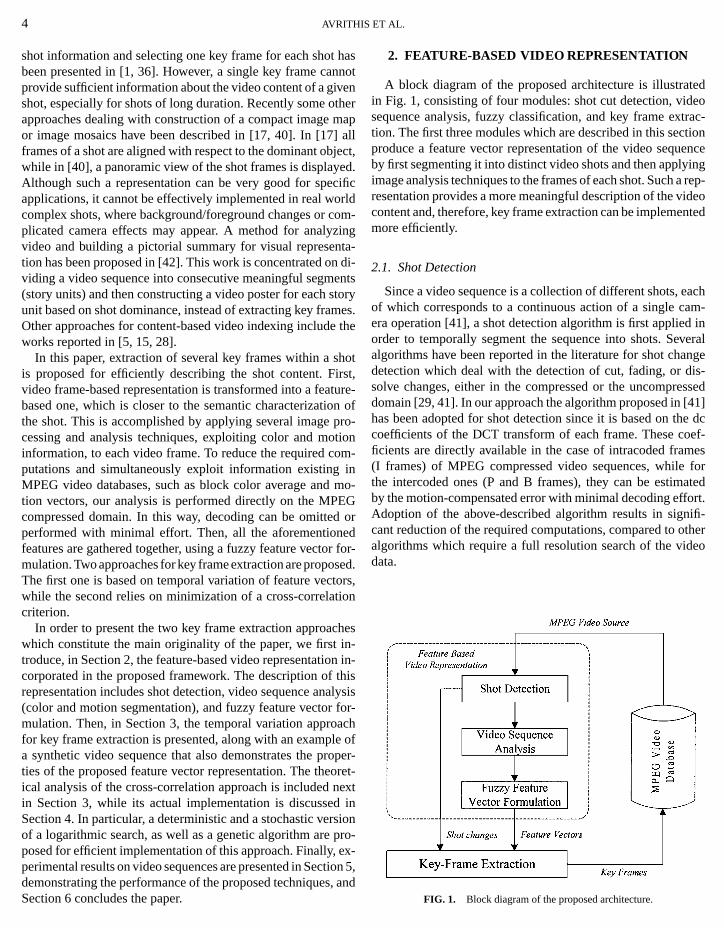
A block diagram of the proposed architecture is illustrain Fig. 1, consisting of four modules: shot cut detection, vidsequence analysis, fuzzy classification, and key frame extion. The first three modules which are described in this secproduce a feature vector representation of the video sequby first segmenting it into distinct video shots and then applyimage analysis techniques to the frames of each shot. Such aresentation provides a more meaningful description of the vicontent and, therefore, key frame extraction can be implememore efficiently.
2.1. Shot Detection
Since a video sequence is a collection of different shots, eof which corresponds to a continuous action of a single caera operation [41], a shot detection algorithm is first appliedorder to temporally segment the sequence into shots. Sealgorithms have been reported in the literature for shot chadetection which deal with the detection of cut, fading, or dsolve changes, either in the compressed or the uncompredomain [29, 41]. In our approach the algorithm proposed in [has been adopted for shot detection since it is based on thcoefficients of the DCT transform of each frame. These coficients are directly available in the case of intracoded fram(I frames) of MPEG compressed video sequences, whilethe intercoded ones (P and B frames), they can be estimby the motion-compensated error with minimal decoding effAdoption of the above-described algorithm results in signcant reduction of the required computations, compared to oalgorithms which require a full resolution search of the viddata.
andFIG. 1. Block diagram of the proposed architecture.
T
d
n
ogat
mi
p
of aion,d fortors
ngta-
tiveost
ech-ng,
lly
or allal togen-color
OPTIMAL KEY FRAME EXTRAC
2.2. Video Sequence Analysis
Once a video sequence is temporally partitioned into vishots, the next step of the analysis is segmentation of eachinto semantically meaningful objects and extraction of esstial information describing those objects. The goal of semasegmentation is to determine the presence of a set of regrepresenting known objects with semantic meaning. This, hever, is a difficult problem, since it involves a priori knowledabout the objects to be detected (e.g., detection of human fand thus can only be solved for a limited range of applicacontexts (e.g., videophone systems, news bulletins, etc.) [9,In this paper, color and motion segmentation is applied toimage sequence representing each video shot. Although setic segmentation would be essential in a content-based retrenvironment, color and motion segmentation provide a powerepresentation of video shots for the problem of key frametraction. In the following, color and motion information is kedistinct in order to provide a flexible video content represen
tion, where each piece of information can be handled separately.In particular, the number, size, location, and average color com-components of the two regions, using a bias for merging smallregions. Using, for example, the RGB color space, a distance
FIG. 2. (a) Flowchart of the RSST; (b) flow
ION FROM VIDEO DATABASES 5
eoshoten-ticionsw-eces)ion18].the
an-evalrfulex-tta-
ponents of all color segments are used for the constructioncolor feature vector. In a similar way, the number, size, locatand average motion vectors of all motion segments are usethe construction of a motion feature vector. These two vecare then combined as explained in the next section.
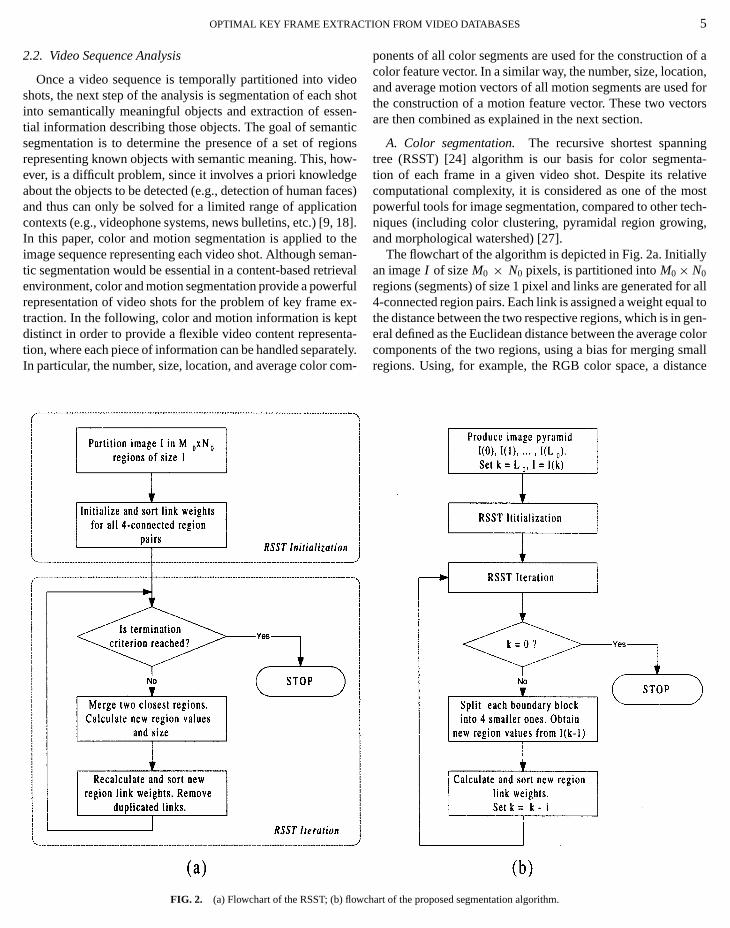
A. Color segmentation. The recursive shortest spannitree (RSST) [24] algorithm is our basis for color segmention of each frame in a given video shot. Despite its relacomputational complexity, it is considered as one of the mpowerful tools for image segmentation, compared to other tniques (including color clustering, pyramidal region growiand morphological watershed) [27].
The flowchart of the algorithm is depicted in Fig. 2a. Initiaan imageI of sizeM0 × N0 pixels, is partitioned intoM0× N0
regions (segments) of size 1 pixel and links are generated f4-connected region pairs. Each link is assigned a weight equthe distance between the two respective regions, which is ineral defined as the Euclidean distance between the average
chart of the proposed segmentation algorithm.

S
e
Trg
atinat
S
c
e
a
ae
ra
l
.ee
pSleet
e oftionnmentt theor a
ntslu-eacholu-bernot
of theT,
eringme
pre-ge isrseg-dled.thece noto ac-aineds isagehis
ams.
on-tagetainin a
n beow-men-
6 AVRITHI
measure between two adjacent regionsX andY is defined as
d(X,Y) = [(RX − RY)2+ (GX − GY)2
+ (BX − BY)2]1/2 AX AY
AX + AY, (1)
whereRX,GX, andBX respectively represent the averageR, G,and B values of all pixels inside regionX and AX is the num-ber of pixels within the region. All link weights are then sortin ascending order, so that the least weighed link correspoto the two closest regions. The iteration phase of the RSSthen initiated, where neighboring regions are recursively meby applying the following actions in each iteration: (i) the twclosest regions are merged and the new region color comnents and size are calculated; (ii) the new region link weigfrom all neighboring regions are recalculated and sorted;(iii) any duplicated links are removed. The iteration terminawhen either the total number of regions or the minimum lweight (distance) reaches a target value (threshold). A distthreshold is in general preferable since it provides a resultis independent of the image content.
The execution time of the RSST is heavily dependent uponchoice of the sorting algorithm, which is certainly a bottleneof the algorithm. For this reason, a new multiresolution RS(M-RSST) approach is proposed, which recursively appliesRSST algorithm on images of increasing resolution, as depiin the flowchart of Fig. 2b. Initially a multiresolution decomposition of imageI is performed with a lowest resolution levof L0 so that a hierarchy of framesI (0)= I , I (1), . . . , I (L0)is constructed, forming a truncated image pyramid, with elayer having a quarter of the pixels of the layer below. The RSinitialization takes place for the lowest resolution imageI (L0)and then an iteration begins, involving the steps: (i) regionsrecursively merged using the RSST iteration phase; (ii) eboundary pixel of all resulting regions is split into four new rgions, whose color components are obtained from the imagthe next higher resolution level; (iii) the new link weights acalculated and sorted. This “split-merge” procedure is repeuntil the highest resolution imageI (0) is reached.
The results of the proposed color segmentation algorithmdepicted in Fig. 3 for a target number of segments equa5 and for an initial resolution levelL0= 3 (equivalent to 8× 8blocks). After application of the RSST iteration onI (3) (Fig. 3c),the boundary pixels are split into four new segments eachshown in Fig. 3d, the total number of segments for the nRSST iteration at resolution level 2 is considerably reduccompared to the initial number of segments of the conventioRSST algorithm at the same resolution level. The same apfor the next level (Figs. 3e and f ). Since the speed of the Rdepends heavily on the initial number of segments, it is cthat the proposed M-RSST approach yields much faster extion, compared to RSST. The computational complexity of
M-RSST, however, is not straightforward to calculate, sincedepends on the number, shape, and size of segments. ForET AL.
dnds
ised
opo-
htsnd
eskncehat
theck
Ttheted-l
chST
arech-
e ofeted
areto
Asxtd,
nalliesSTarcu-
he
TABLE 1Execution Times of the RSST and the Proposed Multiresolution
RSST (M-RSST) for Various Image Sizes
Execution time (s)Improvement
Image size RSST M-RSST ratio
176× 144 (QCIF) 5.65 0.13 43.46352× 288 (CIF) 44.21 0.38 116.35720× 576 (PAL) 534.22 1.36 392.81
Note.The initial resolution level for the M-RSST isL0= 3 (equivalent to8× 8 blocks) in all cases.
reason, the execution times of both algorithms for the imagFig. 3 at different sizes are compared in Table 1. The executimes have been obtained using a C implementation on a SuSparcStation-20 system. It can be seen that the improveratio is heavily affected by the adopted image size and thaM-RSST is approximately 400 times faster than the RSST ftypical image size of 720× 576 pixels.
Also, it is observed from Fig. 3c that very small segmecannot be found by the algorithm at the initial (lowest) resotion, and, since no segments are created or destroyed atiteration, these segments are also eliminated from all restion levels (Figs. 3b, e). For example, even if the target numof segments was higher than 5, some facial details wouldproduce separate segments. The final segmentation resultM-RSST is thus different from that of the conventional RSSas far as small segments are concerned. However, such filtaccording to object size is desirable in the context of key fraselection, since it achieves a high level of video content resentation. This is illustrated in Fig. 4, where a landscape imacorrectly segmented into building, sea, or forest areas. Ovementation is avoided and, thus, texture images can be han
Finally, it can be seen in Figs. 3c, e that effectively onlysegment contour shapes are affected at each iteration, sinsegments are created or destroyed. It is therefore possiblequire the exact contour shapes of the segments that are retat the highest resolution level (as in Fig. 3b). Moreover, thiachieved without using the entire images of the truncated impyramid, but only parts of them at the object boundaries. Tcan be exploited for segmenting frames in MPEG video streby adopting block resolution for initialization of the algorithmIn this case, the truncated image pyramid is actually not cstructed entirely. Instead, decoding of a very small percenof blocks near object boundaries is performed in order to obthe required parts of the higher resolution images, resultingvery fast implementation.
B. Motion segmentation. In order to solve the motionsegmentation problem, numerous different techniques caemployed, such as direct intensity-based methods, optical flbased methods, or simultaneous motion estimation and seg
itthistation methods [39]. Each method has its own advantages anddisadvantages, restricting its use to specific applications. For
OPTIMAL KEY FRAME EXTRACTION FROM VIDEO DATABASES 7
FIG. 3. Color segmentation: (a) initial image; (b) final segmentation; (c) segmentation at resolution level 3; (d) boundary pixels split at level 3; (e) segmentationat level 2; and (f ) boundary pixels split at level 2.
oa
ed, andeyex-
example, simultaneous motion estimation and segmentamethods are unattractive due to their high computational cplexity, while direct intensity-based methods cannot handle cera noise and illumination changes. Optical flow methods
quite popular and widely used both for video coding and imaanalysis and understanding.tionm-m-
are
Having in mind the huge amount of computations involvin the analysis of large video databases on the one handthe limited requirements for accuracy in the problem of kframe extraction on the other hand, we have chosen to
geploit the motion vector information that is directly available inMPEG streams, thus eliminating the need for motion analysis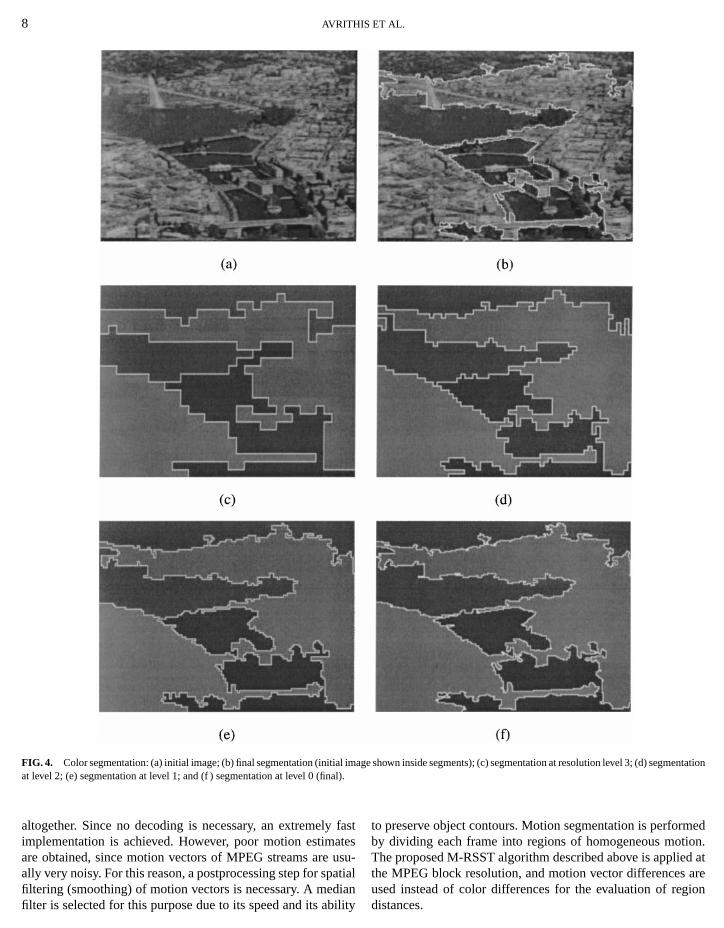
8 AVRITHIS ET AL.
FIG. 4. Color segmentation: (a) initial image; (b) final segmentation (initial image shown inside segments); (c) segmentation at resolution level 3; (d) segmentationat level 2; (e) segmentation at level 1; and (f ) segmentation at level 0 (final).
ua
medion.d atare
altogether. Since no decoding is necessary, an extremelyimplementation is achieved. However, poor motion estimaare obtained, since motion vectors of MPEG streams areally very noisy. For this reason, a postprocessing step for sp
filtering (smoothing) of motion vectors is necessary. A medifilter is selected for this purpose due to its speed and its abfasttessu-tial
to preserve object contours. Motion segmentation is perforby dividing each frame into regions of homogeneous motThe proposed M-RSST algorithm described above is appliethe MPEG block resolution, and motion vector differences
anilityused instead of color differences for the evaluation of regiondistances.

9
can beto featu
OPTIMAL KEY FRAME EXTRACTION FROM VIDEO DATABASES
u
hu
a
d
ot
ee
a
.
S
minm
t
arisons,lting
is-long
ted,sid-achwithex-ir
bins.plex
nals inbein
the
eat
FIG. 5. Motion segmentation res
Figure 5 illustrates the motion segmentation results of a fraextracted from a TV news program. It is clear from Fig. 5a twithout motion vector smoothing, wrong segmentation resare produced, even in a uniform and almost stationary baground. On the contrary, only the actually moving objectsextracted in the case of smoothed motion vectors, as showFig. 5b.
2.3. Fuzzy Feature Vector Formulation
All features extracted by the video sequence analysis mo(i.e., size, location, color, or motion of each segment) canused to describe the visual content of each video frame. Hever, they are not directly included in a vector to be used forpurpose, since their size differs between frames. For exama frame consisting of 20 segments requires twice the numbfeature elements than does a frame consisting of 10 segmMoreover, there can be absolutely no correspondence betwthe elements of the feature vectors of two frames, makingcomparison between the vectors unfeasible. To overcomeproblem, we classify color as well as motion segments into pdetermined classes, forming a multidimensional histogramthis framework, each feature vector element correspondsspecific feature class (equivalent to a histogram bin) and ctains the number of segments that belong to this class.ment size is accounted for by assigning separate feature clafor small and large segments: i.e., size is considered a segfeature just like color or motion. For example, a large movsegment is classified to a different feature class than a smoving segment. Although large objects might be considemore important than small ones, the above approach ensthat all information is kept separate and that, in a content-baretrieval environment, the degree of importance of each fea
specified by the end user, possibly by assigning weigre vector elements [8].
lts (a) without and (b) with smoothing.
meatltsck-ren in
ulebew-
hisple,r ofnts.eenny
thisre-In
to aon-eg-ssesentgall
reduressedure
In order to reduce the possibility of classifying two similsegments to different classes, causing erroneous compara degree of membership is allocated to each class, resuin a fuzzy classification formulation [19]. In conventional htograms, each sample—i.e., segment, in our case—may beonly to one histogram bin, so that two similar samples, locasay, in opposite sides of the boundary of two bins, are conered to belong to different bins. Using fuzzy classification, esample is allowed to belong to several (or all) classes, butdifferent degrees of membership. Therefore, in the previousample, the two similar samples would slightly differ in thedegrees of membership with respect to the two adjacentFuzzy representation permits the user to perform more comqueries, such as seeking a blue andsomehowlarge object, whichis locatednearthe bottom of an image.
Let us first consider the simple case of a one-dimensiofeatures, e.g., the area of an image segment, taking valuea domain, which, without loss of generality, is assumed to[0, 1]; i.e., features is normalized between 0 and 1. This domais partitioned, or quantized, intoQ classes by means ofQ mem-bership functionsµn(s), n= 1, 2, . . . , Q. For a given real values,µn(s) denotes the degree of membership ofs in thenth class.The membership functionsµn(s), n= 1, 2, . . . , Q, take valuesin the range [0, 1], so that values ofµn(s) near unity (zero) indi-cate that the degree of membership of features in thenth classis high (low). The most common membership functions aretriangular ones, defined as
µn(s) ={1− 2|s−mn|/w, |s−mn| < w/2,
0, otherwise(2)
for n= 1, 2, . . . , Q, wherew is the width of each triangle basandmn= (n− 1)/(Q− 1) is the center of each triangle, so th
htsm1= 0 andmQ= 1. An example of fuzzy classification usingQ= 5 triangular membership functions of widthw= 2/(Q− 1)
1
wis
0 AVRITHIS ET AL.
r tions.
e
t
i
r
e
i
uf
e
ethe
ion
riptsn
e.
-e
or-
-a
”tion
edr
,”
,
FIG. 6. Example of one-dimensional fuzzy classification using five t
is depicted in Fig. 6. It can be seen that widthw controls theoverlap between successive partitions, indicating how vaguclassification is, and in this case 50% overlap is used. Theact shape and the overlap percentage of functionsµn(s) can begreatly varied [19]. However, according to experimental resuthe effect of the membership function shape on key frame extion is minimal (except for cases of synthetic video sequenas explained in Subsection 3.1); therefore triangular functhave been selected mainly due to the very simple calculatinvolved.
Using this partition or quantization scheme, a fuzzy histogcan be constructed from a large number of feature samsi , i = 1, . . . , K , each of which corresponds to an image sment, whereK denotes the total number of segments. Then,value of fuzzy histogram, say,H (n) corresponding to thenthclass is defined
H (n) = 1
K
K∑i=1
µn(si ), n = 1, 2, . . . , Q. (3)
We should note that the above definition reduces to the definof conventional histograms if membership functions take binvalues (0 or 1). Since, however, each sample value has nondegree of membership to more than one class, the histogrambe meaningful even when the number of samples is small. Frepresentation thus permits the construction of histogramsa very limited set of data. This is very important since the numof segments in a frame,K , is typically much smaller than thtotal number of classes.
In the more general case of more than one segment featsuch as color, motion, and location, a multidimensional fture vector is constructed for each segment. In particular,each color segmentSc
i , i = 1, . . . , K , an Lc × 1 vectorsci is
formed, while for each motion segmentSmi , an Lm× 1 vector
smi is formed:
sci =
[cT(Sc
i
)lT(Sc
i
)a(Sc
i
)]T(4a)
smi =
[vT(Sm
i
)lT(Sm
i
)a(Sm
i
)]T, (4b)
herea denotes the size of the color or motion segment, anla 2× 1 vector, indicating the horizontal and vertical locatio
iangular membership functions with 50% overlap between successive parti
theex-
lts,rac-cesonsions
amplesg-the
tionaryzerocanzzy
romber
ures,ea-for
of the segment center; the 3× 1 vectorc includes the averagvalues of the color components of the color segment, while2× 1 vectorv includes the average motion vector of the motsegment. Thus,Lc= 6 for color segments andLm= 5 for motionsegments. For the sake of notational simplicity, the superscc and m will be omitted in the sequel; each color or motiosegment will be denoted asSi and will be described by theL×1vectorsi , whereL = 5 or L = 6, depending on the segment typ
According to the above, let us denote bysi = [si,1 si,2 · · ·si,L ]T , i = 1, 2, . . . , K , the vector describing the (color or motion) segmentSi , whereK is the total number of segments. Thdomain of each elementsi, j , j = 1, 2, . . . , L, of vectorsi is thenpartitioned intoQ regions by means ofQ membership functionsµnj (si, j ), nj = 1, 2, . . . , Q. As in the one-dimensional case, fa given real value ofsi, j , µnj (si, j ) denotes the degree of membership of elementsi, j to the class with indexnj . Gathering classindicesnj for all elementsj = 1, 2, . . . , L , andL-dimensionalclassn= [n1 n2 · · · nL ]T is defined. Then, the degree of membership of each vectorsi to classn can be performed throughproduct of the membership functionsµnj (si, j ) of all individualelementssi, j of si to the respective elementsnj of n:
µn(si ) =L∏
j=1
µnj (si, j ). (5)
In order for vectorsi to belong to classn, all its elementssi, j
should belong to the respective classesnj . The membershipfunctionsµnj (si, j ) should thus be combined with the “ANDoperator, which is most commonly represented by multiplicain fuzzy logic.
A simple example of two-dimensional vectors is illustratin Fig. 7. Assume that a segmentS is described here by vectos= [s1 s2]T , andQ= 2 membership functionsµ1(sj ) andµ2(sj )are used to quantize both elementssj , j = 1, 2, ofs. Sinceµ1(sj )is used to express “low” values ofsj andµ2(sj ) to express “high”values ofsj , we can denote classesnj as “L” and “H” andthe two membership functions asµL(sj ) andµH(sj ). The two-dimensional classesn= [n1 n2]T can then be denoted as “LL“LH,” “HL,” and “HH,” and the degree of membership of vectorsto classn isµn(s) = µn1(s1)µn2(s2), or, taking all combinations
dn
µLL (s) = µL(s1) µL(s2), µLH(s) = µL(s1) µH(s2), µHL(s) =µH(s1)µL(s2), andµHH(s)=µH(s1)µH(s2).
T
h
:
ild
g toave
exity
mefea-
r theoef-orentouruch
blingortant
bedentuel,key
avail-rizingtheshotset-be
ationtrates
areria-
imalcri-
lar tobed,
timer, the, ortem-ere-ot isarected
tra-usingting
theond
OPTIMAL KEY FRAME EXTRAC
FIG. 7. Example of two-dimensional fuzzy classification using two partitiofor each dimension.
It is now possible to construct a multidimensional fuzzy htogram from the segment feature samplessi , i = 1, . . . , K , ex-actly as in the one-dimensional case. The value of the fuhistogram,H (n), is defined similarly as the sum, over all sements, of the corresponding degrees of membershipµn(si ):
H (n) = 1
K
K∑i=1
µn(si ) = 1
K
K∑i=1
L∏j=1
µnj (si, j ). (6)
H (n) thus can be viewed as a degree of membership of a wframe to classn. A frame feature vectorf is then formed bygathering values ofH (n) for all classesn, i.e., for all combi-nations of indices, resulting in a total ofQL feature elementsf= [ f1 f2 · · · fQL ]T . In particular, an index function is definewhich maps theQL feature vector elements into an integer btween 1 andQL ,
z(n) = 1+L∑
j=1
nj QL− j . (7)
Then, the elementsfi , i = 1, . . . , QL , of feature vectorf arecalculated asfz(n)= H (n) for all classesn. In fact, since theabove analysis was based on featuressc
i andsmi of color segments
Sci and motion segmentsSc
i , respectively, two feature vectors wbe calculated: a color feature vectorf c for color segments ana motion feature vectorf m for motion segments. Finally, baseon color and motion feature vectors, the feature vector, of lenQLc + QLm
, corresponding to the whole frame, is formed as
f = [(f c)T (f m)T ]T . (8)
It should be noted that the dimension of the feature vectof,and consequently, the computational complexity, increasesponentially with respect to the number of partitions,Q. More-
over, a large number of partitions does not necessarily imprthe effectiveness of the key frame extraction algorithm. OnION FROM VIDEO DATABASES 11
ns
is-
zzyg-
ole
de-
l
dgth
rex-
contrary, it results in a very large number of classes, leadin“noisy” classification. Based on several experiments, we hconcluded that a reasonable choice with respect to compland effectiveness isQ= 3.
Global frame characteristics, obtained through global fraanalysis, could also be included as additional features in theture vector, such as the color histogram of each frame oaverage texture complexity, estimated using the ac DCT cficients of each block derived from the MPEG stream. Msegment properties could also be incorporated, such as coshapes or high order moments. The feature vector would be mmore representative of the frame content in this case, enaselection of those features that are considered as more impfor key frame extraction or content-based retrieval. It shouldmentioned that the feature vector representation is indepenof the key frame selection algorithms described in the seqso that any modification can be made without affecting theframe selection module.
3. EXTRACTION OF KEY FRAMES
Once a feature-based representation of each frame isable, a shot feature vector can be constructed, charactea whole shot. One way of achieving this is by calculatingaverage value of the frame feature vectors over the wholeduration. This information can be exploited for extracting aof representative shots (key shots) using a shot-clustering algorithm, similar to that described in [11]. Key frames can thenselected from the key shots in order to provide a representof a whole video sequence. The rest of the paper concenon key frame extraction from a given shot. Two approachesproposed for this purpose. The first exploits the temporal vation of the frame feature vectors, while the second is an optsolution, based on the minimization of a cross-correlationterion which ensures that the selected frames are not simieach other. In the following both methodologies are descriwhile results are given in Section 5.
3.1. Temporal Variation Approach
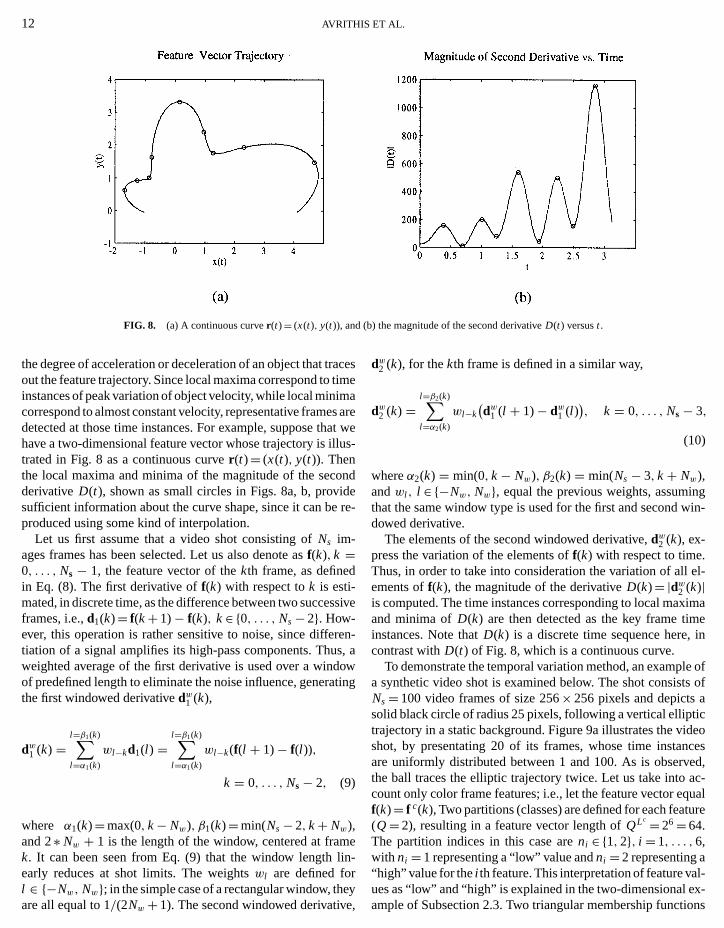
Since every frame in a shot corresponds to a specificinstance and is characterized by a specific feature vectofeature vectors of all frames in the shot form a trajectorymanifold, in a multidimensional space which expresses theporal variation of the frame feature vectors of the shot. Thfore, selection of the most representative frames within a shequivalent to selection of the appropriate curve points whichable to characterize the corresponding trajectory. The selecurve points should provide sufficient information about thejectory curve shape, so that the shape can be reproducedsome kind of interpolation. This can be achieved by extracthe time instances, i.e., the frame numbers which reside inextreme locations of this trajectory. The magnitude of the sec
ovethederivative of the feature vector with respect to time is used as acurvature measure in this case. The second derivative expresses
12
l ∈ {−Nw,are all equ
AVRITHIS ET AL.
rtm
ll
oide
d
s
r
d
l
ngin-
el-
imae
in
le ofs of
icdeocesed,
ac-ualure
l-
FIG. 8. (a) A continuous curver (t)= (x(t), y(t)), and
the degree of acceleration or deceleration of an object that tout the feature trajectory. Since local maxima correspond toinstances of peak variation of object velocity, while local minicorrespond to almost constant velocity, representative framedetected at those time instances. For example, suppose thhave a two-dimensional feature vector whose trajectory is itrated in Fig. 8 as a continuous curver (t)= (x(t), y(t)). Thenthe local maxima and minima of the magnitude of the secderivativeD(t), shown as small circles in Figs. 8a, b, provsufficient information about the curve shape, since it can bproduced using some kind of interpolation.
Let us first assume that a video shot consisting ofNs im-ages frames has been selected. Let us also denote asf(k), k =0, . . . , Ns − 1, the feature vector of thekth frame, as definein Eq. (8). The first derivative off(k) with respect tok is esti-mated, in discrete time, as the difference between two succeframes, i.e.,d1(k)= f(k+ 1)− f(k), k∈ {0, . . . , Ns− 2}. How-ever, this operation is rather sensitive to noise, since diffetiation of a signal amplifies its high-pass components. Thuweighted average of the first derivative is used over a winof predefined length to eliminate the noise influence, generathe first windowed derivativedw1 (k),
dw1 (k) =l=β1(k)∑l=α1(k)
wl−kd1(l ) =l=β1(k)∑l=α1(k)
wl−k(f(l + 1)− f(l )),
k = 0, . . . , Ns− 2, (9)
where α1(k)=max(0, k− Nw), β1(k)=min(Ns− 2, k+ Nw),and 2∗ Nw + 1 is the length of the window, centered at framk. It can been seen from Eq. (9) that the window lengthearly reduces at shot limits. The weightswl are defined for
Nw}; in the simple case of a rectangular window, thal to 1/(2Nw + 1). The second windowed derivative
(b) the magnitude of the second derivativeD(t) versust .
acesimea
s areat weus-
ndere-
sive
en-s, aowting
ein-
dw2 (k), for thekth frame is defined in a similar way,
dw2 (k) =l=β2(k)∑l=α2(k)
wl−k(dw1 (l + 1)− dw1 (l )
), k = 0, . . . , Ns− 3,
(10)
whereα2(k) = min(0, k− Nw), β2(k) = min(Ns− 3, k+ Nw),andwl , l ∈ {−Nw, Nw}, equal the previous weights, assumithat the same window type is used for the first and second wdowed derivative.
The elements of the second windowed derivative,dw2 (k), ex-press the variation of the elements off(k) with respect to time.Thus, in order to take into consideration the variation of allements off(k), the magnitude of the derivativeD(k)= |dw2 (k)|is computed. The time instances corresponding to local maxand minima ofD(k) are then detected as the key frame timinstances. Note thatD(k) is a discrete time sequence here,contrast withD(t) of Fig. 8, which is a continuous curve.
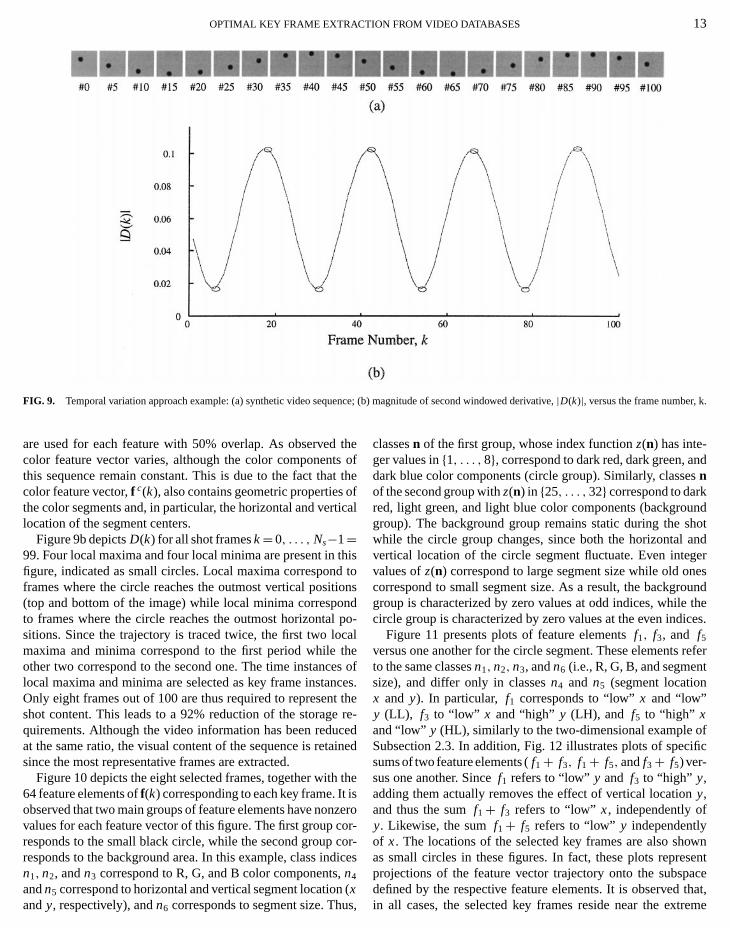
To demonstrate the temporal variation method, an exampa synthetic video shot is examined below. The shot consistNs= 100 video frames of size 256× 256 pixels and depicts asolid black circle of radius 25 pixels, following a vertical ellipttrajectory in a static background. Figure 9a illustrates the vishot, by presentating 20 of its frames, whose time instanare uniformly distributed between 1 and 100. As is observthe ball traces the elliptic trajectory twice. Let us take intocount only color frame features; i.e., let the feature vector eqf(k)= f c(k), Two partitions (classes) are defined for each feat(Q= 2), resulting in a feature vector length ofQLc = 26= 64.The partition indices in this case areni ∈ {1, 2}, i = 1, . . . ,6,with ni = 1 representing a “low” value andni = 2 representing a“high” value for thei th feature. This interpretation of feature va
ey,ues as “low” and “high” is explained in the two-dimensional ex-ample of Subsection 2.3. Two triangular membership functions
OPTIMAL KEY FRAME EXTRACTION FROM VIDEO DATABASES 13
n .
s
t
td
l
te
t
ccd
nds
undshotandgernesound
theices.
refert
fific
ownsentace
FIG. 9. Temporal variation approach example: (a) synthetic video seque
are used for each feature with 50% overlap. As observedcolor feature vector varies, although the color componentthis sequence remain constant. This is due to the fact thacolor feature vector,f c(k), also contains geometric propertiesthe color segments and, in particular, the horizontal and verlocation of the segment centers.
Figure 9b depictsD(k) for all shot framesk= 0, . . . , Ns−1=99. Four local maxima and four local minima are present infigure, indicated as small circles. Local maxima corresponframes where the circle reaches the outmost vertical posit(top and bottom of the image) while local minima correspoto frames where the circle reaches the outmost horizontasitions. Since the trajectory is traced twice, the first two lomaxima and minima correspond to the first period whileother two correspond to the second one. The time instanclocal maxima and minima are selected as key frame instanOnly eight frames out of 100 are thus required to represenshot content. This leads to a 92% reduction of the storagequirements. Although the video information has been reduat the same ratio, the visual content of the sequence is retasince the most representative frames are extracted.
Figure 10 depicts the eight selected frames, together with64 feature elements off(k) corresponding to each key frame. Itobserved that two main groups of feature elements have nonvalues for each feature vector of this figure. The first groupresponds to the small black circle, while the second groupresponds to the background area. In this example, class inn1, n2, andn3 correspond to R, G, and B color components,n4
andn5 correspond to horizontal and vertical segment locationxandy, respectively), andn6 corresponds to segment size. Thu
ce; (b) magnitude of second windowed derivative,|D(k)|, versus the frame number, k
theof
t theofical
histo
ionsndpo-
calhes ofces.there-
cedined
theiszeroor-or-ices
classesn of the first group, whose index functionz(n) has inte-ger values in{1, . . . ,8}, correspond to dark red, dark green, adark blue color components (circle group). Similarly, classenof the second group withz(n) in {25, . . . ,32} correspond to darkred, light green, and light blue color components (backgrogroup). The background group remains static during thewhile the circle group changes, since both the horizontalvertical location of the circle segment fluctuate. Even intevalues ofz(n) correspond to large segment size while old ocorrespond to small segment size. As a result, the backgrgroup is characterized by zero values at odd indices, whilecircle group is characterized by zero values at the even ind
Figure 11 presents plots of feature elementsf1, f3, and f5
versus one another for the circle segment. These elementsto the same classesn1, n2, n3, andn6 (i.e., R, G, B, and segmensize), and differ only in classesn4 and n5 (segment locationx and y). In particular, f1 corresponds to “low”x and “low”y (LL), f3 to “low” x and “high” y (LH), and f5 to “high” xand “low” y (HL), similarly to the two-dimensional example oSubsection 2.3. In addition, Fig. 12 illustrates plots of specsums of two feature elements (f1+ f3, f1+ f5, andf3+ f5) ver-sus one another. Sincef1 refers to “low” y and f3 to “high” y,adding them actually removes the effect of vertical locationy,and thus the sumf1+ f3 refers to “low” x, independently ofy. Likewise, the sumf1+ f5 refers to “low” y independentlyof x. The locations of the selected key frames are also shas small circles in these figures. In fact, these plots repreprojections of the feature vector trajectory onto the subsp
(s,defined by the respective feature elements. It is observed that,in all cases, the selected key frames reside near the extreme
14 AVRITHIS ET AL.
FIG. 10. Set of eight selected key frames from synthetic video sequence example, along with plots of the respective feature vectors.

OPTIMAL KEY FRAME EXTRACTION FROM VIDEO DATABASES 15
FIG. 11. Two-dimensional plots of all pair combinations of feature elementsf1, f3, and f5, corresponding to specific combinations of horizontal and vertical
echle
fs
o
sicalsyn-e.g.,m-s inbut
ari-ionsthe
locations.
locations of the projected trajectory. A plot of particular interis that depicted in Fig. 12b, where in effect the horizontal lotion of the circle is plotted versus the vertical location. In tcase, it is ascertained that the elliptic movement of the circextracted.
Frame extraction based on temporal feature vector variais an extremely fast and very straightforward algorithm sincediscrete time, the second derivative is implemented as a dience equation. In addition, the number of key frames for ais not required to be known a priori. Instead, it is estimatedthe feature vector trajectory. In cases where constant variatiothe feature vector is presented versus time, the second derivmay not work well for detecting the representative frames
shot. However, these are rare situations that might be preonly in synthetic video sequences; instead, in real world onsta-isis
tion, infer-hotbyn ofativef a
feature elements do not obey a specific mathematical or phylaw. This behavior can be eliminated, even in the case ofthetic sequences, by the use of a slightly higher number (3 or 4) of membership functions. The use of nonlinear mebership functions, such as sigmoid or Gaussian, also helpthis direction, since triangular functions may be nonlinear,consist of linear segments.
3.2. Cross-Correlation Approach
As demonstrated in the previous example, the temporal vation approach has the ability of detecting several repetitof the content of a frame. This is useful for understanding
sentes,flow of action in a video shot. In cases, however, where tempo-ral evolution of the shot is not of great interest, this approach

16
posec
AVRITHIS ET AL.
r
tehh
d
e
fhen,
rsc-ut
weraint,es.
et to
fea-
FIG. 12. Two-dimensional plots of all pair co
does not provide a compact video content representation, sincontains redundant information. In such cases, which geneinclude complex shots of large duration, it is necessary to sea small number of frames that are representative of the shoare not similar to each other. For this reason a key frame stion algorithm is introduced, based on an optimization metfor locating a set of minimally correlated feature vectors. Tis achieved by minimizing a cross-correlation criterion amothe frames of a given shot.
Let us recall thatf(k) is the feature vector of thekth frameof the shot under examination, withk∈V ={0, 1, . . . , Ns− 1},whereNs is the total number of frames in the shot. Let us alsonote byKs the number of key frames that should be selected. Tnumber is either known a priori or it can be estimated by the t
ral variation algorithm, as was described in the previous stion. In particular, using several experiments it can be sho
mbinations of sumsf1+ f3, f1+ f5, and f3+ f5.
ce itallylectandlec-odis
ng
e-hism-
that in most cases the numberKs should be approximately half othe key frames extracted by the temporal variation method. Tthe correlation coefficient of two feature vectorsf(k), f(l ) is de-fined asρk,l =Ck,l/(σkσl ), with k, l ∈ {0, . . . , Ns− 1}, whereCk,l = (f(k)−m)T (f(l )−m) is the covariance of the two vectof(k), f(l ), while m= ∑Ns−1
i=0 f(i )/Ns is the average feature vetor of the shot andσ 2
i =Ci,i is the respective variance. Witholoss of generality, it is next assumed thatNs= 2M , whereM isan integer number; i.e., the number of shot frames is a poof 2. In case the actual number does not meet this constrextension of the shot is performed by adding dummy framIn this case, correlation coefficients of dummy frames are sinfinity so that they cannot be selected as key frames.
Based on the correlation coefficients between pairs of
ub-wnture vectors, a measure of correlation amongKs feature vec-tors can be defined. For this purpose, an index vector is defined
e
e
g
o-p
t
si
ni
c
tionofod
ime),are
a-
eto
ortoin-
exon
pates
ration
al
ectorthel
OPTIMAL KEY FRAME EXTRAC
first,
x = (x1, . . . , xKs
)∈W⊂V Ks, (11)
where
W = {(x1, . . . , xKs
)∈V Ks : X1 < · · · < xKs
}(12)
is the subset ofV Ks containing all sorted index vectorsx corre-sponding to sets of frame numbers or time indices. The colation measure of the feature vectorsf(k), k= x1, . . . , xKs, canthen be defined as
R(x) = R(x1, . . . , xKs
) = 2
Ks(Ks − 1)
Ks−1∑i=1
Ks∑j=i+1
(ρxi ,xj
)2,
(13)
taking values in the real interval [0, 1]. Based on the abovefinition, it is clear that searching for a set ofKs minimally cor-related feature vectors is equivalent to searching for an invectorx that minimizesR(x). Searching is limited in the subsW, since index vectors are used to construct sets of featuretors. Thus, any permutations of the elements ofx will result inthe same sets. It is clear that the correlation measure of thKs
features is independent of the feature arrangement. Finallyset of theKs least correlated feature vectors, correspondinthe Ks most characteristic frames, is represented by
x̂ = (x̂1, . . . , x̂Ks
) = arg minx∈W
R(x). (14)
Unfortunately, the complexity of an exhaustive search fortaining the minimum value ofR(x) is such that a direct implementation of the method is practically unfeasible. For examabout 264 million combinations of frames should be conside(each of which requiring several computations for estimaof R(x)) if we wish to select five representative frames out oshot consisting of 128 frames. For this purpose, two methodproposed next for efficient implementation of the optimizatprocedure: the logarithmic search and the genetic algorithm
4. IMPLEMENTATION OF THE CROSS-CORRELATION APPROACH
4.1. Logarithmic Search Algorithm
The first approach is based on a technique similar to theused in MPEG standards for block motion estimation [39]. Tmain difference is that it is implemented in the multidimensiospaceW. In particular, instead of performing an exhaustsearch over all indices ofW, a single path of points is followedbeginning from a certain initial point. At each point of the paonly the set of its neighbors is examined, so that the next pin the path is selected toward the direction of the neighbor
responding to the minimum cross-correlation measure. In eiteration of the algorithm, the neighboring region is decreaTION FROM VIDEO DATABASES 17
rre-
de-
dextvec-
, theto
b-
le,redionf aare
on.
oneheal
ve,th,ointor-
until it reduces to a single point, which is selected as a soluof the optimization problem. Although a very small subsetthe search spaceW is considered, the algorithm presents goperformance, since frames that are close to each other (in tusually have similar properties, and therefore, indices whichclose to each other (inW) should have similar correlation mesures.
An initial index vector, say,x(0) should be selected at thinitialization of the algorithm. A common choice would belocate the initial index vector at the middle pointx̃= (µ, . . . , µ),whereµ= 2M−1− 1 is the central time instance of the shot fa shot lengthNs= 2M . However, this point does not belongspaceW, since its elements do not satisfy the correspondingequality properties, as defined in Eq. (12). Hencex(0) is selectedas the element ofW which is closest to the middle pointx̃,
x(0)= (µ−bKs/2c, . . . , µ−1, µ+1, . . . , µ+bKs/2c) (15a)
if Ks is even and
x(0)= (µ− bKs/2c, . . . , µ− 1, µ, µ+ 1, . . . , µ+ bKs/2c)(15b)
if Ks is odd. Let us now assume that, at thenth iteration of thealgorithm, an index vectorx(n) has been selected. The next indvectorx(n + 1) is then obtained by evaluating the correlatimeasure of all neighbors ofx(n) in a region defined as
N(x(n), δ(n)) = {y ∈ W : y = x(n)+ δ(n)p, p ∈ GKs}, (16)
whereG={−1, 0, 1} andδ(n) is an integer indicating the stesize of the neighborhood region. The above equation indicthat the neighbors ofx(n) are located on the latticeGKs expandedby the step sizeδ(n). The step size is initialized asδ(0)= 2M−2
so that the algorithm covers all possible points of the spaceW.Based on the above, the actions that are repeated in each iteof the algorithm are (i) to select the neighbor ofx(n) with theminimum correlation measure as the next index vectorx(n+ 1)and (ii) to divide the step size by two:
x(n+ 1) = arg minx∈N(x(n),δ(n))
R(x) (17a)
δ(n+ 1) = δ(n)/2. (17b)
The above steps are repeated forn= 0, 1, . . . ,M − 2, untilδ(n)= 1. After M−1 iterations the algorithm stops and the finresult isx̂= x(M−1). This means that the time indices of theKs
key frames of the shot are selected as the elements of the vx(M − 1). Figure 13 depicts a graphical representation ofalgorithm forKs= 2 andNs= 16 (M = 4), where the horizonta
achsed
and vertical axes correspond to the two elements,x1 andx2, ofthe index vectorx. The dark region includes index vectors that
S
d
eb
e
anun
f
a
a
e
c
d
or
],rs
theor-
torsnof
bet-ffer-. The
lo-ofases
opti-well,n, aey
idestiong-ycost.n be2].amic
s ofilitytic al-cialTheiza-rch
18 AVRITHI
FIG. 13. Graphical representation of the logarithmic search algorithmKs= 2 andNs= 16 (M = 4). The dark region indicates index vectors thatnot belong to spaceW.
do not belong to spaceW. The neighborhood area of each indvector is represented by a dotted rectangle, while the neighinsideW are shown as small circles.
Although the proposed scheme significantly reducesrequired time for estimating key frames, it cannot concluddifferent solution than that provided by the examined path. Csequently, it is most frequently trapped in a local minimumR(x). To make the algorithm more flexible, a stochastic approis introduced in the following, providing the possibility of cosidering more than one different paths. Experimental reswhich indicate the performance of both algorithms, are giveSection 5.
4.2. Stochastic Approach
The main difference of this algorithm is the introduction ostochastic term in the selection of the next index vector in eiteration. Therefore Eq. (17a) is modified, based on a probabtic criterion, while the rest of the algorithm remains the samThe concept of this stochastic approach is to assign a probity to every neighbor point of the current examined pointx(n),i.e., every point belonging to the setN(x(n), δ(n)), and then toselect the next index vectorx(n+ 1), using the assigned probbilities. These probabilities are inversely proportional to thespective correlation measure. The search procedure is repseveral times, so that, in effect, multiple logarithmic searchperiments take place in a random way. Due to the stochastihavior of the algorithm, different neighbors are selected in evnew experiment, resulting in the generation of several ranpaths.
Let us denote byxm(n) the index vector at thenth iteration step
for themth experiment, and byyi , i= 1, . . . , |N|, its neighbors,i.e., the elements of setN(xm(n), δ(n)), where|N| is the setET AL.
foro
xors
thea
on-ofch-lts,in
aachilis-e.bil-
-re-ated
ex-be-
eryom
cardinality. Then, a probability value is assigned to eachyi ,according to the respective correlation measure as
pi = 1− R(yi )∑|N|j=1R(y j )
, i = 1, . . . , |N|. (18)
A cumulative probability function is then constructed fall yi , i.e., qi =
∑ij=1 pj , i = 1, . . . , |N|, with q0= 0. Using a
given random numberr , uniformly distributed in the range [0, 1the next index vectorxm(n+ 1) is chosen among the neighboyi as
xm(n+ 1)= {yi ∈ N(xm(n), δ(n)) : qi−1< r ≤qi}. (19)
The iteration is repeatedn = 0, 1, . . . ,M − 2, as in the caseof the logarithmic search algorithm, and the result of themthexperiment is the index vectorx̂m= arg mini=0,...,M−1R(xm(i ))corresponding to the minimum correlation measure alongpath of the experiment. The final result is the index vector cresponding to the minimum correlation measure of all vecin all experiments. AfterJ experiments, the optimal solutiox̂= arg minm=1...,J R(x̂m) is selected, containing the indicesthe Ks key frames.
The stochastic version of the logarithmic search providester results (see Section 5) than the logarithmic one, since dient random paths are generated in each step of the algorithmsearch spaceW is thus explored in a more efficient way, sincecal minima ofR(x) cannot trap the algorithm. As the numberexperiments increases, the number of examined points incretoo; thus the solution obtained by the algorithm reaches themal one. However, in this case the complexity increases asas shown in the experimental results below. For this reasogenetic algorithm is proposed in the following for efficient kframe selection.
4.3. Genetic Algorithm
As we have seen, the logarithmic search algorithm provvery fast convergence to a suboptimal solution of the correlaminimization problem, with a significant possibility of convering to a local minimum ofR(x). This drawback is alleviated bthe use of its stochastic version at a higher computationalThe idea of using a guided random search procedure cafurther extended by employing an evolution program (EP) [2In contrast to enumerative search techniques, such as dynprogramming, which may break down on complex problemmoderate size, evolutionary programs provide unique flexiband robustness on such problems. For this reason, a genegorithm (GA) [13] approach is adopted next. GAs are a specase of EPs, mainly used for discrete optimization problems.approach seems to be very efficient for the particular optimtion problem, given the size and dimensionality of the sea
space and the multimodal nature of the objective function. Thisis evident in Section 5, where experimental results are presented.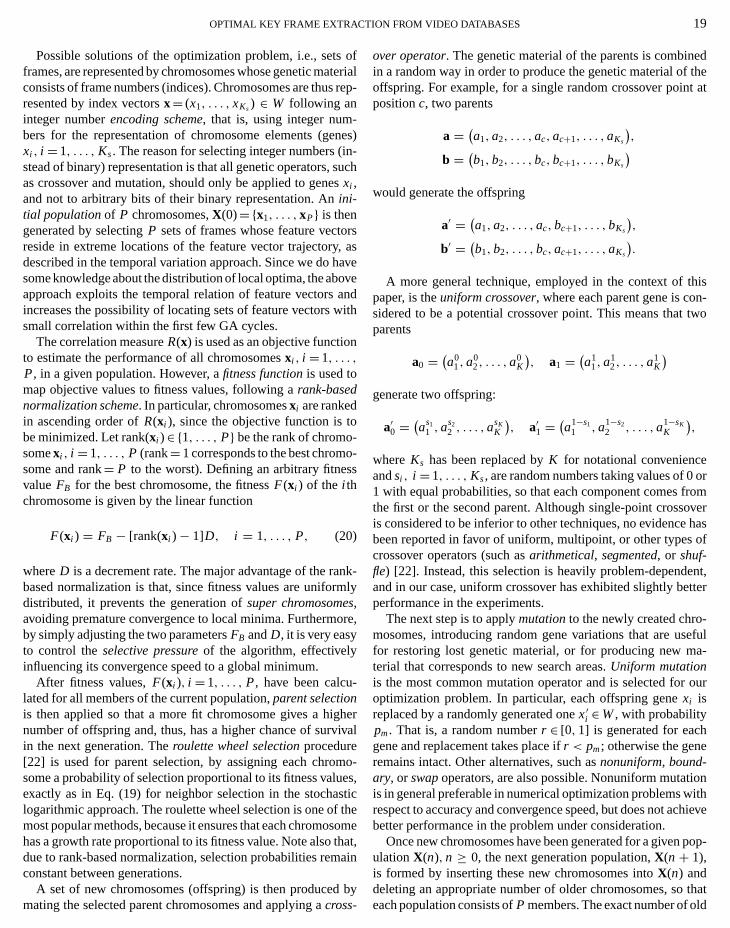
h
w
-
r
f
t
edthet at
hisn-two
orromverhasof
nt,tter
-efula-
our
onithhieve
pop-
OPTIMAL KEY FRAME EXTRAC
Possible solutions of the optimization problem, i.e., setsframes, are represented by chromosomes whose genetic maconsists of frame numbers (indices). Chromosomes are thusresented by index vectorsx= (x1, . . . , xKs) ∈ W following aninteger numberencoding scheme, that is, using integer numbers for the representation of chromosome elements (gexi , i = 1, . . . , Ks. The reason for selecting integer numbers (stead of binary) representation is that all genetic operators,as crossover and mutation, should only be applied to genexi ,and not to arbitrary bits of their binary representation. Anini-tial populationof P chromosomes,X(0)={x1, . . . , xP} is thengenerated by selectingP sets of frames whose feature vectoreside in extreme locations of the feature vector trajectorydescribed in the temporal variation approach. Since we dosome knowledge about the distribution of local optima, the abapproach exploits the temporal relation of feature vectorsincreases the possibility of locating sets of feature vectorssmall correlation within the first few GA cycles.
The correlation measureR(x) is used as an objective functioto estimate the performance of all chromosomesxi , i = 1, . . . ,P, in a given population. However, afitness functionis used tomap objective values to fitness values, following arank-basednormalization scheme. In particular, chromosomesxi are rankedin ascending order ofR(xi ), since the objective function is tbe minimized. Let rank(xi )∈ {1, . . . , P} be the rank of chromosomexi , i = 1, . . . , P (rank= 1 corresponds to the best chromsome and rank= P to the worst). Defining an arbitrary fitnesvalueFB for the best chromosome, the fitnessF(xi ) of the i thchromosome is given by the linear function
F(xi ) = FB − [rank(xi )− 1]D, i = 1, . . . , P, (20)
whereD is a decrement rate. The major advantage of the rabased normalization is that, since fitness values are unifodistributed, it prevents the generation ofsuper chromosomes,avoiding premature convergence to local minima. Furthermby simply adjusting the two parametersFB andD, it is very easyto control theselective pressureof the algorithm, effectivelyinfluencing its convergence speed to a global minimum.
After fitness values,F(xi ), i = 1, . . . , P, have been calculated for all members of the current population,parent selectionis then applied so that a more fit chromosome gives a hignumber of offspring and, thus, has a higher chance of survin the next generation. Theroulette wheel selectionprocedure[22] is used for parent selection, by assigning each chrosome a probability of selection proportional to its fitness valuexactly as in Eq. (19) for neighbor selection in the stochalogarithmic approach. The roulette wheel selection is one omost popular methods, because it ensures that each chromohas a growth rate proportional to its fitness value. Note alsodue to rank-based normalization, selection probabilities remconstant between generations.
A set of new chromosomes (offspring) is then producedmating the selected parent chromosomes and applying across-
TION FROM VIDEO DATABASES 19
ofterialrep-
-nes)in-suchs
rs, asave
oveandith
n
o
o-s
nk-mly
ore,
-
herival
mo-es,sticthesomehat,ain
over operator. The genetic material of the parents is combinin a random way in order to produce the genetic material ofoffspring. For example, for a single random crossover poinpositionc, two parents
a = (a1,a2, . . . ,ac,ac+1, . . . ,aKs
),
b = (b1, b2, . . . ,bc, bc+1, . . . ,bKs
)would generate the offspring
a′ = (a1,a2, . . . ,ac, bc+1, . . . ,bKs
),
b′ = (b1, b2, . . . ,bc,ac+1, . . . ,aKs
).
A more general technique, employed in the context of tpaper, is theuniform crossover, where each parent gene is cosidered to be a potential crossover point. This means thatparents
a0 =(a0
1,a02, . . . ,a
0K
), a1 =
(a1
1,a12, . . . ,a
1K
)generate two offspring:
a′0 =(as1
1 ,as22 , . . . ,a
sKK
), a′1 =
(a1−s1
1 ,a1−s22 , . . . ,a1−sK
K
),
whereKs has been replaced byK for notational convenienceandsi , i = 1, . . . , Ks, are random numbers taking values of 01 with equal probabilities, so that each component comes fthe first or the second parent. Although single-point crossois considered to be inferior to other techniques, no evidencebeen reported in favor of uniform, multipoint, or other typescrossover operators (such asarithmetical, segmented, or shuf-fle) [22]. Instead, this selection is heavily problem-dependeand in our case, uniform crossover has exhibited slightly beperformance in the experiments.
The next step is to applymutationto the newly created chromosomes, introducing random gene variations that are usfor restoring lost genetic material, or for producing new mterial that corresponds to new search areas.Uniform mutationis the most common mutation operator and is selected foroptimization problem. In particular, each offspring genexi isreplaced by a randomly generated onex′i ∈W, with probabilitypm. That is, a random numberr ∈ [0, 1] is generated for eachgene and replacement takes place ifr < pm; otherwise the generemains intact. Other alternatives, such asnonuniform, bound-ary, or swapoperators, are also possible. Nonuniform mutatiis in general preferable in numerical optimization problems wrespect to accuracy and convergence speed, but does not acbetter performance in the problem under consideration.
Once new chromosomes have been generated for a givenulationX(n), n ≥ 0, the next generation population,X(n+ 1),is formed by inserting these new chromosomes intoX(n) and
bydeleting an appropriate number of older chromosomes, so thateach population consists ofP members. The exact number of old
S
s
c
d
t-a
r
o
achows
chtill,ing
emae-tiont canf theilar
ininglied,
thisn
n ins in
s ofred
uesrch,ot-
reelueeticthech
t re-t isctiveon
20 AVRITHI
chromosomes to be replaced by new ones defines thereplace-ment strategyof the GA and greatly affects its convergence raAn elitist strategy has been selected for replacement, whesmall percentage of the best chromosomes is copied intosucceeding generation, together with their offspring, improvthe convergence speed of the algorithm [13]. Several GAcles take place by repeating the procedures of fitness evaluaparent selection, crossover, and mutation, until the populaconverges to an optimal solution. The GA terminates whenbest chromosome fitness remains constant for a large numbgenerations, indicating that further optimization is unlikely.
5. EXPERIMENTAL RESULTS
An MPEG video database consisting of real life videoquences is used in the following to test the performance ofproposed algorithm. The database consists of video sequentotal duration about 3.5 h and includes several shots of newsgrams, films, commercials, sports, and cartoons. The sequehave been encoded using the Optibase Fusion MPEG encoa bitrate of 2 Mbits/s. The shot detection and feature extracalgorithms have been applied offline to all sequences, soall information regarding the shot change instances, as wethe feature vector representation of all frames, is stored indatabase and is readily available. Hence, the key frame extion algorithms are separately performed on each shot, udirectly the feature vectors of all frames within the respecshot. The feature domains are partitioned inQ= 3 classes using three triangular membership functions with 50% overlso that the total feature vector length isQLc + QLm = 972 forLc= 6 andLm= 5, as mentioned in Section 2.3. The numbekey frames for the cross-correlation methods is determinethe integer part of half the number obtained from the tempvariation approach. This selection gives satisfactory resultmost cases, as mentioned in Subsection 3.2.
One shot of the database is used for demonstration of theformance of the proposed techniques. The shot, coming fro
test drive sequence and consisting ofNs= 223 frames, is illus-tratedfunction of frame feature vectors. Other criteria, which take ac-aluate the
in Fig. 14. One every 10 frames is depicted, resulting in 23count of human perception, can also be used to evFIG. 14. Test drive seq
ET AL.
te.re athe
ingcy-tion,tiontheer of
e-thees ofpro-nceser at
tionthatll asthe
trac-singive
p,
ofd asral
s in
per-m a
frame thumbnails. The results of the temporal variation approon this shot are presented in Fig. 15. In particular, Fig. 15a shthe magnitude of the second windowed derivative,|D(k)|, versusthe frame number,k. The variation of|D(k)| denotes that, dueto the complexity of the shot, the feature vector manifold is mumore complex than that of the synthetic example of Fig. 9b. Sthe smoothness of the curve is maintained, due to the windowprocedure described in Section 3; this ensures that local extrof |D(k)|, shown with small circles in Fig. 15a, actually corrspond to variations of the shot content and not to segmentanoise. The seven selected frames are depicted in Fig. 15b. Ibe seen that these frames provide sufficient visualization ototal 223 frames of the shot. Some of them, however, are simto each other (e.g., #30 and #55). For this reason, the remaimplementations of the cross-correlation approach are appconsidering a smaller number of key frames; in particular,Ks
is determined using the rule mentioned above. However, inspecific experiment,Ks= 4 (slightly greater) was selected iorder to sufficiently describe the visual content of the shot.
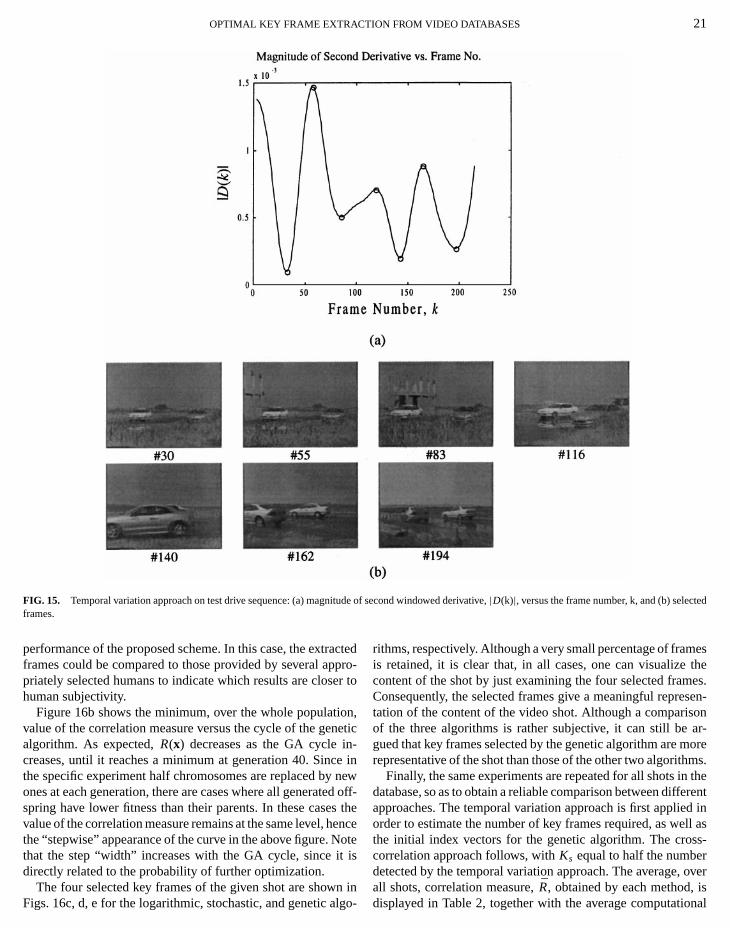
The results of the cross-correlation approach are showFig. 16. In order to estimate the performance of the algorithmterms of the obtained correlation measureR(x), a test of 100,000random index vectors is first performed, and a histogram ofR(x)is constructed, as depicted in Fig. 16a. The optimal valueR(x) obtained through the three algorithms are then compato the minimum value of the histogram. In Fig. 16a, these valare shown with a vertical dashed line for the logarithmic seaa vertical solid line for the stochastic version, and a vertical dted line for the genetic algorithm. It is first observed that all thalgorithms return values that are lower than the minimum vaof the histogram. Second, it is clearly shown that the genalgorithm provides much more accurate results. Actually,minimum value obtained through the genetic algorithm is mulower than that of the random test, although the random tesquires about 100 times more computational time. Finally, iillustrated that key frames are extracted, based on an objenumerical criterion, i.e., minimization of the cross correlati
uence, frames #0 to #220.
OPTIMAL KEY FRAME EXTRACTION FROM VIDEO DATABASES 21
u ted
a
e
onn
e
esthees.sen-
sonar-ore
ms.the
erentd inll asss-rover
FIG. 15. Temporal variation approach on test drive sequence: (a) magnitframes.
performance of the proposed scheme. In this case, the extrframes could be compared to those provided by several appriately selected humans to indicate which results are closhuman subjectivity.
Figure 16b shows the minimum, over the whole populativalue of the correlation measure versus the cycle of the gealgorithm. As expected,R(x) decreases as the GA cycle icreases, until it reaches a minimum at generation 40. Sincthe specific experiment half chromosomes are replaced byones at each generation, there are cases where all generatspring have lower fitness than their parents. In these casevalue of the correlation measure remains at the same level, hthe “stepwise” appearance of the curve in the above figure. Nthat the step “width” increases with the GA cycle, since itdirectly related to the probability of further optimization.
The four selected key frames of the given shot are showFigs. 16c, d, e for the logarithmic, stochastic, and genetic a
de of second windowed derivative,|D(k)|, versus the frame number, k, and (b) selec
ctedpro-r to
n,etic-e innewd off-
s theenceoteis
rithms, respectively. Although a very small percentage of framis retained, it is clear that, in all cases, one can visualizecontent of the shot by just examining the four selected framConsequently, the selected frames give a meaningful repretation of the content of the video shot. Although a compariof the three algorithms is rather subjective, it can still begued that key frames selected by the genetic algorithm are mrepresentative of the shot than those of the other two algorith
Finally, the same experiments are repeated for all shots indatabase, so as to obtain a reliable comparison between diffapproaches. The temporal variation approach is first applieorder to estimate the number of key frames required, as wethe initial index vectors for the genetic algorithm. The crocorrelation approach follows, withKs equal to half the numbedetected by the temporal variation approach. The average,
n inlgo-
all shots, correlation measure,̄R, obtained by each method, isdisplayed in Table 2, together with the average computational
22 AVRITHIS ET AL.
FIG. 16. Cross-correlation approach on test drive sequence: (a) histogram of correlation measureR(x), together with optimal values (dashed line, logarithmic;solid, stochastic; dotted, genetic); (b) minimum value ofR(x) versus cycle of genetic algorithm; (c) key frames (logarithmic); (d) key frames (stochastic); and
has
(e) key frames (genetic).
time, T̄ . As a conclusion, the genetic algorithm outperformthe other two methods in terms of both speed and accuracresults. Still, however, the temporal variation approach is v
useful, mainly as a preprocessing tool for estimation of the scomplexity.sy ofery
6. CONCLUSIONS
In this paper, an efficient video content representation
hotbeen presented for extracting a small but meaningful informa-tion of video data. Our study has been concentrated on extracting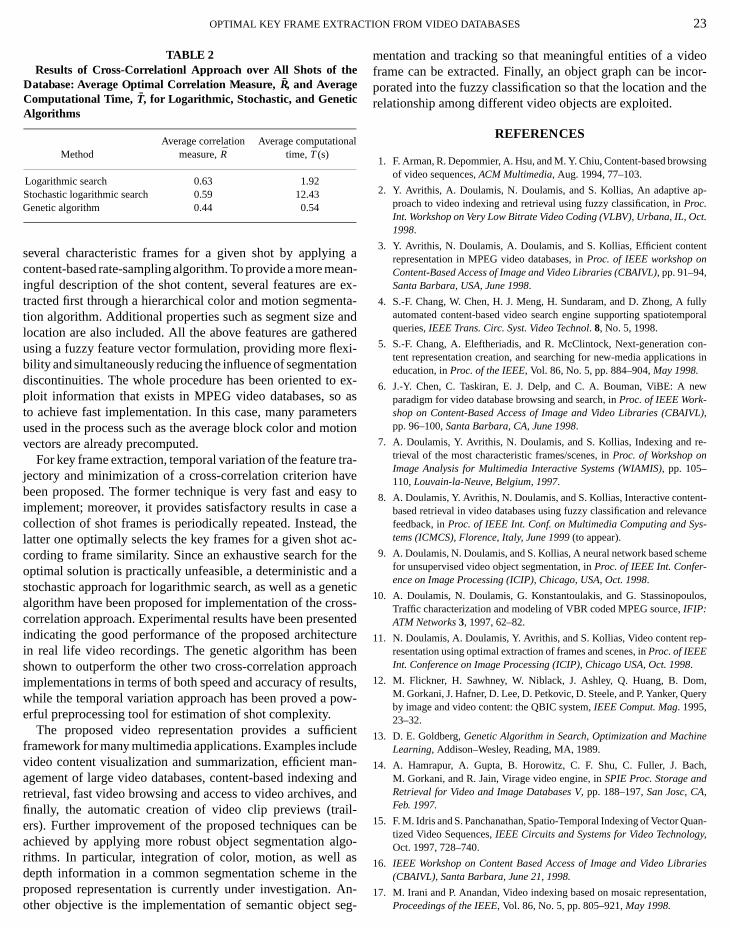
T
a
ge
naext
o
tr
tdn
t
au
i
a
inla
deocor-the
sing
p-
ct.
nt
fullyporal
con-ns in
ew
IVL)
re-
nt-vanceys-
eme
ulos,
ep-
m,uery
ine
ch,d,
uan-gy,
aries
OPTIMAL KEY FRAME EXTRAC
TABLE 2Results of Cross-Correlationl Approach over All Shots of the
Database: Average Optimal Correlation Measure, R-, and AverageComputational Time, T-, for Logarithmic, Stochastic, and GeneticAlgorithms
Average correlation Average computationMethod measure,̄R time, T̄(s)
Logarithmic search 0.63 1.92Stochastic logarithmic search 0.59 12.43Genetic algorithm 0.44 0.54
several characteristic frames for a given shot by applyincontent-based rate-sampling algorithm. To provide a more mingful description of the shot content, several features aretracted first through a hierarchical color and motion segmetion algorithm. Additional properties such as segment sizelocation are also included. All the above features are gathusing a fuzzy feature vector formulation, providing more flebility and simultaneously reducing the influence of segmentadiscontinuities. The whole procedure has been oriented toploit information that exists in MPEG video databases, soto achieve fast implementation. In this case, many parameused in the process such as the average block color and mvectors are already precomputed.
For key frame extraction, temporal variation of the featurejectory and minimization of a cross-correlation criterion habeen proposed. The former technique is very fast and easimplement; moreover, it provides satisfactory results in cascollection of shot frames is periodically repeated. Instead,latter one optimally selects the key frames for a given shotcording to frame similarity. Since an exhaustive search foroptimal solution is practically unfeasible, a deterministic anstochastic approach for logarithmic search, as well as a gealgorithm have been proposed for implementation of the crocorrelation approach. Experimental results have been preseindicating the good performance of the proposed architecin real life video recordings. The genetic algorithm has beshown to outperform the other two cross-correlation approimplementations in terms of both speed and accuracy of reswhile the temporal variation approach has been proved a perful preprocessing tool for estimation of shot complexity.
The proposed video representation provides a sufficframework for many multimedia applications. Examples incluvideo content visualization and summarization, efficient magement of large video databases, content-based indexingretrieval, fast video browsing and access to video archives,finally, the automatic creation of video clip previews (traers). Further improvement of the proposed techniques caachieved by applying more robust object segmentation arithms. In particular, integration of color, motion, as welldepth information in a common segmentation scheme in
proposed representation is currently under investigation. Aother objective is the implementation of semantic object seION FROM VIDEO DATABASES 23
l
aan-ex-ta-ndredi-ionex-asterstion
a-vey toe atheac-hea
eticss-ntedureenchlts,
ow-
entden-and
andl-
bego-sthe
mentation and tracking so that meaningful entities of a viframe can be extracted. Finally, an object graph can be inporated into the fuzzy classification so that the location andrelationship among different video objects are exploited.
REFERENCES
1. F. Arman, R. Depommier, A. Hsu, and M. Y. Chiu, Content-based browof video sequences,ACM Multimedia, Aug. 1994, 77–103.
2. Y. Avrithis, A. Doulamis, N. Doulamis, and S. Kollias, An adaptive aproach to video indexing and retrieval using fuzzy classification, inProc.Int. Workshop on Very Low Bitrate Video Coding (VLBV), Urbana, IL, O1998.
3. Y. Avrithis, N. Doulamis, A. Doulamis, and S. Kollias, Efficient conterepresentation in MPEG video databases, inProc. of IEEE workshop onContent-Based Access of Image and Video Libraries (CBAIVL), pp. 91–94,Santa Barbara, USA, June 1998.
4. S.-F. Chang, W. Chen, H. J. Meng, H. Sundaram, and D. Zhong, Aautomated content-based video search engine supporting spatiotemqueries,IEEE Trans. Circ. Syst. Video Technol. 8, No. 5, 1998.
5. S.-F. Chang, A. Eleftheriadis, and R. McClintock, Next-generationtent representation creation, and searching for new-media applicatioeducation, inProc. of the IEEE, Vol. 86, No. 5, pp. 884–904,May 1998.
6. J.-Y. Chen, C. Taskiran, E. J. Delp, and C. A. Bouman, ViBE: A nparadigm for video database browsing and search, inProc. of IEEE Work-shop on Content-Based Access of Image and Video Libraries (CBA,pp. 96–100,Santa Barbara, CA, June 1998.
7. A. Doulamis, Y. Avrithis, N. Doulamis, and S. Kollias, Indexing andtrieval of the most characteristic frames/scenes, inProc. of Workshop onImage Analysis for Multimedia Interactive Systems (WIAMIS), pp. 105–110,Louvain-la-Neuve, Belgium, 1997.
8. A. Doulamis, Y. Avrithis, N. Doulamis, and S. Kollias, Interactive contebased retrieval in video databases using fuzzy classification and relefeedback, inProc. of IEEE Int. Conf. on Multimedia Computing and Stems (ICMCS), Florence, Italy, June 1999(to appear).
9. A. Doulamis, N. Doulamis, and S. Kollias, A neural network based schfor unsupervised video object segmentation, inProc. of IEEE Int. Confer-ence on Image Processing (ICIP), Chicago, USA, Oct. 1998.
10. A. Doulamis, N. Doulamis, G. Konstantoulakis, and G. StassinopoTraffic characterization and modeling of VBR coded MPEG source,IFIP:ATM Networks3, 1997, 62–82.
11. N. Doulamis, A. Doulamis, Y. Avrithis, and S. Kollias, Video content rresentation using optimal extraction of frames and scenes, inProc. of IEEEInt. Conference on Image Processing (ICIP), Chicago USA, Oct. 1998.
12. M. Flickner, H. Sawhney, W. Niblack, J. Ashley, Q. Huang, B. DoM. Gorkani, J. Hafner, D. Lee, D. Petkovic, D. Steele, and P. Yanker, Qby image and video content: the QBIC system,IEEE Comput. Mag. 1995,23–32.
13. D. E. Goldberg,Genetic Algorithm in Search, Optimization and MachLearning, Addison–Wesley, Reading, MA, 1989.
14. A. Hamrapur, A. Gupta, B. Horowitz, C. F. Shu, C. Fuller, J. BaM. Gorkani, and R. Jain, Virage video engine, inSPIE Proc. Storage anRetrieval for Video and Image Databases V, pp. 188–197,San Josc, CAFeb. 1997.
15. F. M. Idris and S. Panchanathan, Spatio-Temporal Indexing of Vector Qtized Video Sequences,IEEE Circuits and Systems for Video TechnoloOct. 1997, 728–740.
16. IEEE Workshop on Content Based Access of Image and Video Libr(CBAIVL), Santa Barbara, June 21, 1998.
n-g-17. M. Irani and P. Anandan, Video indexing based on mosaic representation,
Proceedings of the IEEE, Vol. 86, No. 5, pp. 805–921,May 1998.
S
e,
ts
o
i
i
u
e
ma-
and
SSP)
ieval,
f videos
ased
Re-
s]
al
deom-
24 AVRITHI
18. D. Kalogeras, N. Doulamis, A. Doulamis, and S. Kollias, Very low bit-racoding of image sequences using adaptive regions of interest, inIEEE Trans.Circuits and Systems for Video Technology, Vol. 8, No. 8, pp. 928–934,Dec.1998.
19. B. Kosko,Neural Networks and Fuzzy Systems: A Dynamical SystApproach to Machine Intelligence, Prentice–Hall, Englewood Cliffs, NJ1992.
20. C.-S. Li, R. Mahan, and J. Smith, Multimedia content description ininfopyramid, in Proc. of IEEE International Conference on AcousticSpeech and Signal Processing (ICASSP), pp. 3789–3792,Seattle, WA,May 1998.
21. W. Y. Ma and B. S. Manjunath, Netra: A Toolbox for navigating large imadatabases, inProc. of ICIP, Santa Barbara, CA, Oct. 1997.
22. Z. Michalewicz,Genetic Algorithms+Data Structures=Evolution Pro-grams, Springer-Verlag, New York/Berlin, 1994.
23. M. Mills, J. Cohen, and Y. Y. Wong, A magnifier tool for videdata, inProc. ACM Computer Human Interface (CHI), pp. 93–98,May1992.
24. O. J. Morris, M. J. Lee, and A. G. Constantinides, Graph theory forage analysis: An approach based on the shortest spanning tree, inIEEEProceedings, Vol. 133, pp. 146–152,April 1986.
25. MPEG Video Group, MPEG-4 Video Verification Model-Version 2.1,ISO/IEC/JTCI/SC29/WG11, May 1996.
26. MPEG-7: Context and Objectives (v.5), inISO/IEC/JTC1/SC29/WG11N1920 MPEG-7, Oct. 1997.
27. P. J. Mulroy, Video content extraction: Review of current automasegmentation algorithms, inProc. of Workshop on Image Analysis anMultimedia Interactive Systems (WIAMIS), Louvain-la-Neuve, BelgiJune 1997.
28. J. Nam and A. Tewfik, Progressive resolution motion indexing of vidobject, inProc. of IEEE International Conference on Acoustics, Speand Signal Processing (ICASSP), Seattle, USA, May 1998.
29. N. V. Patel and I. K. Sethi, Video shot detection and characterizationvideo databases,Pattern Recognition30, No. 4, 1997, 583–592.
tion
ET AL.
te
ms
he,
ge
m-
n
ticdm,
eoch
30. A. Pentland, R. W. Picard, and S. Sclaroff, Photobook: Content-basednipulation of image databases,Int. J. Comput. Vision18, No. 3, 1996,233–254.
31. Y. Rui, T. S. Huang, and S.-F. Chang, Digital image/video libraryMPEG-7: Standardization and research issues, inProc. of IEEE Interna-tional Conference on Acoustics, Speech and Signal Processing (ICA,pp. 3785–3788,Seattle, WA, May 1998.
32. Y. Rui, T. S. Huang, and S. Mehrotra, Content-based image retrwith relevance feedback in MARS, inProc. of ICIP, Santa Barbara, CAOct. 1997.
33. B. Shahraray, Scene change detection and content-based sampling osequences, inProc. of SPIE 2419: Digital Video Compression: Algorithmand Technologies, pp. 2–13,Feb. 1995.
34. T. Sikora, The MPEG-4 video standard verification model, inIEEE Trans.Circuits Systems Video Technol.7, No. 1, 1997, 19–31.
35. J. R. Smith and S. F. Chang, VisualSEEk: A fully automated content-bimage query system,ACM Multimedia Conf., pp. 87–98,Boston, MA, Nov.1996.
36. S. W. Smoliar and H. J. Zhang, Content-Based Video Indexing andtrieval, IEEE Multimedia, Summer 1994, 62–72.
37. V. N. Gudivada and J. V. Raghavan (Guest Eds.),IEEE Comput. Mag. 28,No. 9, 1995. [Special Issue on Content-Based Image Retrieval System
38. R. Jain (Guest Ed.),Comm. ACM, Dec. 1997. [Special Issue on VisuInformation Management]
39. A. M. Tekalp,Digital Video Processing, Prentice-Hall, 1995.
40. N. Vasconcelos and A. Lippman, A spatiotemporal motion model for visummarization, inProc. of IEEE Computer Society Conference on Coputer Vision and Pattern Recognition (CVPR), pp. 361–366,Santa Barbara,CA, June 1998.
41. B. L. Yeo and B. Liu, Rapid scene analysis on compressed videos,IEEETrans. Circuits Systems Video Technol. 5, 1995, 533–544.
42. M. M. Yeung and B.-L. Yeo, Video visualization for compact presenta
for and fast browsing of pictorial content,IEEE Trans. Circuits Systems VideoTechnol. 7, No. 5, 1997, 771–785.