
Recovery Capital, Addiction Theory, and the Development of Recovery Communities

European Journal of Operational Research 160 (2005) 268–287
www.elsevier.com/locate/dsw
O.R. Applications
A stochastic approach to a case study for productrecovery network design
Ovidiu Listes� 1, Rommert Dekker *
Erasmus University Rotterdam, Econometric Institute, P.O. Box 1738, 3000 DR Rotterdam, The Netherlands
Received 29 March 2001; accepted 10 April 2003
Available online 27 November 2003
Abstract
Uncertainty is one of the characteristics of product recovery networks. In particular the strategic design of their
logistic infrastructure has to take uncertain information into account. In this paper we present a stochastic pro-
gramming based approach by which a deterministic location model for product recovery network design may be ex-
tended to explicitly account for the uncertainties. Such a stochastic model seeks a solution which is appropriately
balanced between some alternative scenarios identified by field experts. We apply the stochastic models to a repre-
sentative real case study on recycling sand from demolition waste in The Netherlands. The interpretation of the results
is meant to give more insight into decision-making under uncertainty for reverse logistics.
� 2003 Elsevier B.V. All rights reserved.
Keywords: Facility location; Reverse logistics; Recycling; Uncertainty; Stochastic programming
1. Introduction
The design of product recovery networks is one of the challenging and actual reverse logistics problems.
Stimulated by environmental, legislative and economical reasons, several recovery networks have been set
up in the last decade. Besides paper and glass, nowadays building waste, white-and-brown goods, electricand electronic equipment are being collected for recycling in The Netherlands and other countries in
Europe. The set-up of a product recovery network is however, not similar to that of a forward logistic
network. Fleischmann et al. (2000) state that product recovery not only reverses the product stream with
the consequence that there are many supply sources and few demand points, but that the design is severely
complicated by the high uncertainty in many factors. This is especially true for those recovery networks that
are driven by legislative or environmental reasons (typically for Western Europe). In this case there is large
uncertainty where the recovered product should go to and moreover, some supply may leak away to less
* Corresponding author.
E-mail addresses: [email protected] (O. Listes�), [email protected] (R. Dekker).1 Present address: Department of Operations Research, Tilburg University, P.O. Box 90153, 5000 LE Tilburg, The Netherlands.
0377-2217/$ - see front matter � 2003 Elsevier B.V. All rights reserved.
doi:10.1016/j.ejor.2001.12.001

O. Listes�, R. Dekker / European Journal of Operational Research 160 (2005) 268–287 269
costly disposal alternatives. Furthermore often new technology is developed for recycling, with the con-sequence that realized cost figures can deviate substantially from the foreseen values.
The design of logistic networks has long been the application of location models within operations
research (see Geoffrion and Powers, 1995). Several algorithmic developments coupled with increases in
computer speed now allow us to solve real-world problems to (almost) optimality with commercial software
like GAMS or CPLEX (see Brooke et al., 1988; ILOG, 1999). The expectations on the modeling however,
have gone up with these developments and the handling of uncertainty is one of the aspects which needs to
be tackled, especially in reverse logistic networks. A standard way to tackle uncertainty is to do a single or
multi-parameter sensitivity analysis (see Morgan and Henrion, 1990), which gives insight into how thesolution and the costs change if one or more input parameters are varied. This approach can be extended by
introducing scenarios for the input parameters and finding the individual solution that performs best over
the set of scenarios. The drawback of these approaches, however, is that they stick to solutions which are
optimal for at least one set of parameters. Kall and Wallace (1994) claim that stochastic programming
techniques offer more flexibility for handling uncertainty and can come up with solutions that can not be
found by scenario analysis. The application of stochastic programming to integer location problems is
however a challenging research subject. Stochastic integer models are well-known for their computational
intractability, since they combine two types of models which are by themselves difficult to solve. Besidestheoretical developments, important algorithmic approaches have also been proposed, but the instances
they can address seem still quite limited in size. Moreover, there are only few applications of stochastic
programs to location problems. A representative example is a branch and cut procedure proposed by
Laporte et al. (1994) for solving a location problem with stochastic demands. This procedure is repetitively
applied to a large number of smaller sized instances of the problem, obtained by parametric variation of
some other parameters (different than demand), one parameter at a time.
To the best of our knowledge stochastic programming is hardly applied to practical situations of logistic
network design. In this paper we present a stochastic programming based approach by which a large-scalelocation model for product recovery network design may be extended to account for uncertainties. We
apply the stochastic models to a case study concerning the recycling of sand from demolition waste, which
was done some years ago (see Barros et al., 1998). Although there was quite some uncertainty involved in
this case, it was previously tackled by scenario analysis only. As in addition to data, we have some real
information on the uncertain aspects, the stochastic programming models are employed for explicitly
taking this information into account. Since the aim is to develop insights for problems with real-world
dimension, the construction of the stochastic models deliberately follows a rather simple technique, which
may be potentially used to extend in a reasonable manner any large location model in which uncertainty isan issue and a relatively small set of realistic scenarios can be identified. For an extensive modeling oriented
discussion of stochastic location problems we refer the interested reader to the surveys in Louveaux (1986)
and Louveaux (1993).
This paper is structured as follows. In the next section we describe the case study in more detail. In
Section 3 we discuss the modeling of the problem and indicate how the deterministic location model may be
extended using stochastic programming techniques, according to the available information on the uncertain
factors. The results of the stochastic programming approach as applied to the presented case are discussed
in Section 4. Finally, Section 5 contains some concluding remarks.
2. Recycling of sieved sand: The case study
The case concerned the re-use of sieved sand originating from crushing and sieving of construction waste
in The Netherlands. This sand used to be landfilled, although it could be polluted with poly-aromatic
carbonates. This pollution also prevented an easy re-use of the sand. Legislation was adopted forbidding
270 O. Listes�, R. Dekker / European Journal of Operational Research 160 (2005) 268–287
landfilling of the sand and prescribing recycling. In order to achieve this, the syndicate of building wasteprocessors proposed the set-up of a network with depots storing the sand from the crushers. In the depots
the sand is tested on its pollution by an independent organization. Three categories of sand are distin-
guished, clean sand which can directly be used, half-clean sand, which can be applied in secured applica-
tions and finally polluted sand, which needs to be cleaned. Next cleaning facilities are envisaged to clean the
polluted sand. These involve high investments.
The problem was to get insight into the logistical costs with setting up such a network and to give advise
about locations of both the storage depots and the cleaning facilities. A facility location model was set-up
and solved by a combination of valid inequalities, heuristic rounding off procedures and iterative exactsolving of sub-problems. Excel, Turbo Pascal and GAMS software was used for methods and for input and
output of the data. The resulting software ran on a PC and was handed over to the syndicate to update the
advise when new data would become available (see Barros et al., 1998).
This case is representative for many product recovery networks as remarked by Fleischmann et al.
(2000). It has many sources, high investments costs for the recycling installation with the implication that
only few will be built, not yet tested recycling technology and unclear destinations of the recycled products.
Also the stream splitting is typical for reverse logistics. The aspect of two layers is often but not always the
case and it merely affects the solution procedures. Similar product recovery networks concern for instancecarpet recycling (see Ammons et al., 1999; Flapper et al., 1997). We therefore think that the results obtained
in this paper are of more general nature than just the case discussed here. The title reflects this tendency as
the aim is to gain insight into the general issue of product recovery network design through the framework
offered by this case.
3. Modeling
As mentioned, the case at hand concerns the design of a two-level network in which storage and cleaning
tasks are to be located across a set of potential sites (storage in regional depots and cleaning in treatment
facilities). This network is to extend existing supply sources and to direct recycled material to end use
demand points. The sources of sieved sand correspond to 33 existing sorting facilities. The lack of infor-
mation about future projects requiring sand was handled by selecting 10 strategic sites as potential points of
demand. These initial elements are represented in Fig. 1 (some triangles represent multiple sources).
The new facilities that must be created are regional depots for classifying the sand (86 potential sites) and
treatment facilities for cleaning the polluted sand (21 potential sites). Transport of sand throughout thenetwork can be done by water between reachable sites, which is much cheaper than by road, the mode
employed otherwise. The resulting network structure is schematically given in Fig. 2.
In the model set-up for this problem we use as objective function the net revenue computed as the value
of fees charged for sand entering the network plus the revenues from selling recycled sand to projects
minus various costs involved. These costs are fixed costs for opening the new facilities as well as vari-
able processing and transportation costs based on amounts of sand processed and respectively shipped
between sites. The objective function is determined on a yearly basis. Consequently annualized fixed costs
for opening new facilities are computed by amortizing the total investments over the planning horizon.Based on available technology for cleaning only one type of installation with rather high fixed costs was
possible. Nevertheless a case with several cleaning capacities could also be addressed by considering
treatment at each capacity as a separate investment option, probably associated with specific sites. For
simplicity the fixed costs of regional depots are assumed to vary as an affine function of their storage
capacity. Also processing costs depend only on the type of facility and transportation costs are proportional
to the amount and the distance over which it is transported. The underlying model can be verbally de-
scribed as

Fig. 1. Sorters and potential projects.
O. Listes�, R. Dekker / European Journal of Operational Research 160 (2005) 268–287 271
Maximize Net Revenue
¼ Feesþ Sales Revenue � Fixed opening costs� Transportation Costs� Processing Costs
Subject to: Balances of flows between sites
ðe:g: based on material shipped from depots to facilitiesÞContext specific constraints
ðstorage is allowed; demand may be partially satisfiedÞCapacity constraints ðupper boundsÞðon storage at depots and on processing at facilitiesÞ
This formulation slightly differs from the one in Barros et al. (1998) in order to allow for further
investigations rather than for setting a marketing perspective (see the discussion on stochastic modeling in
Louveaux (1986)). Its mathematical description can be found in Appendix A. The stochastic extensions
proposed below further concentrate on finding the appropriate location for the new facilities. The focus on
the location issue is motivated by the fact that investments are made on long run and are based on uncertaininformation. Since these networks are expensive and difficult to change, establishing a more robust location
for the new facilities becomes a central issue at stake. Therefore the models are primarily configured with
variable infrastructure to assess where to locate the new facilities, but they can be as well configured with all
the infrastructure fixed to investigate operational aspects of candidate network configurations.
3.1. Data and uncertainty
Important data used in implementations are presented in Table 1 (see Barros et al., 1998, for details).Especially when uncertainties are involved, a thorough data analysis is needed before going into the actual

Table 1
Data used in implementations
Description Value
Total available sand at sorters (initial estimation) 992,400 tons per year
Processing capacity of a cleaning facility 150,000 tons per year
Storing capacities of potential depots From 1200 to 240,000 tons per year
Fixed costs for opening a cleaning facility 4,057,125 Dfl per year
Fixed costs for opening a depot with 150,000 capacity 670,625 Dfl per year
Transportation costs by road 0.09 Dfl per ton per km
Transportation costs by water 0.02 Dfl per ton per km
Handling costs at regional depots 1 Dfl per ton
Processing costs at cleaning facilities 45.74 Dfl per ton
sieved sandat sorter
regional depot
store store treatment facility
store
clean sand half-clean sand
project
polluted sand
clean sand
Fig. 2. Sand network structure.
272 O. Listes�, R. Dekker / European Journal of Operational Research 160 (2005) 268–287
modeling phase. Among others, such analysis should establish the relations between the possible processingcapacities and the assumed range of supply levels, as well as the relations between the most likely levels of
supply and demand. This a priori analysis of the data is necessary in order to achieve model efficacy.
A characteristic of the sand problem is that the infrastructure to be created must be able to handle the
whole amount of sand coming from sorters. This kind of requirement originates in newly emerged legis-
lation and may apply as well to similar systems with different product features. The amount of material that
may be expected becomes therefore a very powerful driver of investments. Nevertheless the amount and
quality of the returned flows may be uncertain, because the initial quality mix is unknown and companies
may choose to recycle the sand in another way (the law prescribes recycling of sand, but not the method). Inparticular the actual supply may turn out to be (much) less than expected. We refer to the initial estimation
as the high supply case and besides this we also consider a low supply case deemed relevant for the given
capacity of a cleaning facility. The initial estimation was done for each source separately and as amounts
are decreased, it is done uniformly throughout these sources. The percentages of clean, half-clean and
respectively polluted sand are different in the two cases and induce different fees charged for the sand
entering the network. The two level supply setting (high versus low) should not be seen as an ‘‘end point’’
representation of a richer uniform distribution, but rather as a simple discrete distribution, relevant for the
given capacity of the expensive cleaning facilities (only 1 or 2 such facilities are expected to be build in ourcase). In general, if given one or more capacities multiple supply levels are deemed relevant, clearly all the
corresponding scenarios should be accounted for. Moreover, if probabilities are to be associated with them
in a non-symmetric distribution, this would be one more reason not to use only its end point values.

Table 2
Demand of sand in tons per year
Sand type Proj. 1 Proj. 2 Proj. 3 Proj. 4 Proj. 5 Proj. 6 Proj. 7 Proj. 8 Proj. 9 Proj. 10
Clean 80,000 50,000 50,000 0 80,000 50,000 80,000 0 80,000 200,000
Half-clean 50,000 50,000 75,000 90,000 60,000 50,000 100,000 50,000 100,000 150,000
O. Listes�, R. Dekker / European Journal of Operational Research 160 (2005) 268–287 273
Estimations of demand of each type of sand for the 10 potential projects considered are given in Table 2.In order to handle the lack of information about the location of the actual projects the following scenarios
were established:
Basis scenario: projects 3, 6, 7, 8 (overall)
Scenario 1: projects 2, 5, 8, 10 (south-west and north-east)
Scenario 2: projects 3, 8, 9 (along east region)
Scenario 3: projects 5, 6, 10 (center and south-west)
Scenario 4: projects 3, 9, 10 (center and south-east)Scenario 5: projects 1, 4, 6, 7, 9 (center and south)
Scenario 6: projects 2, 5, 8, 9, 10 (south-west, center and north-east)
In this way, demand varies not only in geographical distribution but also in total amounts of clean
respectively half-clean sand required. We note that the construction in Barros et al. (1998) is based on five
demand scenarios, illustrative for the scenario analysis method, while the one above follows the richer
original form in Scholten (1995), which takes two more scenarios with different network throughput into
consideration. The underlying assumption is that such scenarios may be established by experts in the fieldas representing reasonable future developments. The scenario generation has important implications at two
levels of discussion. Generally, the outcomes of any scenario based approach will depend on the input,
which in turn will rely on the experience and guidance of domain experts. It is therefore necessary that such
authorities identify critical scenarios and that the results are carefully interpreted relative to the scenario
definition. However, within any established scenario scheme, more robustness is expected to be achieved by
accounting for multiple alternatives than just for one or few possibilities.
3.2. The stochastic programming approach
Define U as the set of all possible scenarios and / 2 U as a particular scenario. The complete mathe-
matical description of the underlying deterministic model for scenario / is included in Appendix A. In
order to describe the main ideas of the stochastic approach we use here a concise notation for the deter-
ministic model: all the integer decision variables are included into one vector y of dimension m and all the
continuous decision variables are included into one vector x of dimension n. The notation for the coeffi-
cients is adjusted accordingly: f is the m-dimensional vector of the fixed costs for opening facilities and c isthe vector of dimension n containing the rest of the coefficients in the objective function. Then the concisedeterministic model for scenario / can be stated as
max � fy þ cð/Þxs:t: W0ð/Þx ¼ bð/Þ;
W1ð/Þx6 dð/Þ;Ty þ W2ð/Þx6 0;
y 2 f0; 1gm; x 2 Rn; xP 0;

274 O. Listes�, R. Dekker / European Journal of Operational Research 160 (2005) 268–287
where W0 is a n0 n matrix, b is a n0 vector, W1 is a n1 n matrix, d is a n1 vector, T is a m m matrix and
W2 is a m n matrix. The first group of constraints above corresponds to the equality constraints (SP) and
(A.3) in Appendix A, the second group corresponds to the inequalities (A.1), (A.2), (A.5) and (A.6), while
the third group corresponds to the constraints (A.7) and (A.8) in Appendix A, which also involve the
investment decisions y. Solutions given by this model for each scenario / separately form the basis for
scenario analysis (see Barros et al., 1998).
In a stochastic programming approach probabilities are associated with scenarios and a solution is
sought which is suitably balanced against the various scenarios (see Birge and Louveaux, 1997; Kall andWallace, 1994). The stochastic solution is not optimal in general for any of the individual scenarios. In a
context as considered here, the probabilities assigned to scenarios are of subjective nature. They can be as
well called weights and seen as reflecting a relative importance in an uncertain environment. However,
passing to a probability framework provides a convenient scheme for organizing ideas that mathematically
fall into the same patterns. Although subjective in nature, such probability specifications can support a
meaningful sensitivity analysis and guide the selection of an appropriate configuration. Generally, a sto-
chastic programming approach searches a solution relative to an assumed probabilistic data structure,
which may or may not reflect accurately the reality at a later moment, but should reflect as accurate aspossible the available information for present decisions. We use such an approach in the sequel to address
specific questions about the impact of demand/supply uncertainty on network design.
3.2.1. Locational uncertainty of demand
We denote by X the set of demand scenarios and by x a particular demand scenario (here U coinci-
des with X and / with x). Only the right hand side parameter d is determined to change in demand
scenarios.
In order to approach this locational uncertainty of demand we extend the deterministic model above tothe following two-stage stochastic model: the first stage corresponds to the investments that must be made
for opening facilities prior to knowing the actual realizations of the random parameters and the second
stage corresponds to the allocation of flows through the established network after the values of the random
parameters become known. Consequently the location variables y are assigned as first stage variables and
the allocation variables x are assigned as second stage variables. For each pair (y, x) the performance
measure is given by the second stage program as the maximum revenue that can be achieved in the network
given by location y and under scenario x. The decision y is evaluated this way across all scenarios and the
expected net revenue is recorded as the indicator of the decision. The first stage program aims then atmaximizing this indicator over the set of all possible first stage decisions. So the two-stage stochastic
programming model states as
max � fy þ Ex½Qðy;xÞ� where Qðy;xÞ ¼ max cx
s:t: y 2 f0; 1gm; s:t: W0x ¼ b;
W1x6 dðxÞ;W2x6 � Ty;
x 2 Rn; xP 0:
Clearly once a value of y is fixed in the first stage, second stage decisions depend on scenario and thus
variables x are likely to change under different realizations of x. Therefore when random parameters follow
(finite) discrete distributions it is useful to index the second stage variables by x in order to assess costs and
benefits in each situation. This creates a separate set of variables of the form xx for each scenario. Using this
explicit description of the second stage variables for all scenarios the problem can be stated in the following
extensive form (see Birge and Louveaux, 1997, for this term):

O. Listes�, R. Dekker / European Journal of Operational Research 160 (2005) 268–287 275
max � fy þ Ex½cxx�s:t: W0ðxÞxx ¼ b 8 x 2 X;
W1ðxÞxx 6 dðxÞ 8 x 2 X;
Ty þ W2ðxÞxx 6 0 8 x 2 X;
y 2 f0; 1gm;xx 2 Rn; xx P 0 8 x 2 X:
Since the expectation involved is in this case just an ordinary sum, the last formulation is a (large scale)
mixed integer linear programming model. This form was used for implementing the two-stage stochastic
model in two different variants: one with fixed low supply and uncertain demand, the other with fixed high
supply and uncertain demand.
3.2.2. Additional uncertainty of supply
We further consider a set N of supply scenarios, independent of demand scenarios, and denote by n a
particular supply scenario (here U ¼ N X and one individual scenario / consists of a possible combi-
nation (n, x) of supply–demand realizations). Although the independence assumption will not always hold
for two key sources of uncertainty, in many cases there is no pertinent information to support a dependence
assumption. In our case, the open loop network recycles sand from buildings demolition waste and pro-
duces raw material for construction of roads and bridges; the two economic activities are rather inde-
pendent. Moreover, the appropriateness of the independence assumption can be further supported by therelative magnitudes of supply and demand, which may characterize other networks as well. However, our
approach is also applicable in case of dependence assumption as long as the available data supports the
construction of a scenario tree. Generally, when building such a tree, the division of decision variables into
stages should be based on an a priori analysis of the relation between the available processing capacities and
the assumed dynamics of the supplying process. In our case, the incoming information about supply is
assumed to be revealed at the moment when the sorters will appear to comply with using the designed
network for recycling or (some of them) will possibly embrace other alternatives. The assumption of
complete information about supply (only) at the second stage is thus based as well on the legislativerequirements as on the suppliers behavior under such regulations.
In this case the solution given by one scenario with low supply realization may open few facilities and
thus be infeasible for other scenarios with high supply realization. On the other hand the solution given by
one scenario with high supply may open many facilities and thus be too costly for a scenario with low
supply. Therefore scenario analysis is not applicable in such a situation. Moreover a two-stage model is also
not appropriate, since it would ‘‘protect’’ the scenarios with high supply, that is it would open two cleaning
facilities and thus such a solution would be again too costly. A possible remedy could be to consider extra
costs for penalizing infeasibility. However such penalty costs are difficult to estimate in a meaningfulmanner and this is therefore less realistic. A multi-period model with the investment decisions indexed over
time periods would assume that the final level of supply was known at the first stage and this total amount
could be split over time periods in an a priori manner. The critical factor in our context is that investment
decisions must be already made at an earlier moment, based on partial information only, while the complete
information on supply is supposed to be revealed at a later moment and none of the final supply possi-
bilities can be actually ruled out.
In order to cope with this situation we used a three-stage stochastic programming model, in which
location decisions are made as well in the first stage as in the second stage, whereas the corresponding flowsdecisions are reserved for the third stage. Namely we assume that the common supply of low and high
scenarios has to be met in the first stage, after which the actual supply is expected to be revealed and

low
high
first
cleaning facility
+ corresponding
depots
second
cleaning facility
+ remaining
depots
s3
bs
s1
s2
s5
s4
s6
s3
bs
s1
s2
s4
s5
s6
Fig. 3. Scenario tree in the three-stage approach.
276 O. Listes�, R. Dekker / European Journal of Operational Research 160 (2005) 268–287
consecutive decisions have to be made if the supply is high. In either case the material is processed and sold
to projects in the third stage according to the seven demand scenarios, such that the overall expected
revenue is maximized. The situation is schematically rendered by the scenario tree in Fig. 3. Such a
modeling is not unrealistic since the cleaning facilities are likely to be built one by one rather than at the
same time, especially when there is no clear indication that a high amount will be supplied in once. In this
situation, the first cleaning facility is supposed to process as much as possible from the amount initially
supplied. If clarifying information indicated that also the remaining amount was to be supplied, this would
be processed as soon as a second cleaning facility was available. Clearly, all data assumptions have directimplications on the construction of the underlying scenario tree. Generally, the available information will
directly impact the generation of scenarios, which in turn will determine the quality of the solution ob-
tained.
Denoting by z, y the location decisions for the first and second stages respectively and by x the allocationdecisions in the third stage, the three stage stochastic programming model states as
max �fzþ En½Qðz; nÞ� where Qðz; nÞ ¼ max �fy þ Ex½Q0ðz; y; n;xÞ�s:t: z 2 f0; 1gm; s:t: y 2 f0; 1gm;
and respectively where
Q0ðz; y; n;xÞ ¼ max cðnÞxs:t: W0ðnÞx ¼ bðnÞ;
W1ðnÞx6 dðxÞ;W2ðnÞx6 � T ðz; yÞ;x 2 Rn; xP 0:
Here (z, y) is the 2m-dimensional vector obtained by concatenating z and y and T is a m0 2m matrix. The
last block of constraints also contains requirements that at each site one type of facility may be opened in at
most one stage. As indicated above, the parameters c, W0, b, W1, W2 depend on supply scenarios, whereas dstill depends on demand scenarios as before. Indexing y over n and x over (n, x) yields the following
extensive form, used for implementation:

O. Listes�, R. Dekker / European Journal of Operational Research 160 (2005) 268–287 277
max � fzþ En½�fyn þ Ex½cðnÞxn;x��s:t: W0ðnÞxn;x ¼ bðnÞ 8 n 2 N; 8 x 2 X;
W1ðnÞxn;x 6 dðxÞ 8 n 2 N; 8 x 2 X;
T ðz; ynÞ þ W2ðnÞxn;x 6 0 8 n 2 N; 8 x 2 X;
z 2 f0; 1gm;yn 2 f0; 1gm 8 n 2 N;
xn;x 2 Rn; xn;x P 0 8 n 2 N; 8 x 2 X:
This type of approach is not yet observed in the literature of logistic network design. Yet it arises
naturally in our context because decisions must be hedged against very different levels of return flows. As
this implies rather high risks if approached in just one step, the decisions have to be split over time based onthe assumption that extra information may be gradually acquired. We therefore believe that given the
information we have on the uncertainty, the three stage model above is the appropriate approach in this
case. Moreover we think that such a multi-stage approach may also shed light on more efficient design of
similar product recovery networks as well as in other situations where (forward) logistic networks are to be
developed stepwise over time.
3.2.3. Implementation
We used GAMS as modeling language and the mixed integer solver from CPLEX6.5 commercialsoftware for all the variants of the problem (see Brooke et al., 1988; ILOG, 1999). The original models were
extended with several valid inequalities, e.g. expressing logical relations between the continuous flow be-
tween two sites and the integral indicators associated to those sites (see Barros et al., 1998). Priority orders
on branching were assigned to the integer variables. In the two stage models a higher priority was assigned
to the variables corresponding to the cleaning facilities. In the three stage model four levels were distin-
guished with priorities decreasing in the following order: cleaning facilities first stage, cleaning facilities
second stage, depots first stage, depots second stage.
The underlying deterministic model for each scenario and the two-stage stochastic models in extensiveform were solved on a Windows NT-based 450 MHz Pentium III PC with 128 MB of memory. The average
running time for separate scenarios was about 5 minutes. The solution time for the two-stage model was
about 3 and a half hours in the low supply case and about 11 hours in the high supply case. The three-stage
model was solved on a Sun Enterprize 250 Ultra SPARC II-400 MHz UNIX system with 1 GB of memory
(shared resources). The CPU running time was about 28 hours. The second computational system features
a lower speed, but it was employed in the three-stage case for its capacity to handle larger sets of data
during the computation. Besides the models sizes, the tendency to extensive search is to large extent
explainable by the capacitated feature of the problem and by a relative symmetry of the potential sites interms of the costs they incur. Details on the implemented models are given in Table 3.
Table 3
Dimensions of the models and running times
Models Number of variables Number of constraints Running time
Integer Continuous Initial Valid inequalities
Original deterministic 107 6574 439 5064 5 minutes
Two-stage
low supply 107 46,018 3073 35,448 3 hours 30 minutes
high supply 11 hours
Three-stage 214 92,036 6146 70,896 28 hours

278 O. Listes�, R. Dekker / European Journal of Operational Research 160 (2005) 268–287
As uncertainty is explicitly incorporated, the resulting models are of large scale. Potential larger versionsof the problem could be addressed by aggregating sites from certain areas in order to reduce first the
problem size. When such an argument could not be applied satisfactorily, the solution approach would
need to be improved, such that larger scale instances to be solved in reasonable time. A decomposition
based approach, following for instance similar arguments as in Laporte et al. (1994), may be effective for
this.
Presently, we do not envision a model based on three or more stages to be run many times in order to
investigate robustness in parameter choices. This could be achieved more efficiently by using for example
multiple runs of two stage models with only one uncertain factor investigated at a time (the two stagemodels required significantly less computation time). However, we would remark that the rapid increase of
computational power coupled with continually improving optimization tools are expected to make sig-
nificant difference regarding computational efficiency in the near future.
4. Results
The results presented in the sequel are based on a sales price of 27 Dfl per ton of clean sand and 16 Dflper ton of half-clean sand, which are our estimations and can be interpreted as average values over time. It
is a general shortcoming of location models that the time value of money is not accounted for more
explicitly. In a stochastic setting prices may vary in scenarios. However, in the sand case investments are
mainly driven by legislation, and to a less extent by marketing perspective, such that variations in sales
prices are expected to have less influence on network layout. Accordingly less variations in the net revenues
are also expected (from this point of view our investigations differ from those reported by Realff et al.
(2000)). Therefore we focused on timing of stage decisions mainly based on the assumed amounts of
incoming flows. The charged fees depend on quality of supplied sand and significantly increase as qualitygets worse. Since the considered demand scenarios aim to reflect as different location situations of the
projects as possible, we applied two-stage models with equal probabilities in order to generate the most
balanced network configuration between these various situations. We note that the method perfectly allows
the assignment of different probabilities (if justified by data). However, in our case, if one demand scenario
was assigned a higher probability, the two-stage stochastic solution would closer resemble the individual
solution from that scenario, which was already known from scenario analysis, and the additional insight
obtained would be probably less significant.
4.1. High supply case
The amount of supplied sand equals in this case the initial estimation of 992,400 tons per year from
which 40% is clean (396,960 tons), 40% is half-clean (396,960 tons) and 20% is polluted (198,480 tons). The
charged fee corresponding to this quality amounts to 21.50 Dfl per ton (our estimation). Given the cleaning
capacity of 150,000 tons per year it turns out that two cleaning facilities have to be opened. Yet the number
of regional depots and the location of all the facilities are determined taking the seven demand scenarios
into account. The stochastic configuration differs from any of the optimal configurations of individualscenarios on both regional depots and cleaning facilities. It is illustrated in Fig. 4.
The stochastic solution yields a network with 19 regional depots, from which nine are accessible by
water. Given their rather small fixed costs, the regional depots handle locally the flows of sand. However,
besides the sources of sand, their location is now influenced by all the projects with the weights induced
together by the seven scenarios. Therefore mostly the sites which by their size and position are able to serve
efficiently several projects are retained in the stochastic solution. This effect is also illustrated by the fact
that more than 99% of the storage capacity of the opened depots is used. The optimal location of the

Fig. 4. Stochastic solution with high supply.
O. Listes�, R. Dekker / European Journal of Operational Research 160 (2005) 268–287 279
cleaning facilities for the individual scenarios and the stochastic solution are presented in Table 4. When
evaluating the stochastic configuration over each of the scenarios the following pattern is observed. The
cleaning facility located in Oosterhout (center west) handles scenario 6, where the two facilities handle
comparable yearly amounts, about 100,000 tons either. While the facility in Almelo is also frequent in
scenarios, the one in Oosterhout is not reproduced by any scenario. Instead it makes a necessary trade-offbetween the sites from center or center-west regions separately chosen in the scenarios.
Table 5 shows the differences between the revenue given by the optimal solution of each scenario and the
revenue given by the stochastic solution for the same scenario. The expected revenue generated by the
stochastic solution is 96.1% from the weighted average of individual optima (the hypothetical average
with perfect information). The worst case location for one scenario is the configuration taken from the
seven scenarios which generates the lowest revenue for that scenario. The corresponding values are given in
Table 4
Individual scenarios solutions and stochastic solution in high supply case
Cleaning facilities Scenarios Stochastic solution
bs s1 s2 s3 s4 s5 s6
Alblasserdam � � �Dongen �Oosterhout �Utrecht � � �Westervoort �Almelo � � � � � � �
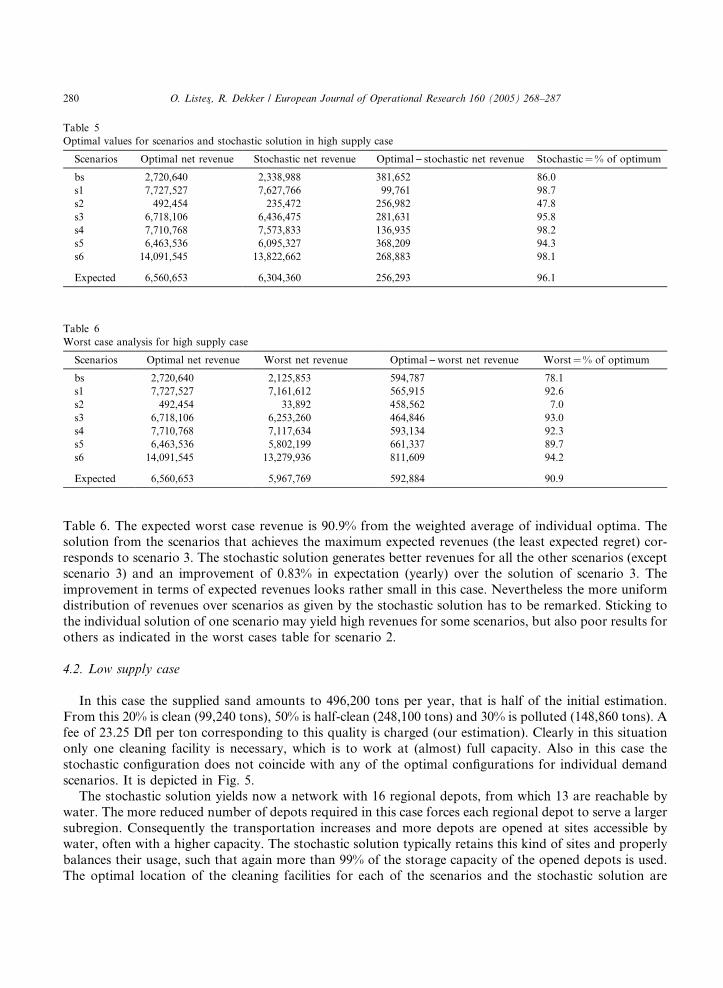
Table 5
Optimal values for scenarios and stochastic solution in high supply case
Scenarios Optimal net revenue Stochastic net revenue Optimal) stochastic net revenue Stochastic¼% of optimum
bs 2,720,640 2,338,988 381,652 86.0
s1 7,727,527 7,627,766 99,761 98.7
s2 492,454 235,472 256,982 47.8
s3 6,718,106 6,436,475 281,631 95.8
s4 7,710,768 7,573,833 136,935 98.2
s5 6,463,536 6,095,327 368,209 94.3
s6 14,091,545 13,822,662 268,883 98.1
Expected 6,560,653 6,304,360 256,293 96.1
Table 6
Worst case analysis for high supply case
Scenarios Optimal net revenue Worst net revenue Optimal)worst net revenue Worst¼% of optimum
bs 2,720,640 2,125,853 594,787 78.1
s1 7,727,527 7,161,612 565,915 92.6
s2 492,454 33,892 458,562 7.0
s3 6,718,106 6,253,260 464,846 93.0
s4 7,710,768 7,117,634 593,134 92.3
s5 6,463,536 5,802,199 661,337 89.7
s6 14,091,545 13,279,936 811,609 94.2
Expected 6,560,653 5,967,769 592,884 90.9
280 O. Listes�, R. Dekker / European Journal of Operational Research 160 (2005) 268–287
Table 6. The expected worst case revenue is 90.9% from the weighted average of individual optima. Thesolution from the scenarios that achieves the maximum expected revenues (the least expected regret) cor-
responds to scenario 3. The stochastic solution generates better revenues for all the other scenarios (except
scenario 3) and an improvement of 0.83% in expectation (yearly) over the solution of scenario 3. The
improvement in terms of expected revenues looks rather small in this case. Nevertheless the more uniform
distribution of revenues over scenarios as given by the stochastic solution has to be remarked. Sticking to
the individual solution of one scenario may yield high revenues for some scenarios, but also poor results for
others as indicated in the worst cases table for scenario 2.
4.2. Low supply case
In this case the supplied sand amounts to 496,200 tons per year, that is half of the initial estimation.
From this 20% is clean (99,240 tons), 50% is half-clean (248,100 tons) and 30% is polluted (148,860 tons). A
fee of 23.25 Dfl per ton corresponding to this quality is charged (our estimation). Clearly in this situation
only one cleaning facility is necessary, which is to work at (almost) full capacity. Also in this case the
stochastic configuration does not coincide with any of the optimal configurations for individual demand
scenarios. It is depicted in Fig. 5.The stochastic solution yields now a network with 16 regional depots, from which 13 are reachable by
water. The more reduced number of depots required in this case forces each regional depot to serve a larger
subregion. Consequently the transportation increases and more depots are opened at sites accessible by
water, often with a higher capacity. The stochastic solution typically retains this kind of sites and properly
balances their usage, such that again more than 99% of the storage capacity of the opened depots is used.
The optimal location of the cleaning facilities for each of the scenarios and the stochastic solution are

Fig. 5. Stochastic solution with low supply.
O. Listes�, R. Dekker / European Journal of Operational Research 160 (2005) 268–287 281
presented in Table 7. A stronger balancing effect is remarked here as the location of the only cleaning
facility in Utrecht (center of the country) makes a clear trade-off between the sites in center-west or east
regions preferred in the separate scenarios. Similarly to the previous case, values generated by the stochastic
solution and the worst cases are presented in Table 8 and respectively Table 9. In this case the expected
revenue generated by the stochastic solution is 95.6% from the weighted average of individual optima,
whereas the expected worst case revenue is 86.5% from the same amount. The solution taken from the
scenarios that achieves the maximum expected revenues (the least expected regret) corresponds in this caseto scenario 4. The stochastic solution generates better revenues for all the scenarios except scenarios 3 and 4
and an improvement of 2.31% in expectation (yearly) over the solution of scenario 4. The improvement in
terms of expected revenues is higher in this case, but still limited through the nature of the investigated
factors. The main gains remain a more robust configuration and a more uniform distribution of revenues
over scenarios as given by the stochastic solution.
Table 7
Individual scenarios solutions and stochastic solution in low supply case
Cleaning facilities Scenarios Stochastic solution
bs s1 s2 s3 s4 s5 s6
Westervoort � �Oosterhout �Utrecht �Alblasserdam � � � �

Table 8
Optimal values for scenarios and stochastic solution in low supply case
Scenarios Optimal net revenue Stochastic net revenue Optimal) stochastic net revenue Stochastic¼% of optimum
bs 3,389,774 3,316,781 72,993 97.8
s1 5,797,840 5,555,551 242,289 95.8
s2 1,322,112 1,095,451 226,661 83.0
s3 5,457,753 5,148,180 309,573 94.3
s4 5,723,589 5,485,855 237,734 95.8
s5 4,829,696 4,681,254 148,442 96.9
s6 5,874,306 5,680,799 193,507 96.7
Expected 4,627,867 4,423,410 204,457 95.6
Table 9
Worst case analysis for low supply case
Scenarios Optimal net revenue Worst net revenue Optimal)worst net revenue Worst¼% of optimum
bs 3,389,774 2,845,208 544,566 83.9
s1 5,797,840 5,133,495 664,345 88.5
s2 1,322,112 482,576 839,536 36.5
s3 5,457,753 4,750,406 707,347 87.0
s4 5,723,589 5,203,795 519,794 90.9
s5 4,829,696 4,303,279 526,417 89.1
s6 5,874,306 5,319,311 554,995 90.5
Expected 4,627,867 4,005,438 622,429 86.5
282 O. Listes�, R. Dekker / European Journal of Operational Research 160 (2005) 268–287
4.3. Three-stage approach
As explained in the modeling section, this case is based on the assumption that after opening some
facilities in a first stage, extra information about the actual supply can be acquired, based on which further
location decisions are to be made in a second stage. Namely we assume that at least a yearly amount of
496,200 tons (20% clean, 50% half-clean, 30% polluted) will be supplied and the remaining amount up to
992,400 tons (40% clean, 40% half-clean, 20% polluted) will be supplied or not with equal chances.
Therefore the overall problem states now differently: where to locate the first cleaning facility in the firststage such that the second treatment facility will be opened or not with 50–50% probability in the second
stage. Simultaneously with each cleaning facility a number of depots are opened, such that facilities opened
in the first stage are able to handle the low amount and facilities opened in both stages can handle the high
amount.
At this point we emphasize once again that the method allows for assigning different probabilities to the
scenarios. In our case, however, if one of the two scenarios was assigned a significantly higher probability,
the solution would probably resemble the one from the corresponding case with fixed supply, previously
analyzed.The stochastic solution given by the three-stage model is presented in Table 10, where also the stochastic
solutions from low and high supply cases are included for comparison (cleaning facilities only). Geo-
graphical distribution of the three-stage solution is depicted in Fig. 6. The cleaning facility opened in the
first stage (Alblasserdam) makes a clear trade-off between the cleaning facility in low supply case (Utrecht)
and the cleaning facility in the high supply case which works mostly at full capacity (Oosterhout). The
treatment facility opened in the second stage is the same as the one working mostly at one third of its

Table 10
Three-stage approach solution and two-stage solutions
Cleaning facilities Three-stage approach Stochastic low supply Stochastic high supply
First stage Second stage
Almelo � �Utrecht �Alblasserdam �Oosterhout �
Fig. 6. Stochastic solution in three-stage approach.
O. Listes�, R. Dekker / European Journal of Operational Research 160 (2005) 268–287 283
capacity in high supply case (Almelo). The regional depots opened in the first stage may be regarded asdivided in two groups: one group with higher capacities concentrate in the central part of the west region
and other group with smaller capacities is spread along the eastern border. The regional depots opened in
the second stage are mainly spread in the center and the central-east region. This configuration reflects once
again a generally unbalanced distribution of facilities in the sand problem.
If afterwards the supply turned out to be low, the investments made in the first stage would on one hand
yield an expected (with respect to demand) revenue of 4,372,300 Dfl, that is only 51,110 Dfl less than
expected revenue based on low supply assumption, but on the other hand would avoid an expected loss of
1,672,600 Dfl that occurred if excessively investing directly based on the high supply assumption (all figures
284 O. Listes�, R. Dekker / European Journal of Operational Research 160 (2005) 268–287
are on a yearly basis). In case afterwards the supply turned out to be high, the investments made in bothstages would on one hand generate an expected revenue of 6,273,100 Dfl, that is only 31,260 Dfl less than
expected revenue based on direct high supply assumption, but on the other hand would avoid a situation
with highly insufficient capacities based on low supply assumption (the avoided loss could be assessed in
such a case by means of penalties).
In order to give more clarity to our option for presenting the above setting, we briefly discuss an
alternative example. Suppose that after decisions have been made in the first stage, the supply at the second
stage was now found to be the rest up to a total of 744,300 tons per year with 35% clean (260,505 tons), 40%
half-clean (297,720 tons) and 25% polluted (186,075 tons). In such a case clearly a second cleaning facilitywould be opened next to the extra depots required to handle the additional incoming amount of sand as
compared with the 496,200 tons expected initially. Such a situation would not differ qualitatively from the
one with a total of 992,400 tons per year discussed above.
5. Conclusions
Generally the solutions obtained by stochastic programming approach for the sand case perform wellbased on interpreting the results through the initial premises of the problem: the recycling system is mainly
driven by legislation, the cleaning options are restricted through available technology to a single capacity
process and transportation can also be done by water at low costs. The first means in particular that the
whole amount of available material must be processed rather than collecting economically attractive
amounts. Therefore the number of newly opened facilities is mostly decided by the amount and the quality
of the incoming flows. On the other hand the location of the new facilities is twofold influenced by sources
and by demand points in a rather non-intuitive way. Moreover, since these factors include uncertainties,
finding a configuration which is likely to be more robust on a long run becomes the central investigatedissue. At high material volumes the network layout is more flexible with respect to demand location and the
improvement in terms of expected revenues based on the stochastic solution seems rather small. However
an essential aspect which must be emphasized is the capacitated feature of the problem. In particular we
deal with a treatment capacity which appears rather restrictive, especially relative to the high supply figures,
leading in this case to investments in considerable unused cleaning capacity. To this end it is worth
mentioning that future development of new technology enabling treatment at several capacities (and
possibly adjustment of the working levels resulted here) is highly desirable. At low material volumes the
network configuration seems more dependent on demand location and a balanced solution as generatedhere is particularly suitable. When more accurate information on material volumes is assumed to be
stepwise revealed, splitting decisions over time is proposed as an effective long run strategy. Especially in
this case the solution approach needs to be improved to allow for solving larger models in reasonable
running times. We have to remark that even in the cases where the explicit improvement in the objective
function is not spectacular, the stochastic approaches have the ability to generate qualitative different
solutions, which are particularly insightful.
Given the representative character of this case, the trends discussed are likely to apply more generally to
product recovery networks designed under similar conditions. Moreover the effectiveness of the type ofapproaches presented may be more striking under some circumstances, such as a larger area over which the
potential sites are spread out, several processing capacities or higher transportation costs.
The results presented in this paper point out that given the existing computational power and using an
adequate modeling it is nowadays possible to apply stochastic programming techniques to practical situ-
ations of logistic networks design. Important issues that this study uncovers are designing and imple-
menting more efficient algorithms for the arisen stochastic models, which may lead to a significant
improvement of the running times. These issues may form the subject of future research.

O. Listes�, R. Dekker / European Journal of Operational Research 160 (2005) 268–287 285
Appendix A. Mixed integer linear programming model for the sand recycling network design
We include here the underlying deterministic MILP model for the design of the sand network. The
formulation below slightly differs from the initial form in Barros et al. (1998). However the differences come
from technical reasons only and do not change the problem context. Therefore we refer to Barros et al.
(1998) for further details on modeling issues.
For the mathematical description of the model the following notation is used. First, the indices used to
distinguish the elements of the model are defined in Table 11. Table 12 describes the notation used for theparameters of the model. Similarly, the notation for the decision variables is given in Table 13.
Define U as the set of all possible scenarios and / 2 U as a particular scenario. Some parameters may
have different values for different scenarios. Therefore using the above notation the deterministic mixed
integer linear programming model for a particular scenario / states as
maxXmi¼1
Xn
j¼1
feeð/Þuij þXp
k¼1
Xq
l¼1
pr1wkl þXn
j¼1
Xq
l¼1
X2
s¼1
prsxjls ðSPÞ
�Xn
j¼1
fjyj �Xp
k¼1
gkzk �Xmi¼1
Xn
j¼1
aijuij �Xn
j¼1
Xp
k¼1
bjkvjk �Xp
k¼1
Xq
l¼1
cklwkl �Xn
j¼1
Xq
l¼1
X2
s¼1
ejlsxjls
s:t:Xn
j¼1
uij ¼ oið/Þ; i ¼ 1; . . . ;m; ðA:1Þ
Xn
j¼1
xjl1 þXp
k¼1
wkl 6 dl1ð/Þ; l ¼ 1; . . . ; q; ðA:2Þ
Xn
j¼1
xjl2 6 dl2ð/Þ; l ¼ 1; . . . ; q; ðA:3Þ
Xp
k¼1
vjk ¼ t3ð/ÞXmi¼1
uij; j ¼ 1; . . . ; n; ðA:4Þ
Xq
l¼1
xjls 6 tsð/ÞXmi¼1
uij; j ¼ 1; . . . ; n; s ¼ 1; 2; ðA:5Þ
Xq
l¼1
wkl 6
Xn
j¼1
vjk; k ¼ 1; . . . ; p; ðA:6Þ
ð1� t3ð/ÞÞXmi¼1
uij 6Hjyj; j ¼ 1; . . . ; n; ðA:7Þ
Xn
j¼1
vjk 6Rkzk; k ¼ 1; . . . ; p; ðA:8Þ
yj; zk 2 f0; 1g; j ¼ 1; . . . ; n; k ¼ 1; . . . ; p; ðA:9Þuij; vjk;wkl; xjls P 0; i ¼ 1; . . . ;m; j ¼ 1; . . . ; n; k ¼ 1; . . . ; p; l ¼ 1; . . . ; q; s ¼ 1; 2: ðA:10Þ
So this formulation also indicates which parameters are determined to change in the scenarios. In order to
strengthen the formulation the following valid inequalities may be included:
uij 6 min oið/Þ;Hj
1� t3ð/Þ
� �yj; i ¼ 1; . . . ;m; j ¼ 1; . . . ; n; ðA:11Þ

Table 11
Indices used in the model
Index Description Range
i Sources of sieved sand 1; . . . ;mj Potential regional depots sites 1; . . . ; nk Potential cleaning facilities sites 1; . . . ; pl Projects 1; . . . ; qs Type of sand: clean, half-clean, polluted 1, 2, 3
Table 12
Parameters of the model
Parameter Description
oi Supply of sand at the source i (in tons)
dls Demand of sand type s ¼ 1; 2 of project l (in tons)
ts Percentage from supply of sand type sfee fee charged for sand entering the network (in Dfl per ton)
prs Price of sand type s sold to projects (in Dfl per ton)
fj Fixed cost of opening regional depot j (in Dfl)
gk Fixed cost of opening cleaning facility k (in Dfl)
aij Sum of transportation costs between source i and regional depot j and processing costs at this depot (in Dfl per ton)
bjk Sum of transportation costs between regional depot j and cleaning facility k and processing costs at this treatment
facility (in Dfl per ton)
ckl Transportation costs between cleaning facility k and project l (in Dfl per ton)
ejls Transportation costs of sand type s ¼ 1; 2 between regional depot j and project l (in Dfl per ton)
Hj Maximal storage capacity of regional depot j (in tons)
Rk Maximal processing capacity of cleaning facility k (in tons)
Table 13
Decision variables
Variable Description Type
yj ¼ 1 if regional depot j is opened0 otherwise
�Integer {0,1}
zk ¼ 1 if cleaning facility k is opened0 otherwise
�Integer {0,1}
uij Amount of sieved sand shipped from sorting facility i to regional depot j (in tons) Continuous P 0
vjk Amount of polluted sand shipped from regional depot j to treatment facility k (in tons) Continuous P 0
wkl Amount of clean sand shipped from cleaning facility k to project l (in tons) Continuous P 0
xjls Amount of sand of type s ¼ 1, 2 shipped from regional depot j to project l (in tons) Continuous P 0
286 O. Listes�, R. Dekker / European Journal of Operational Research 160 (2005) 268–287
vjk 6 min t3ð/ÞXmi¼1
oið/Þ;Rk
( )zk; j ¼ 1; . . . ; n; k ¼ 1; . . . ; p; ðA:12Þ
wkl 6 minfdl1ð/Þ;Rkgzk; k ¼ 1; . . . ; p; l ¼ 1; . . . ; q; ðA:13Þ
xjls 6 min dlsð/Þ;tsð/Þ
1� t3ð/ÞHj
� �yj; j ¼ 1; . . . ; n; l ¼ 1; . . . ; q; s ¼ 1; 2: ðA:14Þ

O. Listes�, R. Dekker / European Journal of Operational Research 160 (2005) 268–287 287
References
Ammons, J.C., Realff, M.J., Newton, D., 1999. Carpet recycling: Determining the reverse production system design. The Journal of
Polymer-Plastics Technology and Engineering 38 (3), 547–567.
Barros, A.I., Dekker, R., Scholten, V., 1998. A two-level network for recycling sand: A case study. European Journal of Operational
Research 110 (2), 199–214.
Birge, J.R., Louveaux, F., 1997. Introduction to Stochastic Programming. Springer Series in Operations Research. Springer Verlag,
New York.
Brooke, A., Kendrick, D., Meeraus, D., 1988. GAMS, A User�s Guide. The Scientific Press, Redwood City, CA.
Flapper, S.D.P., Kip, B.J., Louwers, D., Peters, G., Souren, F., 1997. A location–allocation model for re-use of carpet materials,
Technical Report TUE/TM/BDK/LBS/97-11. Eindhoven University of Technology, Eindhoven, The Netherlands.
Fleischmann, M., Krikke, H.R., Dekker, R., Flapper, S.D.P., 2000. A classification of logistics networks for product recovery. Omega
28 (6), 653–666.
Geoffrion, A.M., Powers, R.F., 1995. Twenty years of strategic distribution system design: An evolutionary perspective. Interfaces 25
(5), 105–127.
ILOG, 1999. ILOG CPLEX 6.5 User�s Manual.
Kall, P., Wallace, S.W., 1994. Stochastic Programming. John Wiley and Sons, Chichester, UK.
Laporte, G., Louveaux, F., van Hamme, L., 1994. Exact solution to a location problem with stochastic demands. Transportation
Science 28 (2), 95–103.
Louveaux, F., 1986. Discrete stochastic location models. Annals of Operations Research 6 (1), 23–34.
Louveaux, F., 1993. Stochastic location analysis. Location Science 1 (2), 127–154.
Morgan, M.G., Henrion, M., 1990. Uncertainty: A Guide to Dealing with Uncertainty in Quantitative Risk and Policy Analysis.
Cambridge University Press, New York.
Realff, M.J., Ammons, J.C., Newton, D.J., 2000. Strategic design of reverse production systems. Computers and Chemical Engineering
24, 991–996.
Scholten, V., 1995. An economical model for the location of depots for sieved sand. Master�s thesis, Econometric Institute, Erasmus
University Rotterdam, P.O. Box 1738, 3000 DR Rotterdam, The Netherlands (in Dutch).
Copyright © 2022 FDOKUMEN