Comparative Advantage, Diversification, and Intra-Industry ...
Upload
khangminh22Category
view
0download
0
World Bank Reprint Series: Number 136
Bela Balassa
A "Stages Approach" toComparative Advantage
Reprinted with permission from Economic Grouwhl and Resources,
edited by Irma Adelman, Proceedings of the Fifth Congress of
the [nternational Economic Association, Tokyo, Japan, 1977, vol.
4 (London: Macmillan, 1979), pp. 121-56.
Pub
lic D
iscl
osur
e A
utho
rized
Pub
lic D
iscl
osur
e A
utho
rized
Pub
lic D
iscl
osur
e A
utho
rized
Pub
lic D
iscl
osur
e A
utho
rized
Pub
lic D
iscl
osur
e A
utho
rized
Pub
lic D
iscl
osur
e A
utho
rized
Pub
lic D
iscl
osur
e A
utho
rized
Pub
lic D
iscl
osur
e A
utho
rized

11 A 'Stages Approach' to ComparativeAdvantageBela Balassa*
INTRODUCTION
The purpose of the paper is to analyse the changing pattern of comparativeadvantage in the process of economic development. The investigation will belimited to exports, since the commodity pattern of imports is greatly influencedby the system of protection in the importing countries. And as trade in naturalresource products depends to a considerable extent on the country's resourceendowment, we will deal with comparative advantage in manufactured goodsalone.
Section I of the paper considers the relevance for the developing countries ofexplanations of international specialisation based on factor proportions andtechnological variables. Section II describes the product classification schemesand country characteristics used to evaluate comparative advantage. Theempirical results on the changing pattern of comparative advantage arepresented in' Section III, they are further analysed in Section IV. Section Vexamines the policy implications of the results.
I. EXPLANA TIONS OF COMPARAA TI VE ADVANTA GE
Hufbauer (1970) was the first to introduce the distinction between the neo-factor proportions and the neo-technological explanations of comparativeadvantage. The former combines human capital with physical capital andrelates the sum of the two to (unskilled) labour. In turn, the latter emphasisesthe role of technological change, the product cycle, and economies of scale indetermining the pattern of international specialisation.
According to Hufbauer, if technological factors 'were somehow combinedinto a single characteristic, that characteristic might prove as powerful as
* The author is Professor of Political Economy at the Johns Hopkins University andConsultant to the World Bank. The paper presented at the Congress was prepared inthe framework of a consultant arrangement with the World Bank but it should not beinterpreted to reflect the Bank's views. The author is indebted to Dominique deCrayencour, Jonathan Levy and especially to Kishore Nadkarni for rescarchassistance. He has benefited from comments on an earlier version of the paper byT. N. Srinivasan and other participants in a seminar held at the World Bank.

122 Ecwiom,ic Growth anid Resources
Lary's single measure (value added per man) of human and physical capital inexplaining trade flows' (1970. p. 196). While such a single characteristic hasnot been established, it has been suggested that 'there appears to be a newconsensus emercino concerning the power of the neo technology theory overthe neo-factor proportions theory' (Groodiman -Ceyhun, 1976, p. 51 1).
rhe results of several receint studies on US trade tend to support thisconclusion. Goodiman and Cevthun have found thalt 'the variables describingdifferent facets of the telholog plhcnunomna are singularl) the most importantvariables, which sug.gcst the importance of the neo technology hypothesis inthe explanation of international trade in maniufactures' (op. cit., p. 547). Similarresults have been reached by Baldwin (197 1) and by Bratison and Junz (1972).
These authors have showvn that net US exports are neg1atively correlated Nvithphysical intensity. Baldwin also finds that general meastires of human capital,such as the average cost of education. average years of education, and averageearnings, are not statisticall\ Ni,,nillcantl in explaining. US trade. And, while thehuman capital variable is posikti% cly cor related with nct exports in theBranson-Junz study, its level of statistical signiFicance is greatly reduced oncetechnological variables are introduced in the equation.
Among technnological variables, R & D epxpnditure performs the best in theBranson-Junz study, whereas Baldwvin finds the nur '"er of engineers andscientists to be the most important exlplanitory factor. ulding further that'probably of even more importance is the fact thaat a significant part of thislabor group is engaged in research and de% elopment activities' (1971, p. 142).Finally, Morall concludes that 'the ULnited States' comparative advalntage inskill-intensive products must be due to mechanisms such as the product cyclemodel, the government subsidy of R & D explanation, the economies of scalein R & D argum-nents. or the dynamic shortage theory' (1972, p. 120).2
The results obtained for the United States, however, have limited relevancefor our inquiry into the changing pattern of comparative advantage for thedeveloping countries. These countries are at the other end of the spectrumni fromthe United States anl engage in research and de% e'lpiliopet to a very smalldegree, if at all.3 Accordingly, Ae will next coonsidier the determninants of trade
'This conclusion applies also in US trade with Canada, Wes;tern Europe, thedeveloping countries, and the rest of the world other than Japan, althoughstatistically significant results were obtained for US trade with Japan (1971, p. 140).
'A dissenting v oice is that of I larkness and Kyle (1975). However, the results ofthese authors were obtained b: replacing a continuous v ariahle (net exports orexport -imiporL ratios) w\ith a binary variable, elassilf ing indiuistries into two groupsacenrding to whether exports exceed, or fall short of, imnports. This choice brings intoquiestion the validity of the results, in part because of the error possibilities in'oul%ed ina binary classiFic.tion and in part because large and small export imnport balancesare given equal weight.
3This concluision also applies to Leamner's findlilngs as to 'the clear stipcriority of theresearch and development variable' (1974, P. 36tj) in detrmining export -importratios for two digit SITC categories in a group of twehe developed colultries,Including thc United States, wvho carry out much (f tILJir trade with each other.

Balassa: A 'Stciges Aporucwh 'to ComparIive.' I )dal agc 123
between de' eloped and dIc'. elo)ing countries.Postulating that light manufactures are relatively labour intensive and heavy
manufactures capital-intensive, Kojima (1970) has concluded that the factorproportions explanation is valid for trade between developed and developingcountries. Defining ceapital intensity in ternms of value added per man, takeni toreflect the use of physic;^i as well as human capital, Lary has also found thatdeveloping countries tendl to export labour-intensive nianufactures (1968,ch. 4). This conclusionl has been reinforced as regards US imports fromdeveloping countries by Mahfuzur Rahman (1973), who defined capital inphysical terms, and for German imports from developing countries by Fels(1972), who defined capital as the sum of the value of the (physical) capitalstock and the discounted value of the diuercence between average wages andunskilled %% ua-es in particular industries, taken as a proxy for human capital.
In examining trade between de% eloped and developing countries, however,these authors have divided a continuum more or less arbitrarily into twosegments, hence their estimates cannot be used to ineicate changes in thepattern of comparative advantage ir the process of economic development.Continuous variables as regards country characteristics have been used byHufbauer in attempting to explain inter-country dilTerences in the averagevalues of particular product characteristtcs.' But, in his sample of twenty-fourcountries. Hufbauer has included only nine which may be considcu eddeveloping, and most of thiese belong to the sCemii industrial groLip (1970,p. 157).5
In turn, Hirsch (1974) has cla.-,siflid eightecn industry groups in threecategories, according to whclher the correlation between export performanceand value added per worker in the non agricultur-al sector, estim1lat.ed in aninter-country framework, was positive. zero, or negative. Hlirsch has also madeestimates for individual countries by regressing export--output ratios in theeighteen-industry breakdown on the skill, physical capktal, scale, and naturalresource characteristics of these industries, and has grouped the resultsobtained for the twenty -nine countries studied into four categories according totheir per capita incomes (high income, mediunm hig,h incomiie, mediulm lowincome and low income groups). No attempt has been m1lalde, however, toestablish a relationship between the two sets of estimates. Considering furtherthe low level of significance of the estimated regression coefficients in thecountry equations, the crudeness of the fourfold country classification scheme,and the high degree of commodity aggregation,6 the results have remainedrather impressionistic.
'E.g. the avcrgte physic, I capital intensity of cxports '.'as related to intercouritrydifnefrcnceh in physical capital per man.
50n the definition used, see Section III below.6An even greater level of aggregation (I digit Standard Interniational T-- .e
Classificatioji categoric'.) is used by Banerji, who distinguishes aniong fourcommodity categories and hIas not been succes;ful in intr0duLcin1g variables directlyexpr-ssing comparative ad'. antage in the rcgre,.ion equation'. (1975. Ch. Ill).
124 FcunLrlic Growth anid Resources
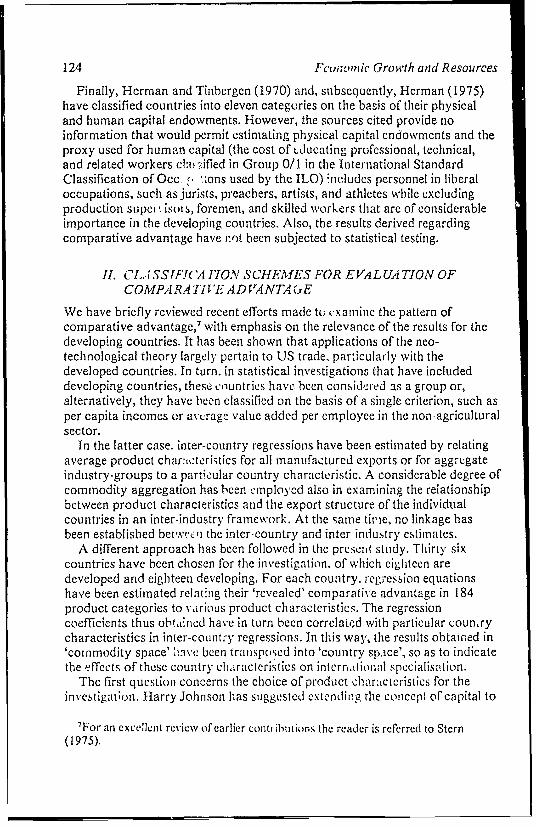
Finally, Herman and Tinbergen (1970) and, subsequently, Herman (1975)have classified countries into eleven categories on the basis of their physicaland human capital endowments. However, the sources cited provide noinformation that would permit estimating physical capital endowments and theproxy used for human capital (the cost of Lducating professional, technical,and related workers ctasied in Giroup 0/1 in the International StandardClassification of Occ, . ions used by the ILO) includes personnel in liberaloccupations, such as jurists, preachers, artists, and athletes while excludingproduction super . is(IS, foremen, and skilled workers that arc of considerableimportance in the developing countries. Also, the results derived regardingcomparative advantage have !'ot been subjected to statistical testing.
Il. Cl -ISSTF!C('AIHONSV SCHEMiIfESSFOR EVALUA TIONOFCOMPARA FIT E' A4D VTANTAG E
We have briefly reviewed recent efforts made to examine the pattern ofcomparative advantage,7 with emphasis on the relevance of the results for thedeveloping countries. It has been shown that applications of the neo-technological theory largely pertain to US trade, particularly with thedeveloped countries. In turn, in statistical investigations that have includeddeveloping countries, these countries have been consid,ered as a group or,alternatively, they have been classified on the basis of a single criterion, such asper capita incomes or a,,erage value added per employee in the non--agriculturalsector.
In the latter case. inter-country regressions have been estiinated by relatingaverage product char:acteristics for all manufactured exports or for aggregateindustry-groups to a particular country characteristic. A considerable degree ofcommodity aggregation has been ernployed also in examining the relationshipbetween product characteristics and the export structure of the individualcountries in an inter-industry framework. At the sanme tirie, no linkage hasbeen established betwecn the inter-country and inter inclustr) cstiinates.
A diffrerent approach has been followed in the present study. Thirty sixcountries have been chosen for the investigation, of which eiglhteen aredeveloped and eighteen developing. For each country. regression equationshave been estimated relating their 'revealed' comparative advantage in 184product categories to va.rious product characteristics. The regressioncoefficients thus obtained have in turn been correlated with particular coun'rycharacteristics in inter-country regressions. In this way, the results obtai,ned in'cornmodity space' ahavc been tranisposed into 'country sp,ice', so as to indicatethe effccts of these country chairacteristics on intern.tionaml specialisalition.
The first queSionll concerns the choice of product characteristics for theinvesliation. Harry Johnson has suggested extending the concept of capital to
'For an cxce'lent review of earlier conti ibutions the reader is referred to Stern(1975).

Balassa: A 'Stages Approach' to Conzparathiie Advanitage 125
include human capital as well as intellectual capital in the form of productionknowledge, noting that 'such an extension is fully consistent with IrvingFisher's approach to the relation between capital and income' (1970, p. 17).However, as Branson observes, the aggregation of various forms of capitalassumes that they are perfect complements or perfect substitutes in production(1973, p. I1).8
In the present study, we have experimented with an aggregate measure ofcapital as well as with separate variables for physical and human capital.9
Investment in research and development has been subsumed under the two asthis is in part embodied in physical capital (e.g. laboratories) and in part inhuman capital (scientists and engineers engaged in R & D). This procedureappears appropriate in an investigation of the changing pattern of comparativeadvantage in the process of development since, as noted above, developingcotuntries engage in research and development to a limited extent, if at all.Thus, little is lost in combining intellectual capital in the form of produtctionknowledge with physical and human capital.
Capital intensity may be defined in terms of flows (Lary's measure of valueadded per worker) or stocks (the value of the capital stock plus the discountedvalue of the difference between average wages and the unskilled wage, dividedby the number of workers). The latter approach was used by Kenen (1965)and, recently, by Fels (1972) and by Branson (1973).
The stock measure of capital intensity (k s) is expressed in (1)
k= = p§ + 5 = j wj- (=1 )
for industry i, where piand h,respectively, refer to physical and human capitalper man, w *is the average wage rate, w9 the wage of unskilled labour, and r hthe discount rate used in calculating the stock of human capital. This approachimplictly assumes that the rental price of physical capital, i.e. the risk-free rateof return andl the rate of depreciation, is the same in all industries. Thisassumption is made explicit in expressing the flow equivalent (FE) of the stock
80n the complemnentarity of physical and human capital, see Fallon and Layard(1975).
9Physical and human capital have also been separated in a recent article by Hirsch,which has come to the author' attention since this paper was completed. Hirschmakes a distinction betwecn high-skill and low-skill industries, further separating(physical) capitli and (unskilled) labour intensive industries within each. For eachgroup, export performance is related to incomes per head, taken as a proxy forphysical and human capital (Hirsch, 1975). Thus, in contradistinction with thepresent study, an aggregated commodity classification scheme is used and capitalendowment variables are not introduced in the analysis. Also, the hiunian capital-intensity of the different product categories is defined in terms of skill-intensity, whichwas criticised in connection with the Herman, -Tinbergen study above.

126 Efcononlic Growvth and Resourcesmeasure of capital intensity as in (2), where r"is the
(FE) k= pS(rP + d) + (Wi -v w) (2)discount rate for physical capital and d is the rate of (looreciation.
In turn, the flow mrasure of capit.l inteisity (k r) can )c expressed as in (3)wherc va refers to value added per man. Now, noii w%a;gc value added per man(va1 - w;i) is taken to represent ph)sical capital initensit)y and Nagc value addedper man (wv;) human-capital intensity.
kf = va; = pf + lif = (vai -- Tr,) + W; = (vai t- 7N ;) + [(W; -- Wi) + Wvv] (3)
As tar as physical capital intensity is concerned, the two measures will givethe same result in risk-free equilibrium, provided that product, capital, andlabour markets are perfect and non-wage value added does not include anyitems other than capital remuneration. However, production is subject to risksthat vary among industries, and, assumiing risk aversion, profit rates willinclude a risk premium that will differ from industry to industry. Also, thesituat;ton in a particular year will not represent an equilibrium position and thlisfact, as well as imperfections in product, capital, and labour markets, willfurther contribute to inter-industry variations in profits. Moreover, non-wagevalue added may include items other than capital's remuneration, such asadvertising.
Finally, while the stock measure imputes diffei-ences between average vagesand the unskilled wage to human capital, the flow1 measure includes the entirewage value added under this heading, thus overestimating human capital-intensity by the amount of the unskilled wage. This would not give rise toproblems if the unskilled wages were the same in every industry. However,unskilled wages may differ among industries due to factors such as thedisutility of work and the power of labour unions.
The existence of inter-industry differences in risk, market imperfections, theinclusion of items other than capital's remuncration in nion wvage value added,and the inclusion of unskilled wages in wage value added represent deficienciesof the flow measures of capital-intensity. In turn, the lack of considerationgiven to inter-industry differences in depreciation rates and in the extent ofobsolesence of existing equipment. as well as the use of historical rather thanreplacement values for physical capital, represent disadvantages of the stockmeasure.
The implications of the described shortcominig of the two measures ofcapital-intensity for the results will depend on the particular circumstances ofthe situation. The tusefulnlless of the stock neeasure would be greatly im-,paired inan inflationary situation where historical and replac,inenLt values differ and themagnitude of their difTcrences varies with the age of equipment. This is not thecase in the present study since the benchmark years used for estimating capital-intensity (1969 and 1970) are part of a long noni inflationary period. Bycontrast, the usefulness of the flow ineasure is limited by reason of the fact thatprofit rates sli(w considerable variation over timle and inter industry

Balassi: A 'Stigt-'s A)poac/hz'to Compurdtire 4f clidantage 127
diffcrence.z in profit rates cannot be fully e\plninWd by rcfeeutc to riskfactors.' 0
These considerations tend to fax oUr tile use of the stock measure of canitalintensity. Nexerthelcss, given the error possibii,i;ies involved, interest attachesto making estimiiates by the use of both nicasure-r,Q' which :ldso permits us toexamine the stability oftthe reulth derived undier altcrinativ: OSsumI-ptions. TAishas been done in the prsOent stidil, with eimplia is given to the estimateobtained by the use of tie stock mC,ahuire in eva!uating the results.
For the purpos.cs of the calcmiditi16om, we have attemrnlpted! to obtain data ointhe capital intensity of the production process for Japan, the factor intensitiesof which may be presumicd to lie in betweeni the r&e-ant magnitudes for highlydeveloped and less de% eloped cOunim i`s. Hiowexer, ior lack of information onphysical capital and on unskilled wages in a suMcieliy dlvetailed breakdown,this attempt had to be abanl!k)d0ined and wve have had to have recourse to USdata.
The use of US data in the invcsti LItiOll will he approprinte if factorsubstitution elasticities are zero or thev are identical for every productcategory. While this assumption is not fulfilled in practice, Lary has shownvariations in capital intcnsity to be small in US-UK, US-Japan, andUS-India comnpariNoris as regards his value added mntasure (1968, AppendixD). For lack of data, similar conmparis,ons could not be made for the stockmeasure and the further inx estigatimn of this quLestionE had to be left for futureresearch.
In defining the manulacturing ;ector for the purposes of thc preselntinvestigation, we have taken thc concept used in the US Stanidard IndustrialClassification (SIC) as our poinlt of departure. We have excluded from thiscategory (SIC 19 to 39) foods and beverages (SIC 20) and tobacco (SIC 21),where the high cost of transportatiton and the perishability of the basic materialgive an advantage to primary producing countries. We have further excludedprimary non-ferrous metals (SIC 333) where trans)portation costs account for ahigh proportion of the delivered price of the ba'-c nmaterial, and ordnance (SIC19), for which comparable trade data are not a. ailahle. In turn, given theprevalence of produlction for exports based on mported materials, wve haveretained petroleumll products anlnd wood products in the manufactured productcategory. We have also retained non metallic 'mineral products by reason of theubiquity of the basic materials.
Defining the manufacturing sector as SIC industry groups 22 to 39 less 333,the product classification scheme used in this study has been established on the
tmRecrerncc is mn.ide here to US diata which were used in the calcul.itions as notedbelow.
"Fels has emploved both nwiu.sure' in correlating net Gernn.n exports with capitalintensity in a nineteen industry sample (1972, Table 3). In turn, Lary has usedHufbauer's data to calculate the rank correlation coelbejent het%~ ceni countr)averages of value added per employee in exports and per capita incomes (I1970).
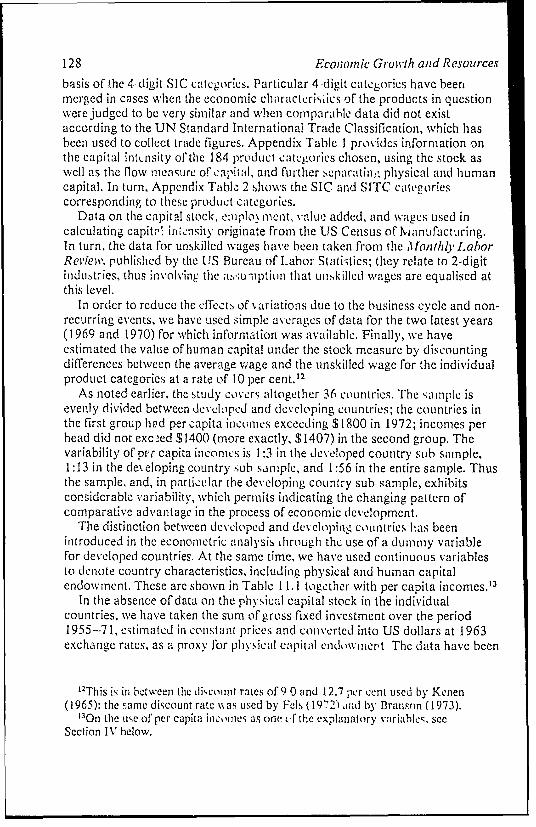
128 Econiomnic Growsth atd Resourcesbasis of the 4 digit SIC categoriles. Particular 4-digit catcories have beerlmerged in cases when the economiiic characteris.ics of the products in questionwere judged to be very similar and when comparable data did not existaccordirng to the UN Standard Internationai Trade Classification, which hasbeen used to collect trade figures. Appendix Table I provides information onthe capital intcnsity of the 184 product categories chosen, using the stock aswcll as the flow nmeasure of capital, and further separatin,L, physical and humancapital. In turn, Appendix Table 2 shows the SIC and SITc calecoriescorresponding to these prOdulCt categories.
Data on the capital stock, eniplo% mnent, value added, and w;ages used incalculating capita' inkasity originate from the US Census of Manufacturing.In turn, the data for unskilled wages have been taken from the Mfonthly LaborReview, published by the US Bureau of ILabor Statistics; tlhcy relate to 2-digitiI1Lluttries, thus involving tihe ;umptiun that unskilled wages are equalised atthis level.
In order to reduce the L'ffeCts of * ariations due to the business cycle and non-recurring events, we have used simple avcrages of data for the two latest years(1969 and 1970) for which informiation was available. Finally, we haveestimated the value of human capital under the stock measure by discountinigdifferences between the average wage and the uinskilled wage for the individualproduct categories at a rate of 10 per cent.12
As noted earlier, the study covcrs altogether 36 countries. The sample isevenly divided between developed and developing countrics; the countries inthe first group had per capita incomes exceCeling $1800 in 1972; incomes perhead did not exc.ed $1400 (more exactly, $1407) in the second group. Thevariability of per capita incomes is 1:3 in the developed country sLub sample.1:13 in the de eloping country sub samiiple, and 1:56 in the entire sample. Thusthe sample, and, in particular the developing country sub sample, exhibitsconsiderable variability, Nvhich permits indicating the changing pattern ofcomparative ad vantage in the process of economic development.
The distinction between developed and developing cOuntries has beenintroduced in the econonmetric analysis dhrougll the use of a dummnly variablefor developed countries, At the same time, we have used conitinuous variablesto denote country characteristics, including physical and human capitalendowment. These are shown in Table 1 1.1 togeLher with per capita incomes.'3
In the absence of data on the physical capital stock in the individualcountries, we have taken the sum of gross fixed investment over the period1955-71, cstimated in constant prices and converted into US dollars at 1963exchange rates, as a proxy for physical capital endowment The data have been
"2This is in between the dcisount rates of 9 0 and 12.7 per cent used b) Kenen(1965): the same discount rate w%as used by Fels (1972) dild b)y Branson (1973).3 0n the use of per capita incomes as ooe irithe explanatory variables. seeSection IV helow.
Balasse: A WStages Approaci'to ConTaratirwe Advtantage 129derived from the WVorllh Tables, 1976, published by thc World Bank; they havebeen expressed in per capita terms.
A similar procedure has been employed by Hftifbauer, except that he useddata for the period 1953-64 and included manufacturing investment onlv(1970, p. 157). The choice of a longer period in the present stuLdy reflects thefact that capital equipment is used beyond eleven years; also, we haveconsidered all capital, and not o nly that used in thle nianuFlcturing sector. 4 Inturn, in using value added per worker (1974, p. 542) as a proxy for capitalendowment, Hirsch does not separate physical and hunman capital and neglectsinter-country dlifecrences in profit rates and in unskilled wages.
Hufbauer has taken the ratio of professional, technical and related workersto the labour force in manufactUring as a proxy for human capital endowment(1970, p. 158). As noted earlier, the use of this measure is objectionable,because it includes various liberal occupations while excluding productionsupervisors, foremen and skilled workers that are of considerable importance inthe developing countries.
A more appropriate procedure appears to be to make use of theilarbisoni MyXers index of human resource development.' 5 While this index is a
flow meai ure,l6 the use of estimates pertaining to 1965 (Harbison, Maruhnic,and Resnick, 1970, pp. 175-6) permiiits us to provide an indication of acountry's general educationral level, and thus its human capital base, in 1972,the year for which trade data have beenl obtained. Nevertheless, we have alsoexperimented with the skill ratio cniplo) ed by llufbauer, utilisinig the datareported in the ILO Yearbook) of [ahor Stat istics.
III. SO.Q E [ .MPIRICAL RESLULTS
As noted in the introduction, the inveztigation is limited to exports since thecommodity pattern of imports is greatly influenced by the system of protection.Following earlier work by the author (1975), a country's relative exportperformance in the indi% iduLal product categories ha.s beenl takenl as anindication of its 'revealed' conmparative adv antage.
For this purpose. we have calculated the ratio of country's share in the worldexports of a particular commodity to its share in the world exports of allmanufactured goods. Thus, a ratio. Iof 1.10 (0.90) means that the country's
"TThis choice can be rationalised on the crounds that, ex ante, capital can bealho':tr, d to nimnurfa-ctrring as well as to other Nect.ors. And while adjustments wouldneed to he made iffthere was -oniplenkLnrarity between capital and natural resources,in certain uses, such as ruirriinii. infrrndiion on the sectorl! composition of investmerntwas not '.1 .I I;itHek for a nuniher of the COuntriecs under study.
'5
This inrdex has also been lsd ill a study of world tradle flows by Gruiber andVerno(ni (I '270)
161t is dcriN ed as the secondary schlool enrolment rate plus rive times the universityenrOlmnnt rate in the respective age cohorts.

TABLE 11.1
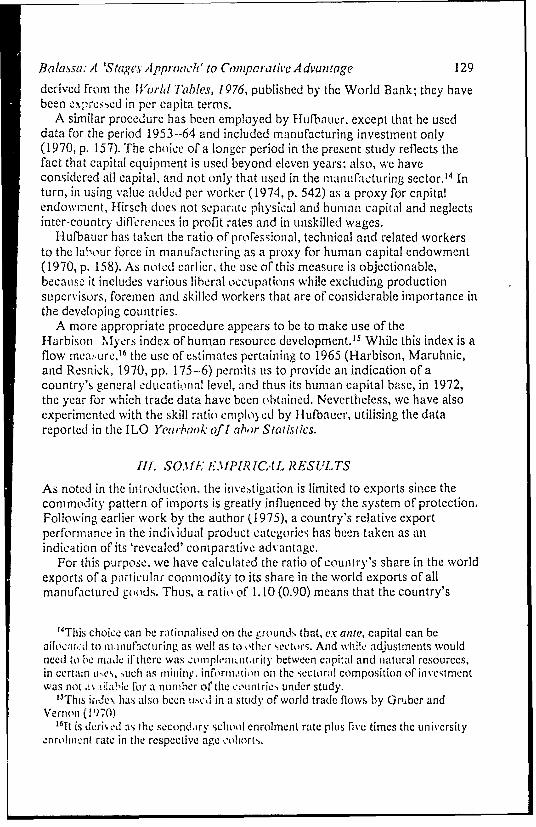
COUNTRY CHARACTERISTICS AND REGRESSION COEFFICIENTS OBTAINED IN ESTIMATES FOR INDIVIDUAL COUNTRIES
Country Characteristics Regression Coefficients
DIUMM1Y GNPCAP GDICAP HMIND SKILLS P f pS II fl piArgentina 0 1139.65 2013.68 122.0 8.76 .32 .19 .25 -.04 .60 -1.49Australia 1 3271.69 6675.24 183.3 10.93 *34** .78* .23 .12 .50* .09Austria 1 2741.26 5129.79 112.9 10.08 -.31* -. 93* -. 33* .04 -.64* .03Belgium 1 3701.15 5441.70 140.5 11.62 .11 .04 .24* -.11 .51* -1.30*Brazil 0 511.27 1016.00 29.3 8.57 -.69* -1.48* -.35 -. 42 -.74 -. 80Canada 1 4691.51 7970.65 179.9 14.92 .75* .87* .46* .25 -.22 2.25*Colombia 0 357.08 751.59 32.3 7.41 -1.31* -2.48* -.06 -1.31* -.33 -3.82*Denmark 1 4187.67 6259.56 139.2 13.63 -. 40 -. 12 -.44 -.05 -.15 .08Finland 1 2877.73 6999.27 109.9 14.89 -. 26 -.62 .08 -. 37** -.32 -. 34France 1 3841.68 7211.24 138.8 13.46 -. 07 -.08 -.06 -. 002 .11 -. 50**Germany 1 4218.84 7102.15 114.3 10.71 .20* .43* -. 05 .26* .05 .69*Greece 0 1407.20 2196.43 93.7 9.60 -.27 -1.05* .11 -. 49 -.08 -1.90*Tionig Kong 0 1048.88 1370.61 60.7 5.09 -2.30* -2.84 -1.83* -.52** -.94* -3.15*India 0 102.03 214.25 50.2 9.64 -1.10* -2.30* -. 93* -. 09 -. 19 4.58*Ireland 1 1840.20 2701.89 110.7 12.53 -.48* -.80* -. 44* -. 04 -.39** -. 66Israel 1 2416.28 4280.96 148.9 19.19 -. 37** -. 70* -.02 -. 41** .27 -2.02*Italy 1 2176.52 3366.47 91.3 7.05 -. 33* -.46* -.20** -.12 -.29** -.06Japan 1 2740.95 4765.11 146.2 8.26 -.31** -.52* -.42* .11 -.70* .86**Korea 0 301.03 402.89 66.7 6.15 -1.67 -3.02* -. 46 -1.24* -.69** -3.91 *Malaysia 0 408.62 494.56 34.5 9.53 -.88* -2.32* -. 26 -.63** -. 56 -3.65*Mexico 0 745.41 1067.02 41.1 9.22 -.91* -1.43* -.17 -. 80* -. 40 -2.38*
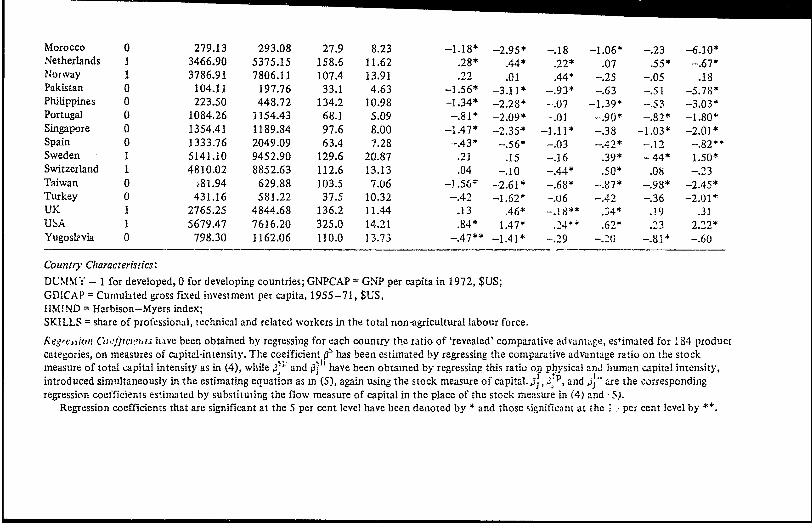
Morocco 0 279.13 293.08 27.9 8.23 -1.18* -2.95* -.18 -1.06* -. 23 -6.10*Netherlands 1 3466.90 5375.15 158.6 11.62 .28* .44* .22* .07 .55* -.67*DNorway 1 3786.91 7806.11 107.4 13.91 .22 .01 .44* -.25 -.05 .18Pakistan 0 104.11 197.76 33.1 4.63 -1.56* -3.1 1 -.93* -. 63 -.51 -5.78*Philippines 0 223.50 448.72 134.2 10.98 -1.34* -2.28* --.07 -1.39* -.53 -3.03*Portugal 0 1084.26 1154.43 68.1 5.09 -.81* -2.09* -.01 ..90* -. 82* -1.80*Singapore 0 1354.41 1189.84 97.6 8.00 -1.47* -).35* -1.11* -.38 -1.03* -2.01*Spain 0 1333.76 2049.09 63.4 7.28 -.43* -.56* -. 03 -.42* -.12 -.82**Sweden 1 5141.10 9452.90 129.6 20.87 .21 .15 -. 16 .39* -44* 1.50*Switzerland 1 4810.02 8852.63 112.6 13.13 .04 -. 10 -.44* .50* .08 -.23Taiwan 0 i81.94 629.88 103.5 7.06 -1.56, --2.61* -. 68* .87* -.98* -2.45*Turkey 0 431.16 581.22 37.5 10.32 -. 42 -1.62* -. 06 -.42 -. 36 -2.01*UK 1 2765.25 4844.68 136.2 11.44 .13 .46* -. l8P** .34* .19 .31USA 1 5679.47 7616.20 325.0 14.21 .84* 1.47* .24 .62* .23 2.22*YugosL-via 0 798.30 1162.06 110.0 13.73 -. 47** -1.41* -.29 -. 20 -. 8I* -.6U
Country Characteristics:D IM - 1 for developed, 0 for developing countries; GNPCAP GNP per capita in 1972, $US;GDICAP = Cumulated gross fLxed investment per capita, 1955-71, $US,IlMITND = Hlarbison-Myers index;SKILLS = share of professional, technical and related workers in the total non-agricultural labour force.
Regreu.,ion Co.4fltcmrj hive been obtained by regressing for each country the ratio of 'revealed' comparative advantage, estimated for 184 productcategories, on measures of capital-intensity. The coefficient gd has been estimated by regressing the comparative advantage ratio on the stockmeasure of total capital intensity as in (4), while ,3 and , l' have been obtamed by regressing this ratio on physical and hiuman capital intensity,
J f f-p I.introduced simultaneously in the estimating equation as in (5), again using the stock measure of capital. ,. , 3, and ,iJ are the correspondingregression coefficients estimated by substituting the flow measure of capital in the place of the stock measure in (4) and 511.
Regression coefficients that are significant at the S per cent level have been denoted by * and those signi-icant at the I i per cent level by *.

132 Economic Growth and Resources
share in a particular prodeuct category is 10 per cent higher (lower) than itsshare in all manufactured exports.,7 These ratios can be considered to expressa country's comparative advantage in manufactured goods that arecharacterised by product differentiation and are hence exported bvy a variety ofcountries.
For each of the 36 countries, the ratio of'revealed' comparative advantage,calculated for the individual product caltegories, has been regressed onvariables representing the capital intensity of the individuia1l produict categories.Separate equations have been *, tiniated using the stock andl the flow nicasuresof (total) capital intensity, as well as by simultaneously introdLucilng physicaland human capital under the !Ls o definitions of capital intensity.
The estimating equation is shown in (4) for total capital intensity
log xij = log a + P log kS (4)and in (5) for phvsical and human canital intensity. The equations have beenestimated in a double-logarithmic form,
log xij - log aj + op log pi + gh log h. (5)so that the value of the a coefTiciecit for cOuntry j indicates the percentagechange in the country's comnpArative advantage ratio (x ,) associated with oneper cent change in capital inter'ity.' 8 A po\ itive (negalive) [ coefficienit thusshows that a country has a comparitiN e advantage in capital/lbhour intensiveproducts while the nunmer ical magnitude of the [3 coefficinti indicates the extentof the country's comparative ON,v! it age in capital/lab(our intensivecommodities.-9 The e'stimated p .;cefficielt are reported in T'able 1 1.1.
In the regression eLuLa;0tions utilising thc stock measure of (total) capital..intensity, thle 3c oefficient is statistically significant at the 5 per cent level for 22countries and at the 10 per cent level fcor 26 countries. In turn, in regression
"1 An alternative measure would nvolve relatinge kpnoriN to output in each country.In the absence of output figures, however, this measure could not be utilised in thepresent study. At any rate, it would require adjU.sting for country size (Balassa, 1968)u-hile the measure used here does not require such an adjustment.
"8Since the logarithm of zero is undefinied, in the estimating equations, an exportratio of 0.001 has been u.-L to represent cases when the e\ports of a country in aparticular product Ca1tegory *ere nil. We have also experim-lenetied with the use of a 0.01ratio and have obtained practically the same rsults. Nor are the results materiallyaffected if we drop the 7cro observations from the regslr >ions. This and (ther stimatesnot reported in the paper are a. -ilible froim the author on request.
'9 Alternatively, use may be miiade of non parametric tests invokling, the calculaition ofthe Spear,nan rank correlation cocnicient betsseen the 'revealed' comparative(d1 anlage ratio and the individual fiaclor intensimr measlures. This test has thedisad aniage. however, that it canniot handle more thIr: one cx.planatury variable andthat it does not permit indlicating th1e imiplicafions of the inter country results for acountry's future conmparatixe ads.% antave (on the last point. see the concluding section).

Balassa: A 'Stages Appro(ch' to Comnparative A dvatntage 133
equations utilising the flow measLure, the coefficient is significant at the 5 percent level for 29 countries, with no additional countries included at the 10 percent level. Note further that the D coefficients that have values near to zerohave an economic interpretation even if they are not significantly different fromzero; they indicate that a country is at the dividing line as far as comparativeadvantage in capital- and labour-intensive products is concerned.
The d3 coefficients estimated by using the stock and the flow measures ofcapital intensity are highly correlated, with a Spearman rank correlationcoefficient of 0.956. In turn, in estimates obtained by disaggregating capitalinto its physical and human capital components, a high degree ofcorrespondence has been obtained in regard to the i coefficients pertaining tohuman capital intensity (Spearman rank correlation coefficient of 0.841) butnot for physical capital-intensity (Spearman rank correlation coefficient of0.650). These differences are explained if we consider that human capital-intensity was defined in a similar way under the stock and the flow measure ofcapital while this was not the case for physical capital intensity.
The level of statistical significance of thle coefficients, too, is lower if wedisaggregate capital into its physical and human capital components. The fcoefficients are significant at the 5 (10) per cent confidence level in 14 (17)cases for the physical capital- intensity variable and in 13 (17) cases for thehuman capital-intensity variable if we use a stock measure of capital. Thecorresponding figures are 11 (15) for the physical capital intensity variable and21 (24) for the human capital-intensity variable under the flow measure.2 0
Next, we have tested the hypothesis that inter-country differences in the ,coefficients can be explained by difTerences in country characteristics thatdetermine the pattern of comparative advantage. This test has been carried outby regressing the P coefficients estimated for the individual countries onvariables represcnting their physical and human capital endowments in anintercountry framework. (6) shows the estimating equation for the case when
=j = f (GD11CAPj, l1MlNDj) (6)
per capita ph\ sical capital endowments (GDICAP) and human capital
"'The results contrast with thosC obtained by Helleiner, who found total (physicaland human) capital intcnsity tu have lower explanatory power than skill-intensitvalone. But Helleiner's results pertain to the trade of the LDCs taken as a whole; he didnot enmploy a stock measure of capital; and he used the average wage as a measurc ofskill intensity (1976).
Helleiner also used sonic additional variables, of which scale econornics werestastical,H significant in trade betwveen de% eloping and developed countries (1976,p. 512). However, coinparative idJ antage in products subject to scale cconomics isrelated to the size of the domestic market (Balassa. 1968) and, wvith developingcountries having smaller markets, Iflelleiner's results raise problems or identrifcation.

134 Econominic Growth and Resources
endowments (HIMIND) are introduced simultaneously in the equation.2 'In estimating equation (6) statistically significant results have been obtained
for the physical as well as for the human capital e%ndowment variables,regardless of whether the dependent variablc originated in country regressionsutilising the stock or the flow measure of capital intensity. In both regressions,the physical as well as the human capital endowment variables are significantat the 5 per cent confidence level, while the coefficient ofdlctcrmination is 0.65using the stock measure and 0.78 using the flow measure of capital intensity(equations 1.3 and 2.3 Table 11.2).22
The level of statistical significance of the regression coefficients for thephysical and human capital-enCdowment variables is hardly affected if weintroduce a dummy v ariable (DUMNMl4Y) represecnting the level of economicdevelopment. In turn, the dummy variable is not statistically significant if usedin combination wi.h either or both capital-endowment variables, and itsintroduction does not increase the coefficient of determination.
We have also experimented with the ratio of professional, technical, andrelated workers to the total in the place of, and together with, theHarbison --Myers index. This variable (SKILLS) is not statistically significantat even the I0 per cent level. Nor does it appreciably affect the statisticalsignificance of the other variables in the regression equation or raise thecoefficient of determination. It can thus be rejected as an unsuitable substitute(complement) to the Harbison -Myers index.
It will be recalled that the level of statistical significance of the P coefficicentsfor the physical capital intensity variable in the country regressions has beengenerally low. Statistically poor results have been obtained also in regressingthese coefficients on variables representing physical and human capitalendowment in an inter-cruntry framework as in equation (6). The explanatorypower of the regressions is low, as is the level of statistical significance of thecoefficients in cases when the physical and the human capital-endowmentvariables are introduced simultaneously in the ectinmating equations. 1-lowever,the coefficients are statistically significant when Lhcse variables are introducedseparately (Table 11.3).
The explanatory powver of the regressions is relatively high in cases w hen the,B coefficicnts obtained in regard to the flow measure of human capital intensityare used as the depcndent variable in equation (6). Also, both the physical and
2"Note that, with variations in the standard errors of the , coefficients derived inequations (3) and (4), the regression results obtained .- eqniation (5) wvill be subject tohererosceda-sticity which increases the standard error of the coefiTcients. However, theestimates are little affected if we weight the data for the individual countries by theinversion of the standard error of the D coefficients to reduce heteroscedasticity.
1R2rcrssin z the rank correlition coetlTicients calculated as bnetween the 'revealed'comparative adu m 1ntgc ratio and the f:ictor-intLr,sitv measures on factor endowinenitvariables has generally confirmed the reported results, alihoLugh the level of statisticalimigniFicance of Nhe coefliciciims was somewhat lower.

TABLE 11.2
INTER-COUNTRY REGRESSION EQUATIONS FOR THE TOTAL CAPITAL-INTENSITY MEASURE
Explanatory variablesDependent Equation Coefficient ofvariable number determination GDICAP HMIND DUMMY SKILLS CONSTANT
01 1.1 0.61 1.90 (7.28) -1.17 (-9.60)1.2 0.46 0.85 (5.35) -1.38 (-7.25)1.3 0.65 1.46 (4.24) 0.34 (1.92) -1.37 (-8.78)1.4 0.61 1.66 (2.87) 0.16 (0.48) -1.16 (-9.38)1.5 0.59 0.45 (2.37) 0,69 (3.19) -1.30 (-7.64)1.6 0.65 1.39 (2.40) 1.34 (1.83) 0.05 (0.15) -1.36 (-8.44)1.7 0.62 1.63 (4.42) 0.03 (1.06) -1.41 (-5.51)1.8 0.62 1.40 (2.23) 0.15 (0.45) 0.03 (1.04) -1.40 (-5.39)1.9 0.66 1.27 (3.09) 0.32 (1.78) 0.02 (0.85) -1.54 (-5.96)1.10 0.66 1,20 (1.93) 0.31 (1.70) 0.05 (0.15) 0.02 (0.84) -1.54 (-5.80)
4 2.1 0.71 3.59 (9.12) -2.27 (-12.43)2.2 0.58 1.67 (6.84) -2.74 (-9.39)2.3 0.78 2.57 (5.37) 0.77 (3.12) -2.72 (-12.54)2.4 0.72 2.72 (3.19) 0.57 (1.14) -2.25 (-12.29)2.5 0.73 0.91 (3.42) 1.30 (4.30) -2.60 (-10.83)2.6 0.78 2.11 (2.66) 0.74 (2.91) 0.33 (0.71) -2.69 (-12.05)2.7 0.71 3.45 (6.14) 0.02 (0.34) -2.39 (-6.13)2.8 0.72 2.60 (2.76) 0.57 (1.12) 0.01 (0.32) -2.36 (-6.05)2.9 0.78 2.50 (4.46) 0.77 (3.05) -. 001(-0.03) -2.71 (-7.44)2.10 0.78 2.12 (2.45) 0.74 (2.84) 0.32 (0.70) -. 001(-0.03) -2.68 (-7.24)
NOTE For explanation of symbols, see Table 11.1. In the estimating equations, GDICAP has been expressed in units of10,000 dollars and HMIND in units of 100.

TABLE 11.3
REGRESSION EQUATIONS FOR PHYSICAL AND HUMAN CAPITAL INTENSITY MEASURES
Explanatory variablesDependent Equation Coefficient ofvariable number determination GDICAP HMIND DUMMY CONSTANT
p 3.1 0.17 0.32 (2.64) -0.56 (-3.81)3.2 0.19 0.67 (2.86) -0.46 (-4.22)3.3 0.22 0.45 (1.42) 0.16 (1.00) -0.55 (-3.83)3.4 0.22 0.55 (1.03) 0.17 (1.01) -0.07 (-0.23) -0.56 (-3.75)
4p 4.1 0.23 0.37 (3.16) -0.65 (-4.66)4.2 0.25 0.75 (3.39) -0.53 (-5.17)4.3 0.29 0.50 (1.67) 0.19 (1.24) -0.64 (-4.74)4.4 0.30 0.21 (0.43) 0.17 (1.08) 0.21 (0.72) -0.62 (-4.46)
sh 5.1 0.40 0.55 (4.74) -0.87 (-6.23)5.2 0.59 1.30 (6.99) -0.75 (-8.73)5.3 0.61 1.07 (4.27) 0.17 (1.36) -0.86 (-7.55)5.4 0.62 0.81 (1.95) 0.16 (1.18) 0.19 (0.78) -0.84 (-7.19)
ofh 6.1 0.50 2.45 (5.87) -3.91 (-7.81)6.2 0.64 5.36 (7.77) -3.25 (-10.13)6.3 0.69 3.96 (4.96) 1.07 (2.33) -3.87 (-9.65)6.4 0.69 3.83 (2.58) 1.06 (2.24) 0.09 (0.10) -3.86 (-9.29)
NOTE For explanation of symbols, see Tables 11.1 and 11.2.

Balassa: A 'Stages Approuch' to ConiparatiLre Advantage 137
the human capital endsowment variables are highly significant when introducedsimultaneously in the equations. The level of significance is lower in cases whenthe stock measure of capital -intensity is employed instead of the flow measure.
IV. ANALYSISOFTHERESULTS
We have further examined deviations from therclationships estimated in aninter-country context. Upward deviations from the regressio.n line are shownwith respect to the physical capital endlowmient. but not with regard to thehuman capital endowment, of Argentina and the United States. The resultsindicate that the actual capital-intensity of the exports of these countries muchexceeded expected values based on their physical and human capital endowments.
The results for Argentina are explained if we consider that, during the periodunder study, this country represented an extreme case among the developingcountries as far as distortions due to the application of protective measures areconcerned. These distortions, in turn, have affected the pattern of exports andimports; in particular, with the implicit subsidy to capital goods through theovervaluation of the exchange rate associated with high protection, exportshave been biased in a capital-intensive direction.
The results for the United States are somewhat of a puzzle as the findings ofother authors would have led us to expect that actual US exports are less,rather than more, physical-capital-intensive than the hypotlictical exportsderived from inter-country relationships. And while the solution to the puzzlemay well be that the ratio of physical to human, capital-intensity is cven higherfor the imports than for the exports of the United States. our results conflictwith those of Hufbauer which show the US to be below the regression line(1970, p. 169). Note, however, that Hufbauer's results pertain to an earlier yearand he provides evidence that US exports have become increasingly physical-capital-intensive over time. Finally, our calculations using direct inputcoefficients are preferable to earlier estimates derived by the use of direct plusindirect coefficients once we admit international trade in intermediate products.
In turn, the exports of Hong Kong are less capital -intcnsive than expected onthe basis of its physical capital endowment. It would appear that Hong Kong'sexport structure does not yet fully reflect the large investments in physical capitalcarried out during the period under consideration. Finally, deviations from theregression line are relatively small in regard to human capital endowment.
Next we have estimated a matrix of Spearman rank correlaton coeficientsfor pairs of country characteristics in the 36-country sample. From Table 11.4it is apparent that the extent of the correlation is the weakest in regard to theskill ratio, reinforcing our conclusion as to the inappropriatencss of this variable.
In turn, the correlations between per capita GDI and the Harbison -Myersindex, on the one hand, and per capita GDP on the other indicate the effects ofinvestment in physical and in human capital on incomes per head. Theexistence of this correlation also explains that the incltusioni of all threeV.riables in the regression equation raises the standard error of the coefficients

138 Economic Growvth and Resources
TABLE 11.4SPEARMAN RANK CORRELATIION COEFFICIENTS FOR COUNTRYCHARACTERISTICS IN THE 36-COJUNT'RY SAMPLE
GNPCAP GDICAP IilND SKILLS
GNPCAP 1,000 0.984 0.754 0.674GDICAP 0.984 1.000 0.730 0.697HMiND 0.754 0.730 1.000 0.660SKILLS 0.674 0.697 0.660 1.000
NOTE For explanition of symbols, see Table 11.1. Al coefficients arestatistic.illy si-nificant at the 1 per cent level.
to a considerable extent.23 Nevcrtlheless, the fact that the levcl of statisticalsignificance of thie physical and human capital endowment v riables muchexceeds that for incomes per head may be taken as an indication of the'primacy' of the former.
We have seen that the inter-country regressions provide the same generalresults, irrespective of whether we use a stock or a flow measure of capital-intensity. This finding may be explained by the relatively high degree ofcorrespondence in the ranking of the product categories by the two measuresof capital intensity that is shown by the estimated Spearman rank correlationcoefficient of 0.782 (Table 1 1.5).14
The rankings of the 18 2 digit industry groups. too, are rather similar underthe two measures of capital intensity. Among the individual industry groups,Apparel and otther tcxtile products, Leather and leather products, and Stone,clay and glass products are relatively labour-intensive while Petroleum andcoal troducts, Chemicals, and Paper and paper products are relatively capital-intensive (Table 11.6). In turn, considerable differences are shown between thetwo sets of industry groups, with capital per worker under the stock measureranging between $13,991 and $23,142 in the three labour intensive, andbetween $74,448 and $191,739 in the three capital-intensive industry groups,with the overall average being $48,796.
23The relevant regression results with t *alucs in parentheses are= -1.36 + 0.14 GNPCAP + 1.39 GPIC'AP + 0.33 IIMIND R2 = 0.65
(8.46) (0.06) (1.20) (1.52)= -2.70 + 1.66 GNPCAP + 1.79 GDI('AP + 0.68 IIMIND R2 = 0.78
(12.0b) (0.51) (1.11) (2.25)24Some major exceptions are various textile fabrics, reclaimed rubber, aluminium
castings, ball bearings, and railroad car s, where a considerably higlher degree ofcalpital intensit) is showrl by the stock nieasure. and tilt articles, paints, electrichousewares, electric lamps, and motor vehicles, where this is shown by the flowmeasure.

Balassa: A 'Stages Approach' to Comparative Advantage 139
TABLE 11.5
SPEARNIAN RANK CORRELATION COEfFiCIENTS FOR ALTERNATIVEMEASURES OF CAPITAL-INTENSITY
(PC + HC)/L VA/L PC/L HC/L (VA - W)/L W/L
(PC + HC)/L 1.000 0. 782 0.758 0.907 0.680 0.835VA/L 0.782 1.000 0.636 0.685 0.951 0.809PC/L 0.758 0.636 1.000 0.488 0.604 562HC/L 0.907 0.685 0.488 1.000 0.565 0. 29(VA -- W)/L 0.680 0.951 0.604 0.565 1.000 G.b 2 .W/L 0.835 0.809 0.562 0.839 0.631 1.000
NOTE For explanation of symbols see Table 1 1.1. All coefficients arestatistically significant at the 1 per cent level.
At the same time, the results vary to a considerab,le extent within eachindustry group. For example, fur goods are very capital-intensive although theybelong to the highly labour-intensive apparel and other textile productsindustry group. In turn, explosives are relatively labour-intensive although theybelong to the capital-intensive chemicals industry group.
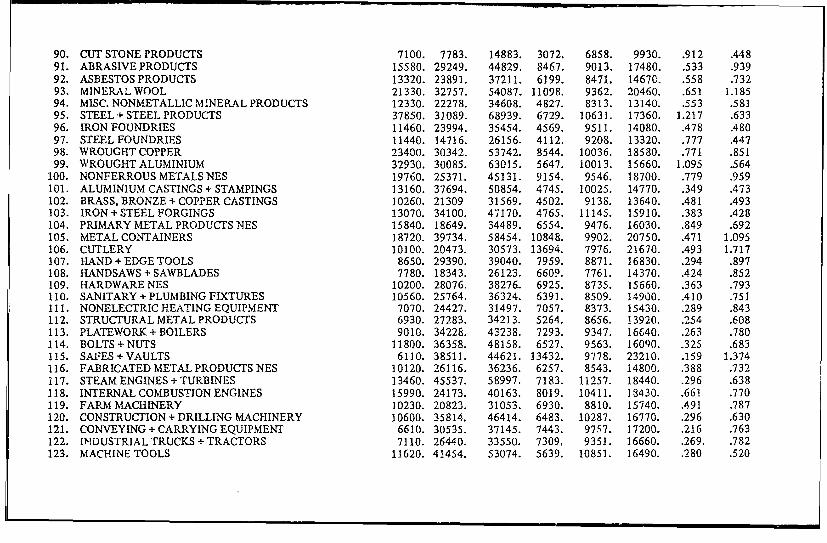
Moreover, substantial differences are observed among individual productcategories in terms of their factor intensity. At o'n extreme, we find woollenyarn and thread with (total) capital per worker ot D3215, followed byearthenware food utensils ($3520), footwear ($3757), leather bags and gloves($5483), vitreous china food utensils ($722 1), costume jewellery ($8589), andgames and toys ($8634), which are the most labour-intensive among the 184product categories. At the other end of the spectrum, petroleum products($191,739), wood pulp ($135,474), organic chemicals ($124,198), syntheticrubber ($120,631), carbon black ($101,161), inorganic chemicals ($92,762),and paper ($89,089) are the most capital-intensive (Appendix Table 1).25
There is less of a correspondence in the rankings of product categories bytheir physical and their human capital-intensity. The Spearman rankcorrelation coefficient between these indicators is 0.488 under the stockmeasure of capital and 0.63 1 under the flow measure. In turn, the correlationcoefficient is 0.604 between the two measures of physical capital intensity and0.839 between the two measures of human capital-intensity. These differencesare explained by the fact that the flow measure of capital-intensity is sensitiveto inter-industry differences in profits that do not affect the stock measurewhereas both measures of human capital-in;-;nsity are affected by averagewages in the various product categories.
Among the individual product categories, org4nic chemicals, cellulosic man-made fibres, dyeing and tanning extracts, fertilisers, carbon black, and
"5The results obtained by the use of the flowv measure of capital intensity are broadlycomrparable, although they differ in regard to particular cornnioudities.
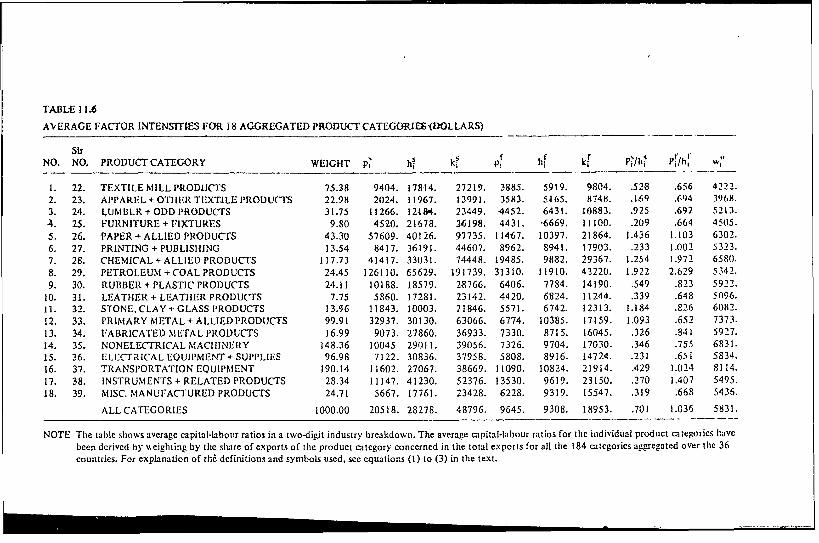
TABLE I IA6
AVERAGE FACTOR INTENSITIES FOR 18 AGGREGATED PRODUCT CATEGOR.E-6 (DLLARS)
SirNO. NO, PRODUCT CATEGORY WEIGHT p, hS k0 P hf k! P1/hi Pt/h# w1
1. 22. TEXTILEMIILLPROD.JCTS 75.38 9404. 17814. 27219. 3885. 5919. 9804. .528 .656 4222.2. 23. APP'ARE-L+OTillERTE1TXTJLE I'RODUC'TS 22.98 2024. 11967. 13991. 35R3. 5465. 8748. .169 .694 3968.3. 24. t1UNI LR+ODDPRODUCTS 31.75 11266, 12184. 23449. 4452. 6431. 10883. .925 .692 5213.4. 25. FURNITURE + FIXTURES 9.80 4520. 21678. 26198. 4431. -6669. 11100. .209 .664 4505.5. 26. PAPER+ALLIEDPRODUCTS 43.30 57609. 40126. 97735. 11467. 10397. 21864. 1.436 1.103 6302.6. 27. PRINTING + PUBLISHi1NG 13.54 8417. 36191. 44607. 8962. 8941. 17903. .233 1.002 5323.7. 28. CHEMICAL+ALLIEDPRODUCTS 117.73 41417. 33031. 74448. 19485. 9882. 29367. 1.254 1.972 6580.8. 29. PETROLEUM+COALPRODUCTS 24.45 126110. 65629. 191739. 31310. 11910. 43220. 1.922 2.629 5342.9, 30. RUBBER+PLASTICPRODUCTS 24.11 10188. 18579. 28766. 6406. 7784. 14190. .549 .823 5922.
10. 31. LEATHER + LEATHER PRODUCTS 7.75 5860. 17281. 23142. 4420. 6824. 11244. .339 .648 5(096.11. 32. STONE,CLAY+GLASS1'RODUCTS 13.96 11843. 10003. 21846. 5571. 6742. 12313. 1.184 .826 6082.12. 33. PRIMARY METAL+ALLIEDP'RODUCTS 99.91 32937. 30130. 63066. 6774. 10385. 17159. 1.093 .652 7373.13. 34. FABRICATED METAL PRODUCTS 16.99 9073. 27860. 36933. 7330. 8715. 16045. .326 .841 5927.14. 35. NONELECTRICALMACiIINERY 148.36 10045 29011. 39056. 7326. 9704. 17030. .346 .755 6831.15. 36. ELI:CTTR[CAL EQUlIPMENT+ SUPPLIES 96.98 7122. 30836. 37958. 5808. 8916. 14724. .231 .651 5834.16. 37. TRANSPORTATIONEQUIPMIENT 190.14 11602. 27067. 38669. 11090. 10824. 21914. .429 1.024 8114.17. 38. INSTRUMENTS+RELATEDPRODUCTS 28.34 11147. 41230. 52376. 13530. 9619. 23150. .270 1.407 5495.18. 39. MISC. MANUFACTURED PRODUCTS 24.71 5667. 17761. 23428. 6228. 9319. 15547. .319 .668 5436.
ALLCATEGORIES 1000.00 20518. 28278. 48796. 9645. 9308. 18953. .701 1.036 5831.
NOTE The table shows average capital-labour ratios in a two-digit industry breakdown. The average capital-labour ratios for the individual product categories havebeen derived by Aeighting by the share of exports of the product category concerned in the total exports for all the 184 categories aggregated over the 36countries. For explanation of the definitions and symbols used, see equations (I) to (3) in the text.

Balassa: A 'Stages Approach' to Coinparatire A dvantage 141
petroleum refining and products have relatively high physical as against humancapital-intensity, regardless of wvhether we use the stock or the flow measure ofcapital. The opposite result has been obtained for canvas products, radio andT'V equipment, aircraft, ships and boats, and scientific instruments and controlequipment. The first group includes product categories where the ratio ofphysical to human capital was between 1.5 and 5 using the stock measure ofcapital intensity and exceeded 1.2 using the flow measure. In turn, productcategories in the second group had a ratio of physical to human capital ofbetween 0.1 and 0.2 under the stock measure of capital and less than 0.6 underthe flow measure (Appendix Table 1).
V. POLICY IMPLICATIONS
This paper has investigated the changing pattern of comparative advantage inthe process of economic development. Comparative advantage has beendefined in terms of relative export performance, thus neglecting thecomposition of imports which is greatly affected by the structure of protection.
For each country, export performance has been related to the capital-intensity of the individual product categories, using a stock as well as a flowmeasure of capital, with further distinction made between physical and humancapital. Next, the inter=country difTerences in the regression coefficients thusobtained have been correlated with country characteristics, such as physicaland uruman capital endownient and the level of economic development.
The empirical estimates show that inter country differences in the strulctureof exports are in a large part explained by differences in physical and humancapital endowments. The results lend support to the 'stages' approach tocornparative advantage, according to which the structure of exports changeswith the accumulation of physical and human capital.2 6 This approach is alsosupported by intertemporal comparisons for Japan, which indicate thatJapanese exports have become increasingly physical capital and human capitalintensive over time (Heller, 1976).
These findings have important policy implications for the developingcountries. To begin with, they warn against distorting the system of incentivesin favour of products in which the country has a comparative disadvantage.The large differences shown among product categories in terms of their capital-intensity point to the fact that there is a substantial penalty for such distortionsin the form of the misallocation of productive factors.
Possible magnitudes of the economic cost of distortions are indicated inTable 11.7. This provides coimparisons between productio-n costs in the UnitedStates, assuming that pre-tax returns and depreciation anmount to 30 per cent of
26The expression 'stages' is used here to denote changes over time that occur more orless continuously rather than to discrete, stepwise changes. It is thus unrelated toeconomic stages described by Marx, the exponents of the German historical school,and Rostow.

TABLE 11.7
IIY'POTFIETICAL PRODUCTION COSTS CALCULATED UNDER ALTERNATIVE ASSUMPTIONS (US DOLLARS)
Product CategorY United States Developing Cotun7try, Ratio of
Plivsical Humnani Unskilled Total Physical Human Un;skilled Total rotalCapital Capital Labour Costs Capital Capital Labovor Costs Costs
Cacpital-ieLn give
1. Petroleum refining and products 37,833 6563 5342 49,738 54,215 9405 1781 65,401 1.3152. Wood pulp 26,400 4747 6382 37,529 37,831 6802 2127 46,760 1.2463. Organic cheniicals 22,635 4875 6632 34,142 32,436 6986 2211 41,633 1.2194. Synthetic rubber 20,826 5121 6632 32,579 29,844 7338 2211 39,393 1.209S. Carbon black 18,669 3893 6632 29,194 26,753 5579 2211 34,543 1.1836. Inorganic chemicals 16,044 3928 6632 26,604 22,991 5629 2211 30,831 1.1597. Paper 14,778 3983 6382 25,143 21,177 5707 2127 29,011 1.154
L.4,oiur.igcsive5sSll8. Gamesand toys 1521 359 5436 7316 2180 514 1812 4506 0.6169. Vitreous china food utensils 1608 186 6082 7876 2304 267 2027 4598 0.584
10. Costume jewelery 978 533 5436 6947 1401 764 1812 3977 0.57211. Ieather bagsand purses 711 311 5096 6118 1019 446 1699 3164 0.51712. I;artlhenware food utensils 1056 0 6082 7138 1513 0 2027 3540 0.49613. Woollen yarnand thread 486 160 4228 4874 696 229 1409 2334 0.47914. Footwear 660 156 5450 6266 946 224 1817 2987 0.477
All Categories 6155 2828 5831 14,815 8818 4052 1944 14,815 1.000
NOTE US production costs have been calculated by adding 30 per cent of the gross value of physical capital, assumed to reflect pre-taxearninms and depreciation, to observed labour costs. In turn, for the lihyp)odhetical developing country it has been assumed that unskilledwages are one-third of US wages and the cost of capital is correspondingly highier. The latter has been estimated to exceed US costs by43.3 per cent under the assumption that value added in the entire manufacturing sector is the same in the two cases. All data areexpressed per worker.

Balassa: A 'Sagv, A4pproach'to Comparativ d.4dvann:go 143
the gross value of physical capital, antd production costs in a hypotheticaldeveloping country wvhere unskilled wagcs are one-third of US wages2" and thecost of capital is commensurately higher.2" In the latter country, the estima-tedcost of capital-intensive products is 15 to 32 per cent lhiglher, and that oflabour-intensive products 38 to 52 per cent lower, than in the United States, sothat differences in relative costs between capital- and labour intensive productsrange from 1L87 to 2.76.29
The economic cost of policy distortions may be especially high in countriesthat bias the systern of incentives in favour of import substitution in capital-intensive industries and against exports in labour-intensive industries. Costswill also be incurred if capital-intensive exports are artificially promoted.
The results can further be utilised to gauge the direction in which a country'scomparative advantage is moving. For this purpose, use may be made of theregression estimates obtained as regards total capital-intensity. As a first step,we substitute projected future VEalues of a country's physical aind human capitalendowments in the inter-country regressions, so as to estimate the prospectivevalues of the , coefficients. 30 Next. we derive the hypothetical structure ofexports corresponding to the estimated P coefficients, which are taken to reflectthe country's future physical and human capital endowments. Comoparing theprojected export structure with the actual siructure of exports, one can thenindicate prospective changes in export flows?3'
The regression estimates obtained in regard to physical and human capital-intensity can also be used in the manner described above so as to indicatc therelative importance of physical and human capital intenisive products in acountry's future export structure. Given the poor statistical results of theregressions for physical capital intensity, however, one should utilise directlythe data reported in Appenclix 1, which show the physical and the humancapital-intensity of individual product categories.
"In 1974, average wages in manufacturing in Korea were 9 per cenlt, and in thePhilippines 6 per cent, of US wages (ILO, Yearbook of Labor Statistics).
28The difference in the cost oF capital has been estimated at 43.3 per cent under theassumption that value added in the manuracturing sector was the same in the twocases. It has further been assumed that the absolute difference between skilled andunskilled wages remained the same.
29As elsewhere in the paper, the calculations do not allow for factor substitution inresponse to inter-country differences in factor prices.
301n line with the stages approach to conmparative advantage, this is done on theassumption that new countries exporting manufactured gnoo(s will enter at the lowerend of the spectrum. It is further assumed that the relative importance of capital-intensive goods in world exports will continue to increase over time.
39These projections further need to be adjusted in cases when ohlcrved values of theP-coefficients differ from values estimnated from the inter-country regression. Theresults are also subject. to the usual projectioni error and may be biased to the extentthat high protection in countries with poor capital endowminent affects the slope of theinter--country regression.
144 FEconicuniic Gri'( ih ,nd Resrmrces
The stages approach to cornparativc ald. antage also permits olne to dispelcertain misapprehensions as regards the foreign demland constraint underwhich developing countries are saidl to operate. With countries progressing onthe conmparative advantage scale, their exports can supplant the exports ofcountries that graduate to a higher level. Now, to the extent that oniedeveloping country replaces anothler in the inmports of particular c.nirnoditiesby the developed countries. the problem of adjustmnent in the latter group ofcountries does not arise. Rather, the brunt of adjusNtment wvill 1:i. borne inindustries where the products of newvly graduating developing coruntriescompete with the products of the dc'. eloped countries.
A case in point is Japan, whose coinparati'. e advantage has shifted towardshighly capital intensive exports. In turn, dcvcl oping countries with a relativelyhigh human capital endownient, such as Korc.i and Taiwan, can take Japan'splace in exporting relatively human capital initinsive products, and countries*with a relatively high physical c,lpital en,.'. incnt, such as Brazil and Mexico,can take Japan's place in exporting relativelv physical capital intensiveproducts. Finally, countries at lower {evels of development can supplant themiddle level countries in exporting unskilled-labour-intensive commodities.
The prospects of economic growth through exports thus appear muchbrighter once we understand the character of the changing pattern ofcomparative adv antage. Further work on the experience of individual countriesover tirme would be necessary. however, in o.Yder to study this pr.acess in moredepth.
REFERENCLES
Balassa. B.. 1965, tTrade Liberalization and Re; coled Crmparati% e Ad- antage',Mfanfchester School, Mav, vol. 33.
1 1969, 'Country Size and Trade Patterns: Commcnt', Amern, an EconomicReriew, March. vol, 59.
Baldwin. R. E... 1971. 'Determinants of the Conniodity Struictuire of U1.S. Trade'.American Ecoi,r,,ic Re'ieuPaprers and an'dPr' c,'jintr March, vol. 61.
Banerji. R.. 1975. Exports offainutf/ctlures fromit Indliai (Kieler Studien. Institut f;irWeltwirtschaft an der Universiiat Kiel, JCRB Mohr (Paul Sihecek), T;ihingen).
Branson. W. B.. 1973. Factor Inputs. U.S. Trade, and the Hleckscher--Ohlin Model'.Seminar Paper No. 27. Institute for International Feoroomic Sttjdies, Uni%ersity ofStockhohlm.
Branson. W\'. H., and H. Junz, 1971, 'Trenkis in U T.S. Comparative Advant age'.Br'iu/i'mige Papeir (,)1n Economin 4,.cih iiY. 0ol. 2.
Cornwall. A. B. 1972. 'nquen1CC of the Natural Resource Factor on the ComparativeAd'. antage of t ess Developed Conltries'. lier 'milinmlt EC'(,ionui1 Remi/et. Fall,\ ol. 3.
Falloti. P. R and P) R. Gs. L,smard. 1975, 'Capital Skill Complenmentarity. IncoimeDistribut onl. aln1d Otitptutt Ac;nunting'. Journal of PA-!W. inl E.'- m. Api il l. 83.
Fels. G.. 1972, 'The Choice Of Irdustry Nlix in the Dm'ision of Labor betv.eenDe-celoped and r)De\ elotling Counitries, W el'tnirl., hI1?/w10w Arhi/. RBand 1WS. Hleft 1.
joo(idmani. .. a-nd R. Cevhinn 1976. '11.S. isport P'rrmance in ManufacturingIndustries: An fEmpririctl In e Ar'htionr. H 'c/i/i r'.ctm,.rf,/ih .4rchi. Band 112. left 3.
Gruber. W. H.. and R. Vernon. I070t. 'Tlhe Techin l'gy I i i tur in a N'orld Trade

Balassa: A 'Stages Approach' to Comparative .dvantage 145
Matrix'. in The Technology FUL:IUr int International 7Tae,e, ed. R. Vernon (NationalBureau of Econonic Research. Columbia University Press).
Harbison, F. H., J. Maruhnic andi J. R. Resnick, 1970, Quiantitative Analyses ofMlodernli:ation and Devulopmnent (Industrial Relations Section, Dept. of Economiiies.Princeton University, Princetoni).
Harkness. J.. and J. F. Kyle, 1975, 'Factors Influencin,, United States ComparativeAdvarn It age', Jouirizal of IMernatiol Economics. May, vol. 5.
fHelleinier, G. K.. 1976. 'l1ndn;rr Clharacteristics and the Compclitiv(:Illes ofManufactures from Less-Developed Counitries'. I1't/ltzl irtscha,fi/ichyes Archih, Band1 12, Heft 3.
Heller, P. S., 1976, 'Factor Endo\ nmenit Change and Comparative Advantage', Reviewtof Econtomttics anid Statistics, August. vol. 58.
Herman. B.. 1975, Tlhe Optlinal International Division of Lahor (Tnternational LaborOffice, Geneva).
Herman, B., and J. Tinbergen. 1970 'Planning of International Devclopment',ProceTldinlg of the lIternlationial Cozflerence oni )'tuliustrial Economics, Bunlapest.April 15-417.
Hirsch, S.. 1974. 'Capital or Tchnoloay? Confronting the Neo-Factor Proportionsand the Neo Technology Accounll n of International Trade', WeltwvirtschaftlichesArchiv. Band 110. Heft 1.-, 1975, 'The Product Cycle Model of International Trade - A Multi-CountryCross Section Analysi:.'. Oxford Builletin of Econolics and Statistics November.vol. 27.
Hufbauer. G. C.. 1970. 'The Impact of National Characteristics and Technology onthe Commodity Crmnpo-;ition ofTrade in %lanufdctured Goods', in 7The TethnlogyFactor in n1t'rna.ltiouzWL Tradle. ed.. R. Vernon (National Bureau of EconomicResearc.i Colunibia Universitv Press).
Johnson. H. G. 1970. 'The State of Theory in Rel:ition to Empirical Analysis' in ThteTechnolo,gy Factor in lut., notaional Trade. op. cit.
Kenen. P. B.. 1965. 'Nature. Capita-l and Trade'. Joutrnal of Political EconoMY,October. vol. 73.
Kojima. K.. 1970, 'Structure of Comparative Advantage in Industrial Countries. AVerification of the Factor- Proportions Theorem',liotuhcshiJourwl ofEconomics. June, vol. I 1.
Krueger. A. O. 1974. Foreign Trade Regimnes and t Ecoliomtie Development: TurkeY.National Bureau of Economic Research. Columbia University Press.
Lary. H. B.. 1968. Im7zports of Alanufacturesfrom Less Developed Countries. NationalBureau of Ect ionomic Research. Columbia Universitl Press.- 1 1970, 'Comimilients on The Techlinolog Factor in a World Trade Matrix' in The
Technolog.v Faclor in 1ntIelTHati(n1 7lTzrade, op. cit.Leamer, F., 1974.'The Commodity Complosition ofInternational Trade in
N1lnnrif,ct Ures An Fmnpirical Analysis'. Oxfo brd Ieollomi Puplr, November.vol. 26.
Malifuzur Rahnian. A. H. NI., 1973. Exports of./hnnflctures from D[)elolinr'Countries. (Centre for Dek'elotipent Plknning. Rotterdamii University Press).
Morall. J. F.. 1972. [Ihaiinan Ca()itfal, Tcclioloulgv & the Role of the U.S. inIJterna,'i(ioalo1 Trade (University of F:lorida Pre..ss (hines.- llle).
SchL dIn''. sk,xv D. M. (frort licoiiri) I. 'Arzentinn . in t)ci el p'm'nt Strultei,iec in Seoululumlil %/I !la CounutI i. b 13. B. Bl:al,a anid Associates.
Stern. R. NI.. 1975. 'Testing Trade Trheories'. in International 7Trae and l IniuMu'u. ed.P. B. Kenen (Canibridge University Press).

Appendix
APPENDIX TABLE I
SECTORAL CHARACTERISTICS FOR 184 PRODUCT CATEGORIES (in dollars)
SECTOR PRODUCT CATEGORY Pi ph rp hf kf Pslh / khf
I. COTTON FABRICS (GREY) 11770. 15906. 27676. 2871. 5819. a690. .740 .4932. S'NTIIETIC FABRICS 11690. 22165. 33855. 3734. 6446. 10180. .527 .579
3. WOOLLEN FABRICS 9490. 20229. 29719. 3792. 6248. 10040. .469 .607
4. NARR'1W FABRICS 6820. 15092. 21912. 3778. 5742. 9520. .452 .658
5. HiOSILiY + KNIT FABRICS 6930. 10406. 17336. 4501. 5269. 9770. .666 .8546. KNITOLUTERWEAR 4410. 12826. 17236. 2609. 5511. 8120. .344 .473
K. KNIT UNDERVEAR 4330. 6864. 11194. 2083. 4817. %100oJ. .631 .4248. COTTON' FABRICS (FiNISHED) 3170. 23804. 36974. 3349. 6611. 9960. .553 .5079. WOVEN CARPETS +RUGS i 50. 23188. 34738. 4995. 6545. 11540. .498 .763
10. NONWOVENCARPETS+RLGS ; n .Q7,. 35337. 9569. 6721, 16290. .417 1.42411. YARN + THREAD, EXCEPT WOOL i '3; . 23106. 3652. 536g. 9020. 1.028 .68012. WOOLLEN YARN + THREAD 46l. . 3215. 799. 1221. 2020l. 1.016 .654
13. FELT GOODS 13280. 385h~. 51868 6985. 8085. 15070. .344 .86414. LACE+FMl:h3ROMDMRY 4530. 28545. 33075. 4853. 6787. 11640. .159 .71515. TEXTILE PADDINGS 9460. 24145. 33605. 6336. 6644. 12980. .392 .954
16. CO NibE D FIBERS + PROCESSED TEXTJLE WASTE 9420. 14905. 24145. 4080. 5720. 9800. .620 .713
17. NON RUBBERIZED COATED FABRICS 12370. 44198. 56568. 7024. 8646. 15670. .280 .81218. CORDAGE + TWINE 9100. 19327. 28427. 4880. 6160. 11040. A71 .792I9. TEXTILE GOODS NES 11640. 29568. 41208 7247. 7183 14430. .394 1.009
: ). MENS AND BOYS OUTER APPAREL 1680. 9450. 11130. 3181. 4869. 8050. .178 .653
21. NON"KNIT UNDERWETAR 1920. 7320. 9240. 3042. 4648. 7690. .262 .655
22. TIES,CORSETS+ GLOVES 1990. 15577. 17567. 4324. 5476. 9800. .128 .79023. WOMENSA-C --HILDRENS CLOTHING 2070. 12453. 14523. 3383. 5167. 8550. .166 .655-4. HATS + CAPS 2050. 11217. 13267. 3405. 5045. 8450. .183 .675
25. FUR GOODS 5320. 46677. 51997. 11051. 8589. 19640. .114 1.287
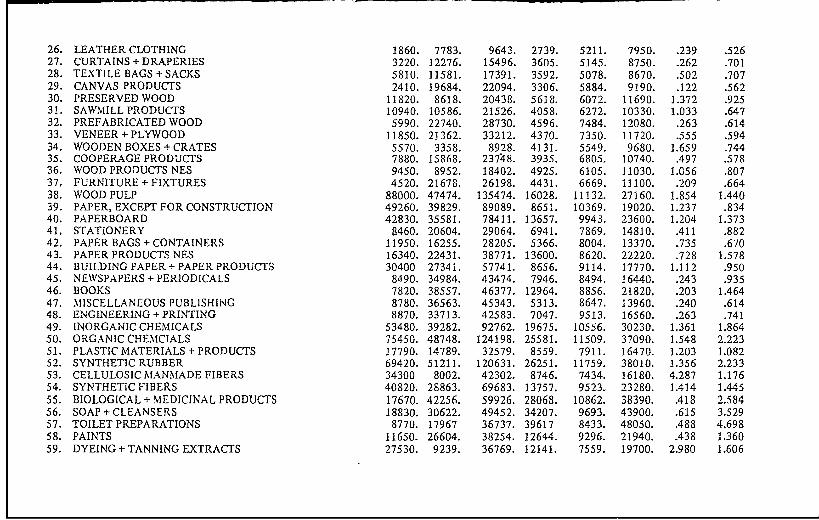
26. LEATHER CLOTHING 1860. 7783. 9643. 2739. 5211. 7950. .239 .52627. CURTAINS + DRAPERIES 3220. 12276. 15496. 3605. 5145. 8750. .262 .70128. TEXTILE BAGS + SACKS 5810. 11581. 17391. 3592. 5078. 8670. .502 .70729. CANVAS PRODUCTS 2410. 19684. 22094. 3306. 5884. 9190. .122 .56230. PRESERVED WOOD 11820. 8618. 20438. 5618. 6072. 11690. 1.372 .92531. SAWMILL PRODUCTS 10940. 10586. 21526. 4058. 6272. 10330. 1.033 .64732. PREFABRICATED WOOD 5990. 22740. 28730. 4596. 7484. 12080. .263 .61433. VENEER + PLYWOOD 11850. 21362. 33212. 4370. 7350. 11720. .555 .59434. WOODEN BOXES + CRATES 5570. 3358. 8928. 4131. 5549. 9680. 1.659 .74435. COOPERAGE PRODUCTS 7880. 15868. 23748. 3935. 6805. 10740. .497 .57836. WOOD PRODUCTS NES 9450. 8952. 18402. 4925. 6105. 11030. 1.056 .80737. FURNITURE + FIXTURES 4520. 21678. 26198. 4431. 6669. 11100. .209 .66438. WOOD PULP 88000. 47474. 135474. 16028. 11132. 27160. 1.854 1.44039. PAPER, EXCEPT FOR CONSTRUCTION 49260. 39829. 89089. 8651. 10369. 19020. 1.237 .83440. PAPERBOARD 42830. 35581. 78411. 13657. 9943. 23600. 1.204 1.37341. STATIONERY 8460. 20604. 29064. 6941. 7869. 14810. .411 .88242. PAPER BAGS + CONTAINERS 11950. 16255. 28205. 5366. 8004. 13370. .735 .67043. PAPER PRODUCTS NES 16340. 22431. 38771. 13600. 8620. 22220. .728 1.57844. BUILDINGPAPER+PAPERPRODUCTS 30400 27341. 57741. 8656. 9114. 17770. 1.112 .95045. NEWSPAPERS + PERIODICALS 8490. 34984. 43474. 7946. 8494. 16440. .243 .93546. BOOKS 7820. 38557. 46377. 12964. 8856. 21820. .203 1.46447. MISCELLANEOUS PUBLISHI11G 8780. 36563. 45343. 5313. 8647. 13960. .240 .61448. ENGINEERING + PRINTING 8870. 33713. 42583. 7047. 9513. 16560. .263 .74149. INORGANIC CHEMICALS 53480. 39282. 92762. 19675. 10556. 30230. 1.361 1.86450. ORGANIC CHEMCIALS 75450. 48748. 124198. 25581. 11509. 37090. 1.548 2.22351. PLASTIC MATERIALS + PRODUCTS 17790. 14789. 32579. 8559. 7911. 16470. 1.203 1.08252. SYNTHETIC RUBBER 69420. 51211. 120631. 26251. 11759. 38010. 1.356 2.23353. CELLULOSIC MlANMADE FIBERS 34300 8002. 42302. 8746. 7434. 16180. 4.287 1.17654. SYNTHETIC FIBERS 40820. 28863. 69683. 13757. 9523. 23280. 1.414 1.44555. BIOLOGICAL + MEDICINAL PRODUCTS 17670. 42256. 59926. 28068. 10862. 38390. .418 2.58456. SOAP+CLEANSERS 18830. 30622. 49452. 34207. 9693. 43900. .615 3.52957. TOILET PREPARATIONS 8770. 17967 36737. 39617 8433. 48050. .488 4.69858. PAINTS 11650. 26604. 38254. 12644. 9296. 21940. .438 1.36059. DYEING+TANNING EXTRACTS 27530. 9239. 36769. 12141. 7559. 19700. 2.980 1.606

APPENDIX TABLE I (continued)
SECTOR PRODUCT CATEGORY ps hf k Pf hf kf pS/lh pf/hf
60. FERTILISERS 39710. 10748. 50458. 11543. 7707. 19250. 3.694 1.49861. MISC. AGRICULTURAL CHEMICALS 30560. 24698. 55258. 29967. 9103. 39070. 1.237 3.29262. ADHESIVES + GELATIN 18500. 34856. 53356. 14986. 10124. 25110. .531 1.48063. EXPLOSIVES 6760. 26423. 33183. 1887. 9273. 11160. .256 .20464. PRINTING INK 10810. 29033. 39843. 8726. 9534. 18260. .372 .91565. CARBON BLACK 62230, 38391. 101161. 30489. 10521. 41010. 1.598 2.89866. MIISC. CHIEMICAL PREPARATIONS 17820. 26071. 43891. 17251. 9239. 26490. .684 1.86767. PETROLEUNM REFINING+PRODUCTS 126110. 65629. 191739. 31310. 11910. 43220. 1.922 2.62968. ASBESTOS+ASPHALTPRODUCTS 19810 43088. 62898. 11119. 9651. 20770. .460 1.15269. TIRES + TUBES 23050. 45124. 68174. 11792. 10958. 22750. .511 1.07670. FOOTWEAR 2200. 1557. 3757. 3360. 5611. 8970. 1.413 .59971. RECLAINIED RUBBER 21620. 22534. 44154. 4059. 8691. 12750. .959 .46772. MISC. RUBBER PRODUCTS 10280. 20621. 30901. 5413. 8507. 13920. .499 .63673. LEATHER 7470. 23815. 31285. 4840. 7480. 12320. .314 .64774. LEATHER INDUSTRIAL BELTING 5130. 25564. 30694. 6324. 7656. 13980. .201 .82675. LEATHER UPPERS 3250. 8041. 11291. 4144. 5896. 10040. .404 .70376. LEATHER BAGS +PURSES 2370. 3113. 5483. 3509. 5401. 8910. .761 .65077. MISC. LEATHER GOODS 2890. 7623. 10513. 2567. 5863. 8430. .379 .43878. FLATGLASS 35560. 49700. 85260. 12076. 11054. 23130. .. 715 1.09279. GLASS CONTAINERS 9980. 7366. 17346. 5710. 6260. 11970. 1.355 .91280. CENMENT+CONCRETE 41110. 31110. 72220. 11447. 9193. 20640. 1.321 1.24581. BRICK+STRUCTURALCLAYTILES 14700. 8708. 23408. 4252. 6948. 11200. 1.688 .61282. REFRACTORIES 22060. 30907. 52967. 8609. 9171. 17780. .714 .93983. VITREOUS PL UM BI NG FIXTURES 11810. 24748. 36558. 7498. 8562. 16060. .477 .87684. VITlREOUS CHINA FOOD UTENSILS 5360. 1861. 7221. 3390. 6260. 9650. 2.880 .54185. EARTHENWtARE FOOD UTENSILS 3520. 0. 3520. 764. 5606. 6370. R .13686. PORCELAIN PRODUCTS 9620. 11122. 20742. 3743. 7197. 10940. .865 .52087. CONCRETE + BRICK PRODUCTS 11980. 20101. 32081. 6702. 8088. 14790. .596 .82988. LIME 46700. 28313. 75013. 8969. 8911. 17880. 1.649 1.00689. GYPSUM PRODUCTS 49070. 33163. 82233. 12184. 9396. 21580. 1.480 1.297
90. CUT STONE PRODUCTS 7100. 7783. 14883. 3072. 6858. 9930. .912 .448
91. ABRASIVE PRODUCTS 15S80. 29249. 44829. 8467. 9013. 17480. .533 .939
92. ASBESTOS PRODUCTS 13320. 23891. 37211. 6199. 8471. 14670. .558 .732
93. MINERALWOOL 21330. 32757. 54087. 11098. 9362. 20460. .651 1.185
94. MISC. NONMETALLIC MINERAL PRODUCTS 12330. 22278. 34608. 4827. 8313. 13140. .553 .581
95. STEEL+ STEEL PRODUCTS 37850. 31089. 68939. 6729. 10631. 17360. 1.217 .633
96. IRON FOUNDRIES 11460. 23994. 35454. 4569. 9511. 14080. .478 .480
97. STEEL FOUNDRIES 11440. 14716. 26156. 4112. 9208. 13320. .777 .447
98. WROUGHT COPPER 23400. 30342. 53742. 8544. 10036. 18580. .771 .851
99. WROUGHTALUMINIUM 32930. 30085. 63015. 5647. 10013. 15660. 1.095 .564
100. NONFERROUS METALS NES 19760. 25371. 45131. 9154. 9546. 18700. .779 .959
101. ALUMINIUM CASTINGS + STAMPINGS 13160. 37694. 50854. 4745. 10025. 14770. .349 .473
102. BRASS, BRONZE+ COPPER CASTINGS 10260. 21309 31569. 4502. 9138. 13640. .481 .493
103. IRON+STEELEORGINGS 13070. 34100. 4,-170. 4765. 11145. 15910. .383 .428
104. PRIMARY METAL PRODUCTS NES 15840. 18649. 34489. 6554. 9476. 16030. .849 .692
105. METAL CONTAINERS 18720. 39734. 58454. 10848. 9902. 20750. .471 1.095
106. CUTLERY 10100. 20473. 30573. 13694. 7976. 21670. .493 1.717
107. HAND+EDGETOOLS 8650. 29390. 39040. 7959. 8871. 16830. .294 .897
108. HANDSAWS + SAWBLADES 7780. 18343. 26123. 6609. 7761. 14370. .424 .852
109. H4ARDWARE NES 10200. 28076. 38276. 6925. 8735. 15660. .363 .793
110. SANITARY + PLUMBING FIXTURES 10560. 25764. 36324. 6391. 8509. 14900. .410 .751
111. NONELECTRIC HEATING EQUIPMENT 7070. 24427. 31497. 7057. 8373. 15430. .289 .843
112. STRUCTURAL METAL PRODUCTS 6930. 27283. 34213. 5264. 8656. 13920. .254 .608
113. PLATEWORK + BOILERS 9010. 34228. 43238. 7293. 9347. 16640. .263 .780
114. BOLTS+NUTS 11800. 36358. 48158. 6527. 9563. 16090. .325 .683
115. SAFES +VAULTS 6110. 38511. 44621. 13432. 9778. 23210. .159 1.374
116. FABRICATEDMETALPRODUCTSNES 10120. 26116. 36236. 6257. 8543. 14800. .388 .732
117. STEAMENGINES+TURBINES 13460. 45537. 58997. 7183. 11257. 18440. .296 .638
118. INTERNAL COMBUSTION ENGINES 15990. 24173. 40163. 8019. 10411. 13430. .661 .770
119. FARM MACHINERY 10230. 20823. 31053. 6930. 8810. 15740. .491 .787
120. CONSTRUCTION +DRILLING MACHINERY 10600. 35814. 46414. 6483. 10287. 16770. .296 .630
121. CONVEYING + CARRYING EQUIPMENT 6610. 30535. 37145. 7443. 9757. 17200. .216 .763
122. INDUSTRIAL TRUCKS + TRACTORS 7110. 26440. 33550. 7309. 9351. 16660. .269. .782
123. MACHINE TOOLS 11620. 41454. 53074. 5639. 10851. 16490. .280 .520

APPENDIX TABLE 1 (continued)
SECTOR PRODUCT CATEGORY Pi k p kf pf/h f pI/hf
124 METAL+WOODWORKING MACIINERY 9320. 23959. 33279. 6747. 9103. 15850. .389 .741125. FOOD PRODUCTS MACHINERY 7570. 29204. 36774. 6928. 9622. 16550. .259. .720126. TEXTILE + LAUNDRY MACHINERY 9440. 21364. 30804. 7610. 8550. 16160. .442 .890127. PAPERMAKINGMACHIINERY 10960. 31110. 42070. 5966. 9814. 15780. .352 .608128. SPI:CIAL INDUSTRY MACHINES NES 8540. 39041. 39481. 6868. 9802. 16670. .276 .701129. AIRCOMPRESSORS+PUMPS 8880. 27219. 36099. 7770. 9430. 17200 .326 .824130. BALL + ROLLER BEARINGS 15800. 30400. 46200. 4714. 9746. 14460. .520 .484131. INDUSTRIAL FURNACES + OVENS 2760. 8020. 10780. 2566. 4004. 6570. .344 .641132, GENERAL INDUSTRIAL MACHINERY NES 7910. 24793. 32703. 6738. 9182. 15920. .319 .734133. TYPEWRITERS 10250. 25301. 35551. 12402. 9238. 21640. .405 1.342134. COMPUTERS 7400. 41578. 48978. 9217. 10863. 20080. .178 .849135. CALCULATING + ACCOUNTING MACHINES 7560. 20586. 28146. 8275. 8765. 17040. .367 .944136. SCALES + BALANCES 4870. 23451. 28321. 6893. 9047. 15940. .208 .762137. OFFICE MIACIiINERY NES 9210. 26824. 36034. 9625. 9385. 19010. .343 1.026138. AUTOMATIC MERCHANDISING MACHINES 7190. 7716. 14906. 6431. 7479. 13910. .932 .860139. REFRIGERATION MACHINERY 8320. 20541. 28861. 8307. 8753. 17060. .405 .949140. NOM'ZLECTRICAL MACHINERY NES 7950. 22605. 30555. 5102. 8968. 14070. .352 .569141. EL-'CTRIC MEASURING INSTRUMENTS 5670. 30040. 35710. 6232. 8838. 15070. .189 .705142. TRANSFORMERS, MOTORS + GENERATORS 8500. 28378. 36878. 5660. 8670. 14330. .300 .653143. CARBON+ GRAPHITE PRODUCTS 24760. 29715. 54475. 10636. 8804. 19440. .833 1.208144. HOUSEHOLDCOOK I GEQUIPMENT 6690. 22527. 29217. 6044. 8086. 14130. .297 .748145, HOUSEHOLD REFRIGERATORS + FREEZERS 8870. 33611. 42481. 8603. 9197. 17800. .264 .935146. ELECTRICAL HOUSEWARES + FANS 6240. 10702. 16942. 9004. 6906. 15910. .583 1.304147. SEWING MACHINES 10810. 38991. 49801. 6884. 9736. 16620. .277 .707148. ELECTRIC LAMPS 9380. 1'I94. 22924. 10608. 7142. 17750. .751 1.485149. LIGHTING FIXTURES 6650. 19563. 26213. 7006. 77194. 14800. .340 .899150. RADIO+TVEQUIPMENT 5450. 42988. 48438. 4951. 10129. 15080. .127 .489151. PHIONOGRAPHIC RECORDS 6250. 9939. 16189. 8232. 6828. 15060. .629 1.206152. TELLPIIONE + TELEGRAPH APPARATUS 9360. 37508. 46868. 6941. 9579. 16520. .250 .725153. ELECTRONIC COMPONENTS + ACCESSORIES 7910. 22078. 29988. 3909. 8041. 11950. .358 .486
L ~ -I

154. STORAGE BATTERIES 9940. 34723. 44663. 7780. 9310. 17090. .286 .836155. PRIM.ARY BATTERIES 7750. 14431. 22181. 12803. 7277. 20080. .537 1.759156. XRAY APPARATUS + TUBES 5860. 42854. 48714. 7132. 10118. 17250. .137 -05157. AUTO.MIOTIVIE ELECTRICAL EQUIPMENT 8440. 34409. 42849. 7764. 9276. 17040. .245 .6j7158. MOTORVEHICLES+BODIES 13210. 25855. 39065. 13616. 11064. 24680. .511 1.231159. TRAILERS 3720. 6420. 10140. 4832. 7338. 12170. .579 .659160. AIRCRAFT 6820. 41483. 48303. 5339. 12121. 17460. .164 .440161. AIRCRAFT ENGINES + EQUIPMENT 8830. 35132. 43962. 4268. 11482. 15750. .251 .372162. SHIPS+ BOATS 5730. 32125. 37855. 1538. 9392. 10930. .178 .164163. LOCOMOTIVES + PARTS 11780. 50318. 62098. 18106. 11204. 29310. .234 i.616164. RAILROAD CARS 9660. 36258. 45918. 1771. 9799. 11570. .266 .181165. MOTORCYCLES, BICYCLES + PARTS 5940. 15325. 21265. 4381. 7709. 12090. .388 .568166. SCIENTIFICINSTRUMENTS+CONTROLEQUIP. 6040. 35157. 41197. 5394. 9016. 14410. .172 .598167. OPTICAL INSTRUMENTS 6600. 43467. 50067. 5965. 9845. 15810. .152 .606168. MEDICALAPPLIANCES + EQUIPMENT 6470. z5155. 31625. 8762. 8008. 16770. .257 1.094169. OPHTHALMI IC GOODS 6020. 15288. 21308. 6438. 7022. 13460. .394 .917170. PHOTOGR APHIC EQUIPMENT+ SUPPLIES 17720. 57378. 75098. 21716. 11234. 32950. .309 1.933171. WATCHES+CLOCKS 3840. 17270. 21110. 6386. 7224. 13610. .222 .884172. JENW'ELRY + SILVERWARE 4680. 24708. 39388. 6119. 7911. 14030 .189 .773173. LAPIDARY WORK 6370. 29030. 35400. 8507. 8343. 16850. .219 p1.020174. MIUSICALINSTRUMENTS+PARTS 5250. 17739. 22989. 4287. 7213. 11 50Q. .296 .594175. GANIES+TOYS 5069. 3585. 8654. 3922. 13408. 17330. 1.414 .293176. CIIILDRENS VEHICLES 6860. 10903. 17763. 4554. 6526. 11080. .629 .698177. MISC. SPORTING GOODS 5180. 8676. 13856. 5305. 6305. 11510 .597 .826178. WRITING INSTRU.MIENTS + NMATERIALS 6630. 15678. 22308. 6327. 7003. 13330. .423 .904179. COSTUME JEWELRY 3260. 5329. 8589. 4988. 5972. 10960. .612 .835180. BUTTONS 5120. 11302. 16422. 4470. 6570. 11040. .453 .680181. NEEDLES,PINS+FASTENERS 6560. 11756. 18316. 6765. 6615. 13380. .558 1.023182. BROONIS + BRUSHES 5800. 5540. 11340. 5336. 5994. 11330. 1.047 .890183. HARD FLOOR COVERINGS 28460. 38547. 67007. 15684. 9296. 249811. .738 1.687184, MIlSCELLANEOUS MANUFACTURES NES 4920. 8842. 13762. 4484. 66316. 10800. .556 .710
NOTE ON THE CORRESPONDENCE OF THE PRODUCT CATEGORIES WITH THIE US STANDARD INDUSTRIAL CLASSIFICATION ANDTHE UN STANDARD INTERNATIONAL TRADE CLASSIFICATION, SEE APPENDIX TABLE 2
FOR AN EXPLANATION OF THE DEFINITIONS AND SYMBOLS USED, SEE EQUATIONS (1) AND (3) IN THE TEXT.

1 52 Economic Growth and Resources
A.PPENDIX TABLE 2
CORRESPONDENCE OF THE SECTOR CLASSIFICATION SCHEME WITH T HESTANDARD INDUSTRIAL CLASSIFICATION AND THE STANDARDINTERNATIONAL TRADE CLASSIFICATION
Sector SIC SITC
001 2211 652.1002 2221,2262 653 less 633.2, 653.3, 653.4, 653.9003 2231 653.2004 2241 655.5, 655.9005 2251,2252,2256,2259 841.4 less 841.43, 0.44006 2253 841.44007 2254 841.43008 2261 652.2009 2271 657.5010 2272,2279 657.6, 657.8011 2281,2282,2284 651 less 651.2, .5, .8, .9012 2283 651.2013 2291 655.1014 2292,2395,2396,2397 654.0015 2293 655.8016 2294,2297 262.6, .7, .8, .9; 263.4, 266.23017 2295 611.2,655.4018 2298 655.6019 2299 651.5, 651.9, 653.3, 653.4, 653.9020 2311,232),2327,2328, 841.11
2329021 23'-1,1341 841 less 8A.11, 841.12,022 23, 2342,2>A1,23d9 9 1.2023 23i -235,2337,2339 341.12
2 v1 ')3, 2369024 235i L -J..7, 841,5025 2371 842026 2386,3.51 84125027 2391,2392 656.6, 656.9, 657.7028 2393 656.1029 2394 656 2030 2411,249' 242031 2421,2426,2-,29 2A3,631032 2431,2433 6.).4033 2432 oJ 1.1,631 3 6 631.4 lss 631.42034 2441, 1442,2443 632.1035 2445 632.2036 2499 244, 631.42, 632.7, 632.8, 633037 25 821, 895.1038 2611 251039 2621 641 less 641.5, 641.6040 '2631,2641 641.5

Balassa: A 'Stages Approach' to Comparative A dvantage 153
APPENDIX TABLE 2 (continued)
Sector SIC SITC
041 2642, 2645, 2649, 2761 642.2, 642,32782
042 264D,2651,2652,2653, 642.12654
043 2646, 2647, 2655 642.9044 2661 641.6045 2711,2721 892.2046 2731, 2732 892.1, 892.3047 2741, 2751, 2752, 2771 892.4, 892.9048 2753, 3555 718.2049 2812, 2813,2816,2819 513 less 513.27, 514, 515, 533.1, 561.1050 2815, 2818 321.8, 512, 521, 531, 532.3, 551.2051 2821,3079 581,893052 2822 231.2053 2823 266.3054 2824 266.21, 266.22055 2831, 283X, 2834 541 less 541.9056 2841,2842,2843 554057 2844 553058 2851 533.3059 2861 241.2, 532 less 532.3, 599.6060 2871, 2872 561 less 561.1061 2879 599.2062 2891 599.5063 2892 571.1, 571.2064 2893 533.2065 2895 513.27066 2899 551.1, 571.3, 599.7067 2911, 2992,2999 331 less 331,01; 332068 2951, 2952 661.8069 3011 629.1070 3021, 3141, 3142 851071 3031 231.3072 3069 621, 629 less 629.1, 841.6073 3111 611 less611.2074 3121 612.1075 3131 612.3076 3161,3171,3172 831077 3199 612.2, 612.9078 3211 644.3, 664.4, 664.5079 3221, 3229, 3231 651.8, 664 less 664.3, 664.4, 664.5; 665080 3241, 3273 661.2081 3251, 3253, 3259 662.4082 3255, 3297 662.3, 663.7083 3261 812.2

154 Economic Growth anid Resources
APPENDIX TABLE 2 (continued)
Sector SIC SITC
084 3262 666.4085 3263 666.5086 3264,3269 663.9, 666.6, 723.2087 3271,3272 663.6088 3274 666.1089 3275 273.2090 3281 661.3091 3291 663.1,663.2, 697.9092 3292,3293 663.8, 663.2, 697,r093 3296 663.5094 3299 663.4095 3312, 3313, 3315, 3316, 693.2, 693.3, 694.1, 698.3, 698.6, 719.93,
3317,3566,3481, 67 less 671.3, 678.1, 678.5, 6793493
096 3321,3322,3494,3497 678.1,678.5,679.1,719.92097 3323 679.2098 3351 682 less 682.1099 3352 684 less 684.1100 3356, 3357 681, 683.2, 685.2, 686.2, 687.2, 688,
689 less 689.13, 693.1, 723.1101 3361,3461 697.2102 3362,3369,3392 698.9103 3391 679.3, 698.4104 3399 671.3105 3411,3491,3496 692.2106 3421 696107 3423 69.5.1, 695.22, 695.23108 3425 695.21109 3429 698.1110 3431,3432 812.3111 3433 719.13, 82.1112 3441,3442, 3444,3446, 619, 693.4
3449113 3443 692.1,692.3,711.1,711.2,711.7114 3452 694.2115 3492 698.2116 3499 719.66,729.91117 3511 711.3,711.6,711.8118 3519,3714 711.5119 3522 712,719.64120 3531, 3532, 3533, 3544, 695.24, 695.25, 695.26, 718.4, 718,51,
3545 719,91,719.54121 3534,3535,3536 719.31122 3537 719.32123 3541,3542 715,1

Balassa: A 'Stages Approach' to Comparative A dvantage 155
APPENDIX TABLE 2 (continued)
Sector SIC STIC
124 3548,3553 715.22, 715.23, 729.6, 719.52,719.53125 3551 718.3, 719.62126 3552, 3582, 3633 717.1 less 717.14, 725.02127 3554 718.1128 3559 715.21,717.1 less all but 717.14,717.2,
718.5 less 718.51, 719.19, 719.51,719.61, 719.8
129 3561,3564,3586 719.21,7!9.22130 3562 719.7131 3567,3623 719.14, 729.92132 3569 719.11,719.23133 3572 714.1134 3573 714.3135 3574 714.2136 3576 719.63137 3579 714.91138 3581 719.65139 3585 719.12, 719.15140 3599 719.99141 3611 729.5,729.99142 3612,3621 722.1143 3624 729.96144 3631 697.1145 3632,3639 719.4,725.01146 3634,3635 725 less 725.01, 725.02147 3636 717.3148 3641 729.2, 729.42149 3642 729.94, 812.4150 3651,3662 724 less 724.91, 729.7, 729.93, 891.1151 3652 891.2152 3661 724.91153 3671,3672, 3673,3674, 722.2, 729.3, 729.95, 729.98
3679154 3691 729.12155 3692 729.11156 3693 726157 3694 729,41158 3711,3712,3713 7321ess 732.9159 3715,3791,3799 733.3160 3721 734 less 734.92161 3722,3723,2739 711.'1,734.92162 3731,3732 735163 3741 731.1,731.2,731.3164 3742 7311ess 731.1,731.2,731.3165 3751 732.9, 733.1

156 Econiomnic Groit-h atd ResourcesAPPENDIX TABLE 2 (continued)
Sector SIC SITC
166 3811,3821,3822 861.8,861.91css 861.92,861.94167 3831 861.1,861.3168 3841, 3842, 3843 541.9, 733.4, 861.7, 899.6169 3851 861.2170 3861 861.4,861.5, 861.6,862171 3871 864172 3911,3912,3914 897.1173 3913 667174 3931 891 less 891.1, 892175 3941,3942 894.2176 3943 894.1177 3949 894.4178 3951, 3952, 3953, 3955 895 less 895.1179 3961 897.2180 3963 899.5181 3964 698.5182 3991 899.2183 3996 657.4184 3999 613, 861.92, 861,94, 894.5, 899 less
899.2, 899.5, 899.6
THE WORLD BANKHeadquarters.1818 H Street, N.W. UWashington, D.C. 20433, U.S.A.
European Office:66, avenue d'Iena75116 Paris, France
Tokyo Office:Kokusai Building,1-1 Marunouchi 3-chomeChiyoda-ku, Tokyo 100, Japan
The full range of World Bank publications, both free and for sale, isdescribed in the World Bank Catalog of Publications, and of the continuingresearch program of the World Bank, in World Bank Research Program:Abstracts of Current Studies. The most recent edition of each is availablewvithout charge from:
PUBLICATIONS UNIT
THE WORLD BANK
1818 H STREET, N.W.
WASHINGTON, D.C. 20433
U.S.A.
Copyright © 2022 FDOKUMEN