The identification of Trypanosoma brucei subspecies using repetitive DNA sequences
Upload
independentCategory
view
7download
0
Comparative SILAC Proteomic Analysis of Trypanosomabrucei Bloodstream and Procyclic Lifecycle StagesMichael D. Urbaniak., M. Lucia S Guther., Michael A. J. Ferguson*
Division of Biological Chemistry and Drug Discovery, College of Life Sciences, University of Dundee, Dundee, United Kingdom
Abstract
The protozoan parasite Trypanosoma brucei has a complex digenetic lifecycle between a mammalian host and an insectvector, and adaption of its proteome between lifecycle stages is essential to its survival and virulence. We have optimizeda procedure for growing Trypanosoma brucei procyclic form cells in conditions suitable for stable isotope labeling by aminoacids in culture (SILAC) and report a comparative proteomic analysis of cultured procyclic form and bloodstream form T.brucei cells. In total we were able to identify 3959 proteins and quantify SILAC ratios for 3553 proteins with a false discoveryrate of 0.01. A large number of proteins (10.6%) are differentially regulated by more the 5-fold between lifecycle stages,including those involved in the parasite surface coat, and in mitochondrial and glycosomal energy metabolism. Ourproteomic data is broadly in agreement with transcriptomic studies, but with significantly larger fold changes observed atthe protein level than at the mRNA level.
Citation: Urbaniak MD, Guther MLS, Ferguson MAJ (2012) Comparative SILAC Proteomic Analysis of Trypanosoma brucei Bloodstream and Procyclic LifecycleStages. PLoS ONE 7(5): e36619. doi:10.1371/journal.pone.0036619
Editor: Ziyin Li, University of Texas-Houston Medical School, United States of America
Received February 7, 2012; Accepted April 3, 2012; Published May 4, 2012
Copyright: � 2012 Urbaniak et al. This is an open-access article distributed under the terms of the Creative Commons Attribution License, which permitsunrestricted use, distribution, and reproduction in any medium, provided the original author and source are credited.
Funding: This work was supported by a Wellcome Trust (www.wellcome.ac.uk) Programme Grant (085622) and Strategic Award (083481). The funder had no rolein study design, data collection and analysis, decision to publish, or preparation of the manuscript.
Competing Interests: The authors have declared that no competing interests exist.
* E-mail: [email protected]
. These authors contributed equally to this work.
Introduction
Trypanosoma brucei is a protozoan parasite transmitted by the bite
of the tsetse fly, and is the etiological agent of African sleeping
sickness. The disease is invariably fatal if untreated and is
estimated to be responsible for ,10,000 deaths per annum in
sub-Saharan Africa [1]. Current treatments are expensive, toxic
and difficult to administer leaving an urgent unmet need for new
therapeutic agents [2].
T. brucei has a complex digenetic lifecycle between an insect
vector and mammalian host, and the ability to respond to its
environment through adaption of its proteome is essential to its
survival and virulence. The clinically relevant bloodstream form
lives in the bloodstream and lymph of the host in the first stage of
the disease, before crossing the blood-brain barrier in the second
stage of the disease leading to coma and death. The pleomorphic
bloodstream form exists as both a replicative long-slender
morphology and a division arrested stumpy form which is pre-
adapted for transmission into the tsetse fly. Upon ingestion by the
tsetse fly the parasite differentiates into a replicative procyclic form
to enable survival in its new environment. The lifecycle is
completed by migration to the salivary glands and transformation
to an adherent epimastigote form, followed by transformation to
a detached metacyclic form, which is then competent for
transmission into the bloodstream of the mammalian host when
the tsetse takes a blood-meal.
Both the procyclic form and bloodstream form of the parasite
may be cultured in vitro. Reverse genetic approaches have been
made possible by constructing cell lines containing T7 and
tetracycline-responsive procyclin promoters to drive expression of
the selectable marker and test gene respectively [3]. Through
adaptation to continuous culture the bloodstream form parasite
has become monomorphic, having lost the ability to spontaneously
transform to stumpy morphology, but is still considered a relevant
model system.
Trypanosomes are one of the most evolutionarily divergent
eukaryotes for which there are molecular data [4]. The regulation
of gene expression in trypanosomes is distinct from that in most
eukaryotes, as, except for key surface molecules in T. brucei [5], it
does not occur at the transcriptional level. Instead, genes are
transcribed in large polycistronic units, with post-transcriptional
regulation of mRNA processing and stability used to control
mRNA abundance [6]. In T. brucei the mRNAs from neighbouring
genes will often display distinct developmentally regulated profiles
[7,8]. Additional processes such as regulated protein synthesis,
modification and turnover will also contribute to regulated gene
expression [9].
The variation in mRNA abundance in T. brucei between
lifecycle stages and during the differentiation process has recently
been examined by three global transcriptomic studies using
microarrays [10,11,12]. Each found extensive regulation of
mRNA abundance occurs between lifecycle stages and at different
stages during the differentiation process. To date, there have been
no genome-wide comparative proteomic studies between the
lifecycle stages in T. brucei, and the correlation between mRNA
and protein abundance is unclear. We have optimized a procedure
for growing T. brucei procyclic form cells in conditions suitable for
stable isotope labeling by amino acids in culture (SILAC) [13], and
here we report a genome-wide comparative proteomic analysis of
cultured procyclic form and bloodstream form T. brucei cells.
PLoS ONE | www.plosone.org 1 May 2012 | Volume 7 | Issue 5 | e36619

Results and Discussion
Applying SILAC to T. bruceiThe procyclic form T. brucei cells were grown in a modified
SDM-79 media where L-arginine and L-lysine could be replaced
by stable heavy isotopes forms as required for SILAC. Growth
curves of procyclic form T. brucei cells grown in original SDM-79
[14], modified SDM-79 with normal isotopic abundance L-
arginine and L-lysine (SDM-79+R0K0), or in modified SDM-79
with L-arginine U-13C6 and L-lysine U-13C6 (SDM-79+R6K6)
were determined and demonstrated that the division time was
unaffected (Fig. 1A). Furthermore, the gross morphology of the
cells was unaffected after ten days culture, as judged by DIC light
microscopy (Fig. 1B).
If heavy isotope incorporation occurs only by dilution (neglect-
ing protein turnover), then 6–7 cell divisions should produce 96.7–
98.3% incorporation. To experimentally assess the efficiency of
isotope incorporation, procyclic cells were grown in
SDM279+R6K6 for 6–7 cell divisions and subjected to analysis
by LC-MS/MS. The extent to heavy isotope incorporation was
estimated to be 98.861.5% by comparing the relative abundance
of the major isotopic peak of the heavy (arginine-13C6/lysine-13C6)
and light (arginine-12C6/lysine-12C6) forms of twenty peptides
chosen at random. No significant incorporation of proline-13C5 (by
conversion of arginine-13C6) was observed, most likely because the
procyclic growth media is rich in unlabeled proline that would
significantly dilute any proline-13C5 made from arginine-13C6.
To assess the distribution of isotope incorporation across the
proteome we mixed an equal number of procyclic cells grown in
the presence of normal L-arginine and L-lysine (R0K0) with cells
grown in the presence of L-arginine and L-lysine uniformly
incorporating 13C (R6K6) for 6–7 cell divisions and conducted
a global proteomic analysis. To ensure maximum coverage of
membrane and structural proteins, total protein extracts were
prepared using the filter-aided sample preparation technique,
which uses complete solubilization with 4% SDS [15]. After
denaturation and reductive alkylation the proteins were either
fractionated by SDS-PAGE and subjected to in-gel tryptic digest,
or digested with trypsin in solution and peptides separated by SCX
chromatography (Fig. 2). The use of two orthogonal techniques to
fractionate the sample at the protein or peptide level was designed
to improve coverage of the proteome.
The eight fractions obtained from SDS-PAGE and ten SCX
fractions were subjected to LC-MS/MS in technical duplicates,
and the 36 data files analyzed using MaxQuant [16,17] to search
a T. brucei 927 protein sequence database. Altogether 248,648
MS/MS spectra were identified, corresponding to 37,051 non-
redundant peptide sequences and 4005 protein groups with a false
discovery rate of 0.01. The high number of proteins identified
(49% of predicted ORFs) validates the sample processing
technique. Heavy to light ratios (fold-change, FC) could be
determined for a total of 3662 protein groups, with the observed
ratios normally distributed about 1 (Log2 FC=0) as expected for
a 1:1 mixture (Fig. 3 A), confirming that efficient labelling had
occurred. Comparison of the orthogonal separation techniques
revealed that analysis of the SDS-PAGE samples alone was able to
quantify ratios for 1639 protein groups, including 114 protein
groups not quantified by SCX separation. The SCX samples were
able to quantify ratios for 3548 protein groups, including 2023
protein groups not quantified by SDS-PAGE separation. The
separation techniques did not show any significant bias towards
number of transmembrane domains or the proteins isoelectric
point. The SDS-PAGE analysis detected slightly fewer proteins
with molecular weight .200 kDa (1.9%) than SCX (2.9%). The
higher number of observation made by SCX separation may
reflect that, due its higher capacity, approximately ten times as
much material was loaded on the SCX column as was possible to
resolve by SDS-PAGE. Despite this, SDS-PAGE was still able to
quantify as significant number of unique protein groups.
To demonstrate the utility of SILAC to inform biology we
conducted a global comparative proteomic analysis of procyclic
form and monomorphic bloodstream form T. brucei. Cultured
bloodstream form cells were grown in the presence of normal L-
arginine and L-lysine (R0K0) and mixed 1:1 with procyclic form
cells grown in the presence of L-arginine and L-lysine uniformly
incorporating 13C (R6K6) for 6–7 cell divisions. The cells were
detergent solubilized, fractionated by SDS-PAGE and SCX, and
analyzed by LC-MS/MS as described above. Altogether 241,537
MS/MS spectra were identified, corresponding to 38,084 non-
redundant peptide sequences and 3959 protein groups with a false
discovery rate of 0.01. Heavy to light ratios (fold-change) could be
determined for a total of 3553 protein groups (Table S1).
Comparison of the orthogonal separation techniques revealed
that the SDS-PAGE samples alone quantified ratios for 2381
protein groups (272 unique), whilst SCX samples quantified ratios
for 3281 protein groups (1172 unique). The observed heavy to
Figure 1. Growth of T. brucei procyclic form cells in originalSDM-79 and SILAC labelling media. A. Cumulative growth curve.Growth in original SDM-79 containing non-dialysed FBS (open squares)is shown in parallel to SDM-79+R0K0 (open circles) and SDM-79+R6K6(closed circles), both containing dialysed FBS. B. DIC light microscopy. T.brucei procyclic cells grown in original SDM-79, SDM-79+R0K0 or SDM-79+R6K6 for ten days were fixed in 4% paraformaldehyde and DICimages acquired on a Zeiss confocal microscope.doi:10.1371/journal.pone.0036619.g001
Comparative SILAC Proteomics of Trypanosoma brucei
PLoS ONE | www.plosone.org 2 May 2012 | Volume 7 | Issue 5 | e36619

light ratios were widely distributed (Fig. 2 B), with 10.6%
differentially regulated by more the 5-fold (Log2 FC.2.35)
between lifecycle stages. These results are analyzed in more detail
below.
Agreement with known biologyWe initially sought to validate our comparative proteomic data
by examining the fold-changes for proteins known to show
differential regulation between lifecycle stages (Fig. 4). There are
major changes to the energy metabolism between procyclic and
bloodstream form cells that occur in response to their differing
host environments. Bloodstream form trypanosomes derive their
energy from the metabolism of glucose mainly into pyruvate in
a glycolytic pathway compartmentalized into a specialized perox-
isome called the glycosome [18]. In contrast, procyclic form cells
have several alternative pathways for energy. In culture, proline is
the major energy source, and although they still metabolize
glucose it is mainly into phosphoenol pyruvate, which can be
converted by several routes including into acetate in the
mitochondrion [19]. In agreement with these observations, the
comparative proteomic data shows seven glycolytic enzymes are
down-regulated in procyclic form (Log2 FC 22.3 to 23.6), whilst
seven nuclear encoded subunits of cytochrome oxidase are up-
regulated (Log2 FC 2.6 to 4.6) [20]. Additional metabolic enzymes
that are up-regulated in procyclic form include five enzymes
involved in glycosomal pyruvate metabolism (Log2 FC 1.8 to 4.1)
and three enzymes involved in proline degradation (Log2 FC 1.8
to 2.5).
There are major changes to the trypanosome surface coat
between lifecycle stages. Bloodstream form cells have a dense
surface coat of 56106 copies of a single GPI anchored Variant
Surface Glycoprotein (VSG) dimers and collectively 16105 copies
of Invariant Surface Glycoprotein 65 & 75 (ISG65 & ISG75)
family members [21]. Procyclic cells have a surface coat of
GPEET and EP procyclins, anchored by GPI structure distinct
from that found in the bloodstream form by virtue of inositol
acylation which renders it resistant to GPI-PLC.
The VSG variant expressed in our cultured cell line (VSG221,
MITat 1.2) is not present in the T. brucei 927 genomic database,
and, therefore, was not observed in the standard proteomic
analysis, nor were we able to observe procyclins due to their
resistance to tryptic digestion [22]. In order to observe VSG, the
VSG221 sequence (GI:139611) was appended to the protein
sequence database. Re-analysis of the data identified VSG221 with
55 unique peptides (82.6% sequence coverage), and confirmed
that VSG221 is strongly down-regulated in procyclic form (Log2FC 24.9). We were also able to see that ISG65 and ISG75 (Log2FC 24.3 and 22.8) were down-regulated in procyclic form, as
were the enzymes GPI-PLC [23] and GPI deacylase [24] (Log2 FC
23.6 and 24.1) involved in stage-specific GPI processing
The ability of the proteomic data to distinguish proteins with
high sequence homology was confirmed by its ability to
discriminate between two families of enzymes known to be
developmentally regulated. It has previously been observed that
the two tandemly linked copies of the acidocalcisomal pyropho-
sphatase VSP1 (Tb11.02.4910 and Tb11.02.4930) are reciprocally
regulated at the mRNA level between bloodstream and procyclic
stages [7,10]. Despite high sequence homology between the two
genes the comparative proteomic data were able to discriminate
between them based on 4 unique peptides observable for
Tb11.02.4910 (Log2 FC 2.0) and 3 unique peptides for
Tb11.02.4930 (Log2 FC 24.1), confirming the transcriptomic
observation. The regulation of phosphoglycerate kinase PGK
mRNA levels are known to vary with the isoform, with PGKC
(Tb927.1.700) being down-regulated in procyclic form, PGKB
(Tb927.1.710) being up-regulated in procyclic form and PGKA
being constitutively expressed in both bloodstream and procyclic
form parasites [8,25]. The comparative proteomic data was able to
distinguish the three isoforms with Log2 FC 24.5 for PGKC (12
unique peptides) and Log2 FC 3.8 for PGKB (8 unique peptides),
in agreement with the trend in the observed mRNA change.
However, the proteomics data revealed that PGKA was strongly
up-regulated in procyclic form (Log2 FC 2.8, 12 unique peptides)
at the protein level, in contrast with the reported constitutive
expression. This observation raises the possibility that the
regulation of PGKA abundance may occur independently of
mRNA level, adding further complexity to the regulation of PGK
isoforms.
Figure 2. Proteomics workflow. Procyclic cells were cultured inSDM-79+R6K6 then mixed 1:1 with either unlabeled procyclic orbloodstream form cells. Sample complexity was reduced prior to LC-MS/MS analysis by either fractionation at the protein level by SDS-PAGEor at the peptide level by SCX chromatography.doi:10.1371/journal.pone.0036619.g002
Comparative SILAC Proteomics of Trypanosoma brucei
PLoS ONE | www.plosone.org 3 May 2012 | Volume 7 | Issue 5 | e36619

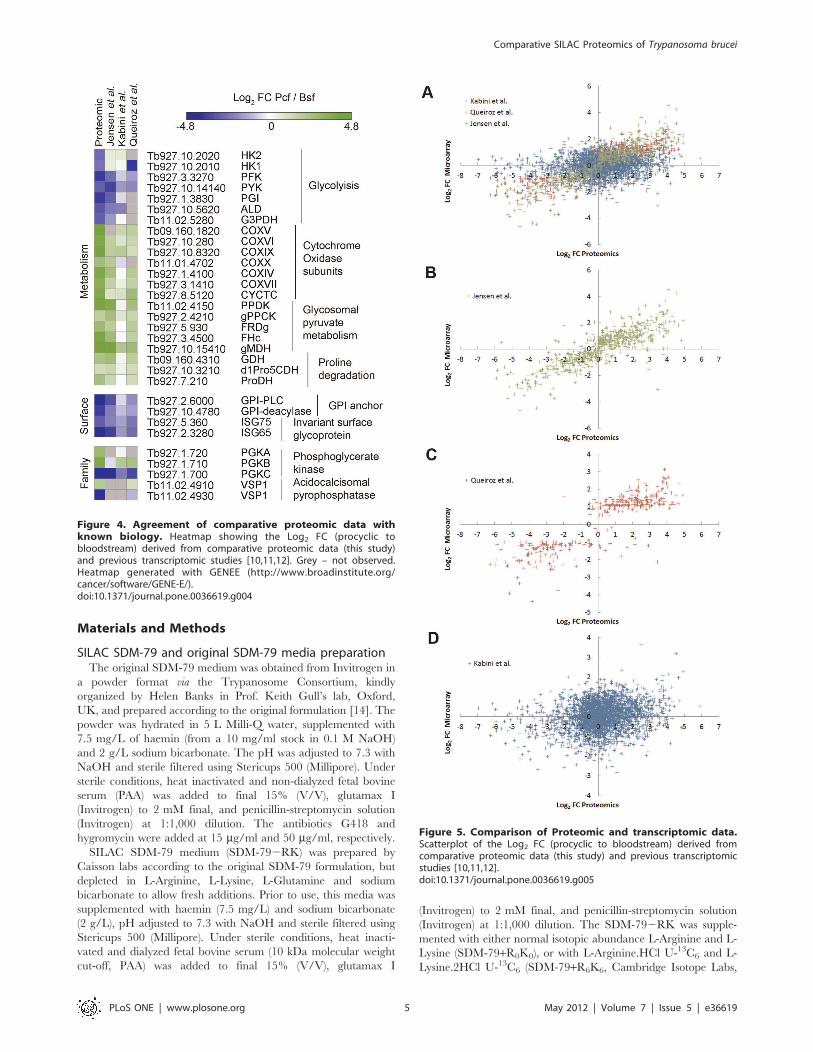
Correlation between proteomic and transcriptomic dataThe correlation between the comparative proteomic data and
the three recently reported T. brucei transcriptomic studies was
examined (Fig. 5 A–D, and Table S2) [10,11,12]. Some of the
variation in correlation observed (Fig. 5 A) may be explained by
considering the differences between the three studies. A good
correlation (0.86) between protein and mRNA abundance was
found when comparing to the Log2 FC in mRNA between
cultured procyclics and cultured bloodstream form cells (pleomor-
phic ‘genome’ strain TREU927/4) reported by Jensen et al. [10]
(Fig. 5B). A slightly lower level of correlation (0.83) between
protein and mRNA abundance was found when comparing to the
Log2 FC in mRNA between cultured procyclics and cultured
bloodstream form cells (pleomorphic strain AnTat1.1) reported by
Queiroz et al. [12]. The final study by Kabini et al. [11] used
animal derived bloodstream form cells (pleomorphic strain
AnTat1.1) to examine differentiation to procyclic form up to
48 h after initiation of differentiation, and we have used the Log2FC between 48 h and slender bloodstream form cells. The poor
correlation (0.2) with the proteomic data may be reflective of the
variability of animal infections and differences between established
cultured procyclic form cells and cells 48 h after initiation of
differentiation.
Overall, the good level of correlation between the protein and
mRNA abundance lends support to the hypothesis that the post-
transcriptional regulation of mRNA level is a significant compo-
nent in the regulation of gene expression in Trypanosoma brucei. The
fold-changes observed at the protein level are consistently larger
(by ,2-fold) than those observed at the mRNA level, suggesting
that either an amplification effect occurs, or the introduction of
experimental bias due to differences in effective dynamic range.
The level of correlation between the transcriptomic studies of
Jensen et al. and Queiroz et al. of 0.91 is only a slight improvement
to their correlation to the proteomic data (0.86 and 0.83
respectively). Of a total of 43 protein ratios showing negative
correlation with the mRNA ratio of Jensen et al. with a Log2FC.|0.5|, only 8 showed negative correlation with both Jensen et
al. and Queiroz et al. (Table 1). Six of these proteins could be
identified with 2 or more unique peptides. Any biological
significance of the negative correlation is unclear.
GO term enrichmentA Gene Ontology analysis was performed using a GO slim set to
identify functional classes of genes amongst those that were either
more than ten-fold up- or down-regulated (Log2 FC$3.32 or
#23.32) at the protein level between the lifecycle stages. Due to
the high occurrence of proteins annotated as hypothetical
conserved in the T. brucei genome only 55 out of the 143 proteins
showing either more than ten-fold up- or down-regulation could
be analyzed. This may contribute to the fact that the enriched GO
terms (P,0.01) are dominated by known biology, i.e. changes in
metabolism and energy (Fig. 5A). An equivalent analysis was
performed using proteins that were constitutively expressed (Log2FC60.25). Of the 663 constitutively expressed proteins 222 were
analyzed, with enriched GO terms (P,0.01) including many core
cellular processes, as expected (Fig. 6B).
ConclusionWe have established SILAC steady-state labeling in procyclic
form T. brucei, and demonstrated the power of the technique by
conducting a global comparative proteomic analysis of cultured
procyclic and bloodstream form parasites. This work should be
a useful resource for the community as it provides experimental
evidence of the expression of a large number of hypothetical
conserved proteins and their developmental regulation. The
establishment of SILAC in T. brucei will enable this powerful
technique to be used to refine many further studies such as
subcellular fractionations, protein-protein interactions and signal-
ing pathway analysis [26]. To make our data accessible to the
scientific community, we have uploaded our study to TriTrypDB,
and deposited the LC-MS/MS files into the Proteome Commons
Tranche depository, enabling researchers to interrogate the
information presented here.
Figure 3. Histograms of Log2 fold change. A. Procyclic form labeled with heavy isotopes (R6K6) mixed 1:1 with unlabeled procyclic form (R0K0).B. Procyclic form labeled with heavy isotopes (R6K6) mixed 1:1 with unlabeled bloodstream form (R0K0).doi:10.1371/journal.pone.0036619.g003
Comparative SILAC Proteomics of Trypanosoma brucei
PLoS ONE | www.plosone.org 4 May 2012 | Volume 7 | Issue 5 | e36619
Materials and Methods
SILAC SDM-79 and original SDM-79 media preparationThe original SDM-79 medium was obtained from Invitrogen in
a powder format via the Trypanosome Consortium, kindly
organized by Helen Banks in Prof. Keith Gull’s lab, Oxford,
UK, and prepared according to the original formulation [14]. The
powder was hydrated in 5 L Milli-Q water, supplemented with
7.5 mg/L of haemin (from a 10 mg/ml stock in 0.1 M NaOH)
and 2 g/L sodium bicarbonate. The pH was adjusted to 7.3 with
NaOH and sterile filtered using Stericups 500 (Millipore). Under
sterile conditions, heat inactivated and non-dialyzed fetal bovine
serum (PAA) was added to final 15% (V/V), glutamax I
(Invitrogen) to 2 mM final, and penicillin-streptomycin solution
(Invitrogen) at 1:1,000 dilution. The antibiotics G418 and
hygromycin were added at 15 mg/ml and 50 mg/ml, respectively.
SILAC SDM-79 medium (SDM-792RK) was prepared by
Caisson labs according to the original SDM-79 formulation, but
depleted in L-Arginine, L-Lysine, L-Glutamine and sodium
bicarbonate to allow fresh additions. Prior to use, this media was
supplemented with haemin (7.5 mg/L) and sodium bicarbonate
(2 g/L), pH adjusted to 7.3 with NaOH and sterile filtered using
Stericups 500 (Millipore). Under sterile conditions, heat inacti-
vated and dialyzed fetal bovine serum (10 kDa molecular weight
cut-off, PAA) was added to final 15% (V/V), glutamax I
(Invitrogen) to 2 mM final, and penicillin-streptomycin solution
(Invitrogen) at 1:1,000 dilution. The SDM-792RK was supple-
mented with either normal isotopic abundance L-Arginine and L-
Lysine (SDM-79+R0K0), or with L-Arginine.HCl U-13C6 and L-
Lysine.2HCl U-13C6 (SDM-79+R6K6, Cambridge Isotope Labs,
Figure 4. Agreement of comparative proteomic data withknown biology. Heatmap showing the Log2 FC (procyclic tobloodstream) derived from comparative proteomic data (this study)and previous transcriptomic studies [10,11,12]. Grey – not observed.Heatmap generated with GENEE (http://www.broadinstitute.org/cancer/software/GENE-E/).doi:10.1371/journal.pone.0036619.g004
Figure 5. Comparison of Proteomic and transcriptomic data.Scatterplot of the Log2 FC (procyclic to bloodstream) derived fromcomparative proteomic data (this study) and previous transcriptomicstudies [10,11,12].doi:10.1371/journal.pone.0036619.g005
Comparative SILAC Proteomics of Trypanosoma brucei
PLoS ONE | www.plosone.org 5 May 2012 | Volume 7 | Issue 5 | e36619

UK) at the same concentration as described in the original SDM-
79 formulation [14]. The antibiotics G418 and hygromycin were
added at 15 mg/ml and 50 mg/ml, respectively.
Cell cultureProcyclic form Trypanosoma brucei clone 29.13.6 cells (kindly
provided by Prof. George Cross) were grown at 28uC without CO2
in with fully capped culture flasks (BD, non-treated plastic) in
original SDM-79.
For the growth curves the T. brucei procyclic form cells were
washed 3 times in 10 ml SDM-792RK, and resuspended at
2.56106 cells/mL in either original SDM-79, SDM-79+R0K0 or
SDM-79+R6K6. Every 2 days the cells were counted using
a Neubauer chamber and phase contrast microscope, and the
cultures were diluted 7.7 times. After 10 days samples were
collected for analysis by light microscopy.
For SILAC labeling, T. brucei procyclic form cells, in log phase
of growth were washed 3 times with 10 ml of SDM-792RK, and
resuspended at 2.56106 cells/mL in either SDM-79+R0K0 or
SDM-79+R6K6. Cells were passaged every 2 days by diluting
about 7.7 fold to obtain ,2.56106 cells/mL to enlarge the culture
and to reach 6–7 cell divisions under labeling conditions.
Culture adapted strain 427 monomorphic bloodstream form T.
brucei (variant 221, MITat 1.2) genetically modified to express T7
polymerase and the tetracycline repressor protein, as described by
Wirtz et al. [3], were cultured in HMI-9T medium [27] containing
2.5 mg/mL G418 at 37uC in a 5% CO2 incubator. HMI-9T is
a modification of the original HMI-9 that uses 56 mM 1-
thioglmycerol in place of 200 mM 2-mercaptoethanol, and contains
10% heat inactivated fetal Bovine serum (PAA).
Cells were harvested by centrifugation and hypotonically lysed
at 56109 cells/mL for 5 min on ice in the presence 0.1 mM 1-
chloro-3-tosylamido-7-amino-2-heptone (TLCK), 1 mM benza-
midine, 1 mM phenyl-methyl sulfonyl fluoride (PMSF), 1 mg/mL
leupeptin, 1 mg/mL aprotinin and Phosphatase Inhibitor Mixture
II (Calbiochem). The protein concentration was determined by
BCA assay (Pierce) to be ,5 mg/mL from each cell type. Samples
were aliquoted, snap frozen, and stored at 280uC prior to
subsequent processing.
MicroscopyProcyclic form cells at late log phase grown in either original
SDM-79, SDM-79+R6K6 or R0K0 for 10 days were washed in
10 ml phosphate buffer saline at 6006g at 4uC, fixed in 4%
paraformaldehyde in phosphate buffered saline at 4uC for 30 min,
and placed on a cover slip. After air-drying the cover slips were
washed in phosphate buffered saline and mounted onto slides. The
differential interference contrast (DIC) images were collected in
a Zeiss LSM 700 META confocal microscope.
Estimating efficiency of SILAC labelingProcyclic cells grown in SDM279+R6K6 for 6–7 cell divisions
and hypotonically lysed as described above. To reduce the sample
complexity the proteins were fractionated by SDS-PAGE, and
a band corresponding to 25–50 kDa molecular weight range was
excised and subjected to in-gel tryptic digest prior to analysis by
LC-MS/MS. Twenty peptides were chosen at random and the
relative abundance of the major isotopic peak of heavy
(arginine-13C6/lysine-13C6) and light (arginine-12C6/lysine-
12C6)
forms were measured in extracted ion chromatograms using the
Excalibur software (Thermo Scientific).
Filter aided sample preparationSamples for analysis by mass spectrometry were prepared by
modification of the filter-aided sample preparation procedure [15]
and fractionated by either SDS-PAGE or strong cation exchange
(SCX) chromatography. Samples containing 7.56107 lysed cells
(15 mL) were defrosted and combined according to the experiment
design. The combined sample was solubilized by addition of 30 mlbuffer A (8% SDS, 200 mM DTT, 200 mM Tris-HCl pH 8.0)
followed by vigorous vortexing for 3 min, sonication for 3 min,
heating to 95uC for 3 min and a vortexing for a further 3 min.
Samples were centrifuged at 16,0006g for 5 min to remove
insoluble material, although none was visible.
The solubilized sample was reductively alkylated using the
standard FASP I procedure in a 10,000 MWCO horizontal spin
filtration unit (Vivascience), and washed into 40 mL of 50 mM
ammonium bicarbonate [15]. At this point 10% of the sample was
withdrawn for separation by SDS-PAGE prior to in-gel tryptic
digest (see below). The remaining sample was digested with 1.5 mgratio of trypsin gold (Promega) in the filtration unit for 18 h at
37uC. Tryptic peptides were eluted by centrifugation at 16,0006g
for 10 min, and the filtration washed with sequentially with 40 mLof 50 mM NH4HCO3 and 40 mL of 0.5 M NaCl. The combined
eluent was desalted using a 50 mg C18 cartridge (SepPak, Waters)
and lyophilized.
Table 1. Negative correlation between protein and Mrna.
GeneDB ID Description Peptidesa Proteomics Jensen et al. Queiroz et al. Kabini et al.
Tb09.211.1030 inositol phosphorylceramidesynthase
1 21.99 1.81 1.58 1.35
Tb11.01.8225 hypothetical protein,conserved
4 20.47 0.92 1.20 0.09
Tb11.02.3210 triosephosphate isomerase 15 20.31 1.09 1.00 0.07
Tb927.8.1790 hypothetical protein,conserved
3 20.21 2.06 1.43 1.08
Tb927.7.4110 kinesin, putative 2 0.14 20.79 21.32 20.85
Tb927.8.870 serine/threonine kinase 3 2.16 20.89 20.78 20.78
Tb11.01.8270 zinc finger protein family 19 2.94 21.54 21.20 0.00
Tb927.10.8450 glucose transporter 1E 1 3.44 23.08 22.14 20.45
a– number of unique peptides mapped to each protein. Log2 FC (procyclic to bloodstream) derived from comparative proteomic data (this study) and previoustranscriptomic studies [10,11,12].doi:10.1371/journal.pone.0036619.t001
Comparative SILAC Proteomics of Trypanosoma brucei
PLoS ONE | www.plosone.org 6 May 2012 | Volume 7 | Issue 5 | e36619

Strong cation exchange chromatographyStrong cation exchange was performed on an Agilent 1120
compact LC using a 3.06200 mm 5 mm polysulfoethyl asparta-
mide column (Poly LC) with a flow rate of 350 mL/min and
detection at 220 nm. Dried peptides were dissolved in 200 mL of
solvent A (10 mMKHPO4 pH 3.0, 30%MeCN) and separated by
salt gradient consisting of 5 min at 100% solvent A, a 22.5 min
gradient to 42% solvent B (solvent A+0.6 M KCl, 7.5 min
gradient to 100% B, 5 min at 100% B, and a 5 min gradient to
100% A. Fractions of 700 mL were collected throughout the run
and combined into 10 fractions of equal peptide content based on
their absorbance at 220 nm. Combined fractions were desalted
using microcolumns containing 1 mg Oligo R3 (AppliedBiosys-
tems) in C18 ZipTips (Millipore) and lyophilized prior to analysis.
Polyacrylamide gel electrophoresisFor SDS-PAGE, ,5 mg of reductively alkylated sample was
subjected to electrophoresis on a NuPAGE bis-Tris 4–12%
gradient acrylamide gel under reducing conditions and stained
with Simply Blue colloidal Coomassie (Invitrogen). The sample
lane was divided into eight bands that were excised, and subjected
to in-gel digestion for 18 h at 37uC with 12.5 mg/mL trypsin gold
(Promega) in 10 mM NH4HCO3, 10% MeCN. Tryptic peptides
were recovered in 45% MeCN, 1% formic acid and lyophilized
prior to analysis.
Mass spectrometry data acquisition and processingLiquid chromatography tandem mass spectrometry was per-
formed by the Proteomic Facility at the University of Dundee.
Liquid chromatography was performed on a fully automated
Ultimate U3000 Nano LC System (Dionex) fitted with a 165 mm
PepMap C18 trap column and a 75 mm615 cm reverse phase
PepMap C18 nanocolumn (LC Packings, Dionex). Samples were
loaded in 0.1% formic acid (buffer A) and separated using a binary
gradient consisting of buffer A and buffer B (90% MeCN, 0.08%
formic acid). Peptides were eluted with a linear gradient from 5 to
40% buffer B over 65 min. The HPLC system was coupled to an
LTQ Orbitrap Velos mass spectrometer (Thermo Scientific)
equipped with a Proxeon nanospray ion source. The mass
spectrometer was operated in data dependent mode to perform
a survey scan over a range 335–1800 m/z in the Orbitrap
analyzer (R=60,000), with each MS scan triggering ten MS2
acquisitions of the ten most intense ions. The Orbitrap mass
analyzer was internally calibrated on the fly using the lock mass of
polydimethylcyclosiloxane at m/z 445.120025.
Data was processed using MaxQuant [16] version 1.2.2.5 which
incorporates the Andromeda search engine [17]. Proteins were
identified by searching a protein sequence database containing T.
brucei brucei 927 annotated proteins (Version 3.2, downloaded from
TriTrypDB [28], http://www.tritrypdb.org/) supplemented with
frequently observed contaminants (porcine trypsin, bovine serum
albumins and human keratins). Search parameters specified a MS
tolerance of 5 ppm, a MS/MS tolerance at 0.5 Da and full trypsin
specificity, allowing for up to three missed cleavages. Carbamido-
methylation of cysteine was set as a fixed modification and
oxidation of methionines, N-terminal protein acetylation and N-
pyroglutamate were allowed as variable modifications. Peptides
were required to be at least 6 amino acids in length, and false
discovery rates (FDRs) of 0.01 were calculated at the levels of
peptides, proteins and modification sites based on the number of
Figure 6. GO term enrichment. A. Proteins with greater than ten-fold up- or down regulation, with enrichment P,0.01. B. Constitutivelyexpressed proteins, with enrichment P,0.01.doi:10.1371/journal.pone.0036619.g006
Comparative SILAC Proteomics of Trypanosoma brucei
PLoS ONE | www.plosone.org 7 May 2012 | Volume 7 | Issue 5 | e36619

hits against the reversed sequence database. SILAC ratios were
calculated using only peptides that could be uniquely mapped to
a given protein.
Bioinformatic analysisProcessed mass spectrometery data was further analyzed using
the information contained in TriTrypDB (http://www.tritrypdb.
org) [28]. Gene ontology (GO) term enrichment was carried out
using GOTools (http://genome.crg.es/GOToolBox/) [29] using
a generic GO slim set containing 11 additional terms to capture
trypanosome biology [30]. To make our data accessible to the
scientific community, we uploaded our study to TriTrypDB
(http://www.tritrypdb.org), and deposited the LC-MS/MS files
into the Proteome Commons (http://www.proteomecommons.
org) Tranche depository (#6nVGofIEQu6D4odoX8aAd-
odoX8aAdpUngsx1fAv43g8UN2w23Bb/
dXd6zBwaqq7SQKQcH7Mf05dGtfye0vl8pnrH3mu-
ce8eA67EAAAAAAAAcbw= = ), enabling researchers to access
the data presented here.
Supporting Information
Table S1 Comparative proteomic data.
(XLS)
Table S2 Comparison of proteomic and transcriptomic data.
(XLS)
Acknowledgments
We thank the Proteomic Facility at the University of Dundee for
acquisition of MS data and helpful discussions, Chris Cole (Data Analysis
Group, University of Dundee) for constructing the T. brucei 927 MaxQuant
database, and David Horn (London School of Hygiene and Tropical
Medicine, UK) for providing the T. brucei specific GO slim set.
Author Contributions
Conceived and designed the experiments: MDUMLSG MAJF. Performed
the experiments: MDU MLSG. Analyzed the data: MDU. Wrote the
paper: MDU.
References
1. Simarro P, Diarra A, Ruiz Postigo J, Franco J, Jannin J (2011) The Human
African Trypanosomiasis control and Surveillance Programme of the WHO2000–2009: The Way Forward. PLoS Negl Trop Dis 5: e1007.
2. Frearson JA, Wyatt PG, Gilbert IH, Fairlamb AH (2007) Target assessment for
antiparasitic drug discovery. Trends Parasitol 23: 589–595.3. Wirtz E, Leal S, Ochatt C, Cross GAM (1999) A tightly regulated inducible
expression system for conditional gene knock-outs and dominant-negativegenetics in Trypanosoma brucei. Mol Biochem Parasitol 99: 89–101.
4. Carrington M (2009) How African trypanosomes evade mammalian defences.Parasites. pp 8–11.
5. Gunzl A, Bruderer T, Laufer G, Schimanski B, Tu L, et al. (2003) RNA
polymerase I transcribes procyclin genes and variant surface glycoproteinexpression sites in Trypanosoma brucei. Eukaryot Cell 2: 542–551.
6. Clayton C, Shapira M (2007) Post-translational regulation of gene expression intrypanosomes and leishmanias. Mol Biochem Parasitol 156: 93–101.
7. Lemercier G, Espiau B, Ruiz FA, Vieira M, Luo S, et al. (2004) A
Pyrophosphatase Regulating Polyphosphate Metabolism in Acidocalcisomes IsEssential for Trypanosoma brucei Virulence in Mice. J Biol Chem 279: 3420–3425.
8. Colasante C, Robles A, Li C-H, Schwede A, Benz C, et al. (2007) Regulatedexpression of glycosomal phosphoglycerate kinase in Trypanosoma brucei. Mol
Biochem Parasitol 2007: 193–204. pp 193–204.
9. Clayton C (2002) Life without transcriptional control? from fly to man and backagain. EMBO J 21: 1881–1888.
10. Jensen BC, Sivam D, Kifer CT, Myler PJ, Parsons M (2009) Widespreadvariation in transcript abundance within and across developmental stages of
Trypanosoma brucei. BMC Genomics 10: 482.11. Kabini S, Fenn K, Ross A, Ivens A, Smith TK, et al. (2009) Genome-wide
expression profiling of in vivo-derived bloodstream parasite stages and dynamic
analysis of mRNA alterations during synchronous differentiation in Trypanosoma
brucei. BMC Genomics 10: 427.
12. Queiroz R, Benz C, Fellenberg K, Hoheisel JD, Clayton C (2009)Transcriptome analysis of differentiating trypanasomes reveals the existance of
multiple post-transcriptional regulons. BMC Genomics 10: 495.
13. Ong S, Blagoev B, Kratchmarova I, Kristensen DB, Steen H, et al. (2002) Stableisotope labeling by amino acids in cell culture, SILAC, as a simple and accurate
approach to expression proteomics. Mol Cell Proteomics 1: 376–386.14. Brun R, Schonenberger M (1979) Cultivation and in vivo cloning of procyclic
culture forms of Trypanosoma brucei in a semi-defined medium. Acta Trop 36:289–292.
15. Wisniewski JR, Zougman A, Nagaraj N, Mann M (2009) Universial sample
preparation method for proteome analysis. Nat Meth 6: 359–362.
16. Cox J, Mann M (2008) MaxQuant enables high peptide identification rates,
individualised p.p.b.-range mass accuracies and proteome-wide proteinquantification. Nat Biotech 26: 1367–1372.
17. Cox J, Neuhausert N, Michalskit A, Scheltemat RA, Olsen JV, et al. (2011)
Andromeda: a peptide search engine integrated into the MaxQuant environ-ment. J Proteome Res 10: 1794–1805.
18. Michels PA, Bringaud F, Herman M, Hannaert V (2006) Metabolic functions ofglycosomes in trypanosomatids. Biochem Biophys Acta 1763: 1463–1477.
19. Besteiro S, Barrett MP, Riviere L, Bringaud F (2005) Energy generation in insectstages of Trypanosoma brucei: metabolism in flux. Trend Parasitol 21: 185–191.
20. Mayho M, Fenn K, Craddy P, Crosswaite S, Matthews KR (2006) Post-
transcriptional control of nuclear-encoded cytochrome oxidase subunits inTrypanosoma brucei: evidence for genome-wide conservation of life-cycle stage-
specific regulatory elements. Nucleic Acid Res 2006: 5312–5324. pp 5312–5324.21. Zeigelbauer K, Overath P (1992) Identification of invarient surface glycoprotein
in the bloodstream stage of Trypanosoma brucei. J Biol Chem 267: 10791–10796.
22. Acosta-Serrano A, Vassella E, Liniger M, Renggli CK, Brun R, et al. (2001) Thesurface coat of procyclic Trypanosoma brucei: Programmed expression and
proteolytic cleavage of procyclin in the tsetse fly. Proc Natl Acad Sci USA 98:1513–1518.
23. Carrington M, Carnall N, Crow MS, Gaud A, Redpath MB, et al. (1998) The
properties and functions of the glycosylphosphatidylinositol-phospholipase C inTrypanosoma brucei. Mol Biochem Parasitol 91: 153–164.
24. Guther MLS, Ferguson MAJ (1995) The role of inositol acylation and inositoldeacylation in GPI biosynthesis in Trypanosoma brucei. EMBO J 14: 3080–3093.
25. Gibson WC, Swinkels BW, Borst P (1988) Post-transcriptional control of thedifferential expression of phosphoglycerate kinase genes in Trypanosoma brucei.
J Mol Biol 201: 315–325.
26. Harsha HC, Molina H, Pandey A (2008) Quantitative proteomics using stableisotope labeling with amino acids in cell culture. Nat Protocols 3: 505–506.
27. Greig N, Wyllie S, Patterson S, Fairlamb AF (2008) A comparative study ofmethylglyoxal metabolism in trypanosomatids. FEBS J 276: 376–386.
28. Aslett M, Aurrecoechea C, Berriman M, Brestelli J, Brunk BP, et al. (2010)
TriTrypDB: a functional genomic resource for the Trypanosomatidae. NucleicAcid Res 38: D457–D462.
29. Martin D, Brun C, Remy E, Mouren P, Thieffry D, et al. (2004) GOToolBox:functional analysis of gene datasets based on Gene Ontology. Genome Biol 5:
R101.30. Alsford S, Turner DJ, Obado SO, Sanchez-Flores A, Glover L, et al. (2011)
High-Throughput phenotyping using parallel sequencing of RNA interference
targets in the African Trypanosome. Genome Res 21: 915–924.
Comparative SILAC Proteomics of Trypanosoma brucei
PLoS ONE | www.plosone.org 8 May 2012 | Volume 7 | Issue 5 | e36619
Copyright © 2022 FDOKUMEN