Status of complete proteome analysis by mass spectrometry: SILAC labeled yeast as a model system
15
Genome Biology 2006, 7:R50 comment reviews reports deposited research refereed research interactions information Open Access 2006 de Godoy et al. Volume 7, Issue 6, Article R50 Research Status of complete proteome analysis by mass spectrometry: SILAC labeled yeast as a model system Lyris MF de Godoy *† , Jesper V Olsen *† , Gustavo A de Souza *† , Guoqing Li * , Peter Mortensen † and Matthias Mann *† Addresses: * Department of Proteomics and Signal Transduction, Max-Planck-Institute of Biochemistry, Am Klopferspitz, 82152 Martinsried, Germany. † Center for Experimental BioInformatics, Department of Biochemistry and Molecular Biology, University of Southern Denmark, Campusvej, 5230 Odense M, Denmark. Correspondence: Matthias Mann. Email: [email protected] © 2006 de Godoy et al.; licensee BioMed Central Ltd. This is an open access article distributed under the terms of the Creative Commons Attribution License (http://creativecommons.org/licenses/by/2.0), which permits unrestricted use, distribution, and reproduction in any medium, provided the original work is properly cited. Complex protein mixture analysis <p>A mass spectrometry analysis of the yeast proteome shows that complex mixture analysis is not limited by sensitivity but by a combi- nation of dynamic range and by effective sequencing speed.</p> Abstract Background: Mass spectrometry has become a powerful tool for the analysis of large numbers of proteins in complex samples, enabling much of proteomics. Due to various analytical challenges, so far no proteome has been sequenced completely. O'Shea, Weissman and co-workers have recently determined the copy number of yeast proteins, making this proteome an excellent model system to study factors affecting coverage. Results: To probe the yeast proteome in depth and determine factors currently preventing complete analysis, we grew yeast cells, extracted proteins and separated them by one-dimensional gel electrophoresis. Peptides resulting from trypsin digestion were analyzed by liquid chromatography mass spectrometry on a linear ion trap-Fourier transform mass spectrometer with very high mass accuracy and sequencing speed. We achieved unambiguous identification of more than 2,000 proteins, including very low abundant ones. Effective dynamic range was limited to about 1,000 and effective sensitivity to about 500 femtomoles, far from the subfemtomole sensitivity possible with single proteins. We used SILAC (stable isotope labeling by amino acids in cell culture) to generate one-to-one pairs of true peptide signals and investigated if sensitivity, sequencing speed or dynamic range were limiting the analysis. Conclusion: Advanced mass spectrometry methods can unambiguously identify more than 2,000 proteins in a single proteome. Complex mixture analysis is not limited by sensitivity but by a combination of dynamic range (high abundance peptides preventing sequencing of low abundance ones) and by effective sequencing speed. Substantially increased coverage of the yeast proteome appears feasible with further development in software and instrumentation. Background Technological goals of proteomics include the identification and quantification of as many proteins as possible in the pro- teome to be investigated [1-3]. However, despite spectacular advances in mass spectrometric technology, no cellular or microorganismal proteome has been completely sequenced Published: 19 June 2006 Genome Biology 2006, 7:R50 (doi:10.1186/gb-2006-7-6-r50) Received: 2 December 2005 Revised: 21 April 2006 Accepted: 19 May 2006 The electronic version of this article is the complete one and can be found online at http://genomebiology.com/2006/7/6/R50
-
Upload
independent -
Category
Documents
-
view
2 -
download
0
Transcript of Status of complete proteome analysis by mass spectrometry: SILAC labeled yeast as a model system
com
ment
reviews
reports
deposited research
refereed researchinteractio
nsinfo
rmatio
n
Open Access2006de Godoyet al.Volume 7, Issue 6, Article R50ResearchStatus of complete proteome analysis by mass spectrometry: SILAC labeled yeast as a model systemLyris MF de Godoy*†, Jesper V Olsen*†, Gustavo A de Souza*†, Guoqing Li*, Peter Mortensen† and Matthias Mann*†
Addresses: *Department of Proteomics and Signal Transduction, Max-Planck-Institute of Biochemistry, Am Klopferspitz, 82152 Martinsried, Germany. †Center for Experimental BioInformatics, Department of Biochemistry and Molecular Biology, University of Southern Denmark, Campusvej, 5230 Odense M, Denmark.
Correspondence: Matthias Mann. Email: [email protected]
© 2006 de Godoy et al.; licensee BioMed Central Ltd. This is an open access article distributed under the terms of the Creative Commons Attribution License (http://creativecommons.org/licenses/by/2.0), which permits unrestricted use, distribution, and reproduction in any medium, provided the original work is properly cited.Complex protein mixture analysis<p>A mass spectrometry analysis of the yeast proteome shows that complex mixture analysis is not limited by sensitivity but by a combi-nation of dynamic range and by effective sequencing speed.</p>
Abstract
Background: Mass spectrometry has become a powerful tool for the analysis of large numbers ofproteins in complex samples, enabling much of proteomics. Due to various analytical challenges, sofar no proteome has been sequenced completely. O'Shea, Weissman and co-workers have recentlydetermined the copy number of yeast proteins, making this proteome an excellent model systemto study factors affecting coverage.
Results: To probe the yeast proteome in depth and determine factors currently preventingcomplete analysis, we grew yeast cells, extracted proteins and separated them by one-dimensionalgel electrophoresis. Peptides resulting from trypsin digestion were analyzed by liquidchromatography mass spectrometry on a linear ion trap-Fourier transform mass spectrometerwith very high mass accuracy and sequencing speed. We achieved unambiguous identification ofmore than 2,000 proteins, including very low abundant ones. Effective dynamic range was limitedto about 1,000 and effective sensitivity to about 500 femtomoles, far from the subfemtomolesensitivity possible with single proteins. We used SILAC (stable isotope labeling by amino acids incell culture) to generate one-to-one pairs of true peptide signals and investigated if sensitivity,sequencing speed or dynamic range were limiting the analysis.
Conclusion: Advanced mass spectrometry methods can unambiguously identify more than 2,000proteins in a single proteome. Complex mixture analysis is not limited by sensitivity but by acombination of dynamic range (high abundance peptides preventing sequencing of low abundanceones) and by effective sequencing speed. Substantially increased coverage of the yeast proteomeappears feasible with further development in software and instrumentation.
BackgroundTechnological goals of proteomics include the identificationand quantification of as many proteins as possible in the pro-
teome to be investigated [1-3]. However, despite spectacularadvances in mass spectrometric technology, no cellular ormicroorganismal proteome has been completely sequenced
Published: 19 June 2006
Genome Biology 2006, 7:R50 (doi:10.1186/gb-2006-7-6-r50)
Received: 2 December 2005Revised: 21 April 2006Accepted: 19 May 2006
The electronic version of this article is the complete one and can be found online at http://genomebiology.com/2006/7/6/R50
Genome Biology 2006, 7:R50
R50.2 Genome Biology 2006, Volume 7, Issue 6, Article R50 de Godoy et al. http://genomebiology.com/2006/7/6/R50
yet. This has not hindered successful application of proteom-ics, as most biologically relevant studies have focused onfunctionally relevant 'subproteomes'. For example, our labo-ratory has been interested in protein constituents oforganelles such as the nucleolus and mitochondria [4-6].These proteomes have complexities of about a 1,000 proteinsand are largely within reach of current technology. Otherfruitful areas of proteomics have been the analysis of proteincomplexes for protein interaction studies [7,8] and the large-scale analysis of protein modifications [9], which also do notrequire analysis of the total proteome. However, if proteomicsis to directly complement or supersede mRNA based meas-urements such as oligonucleotide microarrays in certainapplications, it needs to be able to identify and quantify com-plete cellular or tissue proteomes. Furthermore, if proteomicsis to be used in diagnostic applications by in-depth analysis ofbody fluids, even higher performance would be desirable [10].
Protein mixtures can be analyzed in different ways by massspectrometry. The most widely used approach involves enzy-matic digestion of proteins to peptides, followed by chroma-tographic separation of the peptides and electrosprayionization directly into the source of a mass spectrometer.The mass spectrometer acquires spectra of the eluting pep-tides and fragments the most abundant peptide ions in turn(tandem mass spectrometry or MS/MS). The tandem massspectra are then searched against protein databases resultingin the identification of a large number of peptides from whicha protein list is compiled. Importantly, mass spectrometricsignal varies widely between different peptides even if presentat the same amount, not all electrosprayed peptides are frag-mented and not all fragmented peptides lead to successfulidentifications [11]. The finite sampling speed of peptides indata-dependent experiments has partial random characterand also influences reproducibility of the final protein identi-fication [12]. In particular, if a mass spectrum contains manyhighly abundant peptides, then signals of low abundance willnot be selected or 'picked' for sequencing by the instrument.The overall protein coverage of the experiment is a function ofthe sensitivity of the mass spectrometer, its sequencing speedand its dynamics range.
Systematic elucidation of the ability of mass spectrometry-based proteomics to characterize a proteome in depth wouldclearly be useful, both to realistically assess current capabili-ties and to locate bottlenecks that should be removed. Amajor impediment for such studies has been the lack of agood model proteome with defined identity and abundance ofthe constituting proteins. The baker's yeast Saccharomycescerevisiae has served as a model organism from the earliestdays of proteomics, mainly to demonstrate how many pro-teins could be identified with a given technology (Figure 1).The first large-scale protein identification project, performedmore than 10 years ago, resulted in the identification of 150proteins [13]. Yeast was also used as the model system byYates and co-workers [14] to illustrate their 'shotgun' and
'MudPIT' identification approaches. Those researchers andGygi and co-workers [15] reported identification of about1,500 proteins. A recent publication employing extensive pre-fractionation of the yeast proteome claims even higher num-bers of identified proteins [16]. However, as no primary datawere provided, this later claim is difficult to evaluate.
Here we make use of the data sets provided by O'Shea, Weiss-mann and co-workers, who have tagged each yeast gene inturn, and performed quantitative western blotting [17] as wellas protein localization with GFP [18]. Their data set, for thefirst time, gives us both the identity and abundance of themembers of a complex proteome. In logarithmically growingyeast, evidence of expression of more than 4,500 proteins wasobtained, with the lowest abundance proteins at about 100copies per cell and the most abundant proteins at about a mil-lion copies per cell. We apply state of the art mass spectromet-ric technologies and stringent identification criteria and showthat more than 2,000 proteins can be detected in the yeastproteome by a combination of one-dimensional gel electro-phoresis (1D PAGE) and on-line electrospray tandem massspectrometry ('GeLCMS'). While proteins with very low abun-dance are detected, we find that the effective sensitivity incomplex mixtures is orders of magnitude lower than it is forsingle, isolated proteins. Likewise, while the dynamic range isvery high for some proteins, the average for the whole exper-iment is about 1,000. We employ stable isotope labeling byamino acids in cell culture (SILAC) [19] labeled yeast to inves-tigate these limitations in effective sensitivity and dynamicrange and suggest ways to improve complex mixture analysis.
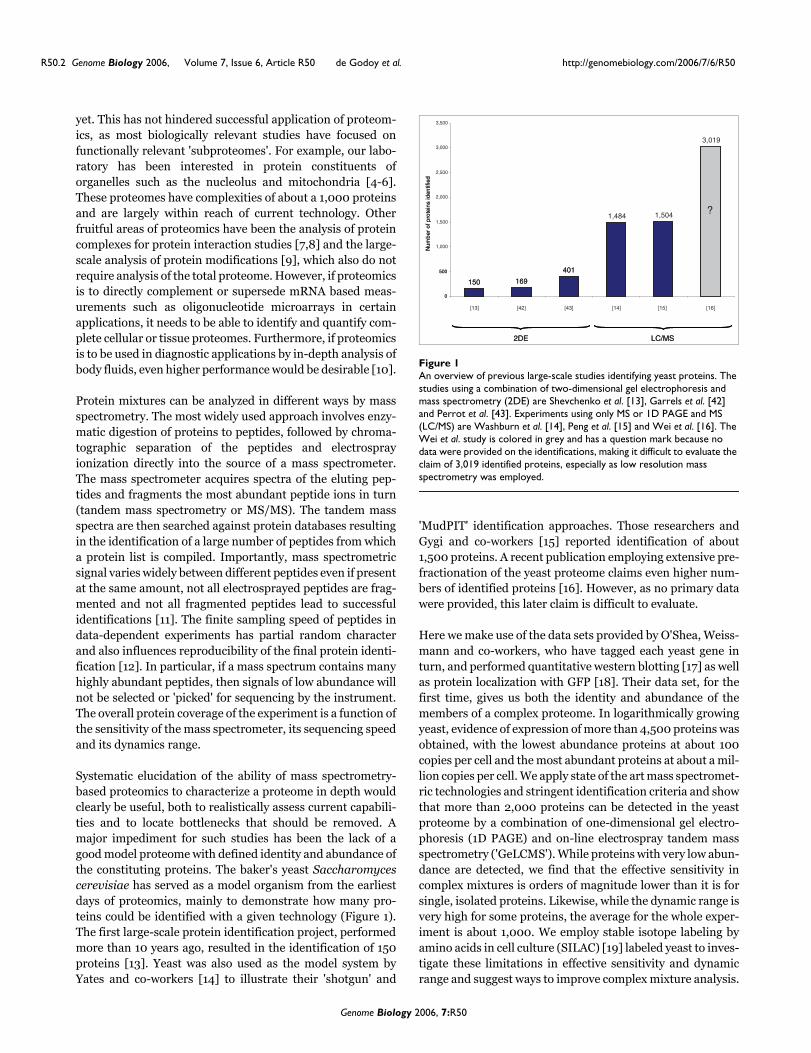
An overview of previous large-scale studies identifying yeast proteinsFigure 1An overview of previous large-scale studies identifying yeast proteins. The studies using a combination of two-dimensional gel electrophoresis and mass spectrometry (2DE) are Shevchenko et al. [13], Garrels et al. [42] and Perrot et al. [43]. Experiments using only MS or 1D PAGE and MS (LC/MS) are Washburn et al. [14], Peng et al. [15] and Wei et al. [16]. The Wei et al. study is colored in grey and has a question mark because no data were provided on the identifications, making it difficult to evaluate the claim of 3,019 identified proteins, especially as low resolution mass spectrometry was employed.
150 169
401
1,484 1,504
3,019
0
500
1,000
1,500
2,000
2,500
3,000
3,500
Num
ber
of p
rote
ins
iden
tifie
d
SM/CLED2
?
150 169
401
0
500
Num
ber
of p
rote
ins
iden
tifie
d
SM/CLED2
?
[13] [42] [43] [14] [15] [16]
Genome Biology 2006, 7:R50

http://genomebiology.com/2006/7/6/R50 Genome Biology 2006, Volume 7, Issue 6, Article R50 de Godoy et al. R50.3
com
ment
reviews
reports
refereed researchdepo
sited researchinteractio
nsinfo
rmatio
n
Results and discussionSampling the yeast proteome by GeLCMSFigure 2 is an overview of the procedure used to probe theyeast proteome. Wild-type yeast cells were grown to log-phase, lysed by boiling in SDS and 100 µg of whole cell lysatewas separated by 1D PAGE. The gel was cut into 20 slices, pro-teins were in-gel digested with trypsin and the resulting pep-tides extracted from each gel slice were analyzed byautomated reversed-phase nanoscale liquid chromatography(LC) coupled to tandem mass spectrometry (MS/MS).Together, the 20 LC-MS/MS runs, including interveningwashing steps, lasted 48 hours. The peptides were electro-sprayed into the source of a linear ion trap-Fourier transformmass spectrometer (LTQ-FT) [20]. This hybrid instrumentconsists of a linear ion trap (LTQ) capable of very fast andsensitive peptide sequencing combined with an ion cyclotron
resonance trap (ICR). In the ICR trap, ions circle in a 7 Teslamagnetic field and their image current is detected and con-verted to a mass spectrum by Fourier transformation (FT-ICR). While this high resolution and high mass accuracy spec-trum is acquired, the LTQ part of the mass spectrometersimultaneously isolates, fragments and obtains the MS/MSspectrum of the five most abundant peptides. These are thenautomatically excluded from further sequencing for 30 sec-onds. Figure 3a shows a mass spectrum of yeast peptides elut-ing at a particular time point in the LC gradient. As can beseen in the figure, mass resolution was very high (better than50,000) and mass accuracy was better than one part per mil-lion (ppm). Figure 3b illustrates a tandem mass spectrum ofthe most abundant peptide in the full scan spectrum acquiredby fragmentation in the linear ion trap. Because detection oftandem mass spectra happens in the linear ion trap it is highly
Work flow of the yeast proteomics experimentFigure 2Work flow of the yeast proteomics experiment.
Protein validation criteria:At least 2 unique peptides identified
Sum score greater than 2 x p<0.01 (0.0001% error rate)
2,003 proteinsidentified
Total yeast extract(0.1 mg protein)
Cells grown to Log phase(OD600 0.7)
Decoy database searchMASCOT: probability-based matching
Protein fractionation and trypsin digestion
SDS-PAGE
20 slices
Peptidemixture
No false positiveproteins validated
Reversed-phase nanoLC-MS/MS
LTQ-FT
C18 column
LTQ-FTLTQ-FT
C18 column
Inte
nsity
Tandem-MS spectrum
m/z
Match predicted fragments to experimental fragments
Calculete predicted fragments
A C D E C A G H K
Protein validation criteria:At least 2 unique peptides identified
Sum score greater than 2 x p<0.01 (0.0001% error rate)
2,003 proteinsidentified
Total yeast extract(0.1 mg protein)
Total yeast extract(0.1 mg protein)
Cells grown to Log phase(OD600 0.7)
Cells grown to Log phase(OD600 0.7)
Decoy database searchMASCOT: probability-based matching
Protein fractionation and trypsin digestion
SDS-PAGE
20 slices
Peptidemixture
Protein fractionation and trypsin digestion
SDS-PAGE
20 slices
Peptidemixture
SDS-PAGE
20 slices20 slices20 slices
Peptidemixture
No false positiveproteins validated
Reversed-phase nanoLC-MS/MS
LTQ-FT
C18 column
LTQ-FTLTQ-FT
C18 column
Reversed-phase nanoLC-MS/MS
LTQ-FT
C18 column
LTQ-FTLTQ-FT
C18 column
Inte
nsity
Tandem-MS spectrum
m/z
Match predicted fragments to experimental fragments
Calculete predicted fragments
A C D E C A G H K
Inte
nsity
Tandem-MS spectrum
m/z
Inte
nsity
Tandem-MS spectrum
m/z
Match predicted fragments to experimental fragments
Match predicted fragments to experimental fragments
Calculete predicted fragments
A C D E C A G H K
Calculete predicted fragments
A C D E C A G H K
LTQ-FT
Protein validation criteria:At least 2 unique peptides identified
Sum score greater than 2 x p<0.01 (0.0001% error rate)
2,003 proteinsidentified
Total yeast extract(0.1 mg protein)
Cells grown to Log phase(OD600 0.7)
Decoy database searchMASCOT: probability-based matching
Protein fractionation and trypsin digestion
SDS-PAGE
20 slices
Peptidemixture
No false positiveproteins validated
Reversed-phase nanoLC-MS/MS
LTQ-FT
C18 column
LTQ-FTLTQ-FT
C18 column
Inte
nsity
Tandem-MS spectrum
m/z
Match predicted fragments to experimental fragments
Calculete predicted fragments
A C D E C A G H K
Protein validation criteria:At least 2 unique peptides identified
Sum score greater than 2 x p<0.01 (0.0001% error rate)
2,003 proteinsidentified
Total yeast extract(0.1 mg protein)
Total yeast extract(0.1 mg protein)
Cells grown to Log phase(OD600 0.7)
Cells grown to Log phase(OD600 0.7)
Decoy database searchMASCOT: probability-based matching
Protein fractionation and trypsin digestion
SDS-PAGE
20 slices
Peptidemixture
Protein fractionation and trypsin digestion
SDS-PAGE
20 slices
Peptidemixture
SDS-PAGE
20 slices20 slices20 slices
Peptidemixture
No false positiveproteins validated
Reversed-phase nanoLC-MS/MS
LTQ-FT
C18 column
LTQ-FTLTQ-FT
C18 column
Reversed-phase nanoLC-MS/MS
LTQ-FT
C18 column
LTQ-FTLTQ-FT
C18 column
Inte
nsity
Tandem-MS spectrum
m/z
Match predicted fragments to experimental fragments
Calculete predicted fragments
A C D E C A G H K
Inte
nsity
Tandem-MS spectrum
m/z
Inte
nsity
Tandem-MS spectrum
m/z
Match predicted fragments to experimental fragments
Match predicted fragments to experimental fragments
Calculete predicted fragments
A C D E C A G H K
Calculete predicted fragments
A C D E C A G H K
LTQ-FT
Genome Biology 2006, 7:R50

R50.4 Genome Biology 2006, Volume 7, Issue 6, Article R50 de Godoy et al. http://genomebiology.com/2006/7/6/R50
Figure 3 (see legend on next page)
300 400 500 600 700 800 900 1000 1,100 1,200 1,300 1,400 1,500 1,600m/z
0
5
10
15
20
25
30
35
40
45
50
55
60
65
70
75
80
85
90
95
100R
elat
ive
Abu
ndan
ce735.92944
801.87518490.95444
890.41534639.83685981.24255
701.86176
515.305971104.07117 1241.12988 1570.33325369.18213 1471.867071339.23926
435.14664
735.6 735.8 736.0 736.2 736.4 736.6 736.8 737.0 737.2 737.4 737.6 737.8 738.0m/z
0
5
10
15
20
25
30
35
40
45
50
55
60
65
70
75
80
85
90
95
100
Rel
ativ
e A
bund
ance
735.9294
736.4312
736.9333
737.4347
737.9369736.1771 3876.6373386.537 737.0447
mass error = - 0.1 ppm
200 300 400 500 600 700 800 900 1,000 1,100 1,200 1,300 1,400m/z
0
5
10
15
20
25
30
35
40
45
50
55
60
65
70
75
80
85
90
95
100
Rel
ativ
e a
bund
ance
P y13
y12y11
y10
y9
y8
y7
y6
y5y4
y3
y2 b13b12b11
b10
b9
b8b7
b6
b5
b4b3
P y++13VPTVDVSVVDLTVK
(a)
(b)
Genome Biology 2006, 7:R50

http://genomebiology.com/2006/7/6/R50 Genome Biology 2006, Volume 7, Issue 6, Article R50 de Godoy et al. R50.5
com
ment
reviews
reports
refereed researchdepo
sited researchinteractio
nsinfo
rmatio
n
sensitive, such that overall MS sensitivity is limited by recog-nition of the peptide in the full scan.
To maximize the number of ions we did not use the selectedion monitoring (SIM) scans in the FT-ICR that we had previ-ously found to result in very high mass accuracy [21]. Instead,we operated the LTQ-FT in full sequencing mode, where fullscan spectra are recorded in the ICR without acquiring SIMscans and with a high ion load (target of 5 × 10⁶) to maximizedynamic range. The high ion loads cause space-chargingeffects, which result in an almost constant frequency shift forall ions recorded and thereby affect mass accuracy. To correctfor this shift we devised a recalibration algorithm that cor-rects for space charge-induced frequency errors on the basisof peptides identified in a first pass search (see Materials andmethods). Using this recalibration algorithm, peptide massaccuracy improved several fold, to an average absolute massaccuracy of 2.6 ppm for our entire data set (Additional datafile 1).
A total of more than 200,000 MS/MS spectra were acquiredand searched against the yeast proteome using a probabilitybased program (Mascot [22]). We first required a probabilityscore of 15 for peptide identification, which resulted in theidentification of more than 60,000 peptides, among which20,893 represent unique sequences (Table 1; Additional datafile 1; peptides will be submitted to the open archive termedPeptide Atlas [23] as well as to the PRIDE proteomics data-base [24]). For each unique sequence, therefore, on averagethree peptides were fragmented and identified. This wascaused by repeated picking of the same peptide in the same ordifferent runs, sequencing of different charge states, sequenc-ing peptides with modifications such as oxidized methionineand sequencing peptides with missed tryptic cleavage sites.
We next analyzed the distribution of peptides onto proteins.In Figure 4a, proteins are listed according to decreasing Mas-cot protein score and the number of unique peptides with aprobability score of at least 15 is plotted. (Note that these areprotein hits before validation.) Six yeast proteins were identi-fied with more than one hundred peptides each and a steadydecline in the number of peptides identifying each protein canbe observed.
To establish criteria for unambiguous protein identification,we first noted that the probability score for 99% significance(p < 0.01) was 29 for these experiments. Only peptides withscores higher than 15 were considered in the analysis and aminimum of two unique peptides and a combined score of 59were required for protein validation. The value of 59 was cho-sen because it corresponds to the summed score of two pep-tides with p < 0.01. Formally, if the two peptideidentifications are statistically independent, a combinedscore of 59 would represent less than one false positive in10,000. However, as we cover a substantial part of the yeastproteome, the probability of protein identification is a morecomplicated function of peptide identification [25-27]. Wetherefore tested our false positive rates directly in a 'decoydatabase' [15,28] consisting of both forward and reversed('nonsense') yeast sequences. Peptides that are found in thereversed but not in the forward database are assumed to befalse positive peptide matches. When requiring the stringentcriteria outlined above, we found no false positive protein hitsin the reversed database. We therefore conclude that oursearch criteria exclude essentially all false positives.
A total of 2,003 proteins were identified, with an average of 10unique, verified peptides per protein. Thus, it is possible tounambiguously identify more than 2,000 yeast proteins in asingle experiment involving a measurement time of about 48hours. Almost all of the top 1,500 proteins are represented by
Example of MS and MS/MS on the LTQ-FTFigure 3 (see previous page)Example of MS and MS/MS on the LTQ-FT. (a) A mass spectrum of yeast peptides eluting from the column at a particular time point in the LC gradient and electrosprayed into the LTQ-FT mass spectrometer. The inset is a zoom of the doubly charged peptide ion at m/z 735.929, showing its natural isotope distribution and demonstrating very high resolution. (b) Tandem mass spectrum of the dominant peptide in (a). Peptides fragment on average once at different amide bonds, giving rise to carboxy-terminal containing y-ions or amino-terminal containing b-ions. The prominent y13
++ ion is caused by fragmentation at the first amide bond, which is favored here because it is amino-terminal to proline. (See [44] for an introduction to peptide sequencing and identification by MS.) The mass of the peptide identified is within less than 1 ppm of the calculated value.
Table 1
Statistics of the three large-scale mass spectrometric yeast proteomics studies
Proteins identified
Proteomic approach Protein amount Number of fractions Unique peptides 1 Upep >2 Upeps Total
LC-MS (MudPIT) 1.4 mg 45 5,540 636 848 1,484
LC/LC-MS/MS 1.0 mg 80 7,537 513 991 1,504
GeLC-MS/MS 0.1 mg 20 20,893 NA 2,003 2,003
MudPIT refers to Washburn et al. [14], LC/LC-MS/MS refers to Peng et al. [15] and GeLC-MS/MS refers to work presented in this study. NA, not applicable; Upep, unique peptide.
Genome Biology 2006, 7:R50
R50.6 Genome Biology 2006, Volume 7, Issue 6, Article R50 de Godoy et al. http://genomebiology.com/2006/7/6/R50
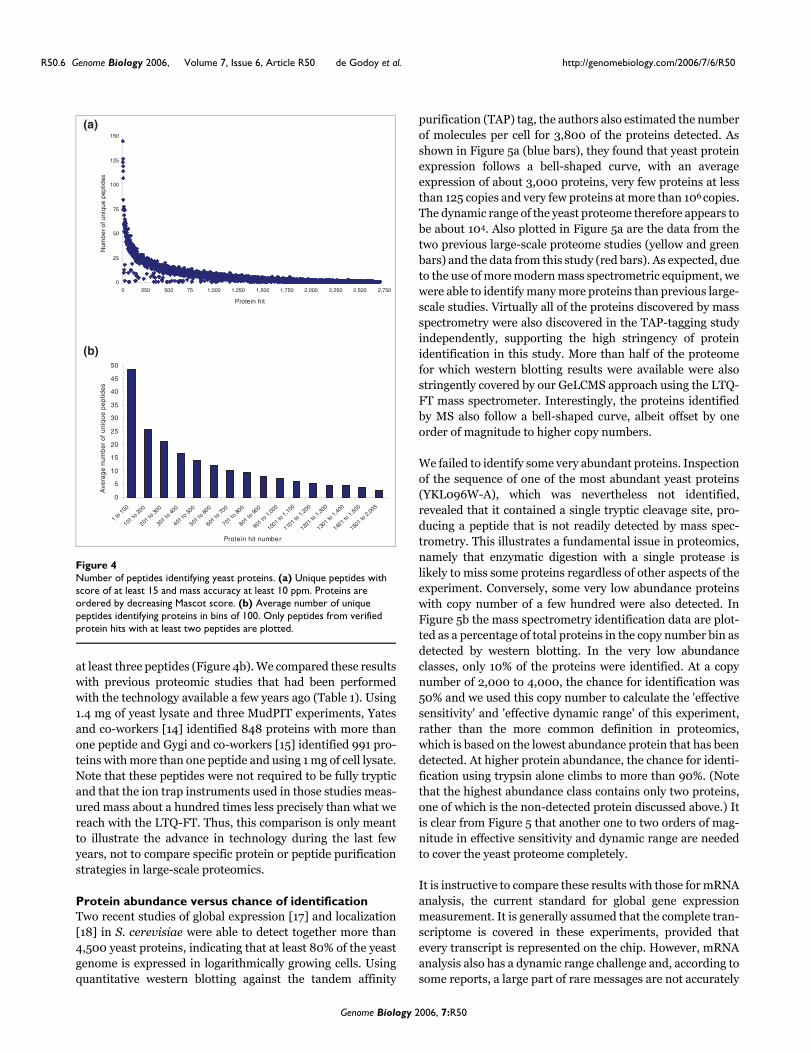
at least three peptides (Figure 4b). We compared these resultswith previous proteomic studies that had been performedwith the technology available a few years ago (Table 1). Using1.4 mg of yeast lysate and three MudPIT experiments, Yatesand co-workers [14] identified 848 proteins with more thanone peptide and Gygi and co-workers [15] identified 991 pro-teins with more than one peptide and using 1 mg of cell lysate.Note that these peptides were not required to be fully trypticand that the ion trap instruments used in those studies meas-ured mass about a hundred times less precisely than what wereach with the LTQ-FT. Thus, this comparison is only meantto illustrate the advance in technology during the last fewyears, not to compare specific protein or peptide purificationstrategies in large-scale proteomics.
Protein abundance versus chance of identificationTwo recent studies of global expression [17] and localization[18] in S. cerevisiae were able to detect together more than4,500 yeast proteins, indicating that at least 80% of the yeastgenome is expressed in logarithmically growing cells. Usingquantitative western blotting against the tandem affinity
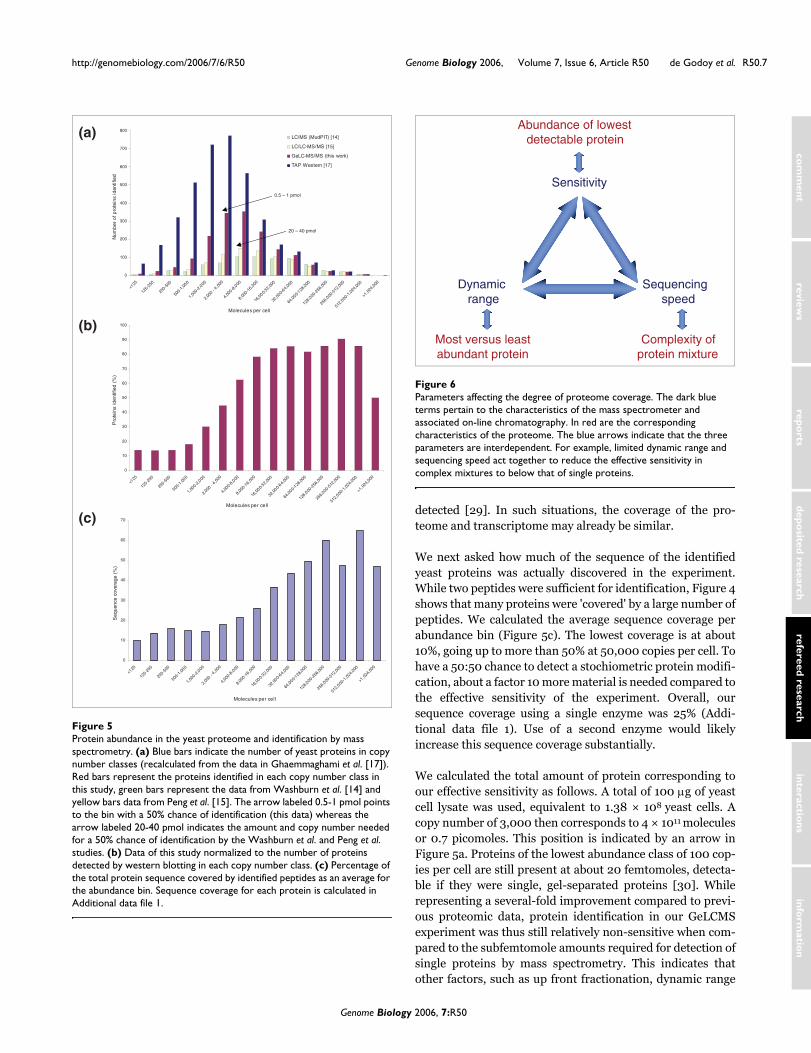
purification (TAP) tag, the authors also estimated the numberof molecules per cell for 3,800 of the proteins detected. Asshown in Figure 5a (blue bars), they found that yeast proteinexpression follows a bell-shaped curve, with an averageexpression of about 3,000 proteins, very few proteins at lessthan 125 copies and very few proteins at more than 106 copies.The dynamic range of the yeast proteome therefore appears tobe about 104. Also plotted in Figure 5a are the data from thetwo previous large-scale proteome studies (yellow and greenbars) and the data from this study (red bars). As expected, dueto the use of more modern mass spectrometric equipment, wewere able to identify many more proteins than previous large-scale studies. Virtually all of the proteins discovered by massspectrometry were also discovered in the TAP-tagging studyindependently, supporting the high stringency of proteinidentification in this study. More than half of the proteomefor which western blotting results were available were alsostringently covered by our GeLCMS approach using the LTQ-FT mass spectrometer. Interestingly, the proteins identifiedby MS also follow a bell-shaped curve, albeit offset by oneorder of magnitude to higher copy numbers.
We failed to identify some very abundant proteins. Inspectionof the sequence of one of the most abundant yeast proteins(YKL096W-A), which was nevertheless not identified,revealed that it contained a single tryptic cleavage site, pro-ducing a peptide that is not readily detected by mass spec-trometry. This illustrates a fundamental issue in proteomics,namely that enzymatic digestion with a single protease islikely to miss some proteins regardless of other aspects of theexperiment. Conversely, some very low abundance proteinswith copy number of a few hundred were also detected. InFigure 5b the mass spectrometry identification data are plot-ted as a percentage of total proteins in the copy number bin asdetected by western blotting. In the very low abundanceclasses, only 10% of the proteins were identified. At a copynumber of 2,000 to 4,000, the chance for identification was50% and we used this copy number to calculate the 'effectivesensitivity' and 'effective dynamic range' of this experiment,rather than the more common definition in proteomics,which is based on the lowest abundance protein that has beendetected. At higher protein abundance, the chance for identi-fication using trypsin alone climbs to more than 90%. (Notethat the highest abundance class contains only two proteins,one of which is the non-detected protein discussed above.) Itis clear from Figure 5 that another one to two orders of mag-nitude in effective sensitivity and dynamic range are neededto cover the yeast proteome completely.
It is instructive to compare these results with those for mRNAanalysis, the current standard for global gene expressionmeasurement. It is generally assumed that the complete tran-scriptome is covered in these experiments, provided thatevery transcript is represented on the chip. However, mRNAanalysis also has a dynamic range challenge and, according tosome reports, a large part of rare messages are not accurately
Number of peptides identifying yeast proteinsFigure 4Number of peptides identifying yeast proteins. (a) Unique peptides with score of at least 15 and mass accuracy at least 10 ppm. Proteins are ordered by decreasing Mascot score. (b) Average number of unique peptides identifying proteins in bins of 100. Only peptides from verified protein hits with at least two peptides are plotted.
0
25
50
75
100
125
150
0 250 500 75 1,000 1,250 1,500 1,750 2,000 2,250 2,500 2,750
Protein hit
Num
ber
of u
niqu
e pe
ptid
es
(a)
(b)
0
5
10
15
20
25
30
35
40
45
50
1 to100
101to
200
201to
300
301to
400
401to
500
501to
600
601to
700
701to
800
801to
900
901to
1,000
1001 to
1,100
1101 to
1,200
1201 to
1,300
1301 to
1,400
1401 to
1,500
1501 to
2,003
Protein hit number
Ave
rag
e n
um
ber
of
un
iqu
e p
eptid
es
Genome Biology 2006, 7:R50
http://genomebiology.com/2006/7/6/R50 Genome Biology 2006, Volume 7, Issue 6, Article R50 de Godoy et al. R50.7
com
ment
reviews
reports
refereed researchdepo
sited researchinteractio
nsinfo
rmatio
n
detected [29]. In such situations, the coverage of the pro-teome and transcriptome may already be similar.
We next asked how much of the sequence of the identifiedyeast proteins was actually discovered in the experiment.While two peptides were sufficient for identification, Figure 4shows that many proteins were 'covered' by a large number ofpeptides. We calculated the average sequence coverage perabundance bin (Figure 5c). The lowest coverage is at about10%, going up to more than 50% at 50,000 copies per cell. Tohave a 50:50 chance to detect a stochiometric protein modifi-cation, about a factor 10 more material is needed compared tothe effective sensitivity of the experiment. Overall, oursequence coverage using a single enzyme was 25% (Addi-tional data file 1). Use of a second enzyme would likelyincrease this sequence coverage substantially.
We calculated the total amount of protein corresponding toour effective sensitivity as follows. A total of 100 µg of yeastcell lysate was used, equivalent to 1.38 × 10⁸ yeast cells. Acopy number of 3,000 then corresponds to 4 × 10¹¹ moleculesor 0.7 picomoles. This position is indicated by an arrow inFigure 5a. Proteins of the lowest abundance class of 100 cop-ies per cell are still present at about 20 femtomoles, detecta-ble if they were single, gel-separated proteins [30]. Whilerepresenting a several-fold improvement compared to previ-ous proteomic data, protein identification in our GeLCMSexperiment was thus still relatively non-sensitive when com-pared to the subfemtomole amounts required for detection ofsingle proteins by mass spectrometry. This indicates thatother factors, such as up front fractionation, dynamic range
Protein abundance in the yeast proteome and identification by mass spectrometryFigure 5Protein abundance in the yeast proteome and identification by mass spectrometry. (a) Blue bars indicate the number of yeast proteins in copy number classes (recalculated from the data in Ghaemmaghami et al. [17]). Red bars represent the proteins identified in each copy number class in this study, green bars represent the data from Washburn et al. [14] and yellow bars data from Peng et al. [15]. The arrow labeled 0.5-1 pmol points to the bin with a 50% chance of identification (this data) whereas the arrow labeled 20-40 pmol indicates the amount and copy number needed for a 50% chance of identification by the Washburn et al. and Peng et al. studies. (b) Data of this study normalized to the number of proteins detected by western blotting in each copy number class. (c) Percentage of the total protein sequence covered by identified peptides as an average for the abundance bin. Sequence coverage for each protein is calculated in Additional data file 1.
0
100
200
300
400
500
600
700
800
<125
125-
250
250-
500
500-
1,00
0
1,00
0-2,0
00
2,00
0 - 4,0
00
4,00
0-8,0
00
8,00
0-16,0
00
16,0
00-32,
000
32,0
00-64,
000
64,0
00-128
,000
128,
000-2
56,0
00
256,
000-5
12,0
00
512,
000-1
,024
,000
>1,0
24,0
00
Molecules per cell
Num
ber
of p
rote
ins
iden
tifie
d
LC/MS (MudPIT) [14]
LC/LC-MS/MS [15]
GeLC-MS/MS (this work)
TAP Western [17]
(a)
(c)
(b)
0.5 – 1 pmol
20 – 40 pmol
0
10
20
30
40
50
60
70
80
90
100
<125
125-
250
250-
500
500-
1,00
0
1,000
-2,0
00
2,00
0 -4,00
0
4,000
-8,0
00
8,00
0-16,00
0
16,0
00-32,
000
32,0
00-64,
000
64,0
00-128
,000
128,
000-2
56,0
00
256,
000-5
12,0
00
512,
000-1
,024
,000
>1,0
24,0
00
Molecules per cell
Pro
tein
s id
entif
ied
(%)
0
10
20
30
40
50
60
70
<125
125-
250
250-
500
500-
1,00
0
1,000
-2,0
00
2,000
- 4,0
00
4,00
0-8,0
00
8,000
-16,0
00
16,00
0-32,
000
32,00
0-64,
000
64,0
00-128
,000
128,
000-2
56,0
00
256,
000-5
12,0
00
512,
000-1
,024
,000
>1,02
4,00
0
Molecules per cell
Seq
uenc
e co
vera
ge (
%)
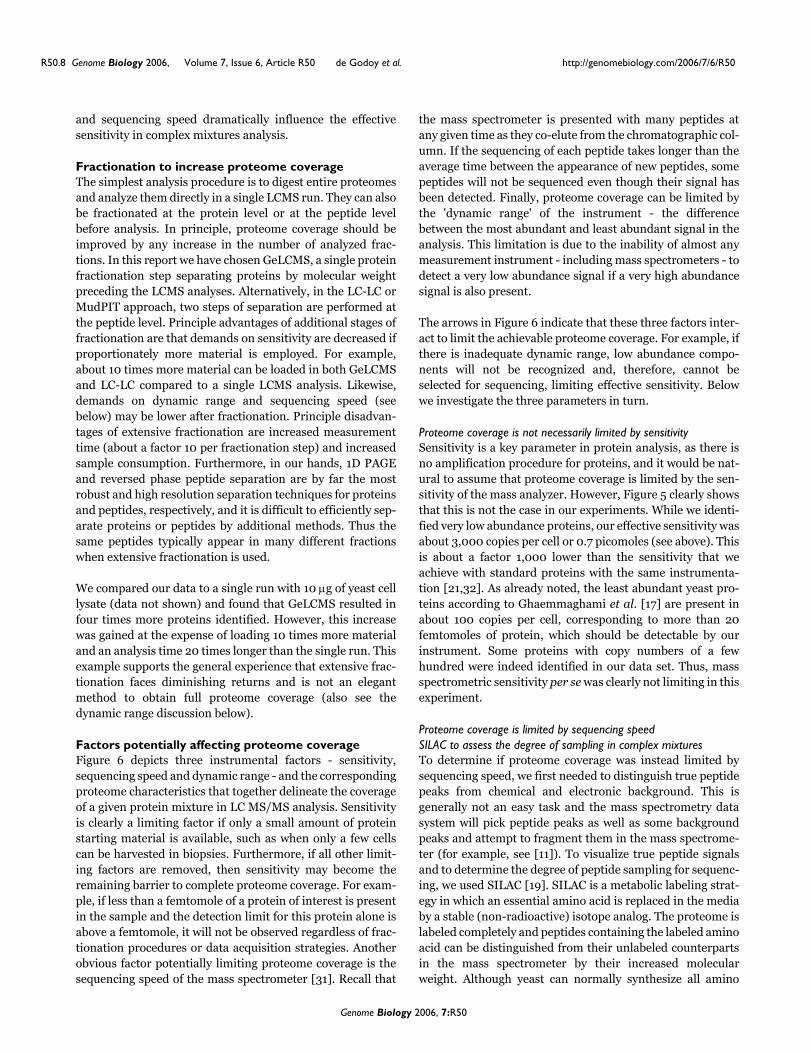
Parameters affecting the degree of proteome coverageFigure 6Parameters affecting the degree of proteome coverage. The dark blue terms pertain to the characteristics of the mass spectrometer and associated on-line chromatography. In red are the corresponding characteristics of the proteome. The blue arrows indicate that the three parameters are interdependent. For example, limited dynamic range and sequencing speed act together to reduce the effective sensitivity in complex mixtures to below that of single proteins.
Sensitivity
Dynamicrange
Sequencingspeed
Abundance of lowest detectable protein
Complexity of protein mixture
Most versus least abundant protein
Genome Biology 2006, 7:R50
R50.8 Genome Biology 2006, Volume 7, Issue 6, Article R50 de Godoy et al. http://genomebiology.com/2006/7/6/R50
and sequencing speed dramatically influence the effectivesensitivity in complex mixtures analysis.
Fractionation to increase proteome coverageThe simplest analysis procedure is to digest entire proteomesand analyze them directly in a single LCMS run. They can alsobe fractionated at the protein level or at the peptide levelbefore analysis. In principle, proteome coverage should beimproved by any increase in the number of analyzed frac-tions. In this report we have chosen GeLCMS, a single proteinfractionation step separating proteins by molecular weightpreceding the LCMS analyses. Alternatively, in the LC-LC orMudPIT approach, two steps of separation are performed atthe peptide level. Principle advantages of additional stages offractionation are that demands on sensitivity are decreased ifproportionately more material is employed. For example,about 10 times more material can be loaded in both GeLCMSand LC-LC compared to a single LCMS analysis. Likewise,demands on dynamic range and sequencing speed (seebelow) may be lower after fractionation. Principle disadvan-tages of extensive fractionation are increased measurementtime (about a factor 10 per fractionation step) and increasedsample consumption. Furthermore, in our hands, 1D PAGEand reversed phase peptide separation are by far the mostrobust and high resolution separation techniques for proteinsand peptides, respectively, and it is difficult to efficiently sep-arate proteins or peptides by additional methods. Thus thesame peptides typically appear in many different fractionswhen extensive fractionation is used.
We compared our data to a single run with 10 µg of yeast celllysate (data not shown) and found that GeLCMS resulted infour times more proteins identified. However, this increasewas gained at the expense of loading 10 times more materialand an analysis time 20 times longer than the single run. Thisexample supports the general experience that extensive frac-tionation faces diminishing returns and is not an elegantmethod to obtain full proteome coverage (also see thedynamic range discussion below).
Factors potentially affecting proteome coverageFigure 6 depicts three instrumental factors - sensitivity,sequencing speed and dynamic range - and the correspondingproteome characteristics that together delineate the coverageof a given protein mixture in LC MS/MS analysis. Sensitivityis clearly a limiting factor if only a small amount of proteinstarting material is available, such as when only a few cellscan be harvested in biopsies. Furthermore, if all other limit-ing factors are removed, then sensitivity may become theremaining barrier to complete proteome coverage. For exam-ple, if less than a femtomole of a protein of interest is presentin the sample and the detection limit for this protein alone isabove a femtomole, it will not be observed regardless of frac-tionation procedures or data acquisition strategies. Anotherobvious factor potentially limiting proteome coverage is thesequencing speed of the mass spectrometer [31]. Recall that
the mass spectrometer is presented with many peptides atany given time as they co-elute from the chromatographic col-umn. If the sequencing of each peptide takes longer than theaverage time between the appearance of new peptides, somepeptides will not be sequenced even though their signal hasbeen detected. Finally, proteome coverage can be limited bythe 'dynamic range' of the instrument - the differencebetween the most abundant and least abundant signal in theanalysis. This limitation is due to the inability of almost anymeasurement instrument - including mass spectrometers - todetect a very low abundance signal if a very high abundancesignal is also present.
The arrows in Figure 6 indicate that these three factors inter-act to limit the achievable proteome coverage. For example, ifthere is inadequate dynamic range, low abundance compo-nents will not be recognized and, therefore, cannot beselected for sequencing, limiting effective sensitivity. Belowwe investigate the three parameters in turn.
Proteome coverage is not necessarily limited by sensitivitySensitivity is a key parameter in protein analysis, as there isno amplification procedure for proteins, and it would be nat-ural to assume that proteome coverage is limited by the sen-sitivity of the mass analyzer. However, Figure 5 clearly showsthat this is not the case in our experiments. While we identi-fied very low abundance proteins, our effective sensitivity wasabout 3,000 copies per cell or 0.7 picomoles (see above). Thisis about a factor 1,000 lower than the sensitivity that weachieve with standard proteins with the same instrumenta-tion [21,32]. As already noted, the least abundant yeast pro-teins according to Ghaemmaghami et al. [17] are present inabout 100 copies per cell, corresponding to more than 20femtomoles of protein, which should be detectable by ourinstrument. Some proteins with copy numbers of a fewhundred were indeed identified in our data set. Thus, massspectrometric sensitivity per se was clearly not limiting in thisexperiment.
Proteome coverage is limited by sequencing speedSILAC to assess the degree of sampling in complex mixturesTo determine if proteome coverage was instead limited bysequencing speed, we first needed to distinguish true peptidepeaks from chemical and electronic background. This isgenerally not an easy task and the mass spectrometry datasystem will pick peptide peaks as well as some backgroundpeaks and attempt to fragment them in the mass spectrome-ter (for example, see [11]). To visualize true peptide signalsand to determine the degree of peptide sampling for sequenc-ing, we used SILAC [19]. SILAC is a metabolic labeling strat-egy in which an essential amino acid is replaced in the mediaby a stable (non-radioactive) isotope analog. The proteome islabeled completely and peptides containing the labeled aminoacid can be distinguished from their unlabeled counterpartsin the mass spectrometer by their increased molecularweight. Although yeast can normally synthesize all amino
Genome Biology 2006, 7:R50
http://genomebiology.com/2006/7/6/R50 Genome Biology 2006, Volume 7, Issue 6, Article R50 de Godoy et al. R50.9
com
ment
reviews
reports
refereed researchdepo
sited researchinteractio
nsinfo
rmatio
n
acids, SILAC labeling is possible by using deletion strainswhere the synthesis pathway of the specific amino acid usedfor labeling is disrupted [33].
Cells were grown in defined medium containing either nor-mal or 13C6
15N2-labeled lysine, mixed 1:1, lysed and the cellextract separated by gel electrophoresis. One of the bands wasexcised, in-gel digested and measured by LC MS/MS on theLTQ-FT. A flow chart of the experiment is presented in Figure7. All peptides - except the carboxy-terminal peptide of eachprotein - should be present as 1:1 pairs in the mass spectra.Ideally, each SILAC pair detectable in the each mass spec-trum should then be selected for sequencing and both its non-labeled ('light') and labeled ('heavy') forms should be identi-fied. In practice, if sequencing speed is not sufficiently high,the more abundant peptide pairs will be identified in bothforms, less abundant peptide pairs will be picked for sequenc-ing in only one of the two forms and the least abundant pep-tide pairs may not be sequenced at all.
Coverage of SILAC pairs by sequencingIn total, more than 1,200 unique peptides were identified inthe SILAC experiment of one gel band, mapping to 287 pro-teins. Among these peptides, 729 were present in both heavyand light forms, while for 500 unique peptides, only one ofthe SILAC forms could be detected (Figure 8a). As bothSILAC forms were of equal abundance, they were both recog-nized by the data system as candidates for sequencing. Thefact that in 40% of the cases, only one of them was actuallyfragmented and identified shows that sequencing speed wasindeed limiting. Furthermore, Figure 8a shows that SILACpairs from abundant proteins tend to be sequenced in bothforms, whereas low abundance proteins (indicated here bylower peptide number) are almost exclusively identified bysequencing of only one partner of the SILAC pairs.
To clarify this finding in more detail, we investigated thewhole LC run for the occurrence of SILAC pairs, regardless ofwhether they were picked for sequencing or not. Using thehigh mass accuracy and resolution, we extracted SILAC pairsby the exact mass difference of 8.014 Da. To count as SILACpairs, masses had to be within 10 ppm of each other (afteradding the SILAC label) and both peaks needed to be accom-panied by 13C isotopes. These criteria effectively removednoise from consideration. The list was then reduced to uniquemasses and SILAC pairs were classified according to thenumber of times they appeared in consecutive full scans.Finally, we determined for each pair whether none, one orboth members of the pair were selected for sequencing. Asshown in Figure 8b, for abundant peptides - those detectablein 5 or more consecutive MS scans (roughly corresponding to20 seconds elution time) - 18% of SILAC pairs weresequenced only in one of the two states, 44% were sequencedin both forms and the remaining 38% were not sequenced atall. The low abundance peptides (those registered only for 2consecutive scans) were not picked for sequencing in an
astonishing 60% of the cases. These data show that thesequencing speed was not sufficient to fragment all recog-nized peptide pairs and that low abundance peaks are lesslikely to be sequenced than high abundance peaks. The figuresuggests that, at the dynamic range achieved in this experi-ment, at least a factor three increase in sequencing attemptswould be desirable. Any increase in dynamic range, of course,would need to be accompanied by a further increase insequencing speed.
We note in passing that the 'effective sequencing speed' couldbe much higher than it is now. As observed above, in ourexperiment each unique sequence was sequenced andidentified on average three times. Thus, if acquisition soft-ware was more intelligent in selecting peaks for sequencing,the effective sequencing speed could be at least a factor threehigher, probably leading to many more identifications. Sincemass accuracy is in the low ppm range, recognition of thesame peptide or the same peptide in a different charge stateand exclusion from further sequencing should be straightfor-ward. Furthermore, further predicted peptides from a proteinalready identified with two peptides could be excluded fromfurther sequencing, which would dramatically improve effec-tive sequencing speed.
In principle, it would be possible that many peptides are frag-mented but not identified by the search engine. However,30% of all sequencing attempts in this experiment already ledto productive identifications even at our high stringency cri-teria. Furthermore, reports of manual in depth analysis ofhigh accuracy data also suggest that there is not a large frac-tion of proteins remaining to be identified with the aid of bet-ter peptide search engines (for example, see [34,35]).
Proteome coverage is limited by dynamic rangeBecause the yeast proteome has a dynamic range of about 104,the dynamic range of the mass spectrometer ideally should begreater than this value. By inspection of mass spectra in thisexperiment, we found that SILAC pairs could only be identi-fied in a range of about 100 (most abundant to least abundantpair in the same spectrum). In no case were we able to identifypairs with an abundance difference of more than a few hun-dred. In hindsight, this was to be expected since the FT-ICRwas filled with five million charges and several hundredcharges are necessary for detecting a signal. If only two spe-cies were present, then a dynamic range of 104 could beachieved. However, in our experiments, the total signal isalways distributed between many peptides with differentabundances, thus the effective dynamic range in a proteomicsexperiment is much less than the maximal dynamic range fora two component mixture.
Accumulation times for the FT-ICR full scans were set to amaximum of two seconds but typical injection times werebelow a hundred milliseconds. This was caused by abundantpeptides that essentially determined the time it took to fill the
Genome Biology 2006, 7:R50

R50.10 Genome Biology 2006, Volume 7, Issue 6, Article R50 de Godoy et al. http://genomebiology.com/2006/7/6/R50
Figure 7 (see legend on next page)
LYS1deletion strain
Light isotope Heavy isotope
Mix cells 1:1Analyze by reversed-phase nanoLC-MS
546 548 550 552 554 556 558 560 562 564 566m/z
0
5
10
15
20
25
30
35
40
45
50
55
60
65
70
75
80
85
90
95
100
Rel
ativ
e a
bund
ance
551.32
547.31
564.96547.81 561.96551.82
562.29
557.10
555.70562.63555.50 557.30 565.30
548.31
555.30552.32
556.90
557.50555.90549.80 562.96
545.79565.63564.30548.81
550.30 557.70546.29 565.97563.29558.30 560.29552.82 555.04 560.70**546 548 550 552 554 556 558 560 562 564 566
m/z
0
5
10
15
20
25
30
35
40
45
50
55
60
65
70
75
80
85
90
95
100551.32
547.31
564.96547.81 561.96551.82
562.29
557.10
555.70562.63555.50 557.30 565.30
548.31
555.30552.32
556.90
557.50555.90549.80 562.96
545.79565.63564.30548.81
550.30 557.70546.29 565.97563.29558.30 560.29552.82 555.04 560.70**
Genome Biology 2006, 7:R50

http://genomebiology.com/2006/7/6/R50 Genome Biology 2006, Volume 7, Issue 6, Article R50 de Godoy et al. R50.11
com
ment
reviews
reports
refereed researchdepo
sited researchinteractio
nsinfo
rmatio
n
ICR trap to the desired number of ions. Abundant proteinswere present in each gel slice and abundant peptides eluted atnearly every time point; therefore, effective dynamic rangewas determined by the most abundant proteins. Dynamicrange of the LC separation would only increase overalldynamic range if peptides were completely separated fromeach other rather than many peptides co-eluting at any giventime. This finding also explains why additional stages of frac-tionation do not necessarily increase dynamic range substan-
tially. Interestingly, purely in silico models have recentlypredicted that dynamic range is the crucial parameter in com-plex mixture analysis [36].
Possible improvements in proteome coverage and perspectives for covering the entire yeast proteomeWith current GeLCMS technology employing high accuracymass measurements and fast sequencing cycles, we unambig-uously cover more than 2,000 yeast proteins. There is evi-dence for about 1,000 additional proteins that are not listedhere because their identification was ambiguous (Figure 4a).These proteins should be 'recoverable' with incrementalimprovements in current technology. For example, we notedthat effective sequencing speed was limited by repeatedsequencing of the same peptide, something that should beavoidable with better acquisition software. With these andother straightforward improvements, a protein mixturesimilar to the yeast proteome should be analyzable to a depthof about 3,000 proteins. Those proteins should also essen-tially all be quantifiable by the SILAC method, since we wouldobtain several quantifiable yeast peptides for the vast major-ity of these proteins.
Figure 5 indicates that effective sensitivity needed for theentire yeast proteome is between 10 and 100 times higherthan what we achieve here and that we would need to detectabout twice as many proteins. As mentioned above, massspectrometric sensitivity is already sufficient even for theleast abundant proteins.
Sequencing speed could further be improved by building adatabase of typically observed yeast peptides first. Subse-quent identification would then be done against this peptidedatabase and, given the very high mass accuracy that can nowbe obtained even on compact instruments [37], would requirerelatively low quality MS/MS spectra. Therefore, very fastMS/MS scans (called 'Turbo scans') could be employed,which could speed up sequencing several fold.
With these improvements, neither sensitivity nor sequencingspeed would likely be limiting for the analysis of the completeyeast proteome. Dynamic range, however, can only beaddressed by substantial pre-fractionation, which is an unat-tractive option, or by increasing the dynamic range of themass spectrometer. Fortunately, the latter can be addressedin several ways. For example, the most abundant ions in amass spectrum could be determined first, as is the case now.In a second accumulation of ions, these species could
SILAC labeling of yeast to recognize true peptide signalsFigure 7 (see previous page)SILAC labeling of yeast to recognize true peptide signals. A yeast strain that is deficient for lysine biosynthesis is grown in the presence of normal lysine or lysine with substituted 13C and 15N, leading to a mass difference of 8 Da. Yeast cells are mixed in equal proportions, lysed, digested by endopeptidase LysC and analyzed by mass spectrometry. In the example mass spectrum, each true peptide signal is represented by a pair, spaced by 8 Da (blue arrows; mass difference appear different because peptide can have different charge states). Peaks marked by red stars are unlikely to be yeast peptides because they have no SILAC partner.
Degree of sampling of SILAC peptide pairsFigure 8Degree of sampling of SILAC peptide pairs. Yeast was SILAC labeled as explained in Figure 7 and one gel band was analyzed. In principle, SILAC peptide pairs should both be recognized and sequenced as they are equally abundant. (a) Proteins identified were binned according to decreasing Mascot score. Blue bars indicate the peptide in which both members of SILAC pairs were sequenced and red bars indicate the proportion of peptides in which only one member of the SILAC pair was sequenced. (b) Complete analysis of the LCMS experiment for all SILAC pairs extracted by their mass differences. Peptide pairs are ordered by the number of consecutive mass spectrometry scans that they appear in, thus greater or equal than three means that the pair was detected in three or more scans.
0
10
20
30
40
50
60
70
80
90
100
All ≥ 2 ≥ 3 ≥ 4 ≥ 5
Number of times the peptide was detected
Seq
uenc
ing
by M
S/M
S (
perc
enta
ge)
SILAC singlets
SILAC pairs
Not picked
0
100
200
300
400
500
600
01 to 50 51 to 100 101 to 150 151 to 200 201 to 250 251 to 287
Mascot protein hit
Pep
tides
Iden
tifie
d
SILAC singlets
SILAC pairs
(a)
(b)
Genome Biology 2006, 7:R50

R50.12 Genome Biology 2006, Volume 7, Issue 6, Article R50 de Godoy et al. http://genomebiology.com/2006/7/6/R50
selectively be ejected from the ion trap allowing longer accu-mulation times for the remaining low abundance ions [38].Alternatively, the total mass range can be acquired in severalindividual mass ranges, again allowing much longer acquisi-tion times for the mass ranges without dominant peptides(Olsen and Mann, unpublished). By one or a combination ofthese techniques, it seems likely that an increase of dynamicrange by at least an order of magnitude should be achievable.
ConclusionHere we have shown that high mass accuracy and sequencingspeeds employed in state of the art proteomics can confi-dently identify more than 2,000 proteins in the yeast pro-teome without excessive fractionation and from only 100 µgof yeast cell lysate. Despite these impressive numbers, effec-tive sensitivity in complex mixture analysis is several ordersof magnitude lower than that achieved in single protein anal-ysis. Using SILAC labeled yeast, which produces characteris-tic 1:1 pairs of true peptide signals, we determined that acombination of effective sequencing speed and effectivedynamic range limit coverage of the yeast proteome. Ourresults show that current proteomics technology is indeedcapable of in-depth characterizing samples containing about1,000 to 2,000 proteins, ratifying the results obtained in pre-vious studies of 'subproteomes' such as those of the nucleolusand mitochondria [4,5]. It also indicates in the case of morecomplex proteomes, such as yeast total cell lysate, only abouthalf of the proteins expressed are being detected and the fullcoverage will require one to two orders of magnitude highereffective sensitivity. This can be achieved by increasing thesequencing speed by more intelligent acquisition software,the use of peptide databases for spectrum/spectrum match-ing using very fast scans and most importantly by increasingthe dynamic range of the mass spectrometer by separatelyaccumulating highly abundant peptides and low abundancepeptides. Such advances seem possible in principle and willlikely allow identification and quantification of almost allproteins in the yeast proteome in an experiment of reasonablelength.
If we estimate that a particular human cell type expresses upto three times more genes than yeast, then another one or twoorders of magnitude in effective sensitivity may be needed forcomplete coverage of a human cellular proteome. This chal-lenge also appears to be solvable if we consider the trajectoryof mass spectrometric technology improvement over the lastfew years.
We found that in the detected proteome our experimentalready identified enough peptides to account for 25% of theprimary structure of each of the proteins on average. Thus,any modifications present in this part of the proteome couldin principle also have been detected and quantified. Use of asecond enzyme would only double analysis time but yieldmuch larger overall sequence coverage. At least in the case of
stochiometric modifications, the chances to detect them invery complex mixtures appear quite favorable.
On the other hand, covering the proteome completely in thesense of characterizing all modifications present only on asmall number of the protein population as well as all isoformsby 'brute force' approaches represents a challenge manyorders of magnitude larger. This is far out of reach of cur-rently existing technologies and will instead require targetedstrategies for each of these 'subproteomes' for the foreseeablefuture.
Materials and methodsCulture growth, SILAC labeling and extract preparationYeast cell culture and harvesting was done as close as possibleto the protocol of Ghaemmaghami et al. [17], in order to makeresults comparable. Wild-type S. cerevisiae cells (Y700), weregrown to log-phase (OD600 0.7) in yeast extract peptone dex-trose (YEPD) liquid medium, harvested by centrifugation for5 minutes at 4,000 × g at 4°C, washed two times with coldH2O by centrifugation and immediately lysed for proteinextraction. Cell membranes were disrupted by boiling in aSDS solution (50 mM Tris-HCl, pH 7.5, 5% SDS, 5% glycerol,50 mM dithiothreitol (DTT), complete protease inhibitorscocktail (Roche, Mannheim, Germany). The total yeast lysatewas centrifuged to remove cellular debris, the supernatantwas transferred to a fresh tube and the protein concentrationin the extract was determined by Bradford assay. For SILACexperiments, the yeast strain Y15969 (BY4742; MATα;his3D1; leu2D0; lys2D0; ura3D0; YIR034c::kanMX4), whichhas a lys1 gene deletion and is, therefore, an auxotroph forlysine, was purchased from EuroScarf (EuroScarf, Frankfurt,Germany). Two populations of cells were grown in yeastnitrogen base (YNB) liquid medium containing either 20 mg/l normal L-lysine or 20 mg/l L-lysine-U-13C6, 15N2 (Isotec-SIGMA, Miamisburg, OH, USA) for 10 generations, until theyreached log-phase (OD600 0.7). Equal amounts of the normaland heavy SILAC-labeled yeast cells (as determined by OD600
measurement) were then mixed 1:1, harvested, washed andlysed as described above.
1D SDS-PAGE and in-gel digestion of yeast proteinsProteins (100 µg) extracted from wild-type or lysine-auxo-troph yeast cells were separated by 1D SDS-PAGE, usingNuPAGE® Novex Bis-Tris gels and NuPAGE® MES SDS run-ning buffer (Invitrogen, Carlsbad, CA, USA) according to themanufacturer's instructions. The gel was stained withCoomassie blue using Colloidal Blue Staining Kit (Invitro-gen), cut in 20 slices and protein bands were excised anddigested with either trypsin (Promega, Madison, WI, USA) orendoproteinase Lys-C (Wako, Osaka, Japan). Gel bands werecut into 1 mm3 cubes, washed four times with 50 mM ammo-nium bicarbonate, 50% ethanol and incubated with 10 mMDTT in 50 mM ammonium bicarbonate for 1 hour at 56°C for
Genome Biology 2006, 7:R50
http://genomebiology.com/2006/7/6/R50 Genome Biology 2006, Volume 7, Issue 6, Article R50 de Godoy et al. R50.13
com
ment
reviews
reports
refereed researchdepo
sited researchinteractio
nsinfo
rmatio
n
protein reduction. The resulting free thiol (-SH) groups weresubsequently alkylated by incubating the samples with 55mM iodoacetamide in 50 mM ammonium bicarbonate for 1hour at 25°C in the dark. Gels were washed two times with a50 mM ammonium bicarbonate, 50% acetonitrile solution,dehydrated with 100% ethanol and dried in a vacuum concen-trator. The gel pieces were re-hydrated with either 12.5 ng/µltrypsin (wild-type cells) or 12.5 ng/µl endoproteinase Lys-C(SILAC-labeled cells) in 50 mM ammonium bicarbonate andincubated for 16 hours at 37°C for protein digestion. Superna-tants were transferred to fresh tubes, and the remaining pep-tides were extracted by incubating gel pieces two times with30% acetonitrile (MeCN) in 3% trifluoroacetic acid (TFA), fol-lowed by dehydration with 100% MeCN. The extracts werecombined, desalted using RP-C18 StageTip columns [39] andthe eluted peptides used for mass spectrometric analysis.
NanoLC-MS/MS and data analysisAll digested peptide mixtures were separated by onlinereversed-phase (RP) nanoscale capillary liquid chromatogra-phy (nanoLC) and analyzed by electrospray tandem massspectrometry (ES MS/MS). The experiments were performedwith an Agilent 1100 nanoflow system connected to an LTQ-FT mass spectrometer (Thermo Electron, Bremen, Germany)equipped with a nanoelectrospray ion source (Proxeon Bio-systems, Odense, Denmark). Binding and chromatographicseparation of the peptides took place in a 15 cm fused silicaemitter (75 µm inner diameter) in-house packed with RPReproSil-Pur C18-AQ 3 µm resin (Dr Maisch GmbH, Ammer-buch-Entringen, Germany).
Peptide mixtures were injected onto the column with a flow of500 nl/minute and subsequently eluted with a flow of 250 nl/minute from 5% to 40% MeCN in 0.5% acetic acid, in a 120minute gradient. The mass spectrometer was operated in datadependent mode to automatically switch between MS andMS/MS (MS2) acquisition. Survey full scan MS spectra (fromm/z 300 to 1,600) were acquired in the FT-ICR withresolution R = 100,000 at m/z 400 (after accumulation to atarget value of 5,000,000 in the linear ion trap). The five mostintense ions were sequentially isolated and fragmented in thelinear ion trap using collisionally induced dissociation at atarget value of 10,000. Former target ions selected for MS/MS were dynamically excluded for 30 seconds. Total cycletime was approximately 3 seconds. The general mass spectro-metric conditions were: spray voltage, 2.4 kV; no sheath andauxiliary gas flow; ion transfer tube temperature, 100°C; col-lision gas pressure, 1.3 mTorr; normalized collision energyusing wide-band activation mode; 35% for MS2. Ion selectionthresholds were 250 counts for MS2. An activation q = 0.25and activation time of 30 ms was applied in MS2 acquisitions.
Recalibration algorithm for increased mass accuracy under space charge conditionsTo boost the number of ion trap sequencing events during theonline LCMS analysis, we operate the LTQ-FT in full sequenc-
ing mode (Top5), where full scan spectra are recorded in theLTQ-FT-ICR without acquiring narrow mass range (SIM)scans and with a high ion load (target of 5 × 10⁶) to maximizedynamic range. To correct for the frequency shift caused byoverfilling the ICR trap, we have devised a recalibration algo-rithm that corrects for space charge-induced frequency errorsin FT-ICR full scan spectra using already identified peptides.The algorithm is based on an iterative protein databasesearch procedure, in which high-scoring peptides (Mascotpeptide scores >35) from a first-pass database search of allacquired tandem mass spectra with loose MS tolerance (25ppm) are used for calculating the frequency error correction.This procedure is an extension of the iterative recalibrationprocedure routinely used in our open source programMSQuant [40].
We compute the frequency error correction by converting theobserved and calculated peptide precursor m/z values to fre-quencies and then determining a linear correlation betweenthe observed and theoretical frequencies. The precursor m/zof all acquired tandem mass spectra was corrected by con-verting the m/z to a frequency, applying the found observed-to-theoretical linear transformation and converting the newfrequency back to an m/z value. This recalibration proceduredecreases the average absolute precursor mass error severalfold and we achieved a final average absolute mass accuracyof 2.6 ppm. This enabled a second-pass database search withmore stringent MS tolerance, in this case 10 ppm.
Peptide identification via Mascot database searchProteins were identified by automated database searching[41] against an in-house curated version of the yeast_orf (S.cerevisiae) protein sequence database. This database wascomplemented with frequently observed contaminants (por-cine trypsin, achromobacter lyticus lysyl endopeptidase andhuman keratins). A 'decoy database' was prepared bysequence reversing each entry and appending this database tothe forward database. Search parameters specified a MS tol-erance of 10 ppm (see above) and an MS/MS tolerance at 0.5Da and either full trypsin or Lys-C specificity as applicable,allowing for up to three missed cleavages. Carbamidomethyl-ation of cysteine was set as a fixed modification and oxidationof methionines, amnio-terminal protein acetylation, lysine-U-13C6, 15N2 (where applicable) and N-pyroglutamate wereallowed as variable modifications. Due to the high mass accu-racy, the 99% significance threshold (p < 0.01) in the yeastdatabase search was a Mascot score of 29. (Mascot peptidescore is defined as -10 × log(p) where p is the probability of afalse positive peptide hit.) Peptides and proteins were vali-dated as follows. Only peptides with a length greater or equalto 5 amino acids and with a Mascot score greater or equal to15 were considered. Peptides identifying the same sequenceor sequence stretch were collapsed to one. Proteins were con-sidered identified if 2 peptides fulfilling the above criteriamapped to their sequence and the added score of both pep-tides was at least 59. This protein identification criterion
Genome Biology 2006, 7:R50

R50.14 Genome Biology 2006, Volume 7, Issue 6, Article R50 de Godoy et al. http://genomebiology.com/2006/7/6/R50
corresponds to 2 peptides with 99% confidence if they havethe same score and an overall confidence of p = 0.0001 if bothpeptide identifications are considered independent. Thisstringency of identification should exclude any false positiveidentification in our data set. Searching a compound forwardand reversed database indeed did not reveal any false positiveprotein identification.
Additional data filesThe following additional data are available with the onlineversion of this paper. Additional data file 1 contains data onall peptides and proteins identified in this study.Additional File 1Data on all peptides and proteins identified in this studyData on all peptides and proteins identified in this study.Click here for file
AcknowledgementsWe thank other members of the Center for Experimental BioInformatics(CEBI) and the Department for Proteomics and Signal Transduction fortheir support. Work at CEBI was supported by a grant from the DanishNational Research Foundation to the Center for ExperimentalBioinformatics. J.V.O. was supported by a PhD fellowship by the Universityof Southern Denmark. We thank Yanling Zang for constructing a yeastdatabase used for calculating sequence coverage.
References1. Link AJ, Eng J, Schieltz DM, Carmack E, Mize GJ, Morris DR, Garvik
BM, Yates JR 3rd: Direct analysis of protein complexes usingmass spectrometry. Nat Biotechnol 1999, 17:676-682.
2. Peng J, Gygi SP: Proteomics: the move to mixtures. J MassSpectrom 2001, 36:1083-1091.
3. Aebersold R, Mann M: Mass spectrometry-based proteomics.Nature 2003, 422:198-207.
4. Mootha VK, Bunkenborg J, Olsen JV, Hjerrild M, Wisniewski JR, StahlE, Bolouri MS, Ray HN, Sihag S, Kamal M, et al.: Integrated analysisof protein composition, tissue diversity, and gene regulationin mouse mitochondria. Cell 2003, 115:629-640.
5. Andersen JS, Lam YW, Leung AK, Ong SE, Lyon CE, Lamond AI, MannM: Nucleolar proteome dynamics. Nature 2005, 433:77-83.
6. Foster LJ, de Hoog CL, Zhang Y, Xie X, Mootha VK, Mann M: Amammalian organelle map by protein correlation profiling.Cell 2006, 125:187-199.
7. Ho Y, Gruhler A, Heilbut A, Bader GD, Moore L, Adams SL, Millar A,Taylor P, Bennett K, Boutilier K, et al.: Systematic identificationof protein complexes in Saccharomyces cerevisiae by massspectrometry. Nature 2002, 415:180-183.
8. Gavin AC, Bosche M, Krause R, Grandi P, Marzioch M, Bauer A,Schultz J, Rick JM, Michon AM, Cruciat CM, et al.: Functional organ-ization of the yeast proteome by systematic analysis of pro-tein complexes. Nature 2002, 415:141-147.
9. Mann M, Jensen ON: Proteomic analysis of post-translationalmodifications. Nat Biotechnol 2003, 21:255-261.
10. Anderson NL, Anderson NG: The human plasma proteome: his-tory, character, and diagnostic prospects. Mol Cell Proteomics2002, 1:845-867.
11. Kuster B, Schirle M, Mallick P, Aebersold R: Scoring proteomeswith proteotypic peptide probes. Nat Rev Mol Cell Biol 2005,6:577-583.
12. Liu H, Sadygov RG, Yates JR 3rd: A model for random samplingand estimation of relative protein abundance in shotgunproteomics. Anal Chem 2004, 76:4193-4201.
13. Shevchenko A, Jensen ON, Podtelejnikov AV, Sagliocco F, Wilm M,Vorm O, Mortensen P, Boucherie H, Mann M: Linking genome andproteome by mass spectrometry: large-scale identificationof yeast proteins from two dimensional gels. Proc Natl Acad SciUSA 1996, 93:14440-14445.
14. Washburn MP, Wolters D, Yates JR 3rd: Large-scale analysis ofthe yeast proteome by multidimensional protein identifica-tion technology. Nat Biotechnol 2001, 19:242-247.
15. Peng J, Elias JE, Thoreen CC, Licklider LJ, Gygi SP: Evaluation of
multidimensional chromatography coupled with tandemmass spectrometry (LC/LC-MS/MS) for large-scale proteinanalysis: the yeast proteome. J Proteome Res 2003, 2:43-50.
16. Wei J, Sun J, Yu W, Jones A, Oeller P, Keller M, Woodnutt G, ShortJM: Global proteome discovery using an online three-dimen-sional LC-MS/MS. J Proteome Res 2005, 4:801-808.
17. Ghaemmaghami S, Huh WK, Bower K, Howson RW, Belle A,Dephoure N, O'Shea EK, Weissman JS: Global analysis of proteinexpression in yeast. Nature 2003, 425:737-741.
18. Huh WK, Falvo JV, Gerke LC, Carroll AS, Howson RW, WeissmanJS, O'Shea EK: Global analysis of protein localization in bud-ding yeast. Nature 2003, 425:686-691.
19. Ong SE, Blagoev B, Kratchmarova I, Kristensen DB, Steen H, PandeyA, Mann M: Stable isotope labeling by amino acids in cell cul-ture, SILAC, as a simple and accurate approach to expres-sion proteomics. Mol Cell Proteomics 2002, 1:376-386.
20. Syka JEP, Marto JA, Bai DL, Horning S, Senko MW, Schwartz JC,Ueberheide B, Garcia B, Busby S, Muratore T, et al.: Novel linearquadrupole ion trap/FT mass spectrometer: performancecharacterization and use in the comparative analysis of his-tone H3 post-translational modifications. J Proteome Res 2004,3:621-626.
21. Olsen JV, Ong SE, Mann M: Trypsin cleaves exclusively C-termi-nal to arginine and lysine residues. Mol Cell Proteomics 2004,3:608-614.
22. Perkins DN, Pappin DJ, Creasy DM, Cottrell JS: Probability-basedprotein identification by searching sequence databases usingmass spectrometry data. Electrophoresis 1999, 20:3551-3567.
23. Desiere F, Deutsch EW, Nesvizhskii AI, Mallick P, King NL, Eng JK,Aderem A, Boyle R, Brunner E, Donohoe S, et al.: Integration withthe human genome of peptide sequences obtained by high-throughput mass spectrometry. Genome Biol 2005, 6:R9.
24. Martens L, Hermjakob H, Jones P, Adamski M, Taylor C, States D,Gevaert K, Vandekerckhove J, Apweiler R: PRIDE: the proteomicsidentifications database. Proteomics 2005, 5:3537-3545.
25. Keller A, Nesvizhskii AI, Kolker E, Aebersold R: Empirical statisti-cal model to estimate the accuracy of peptide identificationsmade by MS/MS and database search. Anal Chem 2002,74:5383-5392.
26. Nesvizhskii AI, Keller A, Kolker E, Aebersold R: A statistical modelfor identifying proteins by tandem mass spectrometry. AnalChem 2003, 75:4646-4658.
27. Nesvizhskii AI, Aebersold R: Interpretation of shotgun pro-teomic data: the protein inference problem. Mol CellProteomics 2005, 4:1419-1440.
28. Elias JE, Haas W, Faherty BK, Gygi SP: Comparative evaluation ofmass spectrometry platforms used in large-scale proteomicsinvestigations. Nat Methods 2005, 2:667-675.
29. Draghici S, Khatri P, Eklund AC, Szallasi Z: Reliability and repro-ducibility issues in DNA microarray measurements. TrendsGenet 2006, 22:101-109.
30. Wilm M, Shevchenko A, Houthaeve T, Breit S, Schweigerer L, FotsisT, Mann M: Femtomole sequencing of proteins from polyacr-ylamide gels by nano electrospray mass spectrometry.Nature 1996, 379:466-469.
31. Rappsilber J, Mann M: Is mass spectrometry ready for pro-teome-wide protein expression analysis? Genome Biol 2002,3:COMMENT2008.
32. Olsen JV, Mann M: Improved peptide identification in pro-teomics by two consecutive stages of mass spectrometricfragmentation. Proc Natl Acad Sci USA 2004, 101:13417-13422.
33. Gruhler A, Olsen JV, Mohammed S, Mortensen P, Faergeman NJ,Mann M, Jensen ON: Quantitative phosphoproteomics appliedto the yeast pheromone signaling pathway. Mol Cell Proteomics2005, 4:310-327.
34. Chalkley RJ, Baker PR, Huang L, Hansen KC, Allen NP, Rexach M,Burlingame AL: Comprehensive analysis of a multidimensionalliquid chromatography mass spectrometry dataset acquiredon a quadrupole selecting, quadrupole collision cell, time-of-flight mass spectrometer: II. New developments in ProteinProspector allow for reliable and comprehensive automaticanalysis of large datasets. Mol Cell Proteomics 2005, 4:1194-1204.
35. Chalkley RJ, Baker PR, Hansen KC, Medzihradszky KF, Allen NP, Rex-ach M, Burlingame AL: Comprehensive analysis of a multidi-mensional liquid chromatography mass spectrometrydataset acquired on a quadrupole selecting, quadrupole col-lision cell, time-of-flight mass spectrometer: I. How much ofthe data is theoretically interpretable by search engines? Mol
Genome Biology 2006, 7:R50
http://www.ncbi.nlm.nih.gov/entrez/query.fcgi?cmd=Retrieve&db=PubMed&dopt=Abstract&list_uids=8962070
http://www.ncbi.nlm.nih.gov/entrez/query.fcgi?cmd=Retrieve&db=PubMed&dopt=Abstract&list_uids=8962070
http://www.ncbi.nlm.nih.gov/entrez/query.fcgi?cmd=Retrieve&db=PubMed&dopt=Abstract&list_uids=8962070
http://www.ncbi.nlm.nih.gov/entrez/query.fcgi?cmd=Retrieve&db=PubMed&dopt=Abstract&list_uids=8559255
http://genomebiology.com/2006/7/6/R50 Genome Biology 2006, Volume 7, Issue 6, Article R50 de Godoy et al. R50.15
com
ment
reviews
reports
refereed researchdepo
sited researchinteractio
nsinfo
rmatio
n
Cell Proteomics 2005, 4:1189-1193.36. Eriksson J, Fenyo D: Protein identification in complex
mixtures. J Proteome Res 2005, 4:387-393.37. Olsen JV, de Godoy LM, Li G, Macek B, Mortensen P, Pesch R,
Makarov A, Lange O, Horning S, Mann M: Parts per million massaccuracy on an Orbitrap mass spectrometer via lock massinjection into a C-trap. Mol Cell Proteomics 2005, 4:2010-2021.
38. Pasa-Tolic L, Harkewicz R, Anderson GA, Tolic N, Shen Y, Zhao R,Thrall B, Masselon C, Smith RD: Increased proteome coveragefor quantitative peptide abundance measurements basedupon high performance separations and DREAMS FTICRmass spectrometry. J Am Soc Mass Spectrom 2002, 13:954-963.
39. Rappsilber J, Ishihama Y, Mann M: Stop and go extraction tips formatrix-assisted laser desorption/ionization, nanoelectro-spray, and LC/MS sample pretreatment in proteomics. AnalChem 2003, 75:663-670.
40. MSQuant [http://msquant.sourceforge.net/]41. Mascot Daemon [http://www.matrixscience.com]42. Garrels JI, McLaughlin CS, Warner JR, Futcher B, Latter GI, Kobayashi
R, Schwender B, Volpe T, Anderson DS, Mesquita-Fuentes R: Pro-teome studies of Saccharomyces cerevisiae: identification andcharacterization of abundant proteins. Electrophoresis 1997,18:1347-1360.
43. Perrot M, Sagliocco F, Mini T, Monribot C, Schneider U, ShevchenkoA, Mann M, Jeno P, Boucherie H: Two-dimensional gel proteindatabase of Saccharomyces cerevisiae (update 1999). Electro-phoresis 1999, 20:2280-2298.
44. Steen H, Mann M: The abc's (and xyz's) of peptide sequencing.Nat Rev Mol Cell Biol 2004, 5:699-711.
Genome Biology 2006, 7:R50
http://www.ncbi.nlm.nih.gov/entrez/query.fcgi?cmd=Retrieve&db=PubMed&dopt=Abstract&list_uids=9298649