Time-resolved-correlation measurements of temporally heterogeneous dynamics
Upload
independentCategory
view
1download
0
A Spatially and Temporally Disaggregated AnthropogenicEmission Inventory in the Southern Balkan Region
Anastasia Poupkou & Panagiotis Symeonidis &
Ioannis Ziomas & Dimitrios Melas &
Konstantinos Markakis
Received: 28 February 2007 /Accepted: 15 June 2007 / Published online: 24 July 2007# Springer Science + Business Media B.V. 2007
Abstract A spatially and temporally resolved atmo-spheric emission inventory of ozone precursor pollut-ants (NOx, NMVOCs and CO) was developed forthe southern Balkan region in order to support airquality modelling studies focusing on Greece. Theinventory is established for the reference year 2000and it has 10 km spatial resolution. Annual anthropo-genic emission data obtained from official nationalemission inventories and from international emissiondatabases were spatially disaggregated and allocatedto a gridded domain using the top-down methodology.Source specific temporal profiles were used in ordermonthly and hourly emission data to be estimated. Inthe study area, the highest NOx amounts are emittedby the maritime and road transport sectors. Roadtransport has a prominent role in anthropogenicNMVOCs emissions followed by the solvent andother product use sector. The main CO emissionsources are represented by the road transport sectorand the non-industrial combustion plants. In thepresent study, the contribution of the transport sector
to the total emissions of pollutants over urban andnon-urban areas of Greece is investigated. Overalmost all Greek urban areas, road transport is themajor NMVOCs and CO emission source. Roadtransport contribution to NOx emissions is greaterthan 50% at the large urban centres of Greece. Thegreater part of non-urban areas is dominated by off-road vehicle emissions.
Keywords Balkan region . Emission inventory .
Greece . Spatial and temporal disaggregation
1 Introduction
Emission inventories are an essential tool for themanagement of air quality. They are one of the mostcrucial inputs required for running air quality models.In this view, a high temporal and spatial resolutioninventory is normally required. Moreover, theyrepresent a diagnostic tool through the identificationof the main sources responsible for air qualitydeterioration. The possibility to make comparisonsamong emissions calculated in different years, mayallow policy makers to assess the results of theabatement strategies adopted to reduce pollutantemissions and improve air quality (Cirillo et al. 1996).
Ideally, pollutant emissions would be measured inexact time periods and the exact location of theemission sources would be known precisely (Placetet al. 2000). In the real world, it is not feasible to
Water Air Soil Pollut (2007) 185:335–348DOI 10.1007/s11270-007-9457-2
A. Poupkou (*) : P. Symeonidis :D. Melas :K. MarkakisLaboratory of Atmospheric Physics,Department of Physics, Aristotle University of Thessaloniki,P.O. Box 149, 54124, Thessaloniki, Greecee-mail: [email protected]
I. ZiomasDepartment of Chemical Engineering,National Technical University of Athens,Zografou, Athens 15780, Greece

conduct continuous emissions monitoring of allpollutants from all emission sources. For most sourcesectors, two different approaches are implemented forthe determination of emissions that are based on theuse of emission factors. In the bottom-up approach,detailed information of individual emission sourcesare collected and added to yield a regional total.Emissions are calculated by multiplying an emissionfactor and the value of an associated activity indicatorwhich is a quantitative parameter strictly related to theemission source (Francois et al. 2005). The top-downapproach applies this concept to larger (administra-tive) areas, where statistical data may be more readilyavailable. Emissions are subsequently distributedwithin the respective area using surrogate informa-tion and downscaling methods. For modelling appli-cations on urban scale, the emission data are usuallyprovided by means of a bottom-up approach. Thisapproach is not so often implemented for mesoscaleapplications. In these cases, the emission fields areestimated disaggregating a wider space-time scaleinventory using a top-down methodology (Carnevaleet al. 2006).
Since the 1990s in Europe, many emission inven-tories have been established for modelling purposeson different scales. These inventories covered areas aslarge as Europe (Friedrich and Reis 2004; Lenhart andFriedrich 1995) down to regional or more local scales(Dommen et al. 2003; Ponche et al. 2000). Variousresearchers determined the characteristics for thequantification of atmospheric pollutants emitted inthe countries of the southern Balkan region (e.g.Aleksandropoulou and Lazaridis 2004; Symeonidis etal. 2003; Lalas 2001; Elbir et al. 2000) and only a fewof them presented emission inventories that were bothspatially and temporally resolved. More detailed arethe emission inventories compiled for the large urbanagglomerations of the southern Balkan region (Dincerand Elbir 2007; Giannouli et al. 2006; Stern 2005;Elbir and Muezzinoglu 2004; Tsilingiridis et al. 2002;Ziomas et al. 1995; Katsoulis and Whelpdale 1990).
This paper describes the spatial and temporaldisaggregation of officially reported emission data inorder an ozone precursors’ anthropogenic emissioninventory to be produced in the southern Balkanregion that can be used for air quality modellingstudies focusing mainly on Greece. In Section 2, weprovide background on the domain, the referenceyear, the temporal and spatial resolution of the
emission inventory, the emission data sources usedand the classification of the emission sources. InSections 3 and 4, the methodology employed in orderthe spatial and temporal disaggregation of emissionsby source sector to be conducted is highlighted. InSection 5, the contribution by source sector to theannual NOx, NMVOCs and CO anthropogenicemissions and the spatially resolved annual emissiontotals (gridded plots) are presented. The spatialdistribution of the road transport sector emissionsversus total emissions in Greece is also studied.Finally, seasonal and diurnal variations of emissionsare reported.
2 General Description of the Emission Inventory
We developed a source specific, gridded emissioninventory for the southern Balkan region for the year2000. The area of interest covers Greece, Albania, theFormer Yugoslav Republic of Macedonia (FYROM),western Turkey, southern Serbia and Montenegro andthe greater part of Bulgaria (Fig. 1). Besides thequantification of emissions, the aim of this inventorywas to act as a base for photochemical modelling atthe southern Balkan region in order to study theregional ozone levels mainly over Greece. A precon-dition for an emission inventory to serve as a basis forair pollution modelling is a high temporal and spatialresolution. For that reason, a standard grid wasdefined with the use of Geographic InformationSystem software, covering the 1,100 km ×1,100 kmgeographic region of interest. The grid resolution wasdetermined to be 10 km ×10 km.
The gaseous pollutants considered in the anthro-pogenic emission inventory are nitrogen oxides (NOxreported as NO2), non-methane volatile organiccompounds (NMVOCs) and carbon monoxide (CO).It should be noticed that a vast variety and significantquantities of VOCs are produced and emitted into theatmosphere by vegetation in the study area, especiallyduring summer months (Simeonidis et al. 1999;Simpson et al. 1999). Biogenic VOCs play asignificant role in the determination of atmosphericcomposition and can enhance ozone concentrationsmainly in environments rich in nitrogen oxides (Naiket al. 2004). However, the quantification of thesurface fluxes of these compounds in the southernBalkan region is out of the scope of the present study.
336 Water Air Soil Pollut (2007) 185:335–348

The emission sources of the inventory have beenstructured within the Selected Nomenclature for AirPollution (SNAP). The following source sectors havebeen considered in the inventory:
SNAP 1: Combustion in energy and transformationindustries
SNAP 2: Non-industrial combustion plantsSNAP 3: Combustion in manufacturing industrySNAP 4: Production processesSNAP 5: Extraction and distribution of fossil fuels
and geothermal energySNAP 6: Solvent and other product useSNAP 7: Road transportSNAP 8: Other mobile sources and machinery.
In the current work, the emissions from wastetreatment and disposal (SNAP 9) and agriculture(SNAP 10) were not processed. In the study area,the contribution of both source sectors to the totalNOx, NMVOCs and CO emissions of the year 2000
is small (EMEP/MSC-W 2002). In addition, allavailable information that could be used for thespatial and temporal disaggregation of these emis-sions (e.g. location of waste incinerators and landfills,time period of stubble burning) was very poor. SNAPsectors 5 and 6 contribute mainly to NMVOCsemissions and as result only these emissions wereprocessed in the framework of the present study.
CORINAIR provided the 1994 national annualemission data of NOx, NMVOCs and CO for allsource sectors in Greece (EEA 1997) with theexception of the road transport and other mobilesources and machinery sectors. CORINAIR emissiondata for Greece were chosen as they were the onlysectoral and subsectoral data available. The officialemission data reported to EMEP suggest that totalemissions in Greece experience an almost constanttrend during the period 1994–2000. Considering 1994as the base year, NMVOCs and CO emissions arecharacterised by small variations in the order of
Fig. 1 Map of the studyarea
Water Air Soil Pollut (2007) 185:335–348 337

±4% between 1994 and 2000, while NOx emissionsexhibit increases up to 8.6%. Consequently CORINAIR emission data can be considered representativeof the national emissions of Greece for the period1994–2000.
Spatially resolved annual emission data for thetransport sector in Greece were obtained from theHellenic Ministry for the Environment, PhysicalPlanning and Public Works (Symeonidis et al.2004). The inventory, having 1998 as a referenceyear, was created based on the use of the best inputdatasets available and on the implementation ofcombined bottom-up and top-down methodologiesfor the better estimation and spatial and temporalallocation of the emissions. The inventory is used inany air pollution study that requires detailed emis-sions for the transport sector. The Hellenic Ministryfor the Environment, Physical Planning and PublicWorks provided also data for the 2000 NMVOCsemissions from the production processes in therefineries of Greece (IPEXODE 2001).
The database of EMEP was the main source ofpollutants yearly emission data for all countries of thestudy area other than Greece (EMEP/MSC-W 2002).In addition to the sectoral and gridded emissions bycountry of the study domain, the internationalshipping emissions of the EMEP database were alsoused. The EMEP data, having 2000 as a referenceyear, were spatially allocated to a standard grid thathad 50 km spatial resolution (the EMEP grid: http://www.emep.int/index_data.html). For Albania andFYROM, the spatial resolution of EMEP emissionswas coarser, equal to 150 km.
3 Methodology Implemented for the SpatialDistribution of Emissions
For all emission source sectors (with the exception ofthe road transport and the other mobile sources andmachinery sectors), the main methodology used inorder to spatially allocate the emissions was the top-down approach (Cirillo et al. 1996). The top-downapproach involved disaggregating the low spatial andtemporal resolution emissions to a grid cell levelthrough the use of proxy variables that determined theshare of annual emissions that had to be attributed toeach grid cell. The proxy variables were correlatedwith the emission source sectors and were defined bymeans of: (1) geographically resolved official statis-tics, (2) indexes derived from various sources (e.g.national electricity companies, petroleum refineriescorporations) and (3) land use information. Table 1lists the proxy variables by emission source sectorused for the spatial disaggregation of the emissiondata. Emissions were distributed over populated areashaving more than 10,000 inhabitants. The only largepoint sources that could be identified individuallywere the thermal power plants and refineries. Theiremissions were assigned directly to the grid cell atwhich they were located according to their discretecoordinates (latitude and longitude).
The annual emissions from non-industrial combus-tion plants (the main polluting subsector being theresidential plants) and from district heating plantswere spatially and temporally disaggregated usingproxy variables based on demographic statistics andclimatic temperature data indicating the heating
Table 1 Proxy variables used for the spatial disaggregation of emissions
Emission source sector Proxy variable
Combustion in energy and transformationindustries
Energy production indexes (power of electricity generated by the thermal power plants,amount of produced distilled oil by the refineries)
Population data (for the district heating plants)Non-industrial combustion plants Population dataCombustion in manufacturing industry Statistics on manufacturing industry fuel consumption
Population dataProduction processes Production indexes (amount of produced distilled oil by the refineries)
Statistics on manufacturing industry fuel consumptionPopulation data
Extraction and distribution of fossil fuelsand geothermal energy
Population data
Solvent and other product use Population data
338 Water Air Soil Pollut (2007) 185:335–348

degree-days of each populated area for every heatingmonth (October to April with the exception ofAlbania where central heating operates mainly duringthe winter months). For Greece, mean monthlyclimatic temperature data were available for 87meteorological stations of the Greek Weather Service.For the rest of the study domain, the CRU globalclimate dataset of the IPCC Data Distribution Centerwas used which provided gridded mean monthlyclimatic temperature data having 0.5°×0.5° spatialresolution. In order to calculate the indicator of theheating degree-days of each populated area for everyheating month, a simplified approach was imple-mented based on the difference between the meanmonthly climatic temperature of each populated area(being equal to the mean monthly climatic temperatureof the nearest meteorological station or grid point) andthe critical temperature determining the operation ofthe heating plants. A different critical temperature wasselected for each of the countries included in the studydomain being equal to the mean value of the monthlyclimatic temperature data of the months October andApril. The calculated indicators were used along withdemographic statistics in order monthly emissionvalues to be estimated for all populated areas anddistrict heating plants in the area of study.
For Greece, the following datasets of annual NOx,NMVOCs and CO emissions from the transport sectorwere available:
1. Road transport at the urban centres, the nationaland secondary road network
2. Landing and take-off procedures (LTO) at all theairports
3. Railway transport4. Off-road vehicles and machineries (agriculture,
forestry, industry)5. Sea transport (passenger ships/ferries, cargo
ships, fishing ships, recreation activities’ vessels).
The emissions were spatially distributed in a gridhaving 20 km spatial resolution. This coarse grid, cov-ering only Greece, had common origin and the sameprojection with the fine grid of the present study. Theannual emissions of each 20 km ×20 km cell of thecoarse grid were evenly allocated to the corresponding10 km ×10 km cells of the fine grid. The emissionsfrom the road transport at the Greek urban centreswere assigned only to the 10 km resolution grid cellsat which the urban centres were located.
Road transport emissions of the EMEP databasefor the countries other than Greece were spatiallyreallocated in the 10 km resolution grid with the useof apportioning factors. Depending on the size of agiven EMEP grid cell (50×50 km2 or 150×150 km2)and on the population density of the urban centreslocated in it (less or greater than 500,000 inhabitants),a share of 35–80% of NOx , 70–95% of NMVOCsand 55–90% of CO road transport emissions of theEMEP cell were allocated to the urban centres. Theremaining share of the emissions was evenly distrib-uted to the 10 km grid cells that intersected with themain road network of the Balkan countries. The othermobile sources and machinery gridded emissions of theEMEP database for all continental and maritime areasof the study domain other than Greece were evenlydistributed to the corresponding 10 km grid cells.
4 Methodology Implemented for the TemporalDisintegration of Emissions
It is well known that the temporal variation ofemissions is very often only assumed with the aid ofinadequate data, since a vast amount of informationhas to be collected and elaborated (Tsilingiridis et al.2002; Palacios et al. 2001; Sturm et al. 1999). Weconverted annual to hourly emissions using seasonaland diurnal allocation profiles. No weekly emissionvariation was assumed. The source specific temporalprofiles used were based on the temporal profilessuggested by the EMEP/CORINAIR emission inven-tory guidebook and other studies or on common sensecriteria that were applicable to the study domain(Table 2). The developed inventory provided forevery month of the year 2000 typical diurnalvariations of the gridded anthropogenic NOx,NMVOCs and CO emissions.
5 Results–Discussion
5.1 Contribution to Total Emissions by Source Sector
The sectoral and total annual NOx, NMVOCs and COanthropogenic emissions in the study area are sum-marized in Table 3. In this table, the other mobilesources and machinery sector has been divided in twocategories in order emissions from the maritime
Water Air Soil Pollut (2007) 185:335–348 339

transport subsector to be presented separately, sincethey represent a significant share of the total annualNOx emissions.
The other mobile sources and machinery sector isthe major source of NOx emissions representing
45.9% of the annual total anthropogenic NOxemissions. It is worthwhile noticing that the maritimetransport subsector is responsible for 33.8% of theannual total NOx emissions. The road transport sectorcontribution is approximately 23.8%. The combustion
Table 3 Sectoral and total annual NOx, NMVOCs and CO anthropogenic emissions in the southern Balkan region
Emission source sector NOx (kt/year) NMVOCs (kt/year) CO (kt/year)
Combustion in energy and transformation industries 161.7 13.1 14.7Non-industrial combustion plants 63.4 71.0 687.7Combustion in manufacturing industry 93.7 5.9 89.9Production processes 61.8 79.9 68.7Extraction and distribution of fossil fuels and geothermal energy – 36.2 –Solvent and other product use – 125.6 –Road transport 299.3 331.3 1,535.8Other mobile sources and machinery (except of Maritime transport) 152.4 44.3 292.8Maritime transport 425.9 28.0 68.1Total 1,258.2 735.3 2,757.7
Table 2 Seasonal and diurnal profiles used for the temporal disaggregation of emissions
Emission source sector or subsector Seasonal profile-Parameter for temporaldisaggregation
Diurnal profile-Parameter for temporaldisaggregation
Combustion in energy and transformation industries(except district heating plants)
Constant values Constant values
Non-industrial combustion plants / District heating plants Heating degree-daysindicator
Constant working cyclefrom 7 A.M. to 10 P.M.
Combustion in manufacturing industry Constant values Constant valuesProduction processes Constant values
(EMEP/CORINAIR 2002)Constant values(EMEP/CORINAIR 2002)
Extraction and distribution of fossil fuels and geothermal energy Constant values Constant valuesSolvent and other product use Constant values Constant valuesRoad transport Constant values
(Symeonidis 2002)Traffic load(Symeonidis 2002)
Off-road vehicles and machineries (Greece) / Other mobile sourcesand machinery (all continental areas other than Greece)
Working cycle(EMEP/CORINAIR 2002)
Working cycle(EMEP/CORINAIR 2002)
Landing and take-off procedures (Greece) LTO activities by aircraftand flight type(Symeonidis 2002)
80% of the daily emissionsemitted from 6 A.M.
to 22 P.M.
Railway transport (Greece) Constant values(EMEP/CORINAIR 2002)
Working cycle(EMEP/CORINAIR 2002)
Passenger ships and ferries (Greece) Activities by ship type(Symeonidis 2002)
Constant values
Cargo ships / International shipping Constant values(EMEP/CORINAIR 2002)
Constant values(EMEP/CORINAIR 2002)
Fishing ships (Greece) Working cycle(EMEP/CORINAIR 2002)
Constant values
Recreation activities’ vessels (Greece) Activities by vessel type(Symeonidis 2002)
Working cycle(EMEP/CORINAIR 2002)
340 Water Air Soil Pollut (2007) 185:335–348

in energy and transformation industries sectoraccounts for 12.8% of the annual total NOx. Lessthan 10% is the contribution of each of the remainingsource categories. The sectoral contribution to theannual NOx emission totals in the southern Balkanregion is different than the European one. Accordingto the official data of the EMEP database for the year2000, the road transport sector is the major sourcesector that emits 34.6% of annual NOx emissions inEurope (Vestreng et al. 2006). The percentagecontribution of the other mobile sources and machin-ery sector is 28.5%, being 1.6 times less than thecorresponding contribution in the study area. Thepercentage contribution of the combustion in energyand transformation industries sector is 17.6% inEurope, comparable to the corresponding contributionin the southern Balkans.
Road transport has a 45% share in annual totalanthropogenic NMVOCs emissions. Solvent andother product use sector accounts for about 17% oftotal NMVOCs. The production processes, the othermobile sources and machinery (maritime transportincluded) and the non-industrial combustion plantssectors have comparable contribution each one repre-senting about 10% of NMVOCs emissions. Less than5% is the contributions of each of the remainingsource categories. In Europe, the road transport andthe solvent and other product use are the most
important source sectors emitting respectively 34.3%and 28% of the annual NMVOCs emission totals(Vestreng et al. 2006). However, in European scalethe contribution of the other mobile sources andmachinery sector is only 4.7%.
Within CO sources, road transport weighs heavilyaccounting for 55.7% of annual total CO emissions.Non-industrial combustion plants emit approximately25% of the total CO. Other mobile sources andmachinery (maritime transport included) representabout 13% of annual total CO emissions while lessthan 5% is the contribution of each of the remainingsource sectors. The corresponding percentages inEuropean scale for the year 2000 are comparable forthe road transport sector (53%) and for the non-industrial combustion plants (20%). However, theother mobile sources and machinery sector is respon-sible for only 5.2% of the European annual CO totalemissions (Vestreng et al. 2006).
5.2 Spatially Resolved Emission Inventory
The spatial distribution of the annual total anthropo-genic NOx emissions in the southern Balkans isillustrated in Fig. 2. NOx emissions have peaksmainly over the large power plants and the greaterareas of the large urban centres (primarily the binsfrom 1.0E+06 kg/year to 1.8E+07 kg/year represent
0 100 200 300 400 500 600 700 800 900 1000 1100
Distance (km)
0
100
200
300
400
500
600
700
800
900
1000
1100
Dis
tance (
km
)
NOx (kg/y)
1.0E+000 to 1.9E+005
1.9E+005 to 5.0E+005
5.0E+005 to 1.0E+006
1.0E+006 to 5.0E+006
5.0E+006 to 1.0E+007
1.0E+007 to 1.8E+007
Fig. 2 Spatial distributionof the annual total anthro-pogenic NOx emissions inthe southern Balkan region
Water Air Soil Pollut (2007) 185:335–348 341

these peaks). In Fig. 2, we point out NOx emissionsfrom national and international shipping activitiesover the maritime areas of central Greece wherePiraeus, the largest harbour of Greece, is located.NOx emissions from international navigation alongthe southern part of the study domain and throughBosporus also stand out. NMVOCs emissions havepeaks over the urban centres scattered throughout the
domain (Fig. 3). CO higher emissions correspond tothe greater areas of the large urban agglomerations(represented by the bins from 5.0E+06 kg/year to9.2E+07 kg/year) and to some major highways(Fig. 4).
The transport sector is the major source contributorto ozone precursors’ emissions in the southern Balkanregion. In addition to the presented contribution of the
0 100 200 300 400 500 600 700 800 900 1000 1100
Distance (km)
0
100
200
300
400
500
600
700
800
900
1000
1100
Dis
tanc
e (k
m) NMVOCs (kg/y)
1.0E+000 to 1.5E+005 1.5E+005 to 5.0E+005 5.0E+005 to 1.1E+006 1.1E+006 to 5.5E+006 5.5E+006 to 1.5E+007 1.5E+007 to 3.1E+007
Fig. 3 Spatial distributionof the annual total anthro-pogenic NMVOCs emis-sions in the southern Balkanregion
0 100 200 300 400 500 600 700 800 900 1000 1100
Distance (km)
0
100
200
300
400
500
600
700
800
900
1000
1100
Dis
tanc
e (k
m) CO (kg/y)
1.0E+000 to 2.5E+005 2.5E+005 to 5.0E+005 5.0E+005 to 1.0E+006 1.0E+006 to 5.0E+006 5.0E+006 to 8.3E+006 8.3E+006 to 4.0E+007 4.0E+007 to 9.2E+007
Fig. 4 Spatial distributionof the annual total anthro-pogenic CO emissions inthe southern Balkan region
342 Water Air Soil Pollut (2007) 185:335–348

0 100 200 300 400 500 600 700 800 900 1000 1100
Distance (km)
0
100
200
300
400
500
600
700
800
900
1000
1100
Dis
tanc
e (k
m)
Ratio of annual road transport to annual total NOx emissions
(%)
0 to 10 10 to 30 30 to 50 50 to 70 70 to 90 90 to 100
Fig. 5 Spatial distributionof the ratio of annual roadtransport to annual totalNOx emissions in Greece
0 100 200 300 400 500 600 700 800 900 1000 1100
Distance (km)
0
100
200
300
400
500
600
700
800
900
1000
1100
Dis
tanc
e (k
m)
(%)
0 to 10 10 to 30 30 to 50 50 to 70 70 to 90 90 to 100
Ratio of annual road transport to annual total NMVOCs emissions Fig. 6 Spatial distributionof the ratio of annual roadtransport to annual totalNMVOCs emissions inGreece
Water Air Soil Pollut (2007) 185:335–348 343

transport sector to the emission totals, it is alsoimportant to investigate how large the share of thetransport sector emissions over urban and non-urbanareas is. For this reason, the spatial distribution of theratio of annual road transport emissions to annualtotal emissions is presented for each pollutant. Theresults refer to Greece because only for Greece a verydetailed and spatially resolved transport sector emis-sion inventory was available. Although the roadtransport has an almost 25% contribution to theannual total NOx emissions in the study domain,
over most of the large urban centres of Greece itscontribution ranges from 50 to 70% (Fig. 5). Over allurban areas (both large and medium sized urbancentres), road transport represents more than 50% ofthe annual total NMVOCs emissions (Fig. 6). Thecontribution of road transport to total emissions inurban areas is even more pronounced for CO than forNOx and NMVOCs. Over all urban areas, roadtransport accounts for more than 70% of the annualtotal CO emissions (Fig. 7). Over the city centres ofAthens and Thessaloniki, which are the two largest
0 100 200 300 400 500 600 700 800 900 1000 1100
Distance (km)
0
100
200
300
400
500
600
700
800
900
1000
1100
Dis
tanc
e (k
m)
(%)
0 to 10 10 to 30 30 to 50 50 to 70 70 to 90 90 to 100
Ratio of annual road transport to annual total CO emissions Fig. 7 Spatial distributionof the ratio of annual roadtransport to annual total COemissions in Greece
NMVOCs
0
10
20
30
40
50
60
70
80
1 2 3 4 5 6 7 8 9 10 11 12
Months
Em
issio
ns (
ktn
/mo
nth
)
Fig. 9 Monthly anthropogenic NMVOCs emissions in thesouthern Balkan region
NOx
0
20
40
60
80
100
120
1 2 3 4 5 6 7 8 9 10 11 12
Months
Em
issio
ns (
ktn
/mo
nth
)
Fig. 8 Monthly anthropogenic NOx emissions in the southernBalkan region
344 Water Air Soil Pollut (2007) 185:335–348
Greek urban agglomerations, road transport is respon-sible for about 79, 65 and 95% of annual total NOx,NMVOCs and CO emissions respectively, in quitegood agreement with the results of emission inventorystudies for Athens and Thessaloniki (Economopoulouand Economopoulos 2002; Tsilingiridis et al. 2002).Along the road network at the periphery of Athensand Thessaloniki, road transport NMVOCs and COemissions represent a share of total emissions that ishigher than 50%. Over the greater part of the non-urban areas in Greece, road transport accounts for lessthan 10% up to 30% of the annual NOx, NMVOCs
and CO emissions. These areas are dominated by off-road vehicle emissions.
5.3 Temporally Resolved Emission Inventory
Figure 8 shows the seasonal variation of anthropo-genic NOx emissions in the study area. NOxemissions present only a small variation throughoutthe year. NOx emissions in winter months are of thesame magnitude with emissions in summer months.The reduction of NOx emissions during summerseason because of the elimination of the residentialheating emissions is compensated by the increase ofemissions from the other mobile sources and machin-eries, mainly the increase of emissions from themaritime sector which is the major NOx emissionsource sector in the study area.
The highest NMVOCs emissions occur in wintermonths (Fig. 9). The seasonal variation of NMVOCsemissions is driven by the seasonal variation ofemissions from the non-industrial combustion plantsand from the other mobile sources and machinerysector. Both sectors have almost equal contributionto the annual total NMVOCs emissions. However,NMVOCs are emitted by the heating plants onlyduring the heating months and emissions are maxi-mum during the winter season, while NMVOCs emis-sions from the other mobile sources and machinery
CO
0
50
100
150
200
250
300
350
400
1 2 3 4 5 6 7 8 9 10 11 12
Months
Em
iss
ion
s (
ktn
/mo
nth
)
Fig. 10 Monthly anthropogenic CO emissions in the southernBalkan region
6 12 18 24
Hours
200
600
1000
1400
1800
2200
2600
Em
issio
ns (
kg
r/h
)
Greater Athens AreaNOx
NMVOCs
CO
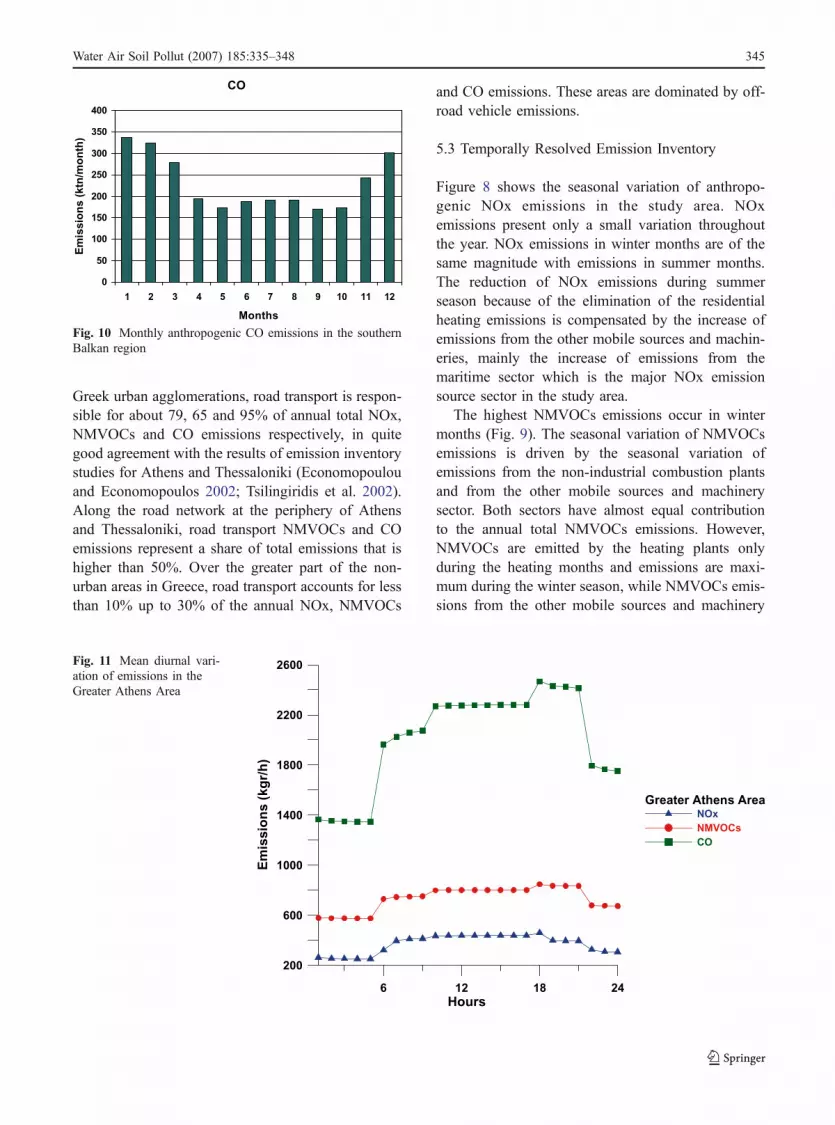
Fig. 11 Mean diurnal vari-ation of emissions in theGreater Athens Area
Water Air Soil Pollut (2007) 185:335–348 345

sector, being though more pronounced during summerseason, are emitted throughout the year.
CO emissions have a strong seasonal variation(Fig. 10). They are maximum in January and aredecreased by almost 50% in September. Approxi-mately 35% of annual CO emissions are emittedduring the winter months. This percentage is thelowest during the summer months (about 20%). COemissions seasonal variation is forced mainly by theseasonal variation of emissions from the residentialheating plants which are in operation from October toApril. As already discussed in Section 5.1, the non-industrial combustion plants source sector is thesecond most contributing sector to CO emissions inthe southern Balkan region.
The diurnal variation of emissions in a specificarea of the study domain is dependent on the type ofemission sources in this area. Two examples arepresented in Figs. 11 and 12. Figure 11 shows themean diurnal variation of emissions in the GreaterAthens Area determined mainly by the diurnalvariation of the heavy traffic load at the road networkwithin the densely urbanized agglomeration which ismore pronounced from 6 A.M. to 21 P.M. Figure 12depicts the mean diurnal variation of emissions in arural area of Greece. Thessaly Plain occupies thecentral part of mainland Greece (Fig. 1) and it is an
area characterised by intensive agricultural activities.The diurnal variation of emissions in this rural area isconfigured by the diurnal variation of the off-roadagricultural vehicles emissions and the road transportemissions. Pollutants emissions are maximum duringdaytime because of the agricultural activities that takeplace mainly from 6 A.M. to 18 P.M. and the traffic loadat the national and secondary road network thatcrosses Thessaly Plain which is more increased from8 A.M. to 22 P.M.
6 Conclusions
The main objective of the present study is thedevelopment of a spatially and temporally resolvedanthropogenic emission inventory of ozone precursorpollutants (NOx, NMVOCs and CO) in the southernBalkan region. Annual anthropogenic emission dataobtained from official national emission inventories(e.g. the transport sector emission inventory ofGreece) and from international emission databases(EMEP, CORINAIR) were spatially disaggregatedand allocated to a standard grid having 10 km spatialresolution. The spatial downscaling was performedwith the use of surrogate statistics, indexes and landuse information. Source specific temporal profiles
6 12 18 24
Hours
0
20
40
60
80
Em
issio
ns (
kg
r/h
)
Thessaly PlainNOx
NMVOCs
CO
Fig. 12 Mean diurnal vari-ation of emissions in theThessaly Plain
346 Water Air Soil Pollut (2007) 185:335–348

were used in order monthly and hourly emission datato be estimated.
The annual emission data suggest that the majorNOx emission sources are the other mobile sourcesand machinery and the road transport sectors. Mari-time transport is in particular the strongest NOxemission source. Road transport has a prominent rolein anthropogenic NMVOCs emissions followed bythe solvent and other product use sector. The mainCO emissions sources are the road transport sectorand the non-industrial combustion plants. The highestemission densities occur at the urban centres. NOxemissions have also peaks over the large power plants.NOx emissions from national and/or internationalshipping activities are higher at the maritime areas ofcentral Greece, along the southern part of the studydomain and through Bosporus. Maritime transport isan important emission source in the study domain thatrequires further research studies. The maritime areas ofthe southern Balkans connecting Europe, Asia andAfrica and the land morphology of the Balkancountries, characterized by long coastlines and numer-ous islands, allow intense shipping activities to takeplace that emit significant amounts of pollutants.
The temporal disaggregation of emissions showsthat monthly NOx emissions have a small variationthroughout the year while the highest NMVOCsemissions occur in winter months. CO emissionshave a strong seasonal variation configured mainly bythe seasonal variation of emissions from the residen-tial heating plants.
In the current work, emphasis was given in thestudy of the contribution of transport sector to totalemissions over urban and non-urban areas of Greece.Over almost all Greek urban areas, road transport isthe major NMVOCs and CO emission source, re-spectively representing more than 50% and 70% ofthe annual total NMVOCs and CO emissions. Roadtransport contribution to NOx emissions is greaterthan 50% at the large urban centres. The greater partof the non-urban areas in Greece is dominated by off-road vehicle emissions.
The presented inventory was created in order to actas a base for air quality modelling activities focusingon Greece. The inventory was used to support thestudy of the regional scale ozone formation overGreece that involved the implementation of the UrbanAirshed Model (UAM-V) (SAI 1999). The modelevaluation showed that there was a good agreement
between simulated and measured surface ozoneconcentrations and concluded that the model wascapable of reproducing the regional ozone levels overGreece (Poupkou et al. 2005). The satisfactory modelperformance suggests that the presented emissioninventory provides a reasonable description of thespatial distribution and temporal variation of ozoneprecursors’ emissions in the study area.
Acknowledgements The research study was financially sup-ported by the Greek Ministry of Education (research programPYTHAGORAS).
References
Aleksandropoulou, V., & Lazaridis, M. (2004). Spatial distri-bution of gaseous and particulate matter emissions inGreece. Water, Air, and Soil Pollution, 153, 15–34.
Carnevale, C., Gabusi, V., & Volta, M. (2006). POEM-PM: Anemission model for secondary pollution control scenarios.Environmental Modelling & Software, 21, 320–329.
Cirillo, M., De Lauretis, R., & Del Ciello, R. (1996). Reviewstudy on European urban emission inventories. EuropeanTopic Centre on Air Emissions, Copenhagen: EuropeanEnvironmental Agency. Retrieved from http://reports.eea.europa.eu/92-9167-075-8/en/TopicReportNo30-1996.pdf.
Dincer, F., & Elbir, T. (2007). Estimating national exhaustemissions from railway vehicles in Turkey. Science of theTotal Environment, 374, 127–134.
Dommen, J., Prevot, A. S. H., Baertsch-Ritter, N., Maffeis, G.,Longoni M. G., Gruebler, F. C., et al. (2003). High-resolution emission inventory of the Lombardy region:Development and comparison with measurements. Atmo-spheric Environment, 37, 4149–4161.
Economopoulou, A., & Economopoulos, A. (2002). Airpollution in Athens basin and health risk assessment.Environmental Monitoring and Assessment, 80, 277–299.
EEA (1997). CORINAIR 94 Inventory. European Topic Centreon Air Emissions, Topic report No 8/1997. Copenhagen:European Environmental Agency. Retrieved from http://reports.eea.europa.eu/92-9167-102-9/en/topic_8_1997.pdf.
Elbir, T., & Muezzinoglu, A. (2004). Estimation of emissionstrengths of primary air pollutants in the city of Izmir,Turkey. Atmospheric Environment, 38, 1851–1857.
Elbir, T., Muezzinoglu, A., & Bayram, A. (2000). Evaluation ofsome air pollution indicators in Turkey. EnvironmentInternational, 26, 5–10.
EMEP/CORINAIR (2002). Atmospheric emission inventoryguidebook, third edition, Copenhagen: European Environ-ment Agency. Retrieved from http://reports.eea.europa.eu/EMEPCORINAIR3/en/page002.html.
EMEP/MSC-W (2002). Emission data reported to UNECE/EMEP: Quality assurance and trend analysis & Presenta-tion of WebDab. MSC-W Status Report 2002, EMEP/MSC-W NOTE 1/2002. Retrieved from http://www.emep.int/publ/reports/2002/mscw_note_1_2002.pdf.
Water Air Soil Pollut (2007) 185:335–348 347

Francois, S., Grondin, E., Fayet, S., & Ponche, J.-L. (2005).The establishment of the atmospheric emission invento-ries of the ESCOMPTE program. Atmospheric Research,74, 5–35.
Friedrich, R., & Reis, S. (2004). Emissions of air pollutants.Measurements, calculations and uncertainties. ISBN 3-540-00840-3, Berlin: Springer.
Giannouli, M., Samaras, Z., Keller, M., deHaan, P., Kallivoda,M., Sorenson, S., et al. (2006). Development of databasesystem for the calculation of indicators of environmentalpressure caused by transport. Science of the TotalEnvironment, 357, 247–270.
IPEXODE (2001). Inventory of gaseous, liquid and solidwastes from industry. An emission inventory from thecentral heating. Report of the Hellenic Ministry for theEnvironment, Physical Planning and Public Works, ReportNo YP4-PETREFREP-AWS-01-01.
Katsoulis, D. B., & Whelpdale, D. M. (1990). Atmosphericsulphur and nitrogen budgets for Southeast Europe.Atmospheric Environment, 24A(12), 2959–2970.
Lalas, D. P. (2001). Climate change, emission inventory,national inventory for greenhouse and other gases forthe years 1990–1999. Technical Report of the NationalObservatory of Athens.
Lenhart, L., & Friedrich, R. (1995). European emission datawith high temporal and spatial resolution. Water, Air, andSoil Pollution, 85, 1897–1902.
Naik, V., Delire, C., & Wuebbles, D. J. (2004). Sensitivity ofglobal biogenic isoprenoid emissions to climate variabilityand atmospheric CO2. Journal of Geophysical Research,109, D06301, doi:10.1029/2003JD004236.
Palacios, M., Martin, F., & Cabal, H. (2001). Methodologies forestimation disaggregated anthropogenic emissions –application to a coastal Mediterranean region of Spain.Journal of the Air & Waste Management Association, 51,642–657.
Placet, M., Mann, C. O., Gilbert, R. O., & Niefer, M. J. (2000).Emissions of ozone precursors from stationary sources: Acritical review. Atmospheric Environment, 34, 2183–2204.
Ponche, J.-L., Schneider, C., & Mirabel, P. (2000). Methodol-ogy and results of the REKLIP atmospheric emissioninventory of the upper Rhine valley transborder region.Water, Air, and Soil Pollution, 124, 61–93.
Poupkou, A., Symeonidis, P., Lisaridis, I., Melas, D., Ziomas I.,Pouspourika, E., et al. (2005 September). Performance
evaluation of photochemical modeling over the EasternMediterranean. (Paper presented at the 1st ACCENTSymposium on the Changing Chemical Climate of theAtmosphere, Urbino, Italy).
SAI (1999). User’s guide to the variable-grid Urban AirshedModel (UAM-V). Systems Applications International Inc.,SYSAPP 99-95/27r3.
Simeonidis, P., Sanida, G., Ziomas, I., & Kourtidis, K. (1999).An estimation of the spatial and temporal distribution ofbiogenic non-methane hydrocarbon emissions in Greece.Atmospheric Environment, 33, 3791–3801.
Simpson, D., Winiwarter, W., Börjesson, G., Cinderby, S.,Ferreiro, A., Guenther, A., et al. (1999). Inventoryingemissions from nature in Europe. Journal of GeophysicalResearch, 104, 8113–8152.
Stern, D. I. (2005). Global sulfur emissions from 1850 to 2000.Chemosphere, 58, 163–175.
Sturm, P. J., Sudy, Ch., Almbauer, R. A., & Meinhart, J. (1999).Updated urban emission inventory with a high resolutionin time and space for the city of Graz. Science of the TotalEnvironment, 235, 111–118.
Symeonidis, P. (2002). Study of the atmospheric pollution andits sources with the use of a Geographical InformationSystem. Dissertation, Aristotle University of Thessaloniki.
Symeonidis, P., Ziomas, I., & Proyou, A. (2003). Emissions ofair pollutants from the road transport sector in Greece:Year to year variation and present situation. EnvironmentalTechnology, 24, 719–726.
Symeonidis, P., Ziomas, I., & Proyou, A. (2004). Developmentof an emission inventory system from transport in Greece.Environmental Modelling & Software, 19, 413–421.
Tsilingiridis, G., Zachariadis, T., & Samaras, Z. (2002). Spatialand temporal characteristics of air pollutant emissions inThessaloniki, Greece: Investigation of emission abatementmeasures. Science of the Total Environment, 300, 99–113.
Vestreng, V., Rigler, E., Adams, M., Kindbom, K., Pacyna,J. M., van der Gon, H. D.r, et al. (2006). Inventory Review2006; Emission Data reported to the LRTAP Conventionand NEC Directive. MSC-W Technical Report 1/06.Retrieved from http://www.emep.int/publ/reports/2006/emep_technical_1_2006.pdf.
Ziomas, I., Suppan, P., Rappengluck, B., Balis, D., Tzoumaka,P., Melas, D., et al. (1995). A contribution to the study ofphotochemical smog in the greater Athens area. Beitraegezur Physiologie Atmosphere, 68, 191–203.
348 Water Air Soil Pollut (2007) 185:335–348
Copyright © 2022 FDOKUMEN