
A spatial physiological model for p53 intracellular dynamics
35
* * hal-00726014, version 1 - 28 Aug 2012
Transcript of A spatial physiological model for p53 intracellular dynamics

A spatial physiological model for p53 intracellular
dynamics
Luna Dimitrioa,c,∗, Jean Clairambaulta, Roberto Natalinib
aINRIA Paris-Rocquencourt & UPMC, 4 Place Jussieu, F-75005 ParisbIAC-CNR & Via dei Taurini 19, I-00185 Rome, Italy
cSBAI Department, University Sapienza & Piazzale Aldo Moro 5, I-00185 Rome, Italy
Abstract
In this paper we design and analyse a physiologically based model representingthe accumulation of protein p53 in the nucleus after triggering of ATM by DNAdamage. The p53 protein is known to have a central role in the response of thecell to cytotoxic or radiotoxic insults resulting in DNA damage. A reasonablerequirement for a model describing intracellular signalling pathways is to takeinto account the basic feature of eukaryotic cells: the distinction between nucleusand cytoplasm. Our aim is to show, on a simple reaction network describingp53 dynamics, how this basic distinction provides a framework which is able toyield expected oscillatory dynamics without introducing either positive feedbacksor delays in the reactions. Furthermore we prove that oscillations appear only ifsome spatial constraints are respected, e.g. if the diusion coecients correspondto known biological values. Finally we analyse how the spatial features of a cellinuence the dynamic response of the p53 network to DNA damage, pointing outthat the protein oscillatory dynamics is indeed a response that is robust towardschanges with respect to cellular environments. Even if we change the cell shapeor its volume or better its ribosomal distribution, we observe that DNA damageyields sustained oscillations of p53.
Keywords: Mathematical Models, Cellular biology, Intracellular dynamics,Partial Dierential Equations, Signalling Pathways, p53
Submitted May 2012
∗Corresponding authorEmail addresses: [email protected] (Luna Dimitrio),
[email protected] (Jean Clairambault), [email protected] (RobertoNatalini)
Preprint submitted to Journal of Theoretical Biology August 22, 2012
hal-0
0726
014,
ver
sion
1 -
28 A
ug 2
012

1. Introduction
Protein p53 is a tumour suppressor and its synthesis is essential for healthycell survival. Indeed when damage to the DNA is detected, p53 blocks the cellcycle, triggers DNA repair processes or launches apoptosis of the cell. The proteinp53 acts primarily as a transcription factor, so that it needs to accumulate in thenucleus to start the processes mentioned above, thus indirectly determining thecell fate, survival or apoptosis.
Experimental observations on cell populations [1] and on single cells [2] pointedout an interesting aspect of p53 dynamics: its oscillatory behaviour. While inhealthy cells p53 concentration is low and at steady state, in damaged cells, wherep53 is activated, the protein concentration rises and undamped oscillations appear.There are two main issues about the oscillatory behaviour of p53. The rst oneis to understand the biological meaning of these oscillations, i.e. how oscillationsare linked to cell fate `decision' (towards life or death). The second issue is toidentify the physiological mechanisms driving the observed oscillations. Beforeunderstanding why oscillations occur, it is important to recognize the key featuresthat generate it and mathematical modelling can help to answer this question.Such an approach allows also the analysis of p53 alterations in disease (knowingthat p53 is mutated and ineective in about 50% of cancers) and it representsa challenge with possible therapeutic implications. The aim of this work is todesign and analyse a deterministic model for the evolution of the protein p53,that considers the spatial structure of the cell, in order to describe the proteinintracellular dynamics. A second goal is to exhibit both a stationary behaviour ofp53 intracellular concentrations in the absence of its triggering by DNA damage,and on the contrary sustained oscillations as soon as such damage is sensed by thecell.
The paper is organised as follows. In section 2, we recall biological facts aboutp53 and how they have been taken into account in the previous published models.In section 3 we present an Ordinary Dierential Equation (ODE) compartmentalmodel with two compartments, nucleus and cytoplasm, with exchanges betweenthem, that exhibits the prescribed oscillations. Section 4 contains the core of thiswork, namely a Partial Dierential Equation (PDE) model showing the desiredsustained oscillations in the presence of triggering by DNA damage. We nallydiscuss in sections 5 and 6 the main features of this model, its limitations, andpossible future extensions to include even more biological relevance.
2. Common knowledge about protein p53
2.1. Biological background
The p53 protein has a central role in cell survival. Therefore the network thatcontrols its concentration is rich and complex, so that modelling its dynamics
2
hal-0
0726
014,
ver
sion
1 -
28 A
ug 2
012

is a challenge to mathematicians. This protein regulates essential cellular path-ways, such as the ones controlling cell cycle arrest, DNA repair and apoptosis,and thereby it has a decision-making role for the cell, choosing between deathand survival, and such a `decision' must be strictly regulated by specialised cellsignalling pathways. In healthy cells, p53 concentration is kept low by the actionof several proteins. However after the DNA has been damaged, p53 undergoesmany post-translational modications and accumulates in the nucleus. The majorp53 negative regulator, Mdm2, inhibits p53 accumulation in two principal ways:by enhancing p53 degradation by acting as an enzyme (ubiquitin ligase) and bymarking p53 for degradation [3]; it also reduces p53 nuclear import by maskingits principal NLS (Nuclear Localisation Signal) [4]. Furthermore, Mdm2 interactswith p53 to inhibit its transcriptional activity [5, 6]. On the other hand, p53 ac-tivates Mdm2 transcription [7] so that Mdm2 and p53 together form a negativefeedback loop.
The p53 network can be activated by several independent pathways. Here wefocus on the case of DNA damage (such as caused by ionising radiation or cytotoxicdrug insults), where the activation of the network depends on two protein kinases:ATM and Chk2 [8, 9]. In particular, ATM responds to damaging agents thatproduce double strand breaks in DNA [10] and mediates phosphorylation eventslinked to DNA double strand breaks [11]. Finally ATM phosphorylates p53 atmultiple sites [12]. In response to these stimuli, within a few minutes, the proteinaccumulates in the cell nucleus [13]. The half-life of p53 rises signicantly becauseof post-translational modications, from twenty minutes [14], when for instance nodamage is sensed, to several hours, after detection of a cellular stress [15]. Severalworks demonstrate that p53 stabilisation is a consequence of Mdm2-p53 blockedinteraction. Indeed at least 11 post-translational modications of p53 have beenreported in response to DNA damage [8, 16]. On the one hand these modicationsallow the stabilisation of p53 in the nucleus, on the other hand they regulate p53transcriptional activity [16]. The activation of p53 is not fully controlled by anysingle phosphorylation site or protein [9] and the mechanisms that control p53nuclear accumulation have not yet been completely elucidated. See for example[17] for a review on p53 and Mdm2 cellular location.
2.2. Modelling background: mathematical models of p53 dynamics
Within the regulatory circuit of p53, the existence of a negative feedback be-tween p53 and Mdm2 has been clearly established [18]. The protein Mdm2 isthe major p53 antagonist: as mentioned above, it enhances p53 degradation [19],blocks its entry to the nucleus [4] and inhibits p53 transcriptional activity [6].Conversely, p53 activates Mdm2 transcription [7]. It has been shown that, in amodel design perspective, a negative feedback is necessary to obtain oscillations,but it is not sucient by itself [20]. However, the addition of a third variable to
3
hal-0
0726
014,
ver
sion
1 -
28 A
ug 2
012

the system produces oscillations, at least damped ones, as shown in [1]. This thirdvariable can represent the mRNA of one of the two proteins and serve the purposeof an underlying time delay. Sustained oscillations, as they have been observed inbiological experiments, can be obtained by using an explicit time delay, namely byexpliciting the dependence of protein production at time t upon its concentrationat t − τ for a xed delay τ , as proposed by Monk and Ma [21, 22]. Interestingthough these models may be, they are not awless with respect to physiologicalrealism: explicit delays are meant to globally account for translation and translo-cation processes, and an implicit delay, i.e. a third variable, stands for an abstractputative intermediate, that lacks physiologically based denition. An oscillatorybehaviour can also be reproduced by adding to the p53-Mdm2 negative loop apositive feedback, as proposed in [23, 24]. Biological evidence shows that p53 in-terferes with Mdm2 nuclear entry by inhibiting Mdm2 phosphorylation, which isneeded for its nuclear shuttling [25]. This negative control over Mdm2 is mediatedby several proteins, whose regulation is controlled by p53, but it does not dependdirectly on p53.
In another class of models, among which we will set the present work, theintroduction of a spatial component, as already pointed out in [26, 27], allows tond the oscillations with a system of simple biochemical reactions. In a rst articleSturrock et al. [27], replaced the explicit delay in the model proposed by Monkin [21] by the introduction of a spatial variable and showed that oscillations canbe achieved by considering the location of biological processes. More recently thesame authors, in [28], further detailed their spatial model, including both a nuclearmembrane, as already done in [29, 30], and the structure of cytosolic microtubules.The result of this work is a robust oscillator. The authors were indeed able toenlarge the range of parameters over which they obtain oscillations. However thevalues of physical parameters, such as diusion or permeability, over which theoscillatory behaviour is observed, correspond to those of macro-molecules whosemolecular weight is about 500 kDa [31], whereas p53 and Mdm2 molecular weightsare in fact about 50 kDa. It is also important to note that p53 exists as monomers,dimers and tetramers [32] and this takes its molecular weight to higher values.
In the present work, we do not consider a complicated biological network inorder to introduce a positive feedback. Neither do we use delays that would leavemodel details hidden to the understanding of the whole mechanism and wouldhinder its future physiological identication. We develop a model that takes intoaccount the intracellular spatial structure of the cell in the reconstruction of thedynamics of p53. This allows us to base our model only on well-established bio-logical hypotheses and to use realistic biophysical coecients, related to moleculediusion or nuclear membrane permeability. In particular, we consider, unlike [28],that transport of particles through the membrane can be unidirectional, as biology
4
hal-0
0726
014,
ver
sion
1 -
28 A
ug 2
012

teaches us. In this way we also emphasize the mechanisms of activation of p53linked to enhanced nuclear import and reduced nuclear export. Furthermore, theobserved `delays' due to transport or transcription can be explained using diu-sion or translocation, and molecular reactions can be physiologically located. Weobtain a model in which the behaviour of cell signalling mechanisms is strictlyrelated to the basic spatial distinction between nucleus and cytoplasm.
3. An ODE compartmental model
In this section we introduce the model we intend to analyse in this work. Wepresent it as a compartmental ODE system and we still do not consider the spatialcomponent, by assuming that the concentrations of proteins are homogeneous ineach compartment. The model involves two distinct states of p53, its primaryinhibitor Mdm2, and the mRNA of Mdm2 whose synthesis is promoted by p53.Every species of the model exists in a nuclear and in a cytoplasmic form. Ifnecessary, to avoid confusion between the two compartments, we denote by [·](n)
and [·](c), respectively, the nuclear and cytoplasmic concentration of each species.Protein p53 undergoes several conformational changes. In our model we representthe ubiquitination process, i.e. the enzymatic action of Mdm2 on p53 by whichp53 is marked for degradation. Even if ubiquitination is more complicated thanother enzymatic processes, we choose, for the sake of simplicity, to model it as aclassical enzymatic reaction. Thus, knowing the interactions of p53 and Mdm2,we can write the following:
[Mdm2] + [p53]kk−
[Complex]k1→ [p53U ] (1)
where p53U represents the ubiquitinated form of p53. Then, following the Lawof Mass Action and applying the Quasi Steady State Approximation [33, 34], theassociated dierential equation describing the chemical kinetics in (1) is given by:
d[p53]
dt= −k2[Mdm2]
[p53]
K1 + [p53], (2)
where K1 =k1 + k−
k, and k2[Mdm2] represents the maximum rate of the reaction.
The right term of equation (2) represents a loss of mass in our system since wesuppose that ubiquitinated p53 will be degraded by the proteasome. In order to bedetected by the proteasome, p53 actually needs to be ubiquitinated several times(see [5] and reference therein for a review on Mdm2-mediated p53 ubiquitination).We choose not to describe all the single ubiquitination steps, but rather a globalone, because we are not interested in describing how p53 exits the system, but
5
hal-0
0726
014,
ver
sion
1 -
28 A
ug 2
012

how it is activated. We also take into account the phosphorylation and dephos-phorylation process of p53. As explained in Section 2.1, a single conformationalchange cannot uniquely determine the activity of the p53 protein. Several post-translational transformations decide how p53 will be activated [16] and stabilised.Since p53 phosphorylation is particularly important for its regulation in responseto DNA damage [35], we represent only this transformation and we treat the phos-phorylated form of p53 as a generic `active' species. Furthermore, although we areaware of the fact that dierent kinases are activated and are able to phosphorylatep53 depending on the type of damage, we choose to model here only the ATMkinase, that is thus here meant to roughly represent a DNA damage sensor. Forthe sake of simplicity we treat ATM as parameter and consider simple enzymatickinetics. We consider the following reactions:
[ATM ] + [p53]k2k−2
[Complex]k3→ [p53p], (3)
[E] + [p53p]k4k−4
[Complex]k5→ [p53], (4)
where p53p is the phosphorylated form of p53, while [E] is a generic phosphatasethat removes a phosphate group from its substrate p53p. Again by the Law ofMass Action and the quasi Steady State Approximation we obtain the followingequations:
d[p53]
dt= kph
[p53p]
Kph + [p53p]− k3[ATM ]
[p53]
KATM + [p53], (5)
d[p53p]
dt= k3[ATM ]
[p53]
KATM + [p53]− kph
[p53p]
Kph + [p53p], (6)
where kph is the maximum velocity of the dephosphorylation process, Kph = k5+k−4
k4
and Katm = k3+k−2
k2. We assume that the phosphorylated form of p53, that is the
product of the reaction in equation (3), is unable to interact with Mdm2, so thatafter DNA damage, a pool of p53 is not subject to Mdm2 control and is activein the nucleus as a transcription factor. We then model protein transcriptionand translation: the mRNA of Mdm2 is produced in the nucleus at a constantrate but also in a p53-dependent manner. Since p53 is known to be active asa transcription factor when it is formed out of four sub-units, we represent, asis classical in modelling cooperative processes [36], this reaction by using a Hillfunction with coecient 4:
d[Mdm2RNA]
dt= kSm + kSp
([p53p])4
([p53p])4 +K4Sp
, (7)
6
hal-0
0726
014,
ver
sion
1 -
28 A
ug 2
012

these reactions being located only in the nucleus. The mRNA of Mdm2 is thentranslated in the cytoplasm by the ribosomes, located only in the cytoplasm. Weassume a constant production rate for the synthesis of p53 in the cytoplasmiccompartment. Indeed, we do not have any biological evidence about changesof p53 transcription after a cell damage and therefore we choose not to representexplicitly its mRNA. Based on our assumptions we obtain the following dierentialequation system for the activity of the coupled oscillator p53-Mdm2 in the nucleus:
d[p53](n)
dt= kph
[p53p](n)
Kph + [p53p](n)− k1[Mdm2](n) [p53](n)
K1 + [p53](n)− k3[ATM ][p53](n)
KATM + [p53](n)
−ρpVr([p53](n) − [p53](c)),
d[Mdm2](n)
dt= −δm[Mdm2](n) − ρmVr([Mdm2](n) − [Mdm2](c)),
d[Mdm2RNA](n)
dt= kSm + kSp
([p53p](n))h
([p53p](n))h +KhSp
− δr[Mdm2RNA](n)
−ρrVr[Mdm2RNA](n),
d[p53p](n)
dt= ρqVr[p53p]
(c) +k3[ATM ][p53](n)
KATM + [p53](n)− kph
[p53p](n)
Kph + [p53p](n),
(8)and the following one in the cytoplasm:
d[p53](c)
dt= kS + kph
[p53p](c)
Kph + [p53p](c)− k1[Mdm2]
[p53](c)
K1 + [p53](c)
−k3[ATM ][p53](c)
KATM + [p53](c)− ρp([p53](c) − [p53](n))− δp[p53](c),
d[Mdm2]
dt= ktm[Mdm2RNA](c) − ρm([Mdm2](c) − [Mdm2](n))− δm[Mdm2](c),
d[Mdm2RNA](c)
dt= ρr[Mdm2RNA](n) − ktm[Mdm2RNA](c)
−δr[Mdm2RNA](c),
d[p53p](c)
dt= k3[ATM ]
[p53](c)
KATM + [p53](c)− kph
[p53p](c)
Kph + [p53p](c)− ρq[p53(c)
p ].
(9)Note that we denoted by h the exponent of the Hill term in the equation for[Mdm2RNA](n). Here we include degradation terms as linear functions of each pro-tein concentration. Since it has been proved that p53 degradation occurs mainlyin the cytoplasm [4], we add, besides the ubiquitination term, a classical degra-dation term for p53, in the cytoplasm. Nuclear p53 also undergoes degradation([37, 38]), but in normal growth conditions this is not the preferential way chosenby the cell [19]. Phosphorylated p53 poorly interacts with Mdm2 and it is thusnot marked for degradation by Mdm2. We assume that it will not be degraded at
7
hal-0
0726
014,
ver
sion
1 -
28 A
ug 2
012

all and do not consider any degradation term. Following Ciliberto et al. in [24],we model the exchanges between compartments as a linear contribution of a dif-ference between averaged nuclear and cytoplasmic concentrations and we multiplythe nuclear ux by Vr, a nondimensional quantity representing the volume ratiobetween cytoplasm and nucleus. This choice will be also supported by further dis-cussion in Section 4. It is known that p53 and Mdm2 can shuttle between nucleusand cytoplasm [4, 7]. On the contrary nuclear export of phosphorylated p53, thatrepresents active p53, is inhibited after DNA damage [39, 40]. Therefore, basingour modelling hypotheses on these biological observations, we assume here thatp53 and Mdm2 can traverse the dierent compartments. The phosphorylated formof p53 is assumed to move from cytoplasm to nucleus but not backwards. On thecontrary, we assume that the mRNA of Mdm2 only moves from the nucleus, whereit is transcribed, to the cytoplasm, where it is translated.
3.1. Sustained Oscillations appear in the ODE model.
In this section we begin the study of our model in the compartmental settingin order to capture the temporal dynamics of the system [41]. To simplify our no-tations, let us set p = [p53], m = [Mdm2], r = [Mdm2RNA] and q = [p53P ]. In thesequel we denote the nuclear and cytoplasmic concentrations by the superscripts(n) and (c). Finally the autonomous dierential system resulting from the modelpresented in Section 3 may be written as:
dp(n)
dt= −k1m
(n) p(n)
(Km1+p(n))− k3ATM
p(n)
(Katm+p(n))+ kph
q(n)
(Kph+q(n))
−Vrρp(p(n) − p(c)),dm(n)
dt= −Vrρm(m(n) −m(c))− δmm(n),
dr(n)
dt= kSm + kSp(
q(n)h
(KhSp+q(n)h)
)− Vrρrr(n) − δrr(n),
dq(n)
dt= k3ATM
p(n)
(Katm+p(n))− kph q(n)
(Kph+q(n))+ Vrρqq
(c),dp(c)
dt= kS − k1m
(c) p(c)
(Km1+p(c))− k3ATM
p(c)
(Katm+p(c))+ kph
q(c)
(Kph+q(c))
+ρp(p(n) − p(c))− δpp(c),
dm(c)
dt= ktmr
(c) + ρm(m(n) −m(c))− δmm,dr(c)
dt= −ktmr(c) + ρrr
(n) − δrr(c),dq(c)
dt= k3ATM
p(c)
(Katm+p(c))− kph q(c)
(Kph+q(c))− ρqq(c).
(10)Here the rst four equations represent the nuclear concentrations and the othersthe cytoplasmic ones.
First of all we nondimensionalise the system by writing
p(τ) = p(t)αp, . . . , q(τ) = q(t)
αq
τ = tt?
8
hal-0
0726
014,
ver
sion
1 -
28 A
ug 2
012

where the αs are concentrations of the `s' species, s = p,m, r, q (expressed in µM),and t? is a time constant, expressed in minutes. We xed αp = αq as p53 referenceconcentrations and αm = αr as Mdm2 reference concentrations. Then we choseαp = Katm, t
∗ = 1k3
and αm =kSp
k3. Thus the nondimensional system depends on
less parameters than the dimensional one. Namely it does not depend on Katm, k3
and kSp, while retaining all of its geometry. The nondimensional can be writtenas follows:
dp(n)
dτ= −kubm(n) p(n)
(Kub + p(n))− ATM p(n)
(1 + p(n))+ kph
q(n)
(Kph + q(n))
−Vrρp(p(n) − p(c)),
dm(n)
dτ= −Vrρm(m(n) − m(c))− δmm(n),
dr(n)
dτ= kSm +
q(n)h
(KhSp + q(n)h)
− Vrρrr(n) − δrr(n),
dq(n)
dτ= ATM
p(n)
(1 + p(n))− kph
q(n)
(Kph + q(n))+ Vrρq q
(c),
dp(c)
dτ= kS − kubm(c) p(c)
(Kub + p(c))− ATM p(c)
(1 + p(c))+ kph
q
(Kph + q)
+ρp(p(n) − p(c))− δpp(c),
dm(c)
dτ= ktmr
(c) + ρm(m(n) − m(c))− δmm(c),
dr(c)2
dτ= −ktmr(c) + ρrr
(n) − δrr(c),
dq(c)
dτ= ATM
p(c)
(1 + p(c))− kph
q(c)
(Kph + q(c))− ρq q(c).
(11)
Here we set: kub := t?k4αm
αp, Kub := Km1
αp, ATM := ATM
αp, kph :=
kpht?
αp, Kph :=
Kph
αp,
kSm = t?kSm
αm, KSp :=
KSp
αp, ktp := t?ktp
α0, kS := t?kS. Then ρs = t?ρs and δs = t?δs
for s = p,m, r, q. We performed simulations of this system, using the values ofthe parameters on column 3 of Table 1. Those values have been obtained bynumerical data tting, starting from values found in the biological or modellingliterature on p53. Next we found for each parameter a range of values for which theoscillations are present. To do this, we xed all the parameters, except for one thatwe varied, to assess the response of the system. These ranges correspond in orderof magnitude to the corresponding parameters of many other models [24, 42, 43].
In Figure 1(a) we represent the temporal evolution of nuclear concentrationsof phosphorylated p53 and Mdm2 (respectively q(n) and m(n)). We can observesustained oscillations of their concentrations. On 1(b) we show the phase planerelative to the same simulation where we can observe the corresponding limit cycle
9
hal-0
0726
014,
ver
sion
1 -
28 A
ug 2
012
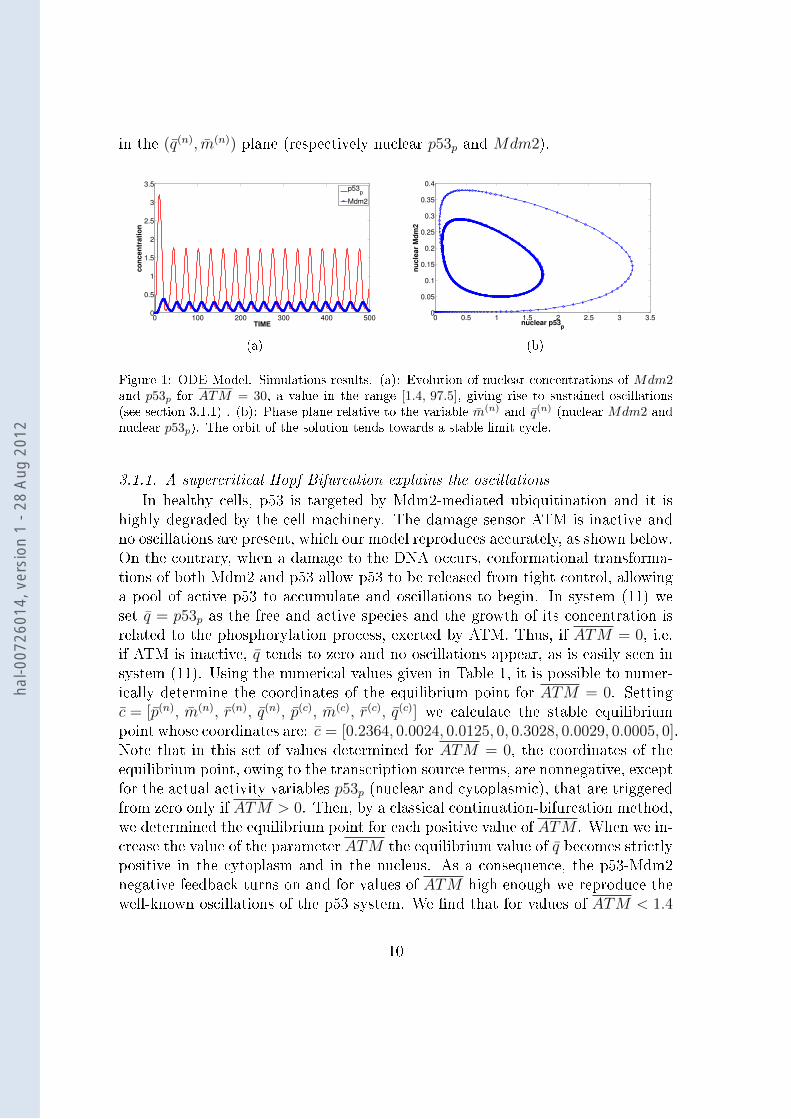
in the (q(n), m(n)) plane (respectively nuclear p53p and Mdm2).
0 100 200 300 400 5000
0.5
1
1.5
2
2.5
3
3.5
TIME
concentration
p53p
Mdm2
(a)
0 0.5 1 1.5 2 2.5 3 3.50
0.05
0.1
0.15
0.2
0.25
0.3
0.35
0.4
nuclear p53p
nu
cle
ar
Md
m2
(b)
Figure 1: ODE Model. Simulations results. (a): Evolution of nuclear concentrations of Mdm2and p53p for ATM = 30, a value in the range [1.4, 97.5], giving rise to sustained oscillations(see section 3.1.1) . (b): Phase plane relative to the variable m(n) and q(n) (nuclear Mdm2 andnuclear p53p). The orbit of the solution tends towards a stable limit cycle.
3.1.1. A supercritical Hopf Bifurcation explains the oscillations
In healthy cells, p53 is targeted by Mdm2-mediated ubiquitination and it ishighly degraded by the cell machinery. The damage sensor ATM is inactive andno oscillations are present, which our model reproduces accurately, as shown below.On the contrary, when a damage to the DNA occurs, conformational transforma-tions of both Mdm2 and p53 allow p53 to be released from tight control, allowinga pool of active p53 to accumulate and oscillations to begin. In system (11) weset q = p53p as the free and active species and the growth of its concentration isrelated to the phosphorylation process, exerted by ATM. Thus, if ATM = 0, i.e.if ATM is inactive, q tends to zero and no oscillations appear, as is easily seen insystem (11). Using the numerical values given in Table 1, it is possible to numer-ically determine the coordinates of the equilibrium point for ATM = 0. Settingc = [p(n), m(n), r(n), q(n), p(c), m(c), r(c), q(c)] we calculate the stable equilibriumpoint whose coordinates are: c = [0.2364, 0.0024, 0.0125, 0, 0.3028, 0.0029, 0.0005, 0].Note that in this set of values determined for ATM = 0, the coordinates of theequilibrium point, owing to the transcription source terms, are nonnegative, exceptfor the actual activity variables p53p (nuclear and cytoplasmic), that are triggeredfrom zero only if ATM > 0. Then, by a classical continuation-bifurcation method,we determined the equilibrium point for each positive value of ATM . When we in-crease the value of the parameter ATM the equilibrium value of q becomes strictlypositive in the cytoplasm and in the nucleus. As a consequence, the p53-Mdm2negative feedback turns on and for values of ATM high enough we reproduce thewell-known oscillations of the p53 system. We nd that for values of ATM < 1.4
10
hal-0
0726
014,
ver
sion
1 -
28 A
ug 2
012

0 20 40 60 80 1000
0.5
1
1.5
2
2.5
ATM
concentration
(a) Bifurcation diagram of q(n)
0 20 40 60 80 1000
0.1
0.2
0.3
0.4
0.5
ATM
concentration
(b) Bifurcation diagram of m(n)
Figure 2: Bifurcation diagrams (ODE system) for nuclear p53p and nuclear Mdm2. The equi-librium of the system is stable for values of ATM lower than a threshold (ATM ∼ 1.4), thena supercritical Hopf bifurcations occurring, it becomes unstable and a limit cycle appears. Thedotted curve represents the branch with unstable equilibrium and the + marked curves repre-sent the minimum and maximum values of the oscillations. When ATM becomes higher thenat a second threshold the equilibrium becomes stable again through a second supercritical Hopfbifurcation (ATM ∼ 97.5).
and ATM > 97.5, the corresponding equilibrium points of system (11) are stablesince all the eigenvalues of the linearized system are strictly negative [44]. AtATM ∼ 1.4 and ATM ∼ 97.5 two supercritical Hopf bifurcations occur. In-deed, all the hypotheses necessary to apply the Hopf Theorem are satised [45](which we did verify by numerical simulations, data not shown) and a supercriti-cal Hopf bifurcation actually occurs. More technical details about the bifurcationanalysis of this ODE system, will be given in a future work. For all values ofATM ∈ [1.4, 97.5], the equilibrium point of system (11) is unstable and a stablelimit cycle exist, towards which the solution of the system tends. Thus the systemoscillates and reproduces the observed biological behaviour. As proposed in [22],our results can be interpreted as follows. If the damage is too low, the cell doesnot need to activate the p53 pathway in order to repair. When the damage is highenough, the p53 pathway needs to be launched and the oscillations begin. On thecontrary, if the damage is too big, the cell does not start repair processes, butdirectly launches apoptosis. Figure 2 presents the bifurcation diagram of q(n) andm(n). The dotted curves represent the value of the unstable equilibrium for eachof the variables. The +-marked curves represent the oscillation amplitude that, aswe can observe, varies slightly. The period of oscillations varies between 25 and33 min for values of ATM ∈ [1.4, 97.5] (results not shown). This observation isconsistent with biological experiments showing that the amplitude of oscillationsvaries with growing damage level, while the period is more stable when the dam-age level varies [46]. The characteristic period of these numerical simulations isshorter than the experimental one (∼ 4 − 5h [46]). However, the exact valuesof the parameters in Table 1 are not easy to be determined physiologically, and
11
hal-0
0726
014,
ver
sion
1 -
28 A
ug 2
012

Param. Description Chosen Value Units Ranges for osc.
kph Dephosphorylation rate 0.1 µM/min 0.039 ≤ kph ≤ 1.73
Kph Michaelis dephosporylation constant 0.05 µM 0.0001 ≤ Kph ≤ 2.2
k1 Ubiquitination rate 100 min−1 30.5 ≤ k1 ≤ 4180
K1 Michaelis ubiquination constant 1.01 µM 0.023 ≤ K1 ≤ 3.3
k3 Phosphorylation velocity 1 min−1 xed
Katm Michaelis phosphorylation constant 0.1 µM xed
δm Mdm2 degradation rate 0.16 min−1 0.03 ≤ δm ≤ 0.45
kSm basal Mdm2 mRNA transcription rate 0.005 µM/min 0 ≤ kSm ≤ 0.19
kSp p53-dependent Mdm2 mRNA transcription rate 1 min−1 xed
KSp Michaelis p53-dependent Mdm2 mRNA transcription 0.1 µM 0.06 ≤ KSp ≤ 0.9
h Hill coecient 4 adim h ≥ 2
δr Mdm2 mRNA degradation rate 0.0001 min−1 0 ≤ δmRNA ≤ 0.41
kS p53 synthesis rate 0.015 µM/min 0.001 ≤ kS ≤ 0.02
δp p53 degradation rate 0.2 min−1 0 ≤ δp53 ≤ 23
ktm Mdm2 translation rate 1 min−1 ∀ktm ≥ 0.02
Vr Volume ratio 10 adim 0.8 ≤ Vr ≤ 24.2
ρp p53 permeability 0.083 min−1 ρp ≥ 0
ρm Mdm2 permeability 0.04 min−1 ρm > 0
ρr Mdm2 mRNA permeability 0.083 min−1 ρr > 0
ρq p53p permeability 0.083 min−1 ρq > 0.01
Table 1: Parameter values for system (10). Starting from values taken from [42, 43] and [24]we numerically obtained by data tting, a complete set of parameter values that are used inthe sequel for the simulations. Keeping all but one of these parameters xed at these referencevalues, and varying the last one, we also calculated ranges of parameters (in projection on eachparameter axis) for which sustained oscillations take place. Note that the parameters k3, Katm
and kSp are presented in this table as xed because they have been xed to constant values bythe change of variables occurring in the nondimensionalisation process (see text in Section 3.1).
we will perform such physiological interpretation only in the PDE case with theintroduction of space. We will indeed show in the next Sections how we can obtainmore realistic periods in our model. From this preliminary study of the ODE com-partmental model, we veried, in a simplied setting, that the system proposedreproduces the expected behaviour, with no need of any articial mechanism. Inthe next sections we analyse the behaviour of the system in a spatial setting andwe study its stability under spatial perturbations.
4. Adding the spatial variable: the PDE case
In this section we complete the setting of our model, introducing a spatialvariable.
12
hal-0
0726
014,
ver
sion
1 -
28 A
ug 2
012

4.1. Mathematical formulation of the model in the 2-dimensional case
Ω1
Ω2
Γ12
Γ3
Figure 3: Domain of the PDE system: we represent the two dierent compartments, Ω1 for thenucleus and Ω2 for the cytoplasm. Γ12 is the common boundary between the two compartments;Γ3 is the exterior boundary, representing the cellular membrane.
We cast our system in a 2-dimensional domain divided into a nuclear and acytoplasmic compartment as shown in Figure 3. We set Ω as the entire domain ofthe cell and we dene Ω1 as the nuclear compartment and Ω2 as the cytoplasmicone. We set Γ12 := ∂Ω1 ∩ ∂Ω2 for the common boundary and Γ3 := ∂Ω \ Γ12.Each species is a function of time t and position x = (x, y); we suppose thateach species is able to diuse in the cytoplasm and in the nucleus. We includepermeability conditions at the common boundary Γ12 that take into account thenuclear membrane. As for the ODE case, we nondimensionalise the system. Setting
p(ξ, η, τ) = p(x,y,t)αp
, . . . , q(τ) = q(x,y,t)αq
,
τ = tt?, ξ = x
L, η = y
L,
where L, expressed in µm, is some 1-dimensional space parameter related to cellsize, we obtain in Ω1:
∂p∂τ
= Dp∆p− kubm p(Kub+p)
− ATM p(1+p)
+ kphq
(Kph+q),
∂m∂τ
= Dm∆m− δmm,∂r∂τ
= Dr∆r + kSm + qh
(KhSp+qh)
− δrr,∂q∂τ
= Dq∆q + ATM p(1+p)
− kph q(Kph+q)
,
(12)
and in Ω2:∂p∂τ
= Dp∆p+ kS − kubm p(Kub+p)
− ATM p(1+p)
+ kphq
(Kph+q)− δpp,
∂m∂τ
= Dm∆m+ ktmr − δmm,∂r∂τ
= Dr∆r − ktmr − δrr,∂q∂τ
= Dq∆q + ATM p(1+p)
− kph q(Kph+q)
,
(13)
13
hal-0
0726
014,
ver
sion
1 -
28 A
ug 2
012

where we used the same notations as in section 3.1. Notice that, as in [29], we usedFick's Law to model the diusion of each species concentration. We dened Ds =t?Ds
L2 , i = 0, . . . , 3, as the nondimensional diusion coecients, where Ds is thedimensional diusion parameter of the `s' species, expressed in µm2/min. Finally,following [29] and [30], and consistently with the assumptions of the ODE model,we x Kedem-Katchalsky [47] boundary conditions at the common boundary Γ12
for the species that cross the nuclear membrane from both sides:∂pn
∂n= ρp
Dp(pc − pn) = ∂pc
∂non Γ12,
∂mn
∂n= ρm
Dm(mc − mn) = ∂mc
∂non Γ12,
(14)
meaning that the ux of each species through the nuclear envelope is proportionalto the dierence between the concentrations at the two sides of the membrane.Notice that the normal vector n is pointing outwards from the nucleus and thatuxes are continuous. We x the following boundary conditions for r and q:
∂rn
∂n= ρr
Dr(−rn) = ∂rc
∂non Γ12,
∂qn
∂n= ρq
Dqqc = ∂qc
∂non Γ12,
(15)
that include the directionality of transport: r, the mRNA of Mdm2, is only able toexit the nucleus, while q, phosphorylated p53, traverses the nuclear membrane onlytowards the nucleus. Again notice that the uxes are continuous. The constants ρsare the permeability coecients relative to each species and are expressed, in thedimensional model, in µm/min. We also assume that proteins are not able to exitthe cell and we use Neumann homogeneous boundary conditions on Γ3 (zero-ux)for all species:
∂s
∂n= 0 on Γ3, s = p,m, r, q. (16)
Since nuclear pores are homogeneously distributed on the nuclear envelope andfar from saturation [30], the choice of Kedem-Katchalsky boundary conditions,to model membrane permeability [47], is consistent with our environment; see[29] and references therein for more details on Kedem-Katchalsky conditions inthe case of the nuclear membrane. We emphasize here that the choice of theboundary condition is coherent with the choice of the ODE model, where we xedan exchange rule between compartments as the linear contribution of the dierenceof the mean concentrations in each compartment. Let us consider a simpliedsystem for one generic species s that can only diuse in the domain Ω:
∂s(n)
∂t= Dn∆s(n) in Ω1,
∂s(c)
∂t= Dc∆s
(c) in Ω2,(17)
14
hal-0
0726
014,
ver
sion
1 -
28 A
ug 2
012

and let us couple this system by using the boundary conditions:
Dn∂s(n)
∂n= ρ(s(c) − s(n)) = Dc
∂s(c)
∂non Γ12, (18)
closed by the continuity of the ux: Dn∂s(n)
∂n= Dc
∂s(c)
∂n. Here again the normal
vector n is the same on both sides. If we integrate over the whole region andapply Green's formula, we obtain:
ds(n)
dt= ρ|Ω1|
∫Γ12
(s(c) − s(n))dσ,ds(c)
dt= ρ|Ω2|
∫Γ12
(s(n) − s(c))dσ,(19)
thus reducing the initial system (17) to system (19) above, in agreement withequations:
ds(n)
dt= ρVr(s
(c) − s(n)),ds(c)
dt= ρ(s(n) − s(c)), (20)
which corresponds to our choices in the ODE model.
4.2. Spatial parameters
In this new setting, the number of parameters of the system has increased.Diusion and permeability coecients need to be set accordingly to the biophysicalknowledge of the cellular environment and molecular species. Since, according to[29], the diusion coecient of a general protein with a mass of about 40kDa isroughly 600µm2/min, we take this value as a reference for all the protein species,p53 and Mdm2, in the nucleus and in the cytoplasm. Using single molecule trackingand statistical analysis, recent works managed to calculate the mRNA diusioncoecient [48, 49, 50] and found that the coecient of a single mRNA particle is∼ 6− 30µm2/min, i.e., the ratio between mRNA and protein diusion coecientsis about 1 : 100. Concerning the permeability coecient, we supposed, to tie inwith this diusion coecient ratio, that the ratio between the mRNA and theprotein permeability coecient is 1 : 100. In the sequel, all the simulations will bedone for values of parameters listed in Table 2.
4.3. Simulations results in a 1-dimensional domain
We begin the study of the system in a simplied 1-dimensional domain, plottedin Figure 4. This domain is given by two adjoining segments that represent thecytoplasmic and nuclear compartments. We x an interval [a, c] = [0 , 10] (in µm),[a, c] = [a, b]∪ [b, c], with [a, b] = [0 , 9] the cytoplasmic compartment, and [b, c] =[9 , 10] the nucleus, as shown in Figure 4. We performed all simulations using nitedierences schemes and we used a basic IMEX numerical scheme. For furtherdetails see [52]. Even if the geometry is oversimplied, there is a striking dierence
15
hal-0
0726
014,
ver
sion
1 -
28 A
ug 2
012

Parameter Description Value Reference
Dp p53 Diusion coecient 600µm2/min [29, 51]Dm Mdm2 Diusion coecient 600µm2/min [29]Dr Mdm2 mRNA Diusion coecient 6µm2/min [48, 49]Dq p53P Diusion coecient 600µm2/min [29, 51]ρp p53 permeability coecient 10µm/min obtainedρm Mdm2 permeability coecient 10µm/min obtainedρr Mdm2 mRNA permeability coecient 0.1µm/min obtainedρq p53p permeability coecient 10µm/min obtained
Table 2: Parameter values for the 1-dimensional and 2-dimensional model. The permeabilitycoecients are obtained by numerical data tting. A more accurate description of the choice ofthe permeability parameter is done in section 4.4.2.
a b c
2Ω Ω1
Figure 4: A 1-dimensional simplied domain of the cell.
with with the ODE case. The protein ux from one compartment to the other isnot given, as in the ODE case, by an average of the total concentration over thewhole compartment, but by the protein concentration that actually exists at themembrane location. In order to test whether the system reproduces the oscillatorybehaviour observed in the ODE case, rst we analyse it by following the variationsof the ATM parameter. As explained above, this parameter is meant to representthe DNA damage and it is the switch that turns on the system, giving rise torobust oscillations. In the sequel we x a time duration of 500 min to comparethe results for dierent values of the parameters. We observed, see Figure 5(a),that for values of ATM < 2, rst the system tends towards a stable equilibrium,then starts to produce damped oscillations (Figures 5(c) and 5(e)). Oscillationsbecome undamped and their amplitude rises when ATM > 2, see Figures 5(d),5(f). As for the ODE case, oscillations disappear again for values of ATM higherthan a second threshold (∼ 45). It is known from in vitro observations [2, 46] thatthe period of oscillations is stable over dierent irradiation doses and consequentdamages. The same behaviour may be observed on our simulation results thatshow that once the undamped oscillations occur, the period varies between 26 and40 minutes. See Figure 5(b) where we plotted the number of peaks of the sustainedoscillations observed in 500 min, against ATM variations.
16
hal-0
0726
014,
ver
sion
1 -
28 A
ug 2
012

0 10 20 30 40 500
0.2
0.4
0.6
0.8
1
1.2
1.4
1.6
ATM
concentration
(a) amplitude of oscillations of q(n)
0 5 10 15 20 25 30 35 40 450
5
10
15
20
ATM
nu
mb
er
of
pe
ak
s
(b) Number of observed peaks in 500 min
0 50 100 150 200 250 300 350 400 450 5000
0.1
0.2
0.3
0.4
0.5
0.6
0.7
0.8
0.9
TIME (min)
co
nc
en
trati
on
(c) Nuclear p53 over time, ATM = 1.5
0 50 100 150 200 250 300 350 400 450 5000
0.2
0.4
0.6
0.8
1
1.2
1.4
TIME (min)
co
nc
en
trati
on
(d) Nuclear p53 over time, ATM = 3
0 50 100 150 200 250 300 350 400 450 5000
0.005
0.01
0.015
0.02
0.025
0.03
0.035
0.04
0.045
TIME (min)
co
ncen
trati
on
(e) Nuclear Mdm2 over time, ATM = 1.5
0 50 100 150 200 250 300 350 400 450 5000
0.02
0.04
0.06
0.08
0.1
0.12
0.14
TIME (min)
co
ncen
trati
on
(f) Nuclear Mdm2 over time, ATM = 3
Figure 5: 1-dimensional PDE model. (a): amplitude of oscillations of q(n) as a function of ATM .(b): Number of sustained oscillations peaks observed in a xed duration of 500 minutes. Oscil-lations in the 1-dimensional case: (c),(d) evolution of p53 concentration, nuclear compartment.(e), (f): evolution of Mdm2 concentration, nuclear compartment. Undamped oscillations occuronly for value of ATM > 2 (ATM = 0.2).
4.3.1. The response of the system is robust upon changes of the diusion coe-
cients.
Once the oscillatory regime is established, we can vary the spatial parame-ters, namely diusion and permeability, to understand how the system respondsto spatial perturbations. In Section 4.2 we pointed out that the physiological ratiobetween protein and mRNA diusion is about 100:1. Keeping this ratio xed, we
17
hal-0
0726
014,
ver
sion
1 -
28 A
ug 2
012

0 200 400 600 800 1000 12000
1
2
3
4
5
DIFFUSION COEFF (µm2/min)
co
ncen
trati
on
(a)
0 200 400 600 800 1000 12000
5
10
15
DIFFUSION COEFF (µm2/min)
nu
mb
er
of
peaks
(b)
0 100 200 300 400 5000
1
2
3
4
5
6
7
8
TIME
concentration
DIFF=1200
DIFF=50
(c)
Figure 6: Oscillations in the 1-dimensional PDE case. If the ratio between protein to mRNAdiusion is kept 100:1, varying the diusion coecient does not compromise the oscillatorybehaviour of the system. (a): amplitude of oscillations of q(n) over the diusion coecients. (b):Number of peaks of the sustained oscillations during 500 min for each diusion coecient value.(c): Evolution of q(n) over time, for a diusion coecient equal to 50 and 1200µm2/min.
performed simulations, varying only the diusion coecients. Our results showthat the oscillatory behaviour is highly robust over a wide range of variation forthe diusion coecient. Oscillations arise for low diusion coecient (see Fig.6) and remain active for very large values of the parameters. The amplitude ofoscillations decreases slightly with the diusion coecient but the period of oscilla-tions is almost constant. We can observe damped oscillations for values of proteindiusion lower than 10µm2/min, but once this threshold is crossed, undamped os-cillations arise with a period of about 35 minutes (lower than the period observedin biological experiments [2, 46]). Conversely, if simulations are performed with a1:1 ratio between mRNA and protein diusion, oscillations disappear quickly, for
18
hal-0
0726
014,
ver
sion
1 -
28 A
ug 2
012

diusion values D ≥ 100, as shown in Figure 7. This suggests that the dierencebetween mRNA and protein diusion coecients is crucial to the oscillations ofthe system.
0 100 200 300 400 5000
2
4
6
8
10
TIME (min)
co
ncen
trati
on
nuclear p53p
nuclear Mdm2
Figure 7: 1-dimensional PDE model. Temporal evolution of nuclear p53p and Mdm2 concentra-tions. For homogeneous values of the diusion coecient (ratio 1:1) only damped oscillationsoccur. Here we xed Ds = 200, for s = p,m, r, q. All the other parameter values are xed to thereference ones reported in Table 1 and 2.
4.3.2. Low permeability is essential for oscillations in the 1-D case.
We analysed the behaviour of the system under variations of the permeabilitycoecient. In order to cross the nuclear membrane, proteins and RNAs need topass through large protein channels, called nuclear pore complexes (NPCs), that letonly authorised molecules to pass through. Even though a nuclear pore can be upto 100 nm long [53] and the access to the pore is highly controlled, the translocationpathway is impressively ecient. The mass ow through a single NPC can be upto 80 MDa/s [54] and the time needed for translocation through the pore lastsonly 5-7ms [55]. In order to understand whether the permeability parameter isdeterminant for the model behaviour, we performed numerical simulations fordierent permeability values. As in Section 4.3.1, the ratio between the diusioncoecients of protein and mRNA has been set to 100:1. In the 1-dimensional case,undamped oscillations occur for values of the permeability ρs included between 3and 20 µm/min. Some damped oscillations still appear for values of the parameterρs ∈ [20, 40], as shown in Figure 8. We also notice that, unlike in the previousexperiments on diusion coecients, the period of the oscillations depends highlyon permeability variations. Figure 8(b) shows the number of peaks of p53 levelobserved in 500 minutes.
These rst results bring out the importance of the spatial variable: analysingvariations of the system with respect to coecients that could not be studied inthe ODE case, we have pointed out the strong dependence of the solution upon thepermeability coecient. However, the range of values over which we can observethe expected oscillatory behaviour is lower than the permeability values proposed
19
hal-0
0726
014,
ver
sion
1 -
28 A
ug 2
012

0 50 100 1500
0.5
1
1.5
2
PERMEABILITY
concentration
(a)
0 50 100 1500
5
10
15
20
PERMEABILITY
nu
mb
er
of
pea
ks
(b)
Figure 8: 1-dimensional PDE model. (a): Amplitude of oscillations of q(n) concentration, fornon homogeneous permeability coecient: protein permeability:RNA permeability xed to 100:1.All the other parameter values are xed to the reference ones reported in Table 1 and 2. (b)Corresponding number of oscillations in 500 min.
in the literature (see e.g. [30]), that range around 100 µm/min−1. We also noticedthat dierent diusion coecients did not inuence - neither qualitatively norquantitatively - the behaviour of the system. Since the 1-dimensional case is anoversimplied model of the cell, where the nuclear membrane is reduced to a singlepoint and diusion is too fast to allow for signicantly dierent behaviours, wewill now analyse the behaviour of the model in a still simple, but more realistic,2-dimensional domain.
4.4. Results in the 2-Dimensional domain
In this section we analyse the system in a 2-dimensional cell-shaped domain.All simulations have been performed using the open source tool FreeFem++1. Forour simulations we chose the domain represented in Fig. 9, where the total areais of about 300 µm2, while the ratio between cytoplasmic and nuclear areas is10 : 1. These values will be varied only when specied. References values forspatial parameters have been reported in Table 2. Most importantly, we remarkthat all the following simulations are done for the value of ATM = 3, for whichsustained oscillations occur. As we veried by numerical simulations, also in the2-dimensional case, sustained oscillations occur for values of ATM higher than aminimum threshold and disappear if the value of ATM is too high.
We reproduced the spatial dynamics of the p53-Mdm2 system, as observed in[2, 46]. As can be observed in Figure 10, 30 min after damage sensing, the p53protein accumulates in the nucleus. A rst peak of p53 concentration appears 1
1FreeFem++ (http://www.freefem.org/++/) is a computer language dedicated to the niteelement method, developed at Jacques-Louis Lions Laboratory, Pierre et Marie Curie University(UPMC), Paris.
20
hal-0
0726
014,
ver
sion
1 -
28 A
ug 2
012

Figure 9: Simulation domain of the 2-dimensional PDE model, Volume ratio: (C : N) = 10 : 1
hour after the start of simulations. Then the cytoplasm and the nucleus empty anda second cycle starts. Oscillations of Mdm2 follow, see Figure 11. The period ofoscillations is about 300 min and corresponds to the actual period experimentallyobserved [2, 46].
Figure 10: 2-dimensional PDE model. Spatial distribution of p53p at dierent time-step on thereference domain. Phosphorylated p53 spatial distribution and temporal evolution. As observedin biological experiments [2, 46] p53 accumulates in the nucleus. The peak of p53 protein isobserved at 1h from damage sensing. Then the level of p53 steps back towards the initial state.
4.4.1. Oscillations exist for realistic protein and mRNA diusion values.
Following the results of [48, 49] and the numerical results of the previous sec-tion, we xed the protein to mRNA diusion coecient ratio to 100 : 1. As in
21
hal-0
0726
014,
ver
sion
1 -
28 A
ug 2
012

Figure 11: 2-dimensional PDE model. Mdm2 evolution in time and space. As shown in biologicalexperiments, the peak level of Mdm2 follows the peak of p53 [46]. The peak of nuclear Mdm2takes place at t=2h, while p53 peaks at t=1h. To compare with p53 evolution, see Figure 10.
section 4.3.1, we observe a robust oscillatory behaviour, with sustained oscilla-tions occurring for diusion values ranging in [10, 1000]µm2/min (see Table 3 andFigure 12). Comparing these results with the 1-dimensional case, we remark thatdiusion values play a more important role. Indeed in Section 4.3.1 we obtainedan oscillatory behaviour for all diusion values > 10 µm2/min. Adding the seconddimension to the system, we remark instead that oscillations disappear for valuesof the diusion coecient higher than 1000 µm2/min, which implies that veryfast diusion of molecules prevents the occurrence of oscillations. This emphasizesthe importance in the 2D model of spatial diusion, with physiological values forthe diusion cecients. As shown in [51] experimentally observed p53 mobilityreduces drastically after DNA damage, and its diusion coecient passes from ∼18 µm2/s to ∼ 3 µm2/s (1000 µm2/min - 180 µm2/min), within 8 hours. This re-duced mobility is probably due to increased protein-protein interactions and DNAbinding of active p53. Interestingly, the oscillatory dynamics is captured by ourmodel for all those dierent values. Nevertheless, we did not consider the diusionof p53 as a function of time and DNA damage, which is an open option left forfuture works.
4.4.2. Period depends on permeability, but sustained oscillations are always present.
We tested again the robustness of the system towards perturbations of thepermeability coecients. We know, from the previous section, that in the 1-dimensional case the response of the system is sensitive to permeability variations.
22
hal-0
0726
014,
ver
sion
1 -
28 A
ug 2
012
0 100 200 300 400 500 600 700 800 900 1000 11000
2
4
6
8
10
12
14
DIFF (µm2/min)
nu
mb
er
of
peaks
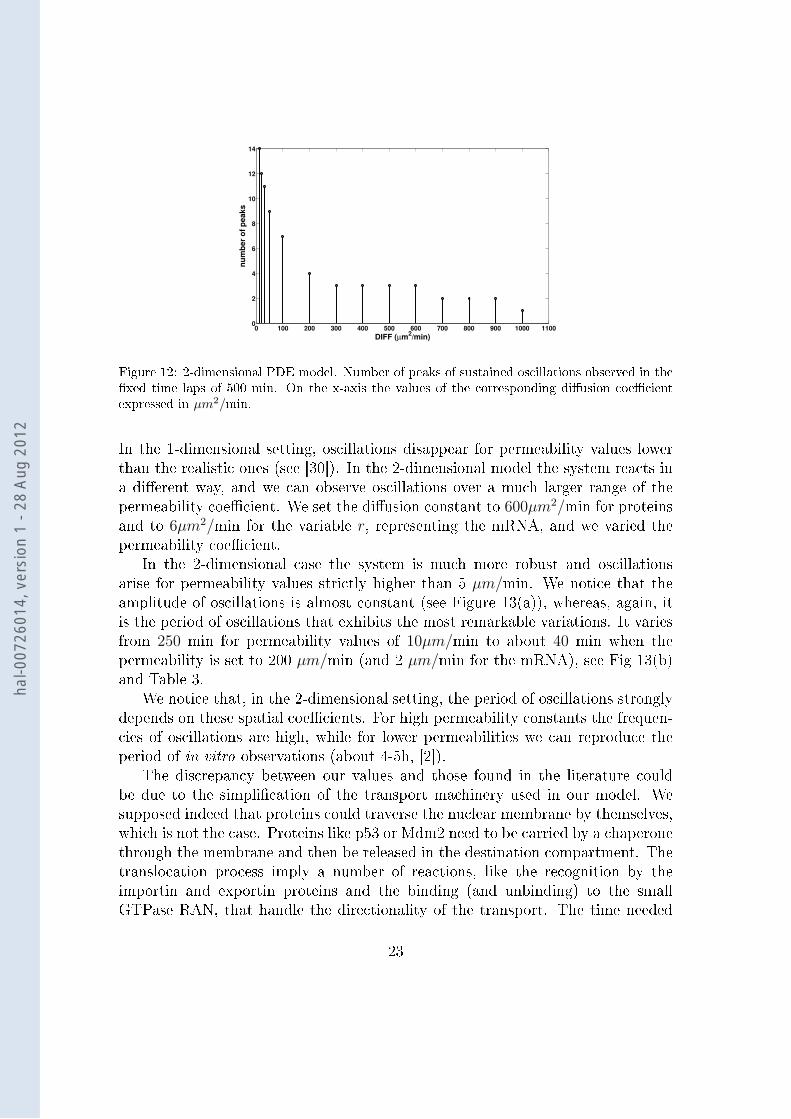
Figure 12: 2-dimensional PDE model. Number of peaks of sustained oscillations observed in thexed time laps of 500 min. On the x-axis the values of the corresponding diusion coecientexpressed in µm2/min.
In the 1-dimensional setting, oscillations disappear for permeability values lowerthan the realistic ones (see [30]). In the 2-dimensional model the system reacts ina dierent way, and we can observe oscillations over a much larger range of thepermeability coecient. We set the diusion constant to 600µm2/min for proteinsand to 6µm2/min for the variable r, representing the mRNA, and we varied thepermeability coecient.
In the 2-dimensional case the system is much more robust and oscillationsarise for permeability values strictly higher than 5 µm/min. We notice that theamplitude of oscillations is almost constant (see Figure 13(a)), whereas, again, itis the period of oscillations that exhibits the most remarkable variations. It variesfrom 250 min for permeability values of 10µm/min to about 40 min when thepermeability is set to 200 µm/min (and 2 µm/min for the mRNA), see Fig 13(b)and Table 3.
We notice that, in the 2-dimensional setting, the period of oscillations stronglydepends on these spatial coecients. For high permeability constants the frequen-cies of oscillations are high, while for lower permeabilities we can reproduce theperiod of in vitro observations (about 4-5h, [2]).
The discrepancy between our values and those found in the literature couldbe due to the simplication of the transport machinery used in our model. Wesupposed indeed that proteins could traverse the nuclear membrane by themselves,which is not the case. Proteins like p53 or Mdm2 need to be carried by a chaperonethrough the membrane and then be released in the destination compartment. Thetranslocation process imply a number of reactions, like the recognition by theimportin and exportin proteins and the binding (and unbinding) to the smallGTPase RAN, that handle the directionality of the transport. The time needed
23
hal-0
0726
014,
ver
sion
1 -
28 A
ug 2
012

0 50 100 150 200 250 300 350 400 4500
1
2
3
4
5
6
PERMEABILITY (µm/min)
co
nc
en
trati
on
oscillationsamplitude
(a) Amplitude of oscillations
0 100 200 300 400 5000
5
10
15
20
PERMEABILITY (µm/min)
nu
mb
er
of
pea
ks
(b) Number of oscillations in 500 minutes
Figure 13: 2-dimensional PDE model. Oscillations in the 2-dimensional case. Variations accord-ing to the permeability coecient: in the 2-dimensional domain, undamped oscillations appearfor a wide range of permeability values (see Table 3). In (a) we plotted the amplitude of oscil-lations for q(n), while in (b) we plotted the number of oscillations in 500 min. The protein tomRNA permeabilty ratio is xed to 100:1.
Parameter Description Ref. values values for oscillations
V ol Total area of the simulations domain 300µm2 V ol > 0(µm2)Vr Volume ratio Cytoplasm:Nucleus 10 2 ≤ Vr ≤ 100ρs Protein permeabilities 10µm/min 5 ≤ ρs ≤ 5000(µm/min)Ds Protein diusion coecients 600µm2/min 10 ≤ Di ≤ 1000(µm2/min)
Table 3: Parameter ranges of spatial values for which oscillations occurs. Remark: As explainedwithin the text, the ratio protein diusion:mRNA diusion has been xed to 100:1. Consistentlyto this choice also the ratio protein permeability:mRNA permeability has been xed to 100:1.Range of parameters obtained as in Table 1.
for these events to occur is not taken into account by our model and this led usto set low permeability values, namely 10µm/min instead of 100µm/min [30], inorder to get oscillations with the period observed in the literature. Note that thispoint is more extensively commented on Section 6.
4.4.3. Period depends on the total volume of the cell rather than on cytoplasmic
to nuclear volume ratio.
The spatial treatment of the problem allowed us to analyse the response ofthe model in dierent domains. Numerical simulations have been performed overa large range of domains having dierent total area, while the ratio between cy-toplasmic and nuclear area was kept x at 10 : 1. Our results show that theoscillatory dynamics is the constant response of the system. However the periodof oscillations depends on the total volume of the in silico cell, see Fig. 14(b). Forsmaller volumes, the period is shorter and it rises with the volume. We observedvariations between 55 and 1000 min.
We also analysed how the nuclear:cytoplasmic volume ratio aects the response
24
hal-0
0726
014,
ver
sion
1 -
28 A
ug 2
012

of the system. In this case, we xed the total area to 300µm2 (Figure 9), and wevaried the nuclear area. Here again, the temporal dynamics of the system isoscillatory and oscillations do not depends on the volume ratio. The period ofsustained oscillations varies between 175 and 400 min. Two or three peaks of p53level (in the xed time lapse of 500 minutes) can be observed in Figure 15(b) forvolume ratios varying between 2 and 100. See Figures 14 and 15 below and Table3 for more quantitative details.
One can remark that the dynamics of the system is robust as sustained oscil-lations can be observed over dierent domains. This information let us speculatethat the role of oscillations is crucial for the p53-Mdm2 system. Indeed, even ifwe change drastically the physical environment, or the cell shape (as we will seein the next section), sustained oscillations are always present.
0 50 100 150 200 250 300 350 400 450 5000
0.1
0.2
0.3
0.4
TIME (min)
co
ncen
trati
on
0 50 100 150 200 250 300 350 400 450 5000
0.1
0.2
0.3
0.4
co
nc
en
tra
tio
n
Vtot=40
Vtot=110
(a)
0 200 400 600 800 10000
1
2
3
4
5
6
7
8
9
TOTAL AREA (µm2)
nu
mb
er
of
pe
ak
s
(b)
Figure 14: 2-dimensional PDE model. (a): Oscillations of nuclear p53p (average concentrations)for dierent total volume (Vtot) and xed volume ratio (Vr). (b): number of oscillations occurringin 500 min for dierent total volumes.
0 100 200 300 400 5000
0.05
0.1
0.15
0.2
0.25
0.3
0.35
0.4
TIME (min)
co
ncen
trati
on
Vr=3
Vr=10
Vr=18
(a)
0 20 40 60 80 1000
0.5
1
1.5
2
2.5
3
Volume Ratio
nu
mb
er
of
peaks
(b)
Figure 15: 2-dimensional PDE model. (a) Oscillations of nuclear p53 (average concentrations) fordierent volume ratios (Vr) and xed total area, Vr = cytoplasmic area
nuclear area. (b): number of oscillations
occurring in 500 min for dierent volume ratio.
25
hal-0
0726
014,
ver
sion
1 -
28 A
ug 2
012

4.4.4. The geometry of the domain does not change the dynamics of the system.
We analysed the behaviour of the system over dierent geometric domains:rectangular, elliptic and `cell-shaped' domains. In accordance with Terry et al
[56] we conclude that the geometry of the domain does not inuence the dynamicresponse of the system. In Figure 16, we reported the cellular domain used insimulations and the corresponding temporal evolution of nuclear and cytoplasmiclevels of p53, all three domains having approximately the same area and samevolume ratio. As can be seen, the reproduced temporal dynamics of the threesystems are the same. Furthermore, the spatial dynamics does not depend onthe shape of the domain, as can be observed in Figure 17 where we reported thesimulations results in two dierent domains.
We also performed simulations locating the ribosomes, the big protein com-plexes, scattered within the cytoplasm, that translate the mRNAs into proteins.We designed the spatial distribution of ribosomes in such a way that their totalconcentration did not change, varying only their location. To do this, we consid-ered dierent functions dened on the domain of Figure 9, all having the samemean. No inuence of the ribosome location could be observed and we couldconclude that the oscillatory behaviour is robust upon changes on the locationof ribosomes. This result diers from [27] where the authors stated that the p53oscillatory response was dependent on ribosome location. However the same au-thors in [28], when more precisely studying the spatial distribution of ribosomes,observed a lower inuence of this location. In an equivalent manner, we changedthe transcription locus in the nucleus, where the mRNA of Mdm2 is produced.We xed the mean of the function representing the transcription domain and wevaried its location within the nucleus. Also in this case, we could not observe anyquantitative or qualitative variation of the cell behaviour.
5. Summary of the results
In this work we studied a new model for p53 which describes both its tempo-ral and spatial dynamics. Considering only the basic pathways and the distinctionbetween nucleus and cytoplasm we have reproduced the spatial and temporal oscil-lations of the p53-Mdm2 system. Firstly, we have shown that we could reproducesustained oscillations for the p53-Mdm2 network by considering a nuclear and acytoplasmic compartment, without further introduction of intracellular space, inSection 3.1. Next we studied a PDE model by introducing a spatial variable inthe previously designed ODE model. We were able to reproduce oscillations withthe period observed in in vitro experiments, namely 4 - 5 hours [2], using realisticdiusion coecients, by this addition of a spatial variable. Furthermore we ob-served that the response of the system strongly depends on the spatial coecientsof the system (diusion, permeability, total volume of the cell), which points out
26
hal-0
0726
014,
ver
sion
1 -
28 A
ug 2
012

Figure 16: 2-dimensional PDE model. Dierent simulation domains having the same total volumeand same nucleus to cytoplasmic volume ratio, lead to similar oscillatory behaviours of nuclearand cytoplasmic concentration of phosphorylated p53.
the signicant role of space in the p53 system. Moreover by means of the PDEmodel, we have also shown that, using realistic diusion coecients for protein andmRNA [48, 49, 50, 51], it is possible to reproduce the oscillatory p53 regime withthe exact observed period of oscillations, and that these oscillations are presentfor all known values of p53 diusivity [51] (knowing that p53 mobility is reducedafter DNA damage).
We have also studied how the system responds to variations in permeabilitycoecients, total volume and nuclear to cytoplasmic volume ratio. We have shownthat the oscillatory response is robust towards such variations, and that the periodof oscillations depends on the permeability coecient, and also on the total volumeof the cell.
The distinction between nucleus and cytoplasm is the characteristic feature ofeukaryotic cells. We think that a model of signal transduction needs to considerthis basic and simple distinction in order to be consistent with common knowledgeof the intracellular biology and topology.
6. Conclusions and Perspectives
We have proposed in this paper a model for p53 nuclear accumulation. We haveshown that the negative p53-Mdm2 feedback reproduces the oscillatory behaviourobserved in cultured cells, if the distinction between the nuclear and cytoplasmiccompartments is taken into account. This implies locating the main cellular pro-cesses and making explicit the delays due to transcription, translation and translo-cation between compartments. Firstly, we have studied the response of the ODE
27
hal-0
0726
014,
ver
sion
1 -
28 A
ug 2
012

(a)
(b)
Figure 17: 2-dimensional PDE model. (a): p53 oscillations in the 2-dimensional case: after 30minutes the concentration of the molecule accumulates in the whole cell. Then the nucleus llsup and the cytoplasmic concentration decreases. The cycle starts again. (b): spatial dynamicsof p53 in the reference domain. The spatial and temporal dynamics do not depend on cell shape.
28
hal-0
0726
014,
ver
sion
1 -
28 A
ug 2
012

dierential system, and we have veried that the dynamics of the network pro-posed was the expected one. We have reproduced undamped oscillations againstATM variations showing the existence of a Hopf supercritical bifurcation. Then wehave introduced a spatial variable and numerically analysed the simulation resultsin the new PDE setting. Our choice to develop a spatial model of the p53 networkhas led us to remark that taking into account physiological phenomena within thecellular space explains in biologically relevant details the expected oscillations. Wehave shown that the experimental diusion values t our model and reproduce theoscillatory behaviour with a good estimation of the period observed in vitro. Wehave provided evidence that the oscillatory behaviour of the system is also robusttowards variations of the nuclear to cytoplasmic ratio and of cell shapes. This al-lows us to speculate that such a robust response of the system towards changes inphysical coecients, as cell volume, diusion coecient or volume ratios, testiesthe crucial role of oscillations in the p53 system.
It is worth noting that the permeability values that reproduce the physiologicalbehaviour in our model are lower than the values proposed in other works [29,30]. We believe that, taking into account more signalling pathways involved inthe import and export nucleocytoplasmic machinery should permit to considermore realistic permeability values. Indeed, it is known that the translocationrate is given by the nucleocytoplasmic transport machinery [50], and not by thetranslocation through the nuclear pore complexes, since the time during whichmolecules bind to the central region of the nuclear pore is very low [55]. Thus totake into account more realistic transport timing it would be important to couplethe model we have designed with the model of nucleocytoplasmic transport studiedin [29]. Preliminary studies with compartmental models are under way. It wouldalso be interesting to model the cytoskeloton activity in the transport mechanism,as done in [28, 29]. It has indeed been shown that p53 uses the microtubulelaments in order to get to the nucleus faster [57, 58]. However, there is stillno experimental evidence for a role of microtubules in Mdm2 cytosolic transport.Another important extension of our model, that would introduce more realism,would be to include the third dimension and explore the behaviour of the systemin the 3-dimensional setting.
To conclude on a medically oriented note, the simplicity of the network con-sidered in this work may oer in the future an eective tool to understand theeects of known mutations of p53 with respect to the dierent mechanism that werepresent in our model, as nuclear import, translation, or phosphorylation. Indeedp53 is known to be mutated in more than 50% of cancer cells and it is a futuregoal with possible pharmacological and clinical consequences for us to understandhow these mutations inuence the spatio-temporal dynamics of p53.
29
hal-0
0726
014,
ver
sion
1 -
28 A
ug 2
012
Acknowledgements.
The authors are gratefully indebted to Frédérique Billy for her time spent onreading the manuscript and suggesting improvements to it, and to Robin Fåhraeusfor his useful comments on the model from an expert biologist's point of view.
[1] R. L. Bar-Or, R. Maya, L. A. Segel, U. Alon, A. J. Levine, M. Oren, Gen-eration of oscillations by the p53-mdm2 feedback loop: a theoretical andexperimental study., Proc Natl Acad Sci U S A 97 (21) (2000) 1125011255.doi:10.1073/pnas.210171597.URL http://dx.doi.org/10.1073/pnas.210171597
[2] G. Lahav, N. Rosenfeld, A. Sigal, N. Geva-Zatorsky, A. J. Levine, M. B.Elowitz, U. Alon, Dynamics of the p53-mdm2 feedback loop in individualcells., Nat Genet 36 (2) (2004) 147150. doi:10.1038/ng1293.URL http://dx.doi.org/10.1038/ng1293
[3] S. Fang, J. P. Jensen, R. L. Ludwig, K. H. Vousden, A. M. Weissman, Mdm2is a ring nger-dependent ubiquitin protein ligase for itself and p53., J BiolChem 275 (12) (2000) 89458951.
[4] N. D. Marchenko, W. Hanel, D. Li, K. Becker, N. Reich, U. M. Moll,Stress-mediated nuclear stabilization of p53 is regulated by ubiquitinationand importin-alpha3 binding., Cell Death Dier 17 (2) (2010) 255267.doi:10.1038/cdd.2009.173.URL http://dx.doi.org/10.1038/cdd.2009.173
[5] D. Michael, M. Oren, The p53-mdm2 module and the ubiquitin system.,Semin Cancer Biol 13 (1) (2003) 4958.
[6] K.-X. Shu, B. Li, L.-X. Wu, The p53 network: p53 and its down-stream genes., Colloids Surf B Biointerfaces 55 (1) (2007) 1018.doi:10.1016/j.colsurfb.2006.11.003.URL http://dx.doi.org/10.1016/j.colsurfb.2006.11.003
[7] D. A. Freedman, L. Wu, A. J. Levine, Functions of the mdm2 oncoprotein.,Cell Mol Life Sci 55 (1) (1999) 96107.
[8] A. M. Carr, Cell cycle. piecing together the p53 puzzle., Science 287 (5459)(2000) 17651766.
[9] B. Vogelstein, D. Lane, A. J. Levine, Surng the p53 network., Nature408 (6810) (2000) 307310. doi:10.1038/35042675.
[10] M. F. Lavin, S. Kozlov, Atm activation and dna damage response., Cell Cycle6 (8) (2007) 931942.
30
hal-0
0726
014,
ver
sion
1 -
28 A
ug 2
012

[11] F. A. Derheimer, M. B. Kastan, Multiple roles of atm in monitoringand maintaining dna integrity., FEBS Lett 584 (17) (2010) 36753681.doi:10.1016/j.febslet.2010.05.031.
[12] S. Saito, A. A. Goodarzi, Y. Higashimoto, Y. Noda, S. P. Lees-Miller, E. Ap-pella, C. W. Anderson, Atm mediates phosphorylation at multiple p53 sites,including ser(46), in response to ionizing radiation., J Biol Chem 277 (15)(2002) 1249112494. doi:10.1074/jbc.C200093200.
[13] N. D. Lakin, S. P. Jackson, Regulation of p53 in response to dna damage.,Oncogene 18 (53) (1999) 76447655. doi:10.1038/sj.onc.1203015.
[14] N. C. Reich, M. Oren, A. J. Levine, Two distinct mechanisms regulate thelevels of a cellular tumor antigen, p53., Mol Cell Biol 3 (12) (1983) 21432150.
[15] M. P. Vierboom, S. Zwaveling, B. GMJ, M. Ooms, G. M. Krietemeijer, C. J.Melief, R. Oringa, High steady-state levels of p53 are not a prerequisite fortumor eradication by wild-type p53-specic cytotoxic t lymphocytes., CancerRes 60 (19) (2000) 55085513.
[16] L. Feng, T. Lin, H. Uranishi, W. Gu, Y. Xu, Functional analysis of theroles of posttranslational modications at the p53 c terminus in regulat-ing p53 stability and activity., Mol Cell Biol 25 (13) (2005) 53895395.doi:10.1128/MCB.25.13.5389-5395.2005.
[17] S. H. Liang, M. F. Clarke, Regulation of p53 localization., Eur J Biochem268 (10) (2001) 27792783.
[18] X. Wu, J. H. Bayle, D. Olson, A. J. Levine, The p53-mdm-2 autoregulatoryfeedback loop., Genes Dev 7 (7A) (1993) 11261132.
[19] Y. Haupt, R. Maya, A. Kazaz, M. Oren, Mdm2 promotes the rapid degrada-tion of p53., Nature 387 (6630) (1997) 296299. doi:10.1038/387296a0.
[20] B. Novák, J. J. Tyson, Design principles of biochemical oscillators., Nat RevMol Cell Biol 9 (12) (2008) 981991. doi:10.1038/nrm2530.
[21] N. A. M. Monk, Oscillatory expression of hes1, p53, and nf-kappab driven bytranscriptional time delays., Curr Biol 13 (16) (2003) 14091413.
[22] L. Ma, J. Wagner, J. J. Rice, W. Hu, A. J. Levine, G. A. Stolovitzky, Aplausible model for the digital response of p53 to dna damage., Proc NatlAcad Sci U S A 102 (40) (2005) 1426614271. doi:10.1073/pnas.0501352102.URL http://dx.doi.org/10.1073/pnas.0501352102
31
hal-0
0726
014,
ver
sion
1 -
28 A
ug 2
012

[23] D. A. Ouattara, W. Abou-Jaoudé, M. Kaufman, From structure todynamics: frequency tuning in the p53-mdm2 network. ii dierentialand stochastic approaches., J Theor Biol 264 (4) (2010) 11771189.doi:10.1016/j.jtbi.2010.03.031.URL http://dx.doi.org/10.1016/j.jtbi.2010.03.031
[24] A. Ciliberto, B. Novak, J. J. Tyson, Steady states and oscillations in thep53/mdm2 network., Cell Cycle 4 (3) (2005) 488493.
[25] L. D. Mayo, D. B. Donner, A phosphatidylinositol 3-kinase/akt pathway pro-motes translocation of mdm2 from the cytoplasm to the nucleus., Proc NatlAcad Sci U S A 98 (20) (2001) 1159811603. doi:10.1073/pnas.181181198.
[26] K. Gordon, I. van Leeuween, S. Lain, M. Chaplain, Spatio-temporal modellingof the p53-mdm2 oscillatory system, Math. Model. Nat. Phenom. 4(3) (2009)97116.
[27] M. Sturrock, A. J. Terry, D. P. Xirodimas, A. M. Thompson, M. A. J.Chaplain, Spatio-temporal modelling of the hes1 and p53-mdm2 in-tracellular signalling pathways., J Theor Biol 273 (1) (2011) 1531.doi:10.1016/j.jtbi.2010.12.016.
[28] M. Sturrock, A. J. Terry, D. P. Xirodimas, A. M. Thompson, M. A. J. Chap-lain, Inuence of the nuclear membrane, active transport, and cell shape onthe hes1 and p53-mdm2 pathways: insights from spatio-temporal modelling,Preprint submitted to Bulletin of Mathematical Biology.
[29] A. Cangiani, R. Natalini, A spatial model of cellular molecular traf-cking including active transport along microtubules., J Theor Bi-oldoi:10.1016/j.jtbi.2010.08.017.URL http://dx.doi.org/10.1016/j.jtbi.2010.08.017
[30] A. E. Smith, B. M. Slepchenko, J. C. Scha, L. M. Loew, I. G. Macara,Systems analysis of ran transport., Science 295 (5554) (2002) 488491.doi:10.1126/science.1064732.
[31] O. Seksek, J. Biwersi, A. S. Verkman, Translational diusion ofmacromolecule-sized solutes in cytoplasm and nucleus., J Cell Biol 138 (1)(1997) 131142.
[32] S. Rajagopalan, F. Huang, A. R. Fersht, Single-molecule characterization ofoligomerization kinetics and equilibria of the tumor suppressor p53., NucleicAcids Res 39 (6) (2011) 22942303. doi:10.1093/nar/gkq800.
32
hal-0
0726
014,
ver
sion
1 -
28 A
ug 2
012

[33] L. A. Segel, M. Slemrod, The quasi-steady-state assumption: A case study inperturbation, SIAM Review 31 (3).URL http://www.jstor.org/stable/2031405
[34] J. S. James P Keener, Mathematical physiology, 2nd Edition, Springer, 1998.
[35] K. M. Dohoney, C. Guillerm, C. Whiteford, C. Elbi, P. F. Lambert, G. L.Hager, J. N. Brady, Phosphorylation of p53 at serine 37 is important fortranscriptional activity and regulation in response to dna damage., Oncogene23 (1) (2004) 4957. doi:10.1038/sj.onc.1207005.
[36] A. Hill, Proceedings of the physiological soci-ety, The Journal of Physiology 40 (1910) ivii.arXiv:http://jp.physoc.org/content/40/supplement/i.full.pdf+html.URL http://jp.physoc.org/content/40/supplement/i.short
[37] D. P. Xirodimas, C. W. Stephen, D. P. Lane, Cocompartmentalization of p53and mdm2 is a major determinant for mdm2-mediated degradation of p53.,Exp Cell Res 270 (1) (2001) 6677. doi:10.1006/excr.2001.5314.
[38] D. A. Freedman, A. J. Levine, Nuclear export is required for degradationof endogenous p53 by mdm2 and human papillomavirus e6., Mol Cell Biol18 (12) (1998) 72887293.
[39] J. M. Stommel, N. D. Marchenko, G. S. Jimenez, U. M. Moll, T. J. Hope,G. M. Wahl, A leucine-rich nuclear export signal in the p53 tetramerizationdomain: regulation of subcellular localization and p53 activity by nes mask-ing., EMBO J 18 (6) (1999) 16601672. doi:10.1093/emboj/18.6.1660.URL http://dx.doi.org/10.1093/emboj/18.6.1660
[40] Y. Zhang, Y. Xiong, A p53 amino-terminal nuclear export signal inhibited bydna damage-induced phosphorylation., Science 292 (5523) (2001) 19101915.doi:10.1126/science.1058637.
[41] P. Rangamani, R. Iyengar, Modelling spatio-temporal interactions within thecell., J Biosci 32 (1) (2007) 157167.
[42] K. B. Wee, U. Surana, B. D. Aguda, Oscillations of the p53-akt network:implications on cell survival and death., PLoS One 4 (2) (2009) e4407.doi:10.1371/journal.pone.0004407.
[43] T. Pu, X.-P. Zhang, F. Liu, W. Wang, Coordination of the nuclear and cyto-plasmic activities of p53 in response to dna damage., Biophys J 99 (6) (2010)16961705. doi:10.1016/j.bpj.2010.07.042.
33
hal-0
0726
014,
ver
sion
1 -
28 A
ug 2
012

[44] L. Perko, Dierential Equations and Dynamical Systems, 2nd Edition,Springer-Verlag, 1996.
[45] Y. A. Kuznetsov, Elements of Applied Bifurcation Theory, 3rd Edition,Springer-Verlag, 2004.
[46] N. Geva-Zatorsky, N. Rosenfeld, S. Itzkovitz, R. Milo, A. Sigal, E. Dekel,T. Yarnitzky, Y. Liron, P. Polak, G. Lahav, U. Alon, Oscillations and variabil-ity in the p53 system, Molecular Systems Biology 2. doi:10.1038/msb4100068.
[47] O. Kedem, A. Katchalsky, Thermodynamic analysis of the permeability of bi-ological membranes to non-electrolytes., Biochim Biophys Acta 27 (2) (1958)229246.
[48] D. Fusco, N. Accornero, B. Lavoie, S. M. Shenoy, J. M. Blanchard, R. H.Singer, E. Bertrand, Single mrna molecules demonstrate probabilistic move-ment in living mammalian cells., Curr Biol 13 (2) (2003) 161167.
[49] Y. Shav-Tal, X. Darzacq, S. M. Shenoy, D. Fusco, S. M. Janicki, D. L. Spector,R. H. Singer, Dynamics of single mrnps in nuclei of living cells., Science304 (5678) (2004) 17971800. doi:10.1126/science.1099754.
[50] D. Grünwald, R. H. Singer, M. Rout, Nuclear export dynamics of rna-proteincomplexes., Nature 475 (7356) (2011) 333341. doi:10.1038/nature10318.
[51] S. Hong, Y.-N. Wang, H. Yamaguchi, H. Sreenivasappa, C.-K. Chou, P.-H.Tsou, M.-C. Hung, J. Kameoka, Measurement of protein 53 diusion coe-cient in live hela cells using raster image correlation spectroscopy (rics)., JBiomater Nanobiotechnol 1 (1) (2010) 3136. doi:10.4236/jbnb.2010.11004.
[52] W. Hundsdorfer, J. Verwer, Numerical Solution of Time-DependentAdvection-Diusion-Reaction Equations, Vol. 33 of Springer Series in Com-putational Mathematics, Springer-Verlag, 2003.
[53] R. Reichelt, A. Holzenburg, E. L. Buhle, M. Jarnik, A. Engel, U. Aebi, Cor-relation between structure and mass distribution of the nuclear pore complexand of distinct pore complex components., J Cell Biol 110 (4) (1990) 883894.
[54] K. Ribbeck, D. Görlich, Kinetic analysis of translocation through nuclear porecomplexes., EMBO J 20 (6) (2001) 13201330. doi:10.1093/emboj/20.6.1320.
[55] T. Dange, D. Grünwald, A. Grünwald, R. Peters, U. Kubitscheck, Autonomyand robustness of translocation through the nuclear pore complex: a single-molecule study., J Cell Biol 183 (1) (2008) 7786. doi:10.1083/jcb.200806173.
34
hal-0
0726
014,
ver
sion
1 -
28 A
ug 2
012

[56] A. J. Terry, M. A. J. Chaplain, Spatio-temporal modelling of the nf-κb intra-cellular signalling pathway: the roles of diusion, active transport, and cellgeometry., J Theor Biol 290 (2011) 726. doi:10.1016/j.jtbi.2011.08.036.
[57] D. M. Roth, G. W. Moseley, D. Glover, C. W. Pouton, D. A. Jans, Amicrotubule-facilitated nuclear import pathway for cancer regulatory pro-teins., Trac 8 (6) (2007) 673686. doi:10.1111/j.1600-0854.2007.00564.x.URL http://dx.doi.org/10.1111/j.1600-0854.2007.00564.x
[58] P. Giannakakou, M. Nakano, K. C. Nicolaou, A. O'Brate, J. Yu, M. V.Blagosklonny, U. F. Greber, T. Fojo, Enhanced microtubule-dependenttracking and p53 nuclear accumulation by suppression of microtubuledynamics., Proc Natl Acad Sci U S A 99 (16) (2002) 1085510860.doi:10.1073/pnas.132275599.URL http://dx.doi.org/10.1073/pnas.132275599
35
hal-0
0726
014,
ver
sion
1 -
28 A
ug 2
012