A review of quasi-periodic oscillations from black hole X-ray ...
94
A review of quasi-periodic oscillations from black hole X-ray binaries: observation and theory Adam R. Ingram and Sara E. Motta Department of Physics, Astrophysics, University of Oxford, Denys Wilkinson Building, Keble Road, Oxford OX1 3RH, UK Abstract Black hole and neutron star X-ray binary systems routinely show quasi- periodic oscillations (QPOs) in their X-ray flux. Despite being strong, easily measurable signals, their physical origin has long remained elusive. However, recent observational and theoretical work has greatly improved our under- standing. Here, we briefly review the basic phenomenology of the different varieties of QPO in both black hole and neutron star systems before focus- ing mainly on low frequency QPOs in black hole systems, for which much of the recent progress has been made. We describe the detailed statistical properties of these QPOs and review the physical models proposed in the literature, with particular attention to those based on Lense-Thirring pre- cession. This is a relativistic effect whereby a spinning massive object twists up the surrounding spacetime, inducing nodal precession in inclined orbits. We review the theory describing how an accretion flow reacts to the Lense- Thirring effect, including analytic theory and recent numerical simulations. We then describe recent observational tests that provide very strong evidence that at least a certain type of low frequency QPOs are a geometric effect, and good evidence that they are the result of precession. We discuss the possibility of the spin axis of the compact object being misaligned with the binary rotation axis for a large fraction of X-ray binaries, as is required for QPOs to be driven specifically by Lense-Thirring precession, as well as some outstanding gaps in our understanding and future opportunities provided by X-ray polarimeters and/or high throughput X-ray detectors. Keywords: Black Holes, Neutron Stars, Accretion disc, Frame-dragging Preprint submitted to Journal Name January 27, 2020 arXiv:2001.08758v1 [astro-ph.HE] 23 Jan 2020
-
Upload
khangminh22 -
Category
Documents
-
view
2 -
download
0
Transcript of A review of quasi-periodic oscillations from black hole X-ray ...

A review of quasi-periodic oscillations from black hole
X-ray binaries: observation and theory
Adam R. Ingram and Sara E. Motta
Department of Physics, Astrophysics, University of Oxford, Denys Wilkinson Building,Keble Road, Oxford OX1 3RH, UK
Abstract
Black hole and neutron star X-ray binary systems routinely show quasi-periodic oscillations (QPOs) in their X-ray flux. Despite being strong, easilymeasurable signals, their physical origin has long remained elusive. However,recent observational and theoretical work has greatly improved our under-standing. Here, we briefly review the basic phenomenology of the differentvarieties of QPO in both black hole and neutron star systems before focus-ing mainly on low frequency QPOs in black hole systems, for which muchof the recent progress has been made. We describe the detailed statisticalproperties of these QPOs and review the physical models proposed in theliterature, with particular attention to those based on Lense-Thirring pre-cession. This is a relativistic effect whereby a spinning massive object twistsup the surrounding spacetime, inducing nodal precession in inclined orbits.We review the theory describing how an accretion flow reacts to the Lense-Thirring effect, including analytic theory and recent numerical simulations.We then describe recent observational tests that provide very strong evidencethat at least a certain type of low frequency QPOs are a geometric effect,and good evidence that they are the result of precession. We discuss thepossibility of the spin axis of the compact object being misaligned with thebinary rotation axis for a large fraction of X-ray binaries, as is required forQPOs to be driven specifically by Lense-Thirring precession, as well as someoutstanding gaps in our understanding and future opportunities provided byX-ray polarimeters and/or high throughput X-ray detectors.
Keywords: Black Holes, Neutron Stars, Accretion disc, Frame-dragging
Preprint submitted to Journal Name January 27, 2020
arX
iv:2
001.
0875
8v1
[as
tro-
ph.H
E]
23
Jan
2020

1. Introduction
X-ray binary systems (XRBs) consist of a black hole (BH) or a neutronstar (NS) accreting material from a stellar companion. Close to the compactobject, the accreting material is heated to such high temperatures that itglows brightly in X-rays – providing a means to observe the relativistic mo-tion of matter in strong gravitational fields, and probe the ultra-dense matterthat forms NSs. These systems cannot be directly imaged as their angularsize is typically sub-nano-arcseconds, but the observed rapid X-ray variabil-ity provides a means to indirectly map the accretion flow. In particular,quasi-periodic oscillations (QPOs) are commonly observed in the X-ray flux.Upon their discovery more than 30 years ago, their potential as a powerfuldiagnostic was immediately recognised, but unambiguous determination oftheir physical origin has since proved challenging. Here we review the exten-sive observational phenomenology of QPOs, the prevailing theories for theirphysical origin, and progress made through observational tests over the last∼decade.
Although our main focus here will be on the BH systems, we will fre-quently refer to the NS systems as a basis for comparison. We will almostexclusively discuss low mass XRBs, in which the companion is less massivethan the compact object, and mass transfer takes place via Roche-Lobe over-flow1. Based on their long-term behaviour, low mass XRBs can be classifiedinto persistent and transient sources. The former are always active, show-ing typical X-ray luminosities exceeding LX ∼ 1036 erg/s. The latter spendmost of their life in quiescence (LX ∼ 1030–1034 erg/s) with occasional brightoutbursts (typically reaching luminosities of LX ∼ 1037–1038 erg/s) that last∼weeks to months, more rarely years, and are spaced by ∼months to decades.Apart from a few exceptions, BH systems are typically transients and mostNS systems are persistent sources [45].
QPOs are best studied in the Fourier domain. They appear in the powerspectrum – which is the modulus squared of the Fourier transform of thelight curve [235] – as narrow (width less than ∼ 1/2 the centroid frequency)peaks. In BH systems, QPOs are generally split into low frequency (LF)QPOs, with centroid frequency . 30 Hz, and high frequency (HF) QPOs,with centroid frequency & 60 Hz [25]. A similar distinction applies in NS
1The only exception in this review is Cygnus X-1, for which the companion is a massiveO-type star, and mass transfer takes place via a focused wind.
2
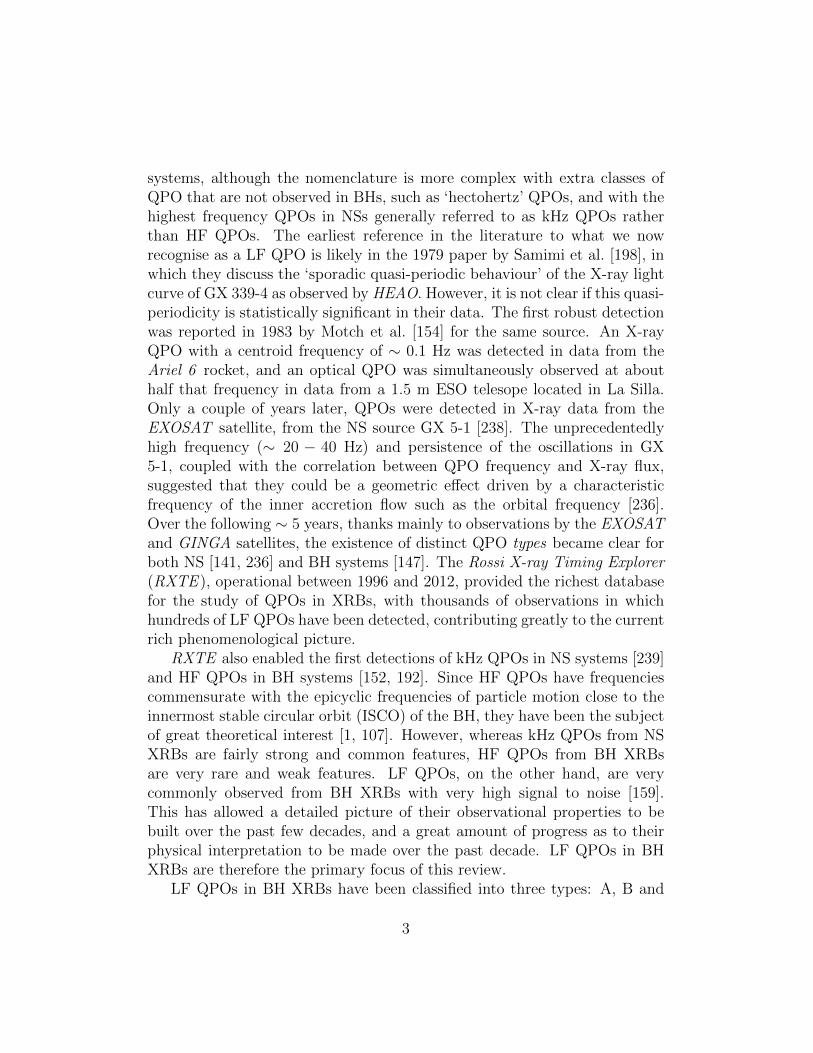
systems, although the nomenclature is more complex with extra classes ofQPO that are not observed in BHs, such as ‘hectohertz’ QPOs, and with thehighest frequency QPOs in NSs generally referred to as kHz QPOs ratherthan HF QPOs. The earliest reference in the literature to what we nowrecognise as a LF QPO is likely in the 1979 paper by Samimi et al. [198], inwhich they discuss the ‘sporadic quasi-periodic behaviour’ of the X-ray lightcurve of GX 339-4 as observed by HEAO. However, it is not clear if this quasi-periodicity is statistically significant in their data. The first robust detectionwas reported in 1983 by Motch et al. [154] for the same source. An X-rayQPO with a centroid frequency of ∼ 0.1 Hz was detected in data from theAriel 6 rocket, and an optical QPO was simultaneously observed at abouthalf that frequency in data from a 1.5 m ESO telesope located in La Silla.Only a couple of years later, QPOs were detected in X-ray data from theEXOSAT satellite, from the NS source GX 5-1 [238]. The unprecedentedlyhigh frequency (∼ 20 − 40 Hz) and persistence of the oscillations in GX5-1, coupled with the correlation between QPO frequency and X-ray flux,suggested that they could be a geometric effect driven by a characteristicfrequency of the inner accretion flow such as the orbital frequency [236].Over the following ∼ 5 years, thanks mainly to observations by the EXOSATand GINGA satellites, the existence of distinct QPO types became clear forboth NS [141, 236] and BH systems [147]. The Rossi X-ray Timing Explorer(RXTE ), operational between 1996 and 2012, provided the richest databasefor the study of QPOs in XRBs, with thousands of observations in whichhundreds of LF QPOs have been detected, contributing greatly to the currentrich phenomenological picture.
RXTE also enabled the first detections of kHz QPOs in NS systems [239]and HF QPOs in BH systems [152, 192]. Since HF QPOs have frequenciescommensurate with the epicyclic frequencies of particle motion close to theinnermost stable circular orbit (ISCO) of the BH, they have been the subjectof great theoretical interest [1, 107]. However, whereas kHz QPOs from NSXRBs are fairly strong and common features, HF QPOs from BH XRBsare very rare and weak features. LF QPOs, on the other hand, are verycommonly observed from BH XRBs with very high signal to noise [159].This has allowed a detailed picture of their observational properties to bebuilt over the past few decades, and a great amount of progress as to theirphysical interpretation to be made over the past decade. LF QPOs in BHXRBs are therefore the primary focus of this review.
LF QPOs in BH XRBs have been classified into three types: A, B and
3

C [252, 204, 36, 159]. Representative power spectra of these three types areshown in Fig 1 (left). Type-A QPOs are weak and broad features, whereasType-B and Type-C QPOs are strong and relatively narrow features. Type-C QPOs are typically observed together with broad band, flat-topped noise,which has been suggested to be caused by propagating fluctuations in themass accretion rate [129, 97]. For NS systems, the nomenclature is slightlydifferent, and largely dependent on historical reasons: LF QPOs are classedas flaring branch oscillations (FBOs), normal branch oscillations (NBOs) andhorizontal brand oscillations (HBOs), based on the location of the source ina colour-colour diagram [117, 72] at the time of the QPO detection. Fig 1(right) shows typical examples of these three types, which have been sug-gested to be NS analogues of the Type-A, -B and -C, respectively, in BHsystems [36, 162]. NBOs, FBOs and HBOs have been observed in the so-called Z-sources, low-mass NS XRBs accreting near or above the Eddingtonluminosity, LEdd (see [72]). In NS XRBs accreting at lower rates, the so-calledAtoll sources, similar LF QPOs have been identified, and called HBO-like andFBO-like oscillations based on the similarities of their properties to the LFQPOs observed in Z-sources (see [162] for details).
QPO properties evolve throughout an outburst and are tightly correlatedwith the evolution of the spectrum through a number of spectral states: thehard state, the intermediate states and the soft state. In the hard state theX-ray spectrum is dominated by a hard power-law (photon-index ≈1.4-2)with a high energy cut-off around ∼ 100 keV, while in the soft state thespectrum is dominated by a thermal component peaking at ∼ 1 keV. Bothcomponents are present in the intermediate states. The thermal componentis well understood as originating from a geometrically thin, optically thickaccretion disc, in which turbulent stress transports angular momentum out-wards and heats the disc material [201, 171]. Since the disc is optically thick,it locally emits a blackbody spectrum, with the blackbody temperature in-creasing with proximity to the BH. The power-law component is thought tooriginate from Compton up-scattering of soft X-ray photons from the disc (ora jet, in the low-luminosity hard states) by a cloud of hot electrons locatedclose to the BH [223, 219], with the high energy cut-off determined by thecharacteristic electron temperature. There is still no consensus in the litera-ture on the exact geometry of this cloud, which is often termed the corona.The disc may evaporate inside of some truncation radius into a large scaleheight accretion flow that plays the role of the corona (truncated disc model[48, 84]). Or, the corona may be located above the disc, and possibly mag-
4
netically supported [62, 71] (analogous to the solar corona). Alternatively itmay be located at the base of the out-flowing jet, either being fairly compact[148, 51] or extended [114].
The spectrum also displays a reflection component that results from ir-radiation of the disc by the corona. The irradiated flux is reprocessed in thedisc’s upper atmosphere to emit characteristic features such as an iron Kαfluorescence line at ∼ 6.4 keV and a broad bump peaking at ∼ 20− 30 keVreferred to as the Compton hump [118, 65]. The observed reflection spectrumis distorted by relativistic motion of the disc material (Doppler shifts) andthe gravitational pull of the BH (gravitational redshift), leading to the ob-served iron line profile being asymmetrically broadened [50]. The observediron line profile therefore encodes information about orbital motion in thedisc, and provides a valuable diagnostic as to the physical origin of QPOs.
We will first summarise the detailed phenomenology of all QPO classesand their relation to spectral states and transitions (Section 2). We will thenfocus on details of LF QPOs in BH XRBs, investigating what makes themquasi-periodic as opposed to purely periodic signals (Section 3). We willdiscuss theoretical models of LF QPOs, many of which consider epicyclicfrequencies in general relativity (GR) and their effect on the dynamics ofthe accretion flow. We will therefore first review some of the theory behindthis (Section 4) before summarising the most prominent LF QPO modelsfrom the literature (Section 5). We will then present the most constrainingobservational tests of the physical mechanism behind LF QPOs (Section 6),discussing the current state of the art (Section 7) and finally concluding witha number of concluding remarks (Section 8).
2. Phenomenology of QPOs
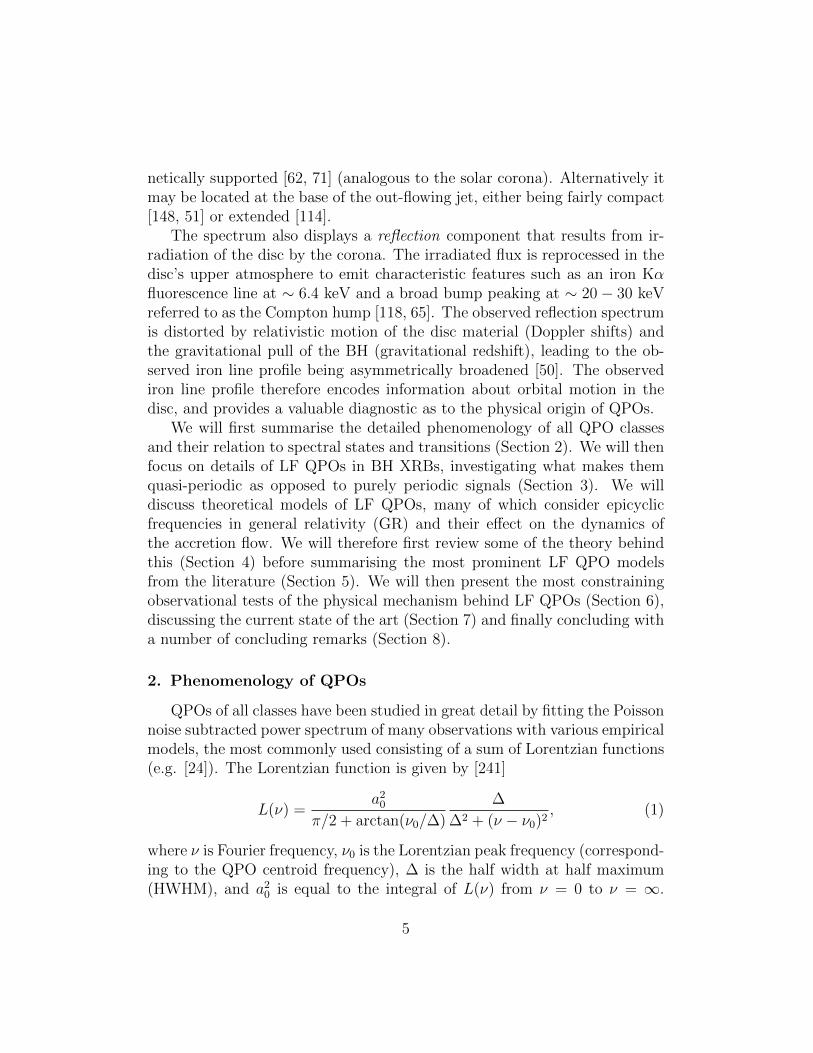
QPOs of all classes have been studied in great detail by fitting the Poissonnoise subtracted power spectrum of many observations with various empiricalmodels, the most commonly used consisting of a sum of Lorentzian functions(e.g. [24]). The Lorentzian function is given by [241]
L(ν) =a20
π/2 + arctan(ν0/∆)
∆
∆2 + (ν − ν0)2, (1)
where ν is Fourier frequency, ν0 is the Lorentzian peak frequency (correspond-ing to the QPO centroid frequency), ∆ is the half width at half maximum(HWHM), and a20 is equal to the integral of L(ν) from ν = 0 to ν = ∞.
5

Figure 1: Left panels: examples of LF QPOs from BH XRBs. From top to bottom, QPOsare taken from XTE J1859+226, GX 339-4 and again GX 339-4. Right panels: examplesof QPOs from NS XRBs. From top to bottom, QPOs are taken from GX17+2, againGX17+2 and Cyg X-2. Power spectra in the power×frequency versus frequency form, andhave been normalised in fractional rms2. The contribution of the Poisson noise has beensubtracted. Arrows represent 3σ upper limits.
6

From Parseval’s theorem, the power spectrum can be normalised such thatits integral over all positive frequencies is equal to the square of the frac-tional root mean square deviation (or rms) of the corresponding time series(fractional rms normalisation; [117, 22]). The rms essentially quantifies howvariable a given time series is in a given Fourier frequency range. If the rmsnormalisation is used, then a0 represents the fractional rms of the Lorentziancomponent. A quality factor Q = ν0/(2∆) is typically defined, which de-scribes how narrowly peaked a given component is. It is also useful to definethe frequency at which the Lorentzian component contributes most of itsvariance per logarithmic frequency interval, νmax = (ν20 + ∆2)1/2, since thisallows the characteristic frequencies of broad and narrow components to becompared. This frequency is sometimes referred to as the characteristic fre-quency [24].
QPOs often appear as a series of harmonically related peaks, which in-dicates that the oscillation in the time domain is more complex than purelysinusoidal. In this review, with the term ‘QPO frequency’ we will refer tothe centroid frequency of the fundamental peak, νqpo, and we employ thenomenclature standard in physics in which the centroid frequency of the nth
harmonic is nνqpo. Therefore, the first harmonic is the fundamental. In con-trast, the centroid frequency of the nth overtone is (n+ 1)νqpo. We note thatin the QPO literature the second harmonic is (erroneously) often referred toas ‘the harmonic’ or ‘the first harmonic’.
Since the QPO properties are tightly correlated with spectral state, wereview the phenomenology of states and states transitions in BHs beforediscussing LF QPOs and HF QPOs and their observed properties.
2.1. States and transitions
During an outburst, BH XRBs typically cycle through several spectral-timing states - believed to be connected with different accretion rates ontothe BH (e.g. [150], [28]) - which can be tracked using a hardness-intensitydiagram (HID) [77, 28]. Fig 2 (top left) shows a sketch of the ‘q’-shaped looptraced out on the HID by a typical BH XRB in outburst. The hardness isdefined as the ratio of the counts in a harder X-ray band to that in a softerX-ray band. Typical bounds for the hard and soft bands are ∼ 6−10 keV and4−6 keV [23], but being rather arbitrarily chosen, the ranges used vary quitea lot across different studies and different instruments. Outbursts begin inthe hard state (bottom right of the HID), during which the time variabilityamplitude of the X-ray emission is high, and the rms can be as high as
7

Hardness Ratio
HBO
NBO
FBOHardness Ratio
Radio flares
Radio flares
Radio flares
Radio flares
C
B
A
Hardness Ratio
LxLEdd
1
0.5
0.01
Z-sources
Atolls
INTERMEDIATESTATE
SOFTSTATE
HARDSTATE
NEU
TRO
N S
TAR
S
Hardness Ratio
LxLEdd
1
0.5
0.01
INTERMEDIATESTATE
SOFTSTATE
HARDSTATE
BLAC
K H
OLE
S
ULTRA-LUMINOUSSTATE
Figure 2: Schematic description of the behaviour of BH (upper panels) and NS (lowerpanels) systems in a Hardness-Intensity diagram. On the left panels we show the typicalbehavior for NS and BH systems, indicating the relevant spectral states. On the rightpanels, we indicate where LF QPOs are found in both systems. Figures adapted from[163].
8

20−30%. Sources then transition to the soft state via two intermediate states:the hard intermediate state (HIMS) and the soft intermediate state (SIMS).This transition occurs at a roughly constant luminosity (∼ tens% LEdd).Since the hardness and the fractional rms variability amplitude are tightlycorrelated, the rms decreases during the state transition and is very low(sometimes consistent with zero) in the soft state [25].
Shortly before or just after the transition to the soft state, a few sourcesenter the so called ultra-luminous state (ULS; e.g. [156], top of the HID).GRO J1655-40 is the BH XRB that showed the clearest example of a ULSin the RXTE era. Other sources have shown short excursions to this state,among these GX 339-4, XTE J1550-564, H1743-322, 4U 1630-47 (see e.g.[46]) and GRS 1915+105 [163]. The ULS exhibits fairly low variability am-plitude (around 5-10%), but large colour variations. Compared to the stan-dard intermediate states, it extends to much higher luminosities, reachingand in some cases exceeding the Eddington luminosity [230]. After the softstate is reached, the luminosity slowly decreases (in weeks to months) toa few percent of LEdd until a backward transition occurs, taking a sourceonce more through the intermediate states and then to the hard state. Afterthis second hard state, the outburst phase normally comes to an end, eventhough it is not unusual to witness a temporary re-brightening, which takesthe sources up in the hard state for a time (typically a few weeks to a fewmonths), and finally back to quiescence [39, 15, 40]. Outburst phases in BHXRBs are characterized by hysteresis, i.e. the hard to soft transition alwaysoccurs at higher luminosity than the soft to hard transition [149, 131]. Thiscyclic pattern translates into hysteresis loops in the HID that are always ob-served to develop in an anti-clockwise manner. Similar loops are seen in anrms-intensity diagram [164], as expected from the known correlation betweenrms and hardness.
2.2. Low frequency QPOs
As we alluded to in the Introduction, LF QPOs in BH XRBs have tradi-tionally been classified into three types: A, B and C. Fig 2 (top right) showswhere in the hysteresis loop on the HID each type of QPO is observed. Wesee that Type-C QPOs are first observed in the hard state, whereas Type-B and Type-A QPOs are only seen during the transition to the soft state.Below, we discuss these three QPO classes in the order they appear in anoutburst.
9

Figure 3: Type-C QPO frequency versus the low frequency break frequency (reproducedfrom Wijnands et al. [252]). Left: black symbols represent BH systems, whereas red andblue points represent NS systems. Right: Black symbols now represent all points from theleft panel and red symbols are Z-sources (high accretion rate NS systems). Blue symbolsare sources for which there are two QPOs and it is unclear which one should be classifiedas Type-C (both are plotted).
10

2.2.1. Type-C QPOs
Type-C QPOs (Fig. 1 bottom) are by far the most common type of QPOin BH systems. Type-C QPOs can be detected essentially in all accretionstates (Fig. 2, top right), even though they are particularly prominent inthe hard-intermediate state and at the bright end of the low-hard state. Thecentroid frequency is tightly correlated with spectral state, rising from a fewmHz in the hard state at low luminosities to ∼ 10 Hz in the intermediatestates. They are also occasionally observed in the soft state and the ULS(see, e.g., [156]), where they can reach ∼30 Hz. Type-C QPOs are char-acterised by a high-amplitude (up to 20% rms), narrow (Q & 8) peak inthe power spectrum, coincident with ‘flat-top’ noise characterised by a lowand high frequency break. A number of harmonics are generally detected,of which the one with the highest rms amplitude is usually (but not exclu-sively) identified with the fundamental. A second harmonic and sometimeseven higher-order harmonics are often seen in addition to the fundamental,as well as a so-called sub-harmonic peak (centered at half the fundamentalfrequency). As shown in Fig. 3, the Type-C QPO frequency correlates withthe low frequency break in the power spectrum [253]. The QPO frequencyalso correlates tightly with spectral parameters such as the photon indexΓ [248] and modelling the flat-top noise as a sum of broad Lorentzians re-veals that it correlates with the characteristic frequency of all these broadcomponents [183]. Type-C QPOs have also been observed at optical (e.g.[154, 85, 63]), ultraviolet [82] and infrared [103] wavelengths. Simultaneousmulti-wavelength observations have revealed that the UV/optical/IR QPOcentroid frequency is sometimes coincident (within errors) with the X-rayQPO fundamental frequency [82, 47, 63] and sometimes (again, within er-rors) with half of the X-ray fundamental frequency [154, 103]. Due to thequality and quantity of Type-C QPO observations, we will concentrate onthese features more than any other throughout this review.
2.2.2. Type-B QPOs
Type-B QPOs (see Fig. 1) have been detected in a large number of BHXRBs and they appear during the SIMS (Fig. 2, top right). In fact, theSIMS is defined by the presence of a Type-B QPO [28]. They are charac-terised by a relatively high amplitude (up to ∼5% rms) and narrow (Q & 6)peak, with a centroid frequency at 5-6 Hz (but see [157], where type-B QPOswere found at ≈1-3 Hz). Type-B QPOs generally appear in the power spec-trum coincident with weak red noise (few percent rms or less) that increases
11

in amplitude at low frequencies (≤0.1 Hz). A weak second harmonic is oftenpresent, sometimes together with a sub-harmonic peak. In a few cases, thesub-harmonic and fundamental have comparable amplitude, resulting in acathedral-like QPO shape [35]. Rapid transitions in which Type-B QPOs ap-pear and disappear on very short time scales are sometimes observed in somesources (e.g. [168] and [35] for the cases of GX 339-4 and XTE J1859+226).These transitions are difficult to resolve at present, as they take place on atimescale shorter than a few seconds. Type-B QPOs occur at a similar timeto discrete jet ejections evidenced by transient radio flares [52] and transientjets resolved in high angular resolution radio images [41]. This property ledto speculation that they are causally connected with the jet ejection, perhapsindicating that the inner regions of the accretion flow are ejected during theType-C to Type-B transition. However, Fender et al. [53] showed that the as-sociation is not so clean, with the Type-B QPO sometimes occurring slightlybefore and sometimes slightly after the inferred ejection.
2.2.3. Type-A QPOs
Type-A QPOs (see Fig. 1) are the least common type of LF QPO inBH XRBs. The entire RXTE archive only contains ∼ 10 significant Type-AQPO detections. Figure 2 (top right) shows that Type-A QPOs normallyappear in the soft state, just after the hard to soft transition has taken place.They appear as a weak (few percent rms) and broad (Q . 3) peak withcentroid frequency of approximately 6− 8 Hz. Neither a sub-harmonic nor asecond harmonic are usually detected, possibly because of the broadness ofthe fundamental peak, or because of the intrinsic low-amplitude of this typeof QPO. Type-A QPOs are associated with a very low amplitude red noise.Originally, these LF QPOs were dubbed Type A-II [79]. LF QPOs dubbedType A-I [252] were strong, broad and appeared together with a very low-amplitude red noise, and a ‘shoulder’ on the right-hand side of this QPO wasclearly visible and interpreted as a very broadened second harmonic peak.Casella et al. [36] showed that these Type A-I LF QPOs should instead beclassified as Type-B QPOs. Since Type-A QPOs are very weak, rare features,we hereafter will not discuss them in much detail.
2.3. High-frequency QPOs
HF QPOs are rare features in BH systems, with all detections to datebeing made by RXTE. The first reported detection, in 1997, was from GRS1915+105 at ∼ 67 Hz [152]. Since then, sixteen years of RXTE observations
12

have yielded only a handful of detections in other sources (XTE J1550-564,GRO J1655-40, XTE J1859+226, H 1743-322 , GX 339-4, XTE J1752-223,4U 1630-47, IGR J17091-3624), but all at a few hundred Hz, i.e., at signifi-cantly higher frequencies than the ∼ 67 Hz QPO from GRS 1915+105. It isworth noticing that some of these detections have been later proven to be notstatistically significant, leaving only two source a few solid detections fromtwo sources (XTE J1550-564, GRO J1655-40, see [29]). The ∼ 67 Hz QPOhas emerged as a somewhat special case, in that a QPO at similar frequencyhas only been seen from one other source (IGR J17091-3624 [4]), and thereare many detections of this feature from GRS 1915+105 [26], including anumber of cases found in the ASTROSAT data, where the 67Hz QPO variessignificantly in frquency over short time scales [27]. The above contrastssharply with the handful of statistically significant detections of & 100 HzHF QPOs from other sources [29].
HF QPOs appear only in high flux observations, at a fairly specific hard-ness ratio [29]. Although this may be a selection effect given that the noiselevel decreases with count rate, there are many high flux observations with-out HF QPO detections, which suggests that a high count rate is not theonly parameter required for the detection of an HF QPO. HF QPOs can beobserved as single or double peaks (in which case they are called the lowerand upper HF QPOs). Only one source, GRO J1655-40 (see Fig. 4), showedtwo clear simultaneous peaks [212, 158], which however appear in two dif-ferent energy bands (the lower peak is visible at low energies, i.e. E . 10keV, the higher peak at higher energies, i.e. E & 10 keV), while all theother systems only showed single peaks, which appear to move in frequencywith time [30]. A claim of two simultaneous HF QPOs from XTE J1550-564(with the lower one at a 2.3σ significance level [193]) was later shown to bean effect of averaging a large number of observations [139]. H1743-322 alsoshowed a significant HF QPO, and a weak tentative simultaneous peak thatmay correspond to a second HF QPO [78].
The fractional rms of a typical HF QPO is ∼ 0.5− 6% in the full RXTEband, increasing steeply with energy [29]. This energy dependence explainswhy RXTE was best suited for detecting HF QPOs, having a high effectivearea above ∼ 5 keV. In the case of GRS 1915+105, the HF QPO rms ampli-tude can reach ≈20% in the 20-40 keV energy band [152]. The typical qualityfactor is Q ∼ 5 and Q ∼ 10 for the lower and upper HF QPO, respectively.For the ∼ 67 Hz QPO, Q ∼ 20 typically, but covers a range Q ∼ 5− 30. Inboth GRO J1655-40 and H1743-322, the frequencies of the simultaneous HF
13

200 300 400 500 600 700 800Frequency (Hz)
1.84
1.86
1.88
1.9
1.92
1.94
Pow
er s
pect
ral d
ensi
ty
Figure 4: Left panels: examples of HF QPOs from BH XRBs (from GROJ1655-40, adaptedfrom [161]). The QPO at ≈500 Hz is detected in a harder energy band than that at ≈350Hz. Note that the power spectrum containing the ≈500 Hz QPO has been shifted upwardfor clarity. The red line marks the best fitting empirical model. Right panels: examples ofHF QPOs from NS XRBs (from Sco X-1). The two (strong) kHz QPOs are both detectedin the entire energy range (2-30 keV).
QPOs are close to being in a 3:2 ratio [212, 193, 191]. The same is true forthe two peaks reported for XTE J1550-564, but as stated above, these peaksare very likely not real simultaneous HF QPOs. This motivated a family ofmodels suggesting that these HF QPOs result from some kind of resonance[1]. However, since HF QPOs are very rare and only detected in a specificstate, this frequency ratio could well be a coincidence.
2.4. Neutron star systems
NS XRBs show states similar to those seen in BH systems except thephenomenology is somewhat more complex, presumably due to the solidsurface and anchored magnetic field [237]. State classification historicallyused a colour-colour diagram (CCD) [72] instead of an HID [237], with sourcesbeing classified as either Atoll or Z sources, based on the shape of the patterntraced by these systems in a CCD. Both Atoll and Z-sources show three mainstates that roughly correspond to the hard, intermediate and soft state seenin BH systems. In Atoll sources, the states are traditionally referred to asthe island, lower banana and upper banana branches, whereas in Z-sources
14

they are referred to as the horizontal, normal and flaring branches. A fewsources (e.g. XTE J1701-462 [119]), have shown full evolution between Z andAtoll like spectra. This clarified that the main difference between these twoclasses of sources is their average accretion rate, significantly higher in Z-sources than in Atoll sources. Recently, Munoz-Darias et al. [163] and Mottaet al. [162] showed that the spectral, timing and multi-wavelength propertiesof BH and NS systems are remarkably similar (see Fig 2, bottom). Theseauthors demonstrated that NS and BH systems cross three main accretionstates that can be determined purely by the fractional variability amplitude:hard state (rms& 20%), intermediate states (5% . rms . 20) and softstate (rms. 5%). The type of evolution of a NS or BH across states andtransitions appears to be mostly determined by the average accretion rateon the compact object, rather than by the nature of the compact objectitself. Below ∼50% LEdd (typical of Atoll sources and the majority of BHlow-mass XRBs) hysteresis is the natural form that state transitions take.Above ∼50% LEdd (typical of Z-sources and highly-accreting BHs, such asGRS 1915+105) hysteresis does not take place, and instead fast transitionsfrom and to the soft state occur at a roughly constant luminosity. Transientflaring behaviour is also observed in such sources, but the variability levelis typically quite low [163]. The main difference that remains between BHand NS low mass XRBs resides in the transition velocity between states: thefastest transitions are seen in Z-sources and the slowest in BH systems, andAtoll sources sit somewhere between the two.
Classification of LF QPOs in NS systems is more difficult than for BH sys-tems due to the somewhat richer phenomenology, but three main types of LFQPOs have been identified for Z-sources [237]: horizontal branch oscillations(HBOs), normal branch oscillations (NBOs) and flaring branch oscillations(FBOs). These are thought to correspond respectively to Type -C, -B and-A QPOs in BH systems (see Fig 1, right panels) [36, 162], partly becausethey occur when the source showing them is in the same region of the HID(see Fig 2, bottom right), and partly because HBOs follow the same correla-tion between QPO frequency and break frequency as BHs (see Fig 3). Mottaet al. [162] recently showed that the same classification can also be appliedto Atoll systems, which however do not appear to show NBO-like QPOs.
QPOs are also seen at high frequencies in NSs, where they are tradition-ally called kHz QPOs instead of HF QPOs. The first two sources in whichkHz QPO were detected were 4U 1728–34 and Sco X-1. Peaks at ≈700 Hzand ≈1100 Hz, apparently not directly connected with the NS spin period,
15

were detected in the power spectrum of these two systems [239, 216]. Sincethen, many kHz QPO detections have been made. These features are no-table for having a much larger amplitude and quality factor than HF QPOs,explaining why they are observed so much more commonly.
NS systems also display QPOs that do not have a BH equivalent. Someexamples are: (i) ∼1 Hz QPOs sometimes seen in dipping sources [102], (ii)hectohertz QPOs seen in Atoll sources [5], (iii) a ∼ 26 Hz QPO only seen inthe dipping flaring branch of Cyg X-2 [113].
2.5. mHz QPOs
In 2001, Revnivtsev et al. [194] reported the discovery of a new class oflow frequency quasi-periodic variations of the X-ray flux in three NS X-raybinaries (4U1608-52, 4U1636-536 and Aql X-1), which were later observedin more systems, [215, 227, 213, 136]. These QPOs are typically referredto as to mHz QPOs, named after the frequency range at which they appear.They exhibit properties that differ from other QPO types, in that they occuronly in a narrow range of X-ray luminosity, their fractional rms amplitudedecreases with energy and they disappear at the onset of thermonuclear (typeI) X-ray bursts [194]. Based on their observed properties, these QPOs aregenerally interpreted as a the result of a special regime of the nuclear burningon the NS surface, which generates a quasi-periodic flaring in the emissionfrom the surface.
Altamirano and Strohmayer [7] reported on the discovery of mHz QPOsin the a BH candidate H1743-322. Clearly, surface-bound processes shouldbe excluded in this source (unless it turns out to harbour a NS instead ofa BH). The authors suggested that these QPOs are not analogues of theNS mHz QPOs, but may instead be the BH equivalent of the so-called 1-Hz QPOs seen in dipping NS systems [102, 77] (except with a much lowercentroid frequency). This particular class of QPOs has only been reportedfor H 1743-322, but we note that most RXTE observations are fairly shortand, moreover, are typically analysed by averaging the power spectrum overmany even shorter (. 100s) segments. It is therefore entirely possible thatmany mHz QPOs are still to be found in the RXTE archive. Indeed, QPOswith frequency below the range typically associated with LF QPOs have beenreported for Cygnus X-1 [189] and V404 Cyg [81].
16

2.6. Other objects
2.6.1. AGN
QPOs are extremely common features in accreting BH X-ray binariesand, based on the scale-invariance of the accretion process, one may expectthat QPOs should be detected around the accreting super-massive (M ∼105−10 M) BHs powering active galactic nuclei (AGN). All timescales areexpected to scale with BH mass, and so any AGN QPOs are expected tobe at frequencies orders of magnitude lower than their X-ray binary coun-terparts. This makes them very difficult to detect with the comparativelyshort and irregularly spaced observations currently available. In particular,Vaughan and Uttley [245] showed that strong Type-C QPOs typical of BHX-ray binaries with their frequencies scaled to AGN BH masses would notbe detectable with existing AGN monitoring campaigns. It is therefore notsurprising that there have been very few convincing detections of AGN QPOsto date.
A number of early claims of AGN QPO detections were later disfavoured.Most commonly, the QPO is originally claimed to be highly statisticallysignificant, then a later re-analysis demonstrates that the inferred significancereduces dramatically when the broad band noise is (correctly) modelled asred noise instead of white noise (e.g. see discussion in [31]). Or in the caseof the Seyfert galaxy NGC 6814, a strong ∼ 12 ks periodicity reported byMittaz and Branduardi-Raymont [146] was later shown to originate fromanother (probably Galactic) source 37 arcmin from the AGN core [135]. Thefirst robust detection of a QPO in an AGN was a ∼1hr X-ray modulationfrom the Seyfert galaxy RE J1034+396 [67]. Alston et al. [2] later reportedon another detection of this ∼1 hr QPO in RE J1034+396, and Alston et al.[3] dicovered a ∼ 2 hr QPO in another AGN, MS 2254.93712. Both QPOsshow a relatively high amplitude (∼5-6%) and Q-factor (> 8), a soft lag atthe QPO frequency and a relatively hard spectrum (they are both detectedabove 1 keV). These QPOs have been suggested to be the AGN equivalent ofHF QPOs [142], but more detections are required before strong conclusionscan be made.
2.6.2. Ultra-luminous X-ray sources (ULXs)
ULXs have inferred intrinsic X-ray luminosities well above the Eddingtonlimit of a stellar-mass BH and are spatially resolved from the nucleus of theirhost galaxy. They were therefore long thought to be powered either by in-termediate mass (M ∼ 102−4 M) BHs accreting at sub-Eddington rates, or
17

stellar-mass BHs accreting at super-Eddington rates. mHz QPOs are oftendetected from ULXs (e.g. [165, 214]). It has been argued that these mHzQPOs are ULX analogues of Type-C QPOs, and thus that the QPO frequen-cies are ∼2 orders of magnitude lower because the BHs in ULXs are ∼ 2orders of magnitude heavier. Moreover, Pasham et al. [177] reported on thediscovery of a pair of 3:2 frequency ratio QPOs in the ULX M82 X-1, whichthey argued are the ULX analogue of HF QPOs. From this association, theyderived a BH mass of M ∼ 400 M. However, the field was dramaticallychanged by the discovery of pulsations from the ULX M82 X-2 [14]. A num-ber of subsequent detections of pulsations from other ULXs [61, 99, 100] haveconfirmed that at least a fraction of ULXs are powered by super-Eddingtonaccreting NSs and have cast doubt on the simple QPO mass scaling argu-ments for the intermediate mass BH hypothesis – particularly since M82X-2 itself appears to exhibit an ∼ 8 mHz QPO in its power-spectrum thatwas previously suggested to be a Type-C QPO analogue [33]. It thereforeseems more likely either that these mHz QPOs are simply analogues of themHz QPOs observed in Galactic XRBs, or are entirely another class of QPO,perhaps associated with super-Eddington accretion rates. As is the case forAGN QPOs, a larger number of detections is needed to allow any furtherprogress to be made in interpreting ULX QPOs.
3. What makes QPOs quasi-periodic?
We now delve into the detailed observational properties of LF QPOs inBH XRBs, asking the question: what makes them quasi-periodic as opposedto purely periodic?.
3.1. Frequency and amplitude modulation
First, let us discuss the effects that may make an oscillation quasi-periodicinstead of periodic. As a starting point, we can represent a QPO as a sumof two harmonic components:
f(t) = 1 + a1(t) sin[ϕ(t)] + a2(t) sin[2(ϕ(t)− ψ(t))]. (2)
Here, a1 and a2 are the amplitudes of the two harmonic components and theQPO phase is
ϕ(t) = ϕ0 + 2π
∫ t
0
νqpo(t′)dt′, (3)
18

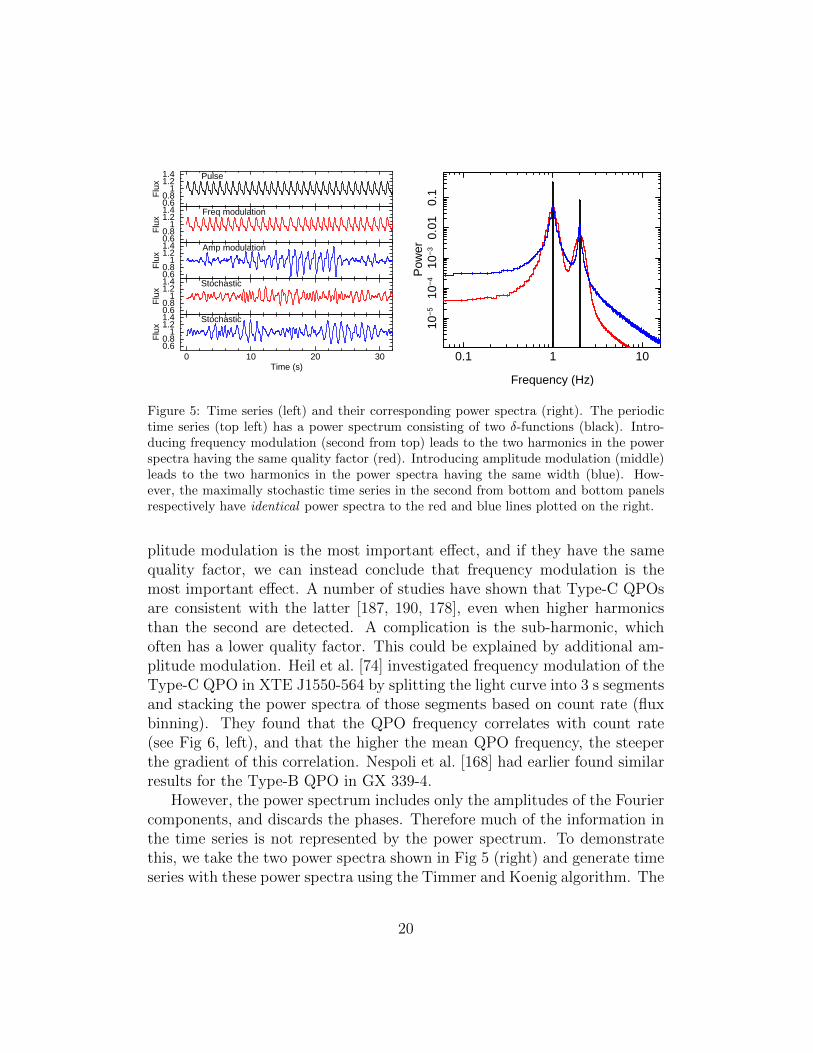
where ϕ0 is the QPO phase at t = 0, νqpo is the centroid frequency of thefundamental and ψ is the phase difference between the harmonics. For thesimplest case whereby the frequency, phase difference and amplitudes areconstant, we would have a purely periodic function, whose power spectrumwould be a sum of δ-functions (i.e. a pulsation). This case is demonstratedby the black lines in Fig 5, with the time series on the top left (ψ = 0.1π,a2 = a1/2) and the corresponding power spectrum on the right.
Now let us explore the effect of frequency modulation by allowing theQPO frequency to change with time. In order to generate a time series forνqpo(t) with the desired properties, we first model its power spectrum (us-ing fractional rms normalisation) as a Lorentzian function (Equation 1). Weuse ν0 = 0 (i.e. a zero-centered Lorentzian), a0 = 0.1 and ∆ = 0.1 Hz.We then use the algorithm of Timmer and Koenig [224] to generate a maxi-mally stochastic time series from this input power spectrum. Essentially, theFourier components of this time series have amplitudes corresponding to thetarget power spectrum and completely random phases (see e.g. [97] for an ex-panded discussion). The time series shown in the second panel from the topin Fig 5 (left) is calculated using this variable QPO frequency, with the am-plitudes of both harmonics held constant (i.e. pure frequency modulation).The corresponding power spectrum is plotted on the right (red). We see thatthe harmonic peaks now have a finite width, and that both harmonics havethe same fractional width (i.e. they have the same Q, and therefore appearto have the same width on a logarithmic scale). This happens because thecentroid frequency of the first and second harmonic at time t is respectivelyνqpo(t) and 2νqpo(t), and therefore the range of frequencies covered by thesecond harmonic is always twice that of the first.
We can instead explore the effect of amplitude modulation by holding theQPO frequency constant and allowing the harmonic amplitudes to vary. Weuse a Timmer and Koenig simulation to generate a time series for a1(t) froma zero-centered Lorentzian power spectrum with a0 = 0.9 and ∆ = 0.05 Hz,and set a2(t) = a1(t)/2. The resulting QPO time series is in the middle panelof Fig 5 (left), and the corresponding power spectrum is on the right (blue).This pure amplitude modulation gives the harmonic peaks the same absolutewidth as each other, which happens because each harmonic component ismultiplied by essentially the same stochastic time series.
Insight into the dominant de-cohering mechanism can therefore, in princi-ple, be gained by modelling observed power spectra with a multi-Lorentzianmodel. If the harmonics have the same width, ∆, we can conclude that am-
19
0.60.8
11.21.4
Flu
x
Pulse
0.60.8
11.21.4
Flu
x
Freq modulation
0.60.8
11.21.4
Flu
x
Amp modulation
0.60.8
11.21.4
Flu
x
Stochastic
0 10 20 300.60.8
11.21.4
Flu
x
Time (s)
Stochastic
0.1 1 10
10−
510
−4
10−
30.
010.
1P
ower
Frequency (Hz)
Figure 5: Time series (left) and their corresponding power spectra (right). The periodictime series (top left) has a power spectrum consisting of two δ-functions (black). Intro-ducing frequency modulation (second from top) leads to the two harmonics in the powerspectra having the same quality factor (red). Introducing amplitude modulation (middle)leads to the two harmonics in the power spectra having the same width (blue). How-ever, the maximally stochastic time series in the second from bottom and bottom panelsrespectively have identical power spectra to the red and blue lines plotted on the right.
plitude modulation is the most important effect, and if they have the samequality factor, we can instead conclude that frequency modulation is themost important effect. A number of studies have shown that Type-C QPOsare consistent with the latter [187, 190, 178], even when higher harmonicsthan the second are detected. A complication is the sub-harmonic, whichoften has a lower quality factor. This could be explained by additional am-plitude modulation. Heil et al. [74] investigated frequency modulation of theType-C QPO in XTE J1550-564 by splitting the light curve into 3 s segmentsand stacking the power spectra of those segments based on count rate (fluxbinning). They found that the QPO frequency correlates with count rate(see Fig 6, left), and that the higher the mean QPO frequency, the steeperthe gradient of this correlation. Nespoli et al. [168] had earlier found similarresults for the Type-B QPO in GX 339-4.
However, the power spectrum includes only the amplitudes of the Fouriercomponents, and discards the phases. Therefore much of the information inthe time series is not represented by the power spectrum. To demonstratethis, we take the two power spectra shown in Fig 5 (right) and generate timeseries with these power spectra using the Timmer and Koenig algorithm. The
20

Figure 6: Left: QPO frequency measured in 3 s segments plotted against the mean countrate of those segments (adapted from Heil et al. [74]). This demonstrates that shorttimescale fluctuations in the QPO frequency and mean count rate are correlated, with thegradient of the correlation increasing with mean QPO frequency (colour bar representsmean QPO frequency). Right: Raw (black) and optimally filtered (red) X-ray light curvefrom GRS 1915+105 (reproduced from van den Eijnden et al. [232]). The filtered lightcurve reveals ‘coherent intervals’, between which the QPO signal loses coherence. Bothplots are created with RXTE data.
resulting time series are shown in the bottom two panels of Fig 5 (left). Wesee that the red ‘stochastic’ time series (second from bottom) is dramaticallydifferent from the red ‘frequency modulation’ time series (second from top),yet they have identical power spectra to one another. Likewise, the blue‘stochastic’ time series is very different to the blue ‘amplitude modulation’time series (middle), eventhough the two have the same power spectrum.This demonstrates that the relative widths of the QPO harmonics in thepower spectrum do not uniquely determine the mechanism that makes theQPO quasi-periodic. For this information, we must use statistics more so-phisticated that the power spectrum that preserve phase. Fig 6 (right) showsa result from van den Eijnden et al. [232], who applied an optimal (Weiner)filter (see e.g [179]) to X-ray light curves from GRS 1915+105 in an attemptto isolate the Type-C QPO from the associated broad band noise. The blackline is the raw data, and the red line is the filtered data. We see both fre-quency and amplitude modulation. In particular, we see what were termedcoherent intervals whereby the QPO signal remains coherent for ∼ Q cycles,then loses coherence before the next coherent interval begins (there are ∼ 2.5coherent intervals in the plot). The amplitude reaches a minimum between
21

coherent intervals and a maximum in the middle of the intervals. Interest-ingly, van den Eijnden et al. [232] used the same filtering technique to studyobservations in which the QPO frequency depends on energy band to findthat during each coherent interval, the QPO phase of the energy band withhigher frequency accelerates ahead of the slower band, only for the phases toreset at the start of the next coherent interval. Evidence of these coherent in-tervals can also be found using wavelet transforms [115] or the Hilbert-Huangtransform [217].
3.2. QPO waveform
If we wish to measure the waveform of the QPO – the count rate as afunction of QPO phase (what pulsar astronomers would call the ‘pulse pro-file’) – we require more information than can be determined from the powerspectrum alone. In fact, from the power spectrum alone, we do not know ifa well defined QPO waveform even exists. The QPO could instead be purelystochastic noise with the variability amplitude peaking at harmonically re-lated frequencies – as is the case for the Timmer and Koenig simulationsplotted in the bottom two panels of Fig 5 (left). The difference betweenthese maximally stochastic time series and the other quasi-periodic time se-ries plotted in Fig 5 (left), that do have well defined waveforms, is that thephases of the QPO harmonic components are correlated with one another inthe latter case and not in the former case. We can think of this in termsof the phase difference between harmonics, ψ (see equation 2). ψ(t) varyingrandomly with a uniform distribution results in a maximally stochastic timeseries whereas ψ(t) varying around a well-defined mean value instead leadsto the harmonic components being correlated – in which case it makes senseto try to constrain a QPO waveform.
Ingram and van der Klis [94] investigated variations of this phase differ-ence between harmonics for two RXTE observations of Type-C QPOs in GRS1915+105. They split the X-ray light curves up into short segments (witheach segment containing ∼ Q QPO cycles) and for each segment calculatedψ from the Fourier transform of the light curve. Fig 7 (left) shows histogramsof these many measurements of ψ for the two observations, which have QPOfundamental frequencies of ∼ 0.5 Hz (obs 1, black) and ∼ 2.25 Hz (obs 2,red). We see that these histograms each have a very clear peak, meaning thatψ(t) does indeed vary around a well-defined mean value. The mean value ofψ for each observation can be measured by determining the peak of the cor-responding histogram, and an ‘average’ QPO waveform can be reconstructed
22

0 0.5 1 1.5 2
0.5
1N
o of
seg
men
ts (
norm
alis
ed)
ψ / π
Obs 1 Obs 2
0 0.5 1 1.5 2
3000
4000
5000
Cou
nts/
s
Phase (QPO cycles)
Obs 1
Obs 2
Figure 7: Left: Distribution of the phase difference between the first and second QPOharmonics, ψ, for two RXTE observations of GRS 1915+105. Observations 1 (black) and2 (red) have QPO frequencies νqpo ∼ 0.5 Hz and νqpo ∼ 2.25 Hz respectively. We see thatψ, which is defined on the interval 0 → π, varies around a well-defined mean (ψ ≈ 0.67πand ψ ≈ 0.13π for obs 1 and 2 respectively). Right: QPO waveforms reconstructed usingthe measured ψ values. Both plots are reproduced from Ingram and van der Klis [94]
from combining this with measurements of the harmonic amplitudes (whichcan be determined from the power spectrum). Fig 7 (right) shows the wave-forms re-constructed for the same two observations of GRS 1915+105. QPOwaveforms can alternatively be constrained using phase-folding algorithms.Tomsick and Kaaret [226] filtered RXTE light curves of GRS 1915+105 inorder to isolate the QPO from the broadband noise (similar to our Fig 6,right). They then defined peaks in the filtered light curve as zero points ofQPO phase in order to phase fold. That their results are similar to those ofIngram and van der Klis [94] provides confidence in the reconstruction tech-nique. It also, in hindsight, tells us that we already knew in 2001 that thephase difference between harmonics varies around a well-defined mean. Thisis because the Tomsick and Kaaret [226] algorithm tracks the phase of theQPO fundamental, which would be uncorrelated with the phase of the secondharmonic if ψ(t) followed a uniform distribution. This would have resultedin the Tomsick and Kaaret [226] waveforms all being purely sinusoidal dueto the second harmonic component cancelling completely in the phase-foldedwaveforms. Therefore, the very fact that the Tomsick and Kaaret [226] wave-forms have harmonic content shows that ψ is not uniformly random. If ψwere constant, then the amplitude of the second harmonic in the phase-folded
23

0.1
0.05
0.2
V
Obs 1
0.1 1 10
0.1
0.02
0.05
0.2
V
Frequency (Hz)
Obs 2
Figure 8: Kuiper’s statistic V , which is a measure of phase correlation between the Fouriercomponent at a given frequency and twice that frequency, plotted against the lower fre-quency of the pair for the two GRS 1915+105 observations featured in Fig 7. The ψdistribution is 3σ inconsistent with uniform for V above the green line. We see thatthe phases of the QPO harmonics couple strongly to each other, in contrast to pairs ofbroadband noise frequencies. Reproduced from Ingram and van der Klis [94].
waveform would be the same as that in the Fourier reconstructed waveform.Instead, ψ(t) varies around a mean value, meaning that the phase-foldingmethod always predicts smaller second harmonic amplitudes than the recon-struction method due to destructive interference. Furthermore, any error inassigning instantaneous QPO phase leads to a reduction of the overall ampli-tude of the phase-folded waveform for exactly the same reason. This providesa good test of any phase-folding algorithm: if the QPO waveform ends upwith a very small amplitude, as would be the case if one simply folded on aconstant QPO period, one can conclude that the algorithm has not worked,and that the results have little meaning.
Ingram and van der Klis [94] further investigated the GRS 1915+105 databy measuring the phase difference between the Fourier components at eachfrequency ν and at 2ν. For each frequency pair, they calculated Kuiper’sstatistic, V , to determine whether or not the distribution of ψ is consistentwith a uniform distribution (high V means the distribution is not consis-tent with uniform). Fig 8 shows Kuiper’s statistic plotted against ν for the
24

two GRS 1915+105 observations featured in the previous figure. Values of Vabove the green line correspond to a non-uniform distribution with > 3σ con-fidence. The peaks at the QPO fundamental frequency (∼ 0.5 Hz and ∼ 2.25Hz for obs 1 and 2 respectively) indicate coupling between the first and sec-ond harmonics, and the peaks at twice and thrice the QPO fundamental inthe bottom plot indicate respectively coupling between the second and fourthharmonics and the third and sixth harmonics! The peak at half the QPOfrequency for observation 1 indicates coupling between the sub-harmonic andthe fundamental, and the peak at a third of the QPO frequency in observa-tion 2 turns out to indicate coupling between the QPO and the broadbandnoise (see the following section). The other feature of note in Fig 5 is thedifference between the QPO and the broadband noise: there is no evidenceof strong phase coupling between pairs of frequencies both dominated by thebroadband noise (although we will see in the next sub-section that there aresome weak correlations).
Recently, de Ruiter et al. [43] measured ψ for many observations of QPOsin the RXTE archive. They found that ψ is always measured to vary arounda well defined mean whenever the data are good enough to do so. Fig 9shows their measurements of ψ plotted against QPO frequency for manyobservations of Type-C QPOs, with the coloured points in the left and rightpanels corresponding respectively to low (i.e. the binary system is viewedmore face-on) and high (i.e. the binary system is viewed more edge-on)inclination sources. We see that ψ generally reduces from ∼ 0.4π to ∼ 0as the QPO frequency evolves from ∼ 0.1 to ∼ 10 Hz, with seemingly lessscatter for the high inclination sources. This confirms the hints from Fig7 that the waveform evolves systematically with QPO frequency (see theexample waveforms for different values of ψ to the left of Fig 9). de Ruiteret al. [43] also found that Type-B QPOs have well defined waveforms, andthat the measured ψ value evolves with QPO frequency in a manner thatdiffers from the Type-C case (see their Fig 6). This implies that these twoQPO types have a genuinely different origin, with the difference between thetwo being more than simply the associated broadband noise.
3.3. The bi-spectrum: coupling of the QPO and broadband noise
Further insight can be gained from the bi-spectrum, which is defined as
B(νj, νk) = 〈X(νj)X(νk)X∗(νj+k)〉, (4)
25

Figure 9: Phase difference between QPO harmonics, ψ, plotted against QPO fundamentalfrequency for many RTXE observations of Type-C QPOs. The coloured points on theleft and right panels correspond respectively to low and high inclination sources (sourcesas labelled), and the grey points correspond to the coloured points from the other plot.Examples of QPO waveforms for given values of ψ are displayed on the left. Reproducedfrom de Ruiter et al. [43].
where X(νj) is the jth frequency of the Fourier transform of the X-ray lightcurve [110, 133], and the averaging indicated by the angle brackets is overdifferent light curve segments. Essentially, the bi-spectrum describes thecorrelations between the phases of Fourier components at three frequencies:νj, νk and νj+k, and is only defined for νj+k less than the Nyquist frequency(and only non-trivially defined for νj < νk). The bi-spectrum informs onhow well correlated the square of a time series is with the time series itself.Defining z(tk) = x2(tk), it can be shown using the convolution theorem that
〈X(νj)Z∗(νj)〉 =
N/2∑k=−N/2+1
B(νj, νk), (5)
where N is the number of time intervals in a light curve segment. Thereforea time series with zero bi-spectrum – as is generated by the Timmer andKoenig [224] algorithm – is uncorrelated with its own square. It is possibleto simulate a time series with a specified bi-spectrum using the algorithm ofVanhoff and Elgar [242], which was developed for the application of modellingwaves in shallow water.
26

Cross
Frequency j (Hz)
Freq
uenc
y k
(Hz)
Hypotenuse
Frequency j (Hz)Fr
eque
ncy
k (H
z)
Figure 10: Two examples of the bi-coherence of GRS 1915+105, adapted from Maccaroneet al. [133]. In general, three patterns are observed: the ‘cross’ pattern (left), the ‘hy-potenuse pattern’ (right), and the ‘web’ pattern is a combination of the cross and thehypotenuse. The dashed lines mark νj = 2νk.
It is convenient to define the squared bi-coherence
b2(νj, νk) =|B(νj, νk)|2
〈|X(νj)X(νk)|2〉〈|X(νj+k)|2〉, (6)
which can take values between b2 = 0 and b2 = 1 [110]. Fig 10 showssome contour plots of the bi-coherence of GRS 1915+105, reproduced fromMaccarone et al. [133]. They identified characteristic patterns displayed byType-C QPOs in the source: the ‘cross’ pattern (left), the ‘hypotenuse’ pat-tern (right), and the ‘web’ pattern, which is a combination of the other two.The pattern exhibited by the source was found to correlate with the ra-dio brightness and the QPO frequency. Recently, Arur and Maccarone [10]conducted a systematic analysis of GX 339-4 to find that the bi-spectrumtransitions smoothly from the web to the hypotenuse pattern as the Type-CQPO frequency increases (no observations displayed the cross pattern for GX339-4). Type-B QPOs only have bi-coherence peaks at νj = νk = νqpo, andType-A QPOs have low bi-coherence. The peaks at combinations of QPOharmonics indicate phase coupling between QPO harmonics, whereas thediagonal line of raised bi-coherence in the hypotenuse pattern indicates cou-pling between the QPO and the broadband noise. The broadband noise itself
27

has a non-zero bi-coherence, albeit more than an order of magnitude lowerthan that of the QPO [231]. This is expected, since the broadband noise isnot Gaussian distributed, but log-normal distributed, which naturally arisesfrom propagation of fluctuations in mass accretion rate [231].
The dashed line along νk = 2νj enables us to compare these bi-coherenceplots with the Kuiper’s statistic plot in Fig 8 if we read the frequency inFig 8 as νj. This is because high bi-coherence roughly corresponds to largeV . We see that the cross pattern along the dashed line consists of peaks atνj = νqpo/2 and νj = νqpo as is seen for observation 1 in Fig 8, whereas thehypotenuse pattern along this line instead consists of a peak at νj = νqpo/3.Since observation 2 in Fig 8 includes such a peak at νj = νqpo/3 in additionto peaks at each QPO harmonic frequency, we can conclude that observation2 from Ingram and van der Klis [94] corresponds to a web pattern, andobservation 1 to a cross pattern. From this comparison, we can make twoinsights that were not appreciated by Ingram and van der Klis [94] at thetime: i) the peak at half the QPO frequency for observation 1 corresponds tothe νk = νqpo line in the cross pattern of the bi-coherence, and ii) the peak at athird of the QPO frequency in observation 2 indicates phase coupling betweenthe QPO and the broadband noise. It is still rather unclear quite whatthis non-linear interaction between the QPO and broadband noise is, butsome simple models are explored and discussed in [133] and [10]. The phasedifference between harmonics, ψ, can also be related to the bi-spectrum,through the bi-phase [132]. Indeed, Arur and Maccarone [10] recently showdthat the bi-spectrum can be used to reconstruct the QPO waveform.
4. Lense-Thirring precession and disc theory
Before exploring specific models for LF QPOs in the following section, wewill first lay some important theoretical foundations. Many of the modelsin the literature consider the relativistic effect of Lense-Thirring precession,and so we take some time to introduce the concept in this section. As we willsee, Lense-Thirring precession can greatly affect the dynamics of accretiondiscs that are initially misaligned with the equatorial plane of a spinningBH. Here, we briefly summarise the analytic theory for such tilted discs andcompare with the results of recent numerical simulations. Hereafter, we willemploy the convention whereby lower case r is radius expressed in units of agravitational radius Rg = GM/c2, such that r = R/Rg (where M , G and c
28

are respectively BH mass, Newton’s gravitational constant and the speed oflight in a vacuum).
4.1. Test mass frequencies
For a test mass orbiting a spinning BH in a nearly circular orbit slightlyperturbed from the BH equatorial plane, the orbital, radial and verticalepicyclic angular frequencies in the Kerr metric are [20, 140]
Ωφ = ± c
Rg
1
r3/2 ± a
Ωr = Ωφ
√1− 6
r± 8a
r3/2− 3a2
r2
Ωz = Ωφ
√1∓ 4a
r3/2+
3a2
r2,
(7)
where a = JBH/(McRg) is the dimensionless spin parameter, JBH is theangular momentum of the hole and top and bottom signs represent pro-and retro-grade spin respectively. The corresponding frequencies in units ofcycles per unit time are νφ,r,z = Ωφ,r,z/(2π). In Newtonian gravity, all three ofthese frequencies are always equal, meaning that orbits always close. In theKerr metric, however, the inequality between the orbital and radial epicyclicfrequencies leads to periastron precession. This is a rotation of the semi-major axis of an orbit with angular frequency Ωper = Ωφ − Ωr. At the timeof Einstein proposing GR, periastron precession had already been observed,and had remained unexplained for more than 50 years, in Mercury’s orbitaround the Sun.
The inequality between the orbital and vertical epicyclic frequencies leadsto Lense-Thirring precession. This is a nodal precession (i.e. a verticalwobble) of orbits misaligned with the BH equatorial plane, with angularfrequency ΩLT = Ωφ − Ωz. It results from the frame dragging effect, whichis the dragging of inertial frames about the BH spin axis. Lense-Thirringprecession is named after the authors who first derived the effect, althoughthe Lense and Thirring [116] expression for the frequency was derived in theweak field limit (a/r 1), this being decades before the derivation of theKerr metric [109]. Their expression
ΩLT ≈ ±c
Rg
2a
r3, (8)
29
can be derived from equations 7 via a first order Taylor expansion. Thehierarchy of the precession frequencies is Ωφ > Ωper > ΩLT.
4.2. The diffusive and wave-like regimes
If a disc is initially tilted with respect to the equatorial plane of a spin-ning BH, it will be warped by the differential nature of the Lense-Thirringprecession frequency. The response of the disc to this turns out to depend onwhether the Shakura and Sunyaev [201] dimensionless viscosity parameter αis greater than or less than the disc scale height H/R. For α > H/R, thewarp is communicated by viscosity (the diffusive regime) and for α < H/R,the warp is instead communicated by pressure waves (the wave-like regime).Here we will take some time to understand what these two regimes are andwhere this comparison between α and H/R comes from. We can start bysplitting the disc into rings and representing the angular momentum per unitsurface area of a ring as the vector
L = ΣR2Ωφl = ΣR2Ωφ(cos γ sin β, sin γ sin β, cos β). (9)
Here, Σ is the surface density (the mass density integrated over the discheight), the z-axis k aligns with the BH spin axis, β is the (polar) tilt angleand γ is the (azimuthal) twist angle. We take a hat to denote a unit vectorthroughout. We see that a disc is respectively misaligned, warped and twistedif β 6= 0, ∂β/dR 6= 0 and ∂γ/dR 6= 0. Warps are communicated via theinternal torque, G = R×F, where F is the shear force acting at the boundarybetween the rings (see equations 1-4 in [170]) caused by the rings moving pastone another in the locally azimuthal direction due to differential rotation andin the locally vertical direction due to differential nodal precession.
In the diffusive regime, mass is assumed to pass between rings only viathe boundaries between them. Pringle [180] showed that mass conservationgives
∂Σ
∂t+
1
R
∂
∂R(ΣRvR) = 0, (10)
which turns out to be the same as for a planar disc [60], and angular mo-mentum conservation gives
∂L
∂t=
1
R
∂
∂R(vRRL) =
1
2πR
∂G
∂R−(
Ω2φ − Ω2
z
2Ωφ
)k× L, (11)
where vR is radial velocity and the final term of equation 11 describes thewarp forced by differential Lense-Thirring precession. These equations can
30

Figure 11: Illustration of how a misalignment between two disc rings turns a verticalpressure gradient into an oscillating radial pressure gradient. Reproduced from Nixon andKing [169].
be solved by defining kinematic viscosity in the azimuthal and vertical di-rections, ν1 and ν2. Using the α prescription of Shakura and Sunyaev [201],we can set ν1 = αcsH, where cs is the sound speed. Papaloizou and Pringle[175] and Ogilvie [172] found that ν2 = csH/(2α), and so the internal torquein each direction can be calculated for a given value of α (see e.g. equations21-23 in [169]). Solving equations 10 and 11 then indicates that β(R) tendsto the initial tilt angle β = β0 for large R and to β = 0 at small R, withthe two regimes connected by a smooth warp (also see [38, 18]). This resultwas first derived by Bardeen and Petterson [19], and therefore such a setupis often called the Bardeen-Patterson configuration. We note, however, thattheir equations did not conserve angular momentum, but the result still heldup to subsequent, more sophisticated treatments [175, 180].
In the opposite, wave-like regime, the linearized equation for angular mo-mentum conservation is essentially the same as the diffusive regime (equation11), whereas the internal torque obeys [126, 127, 169]
∂G
∂t+ αΩφG =
(Ω2φ − Ω2
r
2Ωφ
)l×G + Σ R3 Ω2
z
Ωφ
c2s4
∂ l
∂R. (12)
31

We can understand that these two equations have wave-like solutions for l,therefore explaining the name ‘wave-like regime’, by exploring the invicid(α = 0), Keplerian (Ωφ = Ωr = Ωz) limit. In this case, equations (11) and(12) can be combined to find
∂ 2l
∂t2=
1
RL
∂
∂R
(RL
c2s4
∂ l
∂R
). (13)
Making a final illustrative assumption that RLc2s is independent of R, we seethat the above equation reduces to a classical wave equation with velocitycs/2. We therefore see that a warp in an invicid disc launches a pressurewave with speed cs/2. This is called a bending wave, since it describes thedisc shape.
This can be understood physically as warps in the thick disc launchingpressure waves (note that the final term in equation 12 is related to thevertically integrated pressure: Σc2s[Ωz/Ωφ]2 [127]). Fig 11 illustrates that amisalignment between two rings lines up the high pressure mid-plane of onering with the lower pressure atmosphere of its neighbour, creating a radialpressure gradient from the existing vertical pressure gradient. An orbiting gasparcel will therefore experience an oscillating pressure gradient, launching apressure wave in the disc. The wavelength of the pressure wave in the invicid,Keplerian limit is approximately [127]
λbw ≈π(H/R)
(6a)1/2R9/4. (14)
Since the bending wave wavelength is a fairly strong function of R, the stablewarp, β(R) ∼ sin β(R) ∝ sinλbw(R) is smooth far from the BH and oscil-latory close to the BH. These oscillations at small R are referred to in theliterature as radial tilt oscillations [101, 127].
In a more realistic α > 0 limit, the αΩφG term in equation 12 introducesan exponential damping of the bending waves, on a characteristic timescaletdamp ∼ 1/(αΩφ) [182]. The waves therefore travel a typical distance ldamp ∼cs tdamp = H/α (since cs = ΩφH for a disc in vertical hydrostatic equilibrium)before they are damped by viscosity. If ldamp . R, we can conclude that weare in the diffusive regime rather than a wave-like regime, since viscositydamps out the waves and governs the disc dynamics. Therefore, the diffusiveregime is characterised by H/R . α and the wave-like regime by H/R & α.
32

4.3. Solid body precession
In the wave-like regime, solutions corresponding to solid-body precessionare possible. That is, Ωφ(R) is still given by Equation (7), β(R) is indepen-dent of time and γ(R, t) = Ωprec t + γ0(R). We can calculate the angularfrequency of solid body precession, Ωprec, from the total angular momentumof the disc Jdisc and the Lense-Thirring torque on the total disc TLT, whichare related as TLT = Ωprec×Jdisc. Thus Ωprec = TLT/(sin β0Jdisc), where β0 isthe angle between Jdisc and BH spin axis. The angular momentum and torqueacting on a disc annulus are respectively dJdisc(R) = L(R) 2πR l(R) dR anddTLT(R) = ΩLT(R) × dJdisc(R). For a disc that is not too strongly warped(β(R) ∼ β0), we can set |k × l| = sin β0 and integrate over all disc radii toget
Ωprec =
∫ Rout
RinΩLT(R) L(R) R dR∫ Rout
RinL(R) R dR
. (15)
This equation holds for an arbitrary disc twist, as long as that twist is frozenin time. Using the weak field formula for ΩLT (equation 8) and specifyingΣ(r) ∝ r−ζ then gives [124, 55, 90]
νprec ≈(5− 2ζ)
π(1 + 2ζ)
a[1− (rin/rout)
1/2+ζ]
r5/2−ζout r
1/2+ζin [1− (rin/rout)5/2−ζ ]
c
Rg
. (16)
A more correct description can of course be obtained by using the moreaccurate formula for ΩLT (equations 7) and integrating numerically (e.g. [87,88, 188]), or using a polynomial approximation [42]. Further accuracy canbe achieved if the radial profile of the tilt angle is known.
4.4. Numerical simulations
Qualitatively, the predictions of analytic theory have been reproduced bynumerical simulations. Smoothed particle hydrodynamics (SPH) simulationsconsider many particles interacting in an effective potential, but still rely onan input viscosity prescription (i.e. values of ν1 and ν2). GR magneto-hydrodynamics (GRMHD) simulations instead solve the MHD equations ona grid given an initial configuration of mass and magnetic field density. Themagneto-rotational instability [17], which forms due to the tangling of mag-netic field lines by differential rotation, takes the place of a viscosity pre-scription. Such grid-based simulations therefore provide the best tests foranalytic theory.
33

Figure 12: Volume rendering of density (blue/green) and magnetic energy density (yel-low/red) for one of the thick disc GRMHD simulations ran by Liska et al. [120] (reproducedfrom said paper) at two times (as labelled; tg = Rg/c). We see precession of both thickdisc (blue/green) and jet (yellow/red).
Figure 13: Vertical slices through the grid of thin tilted disc GRMHD simulations, repro-duced from Liska et al. [122]. Parameters are: H/R = 0.015, β0 = 45 (left); H/R = 0.03,β0 = 45 (center); H/R = 0.03, β0 = 65 (right). The tilt transitions sharply (disc break-ing) at rbp ∼ 10 (left) and rbp ∼ 5 (centre), and the inner disc tears for the highest initialtilt (right).
34

Thick discs (H/R > α) were the first to be explored globally in GRMHD,being the least computationally expensive due to the comparatively few totalcells required to properly resolve their scale height. Fragile et al. [55] foundthat such a thick disc with an initial tilt angle of β0 = 15 did indeed undergosolid-body precession as predicted by the analytic theory, at a precessionfrequency consistent with Equation (16). Recently Liska et al. [120] repeatedthis setup, but were able to achieve higher resolution, particularly aroundthe poles of the grid. This enabled them to resolve jets, which they found toprecess with the thick disc (see Fig 12).
Thin discs (H/R < α) are rather harder to resolve in GRMHD, and sofor a long time the Bardeen-Petterson configuration could only be studiedin SPH (e.g. [167, 166]). Liska et al. [123] recently achieved the requiredresolution for the first time to find that an H/R = 0.03, β0 = 10 disc aroundan a = 0.9375 BH forms a Bardeen-Petterson configuration with transitionradius rbp ∼ 5, which is smaller than expected from analytic theory (e.g.[112]). For very large β0 and/or very small H/R, the smooth transitionof the Bardeen-Petterson configuration is predicted to become rather sharp(disc breaking [125]), or even separate into discrete, individually precessingrings (disc tearing [170]). Nixon et al. [170] estimated that the disc tears atradius
rtear .
(4
3| sin β0|
a
αH/R
)2/3
, (17)
and demonstrated that breaking and tearing occur in SPH simulations. Liskaet al. [122] recently confirmed that this also happens in GRMHD (see Fig13).
5. Models for low frequency QPOs
Many models have been proposed for LF QPOs, ranging from well-developedtheories that have been confronted with the data to ideas briefly discussedin one or a few papers. In this section, we describe in detail the models thatfeature prominently in the literature and also summarise some other modelsthat have received less attention. A high fraction of the models assume atruncated disc / hot inner flow geometry, whereby the thin disc truncates atsome radius larger than the ISCO and the accretion flow inside of this takesthe form of a hot, large scale height accretion flow (see Fig 14c) that playsthe role of the X-ray corona. Wherever this geometry is assumed we willrefer to the inner radius of the flow as ri and the transition radius between
35

disc and flow as rtr. All of these models were proposed to explain Type-CQPOs, although we note that they could all equally be candidates to explainType-B QPOs. We have attempted to make this review of models fairlycomprehensive, but fear that the shear size of the literature likely preventsthis from being a completely exhaustive summary.
5.1. The relativistic precession model
The relativistic precession model (RPM) [208, 209] is perhaps the simplestof all the models. The LF QPO fundamental frequency is simply assumedto be the Lense-Thirring precession frequency at some characteristic radius,perhaps the disc truncation radius. Moreover, the lower and upper HF QPOsare postulated to be associated respectively with periastron precession andorbital motion. The model was originally proposed to explain the LF QPOsand pair of kHz QPOs observed from NSs [208], but was soon after extendedto BH QPOs [209]. These frequencies of geodesic motion may modulate theX-ray flux if there are extended bright clumps of material all located at thesame radius of the accretion disc on slightly elliptical orbits (to ensure peri-astron precession) that are slightly titled with respect to the BH equatorialplane (to ensure Lense-Thirring precession). The flux would then be mod-ulated through relativistic Doppler boosting [16]. It is plausible that suchhot spots would form at the truncation radius, where turbulence is likelygenerated. As the truncation radius moves inwards and the spectrum conse-quently softens, all geodesic frequencies increase, reproducing the observedevolution of QPO frequency.
An extension to this model was proposed by Schnittman et al. [199], whoconsidered a precessing ring. Another mechanism for modulating the fluxwith the Lense-Thirring precession and orbital frequencies was suggested byPsaltis and Norman [184]. This model considers a disc with some narrowtransition radius (δr/r ∼ 0.01), perhaps coinciding with an abrupt changein disc properties (again, perhaps the truncation radius). A white noiseof driving density perturbations are assumed to originate from outside thetransition region, and the response of the disc in the transition region tothese perturbations is calculated. The output power spectrum includes azero-centered Lorentzian with HWHM ∼ (δr/r)νvisc (where νvisc is the vis-cous frequency [60]), and narrow peaks at the orbital and Lense-Thirringprecession frequencies of the transition region. The latter peak describes aprecessing, one-armed azimuthal density perturbation with a vertical tilt,similar to the precessing ring model of Schnittman et al. [199].
36

a b
c d
Figure 14: Schematic illustration of the precessing inner flow model. The disc (orange)remains stationary, whilst the inner flow (blue torus) and the jet precess around the BHspin axis (which is pointing upwards and slightly towards the observer in this example).Here, precession and disc rotation are both anti-clockwise. Adapted from an animationmade by ICRAR in association with [144] (the original movie can be found at https:
//vimeo.com/332582739).
5.2. The precessing inner flow model
The model of Ingram et al. [90], which assumes a truncated disc / hotinner flow geometry, is illustrated in Fig 14. The BH spin axis is assumedto be moderately misaligned with the rotational axis of the binary system(∼ 10 − 15). In the soft state, the thin disc is in a Bardeen-Pettersonconfiguration, but in the hard state the disc is assumed to be truncatedoutside of the Bardeen-Petterson transition radius, meaning that the discfeeds misaligned material to the inner flow. This then causes the entire innerflow to precess, as is discussed in Section 4.3, as well as the base of the jet[120].
As illustrated in Fig 14, the flow precesses around the BH spin axis suchthat the misalignment angle between the flow and BH spin, β, remains con-stant. Because the disc is stationary and misaligned with the spin axis bythe same angle β, the angle between the disc and flow rotation axes variesover each precession cycle between 0 (panel c) and 2β (panel a). Therefore
37

viewers at different azimuths will see different things. For the reader, maxi-mum misalignment in Fig 14 (panel a) occurs when the flow faces maximallytowards us, but the flow would face maximally away from an observer posi-tioned behind the page at maximum misalignment. The X-ray flux is thenmodulated by a combination of effects. The most obvious are Doppler boost-ing and projected area effects. Maximal Doppler boosting occurs when theflow is viewed most edge-on, since blue shifts from the approaching materialdominate over red shifts from receding material. The projected area, on theother hand, is largest when the flow is viewed most face-on. The predictedflux as a function of precession phase is therefore a trade-off between thesetwo considerations [247, 91]. It is also important to consider the angulardependence of Compton scattering, which is not isotropic for a non-sphericalscattering medium such as the inner flow [218]. Finally, the intrinsic lumi-nosity and temperature of the inner flow should vary with precession phaseas the angle between disc and flow varies and consequently so too does theluminosity of disc photons irradiating the flow [256, 254].
Ingram et al. [90] showed that the spin dependence of the flow preces-sion frequency is partially cancelled out by the expected spin dependence ofthe surface density profile, Σ(r). Analytic theory and GRMHD simulationspredict that Σ is ∼constant outside of the so-called bending wave radius butdrops-off steeply inside of this in the region dominated by radial tilt oscilla-tions [55, 54]. The bending wave radius can be estimated as the largest radiuswhere the bending waves turn over, rbw ∼ λbw(rbw)/4, giving (from Equa-tion 14) rbw ≈ 2.5(h/r)−4/5a2/5. The increase of this radius with increasingspin can explain why different sources display similar (but not identical; e.g.[202]) evolution in QPO frequency [211, 59] without having to make the un-comfortably fine-tuned assumption that all BH XRBs have the same spin.The highest possible precession frequency, on the other hand, should dependon BH spin, since this is when the truncation radius is only just larger thanthe ISCO (and therefore smaller than rbw), and the highest observed QPOfrequency does indeed vary from one object to the other [158, 93, 59].
The dependence of the precession frequency on the surface density profilealso provides a natural explanation for the observed short term variationsin QPO frequency (see Section 3.1) if the broad band noise is assumed tooriginate from propagating fluctuations of the mass accretion rate in theinner flow [129, 8, 87]. This is because a local increase in accretion rate willcause a local over-density in the surface density. Over-densities in the inner /outer regions of the flow will speed up / slow down precession, and increases
38

in the accretion rate close to the hole will lead to greater increases in X-rayflux than those far from the hole due to the centrally peaked gravitationalemissivity [87]. Therefore, the precession model predicts the short timescalecorrelations between QPO frequency and X-ray flux seen by Heil et al. [74](see Fig 6, left).
This model makes a number of testable predictions, most notably regard-ing the reflection signature. First of all, the changing angle between disc andflow should result in the reflection fraction changing over the course of eachprecession cycle. Most characteristically, the inner flow will predominantlyilluminate different disc azimuths as it goes through each precession cycle,meaning that the iron line should be blue shifted when the flow shines onthe approaching disc material (panel d) and red shifted when the flow shineson the receding disc material (panel b) [199, 89]. Fragile et al. [57] extendedthis model to also attribute HF QPOs to the breathing mode and verticalepicyclic frequency of the inner flow. The model has also been considered asa basis to interpret multi-wavelength observations of QPOs. Kalamkar et al.[103] suggested that the IR QPO they detected from GX 339-4 is due to jetprecession. Veledina et al. [247] modelled optical QPOs by considering opti-cal photons produced in the inner precessing flow by the cyclo-synchrotronprocess, and Veledina and Poutanen [246] instead considered reprocessing ofX-ray photons from a precessing inner flow into optical photons by the outeraccretion disc.
5.3. Corrugation modes
Corrugation modes (c modes) are transverse standing waves in the discheight with some resonant angular frequency ωc, that are trapped in a regionbetween the disc inner radius rin and another radius called the inner verticalresonance (IVR) rivr, and excited by perturbations in an intrinsic disc quan-tity such as density (e.g. [108, 249, 106]). Visualisations of such oscillationscan be found in Fig 2 of Tsang and Butsky [228]. The study of c modesis part of the wider field of discoseismology, which encapsulates a numberof different modes of oscillation (e.g. gravity modes, pressure modes). Thec modes are the discoseismic mode with resonant frequencies in the regionof the observed LF QPO frequencies (gravity modes and pressure modesoscillate at higher frequencies). The resonant frequency is
ωc = mΩφ(rivr)− j1/2Ωz(rivr), (18)
39

where m and j are integers,
rivr = rin + C(a−1/3 − 1), (19)
and the constant C depends on the sound speed in the disc (typical valueC = 0.17; [249]). We see from equation (18) that, in the case of j = m = 1,the resonant frequency is nothing other than the Lense-Thirring precessionfrequency at the IVR, ωc = Ωφ(rivr) − Ωz(rivr), making this essentially yetanother model that associates the LF QPO with Lense-Thirring precession.The resonant frequency is therefore set by the mass and spin of the hole, thesound speed and the disc inner radius. The model can therefore reproducethe observed changes in LF QPO frequency if the disc inner radius movestowards the hole as the QPO frequency is observed to increase (changes inQPO frequency can also be driven, to a lesser extent, by changes in the soundspeed).
In order to understand the origin of the standing wave, let us explore theresult of introducing a plane wave perturbation in the disc density with angu-lar frequency ω. This causes a plane wave in the disc height with dispersionrelation [229, 173]
c2sk2 =
(Ω2r − ω2)(jΩ2
z − ω2)
ω2, (20)
where ω ≡ ω −mΩφ, and k = 2π/λ is the radial wave number. Waves canonly propagate in regions of the disc for which the RHS of equation (20) is> 0, thus in the regions where the following conditions are fulfilled
ω2 < Ω2r < jΩ2
z (21)
ω2 > jΩ2z > Ω2
r. (22)
The latter of these two expressions (equation 22) corresponds to the propa-gation region of c modes (the former corresponds to gravity modes), whichextends from rin out to rivr, defined as ω(rivr) = −j1/2Ωz(rivr). It is thereforepossible for a wave with angular frequency ω to propagate in the region rinto rivr. If these two boundaries are reflective (see [229]), then a standingwave trapped in the region rin to rivr will result only for eigen-frequencies,ωc, that correspond to waves with an integer number of nodes in the region.Therefore, similarly to the Psaltis and Norman [184] model, a white noise ofinput perturbations will result in the excitation of resonant modes.
40
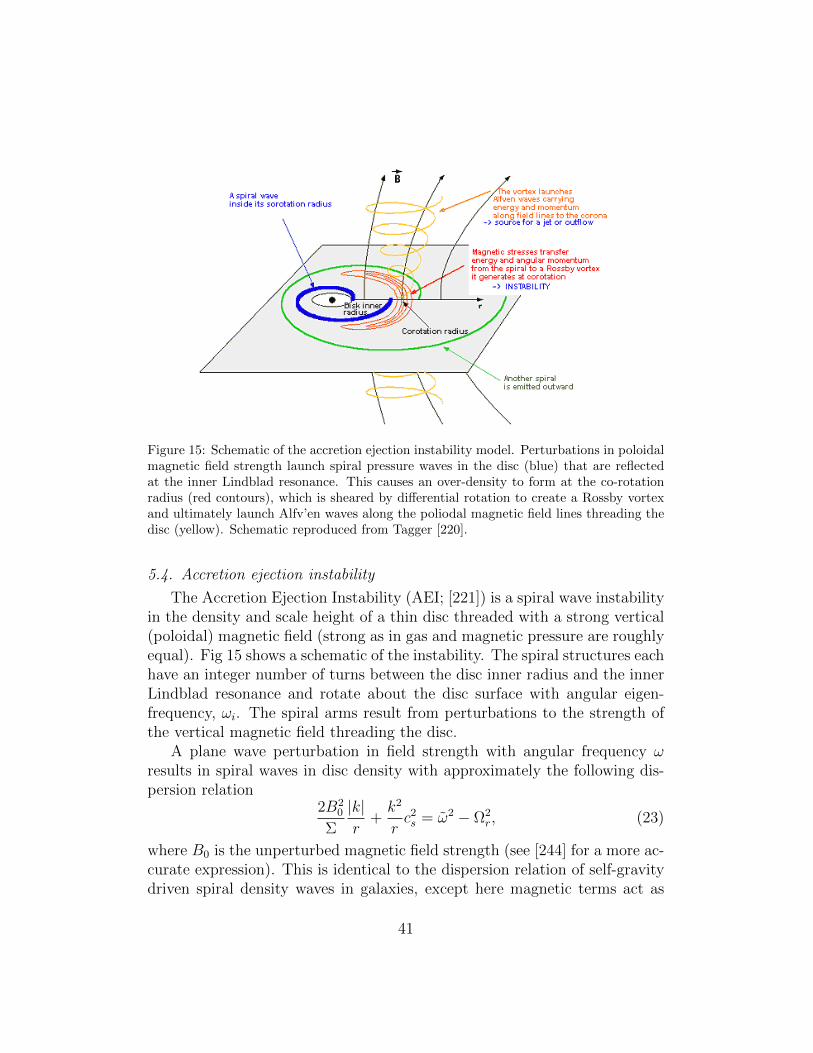
Figure 15: Schematic of the accretion ejection instability model. Perturbations in poloidalmagnetic field strength launch spiral pressure waves in the disc (blue) that are reflectedat the inner Lindblad resonance. This causes an over-density to form at the co-rotationradius (red contours), which is sheared by differential rotation to create a Rossby vortexand ultimately launch Alfv’en waves along the poliodal magnetic field lines threading thedisc (yellow). Schematic reproduced from Tagger [220].
5.4. Accretion ejection instability
The Accretion Ejection Instability (AEI; [221]) is a spiral wave instabilityin the density and scale height of a thin disc threaded with a strong vertical(poloidal) magnetic field (strong as in gas and magnetic pressure are roughlyequal). Fig 15 shows a schematic of the instability. The spiral structures eachhave an integer number of turns between the disc inner radius and the innerLindblad resonance and rotate about the disc surface with angular eigen-frequency, ωi. The spiral arms result from perturbations to the strength ofthe vertical magnetic field threading the disc.
A plane wave perturbation in field strength with angular frequency ωresults in spiral waves in disc density with approximately the following dis-persion relation
2B20
Σ
|k|r
+k2
rc2s = ω2 − Ω2
r, (23)
where B0 is the unperturbed magnetic field strength (see [244] for a more ac-curate expression). This is identical to the dispersion relation of self-gravitydriven spiral density waves in galaxies, except here magnetic terms act as
41

negative self-gravity. The waves can only propagate in regions for which theRHS of equation (23) is > 0, and are therefore damped between the inner andouter Lindblad resonances, defined as the two radii where ω2−Ω2
r = 0. Wavesfrom the inner disc propagate towards the co-rotation radius, where ω = 0,which is located between the two Lindblad resonances. Outward propagat-ing waves are reflected at the inner Lindblad radius, rilr, to then propagateinwards to rin where they are again reflected. The eigen-frequencies are aset of frequencies for which the reflected outward propagating wave has thesame phase as the original outward propagating wave (i.e. they correspondto spiral structures with an integer number of turns between rin and rilr).The fundamental eigen-frequency is therefore set by the mass and spin of thehole, disc parameters such as field strength and sound speed, and the innerdisc radius. The observed changes in QPO frequency are again assumed tobe caused by rin moving towards the hole, with ωi increasing as rin reduces,except for when rin is very close to the ISCO, where the relation reverses[243].
These spiral standing waves can create a further instability at the co-rotation radius: a Rossby vortex. This is caused by an over-density formingat the co-rotation radius that spreads slightly in radius (red contours inFig 15). Differential rotation of disc material means that this over-densityis sheared, with the inner parts accelerating ahead of the outer parts tocreate a vortex at the co-rotation radius. This in turn twists the field linesthreading the over-density to launch a vertical Alfven wave (yellow lines inthe figure). If there is a low density corona above the disc, this Alfven wavecan transfer energy and angular momentum from the accretion flow to thecorona, contributing to the launching of a wind and/or jet (hence the nameaccretion ejection instability).
5.5. Propagating oscillatory shock
The propagating oscillatory shock model [151, 37] assumes a two com-ponent accretion flow (TCAF) consisting of an outer Keplerian disc that issandwiched above and below by a sub-Kelperian corona, and an inner sub-Keplerian halo [225], often referred to as a CENBOL (centrifugal pressuresupported boundary layer). In general, the disc/corona and halo componentshave different accretion rates, and are separated by a shock at radius rshk thatmarks a sharp transition in density from the outer (pre-shock) corona tothe inner (post-shock) halo. According to the propagating oscillatory shockmodel, the shock location oscillates around a mean value rshk if the cooling
42

timescale of the halo is comparable with the infall timescale [151] or if theRankine-Hugoniot condition for a stable shock is not satisfied [197]. It isthis oscillation that is proposed to produce the QPO in the X-ray flux. Theoscillation frequency is inversely proportional to the infall time in the halo(e.g. [37])
νqpo ∼c/Rg
Rrshk√rshk − 2
∼ Ωφ(r = rshk, a = 0)
R, (24)
where R ≡ ρ+/ρ− is the ratio of the post-shock halo density to pre-shockcorona density (the compression ratio). Typical values of the compressionratio are ∼ 1− 4 [44], meaning that the QPO frequency is, within a factor ofa few, assumed to be the Keplerian orbital frequency at the shock location.The evolution of the QPO frequency is then reproduced by the shock locationmoving in as the QPO frequency increases.
We see that this model requires rshk to be very large for typical QPOfrequencies measured in the hard and intermediate states. For νqpo ∼ 1 Hz,typical values are rshk & 600 [44], which is very hard to reconcile with therelativistically broadened iron line routinely observed in the X-ray spectrum.Although measurements of the disc inner radius using the iron line are sub-ject to modelling and calibration uncertainties, the observed broad iron lineprofiles are simply not compatible with a disc truncated at hundreds of Rg
(e.g. [66, 95]), which would instead produce a narrow line. This very largedisc inner radius also means that the accretion rate through the disc mustbe implausibly high in the intermediate state (e.g. ∼ 7 times the Eddingtonlimit in [44]) in order to explain the observed disc temperatures. Whereassuper-Eddington accretion rates are possible in nature [14], the Keplerianthin disc solution, which is used for this model, is not valid for such rates.Furthermore, the soft state still consists of a thin disc extending down to theISCO in this model, meaning that as the source transitions from the interme-diate to soft state, the disc accretion rate must sharply drop by more than anorder of magnitude in order to reproduce the approximately constant X-rayluminosity observed over the transition, which seems rather fine-tuned.
5.6. Pressure or accretion rate modes
There are many QPO models in the literature that can be characterisedas ‘intrinsic’ variability models, in that the system geometry is assumed tostay constant with time, and the oscillation in flux is assumed to resultfrom some resonant oscillation in a property such as pressure or accretion
43

rate. One such model, proposed by Cabanac et al. [34] in the context of ainner flow / truncated disc geometry, considers a white noise of perturbationsto the pressure of the inner flow being generated at its outer radius, rtr.These perturbations set up pressure waves in the corona. Reflection of thesewaves at the flow inner radius leads to the growth of resonant modes withwavelengths that are an integer fraction of (rtr−ri). These oscillations in thepressure then modulate the X-ray flux through the Compton up-scatteringprocess, leading to a predicted power spectrum consisting of band limitednoise and a QPO with a fundamental frequency of νqpo ∼ few 2πcs/rtr andmany higher harmonics. The QPO features become less sharp as transmissionat ri is assumed to be more important. The increase in QPO frequency duringthe transition from hard to soft state is then explained by rtr moving inwards,and to a lesser extent the sound speed increasing.
Other suggestions have been made based on MHD simulations. O’Neillet al. [174] reported on large-scale, low-frequency dynamo cycles in a globalMHD simulation. The cycles take the form of oscillations in azimuthal mag-netic field in and above the disc (extending into a low density corona severalscale heights above the disc). The oscillations in magnetic field at narrowradial ranges are quasi-periodic and occur at frequencies commensurate withthe observed LF QPO frequencies. However, the oscillation frequency is afunction of radius, and so when the flux emitted form the entire disc is esti-mated, the oscillations are completely washed out and no QPO feature is seenin the prost-processed power spectrum. Similarly, Wang et al. [250] proposedthat LF QPOs may be caused by toroidal Alfven wave oscillations. Machidaand Matsumoto [134] noted the formation of a constant angular momentuminner torus in a subset of their MHD simulations that deforms itself from acircle to a crescent quasi-periodically, in turn modulating the mass accretionrate and the mass outflow rate.
6. Observational tests
Here we summarise the current state-of-the-art in attempts to observa-tionally constrain the QPO mechanism. The goal here is less to test individ-ual theories, which in some cases overlap somewhat, but more to determinebroad conclusions about the nature of these oscillations. For instance, mostmodels can be classed either as geometrical – whereby the shape and/or sizeof something varies quasi-periodically – or intrinsic – whereby some fun-damental property such as pressure or accretion rate oscillates in a stable
44

10−1 100 101
QPO Frequency [Hz]
−0.6
−0.4
−0.2
0.0
0.2
0.4
0.6
0.8
φ [ra
d]
XTE J1550−564
GRO J1655−40
H1743−322
GRS 1915 +105
4U 1630−47
MAXI J1659−152
XTE J1748−288
SWIFT J1753.5−01
4U 1543−47
XTE J1650−500
GX 339−4
XTE J1752−223
High i binned
Low i binned
Figure 16: Inclination dependence of Type-C QPO properties. Left: Amplitude of theQPO fundamental versus the centroid frequency for many observations [159]. Right: Phaselag of the QPO fundamental between hard (∼ 7− 13 keV) and soft (∼ 2− 7 keV) energybands (positive means hard photons lag soft) versus centroid frequency [233]. Individualobservations of low and high inclination sources are dark and light grey respectively. Redand blue points also correspond to low and high inclinations respectively, but for thesepoints the population has been binned on QPO frequency.
geometry. In some models the disc emission is predicted to oscillate and inothers the coronal emission is expected to oscillate. By testing these broadproperties against the data, we can narrow down the allowed classes of mod-els until we have a very specific picture of the physical properties that asuccessful model must have. In this manner, we need not even confine our-selves to existing theories proposed in the literature. We can instead imaginebasic modulation mechanisms, such as a oscillations in the scale height ortemperature of the corona.
6.1. Inclination dependence
Given the size of the complete RXTE archive, it is now feasible to con-duct population studies of X-ray binaries that probe the dependence of QPOproperties on the inclination angle between the binary rotation axis and ourline-of-sight. Motta et al. [159] used a sample of RXTE observations to showthat the Type-C QPOs are stronger in higher inclination (more edge-on) bi-nary systems, whereas Type-B QPOs are stronger in lower inclination (moreface-on) systems (see Fig 16, left). Such an inclination dependence of Type-CQPOs had previously been suggested in the literature [200], but Motta et al.[159] and Heil et al. [73] were the first to use a large enough sample sizeto claim high statistical significance. This provides strong evidence that LFQPOs have a geometric origin. It also suggests that Type-B QPOs modulate
45

the X-ray flux differently from Type-C QPOs. For instance, Type-C QPOscould be due to precession of the (oblate) inner flow, with Type-B QPOsinstead caused by jet precession [159, 43]. It is worth noting that the QPOamplitude in the precession model depends on the tilt angle and viewer az-imuth as well as the (polar) inclination angle [247, 91], implying that thereshould be a rather large spread in the correlation between QPO amplitudeand inclination. It is, however, difficult to test for such a spread becausethe inclination angle tends to be poorly constrained observationally beyondbeing categorised as ‘high’ or ‘low’.
van den Eijnden et al. [233] used a sample slightly extended from theMotta et al. [159] analysis (with the main difference being the inclusion ofdata from GRS 1915+105) to study the inclination dependence of the phaselag between hard (∼ 7− 13 keV) and soft (∼ 2− 7 keV) photons measuredat the QPO fundamental frequency and its overtones. Fig 16 (right) showstheir result for the Type-C QPO fundamental. We see that small hard lags(i.e. hard photons lag soft photons) are seen for all sources when the QPOfrequency is low, whereas low / high (red / blue in the plot) inclinationsources display hard / soft lags when the QPO frequency is high. Thisinclination dependence of the phase lag is more difficult to interpret than theamplitude inclination dependence, but is much more dramatic, and providesfurther evidence in favour of a geometric origin of the Type-C QPO. van denEijnden et al. [233] also found that soft lags for the Type-B fundamentalappear to be preferentially associated with high-inclination sources, but notwith high statistical significance because of the small sample size (15 sourcesin total, but only 9 of those sources have Type-B QPO detections and aninclination estimate). The sample size will continue to grow as hithertounknown XRBs go into outburst, therefore there is scope to expand suchpopulation studies using X-ray missions such as NICER.
6.2. Frequency-resolved spectroscopy
Frequency-resolved spectroscopy provides a way to determine the energyspectrum of the QPO harmonics - in other words, it constrains which spectralcomponents are oscillating. This is achieved by extracting light curves formany energy channels, and calculating the Poisson noise subtracted powerspectrum of each channel in absolute rms normalization [195] such that theintegral of the power spectrum over all frequencies gives the variance of thecorresponding light curve. The energy dependence of QPO harmonic compo-nents can be studied by fitting each power spectrum with a multi-Lorentzian
46

Figure 17: Time-averaged (top) and frequency-resolved (bottom) spectra for the Type-CQPO fundamental component, unfolded around the best fitting spectral model (objectsas labelled). The time-averaged spectrum includes disc blackbody (magenta dotted) andComptonized (blue dot-dashed) radiation, whereas the QPO spectrum has no disc com-ponent. Adapted from Sobolewska and Zycki [205].
model and plotting the square root of the integral of the Lorentzian com-ponent corresponding to given harmonic against energy (the absolute rmsspectrum). The rms spectrum is in units of count rate and therefore theinstrument energy response must be accounted for before it can be comparedto physical models (see [138] for an extended discussion on this).
Sobolewska and Zycki [205] studied the rms spectrum of the Type-C QPOfundamental component for a number of BH XRBs. Fig 17 shows a subset oftheir results. Perhaps the most striking conclusion is that the time-averagedspectrum includes a disc component (magenta), but the QPO rms spectrumdoes not. This indicates that the QPO fundamental does not modulate thedirectly observed disc emission, but strongly modulates the Comptonizedemission. They also found that the QPO spectrum is softer than the time-averaged spectrum when the latter is hard, and becomes harder than thetime-averaged spectrum as the latter becomes softer. Axelsson et al. [13]studied the fundamental and second harmonic of Type-C QPOs in XTEJ1550-564. They again found that the QPO fundamental rms spectrum con-tains no disc component, and noted that it is similar to the spectrum of highfrequency (ν > 10 Hz) broad band noise variability, which displays weaker re-
47

flection components than the time-averaged spectrum (consistent with pathlength differences washing out the fastest variability in the reflection spec-trum; [69]). The second harmonic, in contrast, is significantly softer thanthe time-averaged spectrum. A similar analysis of GX 339-4 [12] addition-ally revealed that the rms spectrum of the second harmonic can be describedby a low-temperature, optically thick Comptonized component that is notrequired to be present in the rms spectrum of the fundamental, which insteadincludes a higher temperature Comptonized component. The authors sug-gested that these results could be explained by precession of a stratified inneraccretion flow, which is hotter closer to the BH. They could also potentiallybe explained by non-linear variability of a single Comptonized component[68]. For instance, oscillations in the electron temperature will drive oscil-lations in the spectral index [255]. If these temperature oscillations havea strong second harmonic whereas the variations in total flux only have astrong first harmonic, this could lead to the second harmonic having a muchsofter rms spectrum than the first.
The lack of a QPO signal in the disc component is very troublesome forQPO models that are based on oscillations in the disc. For instance, it issimple to imagine how disc corrugation modes can give rise to strong oscilla-tions of the Comptonised flux (via e.g. variation of seed photons for Comptonup-scattering), but much harder to imagine how the observed disc flux is notmodulated. We can speculate that the region of the disc where the oscilla-tions take place is somewhat hidden from view by an X-ray corona locatedabove the disc (but not entirely hidden, because the corona has optical depthτ ∼ 1), and therefore the disc spectrum we see is dominated by the stableregion at larger radii that is not covered by the corona. The overdensitiesin the disc spiral waves of the AEI model radiate a Comptonized spectrum,and so this model can explain the spectrum of the fundamental, but it is notclear how it can explain the softer spectrum of the second harmonic.
6.3. QPO Phase-resolved spectroscopy
Whereas the rms spectrum gives the amplitude of different QPO harmon-ics for each energy channel, constraining the full QPO waveform for each en-ergy channel provides a lot more information. We have already discussed indetail the QPO waveform for a single energy band in Section 3.2. The sametechniques discussed therein can be applied to individual energy channels toobtain QPO phase-resolved spectra. This includes filtering and phase-foldingsuch as the method of Tomsick and Kaaret [226] and the Hilbert-Huang
48
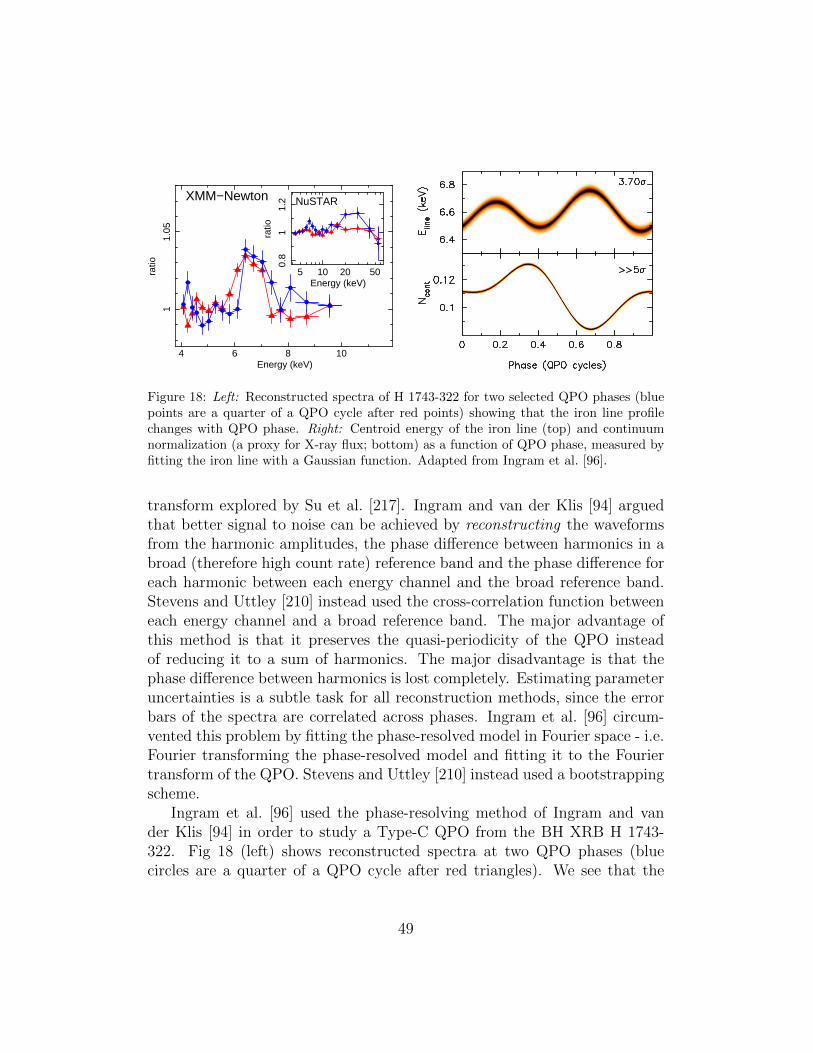
105 20 500.
81
1.2
ratio
Energy (keV)
NuSTAR
4 6 8 10
11.
05
ratio
Energy (keV)
XMM−Newton
Figure 18: Left: Reconstructed spectra of H 1743-322 for two selected QPO phases (bluepoints are a quarter of a QPO cycle after red points) showing that the iron line profilechanges with QPO phase. Right: Centroid energy of the iron line (top) and continuumnormalization (a proxy for X-ray flux; bottom) as a function of QPO phase, measured byfitting the iron line with a Gaussian function. Adapted from Ingram et al. [96].
transform explored by Su et al. [217]. Ingram and van der Klis [94] arguedthat better signal to noise can be achieved by reconstructing the waveformsfrom the harmonic amplitudes, the phase difference between harmonics in abroad (therefore high count rate) reference band and the phase difference foreach harmonic between each energy channel and the broad reference band.Stevens and Uttley [210] instead used the cross-correlation function betweeneach energy channel and a broad reference band. The major advantage ofthis method is that it preserves the quasi-periodicity of the QPO insteadof reducing it to a sum of harmonics. The major disadvantage is that thephase difference between harmonics is lost completely. Estimating parameteruncertainties is a subtle task for all reconstruction methods, since the errorbars of the spectra are correlated across phases. Ingram et al. [96] circum-vented this problem by fitting the phase-resolved model in Fourier space - i.e.Fourier transforming the phase-resolved model and fitting it to the Fouriertransform of the QPO. Stevens and Uttley [210] instead used a bootstrappingscheme.
Ingram et al. [96] used the phase-resolving method of Ingram and vander Klis [94] in order to study a Type-C QPO from the BH XRB H 1743-322. Fig 18 (left) shows reconstructed spectra at two QPO phases (bluecircles are a quarter of a QPO cycle after red triangles). We see that the
49
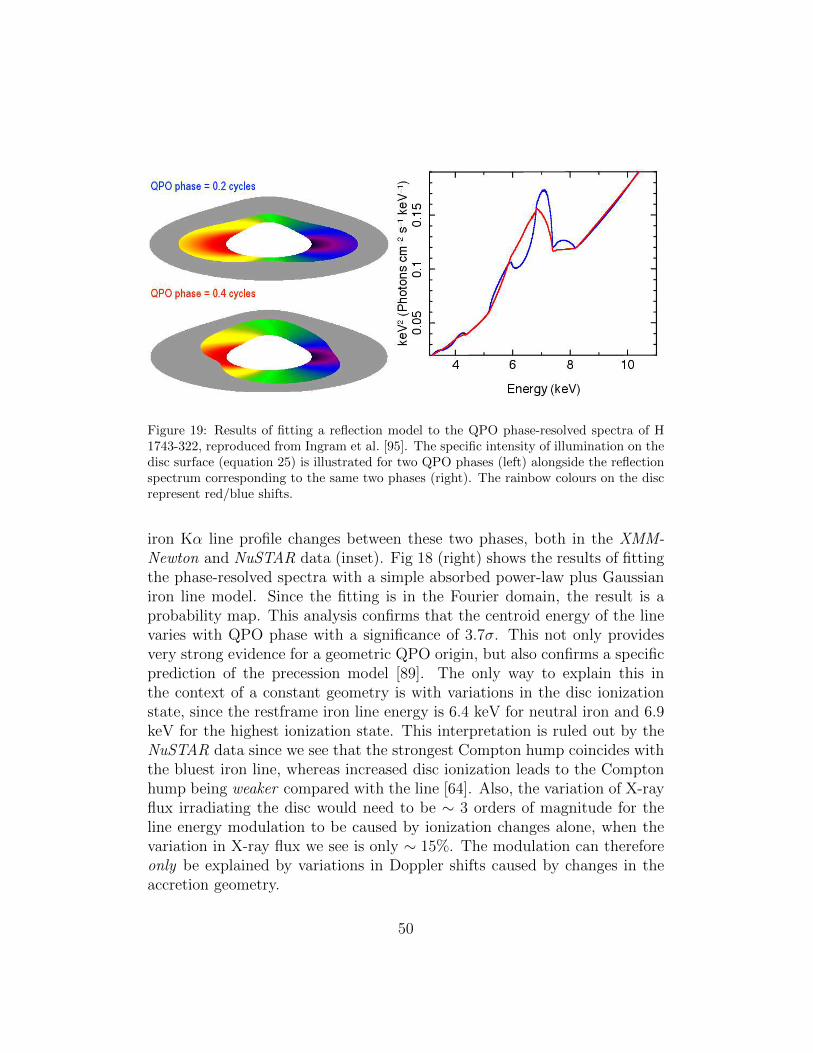
Figure 19: Results of fitting a reflection model to the QPO phase-resolved spectra of H1743-322, reproduced from Ingram et al. [95]. The specific intensity of illumination on thedisc surface (equation 25) is illustrated for two QPO phases (left) alongside the reflectionspectrum corresponding to the same two phases (right). The rainbow colours on the discrepresent red/blue shifts.
iron Kα line profile changes between these two phases, both in the XMM-Newton and NuSTAR data (inset). Fig 18 (right) shows the results of fittingthe phase-resolved spectra with a simple absorbed power-law plus Gaussianiron line model. Since the fitting is in the Fourier domain, the result is aprobability map. This analysis confirms that the centroid energy of the linevaries with QPO phase with a significance of 3.7σ. This not only providesvery strong evidence for a geometric QPO origin, but also confirms a specificprediction of the precession model [89]. The only way to explain this inthe context of a constant geometry is with variations in the disc ionizationstate, since the restframe iron line energy is 6.4 keV for neutral iron and 6.9keV for the highest ionization state. This interpretation is ruled out by theNuSTAR data since we see that the strongest Compton hump coincides withthe bluest iron line, whereas increased disc ionization leads to the Comptonhump being weaker compared with the line [64]. Also, the variation of X-rayflux irradiating the disc would need to be ∼ 3 orders of magnitude for theline energy modulation to be caused by ionization changes alone, when thevariation in X-ray flux we see is only ∼ 15%. The modulation can thereforeonly be explained by variations in Doppler shifts caused by changes in theaccretion geometry.
50

Ingram et al. [95] applied a more sophisticated phase-resolved spectralmodel to the same data set. They parameterized the restframe reflectedspecific intensity as a function of QPO phase, γ, and disc radius and azimuthwith the analytic function
IE(r, φ) ∝ r−q
1 + A1 cos2[(γ − φ+ φ1)/2] + A2 cos2[γ − φ+ φ2]R(E),
(25)where the restframe reflection spectrum R(E) is calculated using the modelxillver [64]. If the asymmetry parameters A1 and A2 are non-zero, thisfunction corresponds to an asymmetric illumination pattern on the disc sur-face that rotates as the QPO phase increases. They then calculated theobserved QPO phase-dependent reflection spectrum accounting for all rela-tivistic effects. Fig 19 shows the best fitting illumination function (left) andthe corresponding observed reflection spectra (right) for two selected QPOphases. We see that the there are two bright patches on the disc surface(A2 > 0). This enables the model to reproduce the two maxima in line en-ergy per QPO cycle seen in Fig 18 (right), since the bluest line occurs whenthe approaching and receding sides of the disc are both illuminated and thereddest line occurs when the front and back of the disc are illuminated. Thisis the case because blue shifted radiation is also Doppler boosted, and so theblue wing dominates over the red wing when approaching and receding sidesof the disc are illuminated. Ingram et al. [95] suggested that such an illumi-nation could result from the top and bottom of an oblate precessing innerflow illuminating the disc (i.e. the misalignment angle between disc and flowis greater than the opening angle of the flow), or alternatively may occur ifboth the inner flow and the jet base are precessing. The best fitting modelis preferred to a null-hypothesis of axisymmetric illumination (A1 = A2 = 0)with 2.4σ significance. Confirmation of asymmetric illumination at > 3σconfidence levels is likely to be provided by the high count rate capabilitiesof NICER.
Another important result of the Ingram et al. [95] analysis is that thereflection fraction is required to vary with 3.5σ significance. Since the reflec-tion fraction in this context is defined as the number of photons interceptedby the disc divided by the number of photons radiated by the corona (i.e.the covering fraction), this indicates once and for all that the geometry ischanging over the course of each QPO cycle. Ingram et al. [95] also tried al-ternative models with an axisymmetric illumination profile. They consideredmodulations in the ionization, disc inner radius and the radial emissivity pa-
51

rameter, q. The first of these has already been argued to be implausible, butqualitative testing is still worthwhile. The second is most similar to the prop-agating oscillatory shock model, although the truncation radius according tothat model would be > 600 Rg for the observed QPO frequency (νqpo ∼ 0.25Hz), and therefore the rotational frequency is too low to cause the observedDoppler shifts. Still, an oscillation of the disc inner radius caused by someother physical mechanism could plausibly cause a line energy modulation.The third is intended to mimic oscillations in the shape or height of thecorona. All three alternative models yield worse fits than the best fittingasymmetric model with > 3.5σ confidence.
The phase-resolved spectroscopy results strongly favour asymmetric geo-metrical models for the Type-C QPO. The line energy modulation could becaused by precession of the inner flow, jet or disc, or by the spiral densitywaves of the AEI [105]. However, there is no strong QPO in the disc compo-nent. Therefore, although disc corrugation modes can explain the line energymodulation [228], this requires the oscillating region of the disc to not be hid-den by the corona and therefore predicts a strong QPO in the disc spectrum.It is also unclear quite how the reflection fraction would change with QPOphase both in the corrugation modes and AEI models, unless perhaps thedisc is warped. These observational characteristics are instead naturally ex-plained by precession of the corona or jet as long as the disc rotation axis ismisaligned with the BH spin axis.
Stevens and Uttley [210] studied a Type-B QPO in RXTE data from GX339-4. They we not able to constrain changes in the iron line due to signalto noise restraints, but were able to track the QPO phase dependence of thedisc blackbody and Comptonised components. Their preferred model con-sisted of a constant multi-temperature disc, a variable blackbody component(representing thermal radiation from the inner disc), a variable power-lawand a Gaussian iron line. They found that the blackbody temperature andpower-law flux varied with ∼ 1.4% and ∼ 25% rms respectively, and thatthe temperature variations led the power-law flux variations by ∼ 0.3 QPOcycles. The variations in bolometric flux of the blackbody component were∝ T 4. This is of course consistent with changes in the intrinsic disc flux,through either accretion rate fluctuations or variable irradiation, in a con-stant geometry (i.e. the Stefan-Boltzmann law). The ∼ 0.3 cycles phase lagrules out irradiation as the cause, since in this case there should be no phaselag, but oscillations in the accretion rate of the inner disc are possible. AnF ∝ T 4 relation would also result if the blackbody component has a constant
52

intrinsic flux, but the blue shift g = Eobs/Eem (where Eobs and Eem are re-spectively observed and emitted photon energies) changes with QPO phase,as would be the case for precession. This is because the relation between theobserved and emitted bolometric flux is Fobs ∝ g4Fem (see e.g. [128, 92]).Since the restframe flux follows the Stefan-Boltzmann law, Fem ∝ T 4
em, thisgives Fobs ∝ (gT 4
em). The effective blackbody temperature measured by theobserver is Tobs = gTem, and therefore Fobs ∝ T 4
obs. The authors suggested amodel whereby a precessing jet illuminates different disc azimuths. This fitsthe observations because the highest disc temperature would occur when thejet tilts towards the approaching disc material, and the peak in power-lawflux would occur ∼ 1/4 precession cycles later when the jet tilts towards theobserver. The X-ray source must be reasonably far from the BH in order toexplain the small variations in disc temperature.
6.4. QPO triplets
Although the observational evidence strongly implies that LF QPOs aregenerated by precession, none of the tests discussed thus far give any indica-tion that this is specifically Lense-Thirring precession. If we knew the massand spin of a given BH, and were able to track the disc inner radius over manyobservations, we could test if the QPO frequency evolves with disc inner ra-dius in a manner predicted by the model. However, it is notoriously difficultto measure all three of these quantities. It is however possible to test theRPM whenever a Type-C LF QPO and a pair of HF QPOs are detected inthe same observation, because the RPM associates these three features withLense-Thirring precession, periastron prescession and orbital motion, all atthe same characteristic radius. If a triplet of QPOs is detected, this leavesthree equations and three unknowns: a, M and r, which can be solved foranalytically [93]. Motta et al. [158] did just this for a QPO triplet detectedfrom GRO J1655-40 (the pair of HF QPOs are pictured in Fig 4, left) to inferr = 5.68 ± 0.04, a = 0.29 ± 0.003 and M/M = 5.31 ± 0.07. Remarkably,this mass measurement agrees very well with the existing dynamical massmeasurement of M/M = 5.4 ± 0.3. Another validation of the model camewhen they found that the highest Type-C QPO frequency ever measured forthis source is consistent with Lense-Thirring precession at the ISCO radiusfor these mass and spin values, as is predicted by the RPM.
Although the RPM is a rather simplistic model, it is the limiting caseof the more physical precessing inner flow model when the radial extent ofthe precessing flow is small [160]. The source is predicted to be in such
53

Figure 20: Black hole spin as a function of the mass as predicted by the three equations ofthe relativistic precession model for the case of GRO J1655-40. The derived black hole mass(m = 5.31±0.07 M agrees with the black hole mass derived from spectro-photometricoptical observations [21], marked by the grey band in the plot (1-sigma confidence level).The green, red and blue lines show the spin as a function of the mass according to thefunctional form of the nodal precession frequency, the periastron precession frequency, andthe orbital frequency, respectively. Taken from [158].
54

a state for the observation containing the triplet, since the Type-C QPOfrequency is fairly high (νqpo ≈ 17 Hz). HF QPOs are only observed in softerstates such as this one (i.e. with higher QPO frequencies) [29]. Psaltis et al.[183] and [24] noted that broader power spectral components are observedin the hard state, whose characteristic frequencies smoothly evolve into theHF QPO frequencies as the source spectrum softens. They suggested thatthis happens because the flow is extended in the harder states, meaning thata range of periastron precession and orbital frequencies contribute to thebroad components, but these features become narrower as the extent of theflow, and therefore the range of epicyclic frequencies, decreases. Fragile et al.[57] showed that the GRO J1655-40 QPO triplet can also be explained by aprecessing torus (rin = 6.5 Rg; rout−rin ≈ (0.2−2.9) Rg), with the lower andhigher HF QPOs resulting respectively from breathing and vertical epicyclicmodes of this torus. This model works for the dynamical mass measurementof GRO J1655-40 for a spin of a ≈ 0.63, but there are 4 parameters andtherefore other values of BH mass also work.
The consistency of this triplet with the RPM and the more sophisticatedmodel of Fragile et al. [57] is very encouraging, but unfortunately HF QPOdetections are sufficiently rare for this to be the only triplet in the entireRXTE archive. It is therefore not possible to further test these models withmore triplets. It is however possible to apply the RPM to doublets if adynamical mass measurement is available. Motta et al. [161] did this forXTE J1550-564 and obtained a spin value consistent with that obtained viaX-ray spectroscopic methods. It is also possible to place limits on the spinaccording to the RPM by combining the highest Type-C QPO frequencyever observed with a mass measurement [93, 59]. The very precise mass andspin values that can be inferred from the RPM make further observationalvalidation of the model very desirable. Such tests will be made possible byfuture high throughput X-ray missions such as eXTP and STROBE-X, whichwill be very sensitive to detecting HF QPOs.
6.5. Energy dependence of the QPO frequency
One observational property of Type-C QPOs that is rather challenging forall models to reproduce is the energy dependence of QPO frequency observedfor a number of sources [185, 232, 233, 80]. Most, if not all, QPO modelsinvoke some sort of global mode, implying that there should be only one QPOfrequency, regardless of the energy band we observe in. van den Eijnden et al.[232] tested the hypothesis that there is no energy dependence of the QPO
55

frequency at any given time, but that the QPO frequency changes with time(which it does) in a manner that correlates with QPO amplitude in oneenergy band and anti-correlates with amplitude in the other band. In thiscase, the power spectrum averaged over time would then contain a QPOwith higher frequency for the correlated band than for the anti-correlatedband. This hypothesis had to be ruled out because the phase of the higherfrequency QPO was found to accelerate away from the phase of the lowerfrequency QPO (see the final paragraph of Section 3.1). This tells us that theinstantaneous QPO frequency depends on energy, and therefore if the QPOis driven by precession, there needs to be some differential precession. This isnot so difficult to imagine, since the Lense-Thirring precession frequency is afunction of radius and so we can imagine the twist of the inner flow increasingto give a slightly higher precession frequency in the hotter inner region, inturn leading to the QPO frequency increasing with energy. However, vanden Eijnden et al. [232] found for GRS 1915+105 that the QPO frequencysightly decreases with energy for low average νqpo and increases with energyfor higher average νqpo. This is very hard to explain with radial differentialprecession, since we always expect the precession frequency and spectralhardness to increase with proximity to the hole.
A possible answer to the riddle was provided by the GRMHD simulationsof a moderately thick (H/R = 0.1) tilted disc ran by Liska et al. [121]. Theyfound that the disc precesses along with the low density corona above it andthe jet. The jet precesses at a slightly slower rate than the corona, whichprecesses at a slightly slower rate than the disc. Such a ‘multi-region’ setupcould potentially also allow other models to reproduce the energy dependenceof QPO frequency. Taking the AEI as an example, perhaps the spiral densitywave in the disc mid-plane could have a slightly different frequency to thethat in the disc upper atmosphere.
7. Discussion
7.1. What are LF QPOs?
From the previous Section, we can conclude a number of things about thenature of Type-C QPOs:They modulate the Comptonised component, not the disc component: Weknow this from frequency-resolved spectroscopy. Furthermore, QPOs are stillvisible - and matter of factly with a higher fractional rms - at energies and inaccretion states where the disc has no contribution. Note, however, that the
56

oscillation could still somehow originate in the disc but only modulate theX-ray flux emitted from the corona through, for example, variation of seedphotons.They are very likely a geometrical effect: There are many strong lines of ev-idence that lead to this conclusion. There is the inclination dependence ofQPO amplitude and phase lag, and the line energy and reflection fractionmodulations observed in H 1743-322. A caveat is that the spectral modula-tions that form the strongest arguments are currently based entirely on oneobservation of one source. More observations therefore need to be analysedin order to gain confidence that the H 1743-322 observation is representativeof the population.They are likely an azymuthally asymmetric geometrical effect: This conclu-sion is again driven by the line energy modulation in H 1743-322 and the QPOphase-resolved spectral modelling of Ingram et al. [95]. We must thereforekeep in mind that this conclusion is also essentially based on one observationof one source.
We can make similar statements about Type-B QPOs, perhaps withslightly less confidence. We also conclude that Type-B QPOs are differentfeatures to Type-C QPOs. This is evidenced by observations that containboth classes of QPO simultaneously [156], and also by the different incli-nation dependence of the two QPO classes. A model whereby Type-C andType-B QPOs are respectively due to precession of the oblate inner accretionflow and the jet is consistent with the observational data, and Lense-Thirringprecession is a theoretically appealing precession mechanism. There is still,however, a lot to learn about LF QPOs despite the many decades since theywere first discovered, and it is of course important to carry on testing modelsother than the precession model such as the AEI.
7.2. Are these systems misaligned?
For the Lense-Thirring precession model to apply to all Type-C QPOs,all sources that display them must have a misalignment between the BH spinaxis and the binary orbital axis. This requirement can be relaxed a little ifwe assume that Type-C QPOs are driven by precession but remain agnosticabout the physics behind this precession. That said, it is difficult to imaginehow the reflection fraction could vary with QPO phase (as is observed) in analigned system. Ray tracing calculations of a precessing ring [247] and torus[91, 95] demonstrate that the observed QPO amplitudes can be reached ifthe half opening angle of the precession cone (i.e. the misalignment angle) is
57

Figure 21: Results of one of the supernova kick models ran by Fragos et al. [58]: 1D (top)and 2D (bottom) probability density functions of the misalignment angle between the BHspin and the binary rotation axis immediately after the supernova that created the BH.Dotted and dashed lines represent 1σ and 2σ. Small misalignment is favoured because thelargest supernova kicks destroy the binary system.
58

∼ 10− 15. These calculations do not include the variation of seed photonsthat would result from the angle between flow and disc rotation axes varyingbetween 0 and 2β, which provides an additional modulation mechanism andthus increase the QPO amplitude for a given misalignment angle [256, 254].The required range of misalignments can therefore be revised down slightly.
The first question we can ask is: is it theoretically reasonable for a largefraction of BH XRBs to have the & 5 misalignment required by the preces-sion model? For XRBs formed from existing binary star systems, misalign-ment is thought to be introduced by asymmetries in the supernova explosionthat creates the BH (a supernova kick). Fig 21 shows the result of one ofthe supernova kick models ran by Fragos et al. [58] (Maxwellian distributionof kick velocities and uniform distrbution of kick directions) in the form ofprobability density functions for all of the binary systems that remain boundafter the supernova (in order to become XRBs). We see that systems withsmaller misalignments are more common, with ∼ 95% in the 0− 48 range.This is because the largest kicks disrupt their binary systems. Accretion ontothe hole will then drive the system towards alignment over time. King andNixon [111] show that this is a slow process, with the BH needing to ac-crete ∼ 10% of its initial mass before the misalignment angle is significantlyaltered (also see [137, 18]), indicating that modest misalignments could becommon amongst the BH XRB population. Even more mass would need tobe accreted if the Bardeen-Petterson transition radius is smaller than analyticpredictions, as recent GRMHD simulations imply [123].
It is therefore plausible for many systems to have a & 5 misalignment,but it follows that there should also be many systems with a . 5 misalign-ment. A fraction of the BH XRB population should therefore display no, orat least very weak, Type-C QPOs according to the precesison model. Themost famous example of such a source is perhaps Cygnus X-1. Althoughthere are lumps and bumps in its power spectrum, the feature that has oc-casionally been speculated to be a Type-C QPO [11] is very weak and broad(Q ∼ 2) and is not seen in the bi-coherence [231]. Other sources with veryweak and/or broad QPOs include GRO J0422+32 (Q . 2 [234]), LMC X–3 (Q ∼ 3 [32]), 1E 1740.7–2942 (the great anhilator [203]), GRS 1758–258[203], Swift J1357.2–0933 [9] and GS 1354–64 [196]. However, in some of thesecases the QPO may have been smeared out by very long exposures, and inothers the QPO may simply have been missed due to the only outburst being‘hard state only’ [222] or largely obstructed by sun constraints (e.g. SwiftJ1713.4–4219 [222]). Perhaps the best example for which these caveats do
59

not apply is XTE J1652–453, which has no detectable Type-C QPO in itsHIMS power spectrum [75]. Finally, there are a number of sources for whicha power spectrum has never been published, despite having been observed byRXTE or another telescope with similar timing capabilities. We speculatethat there may be a bias at play amongst such sources, since Type-C QPOsare interesting features, and therefore a power spectrum displaying them ismore likely to be published than one without.
Although Type-C QPOs are therefore not completely ubiquitous, theyare more commonly present than not, which is slightly in tension with theexpectations of population synthesis models. One effect that has never beenincluded in the binary evolution models, however, is radiative warping [181,60]. For an initially misaligned system, radiation pressure from the centralX-ray source is capable of warping the outer disc. We speculate that thiseffect could further slow down the binary alignment process, and/or lead tothe inner disc being more misaligned with the hole than the binary partneris. BH XRBs in dense environments such as globular clusters may havevery different properties, since they are likely formed by binary capture forwhich there is no preferred misalignment angle [49]. Therefore, if a brightenough XRB in a globular cluster were ever detected, the precession modelpredicts that it would likely have very strong QPOs. Arbitrary misalignmentangles are also expected for tidal disruption events (TDEs). It is somewhatencouraging for the precession model that the QPO recently discovered froma TDE reached a fractional rms as high as ∼ 50% [176].
There are a few (indirect) observational tests for binary misalignment.For instance, the proper motion of Cygnus X-1 is consistent with that of itsnatal association of O stars, implying that it felt no supernova kick [145]. Be-fore we get excited that this explains why Cygnus X-1 has no QPOs however,we must also note that GRS 1915+105, which has very strong QPOs, alsohas no peculiar velocity with respect to its association [145]. Another testcomes from super-luminal jet ejections, because the 3D jet trajectory can bereconstructed by tracking the proper motion and brightness of approachingand receding lobes. For GRO J1655–40, the inferred jet inclination angle is∼ 85 [76], whereas the binary inclination angle calculated from ellipsoidalmodulations of absorption lines in the donor star’s optical spectrum is ∼ 70
[70]. This means that the misalignment angle is at least 15, because wehave no information about the projection of the binary rotation axis on theobserver plane [56]. For SAX 1819–2525 (V4641 Sgr), a misalignment of& 50 is inferred using the same method [130]. The misalignment for XTE
60

J1550–564 could potentially be much smaller, but is still & 12 [206]. ForH 1743–322, comparing the inferred jet orientation [207] with the inner discinclination measured via QPO phase-resolved reflection modelling [95] im-plies a misalignment angle & 5, and an misalignment of ∼ 15 is consistentwithin 0.5σ confidence.
Perhaps the most spectacular evidence of misalignment is the recent re-sult of Miller-Jones et al. [144], who used very long baseline interferometryto discover that the jets of V404 Cygni are precessing. The half openingangle of the precession cone is ∼ 18, and the precession period is in therange ∼ 1 second to 2.6 hours (the pattern of sampling makes it difficult toestimate the precession period, or even to conclusively confirm that that thechanges in jet orientation are periodic). These observations are coincidentwith an intermittently detected X-ray QPO with a period of ∼ 56 seconds[81], although it is difficult to reliably establish a connection between the twophenomena. The results of Miller-Jones et al. [144] provide strong evidencethat V404 is a misaligned system, although we note that this source cannotby any stretch be considered typical of the population. One argument infavour of alignment is that XRB jets are all observed to have a very smallopening angle, which implies that the opening angle of the precession coneis equally small if the observed jet lobe is averaged over many precession cy-cles. However, resolved jet lobes are all from discrete, transient ejections andtherefore there are no such constraints on the precession cone of the compactpersistent jets coincident with Type-C QPOs.
7.3. Outstanding Problems
Although much progress has been made over the past decade or so, thereare still some observational characteristics that challenge the precession hy-pothesis, and some that pose a challenge to most, if not all, proposed QPOmodels. Here, we summarise these problems.
7.3.1. The sub-harmonic
It is usual to classify the QPO fundamental as the highest amplitude peakin the power spectrum. However, a sub-harmonic – at half the frequency ofthe fundamental – is often observed. Sub-harmonics are seen for Type-Cand Type-B QPOs, and they are perhaps the most puzzling property ofQPOs. The most obvious explanation is that the sub-harmonic is the truefundamental, and somehow the second harmonic (which is what we call thefundamental) has more power than the fundamental. This is difficult to
61

Figure 22: Example of the sub-harmonic becoming stronger than the fundamental (markedby the red arrow). The observations are from three consecutive days of the 2007 outburstof GX339-4 (chronological order is top to bottom). The second and third power spectrafrom the top have been re-scaled by a factor of 1/10 and 1/100, respectively, to facilitateinspection.
62

achieve in any model (e.g. [247]). Curiously, a sub-harmonic feature is oftenco-incident with peaks at n times the frequency of the most powerful QPOpeak, where n is an integer > 1, but not with peaks at (2n − 1)/2 timesthe frequency of the most powerful QPO peak. This means that, if the sub-harmonic is actually the true fundamental, then the QPO never has anystrong odd harmonics, only even harmonics. The alternative of the sub-harmonic truly being a sub-harmonic is equally difficult to explain. TheRXTE archive also includes a few examples of the sub-harmonic amplitudeovertaking that of the fundamental. Fig 22 shows an example of this overthree observations on consecutive days from the 2007 outburst of GX339-4.The picture is further complicated by multi-wavelength observations, sincethe fundamental frequency of optical and IR QPOs are sometimes observedto be consistent with the X-ray fundamental (e.g. [83]) and sometimes withthe X-ray sub-harmonic (e.g. [154, 103]).
7.4. QPOs from accreting millisecond X-ray pulsars
Since we know the spin frequency of accreting millisecond X-ray pulsars,we can estimate the spin parameter for a range of reasonable moment ofinertia values and test the Lense-Thirring precession model against the ob-served LF QPO frequencies, under the assumption that the upper kHz QPOis due to orbital motion. Initial works to test the RPM in this manner con-cluded that the LF QPO frequency matches best to twice the Lense-Thirringprecession frequency [153, 209]. Ingram and Done [86] later considered theprecessing inner flow model, and found that the solid body precession fre-quency matched the LF QPO frequency if the surface density profile becomesmore centrally peaked as the source gets brighter, as may result from mate-rial piling up on the MNS surface. More recently, van Doesburgh and van derKlis [240] considered a sample of 13 sources and again found that the surfacedensity profile is required to become more centrally peaked as the sourceflux increases in order to explain the QPO frequencies. They additionallyfind that the LF QPO frequencies are higher than the precession frequen-cies produced by assuming reasonable moment of inertial values, and suggest(again) that the LF QPO fundamental could actually be twice the precessionfrequency, or that the precession is modified by mechanisms other than theframe dragging effect, such as radiation pressure and magnetic precession.
The opportunity for a stricter test of the Lense-Thirring precession modelwas provided by the discovery of QPOs in the 11 Hz pulsar, IGR J17480–2446, in the globular cluster Terzan 5. Shortly after the source was discov-
63

ered, Altamirano et al. [6] reported on a QPO in its power spectrum withfrequency evolving from 35-50 Hz, which is far too high to be driven by Lense-Thirring precession around a NS with a spin of only 11 Hz. This QPO wasalso accompanied by a kHz QPO and broad band noise. Using well-knowncorrelations between the frequencies of the different power spectral compo-nents [252], and by examining its general characteristics (quality factor, rmsamplitude, overall power-spectral shape), Altamirano et al. [6] classified the35-50 Hz QPO as an HBO (thought to be the Z-source analogy of Type-CQPOs - see Section 2.4). This classification implies that HBOs cannot bedue to Lense-Thirring precession, and the association between HBOs andType-C QPOs also throws doubt on the Lense-Thirring model for BHs.
We note, however, that a search for QPOs in the frequency range expectedfor Lense-Thirring precession around an 11 Hz NS (. 0.1 Hz) has never beencarried out for this source, due partially to the presence of a large numberof type-I X-ray bursts in the data [155] and the relatively short length ofthe observations. The detection of such a very low frequency QPO in thissource would cast doubt on the HBO classification of the 35-50 Hz QPO andthus re-establish the possibility that HBOs in general could be due to Lense-Thirring precession. It is also important to note that IGR J17480–2446 wasbehaving as a Z-source when these QPOs were observed, and therefore theLense-Thirring precession frequency of particles close to the NS surface canbe quite significantly modified by radiation pressure [143].
We can also consider whether it is reasonable for the NS spin axis tobe misaligned with the binary rotation axis in accreting millisecond X-raypulsars, given the standard paradigm in which the NS has been spun upby accretion over its lifetime by a factor of ∼hundreds [186]. Is it possiblefor the spin magnitude to increase this much without the system aligning?We can adapt the calculations of King and Nixon [111] to make a back ofthe envelope estimate, starting by expressing the magnitude of the spin-uptorque on the NS as
Gspinup = M(GMnsRns)1/2, (26)
where Mns and Rns are respectively the NS mass and radius, and we haveassumed for simplicity that the accretion disc reaches the NS surface. Inte-grating over time for a constant mass accretion rate, ignoring any NS massincrease caused by accretion and assuming that today’s spin frequency is >>the birth frequency, the total mass that must be transferred to achieve a spin
64

frequency of νs isMtr
Mns
∼ 2πδ
(GMns)1/2R3/2
ns νs, (27)
where the NS moment of inertia is δ MnsR2ns. Assuming δ = 2/5 (solid
sphere), Mns = 1.4 M, Rns = 10 km and νs = 500 Hz, we find Mtr/Mns ∼0.09. We recall from Section 7.2 that this is on the edge of how much masscan be transferred without significant alignment, implying that more NSXRBs should be aligned than BH XRBs, but not ruling out the possibilitythat some are still misaligned today.
7.5. Future outlook
New and upcoming X-ray missions promise to further increase our un-derstanding of QPOs. Some of the best constraints to date have been ob-tained by QPO phase-resolved spectroscopy, which requires a large num-ber of photons. High throughput X-ray detectors will therefore increase thequality and quantity of QPO phase-resolved spectroscopy studies. NICER,which was recently installed on the International Space Station, is ideal forphase-resolved spectroscopy due to its good spectral resolution and abilityto measure high count rates (unlike XMM-Newton, it does not suffer frominstrumental problems associated with high count rates such as pile-up ordead time). The bright BH XRB outbursts that have recently been exten-sively monitored by NICER therefore promise to soon deliver insights intothe physics of QPOs. In future, proposed missions with a large area X-rayinstrument, such as eXTP and STROBE-X will further enhance our phase-resolved spectroscopy constraints, as well as enabling new tests such as QPOphase-resolved reverberation mapping. The hard X-ray capabilities of thesemissions will additionally enable the detection of more HF QPOs, and there-fore more QPO triplets. Since the best current evidence that LF QPOs arespecifically Lense-Thirring precession comes from the QPO triplet in GROJ1655-40, this will be extremely valuable.
Perhaps the most distinctive test for a precession origin of LF QPOsis to search for QPOs in the X-ray polarization degree and angle. Ingramet al. [91] calculated the modulations in polarization degree and angle thatwould result from precession of a Comptonising torus. They found that theswings in polarization angle are greater when the torus is viewed more face-on. This is because an edge-on observer only sees the side of the precessioncone, whereas a face-on observed sees the base of the precession cone, and
65

so sees the polarization vector rotate through all angles. However, the meanpolarization degree should be larger for a torus viewed more edge-on [218],essentially because its image on the observer plane is less symmetric. Sincepolarization angle is easier to measure for a higher polarization degree, thisintroduces a trade-off. The Imaging X-ray Polarimetry Explorer (IXPE ;[251]), due to be launched in 2021, will provide the first opportunity to mea-sure the predicted polarization QPOs. This will, however, be a challengingmeasurement because many photons must be collected to make a significantdetection of polarization. For the expected IXPE count rate (. 100 cps)and BH XRB polarization degree (. 8%), each polarization measurementwill require a & 5 minute exposure. It will therefore not be possible to probethe sub-second timescales of interest simply by making light curves of polar-ization degree and angle. Ingram and Maccarone [98] introduced a statisticalmethod to circumvent this problem, and showed that it should be possible forIXPE to measure the predicted modulations with high statistical significanceproviding that the mean polarization degree for a high inclination source is& 4%. eXTP is proposed to have an X-ray polarimeter of very similar designto the IXPE instrument, but with higher effective area. This, combined withthe possibility to enhance the signal by cross-correlating with the signal fromthe large area detector, will provide much more sensitive constraints on thevariability of X-ray polarization [98].
8. Conclusions
Much progress has been recently made in the physical interpretation ofLF QPOs in BH XRBs. The observational evidence points strongly to a geo-metric origin of Type-C and Type-B QPOs, whereas Type-A QPOs are veryrare and weak features that only have their own classification for historicalreasons. Moreover, an azimuthally asymmetric geometry is required to ex-plain Type-C QPOs, favouring a precession origin. Since the LF QPO is farstronger in the hard (i.e. Comptonised) emission than in the disc emission, itis likely that it is the X-ray corona that undergoes precession, as opposed tothe disc. If the QPO mechanism is specifically Lense-Thirring precession (asimplied by the QPO triplet in GRO J1655-40), this implies that the BH spinaxis in most BH XRBs has to be misaligned with the binary rotation axis by& 5. This could result from an asymmetric kick in the natal supernova andis supported by some observations of jet lobes.
An important caveat is that some of the strongest constraints come from
66

phase-resolved spectroscopy of a single observation of H 1743-322, and so itis important to carry out the same analysis for more observations of moresources. In particular, tracking how the phase-resolved spectral properties ofa given object evolve with QPO frequency will help diagnose what causes theQPO frequency to change. All QPO models summarised here associate QPOfrequency changes with a moving characteristic radius, usually the inner discradius. However, observations in which the broad iron line profile appears tostay constant as the characteristic frequencies in the power spectrum increaseimply that the disc inner radius may instead (at least at times) be fixed, oronly move by a small amount, during the bright outburst phase [104]. If sucha paradigm is confirmed, some creativity will be required to determine howthe observed &two orders of magnitude increase in QPO frequency can beachieved without a moving radius. New, future and proposed X-ray missionspromise further tests of the QPO mechanism through high count rate capa-bilities (e.g. NICER, STROBE-X ) and polarimetry (IXPE, eXTP).
We thank Michiel van der Klis, Chris Fragile and Peggy Varniere for valu-able and informative discussions. AI acknowledges support from the RoyalSociety. SME acknowledges support from the STFC and the Oxford HintzeCentre for Astrophysical Surveys. We thank the anonymous referee for in-sightful comments.
References
[1] Abramowicz, M.A., Kluzniak, W., 2001. A precise determination ofblack hole spin in GRO J1655-40. A&A 374, L19–L20. doi:10.1051/0004-6361:20010791, arXiv:arXiv:astro-ph/0105077.
[2] Alston, W.N., Markeviciute, J., Kara, E., Fabian, A.C., Middleton,M., 2014. Detection of a QPO in five XMM-Newton observations ofRE J1034+396. MNRAS 445, L16–L20. doi:10.1093/mnrasl/slu127,arXiv:1407.7657.
[3] Alston, W.N., Parker, M.L., Markeviciute, J., Fabian, A.C., Middleton,M., Lohfink, A., Kara, E., Pinto, C., 2015. Discovery of a 2-h high-frequency X-ray QPO and iron K alpha reverberation in the activegalaxy MS 2254.9-3712. MNRAS 449, 467–476. doi:10.1093/mnras/stv351, arXiv:1411.0684.
67

[4] Altamirano, D., Belloni, T., 2012. Discovery of High-frequency Quasi-periodic Oscillations in the Black Hole Candidate IGR J17091-3624.ApJ 747, L4. doi:10.1088/2041-8205/747/1/L4, arXiv:1201.2106.
[5] Altamirano, D., Casella, P., Patruno, A., Wijnands, R., van der Klis,M., 2008. Intermittent Millisecond X-Ray Pulsations from the NeutronStar X-Ray Transient SAX J1748.9-2021 in the Globular Cluster NGC6440. ApJ 674, L45–L48. doi:10.1086/528983, arXiv:0708.1316.
[6] Altamirano, D., Ingram, A., van der Klis, M., Wijnands, R., Linares,M., Homan, J., 2012. Low-frequency Quasi-periodic Oscillation fromthe 11 Hz Accreting Pulsar in Terzan 5: Not Frame Dragging. ApJ759, L20. doi:10.1088/2041-8205/759/1/L20, arXiv:1210.1494.
[7] Altamirano, D., Strohmayer, T., 2012. Low-frequency (11 mHz) Os-cillations in H1743-322: A New Class of Black Hole Quasi-periodicOscillations? ApJ 754, L23. doi:10.1088/2041-8205/754/2/L23,arXiv:1206.0476.
[8] Arevalo, P., Uttley, P., 2006. Investigating a fluctuating-accretionmodel for the spectral-timing properties of accreting black hole sys-tems. MNRAS 367, 801–814. doi:10.1111/j.1365-2966.2006.09989.x, arXiv:astro-ph/0512394.
[9] Armas Padilla, M., Wijnands, R., Altamirano, D., Mendez, M., Miller,J.M., Degenaar, N., 2014. An X-ray view of the very faint black holeX-ray transient Swift J1357.2-0933 during its 2011 outburst. MNRAS439, 3908–3915. doi:10.1093/mnras/stu243, arXiv:1308.4326.
[10] Arur, K., Maccarone, T.J., 2019. Nonlinear Variability of Quasi-Periodic Oscillations in GX 339-4. MNRAS doi:10.1093/mnras/stz1052, arXiv:1904.05895.
[11] Axelsson, M., Borgonovo, L., Larsson, S., 2005. Evolution of the 0.01-25 Hz power spectral components in Cygnus X-1. A&A 438, 999–1012.doi:10.1051/0004-6361:20042362, arXiv:astro-ph/0504446.
[12] Axelsson, M., Done, C., 2016. Revealing the nature of the QPO and itsharmonic in GX 339-4 using frequency-resolved spectroscopy. MNRAS458, 1778–1784. doi:10.1093/mnras/stw464, arXiv:1506.01102.
68

[13] Axelsson, M., Done, C., Hjalmarsdotter, L., 2014. An imperfect double:probing the physical origin of the low-frequency quasi-periodic oscilla-tion and its harmonic in black hole binaries. MNRAS 438, 657–662.doi:10.1093/mnras/stt2236, arXiv:1307.4396.
[14] Bachetti, M. et al., 2014. An ultraluminous X-ray source poweredby an accreting neutron star. Nature 514, 202–204. doi:10.1038/nature13791, arXiv:1410.3590.
[15] Bailyn, C.D., Orosz, J.A., McClintock, J.E., Remillard, R.A., 1995.Dynamical evidence for a black hole in the eclipsing X-ray nova GROJ1655 - 40. Nature 378, 157–159. doi:10.1038/378157a0.
[16] Bakala, P. et al., 2014. Power density spectra of modes of orbital motionin strongly curved space-time: obtaining the observable signal. MN-RAS 439, 1933–1939. doi:10.1093/mnras/stu076, arXiv:1401.4468.
[17] Balbus, S.A., Hawley, J.F., 1991. A powerful local shear instability inweakly magnetized disks. I - Linear analysis. II - Nonlinear evolution.ApJ 376, 214–233. doi:10.1086/170270.
[18] Banerjee, S., Chakraborty, C., Bhattacharyya, S., 2019. Align-ment and precession of a black hole misaligned with its accretiondisc: Application to Low Mass X-ray Binaries. arXiv e-prints ,arXiv:1905.12858arXiv:1905.12858.
[19] Bardeen, J.M., Petterson, J.A., 1975. The Lense-Thirring Effect andAccretion Disks around Kerr Black Holes. ApJ 195, L65. doi:10.1086/181711.
[20] Bardeen, J.M., Press, W.H., Teukolsky, S.A., 1972. Rotating BlackHoles: Locally Nonrotating Frames, Energy Extraction, and ScalarSynchrotron Radiation. ApJ 178, 347–370. doi:10.1086/151796.
[21] Beer, M.E., Podsiadlowski, P., 2002. The quiescent lightcurve and the evolutionary state of GRO J1655-40. MN-RAS 331, 351–360. doi:10.1046/j.1365-8711.2002.05189.x,arXiv:arXiv:astro-ph/0109136.
[22] Belloni, T., Hasinger, G., 1990. An atlas of aperiodic variability inHMXB. A&A 230, 103–119.
69

[23] Belloni, T., Homan, J., Casella, P., van der Klis, M., Nespoli, E.,Lewin, W.H.G., Miller, J.M., Mendez, M., 2005. The evolution ofthe timing properties of the black-hole transient GX 339-4 during its2002/2003 outburst. A&A 440, 207–222. doi:10.1051/0004-6361:20042457, arXiv:arXiv:astro-ph/0504577.
[24] Belloni, T., Psaltis, D., van der Klis, M., 2002. A Unified Description ofthe Timing Features of Accreting X-Ray Binaries. ApJ 572, 392–406.doi:10.1086/340290, arXiv:arXiv:astro-ph/0202213.
[25] Belloni, T.M., 2010. States and Transitions in Black Hole Binaries. Lec-ture Notes in Physics 794, 53–+. doi:10.1007/978-3-540-76937-8_3,arXiv:0909.2474.
[26] Belloni, T.M., Altamirano, D., 2013. Discovery of a 34 Hz quasi-periodic oscillation in the X-ray emission of GRS 1915+105. MNRAS432, 19–22. doi:10.1093/mnras/stt285, arXiv:1303.4934.
[27] Belloni, T.M., Bhattacharya, D., Caccese, P., Bhalerao, V., Vadawale,S., Yadav, J.S., 2019. A variable-frequency HFQPO in GRS 1915+105as observed with AstroSat. MNRAS 489, 1037–1043. doi:10.1093/mnras/stz2143, arXiv:1908.00437.
[28] Belloni, T.M., Motta, S.E., 2016. Transient Black Hole Binaries. ArXive-prints arXiv:1603.07872.
[29] Belloni, T.M., Sanna, A., Mendez, M., 2012. High-frequency quasi-periodic oscillations in black hole binaries. MNRAS 426, 1701–1709.doi:10.1111/j.1365-2966.2012.21634.x, arXiv:1207.2311.
[30] Belloni, T.M., Stella, L., 2014. Fast Variability from Black-Hole Binaries. Space Science Reviews 183, 43–60. doi:10.1007/s11214-014-0076-0, arXiv:1407.7373.
[31] Benlloch, S., Wilms, J., Edelson, R., Yaqoob, T., Staubert, R., 2001.Quasi-periodic Oscillation in Seyfert Galaxies: Significance Levels. TheCase of Markarian 766. The Astrophysical Journal 562, L121–L124.doi:10.1086/338252, arXiv:astro-ph/0110204.
[32] Boyd, P.T., Smale, A.P., Homan, J., Jonker, P.G., van der Klis, M.,Kuulkers, E., 2000. Canonical Timing and Spectral Behavior of LMC
70

X-3 in the Low/Hard State. ApJ 542, L127–L130. doi:10.1086/312931,arXiv:astro-ph/0009036.
[33] Caballero-Garcıa, M.D., Belloni, T., Zampieri, L., 2013. Quasi-periodicoscillations and energy spectra from the two brightest Ultra-LuminousX-ray sources in M82. MNRAS 436, 3262–3270. doi:10.1093/mnras/stt1807, arXiv:1309.6101.
[34] Cabanac, C., Henri, G., Petrucci, P.O., Malzac, J., Ferreira, J., Belloni,T.M., 2010. Variability of X-ray binaries from an oscillating hot corona.MNRAS 404, 738–748. doi:10.1111/j.1365-2966.2010.16340.x,arXiv:1001.2116.
[35] Casella, P., Belloni, T., Homan, J., Stella, L., 2004. Astudy of the low-frequency quasi-periodic oscillations in the X-ray light curves of the black hole candidate ¡ASTROBJ¿XTEJ1859+226¡/ASTROBJ¿. A&A 426, 587–600. doi:10.1051/0004-6361:20041231, arXiv:arXiv:astro-ph/0407262.
[36] Casella, P., Belloni, T., Stella, L., 2005. The ABC of Low-Frequency Quasi-periodic Oscillations in Black Hole Candidates:Analogies with Z Sources. ApJ 629, 403–407. doi:10.1086/431174,arXiv:arXiv:astro-ph/0504318.
[37] Chakrabarti, S.K., Debnath, D., Nandi, A., Pal, P.S., 2008. Evo-lution of the quasi-periodic oscillation frequency in GRO J1655-40- Implications for accretion disk dynamics. A&A 489, L41–L44.doi:10.1051/0004-6361:200810136, arXiv:0809.0876.
[38] Chakraborty, C., Bhattacharyya, S., 2017. A tilted and warpedinner accretion disc around a spinning black hole: an analyticalsolution. MNRAS 469, 3062–3068. doi:10.1093/mnras/stx1088,arXiv:1705.01850.
[39] Chen, W., Livio, M., Gehrels, N., 1993. The secondary maxima inblack hole X-ray nova light curves - Clues toward a complete picture.ApJ 408, L5–L8. doi:10.1086/186817.
[40] Chen, W., Shrader, C.R., Livio, M., 1997. The Properties of X-Rayand Optical Light Curves of X-Ray Novae. ApJ 491, 312–338. doi:10.1086/304921, arXiv:astro-ph/9707138.
71
[41] Corbel, S., Kaaret, P., Fender, R.P., Tzioumis, A.K., Tomsick,J.A., Orosz, J.A., 2005. Discovery of X-Ray Jets in the Mi-croquasar H1743-322. ApJ 632, 504–513. doi:10.1086/432499,arXiv:arXiv:astro-ph/0505526.
[42] De Falco, V., Motta, S., 2018. Polynomial approximation of the Lense-Thirring rigid precession frequency. MNRAS 476, 2040–2044. doi:10.1093/mnras/sty361, arXiv:1802.02866.
[43] de Ruiter, I., van den Eijnden, J., Ingram, A., Uttley, P., 2019. Asystematic study of the phase difference between QPO harmonics inblack hole X-ray binaries. MNRAS 485, 3834–3844. doi:10.1093/mnras/stz665, arXiv:1903.03135.
[44] Debnath, D., Chakrabarti, S.K., Mondal, S., 2014. Implementationof two-component advective flow solution in XSPEC. MNRAS 440,L121–L125. doi:10.1093/mnrasl/slu024, arXiv:1402.0989.
[45] Done, C., Gierlinski, M., Kubota, A., 2007. Modelling the behaviourof accretion flows in X-ray binaries. Everything you always wanted toknow about accretion but were afraid to ask. A&A 15, 1–66. doi:10.1007/s00159-007-0006-1, arXiv:0708.0148.
[46] Dunn, R.J.H., Fender, R.P., Kording, E.G., Belloni, T., Cabanac, C.,2010. A global spectral study of black hole X-ray binaries. MNRAS 403,61–82. doi:10.1111/j.1365-2966.2010.16114.x, arXiv:0912.0142.
[47] Durant, M., Gandhi, P., Shahbaz, T., Peralta, H.H., Dhillon, V.S.,2009. Multiwavelength spectral and high time resolution observationsof SWIFTJ1753.5-0127: new activity? MNRAS 392, 309–324. doi:10.1111/j.1365-2966.2008.14044.x, arXiv:0810.1141.
[48] Eardley, D.M., Lightman, A.P., Shapiro, S.L., 1975. Cygnus X-1 -A two-temperature accretion disk model which explains the observedhard X-ray spectrum. ApJ 199, L153–L155. doi:10.1086/181871.
[49] Fabian, A.C., Pringle, J.E., Rees, M.J., 1975. Tidal capture formationof binary systems and X-ray sources in globular clusters. MNRAS 172,15. doi:10.1093/mnras/172.1.15P.
72

[50] Fabian, A.C., Rees, M.J., Stella, L., White, N.E., 1989. X-ray fluores-cence from the inner disc in Cygnus X-1. MNRAS 238, 729–736.
[51] Fender, R. et al., 1999. Quenching of the Radio Jet during the X-RayHigh State of GX 339-4. ApJ 519, L165–L168. doi:10.1086/312128,arXiv:astro-ph/9905121.
[52] Fender, R.P., Belloni, T.M., Gallo, E., 2004. Towards a unified modelfor black hole X-ray binary jets. MNRAS 355, 1105–1118. doi:10.1111/j.1365-2966.2004.08384.x, arXiv:arXiv:astro-ph/0409360.
[53] Fender, R.P., Homan, J., Belloni, T.M., 2009. Jets from black holeX-ray binaries: testing, refining and extending empirical models forthe coupling to X-rays. MNRAS 396, 1370–1382. doi:10.1111/j.1365-2966.2009.14841.x, arXiv:0903.5166.
[54] Fragile, P.C., 2009. Effective Inner Radius of Tilted Black Hole Ac-cretion Disks. ApJ 706, L246–L250. doi:10.1088/0004-637X/706/2/L246, arXiv:0910.5721.
[55] Fragile, P.C., Blaes, O.M., Anninos, P., Salmonson, J.D., 2007. GlobalGeneral Relativistic Magnetohydrodynamic Simulation of a TiltedBlack Hole Accretion Disk. ApJ 668, 417–429. doi:10.1086/521092,arXiv:0706.4303.
[56] Fragile, P.C., Mathews, G.J., Wilson, J.R., 2001. Bardeen-PettersonEffect and Quasi-periodic Oscillations in X-Ray Binaries. ApJ 553,955–959. doi:10.1086/320990, arXiv:astro-ph/0007478.
[57] Fragile, P.C., Straub, O., Blaes, O., 2016. High-Frequency and Type-CQPOs from Oscillating, Precessing Hot, Thick Flow. ArXiv e-printsarXiv:1602.08082.
[58] Fragos, T., Tremmel, M., Rantsiou, E., Belczynski, K., 2010. BlackHole Spin-Orbit Misalignment in Galactic X-ray Binaries. ApJ 719,L79–L83. doi:10.1088/2041-8205/719/1/L79, arXiv:1001.1107.
[59] Franchini, A., Motta, S.E., Lodato, G., 2017. Constraining black holespins with low-frequency quasi-periodic oscillations in soft states. MN-RAS 467, 145–154. doi:10.1093/mnras/stw3363, arXiv:1701.01760.
73

[60] Frank, J., King, A., Raine, D.J., 2002. Accretion Power in Astro-physics: Third Edition. Cambridge University Press.
[61] Furst, F. et al., 2016. Discovery of Coherent Pulsations from the Ultra-luminous X-Ray Source NGC 7793 P13. ApJ 831, L14. doi:10.3847/2041-8205/831/2/L14, arXiv:1609.07129.
[62] Galeev, A.A., Rosner, R., Vaiana, G.S., 1979. Structured coronae ofaccretion disks. ApJ 229, 318–326. doi:10.1086/156957.
[63] Gandhi, P. et al., 2010. Rapid optical and X-ray timing observationsof GX339-4: multicomponent optical variability in the low/hard state.MNRAS 407, 2166–2192. doi:10.1111/j.1365-2966.2010.17083.x,arXiv:1005.4685.
[64] Garcıa, J., Dauser, T., Reynolds, C.S., Kallman, T.R., McClintock,J.E., Wilms, J., Eikmann, W., 2013. X-Ray Reflected Spectra fromAccretion Disk Models. III. A Complete Grid of Ionized ReflectionCalculations. ApJ 768, 146. doi:10.1088/0004-637X/768/2/146,arXiv:1303.2112.
[65] Garcıa, J., Kallman, T.R., 2010. X-ray Reflected Spectra from Accre-tion Disk Models. I. Constant Density Atmospheres. ApJ 718, 695–706.doi:10.1088/0004-637X/718/2/695, arXiv:1006.0485.
[66] Garcıa, J.A., Steiner, J.F., McClintock, J.E., Remillard, R.A., Grin-berg, V., Dauser, T., 2015. X-Ray Reflection Spectroscopy of theBlack Hole GX 339–4: Exploring the Hard State with Unprece-dented Sensitivity. ApJ 813, 84. doi:10.1088/0004-637X/813/2/84,arXiv:1505.03607.
[67] Gierlinski, M., Middleton, M., Ward, M., Done, C., 2008. A periodic-ity of 1hour in X-ray emission from the active galaxy RE J1034+396.Nature 455, 369–371. doi:10.1038/nature07277.
[68] Gierlinski, M., Zdziarski, A.A., 2005. Patterns of energy-dependent variability from Comptonization. MNRAS363, 1349–1360. doi:10.1111/j.1365-2966.2005.09527.x,arXiv:arXiv:astro-ph/0506388.
74

[69] Gilfanov, M., Churazov, E., Revnivtsev, M., 2000. Frequency-resolvedspectroscopy of Cyg X-1: fast variability of the reflected emission in thesoft state. MNRAS 316, 923–928. doi:10.1046/j.1365-8711.2000.03686.x, arXiv:astro-ph/0001450.
[70] Greene, J., Bailyn, C.D., Orosz, J.A., 2001. Optical and Infrared Pho-tometry of the Microquasar GRO J1655-40 in Quiescence. ApJ 554,1290–1297. doi:10.1086/321411, arXiv:arXiv:astro-ph/0101337.
[71] Haardt, F., Maraschi, L., 1991. A two-phase model for the X-ray emis-sion from Seyfert galaxies. ApJ 380, L51–L54. doi:10.1086/186171.
[72] Hasinger, G., van der Klis, M., 1989. Two patterns of correlated X-raytiming and spectral behaviour in low-mass X-ray binaries. A&A 225,79–96.
[73] Heil, L.M., Uttley, P., Klein-Wolt, M., 2015. Inclination-dependentspectral and timing properties in transient black hole X-ray bi-naries. MNRAS 448, 3348–3353. doi:10.1093/mnras/stv240,arXiv:1405.2026.
[74] Heil, L.M., Vaughan, S., Uttley, P., 2011. Quasi-periodic oscillations inXTE J1550-564: the rms-flux relation. MNRAS 411, L66–L70. doi:10.1111/j.1745-3933.2010.00997.x, arXiv:1011.6321.
[75] Hiemstra, B., Mendez, M., Done, C., Dıaz Trigo, M., Altamirano, D.,Casella, P., 2011. A strong and broad Fe line in the XMM-Newtonspectrum of the new X-ray transient and black hole candidate XTEJ1652-453. MNRAS 411, 137–150. doi:10.1111/j.1365-2966.2010.17661.x, arXiv:1004.4442.
[76] Hjellming, R.M., Rupen, M.P., 1995. Episodic ejection of relativisticjets by the X-ray transient GRO J1655 - 40. Nature 375, 464–468.doi:10.1038/375464a0.
[77] Homan, J., 2001. X-ray timing studies of low-mass x-ray binaries.Ph.D. thesis. University of Amsterdam.
[78] Homan, J., Buxton, M., Markoff, S., Bailyn, C.D., Nespoli, E., Belloni,T., 2005. Multiwavelength Observations of the 2002 Outburst of GX
75

339-4: Two Patterns of X-Ray-Optical/Near-Infrared Behavior. ApJ624, 295–306. doi:10.1086/428722, arXiv:arXiv:astro-ph/0501349.
[79] Homan, J., Wijnands, R., van der Klis, M., Belloni, T., van Paradijs,J., Klein-Wolt, M., Fender, R., Mendez, M., 2001. Correlated X-RaySpectral and Timing Behavior of the Black Hole Candidate XTE J1550-564: A New Interpretation of Black Hole States. ApJ 132, 377–402.doi:10.1086/318954, arXiv:arXiv:astro-ph/0001163.
[80] Huang, Y. et al., 2018. INSIGHT-HXMT Observations of the NewBlack Hole Candidate MAXI J1535-571: Timing Analysis. ApJ 866,122. doi:10.3847/1538-4357/aade4c, arXiv:1808.05318.
[81] Huppenkothen, D. et al., 2017. Detection of Very Low-frequency,Quasi-periodic Oscillations in the 2015 Outburst of V404 Cygni. ApJ834, 90. doi:10.3847/1538-4357/834/1/90, arXiv:1610.08653.
[82] Hynes, R. I. et al., 2003a. The remarkable rapid X-ray, ultraviolet, opti-cal and infrared variability in the black hole XTE J1118+480. MonthlyNotices of the Royal Astronomical Society 345, 292–310. doi:10.1046/j.1365-8711.2003.06938.x, arXiv:astro-ph/0306626.
[83] Hynes, R.I., Steeghs, D., Casares, J., Charles, P.A., O’Brien, K., 2003b.Dynamical Evidence for a Black Hole in GX 339-4. ApJ 583, L95–L98.doi:10.1086/368108, arXiv:arXiv:astro-ph/0301127.
[84] Ichimaru, S., 1977. Bimodal behavior of accretion disks - Theory andapplication to Cygnus X-1 transitions. ApJ 214, 840–855. doi:10.1086/155314.
[85] Imamura, J.N., Kristian, J., Middleditch, J., Steiman-Cameron, T.Y.,1990. The 8 Second Optical Quasi-periodic Oscillations in GX 339-4.The Astrophysical Journal 365, 312. doi:10.1086/169484.
[86] Ingram, A., Done, C., 2010. A physical interpretation of thevariability power spectral components in accreting neutron stars.MNRAS 405, 2447–2452. doi:10.1111/j.1365-2966.2010.16614.x,arXiv:0907.5485.
[87] Ingram, A., Done, C., 2011. A physical model for the contin-uum variability and quasi-periodic oscillation in accreting black holes.
76

MNRAS 415, 2323–2335. doi:10.1111/j.1365-2966.2011.18860.x,arXiv:1101.2336.
[88] Ingram, A., Done, C., 2012a. Modelling variability in black hole bi-naries: linking simulations to observations. MNRAS 419, 2369–2378.doi:10.1111/j.1365-2966.2011.19885.x, arXiv:1108.0789.
[89] Ingram, A., Done, C., 2012b. The effect of frame dragging on the ironKα line in X-ray binaries. MNRAS 427, 934–947. doi:10.1111/j.1365-2966.2012.21907.x, arXiv:1208.0728.
[90] Ingram, A., Done, C., Fragile, P.C., 2009. Low-frequency quasi-periodicoscillations spectra and Lense-Thirring precession. MNRAS 397, L101–L105. doi:10.1111/j.1745-3933.2009.00693.x.
[91] Ingram, A., Maccarone, T.J., Poutanen, J., Krawczynski, H.,2015. Polarization Modulation from Lense-Thirring Precession inX-Ray Binaries. ApJ 807, 53. doi:10.1088/0004-637X/807/1/53,arXiv:1505.00015.
[92] Ingram, A., Mastroserio, G., Dauser, T., Hovenkamp, P., van der Klis,M., Garcıa, J.A., 2019. A public relativistic transfer function modelfor X-ray reverberation mapping of accreting black holes. MNRAS 488,324–347. doi:10.1093/mnras/stz1720, arXiv:1906.08310.
[93] Ingram, A., Motta, S., 2014. Solutions to the relativistic preces-sion model. MNRAS 444, 2065–2070. doi:10.1093/mnras/stu1585,arXiv:1408.0884.
[94] Ingram, A., van der Klis, M., 2015. Phase-resolved spectroscopy oflow-frequency quasi-periodic oscillations in GRS 1915+105. MNRAS446, 3516–3525. doi:10.1093/mnras/stu2373, arXiv:1411.1967.
[95] Ingram, A., van der Klis, M., Middleton, M., Altamirano, D., Uttley,P., 2017. Tomographic reflection modelling of quasi-periodic oscilla-tions in the black hole binary H 1743-322. MNRAS 464, 2979–2991.doi:10.1093/mnras/stw2581, arXiv:1610.00948.
[96] Ingram, A., van der Klis, M., Middleton, M., Done, C., Altami-rano, D., Heil, L., Uttley, P., Axelsson, M., 2016. A quasi-periodicmodulation of the iron line centroid energy in the black hole binary
77
H1743-322. MNRAS 461, 1967–1980. doi:10.1093/mnras/stw1245,arXiv:1607.02866.
[97] Ingram, A., van der Klis, M.v.d., 2013. An exact analytic treatment ofpropagating mass accretion rate fluctuations in X-ray binaries. MNRAS434, 1476–1485. doi:10.1093/mnras/stt1107, arXiv:1306.3823.
[98] Ingram, A.R., Maccarone, T.J., 2017. An observational method forfast stochastic X-ray polarimetry timing. MNRAS 471, 4206–4217.doi:10.1093/mnras/stx1881, arXiv:1707.06659.
[99] Israel, G. L. et al., 2017a. An accreting pulsar with extreme propertiesdrives an ultraluminous x-ray source in NGC 5907. Science 355, 817–819. doi:10.1126/science.aai8635, arXiv:1609.07375.
[100] Israel, G. L. et al., 2017b. Discovery of a 0.42-s pulsar in the ul-traluminous X-ray source NGC 7793 P13. MNRAS 466, L48–L52.doi:10.1093/mnrasl/slw218, arXiv:1609.06538.
[101] Ivanov, P.B., Illarionov, A.F., 1997. The oscillatory shape of the sta-tionary twisted disc around a Kerr black hole. MNRAS 285, 394–402.doi:10.1093/mnras/285.2.394.
[102] Jonker, P.G., van der Klis, M., Wijnands, R., 1999. A Persis-tent ˜1 HZ Quasi-periodic Oscillation in the Dipping Low-Mass X-Ray Binary 4U 1323-62. ApJ 511, L41–L44. doi:10.1086/311840,arXiv:astro-ph/9811404.
[103] Kalamkar, M., Casella, P., Uttley, P., O’Brien, K., Russell, D., Mac-carone, T., van der Klis, M., Vincentelli, F., 2015. Detection of thefirst infra-red quasi periodic oscillation in a black hole X-ray binary.ArXiv e-prints arXiv:1510.08907.
[104] Kara, E. et al., 2019. The corona contracts in a black-hole tran-sient. Nature 565, 198–201. doi:10.1038/s41586-018-0803-x,arXiv:1901.03877.
[105] Karas, V., Martocchia, A., Subr, L., 2001. Variable Line ProfilesDue to Non-Axisymmetric Patterns in an Accretion Disc around a Ro-tating Black Hole. PASJ 53, 189–199. doi:10.1093/pasj/53.2.189,arXiv:astro-ph/0102460.
78

[106] Kato, S., 2001. Basic Properties of Thin-Disk Oscillations 1. PASJ 53,1–24. doi:10.1093/pasj/53.1.1.
[107] Kato, S., 2004. Resonant Excitation of Disk Oscillations by Warps: AModel of kHz QPOs. PASJ 56, 905–922. doi:10.1093/pasj/56.5.905,arXiv:astro-ph/0409051.
[108] Kato, S., Fukue, J., 1980. Trapped Radial Oscillations of GaseousDisks around a Black Hole. PASJ 32, 377.
[109] Kerr, R.P., 1963. Gravitational Field of a Spinning Mass as an Exampleof Algebraically Special Metrics. Physical Review Letters 11, 237–238.doi:10.1103/PhysRevLett.11.237.
[110] Kim, Y.C., Powers, E.J., 1979. Digital bispectral analysis and its appli-cations to nonlinear wave interactions. IEEE Transactions on PlasmaScience 7, 120–131. doi:10.1109/TPS.1979.4317207.
[111] King, A., Nixon, C., 2016. Black holes in stellar-mass binary systems:expiating original spin? MNRAS 462, 464–467. doi:10.1093/mnras/stw1598, arXiv:1607.02144.
[112] Kumar, S., Pringle, J.E., 1985. Twisted accretion discs - The Bardeen-Petterson effect. MNRAS 213, 435–442. doi:10.1093/mnras/213.3.435.
[113] Kuulkers, E., van der Klis, M., van Paradijs, J., 1995. Burstlike Eventsin the Z Source Cygnus X-2. The Astrophysical Journal 450, 748.doi:10.1086/176180.
[114] Kylafis, N.D., Belloni, T.M., 2015. Accretion and ejection in black-hole X-ray transients. A&A 574, A133. doi:10.1051/0004-6361/201425106, arXiv:1412.7662.
[115] Lachowicz, P., Done, C., 2010. Quasi-periodic oscillations un-der wavelet microscope: the application of Matching Pursuit al-gorithm. A&A 515, A65+. doi:10.1051/0004-6361/200913144,arXiv:0908.2740.
[116] Lense, J., Thirring, H., 1918. Uber den Einfluß der Eigenrotation derZentralkorper auf die Bewegung der Planeten und Monde nach derEinsteinschen Gravitationstheorie. Physikalische Zeitschrift 19, 156.
79

[117] Lewin, W.H.G., van Paradijs, J., van der Klis, M., 1988. A review ofquasi-periodic oscillations in low-mass X-ray binaries. Space ScienceReviews 46, 273–377. doi:10.1007/BF00212242.
[118] Lightman, A.P., Rybicki, G.B., 1980. Inverse Compton reflection - Thesteady-state theory. ApJ 236, 928–944. doi:10.1086/157820.
[119] Lin, D., Altamirano, D., Homan, J., Remillard, R.A., Wijnands, R.,Belloni, T., 2009. Type I X-ray Bursts from the Neutron-star TransientXTE J1701-462. ApJ 699, 60–65. doi:10.1088/0004-637X/699/1/60,arXiv:0904.2187.
[120] Liska, M., Hesp, C., Tchekhovskoy, A., Ingram, A., van der Klis, M.,Markoff, S., 2018. Formation of precessing jets by tilted black holediscs in 3D general relativistic MHD simulations. MNRAS 474, L81–L85. doi:10.1093/mnrasl/slx174, arXiv:1707.06619.
[121] Liska, M., Hesp, C., Tchekhovskoy, A., Ingram, A., van der Klis,M., Markoff, S.B., 2019a. A Phase Lag between Disk and Coronain GRMHD Simulations of Precessing Tilted Accretion Disks. arXive-prints , arXiv:1901.05970arXiv:1901.05970.
[122] Liska, M., Hesp, C., Tchekhovskoy, A., Ingram, A., van der Klis,M., Markoff, S.B., Van Moer, M., 2019b. Disc Tearing and Bardeen-Petterson Alignment in GRMHD Simulations of Highly Tilted ThinAccretion Discs. arXiv e-prints , arXiv:1904.08428arXiv:1904.08428.
[123] Liska, M., Tchekhovskoy, A., Ingram, A., van der Klis, M.,2019c. Bardeen-Petterson alignment, jets, and magnetic truncationin GRMHD simulations of tilted thin accretion discs. MNRAS 487,550–561. doi:10.1093/mnras/stz834.
[124] Liu, S., Melia, F., 2002. Spin-induced Disk Precession in the Su-permassive Black Hole at the Galactic Center. ApJ 573, L23–L26.doi:10.1086/341991, arXiv:astro-ph/0205487.
[125] Lodato, G., Price, D.J., 2010. On the diffusive propagation of warpsin thin accretion discs. MNRAS 405, 1212–1226. doi:10.1111/j.1365-2966.2010.16526.x, arXiv:1002.2973.
80

[126] Lubow, S.H., Ogilvie, G.I., 2000. On the Tilting of Protostellar Disksby Resonant Tidal Effects. ApJ 538, 326–340. doi:10.1086/309101,arXiv:astro-ph/0003028.
[127] Lubow, S.H., Ogilvie, G.I., Pringle, J.E., 2002. The evolution of awarped disc around a Kerr black hole. MNRAS 337, 706–712. doi:10.1046/j.1365-8711.2002.05949.x, arXiv:astro-ph/0208206.
[128] Luminet, J.P., 1979. Image of a spherical black hole with thin accretiondisk. A&A 75, 228–235.
[129] Lyubarskii, Y.E., 1997. Flicker noise in accretion discs. MNRAS 292,679. doi:10.1093/mnras/292.3.679.
[130] Maccarone, T.J., 2002. On the misalignment of jets in microquasars.MNRAS 336, 1371–1376. doi:10.1046/j.1365-8711.2002.05876.x,arXiv:astro-ph/0209105.
[131] Maccarone, T.J., 2005. Constraints on jet X-ray emission in low/hard-state X-ray binaries. MNRAS 360, L68–L72. doi:10.1111/j.1745-3933.2005.00047.x, arXiv:arXiv:astro-ph/0503689.
[132] Maccarone, T.J., 2013. The biphase explained: understanding theasymmetries in coupled Fourier components of astronomical timeseries. MNRAS 435, 3547–3558. doi:10.1093/mnras/stt1546,arXiv:1308.3150.
[133] Maccarone, T.J., Uttley, P., van der Klis, M., Wijnands, R.A.D.,Coppi, P.S., 2011. Coupling between QPOs and broad-band noise com-ponents in GRS 1915+105. MNRAS 413, 1819–1827. doi:10.1111/j.1365-2966.2011.18273.x, arXiv:1101.1979.
[134] Machida, M., Matsumoto, R., 2008. Excitation of Low-FrequencyQPOs in Black-Hole Accretion Flows. PASJ 60, 613–626. doi:10.1093/pasj/60.3.613, arXiv:0802.3779.
[135] Madejski, G.M., Done, C., Turner, T.J., Mushotzky, R.F., Serlemitsos,P., Fiore, F., Sikora, M., Begelman, M.C., 1993. Solving the mysteryof the X-ray periodicity in the Seyfert galaxy NGC6814. Nature 365,626–628. doi:10.1038/365626a0.
81

[136] Mancuso, G.C., Altamirano, D., Garcıa, F., Lyu, M., Mendez, M.,Combi, J.A., Dıaz-Trigo, M., in’t Zand, J.J.M., 2019. Discovery ofmillihertz quasi-periodic oscillations in the X-ray binary EXO 0748-676. Monthly Notices of the Royal Astronomical Society 486, L74–L79.doi:10.1093/mnrasl/slz057, arXiv:1905.01956.
[137] Martin, R.G., Tout, C.A., Pringle, J.E., 2008. Alignment time-scale ofthe microquasar GRO J1655-40. MNRAS 387, 188–196. doi:10.1111/j.1365-2966.2008.13148.x, arXiv:0802.3912.
[138] Mastroserio, G., Ingram, A., van der Klis, M., 2018. Multi-time-scaleX-ray reverberation mapping of accreting black holes. MNRAS 475,4027–4042. doi:10.1093/mnras/sty075, arXiv:1801.03100.
[139] Mendez, M., Altamirano, D., Belloni, T., Sanna, A., 2013. The phaselags of high-frequency quasi-periodic oscillations in four black hole can-didates. MNRAS doi:10.1093/mnras/stt1431, arXiv:1308.0142.
[140] Merloni, A., Vietri, M., Stella, L., Bini, D., 1999. On gravitomagneticprecession around black holes. MNRAS 304, 155–159. doi:10.1046/j.1365-8711.1999.02307.x, arXiv:astro-ph/9811198.
[141] Middleditch, J., Priedhorsky, W.C., 1986. Discovery of rapid quasi-periodic oscillations in Scorpius X-1. ApJ 306, 230–237. doi:10.1086/164335.
[142] Middleton, M., Done, C., 2010. The X-ray binary analogy to the firstAGN quasi-periodic oscillation. Monthly Notices of the Royal Astro-nomical Society 403, 9–16. doi:10.1111/j.1365-2966.2009.15969.x.
[143] Miller, M.C., 1999. Effects of Radiation Forces on the Frequency ofGravitomagnetic Precession near Neutron Stars. ApJ 520, 256–261.doi:10.1086/307420, arXiv:astro-ph/9801295.
[144] Miller-Jones, J. C. A. et al., 2019. A rapidly changing jet orientation inthe stellar-mass black-hole system V404 Cygni. Nature 569, 374–377.doi:10.1038/s41586-019-1152-0.
[145] Mirabel, F., 2017. The formation of stellar black holes. New AstronomyReviews 78, 1–15. doi:10.1016/j.newar.2017.04.002.
82

[146] Mittaz, J.P.D., Branduardi-Raymont, G., 1989. The flux and spectralvariability of NGC 6814 as observed with EXOSAT. Monthly Notices ofthe Royal Astronomical Society 238, 1029–1046. doi:10.1093/mnras/238.3.1029.
[147] Miyamoto, S., Kimura, K., Kitamoto, S., Dotani, T., Ebisawa, K.,1991. X-ray variability of GX 339 - 4 in its very high state. ApJ 383,784–807. doi:10.1086/170837.
[148] Miyamoto, S., Kitamoto, S., 1991. A jet model for a very high state ofGX 339 - 4. ApJ 374, 741–743. doi:10.1086/170158.
[149] Miyamoto, S., Kitamoto, S., Hayashida, K., Egoshi, W., 1995. LargeHysteretic Behavior of Stellar Black Hole Candidate X-Ray Binaries.The Astrophysical Journal 442, L13. doi:10.1086/187804.
[150] Miyamoto, S., Kitamoto, S., Iga, S., Negoro, H., Terada, K., 1992.Canonical time variations of X-rays from black hole candidates in thelow-intensity state. ApJ 391, L21–L24. doi:10.1086/186389.
[151] Molteni, D., Sponholz, H., Chakrabarti, S.K., 1996. Resonance Oscilla-tion of Radiative Shock Waves in Accretion Disks around Compact Ob-jects. ApJ 457, 805. doi:10.1086/176775, arXiv:astro-ph/9508022.
[152] Morgan, E.H., Remillard, R.A., Greiner, J., 1997. RXTE Observationsof QPOs in the Black Hole Candidate GRS 1915+105. ApJ 482, 993–+.doi:10.1086/304191.
[153] Morsink, S.M., Stella, L., 1999. Relativistic Precession around RotatingNeutron Stars: Effects Due to Frame Dragging and Stellar Oblateness.ApJ 513, 827–844. doi:10.1086/306876, arXiv:astro-ph/9808227.
[154] Motch, C., Ricketts, M.J., Page, C.G., Ilovaisky, S.A., Chevalier, C.,1983. Simultaneous X-ray/optical observations of GX339-4 during theMay 1981 optically bright state. A&A 119, 171–176.
[155] Motta, S. et al., 2011a. X-ray bursts and burst oscillations fromthe slowly spinning X-ray pulsar IGR J17480-2446 (Terzan 5).MNRAS 414, 1508–1516. doi:10.1111/j.1365-2966.2011.18483.x,arXiv:1102.1368.
83

[156] Motta, S., Homan, J., Munoz Darias, T., Casella, P., Belloni, T.M.,Hiemstra, B., Mendez, M., 2012. Discovery of two simultaneous non-harmonically related quasi-periodic oscillations in the 2005 outburst ofthe black hole binary GRO J1655-40. MNRAS 427, 595–606. doi:10.1111/j.1365-2966.2012.22037.x, arXiv:1209.0327.
[157] Motta, S., Munoz-Darias, T., Casella, P., Belloni, T., Homan, J.,2011b. Low-frequency oscillations in black holes: a spectral-timingapproach to the case of GX 339-4. MNRAS 418, 2292–2307. doi:10.1111/j.1365-2966.2011.19566.x, arXiv:1108.0540.
[158] Motta, S.E., Belloni, T.M., Stella, L., Munoz-Darias, T., Fender, R.,2014a. Precise mass and spin measurements for a stellar-mass blackhole through X-ray timing: the case of GRO J1655-40. MNRAS 437,2554–2565. doi:10.1093/mnras/stt2068, arXiv:1309.3652.
[159] Motta, S.E., Casella, P., Henze, M., Munoz-Darias, T., Sanna, A.,Fender, R., Belloni, T., 2015. Geometrical constraints on the originof timing signals from black holes. MNRAS 447, 2059–2072. doi:10.1093/mnras/stu2579, arXiv:1404.7293.
[160] Motta, S.E., Franchini, A., Lodato, G., Mastroserio, G., 2018. On thedifferent flavours of Lense-Thirring precession around accreting stellarmass black holes. MNRAS 473, 431–439. doi:10.1093/mnras/stx2358,arXiv:1709.02608.
[161] Motta, S.E., Munoz-Darias, T., Sanna, A., Fender, R., Belloni, T.,Stella, L., 2014b. Black hole spin measurements through the relativis-tic precession model: XTE J1550-564. MNRAS doi:10.1093/mnrasl/slt181, arXiv:1312.3114.
[162] Motta, S.E., Rouco-Escorial, A., Kuulkers, E., Munoz-Darias, T.,Sanna, A., 2017. Links between quasi-periodic oscillations and ac-cretion states in neutron star low mass X-ray binaries. ArXiv e-printsarXiv:1703.01263.
[163] Munoz-Darias, T., Fender, R.P., Motta, S.E., Belloni, T.M., 2014.Black hole-like hysteresis and accretion states in neutron star low-massX-ray binaries. MNRAS 443, 3270–3283. doi:10.1093/mnras/stu1334,arXiv:1407.1318.
84

[164] Munoz-Darias, T., Motta, S., Stiele, H., Belloni, T.M., 2011. The blackhole candidate MAXI J1659-152: spectral and timing analysis duringits 2010 outburst. MNRAS 415, 292–300. doi:10.1111/j.1365-2966.2011.18702.x, arXiv:1103.2309.
[165] Mucciarelli, P., Casella, P., Belloni, T., Zampieri, L., Ranalli, P.,2006. A variable Quasi-Periodic Oscillation in M82 X-1. Timingand spectral analysis of XMM-Newton and RossiXTE observations.MNRAS 365, 1123–1130. doi:10.1111/j.1365-2966.2005.09754.x,arXiv:astro-ph/0509796.
[166] Nealon, R., Price, D.J., Nixon, C.J., 2015. On the Bardeen-Pettersoneffect in black hole accretion discs. MNRAS 448, 1526–1540. doi:10.1093/mnras/stv014, arXiv:1501.01687.
[167] Nelson, R.P., Papaloizou, J.C.B., 2000. Hydrodynamic simulations ofthe Bardeen-Petterson effect. MNRAS 315, 570–586. doi:10.1046/j.1365-8711.2000.03478.x, arXiv:astro-ph/0001439.
[168] Nespoli, E., Belloni, T., Homan, J., Miller, J.M., Lewin, W.H.G.,Mendez, M., van der Klis, M., 2003. A transient variable 6 HzQPO from GX 339-4. A&A 412, 235–240. doi:10.1051/0004-6361:20031423, arXiv:arXiv:astro-ph/0309437.
[169] Nixon, C., King, A., 2016. Warp Propagation in Astrophysical Discs.volume 905. p. 45. doi:10.1007/978-3-319-19416-5_2.
[170] Nixon, C., King, A., Price, D., Frank, J., 2012. Tearing up the Disk:How Black Holes Accrete. ApJ 757, L24. doi:10.1088/2041-8205/757/2/L24, arXiv:1209.1393.
[171] Novikov, I.D., Thorne, K.S., 1973. Astrophysics of black holes., in: De-witt, C., Dewitt, B.S. (Eds.), Black Holes (Les Astres Occlus), Gordonand Breach, New York. pp. 343–450.
[172] Ogilvie, G.I., 1999. The non-linear fluid dynamics of a warped accretiondisc. MNRAS 304, 557–578. doi:10.1046/j.1365-8711.1999.02340.x, arXiv:astro-ph/9812073.
[173] Okazaki, A.T., Kato, S., Fukue, J., 1987. Global trapped oscillationsof relativistic accretion disks. PASJ 39, 457–473.
85

[174] O’Neill, S.M., Reynolds, C.S., Miller, M.C., Sorathia, K.A., 2011. Low-frequency Oscillations in Global Simulations of Black Hole Accretion.ApJ 736, 107. doi:10.1088/0004-637X/736/2/107, arXiv:1009.1882.
[175] Papaloizou, J.C.B., Pringle, J.E., 1983. The time-dependence of non-planar accretion discs. MNRAS 202, 1181–1194.
[176] Pasham, D. R. et al., 2019. A loud quasi-periodic oscillation aftera star is disrupted by a massive black hole. Science 363, 531–534.doi:10.1126/science.aar7480, arXiv:1810.10713.
[177] Pasham, D.R., Strohmayer, T.E., Mushotzky, R.F., 2014. A 400-solar-mass black hole in the galaxy M82. Nature 513, 74–76. doi:10.1038/nature13710, arXiv:1501.03180.
[178] Pawar, D.D., Motta, S., Shanthi, K., Bhattacharya, D., Belloni, T.,2015. On the modulation of low-frequency quasi-periodic oscillationsin black hole transients. MNRAS 448, 1298–1304. doi:10.1093/mnras/stv024, arXiv:1501.01823.
[179] Press, W.H., Teukolsky, S.A., Vetterling, W.T., Flannery, B.P., 1992.Numerical recipes in FORTRAN. The art of scientific computing. Cam-bridge: University Press, —c1992, 2nd ed.
[180] Pringle, J.E., 1992. A simple approach to the evolution of twistedaccretion discs. MNRAS 258, 811–818. doi:10.1093/mnras/258.4.811.
[181] Pringle, J.E., 1996. Self-induced warping of accretion discs. MNRAS281, 357–361. doi:10.1093/mnras/281.1.357.
[182] Pringle, J.E., 1999. The General Physics of WARPS, in: Sellwood,J.A., Goodman, J. (Eds.), Astrophysical Discs - an EC Summer School,volume 160 of Astronomical Society of the Pacific Conference Series.p. 53.
[183] Psaltis, D., Belloni, T., van der Klis, M., 1999. Correlations in Quasi-periodic Oscillation and Noise Frequencies among Neutron Star andBlack Hole X-Ray Binaries. ApJ 520, 262–270. doi:10.1086/307436,arXiv:arXiv:astro-ph/9902130.
86

[184] Psaltis, D., Norman, C., 2000. On the Origin of Quasi-Periodic Oscil-lations and Broad-band Noise in Accreting Neutron Stars and BlackHoles. ArXiv Astrophysics e-prints arXiv:arXiv:astro-ph/0001391.
[185] Qu, J.L., Lu, F.J., Lu, Y., Song, L.M., Zhang, S., Ding, G.Q., Wang,J.M., 2010. The Energy Dependence of the Centroid Frequency andPhase Lag of the Quasi-periodic Oscillations in GRS 1915+105. ApJ710, 836–842. doi:10.1088/0004-637X/710/1/836, arXiv:0912.4769.
[186] Radhakrishnan, V., Srinivasan, G., 1982. On the origin of the recentlydiscovered ultra-rapid pulsar. Current Science 51, 1096–1099.
[187] Rao, F., Belloni, T., Stella, L., Zhang, S.N., Li, T., 2010. Low-frequency Oscillations in XTE J1550-564. ApJ 714, 1065–1071. doi:10.1088/0004-637X/714/2/1065, arXiv:1003.3285.
[188] Rapisarda, S., Ingram, A., van der Klis, M., 2014. Evolution of thehot flow of MAXI J1543-564. MNRAS 440, 2882–2893. doi:10.1093/mnras/stu461, arXiv:1403.2308.
[189] Rapisarda, S., Ingram, A., van der Klis, M., 2017. Modelling hardand soft states of Cygnus X-1 with propagating mass accretion ratefluctuations. MNRAS 472, 3821–3832. doi:10.1093/mnras/stx2110,arXiv:1708.04182.
[190] Ratti, E. M. et al., 2012. The black hole candidate XTE J1752-223 to-wards and in quiescence: optical and simultaneous X-ray-radio obser-vations. MNRAS 423, 2656–2667. doi:10.1111/j.1365-2966.2012.21071.x, arXiv:1204.2735.
[191] Remillard, R., McClintock, J., 2006. X-Ray Properties of Black-HoleBinaries. Annual Reviews 44, 49–92. doi:10.1146/annurev.astro.44.051905.092532, arXiv:arXiv:astro-ph/0606352.
[192] Remillard, R.A., Morgan, E.H., McClintock, J.E., Bailyn, C.D., Orosz,J.A., 1999. RXTE Observations of 0.1-300 HZ Quasi-periodic Os-cillationsin the Microquasar GRO J1655-40. ApJ 522, 397–412.doi:10.1086/307606.
87

[193] Remillard, R.A., Muno, M.P., McClintock, J.E., Orosz, J.A., 2002.Evidence for Harmonic Relationships in the High-Frequency Quasi-periodic Oscillations of XTE J1550-564 and GRO J1655-40. ApJ 580,1030–1042. doi:10.1086/343791, arXiv:arXiv:astro-ph/0202305.
[194] Revnivtsev, M., Churazov, E., Gilfanov, M., Sunyaev, R., 2001. Newclass of low frequency QPOs: Signature of nuclear burning or accre-tion disk instabilities? A&A 372, 138–144. doi:10.1051/0004-6361:20010434, arXiv:arXiv:astro-ph/0011110.
[195] Revnivtsev, M., Gilfanov, M., Churazov, E., 1999. The frequency re-solved spectroscopy of CYG X-1: fast variability of the Fe K α line.A&A 347, L23–L26. arXiv:astro-ph/9906198.
[196] Revnivtsev, M.G., Borozdin, K.N., Priedhorsky, W.C., Vikhlinin, A.,2000. Rossi X-Ray Timing Explorer Observations of an Outburst ofRecurrent X-Ray Nova GS 1354-644. ApJ 530, 955–965. doi:10.1086/308386, arXiv:astro-ph/9905380.
[197] Ryu, D., Chakrabarti, S.K., Molteni, D., 1997. Zero-Energy RotatingAccretion Flows near a Black Hole. ApJ 474, 378–388. doi:10.1086/303461, arXiv:astro-ph/9607051.
[198] Samimi, J. et al., 1979. GX339-4: a new black hole candidate. Nature278, 434–436. doi:10.1038/278434a0.
[199] Schnittman, J.D., Homan, J., Miller, J.M., 2006a. A Precessing RingModel for Low-Frequency Quasi-periodic Oscillations. ApJ 642, 420–426. doi:10.1086/500923, arXiv:astro-ph/0512595.
[200] Schnittman, J.D., Krolik, J.H., Hawley, J.F., 2006b. Light Curvesfrom an MHD Simulation of a Black Hole Accretion Disk. ApJ 651,1031–1048. doi:10.1086/507421, arXiv:astro-ph/0606615.
[201] Shakura, N.I., Sunyaev, R.A., 1973. Black holes in binary systems.Observational appearance. A&A 24, 337–355.
[202] Shaposhnikov, N., Titarchuk, L., 2006. Comprehensive Analysis ofRXTE Data from Cygnus X-1: Spectral Index-Quasi-Periodic Os-cillation Frequency-Luminosity Correlations. ApJ 643, 1098–1113.doi:10.1086/503272, arXiv:arXiv:astro-ph/0602091.
88

[203] Smith, D.M., Heindl, W.A., Swank, J., Leventhal, M., Mirabel, I.F.,Rodriguez, L.F., 1997. X-Ray Timing in 1E 1740.7-2942 and GRS1758-258. ApJ 489, L51–L54. doi:10.1086/310963.
[204] Sobczak, G.J., Remillard, R.A., Muno, M.P., McClintock, J.E.,2000. Characterizing the Low-Frequency QPO behavior ofthe X-ray Nova XTE J1550-564. arXiv e-prints , astro–ph/0004215arXiv:astro-ph/0004215.
[205] Sobolewska, M.A., Zycki, P.T., 2006. Spectral and Fourier anal-yses of X-ray quasi-periodic oscillations in accreting black holes.MNRAS 370, 405–414. doi:10.1111/j.1365-2966.2006.10489.x,arXiv:arXiv:astro-ph/0603024.
[206] Steiner, J.F., McClintock, J.E., 2012. Modeling the Jet Kinematics ofthe Black Hole Microquasar XTE J1550-564: A Constraint on Spin-Orbit Alignment. ApJ 745, 136. doi:10.1088/0004-637X/745/2/136,arXiv:1110.6849.
[207] Steiner, J.F., McClintock, J.E., Reid, M.J., 2012. The Distance, Incli-nation, and Spin of the Black Hole Microquasar H1743-322. ApJ 745,L7. doi:10.1088/2041-8205/745/1/L7, arXiv:1111.2388.
[208] Stella, L., Vietri, M., 1998. Lense-Thirring Precession and Quasi-periodic Oscillations in Low-Mass X-Ray Binaries. ApJ 492, L59+.doi:10.1086/311075, arXiv:arXiv:astro-ph/9709085.
[209] Stella, L., Vietri, M., Morsink, S.M., 1999. Correlations in the Quasi-periodic Oscillation Frequencies of Low-Mass X-Ray Binaries and theRelativistic Precession Model. ApJ 524, L63–L66. doi:10.1086/312291, arXiv:arXiv:astro-ph/9907346.
[210] Stevens, A.L., Uttley, P., 2016. Phase-Resolved Spectroscopy ofType B Quasi-Periodic Oscillations in GX 339-4. ArXiv e-printsarXiv:1605.01753.
[211] Stiele, H., Belloni, T.M., Kalemci, E., Motta, S., 2013. Relations be-tween X-ray timing features and spectral parameters of Galactic blackhole X-ray binaries. MNRAS 429, 2655–2661. doi:10.1093/mnras/sts548, arXiv:1212.0866.
89

[212] Strohmayer, T.E., 2001. Discovery of a 450 HZ Quasi-periodic Os-cillation from the Microquasar GRO J1655-40 with the Rossi X-RayTiming Explorer. ApJ 552, L49–L53. doi:10.1086/320258.
[213] Strohmayer, T. E. et al., 2018. NICER Discovers mHz Oscillations inthe “Clocked” Burster GS 1826-238. The Astrophysical Journal 865,63. doi:10.3847/1538-4357/aada14, arXiv:1808.04294.
[214] Strohmayer, T.E., Mushotzky, R.F., 2009. Evidence for anIntermediate-mass Black Hole in NGC 5408 X-1. ApJ 703, 1386–1393.doi:10.1088/0004-637X/703/2/1386, arXiv:0911.1076.
[215] Strohmayer, T.E., Smith, E.A., 2011. Discovery of mHz QPOs fromthe LMXB 4U 1323-619. The Astronomer’s Telegram 3258, 1.
[216] Strohmayer, T.E., Zhang, W., Swank, J.H., Smale, A., Titarchuk, L.,Day, C., Lee, U., 1996. Millisecond X-Ray Variability from an Accret-ing Neutron Star System. ApJ 469, L9. doi:10.1086/310261.
[217] Su, Y.H., Chou, Y., Hu, C.P., Yang, T.C., 2015. Characterizing Inter-mittency of 4-Hz Quasi-periodic Oscillation in XTE J1550-564 UsingHilbert-Huang Transform. ApJ 815, 74. doi:10.1088/0004-637X/815/1/74, arXiv:1510.09122.
[218] Sunyaev, R.A., Titarchuk, L.G., 1985. Comptonization of low-frequency radiation in accretion disks Angular distribution and po-larization of hard radiation. A&A 143, 374–388.
[219] Sunyaev, R.A., Truemper, J., 1979. Hard X-ray spectrum of CYG X-1.Nature 279, 506–508. doi:10.1038/279506a0.
[220] Tagger, M., 2007. Disk instabilities and Quasi-Periodic Oscillations,in: Revista Mexicana de Astronomia y Astrofisica, vol. 27, volume 27of Revista Mexicana de Astronomia y Astrofisica, vol. 27. pp. 26–35.
[221] Tagger, M., Pellat, R., 1999. An accretion-ejection instability in mag-netized disks. A&A 349, 1003–1016. arXiv:arXiv:astro-ph/9907267.
[222] Tetarenko, B.E., Sivakoff, G.R., Heinke, C.O., Gladstone, J.C., 2016.WATCHDOG: A Comprehensive All-sky Database of Galactic BlackHole X-ray Binaries. ApJ 222, 15. doi:10.3847/0067-0049/222/2/15,arXiv:1512.00778.
90

[223] Thorne, K.S., Price, R.H., 1975. Cygnus X-1 - an interpretation ofthe spectrum and its variability. ApJ 195, L101–L105. doi:10.1086/181720.
[224] Timmer, J., Koenig, M., 1995. On generating power law noise. A&A300, 707.
[225] Titarchuk, L., Hua, X.M., 1995. A Comparison of Thermal Comp-tonization Models. ApJ 452, 226–+. doi:10.1086/176293.
[226] Tomsick, J.A., Kaaret, P., 2001. The X-Ray Properties ofLow-Frequency Quasi-periodic Oscillations from GRS 1915+105Up to 120 KEV. ApJ 548, 401–409. doi:10.1086/318683,arXiv:astro-ph/0009354.
[227] Trudolyubov, S.P., Borozdin, K.N., Priedhorsky, W.C., 2001. RXTEobservations of 4U 1630-47 during the peak of its 1998 outburst.MNRAS 322, 309–320. doi:10.1046/j.1365-8711.2001.04073.x,arXiv:astro-ph/9911345.
[228] Tsang, D., Butsky, I., 2013. Iron line variability of discoseismic cor-rugation modes. MNRAS 435, 749–765. doi:10.1093/mnras/stt1334,arXiv:1307.4971.
[229] Tsang, D., Lai, D., 2009. Corotational damping of discoseismic c modesin black hole accretion discs. MNRAS 393, 992–998. doi:10.1111/j.1365-2966.2008.14228.x, arXiv:0810.1299.
[230] Uttley, P., Klein-Wolt, M., 2015. The remarkable timing proper-ties of a ‘hypersoft’ state in GRO J1655-40. Monthly Notices of theRoyal Astronomical Society 451, 475–485. doi:10.1093/mnras/stv978,arXiv:1504.08313.
[231] Uttley, P., McHardy, I.M., Vaughan, S., 2005. Non-linearX-ray variability in X-ray binaries and active galaxies. MN-RAS 359, 345–362. doi:10.1111/j.1365-2966.2005.08886.x,arXiv:astro-ph/0502112.
[232] van den Eijnden, J., Ingram, A., Uttley, P., 2016. Probing the origin ofquasi-periodic oscillations: the short-timescale evolution of phase lagsin GRS 1915+105. ArXiv e-prints arXiv:1603.03392.
91

[233] van den Eijnden, J., Ingram, A., Uttley, P., Motta, S.E., Belloni, T.M.,Gardenier, D.W., 2017. Inclination dependence of QPO phase lags inblack hole X-ray binaries. MNRAS 464, 2643–2659. doi:10.1093/mnras/stw2634, arXiv:1610.03469.
[234] van der Hooft, F. et al., 1999. Hard X-Ray Variability of the BlackHole Candidate GRO J0422+32 during Its 1992 Outburst. ApJ 513,477–490. doi:10.1086/306845, arXiv:astro-ph/9810492.
[235] van der Klis, M., 1989a. Fourier techniques in X-ray timing, in:Ogelman, H., van den Heuvel, E.P.J. (Eds.), NATO Advanced Sci-ence Institutes (ASI) Series C, volume 262 of NATO Advanced ScienceInstitutes (ASI) Series C. p. 27.
[236] van der Klis, M., 1989b. Quasi-periodic oscillations and noise in low-mass X-ray binaries. Annual Reviews 27, 517–553. doi:10.1146/annurev.aa.27.090189.002505.
[237] van der Klis, M., 2006. Overview of QPOs in neutron-star low-massX-ray binaries. Advances in Space Research 38, 2675–2679. doi:10.1016/j.asr.2005.11.026.
[238] van der Klis, M., Jansen, F., van Paradijs, J., Lewin, W.H.G., van denHeuvel, E.P.J., Trumper, J.E., Szatjno, M., 1985. Intensity-dependentquasi-periodic oscillations in the X-ray flux of GX5 - 1. Nature 316,225–230. doi:10.1038/316225a0.
[239] van der Klis, M., Swank, J.H., Zhang, W., Jahoda, K., Morgan, E.H.,Lewin, W.H.G., Vaughan, B., van Paradijs, J., 1996. Discovery of Sub-millisecond Quasi-periodic Oscillations in the X-Ray Flux of ScorpiusX-1. ApJ 469, L1. doi:10.1086/310251, arXiv:astro-ph/9607047.
[240] van Doesburgh, M., van der Klis, M., 2017. Testing the relativistic pre-cession model using low-frequency and kHz quasi-periodic oscillationsin neutron star low-mass X-ray binaries with known spin. MNRAS 465,3581–3606. doi:10.1093/mnras/stw2961, arXiv:1611.05860.
[241] van Straaten, S., van der Klis, M., di Salvo, T., Belloni, T.,2002. A Multi-Lorentzian Timing Study of the Atoll Sources 4U0614+09 and 4U 1728-34. ApJ 568, 912–930. doi:10.1086/338948,arXiv:astro-ph/0107562.
92

[242] Vanhoff, B., Elgar, S., 1997. Simulating Quadratically Nonlinear Ran-dom Processes. International Journal of Bifurcation and Chaos 7, 1367–1374. doi:10.1142/s0218127497001084.
[243] Varniere, P., Rodriguez, J., Tagger, M., 2002. Accretion-ejectioninstability and QPO in black-hole binaries. II. Relativistic ef-fects. A&A 387, 497–506. doi:10.1051/0004-6361:20020401,arXiv:astro-ph/0203325.
[244] Varniere, P., Tagger, M., 2002. Accretion-Ejection Instability in magne-tized disks: Feeding the corona with Alfven waves. A&A 394, 329–338.doi:10.1051/0004-6361:20021135, arXiv:astro-ph/0208120.
[245] Vaughan, S., Uttley, P., 2005. Where are the X-ray quasi-periodicoscillations in active galaxies? MNRAS 362, 235–244. doi:10.1111/j.1365-2966.2005.09296.x, arXiv:astro-ph/0506455.
[246] Veledina, A., Poutanen, J., 2015. Reprocessing model for the opticalquasi-periodic oscillations in black hole binaries. MNRAS 448, 939–945.doi:10.1093/mnras/stu2737, arXiv:1409.6523.
[247] Veledina, A., Poutanen, J., Ingram, A., 2013. A Unified Lense-ThirringPrecession Model for Optical and X-Ray Quasi-periodic Oscillations inBlack Hole Binaries. ApJ 778, 165. doi:10.1088/0004-637X/778/2/165, arXiv:1310.3821.
[248] Vignarca, F., Migliari, S., Belloni, T., Psaltis, D., van der Klis,M., 2003. Tracing the power-law component in the energy spec-trum of black hole candidates as a function of the QPO fre-quency. A&A 397, 729–738. doi:10.1051/0004-6361:20021542,arXiv:arXiv:astro-ph/0210517.
[249] Wagoner, R.V., 1999. Relativistic diskoseismology. PhysicsReports 311, 259–269. doi:10.1016/S0370-1573(98)00104-5,arXiv:astro-ph/9805028.
[250] Wang, Z.Y., Huang, C.Y., Wang, D.X., Wang, J.Z., 2012. A model oflow-frequency quasi-periodic oscillations in black hole X-ray binaries.Research in Astronomy and Astrophysics 12, 661–670. doi:10.1088/1674-4527/12/6/006, arXiv:1203.0080.
93

[251] Weisskopf, M. C. et al., 2016. The Imaging X-ray Polarimetry Ex-plorer (IXPE), in: Society of Photo-Optical Instrumentation Engi-neers (SPIE) Conference Series, volume 9905 of Proceedings of SPIE.p. 990517. doi:10.1117/12.2235240.
[252] Wijnands, R., Homan, J., van der Klis, M., 1999. The Complex Phase-Lag Behavior of the 3-12 HZ Quasi-Periodic Oscillations during theVery High State of XTE J1550-564. ApJ 526, L33–L36. doi:10.1086/312365, arXiv:arXiv:astro-ph/9909515.
[253] Wijnands, R., van der Klis, M., 1999. The Broadband Power Spec-tra of X-Ray Binaries. ApJ 514, 939–944. doi:10.1086/306993,arXiv:astro-ph/9810342.
[254] You, B., Bursa, M., Zycki, P.T., 2018. X-Ray Quasi-periodic Oscil-lations in the Lense-Thirring Precession Model. I. Variability of Rel-ativistic Continuum. ApJ 858, 82. doi:10.3847/1538-4357/aabd33,arXiv:1801.04028.
[255] Zycki, P.T., 2003. Simulations of X-ray spectral/timing proper-ties in a propagation model of variability of accreting black holes.MNRAS 340, 639–646. doi:10.1046/j.1365-8711.2003.06357.x,arXiv:astro-ph/0209496.
[256] Zycki, P.T., Done, C., Ingram, A., 2016. Energy spectra of X-ray quasi-periodic oscillations in the Lense-Thirring precession model. arXiv e-prints arXiv:1610.07871.
94