A review of analytical methods for assessing preservation in ...
33
High and Penkman Herit Sci (2020) 8:83 https://doi.org/10.1186/s40494-020-00422-y REVIEW A review of analytical methods for assessing preservation in waterlogged archaeological wood and their application in practice Kirsty E. High * and Kirsty E. H. Penkman Abstract Waterlogged archaeological wood can present management challenges due to its vulnerability to chemical and biological decay, both during burial and post-excavation. Decay processes also often leave it severely weakened and therefore susceptible to mechanical damage. Quantifying preservation and understanding active decay mechanisms is therefore critical in informing the management of this unique cultural resource. It is critical that assessments of preservation are robust, and sensitive enough to allow changes over time to be detected. A wide range of analytical methods can be applied to assess the state of preservation of waterlogged archaeological wood, and determin- ing which of these is most appropriate to the circumstances can be challenging. This review summarises some of the most commonly reported methods suitable for the analysis of waterlogged archaeological wood, ranging from widely used ‘low-tech’ methods, to assessment using advanced analytical instrumentation. Methods are evaluated in terms of the information gained weighed up against their cost, logistical considerations, and time investments, with the aim of supporting the development of an analytical strategy. We conclude that although an analytical strategy must be informed by the aims of assessment as well as any external restrictions, the best available analytical tech- niques should be employed in order to supply an accurate baseline against which future change can be measured. Critically, a multi-analytical approach is vital in obtaining a clear picture of the present state of decay, as no single technique gives the best assessment. Keywords: Waterlogged archaeological wood, Preservation assessment, Wood deterioration, Analytical methods, Preservation in situ, Conservation © The Author(s) 2020. This article is licensed under a Creative Commons Attribution 4.0 International License, which permits use, sharing, adaptation, distribution and reproduction in any medium or format, as long as you give appropriate credit to the original author(s) and the source, provide a link to the Creative Commons licence, and indicate if changes were made. The images or other third party material in this article are included in the article’s Creative Commons licence, unless indicated otherwise in a credit line to the material. If material is not included in the article’s Creative Commons licence and your intended use is not permitted by statutory regulation or exceeds the permitted use, you will need to obtain permission directly from the copyright holder. To view a copy of this licence, visit http://creativeco mmons.org/licenses/by/4.0/. The Creative Commons Public Domain Dedication waiver (http://creativecommons.org/publicdomain/ zero/1.0/) applies to the data made available in this article, unless otherwise stated in a credit line to the data. Introduction and background Assessing the current state of preservation of water- logged archaeological wood provides vital information on decay trajectories, archaeological significance (the state of preservation is likely to influence the level of detail that can be retrieved from an object), and the potential consequences of changing conditions [1, 2]. Appropriate analysis establishes a robust baseline against which any further deterioration can be tracked, for example: when a site is being monitored [3, 4], when comparing material from different sites or phases of investigation [5, 6], or when gathering experimental data on decay mechanisms [7–9]. Analysis is also important post-excavation; detect- ing decay over periods of storage or display can help identify when conditions are not conducive to the contin- ued survival of an object [10, 11]. Analysis during or after conservation can be a critical part of establishing when a conservation treatment has worked, or indeed is hav- ing a negative effect [12, 13]. Understanding the structure of wood, the potential decay mechanisms acting upon it, and appropriate techniques that can be used to assess and track these mechanisms is therefore important for archaeologists, conservators, and heritage management professionals. Open Access *Correspondence: [email protected] Department of Chemistry, University of York, Heslington, York YO10 5DD, UK
-
Upload
khangminh22 -
Category
Documents
-
view
1 -
download
0
Transcript of A review of analytical methods for assessing preservation in ...
High and Penkman Herit Sci (2020) 8:83 https://doi.org/10.1186/s40494-020-00422-y
REVIEW
A review of analytical methods for assessing preservation in waterlogged archaeological wood and their application in practiceKirsty E. High* and Kirsty E. H. Penkman
Abstract
Waterlogged archaeological wood can present management challenges due to its vulnerability to chemical and biological decay, both during burial and post-excavation. Decay processes also often leave it severely weakened and therefore susceptible to mechanical damage. Quantifying preservation and understanding active decay mechanisms is therefore critical in informing the management of this unique cultural resource. It is critical that assessments of preservation are robust, and sensitive enough to allow changes over time to be detected. A wide range of analytical methods can be applied to assess the state of preservation of waterlogged archaeological wood, and determin-ing which of these is most appropriate to the circumstances can be challenging. This review summarises some of the most commonly reported methods suitable for the analysis of waterlogged archaeological wood, ranging from widely used ‘low-tech’ methods, to assessment using advanced analytical instrumentation. Methods are evaluated in terms of the information gained weighed up against their cost, logistical considerations, and time investments, with the aim of supporting the development of an analytical strategy. We conclude that although an analytical strategy must be informed by the aims of assessment as well as any external restrictions, the best available analytical tech-niques should be employed in order to supply an accurate baseline against which future change can be measured. Critically, a multi-analytical approach is vital in obtaining a clear picture of the present state of decay, as no single technique gives the best assessment.
Keywords: Waterlogged archaeological wood, Preservation assessment, Wood deterioration, Analytical methods, Preservation in situ, Conservation
© The Author(s) 2020. This article is licensed under a Creative Commons Attribution 4.0 International License, which permits use, sharing, adaptation, distribution and reproduction in any medium or format, as long as you give appropriate credit to the original author(s) and the source, provide a link to the Creative Commons licence, and indicate if changes were made. The images or other third party material in this article are included in the article’s Creative Commons licence, unless indicated otherwise in a credit line to the material. If material is not included in the article’s Creative Commons licence and your intended use is not permitted by statutory regulation or exceeds the permitted use, you will need to obtain permission directly from the copyright holder. To view a copy of this licence, visit http://creat iveco mmons .org/licen ses/by/4.0/. The Creative Commons Public Domain Dedication waiver (http://creat iveco mmons .org/publi cdoma in/zero/1.0/) applies to the data made available in this article, unless otherwise stated in a credit line to the data.
Introduction and backgroundAssessing the current state of preservation of water-logged archaeological wood provides vital information on decay trajectories, archaeological significance (the state of preservation is likely to influence the level of detail that can be retrieved from an object), and the potential consequences of changing conditions [1, 2]. Appropriate analysis establishes a robust baseline against which any further deterioration can be tracked, for example: when a site is being monitored [3, 4], when comparing material
from different sites or phases of investigation [5, 6], or when gathering experimental data on decay mechanisms [7–9]. Analysis is also important post-excavation; detect-ing decay over periods of storage or display can help identify when conditions are not conducive to the contin-ued survival of an object [10, 11]. Analysis during or after conservation can be a critical part of establishing when a conservation treatment has worked, or indeed is hav-ing a negative effect [12, 13]. Understanding the structure of wood, the potential decay mechanisms acting upon it, and appropriate techniques that can be used to assess and track these mechanisms is therefore important for archaeologists, conservators, and heritage management professionals.
Open Access
*Correspondence: [email protected] of Chemistry, University of York, Heslington, York YO10 5DD, UK
Page 2 of 33High and Penkman Herit Sci (2020) 8:83
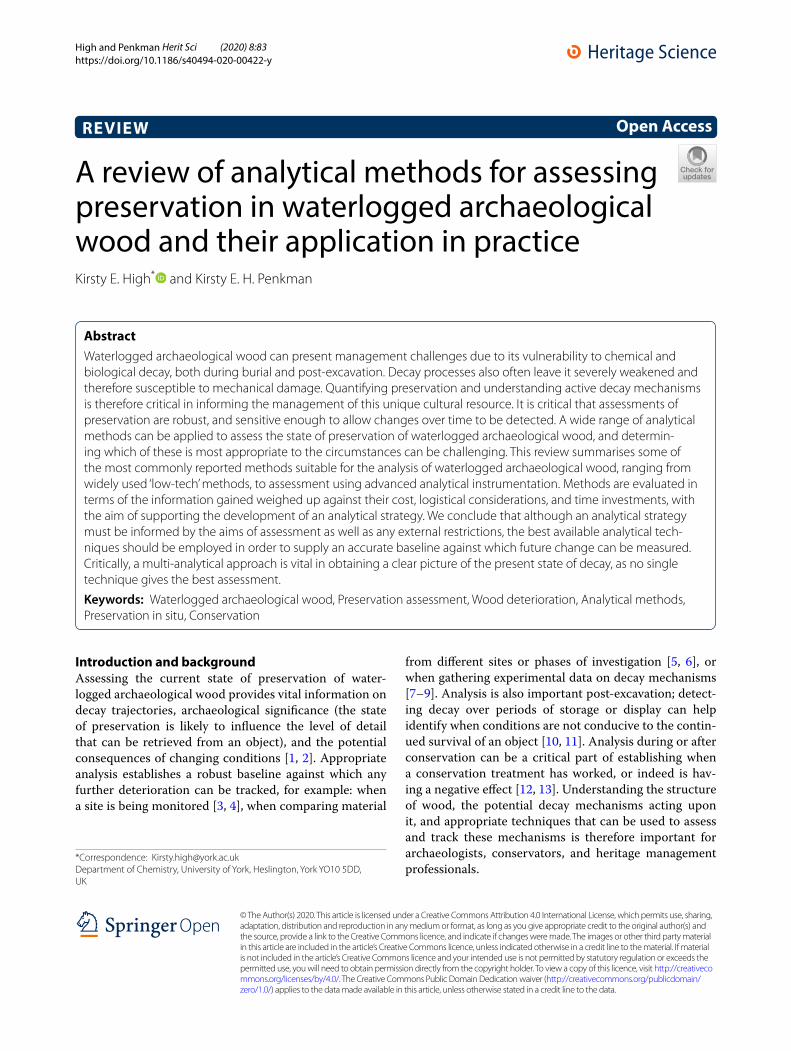
The structure and decay of waterlogged archaeological woodFresh wood is made up of a system of cells composed of three major biopolymers, closely linked and arranged in fibrils (Fig. 1). The first of these, lignin, composes roughly 25–35% by mass, whilst cellulose and hemi-celluloses (two types of polysaccharide) together make up roughly 65–75%. A variety of ‘extractives’ (non-structural compo-nents such as pectins, tannins, resins, and oils) contrib-ute up to 10% by mass. An in-depth description of the anatomical structure of wood is outside the scope of this review but can be found in e.g. [14–16].
Archaeological wood is subjected to a variety of both chemical and biological decay processes during its depo-sition and burial, resulting in a material with a very dif-ferent chemical composition and structure to fresh wood [14, 17]. Under the anoxic conditions provided by water-logged environments, decay processes are significantly slowed and primarily driven by anaerobic biological agents [15, 18, 19]. These agents preferentially attack pol-ysaccharides via enzymatic degradation, with hemi-cellu-loses being particularly vulnerable [15, 20]. Some studies demonstrate that chemical deterioration of cellulose also occurs in waterlogged environments, particularly under extreme conditions such as low pH [6, 10]. Lignin is gen-erally considered to be much more resistant to biological
decay, largely due to its highly stable structure: a large 3 dimensional network of cross-linked polyphenol sub units (Fig. 1; [20]. The preferential decay of celluloses means that waterlogged archaeological wood is often characterised by a high lignin content, with celluloses completely depleted in some cases [21, 22]. In water-logged environments, the cellulose-depleted cell walls become instead filled with water, allowing the structure of the wood to be maintained [20]. However, this lignin-rich skeleton is a very fragile material that is highly sus-ceptible to mechanical damage and can collapse or warp very easily when dried [12, 23].
Although comparatively stable, decay of lignin does also occur. In particular, certain anaerobic fungi digest lignin via enzymatic oxidation [15, 21]. This results in modification of the sub-units, for example an increased concentration of the more resistant guaiacyl-type lignin compared to syringyl-type is often observed in decayed wood [16, 17].
Exchange with the burial environment can influence the chemical composition of waterlogged archaeological wood. Many ‘extractives’ are water soluble, and there-fore present in drastically lower concentrations or com-pletely absent [14, 17]. The highly porous nature of wood means that minerals from the burial environment (such as iron sulfides, phosphates and calcium) may become
Fig. 1 Schematic showing hierarchical structure of wood and the key molecular sub units present in lignin and cellulose
Page 3 of 33High and Penkman Herit Sci (2020) 8:83
incorporated into the cell walls over time, resulting in a higher inorganic, or ‘ash’ content [17, 24]. A particu-larly problematic process is the build-up of sulfur salts in wood from marine environments, as these can oxi-dise when exposed to air and form sulfuric acid, leading to subsequent hydrolysis of cellulose [25, 26]. The pres-ence of iron (e.g. from nails) alongside sulfur in particular can lead to the formation of a wide range of salts within the cellular structure, which leads to extensive mechani-cal damage if they occupy more volume than the precur-sor molecules [26, 27]. The identification of inorganic components can be critical for predicting the success of conservation treatments and the possible effects of long-term storage.
Challenges in the analysis of waterlogged archaeological woodAnalysis of waterlogged archaeological wood aims to evaluate these chemical and physical changes in order to determine its current state of preservation. This knowl-edge is vital in informing conservation or management of these objects: an adequate assessment supplies a baseline against which future change can be measured, and pro-vides an indication of whether further changes might be expected as a result of the proposed strategy [1, 12].
However, the complexity of waterlogged archaeological wood, particularly its highly heterogeneous nature, pre-sents significant analytical challenges. As deterioration tends to occur first at the surface and progress inwards there is often a gradient of decay, with the inner heart-wood much better preserved than the outer sapwood [12, 15]. Different species of erosion microorganisms will also result in different patterns of decay [15]. Localized differ-ences in the burial environment may also cause regions of more decayed wood [28], and decay may be influenced by the presence of inorganic objects such as nails [26, 29].
Archaeological wood can exist in a range of states; whether it is wet, has dried out, or already undergone conservation will limit the application of certain tech-niques. Additional challenges can be presented when material has an unknown history of storage/burial envi-ronment [12, 30].
Traditionally, methods for evaluating the preserva-tion of waterlogged wood have primarily consisted of readily accessible and relatively inexpensive techniques [19, 24, 31]. However, over the past few decades, the interdisciplinary nature of archaeological and paleoen-vironmental research has led to the adoption of more complex methods, ranging from advanced microscopic methods which reveal structural alteration, to instru-mental methods which probe molecular changes within materials. The application of these techniques can
provide a deeper understanding of how organic archae-ological materials degrade, and importantly, the time-scale on which this is happening.
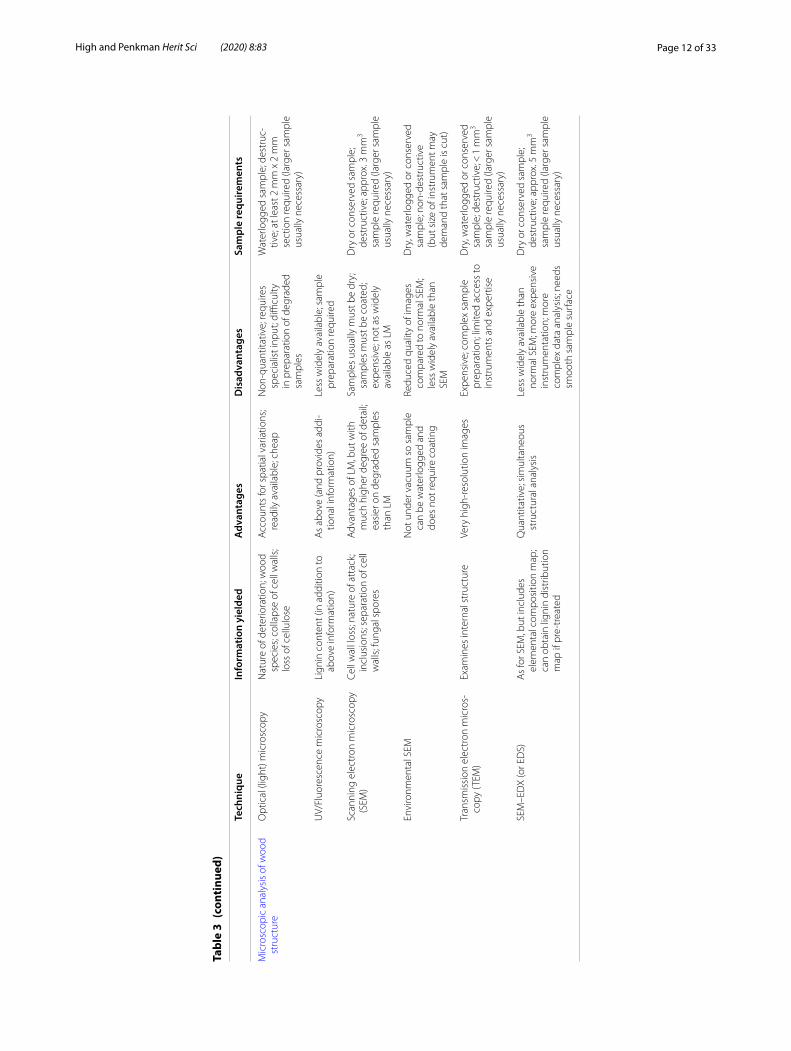
Aims of the reviewAssessment techniques can provide information on the extent of decay, active decay mechanisms, and the origin of decay (e.g. biological or chemical). However, knowing which methods are most appropriate for certain scenarios is not straightforward. This review aims to provide a critical overview of commonly used approaches for the assessment of preservation of water-logged wood, supporting the design of a scheme of assessment. The first section, “Assessment of morpho-logical preservation” (summarised in Table 3) provides an overview of techniques which focus on morpho-logical preservation and the physical condition of the wood; this is critical for determining how it will behave in a changing environment, for example during in situ preservation, on museum display, or during storage or conservation. “Assessment of the relative amounts of wood components” (summarised in Table 4) describes methods which allow comparison between samples by quantifying the relative amounts of different wood components present, although they do not provide detailed molecular information. Finally, “Assessment of changes on the molecular level” (summarised in Table 6) discusses techniques that provide information on a molecular level using advanced analytical instru-mentation. Such analysis may only be relevant in lim-ited circumstances, but allows the monitoring of very small levels of deterioration over short time periods. In each section, the analysis of cellulose, lignin, and inorganic components are discussed together, as many techniques can be applied to the analysis of multiple components.
Techniques are evaluated in terms of the informa-tion they yield, weighed up against aspects such as their availability, cost, and suitability for application to wood in different states. We conclude that due to the hetero-geneous and complex nature of waterlogged archaeo-logical wood, a range of analytical techniques should be employed to obtain the best possible picture of the present state of decay. At the end of the review, some recommendations on factors to consider in designing a scheme of analysis based are given.
A more detailed version of this review has been pub-lished by Historic England [32]. For further information on applying the techniques, the reader is directed to the longer version or to the additional references included within this review.
Page 4 of 33High and Penkman Herit Sci (2020) 8:83
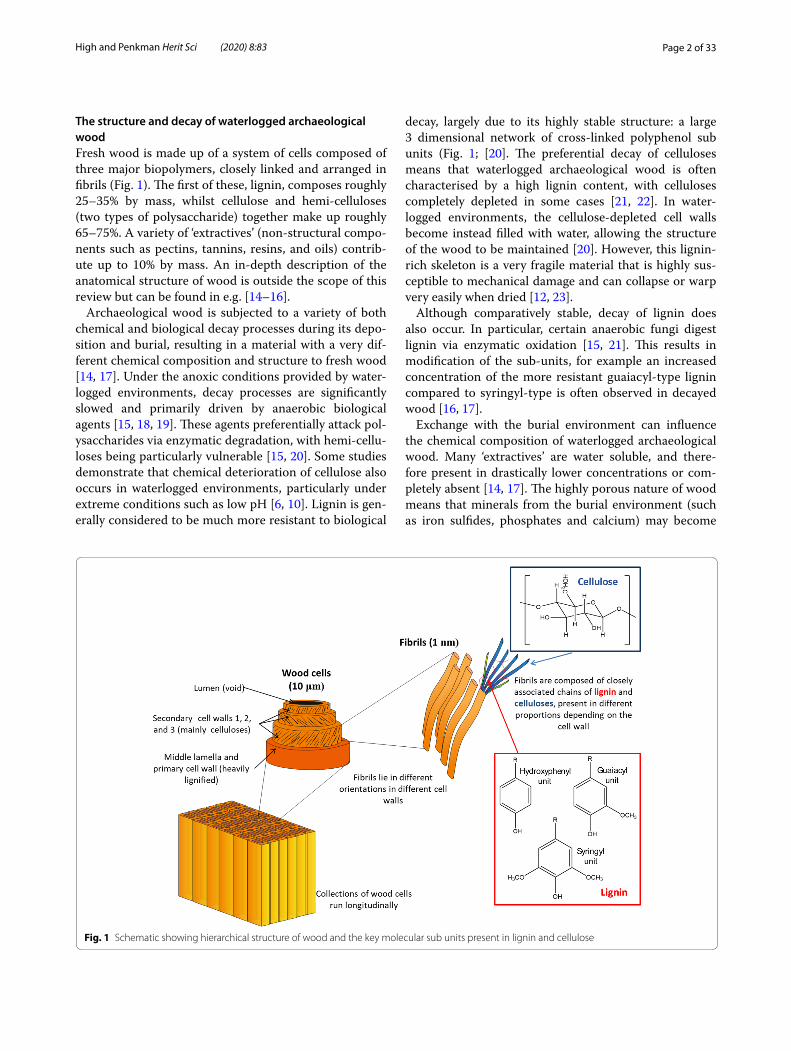
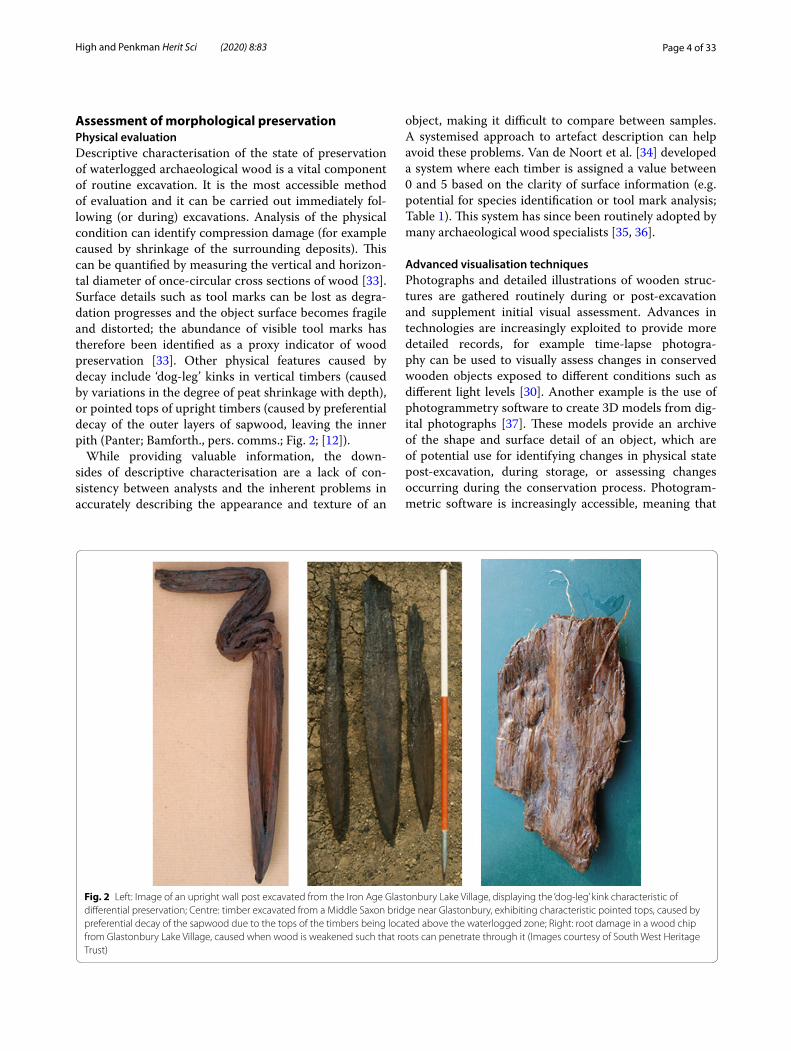
Assessment of morphological preservationPhysical evaluationDescriptive characterisation of the state of preservation of waterlogged archaeological wood is a vital component of routine excavation. It is the most accessible method of evaluation and it can be carried out immediately fol-lowing (or during) excavations. Analysis of the physical condition can identify compression damage (for example caused by shrinkage of the surrounding deposits). This can be quantified by measuring the vertical and horizon-tal diameter of once-circular cross sections of wood [33]. Surface details such as tool marks can be lost as degra-dation progresses and the object surface becomes fragile and distorted; the abundance of visible tool marks has therefore been identified as a proxy indicator of wood preservation [33]. Other physical features caused by decay include ‘dog-leg’ kinks in vertical timbers (caused by variations in the degree of peat shrinkage with depth), or pointed tops of upright timbers (caused by preferential decay of the outer layers of sapwood, leaving the inner pith (Panter; Bamforth., pers. comms.; Fig. 2; [12]).
While providing valuable information, the down-sides of descriptive characterisation are a lack of con-sistency between analysts and the inherent problems in accurately describing the appearance and texture of an
object, making it difficult to compare between samples. A systemised approach to artefact description can help avoid these problems. Van de Noort et al. [34] developed a system where each timber is assigned a value between 0 and 5 based on the clarity of surface information (e.g. potential for species identification or tool mark analysis; Table 1). This system has since been routinely adopted by many archaeological wood specialists [35, 36].
Advanced visualisation techniquesPhotographs and detailed illustrations of wooden struc-tures are gathered routinely during or post-excavation and supplement initial visual assessment. Advances in technologies are increasingly exploited to provide more detailed records, for example time-lapse photogra-phy can be used to visually assess changes in conserved wooden objects exposed to different conditions such as different light levels [30]. Another example is the use of photogrammetry software to create 3D models from dig-ital photographs [37]. These models provide an archive of the shape and surface detail of an object, which are of potential use for identifying changes in physical state post-excavation, during storage, or assessing changes occurring during the conservation process. Photogram-metric software is increasingly accessible, meaning that
Fig. 2 Left: Image of an upright wall post excavated from the Iron Age Glastonbury Lake Village, displaying the ‘dog-leg’ kink characteristic of differential preservation; Centre: timber excavated from a Middle Saxon bridge near Glastonbury, exhibiting characteristic pointed tops, caused by preferential decay of the sapwood due to the tops of the timbers being located above the waterlogged zone; Right: root damage in a wood chip from Glastonbury Lake Village, caused when wood is weakened such that roots can penetrate through it (Images courtesy of South West Heritage Trust)
Page 5 of 33High and Penkman Herit Sci (2020) 8:83
this approach is becoming more commonplace [38]. Despite this, a great degree of skill is still necessary to achieve adequate lighting and contrast to enable observa-tions of surface detail, particularly on wet and dark arte-facts such as waterlogged wood.
An extension of photogrammetry is high resolution laser scanning, which provides a more detailed image of surface texture. Lobb et al. [39] demonstrate the use of laser scanning to identify shrinkage post-excavation by comparing multiple analyses of the same object. This is also a valuable method for examining changes in objects following conservation or long-term storage; Middleton et al. [40] compared scans of wooden artefacts before and after a 3-year period of reburial, observing subtle changes that were not visible through visual or photo-graphic examination. Laser scanning requires specialist equipment and expertise, and although this equipment is increasingly available and analysis itself is fast, processing and interpretation of this data can be time-consuming [41].
Loss of wood substanceA range of indices that indicate the ‘loss of wood sub-stance’ have long been applied to the assessment of water-logged wood (Table 2; [42].) These parameters are critical
in determining the structural integrity of a wooden arte-fact, and thus how susceptible it may be to collapse upon drying, conservation treatment, or compression.
As these are often calculated using easily meas-ured parameters such as mass or volume, no special-ist equipment is required, and the analysis is therefore very accessible and cheap [42]. Density and maximum water content (MWC) are the most commonly applied parameters, although shrinkage can be used to support these measurements and provides a more realistic view of how wood may respond to conservation treatments (Table 2; [45]). Porosity can be calculated by filling the pores with an inert gas (e.g. helium) offering a non-destructive method of assessing loss of wood substance, in contrast to other indices which require irreversible drying of the sample [44, 46].
Despite the apparent simplicity of these measurements, there are difficulties in achieving a standardised method [44]. The high porosity of wood makes an absolutely dry mass difficult to measure as the humidity of the environ-ment is likely to have an effect on how quickly moisture is reabsorbed once the sample has been removed from the oven [24]. There are also inherent errors associ-ated with weighing a sample that has a wet surface [24, 47]. Jensen and Gregory [42] highlight the difficulties
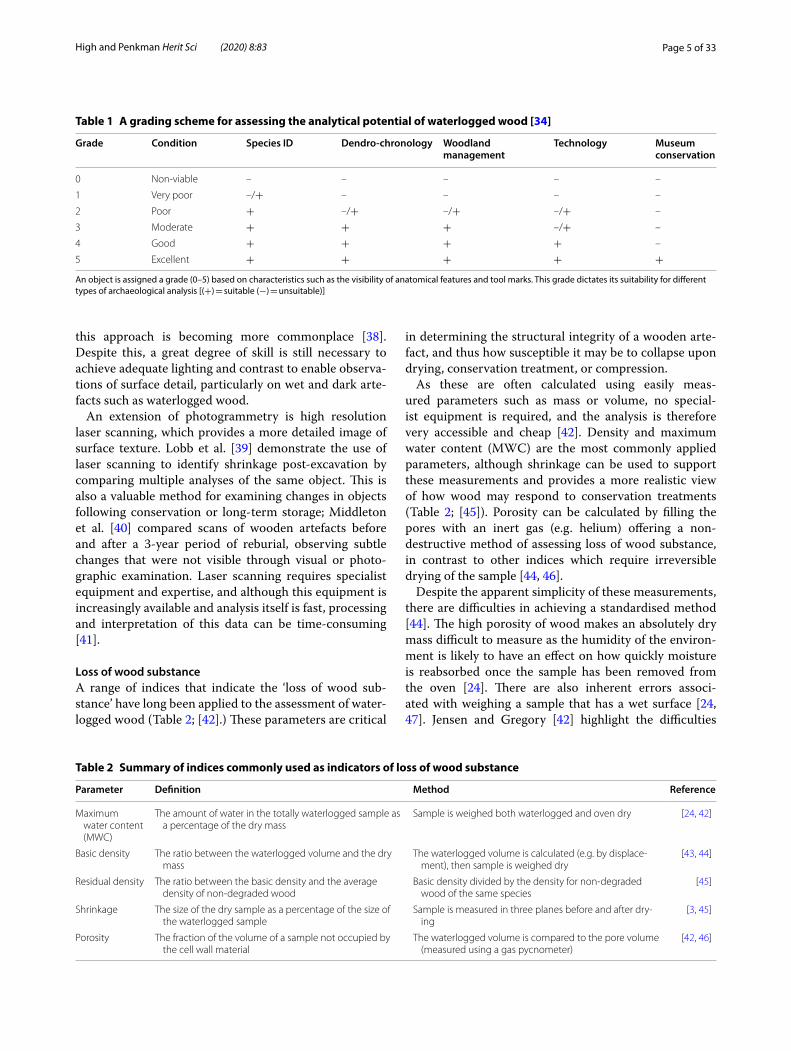
Table 1 A grading scheme for assessing the analytical potential of waterlogged wood [34]
An object is assigned a grade (0–5) based on characteristics such as the visibility of anatomical features and tool marks. This grade dictates its suitability for different types of archaeological analysis [(+) = suitable (−) = unsuitable)]
Grade Condition Species ID Dendro-chronology Woodland management
Technology Museum conservation
0 Non-viable – – – – –
1 Very poor –/+ – – – –
2 Poor + –/+ –/+ –/+ –
3 Moderate + + + –/+ –
4 Good + + + + –
5 Excellent + + + + +
Table 2 Summary of indices commonly used as indicators of loss of wood substance
Parameter Definition Method Reference
Maximum water content (MWC)
The amount of water in the totally waterlogged sample as a percentage of the dry mass
Sample is weighed both waterlogged and oven dry [24, 42]
Basic density The ratio between the waterlogged volume and the dry mass
The waterlogged volume is calculated (e.g. by displace-ment), then sample is weighed dry
[43, 44]
Residual density The ratio between the basic density and the average density of non-degraded wood
Basic density divided by the density for non-degraded wood of the same species
[45]
Shrinkage The size of the dry sample as a percentage of the size of the waterlogged sample
Sample is measured in three planes before and after dry-ing
[3, 45]
Porosity The fraction of the volume of a sample not occupied by the cell wall material
The waterlogged volume is compared to the pore volume (measured using a gas pycnometer)
[42, 46]
Page 6 of 33High and Penkman Herit Sci (2020) 8:83
associated with handling small fragments of wood, and recommend that at least 0.5 g of waterlogged sample is used in order to achieve a reliable measurement. Shrink-age measurements also require a sizeable sample (e.g. 2 cm × 2 cm × 1 cm; [3]) and can be difficult to accurately measure in practice. As measurements are based on an assumption that all pore spaces are filled with water, first submerging the sample in water under vacuum is thought to improve reliability of results; Macchioni et al. [43] argue that although vacuum treatment does appear to remove small air bubbles trapped inside samples, in heavily degraded samples it can lead to structural damage and an artificially lowered MWC. High levels of absorbed inorganic materials can also artificially lower the MWC [45].
Despite the drawbacks, calculation of physical param-eters such as MWC and shrinkage often provide suffi-cient information to inform the treatment procedures for wood in a conservation context [20, 24]. Furthermore, they indicate the potential for wood to collapse follow-ing reburial or during preservation in situ, and therefore play a vital role in determining whether such manage-ment schemes are viable [42]. They are also well-estab-lished parameters, and their use may allow comparison with earlier studies. However, these indices are not sensi-tive enough to detect only very small variations in wood composition, for example over a short period of monitor-ing or storage [44]. If this is the aim of assessment, other methods should be considered in addition.
Physical resistance (density)Loss of wood substance may vary significantly within a sample, particularly as a factor of depth; this variability should always be considered as part of a sampling strat-egy. Variations with depth can be addressed using the ‘pin-test’, where a steel needle is pushed into the sam-ple and the distance it can be pushed without hindrance recorded [12, 48]. This has the benefit of being cheap and
widely available, and it has long been used as a standard evaluation technique in wood conservation laboratories.
Measurements of resistance can be better standardised using mechanised probes such as the Pilodyn wood tester, which fires a spring-loaded pin into the wood and meas-ure the depth of penetration [49], or the Sibert decay drill which pushes a probe into the wood at constant pressure and records the resistance met [24]. Both methods offer a minimally destructive analysis and the ability to test mul-tiple points on an artefact. Gregory et al. [49] show that the Pilodyn can be adapted for use underwater and dem-onstrate good correlation with density as measured using traditional indices. However, variations in density across the surface of an artefact are less easy to account for, and the orientation and species of the wood also affects the depth of penetration [49]. The Sibert decay drill provides a better measure of variations in resistance with depth, although the data is less easily translated into a measure of density [24].
Non-invasive methods for assessing physical structureA downside of loss of wood substance indices is that methods are often destructive as they require irreversible drying of the sample. Wood density can also be deter-mined using non-invasive instrumental methods, which although less accessible in terms of the instrumentation and expertise required, can be valuable in certain cir-cumstances, for example in the evaluation of very small or highly archaeologically significant objects. They also allow the analysis of an entire object, reducing concerns regarding differences in preservation throughout an object.
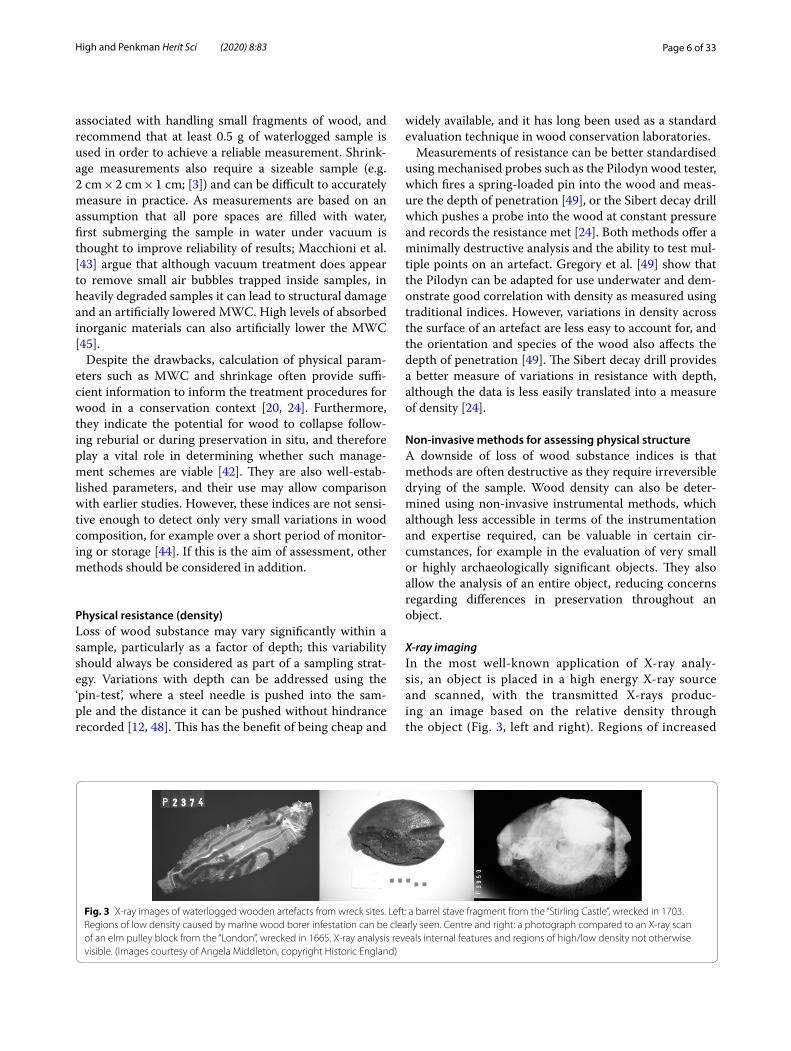
X‑ray imagingIn the most well-known application of X-ray analy-sis, an object is placed in a high energy X-ray source and scanned, with the transmitted X-rays produc-ing an image based on the relative density through the object (Fig. 3, left and right). Regions of increased
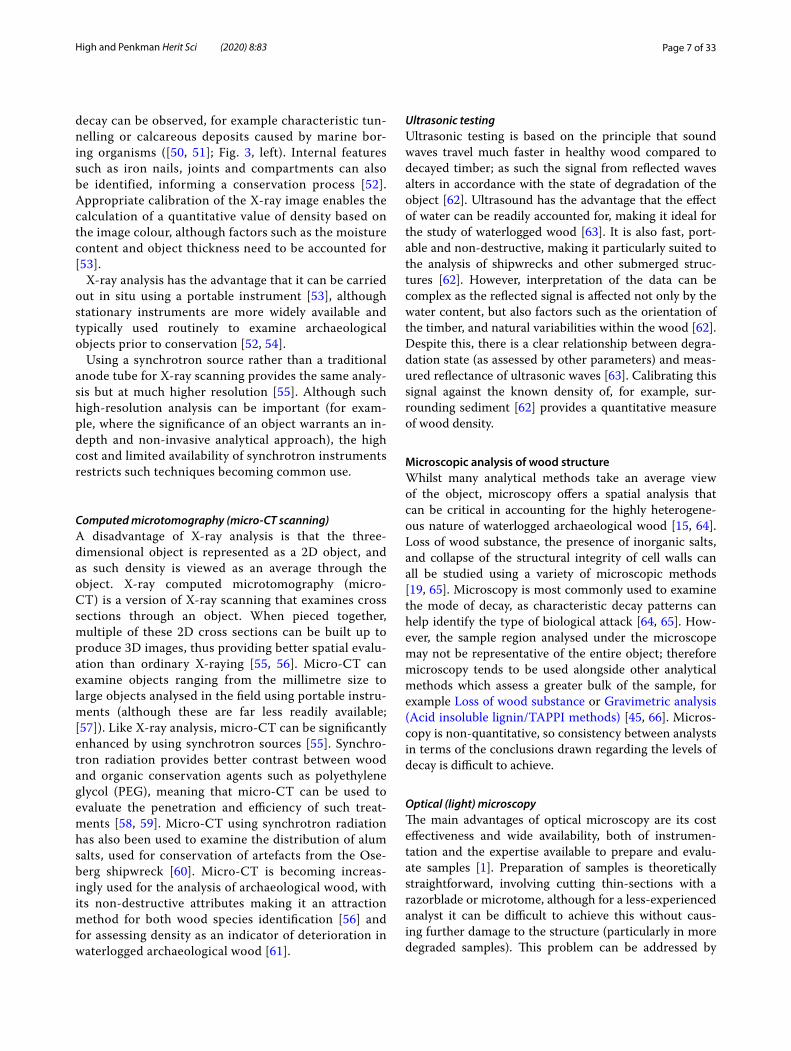
Fig. 3 X-ray images of waterlogged wooden artefacts from wreck sites. Left: a barrel stave fragment from the “Stirling Castle”, wrecked in 1703. Regions of low density caused by marine wood borer infestation can be clearly seen. Centre and right: a photograph compared to an X-ray scan of an elm pulley block from the “London”, wrecked in 1665. X-ray analysis reveals internal features and regions of high/low density not otherwise visible. (Images courtesy of Angela Middleton, copyright Historic England)
Page 7 of 33High and Penkman Herit Sci (2020) 8:83
decay can be observed, for example characteristic tun-nelling or calcareous deposits caused by marine bor-ing organisms ([50, 51]; Fig. 3, left). Internal features such as iron nails, joints and compartments can also be identified, informing a conservation process [52]. Appropriate calibration of the X-ray image enables the calculation of a quantitative value of density based on the image colour, although factors such as the moisture content and object thickness need to be accounted for [53].
X-ray analysis has the advantage that it can be carried out in situ using a portable instrument [53], although stationary instruments are more widely available and typically used routinely to examine archaeological objects prior to conservation [52, 54].
Using a synchrotron source rather than a traditional anode tube for X-ray scanning provides the same analy-sis but at much higher resolution [55]. Although such high-resolution analysis can be important (for exam-ple, where the significance of an object warrants an in-depth and non-invasive analytical approach), the high cost and limited availability of synchrotron instruments restricts such techniques becoming common use.
Computed microtomography (micro‑CT scanning)A disadvantage of X-ray analysis is that the three-dimensional object is represented as a 2D object, and as such density is viewed as an average through the object. X-ray computed microtomography (micro-CT) is a version of X-ray scanning that examines cross sections through an object. When pieced together, multiple of these 2D cross sections can be built up to produce 3D images, thus providing better spatial evalu-ation than ordinary X-raying [55, 56]. Micro-CT can examine objects ranging from the millimetre size to large objects analysed in the field using portable instru-ments (although these are far less readily available; [57]). Like X-ray analysis, micro-CT can be significantly enhanced by using synchrotron sources [55]. Synchro-tron radiation provides better contrast between wood and organic conservation agents such as polyethylene glycol (PEG), meaning that micro-CT can be used to evaluate the penetration and efficiency of such treat-ments [58, 59]. Micro-CT using synchrotron radiation has also been used to examine the distribution of alum salts, used for conservation of artefacts from the Ose-berg shipwreck [60]. Micro-CT is becoming increas-ingly used for the analysis of archaeological wood, with its non-destructive attributes making it an attraction method for both wood species identification [56] and for assessing density as an indicator of deterioration in waterlogged archaeological wood [61].
Ultrasonic testingUltrasonic testing is based on the principle that sound waves travel much faster in healthy wood compared to decayed timber; as such the signal from reflected waves alters in accordance with the state of degradation of the object [62]. Ultrasound has the advantage that the effect of water can be readily accounted for, making it ideal for the study of waterlogged wood [63]. It is also fast, port-able and non-destructive, making it particularly suited to the analysis of shipwrecks and other submerged struc-tures [62]. However, interpretation of the data can be complex as the reflected signal is affected not only by the water content, but also factors such as the orientation of the timber, and natural variabilities within the wood [62]. Despite this, there is a clear relationship between degra-dation state (as assessed by other parameters) and meas-ured reflectance of ultrasonic waves [63]. Calibrating this signal against the known density of, for example, sur-rounding sediment [62] provides a quantitative measure of wood density.
Microscopic analysis of wood structureWhilst many analytical methods take an average view of the object, microscopy offers a spatial analysis that can be critical in accounting for the highly heterogene-ous nature of waterlogged archaeological wood [15, 64]. Loss of wood substance, the presence of inorganic salts, and collapse of the structural integrity of cell walls can all be studied using a variety of microscopic methods [19, 65]. Microscopy is most commonly used to examine the mode of decay, as characteristic decay patterns can help identify the type of biological attack [64, 65]. How-ever, the sample region analysed under the microscope may not be representative of the entire object; therefore microscopy tends to be used alongside other analytical methods which assess a greater bulk of the sample, for example Loss of wood substance or Gravimetric analysis (Acid insoluble lignin/TAPPI methods) [45, 66]. Micros-copy is non-quantitative, so consistency between analysts in terms of the conclusions drawn regarding the levels of decay is difficult to achieve.
Optical (light) microscopyThe main advantages of optical microscopy are its cost effectiveness and wide availability, both of instrumen-tation and the expertise available to prepare and evalu-ate samples [1]. Preparation of samples is theoretically straightforward, involving cutting thin-sections with a razorblade or microtome, although for a less-experienced analyst it can be difficult to achieve this without caus-ing further damage to the structure (particularly in more degraded samples). This problem can be addressed by
Page 8 of 33High and Penkman Herit Sci (2020) 8:83
first embedding the sample in paraffin or resin or freezing prior to slicing [45, 64]. However, embedding a sample limits the ability to use biological stains, and freezing has been observed to cause damage to wood that is already highly degraded [12]. As thin-section optical microscopy is often a routine part of archaeological recording (car-ried out for the purposes of wood species identification) it presents an ideal opportunity to also examine damage to the morphological structure [67].
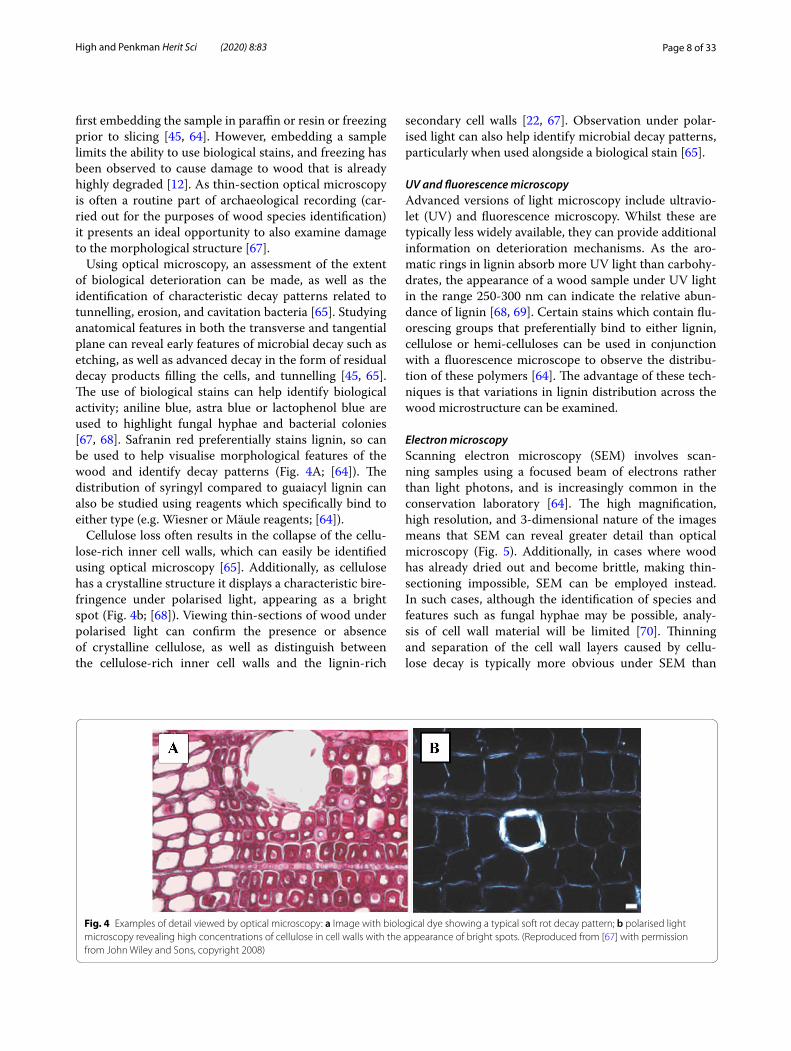
Using optical microscopy, an assessment of the extent of biological deterioration can be made, as well as the identification of characteristic decay patterns related to tunnelling, erosion, and cavitation bacteria [65]. Studying anatomical features in both the transverse and tangential plane can reveal early features of microbial decay such as etching, as well as advanced decay in the form of residual decay products filling the cells, and tunnelling [45, 65]. The use of biological stains can help identify biological activity; aniline blue, astra blue or lactophenol blue are used to highlight fungal hyphae and bacterial colonies [67, 68]. Safranin red preferentially stains lignin, so can be used to help visualise morphological features of the wood and identify decay patterns (Fig. 4A; [64]). The distribution of syringyl compared to guaiacyl lignin can also be studied using reagents which specifically bind to either type (e.g. Wiesner or Mäule reagents; [64]).
Cellulose loss often results in the collapse of the cellu-lose-rich inner cell walls, which can easily be identified using optical microscopy [65]. Additionally, as cellulose has a crystalline structure it displays a characteristic bire-fringence under polarised light, appearing as a bright spot (Fig. 4b; [68]). Viewing thin-sections of wood under polarised light can confirm the presence or absence of crystalline cellulose, as well as distinguish between the cellulose-rich inner cell walls and the lignin-rich
secondary cell walls [22, 67]. Observation under polar-ised light can also help identify microbial decay patterns, particularly when used alongside a biological stain [65].
UV and fluorescence microscopyAdvanced versions of light microscopy include ultravio-let (UV) and fluorescence microscopy. Whilst these are typically less widely available, they can provide additional information on deterioration mechanisms. As the aro-matic rings in lignin absorb more UV light than carbohy-drates, the appearance of a wood sample under UV light in the range 250-300 nm can indicate the relative abun-dance of lignin [68, 69]. Certain stains which contain flu-orescing groups that preferentially bind to either lignin, cellulose or hemi-celluloses can be used in conjunction with a fluorescence microscope to observe the distribu-tion of these polymers [64]. The advantage of these tech-niques is that variations in lignin distribution across the wood microstructure can be examined.
Electron microscopyScanning electron microscopy (SEM) involves scan-ning samples using a focused beam of electrons rather than light photons, and is increasingly common in the conservation laboratory [64]. The high magnification, high resolution, and 3-dimensional nature of the images means that SEM can reveal greater detail than optical microscopy (Fig. 5). Additionally, in cases where wood has already dried out and become brittle, making thin-sectioning impossible, SEM can be employed instead. In such cases, although the identification of species and features such as fungal hyphae may be possible, analy-sis of cell wall material will be limited [70]. Thinning and separation of the cell wall layers caused by cellu-lose decay is typically more obvious under SEM than
Fig. 4 Examples of detail viewed by optical microscopy: a Image with biological dye showing a typical soft rot decay pattern; b polarised light microscopy revealing high concentrations of cellulose in cell walls with the appearance of bright spots. (Reproduced from [67] with permission from John Wiley and Sons, copyright 2008)
Page 9 of 33High and Penkman Herit Sci (2020) 8:83
optical microscopy [13, 19, 71]. Other features of biologi-cal decay such as residual decay material, fungal hyphae, and tunnelling are also often clearly visible [68], although evaluation by an experienced analyst may be required to identify this [65].
In standard SEM instruments, analysis must be carried out in a vacuum and requires that samples are dry, which may cause structural collapse to very degraded samples. Some studies have demonstrated that impregnating and ‘fixing’ a sample in glutaraldehyde, followed by dehydra-tion protects the structural integrity of the sample as it dries, but this process makes the analysis more time consuming [71]. Analysis also traditionally required the samples to be coated in a thin layer of metal so that they are conductive, meaning that this approach was not non-destructive [64]. The development of environmental SEM instruments over the last few decades has removed these challenges, as they allow images to be collected in the absence of a vacuum and without coating. Samples can therefore be analysed waterlogged, removing the need for lengthy sample preparations [64]. However, the presence of water can result in a lower quality image than in tradi-tional SEM [45].
Transmission electron microscopy (TEM) detects elec-trons passing through a sample under very high vacuum, rather than surface-reflected electrons. It can therefore be used to examine the internal structure of wood, pro-ducing very high-resolution 2-dimensional images, and it has been instrumental in the understanding of the structure of wood [64]. However, TEM analysis requires lengthy sample preparation: samples need to be cut thin enough to allow electrons to pass through (70–100 nm), require dehydration and fixing in resin in order to be compatible with the high-vacuum, and are stained with a contrast agent [64]. For preservation assessment, the
large expense, complexity of sample preparation, and difficulties in obtaining access to instrumentation would rarely justify the value of the information obtained [45].
SEM‑BSE/SEM–EDXSEM-back-scattered electron (SEM-BSE) or SEM-energy dispersive X-ray (SEM–EDX; sometimes termed SEM–EDS) analyses detect scattered electrons or X-rays emit-ted from the sample during SEM analysis. As these are characteristic of the atomic weight of the elements pre-sent, analysis can provide an elemental map of the sur-face of the sample, meaning that inorganic components and crystal formations can be characterised [11, 25]. Both techniques have also been shown to provide lignin distribution maps when pre-treated with a reagent that preferentially binds to lignin [72, 73], and have been used to investigate the effectiveness of conservation treat-ments [74]. As an additional detector is required for BSE or EDX analyses, not all electron microscopes have this functionality and therefore this type of analysis is less easy to access. However, the ability to assess inorganic components at the same time as examine morphological damage can be valuable (Table 3).
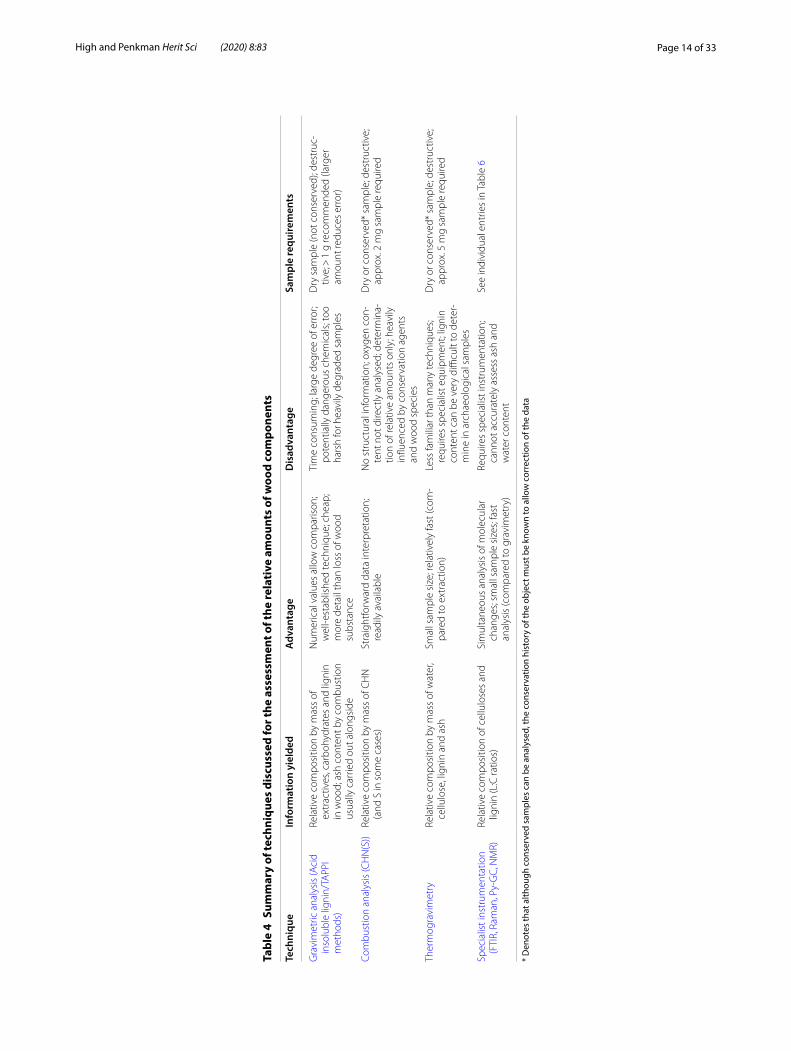
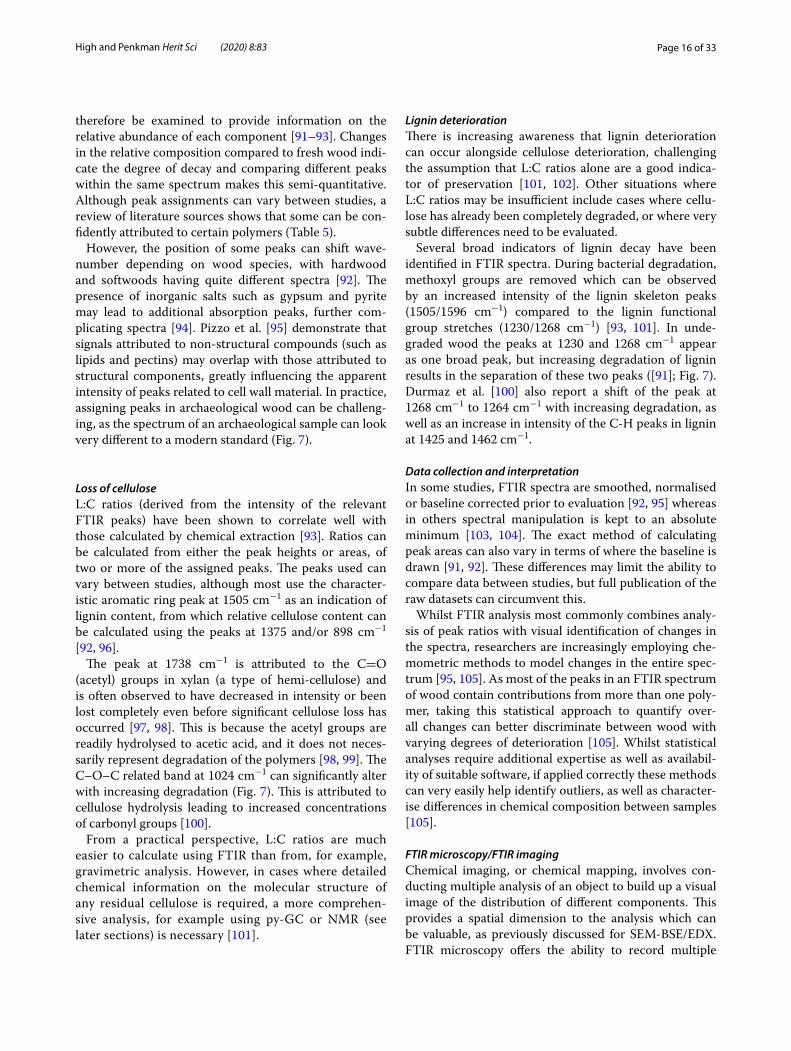
Assessment of the relative amounts of wood componentsQuantification of relative amounts of lignin, cellulose, hemi-celluloses, and inorganic components (ash) is a well-established approach to assessing the current state of preservation of waterlogged archaeological wood (Table 4; [1, 45, 75]). This does not provide detailed molecular information, rather an overview of the com-position of the material. Assessment is based on the assumption that cellulose components of wood dete-riorate faster than lignin, and therefore a higher lignin
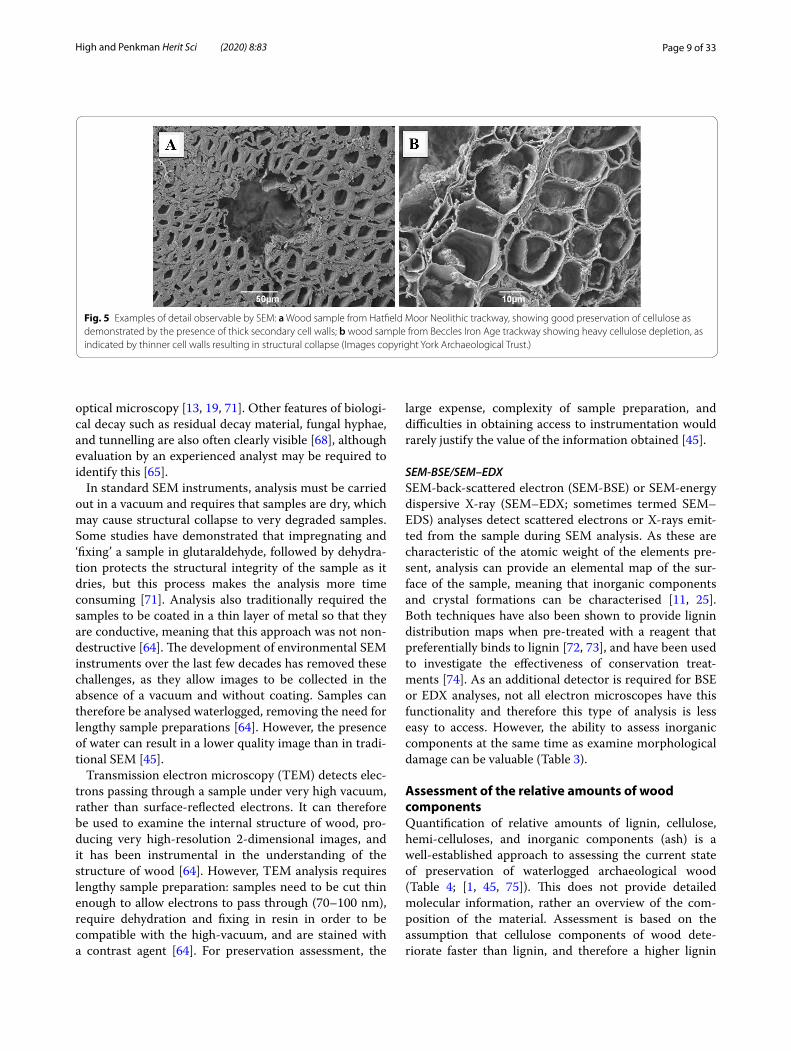
Fig. 5 Examples of detail observable by SEM: a Wood sample from Hatfield Moor Neolithic trackway, showing good preservation of cellulose as demonstrated by the presence of thick secondary cell walls; b wood sample from Beccles Iron Age trackway showing heavy cellulose depletion, as indicated by thinner cell walls resulting in structural collapse (Images copyright York Archaeological Trust.)

Page 10 of 33High and Penkman Herit Sci (2020) 8:83
content indicates more advanced decay [48]. A higher level of inorganic components can also indicate decay, as exchange with the burial environment results in the incorporation of various minerals into the wood struc-ture over time [17, 24]. The presence of inorganic com-ponents causes errors in measurements such as wood density and MWC and has the potential to impact on conservation treatments. Therefore, the determination of inorganic content is an important step in the assessment of waterlogged archaeological wood.
Gravimetric analysis (Acid insoluble lignin/TAPPI methods)The most established method of determining the over-all chemical composition of waterlogged archaeological wood is that of ‘acid insoluble lignin’ or ‘Klason lignin’ determination [20, 44]. Following standards from the Technical Association of the Paper and Pulp Indus-try (TAPPI), wood ‘extractives’ are first removed from a milled sample using a combination of polar and non-polar solvents [76]. Short chain carbohydrates (i.e. degraded celluloses) can then be removed by treatment with 1% sodium hydroxide (this step is often omitted, as it has been shown to remove degraded lignin residues as well as celluloses; [77]). From this ‘extractives-free’ sam-ple, celluloses are then digested using hot 72% sulfuric acid, leaving behind the acid insoluble lignin [77]. The relative abundance of different wood components is then calculated based on mass losses at each stage. Typically, a lignin to cellulose (L:C ratio) is derived, allowing com-parison between samples.
Chemical extraction only requires access to a well-equipped laboratory; however, the negative aspects of analyses are well documented and include the large amount of sample required (> 1 g; [16]), lengthy analysis times (several days), and the need to handle potentially harmful chemicals. Analysis often indicates a compo-sition of over 100%, suggesting a large degree of uncer-tainty [47]. This can be attributed in part to the difficulties in handling small samples during multiple filtration steps, but studies evaluating different methods of calculating L:C ratios have also demonstrated that gravimetric meth-ods overestimate the amount of cellulose remaining [78]. Zabel and Morrell [79] suggest that the harshness of the acid digestion causes degradation of lignin, artificially inflating the cellulose content. This is of particular con-cern in heavily degraded archaeological woods, where lignin may already have deteriorated to some extent, as partially degraded polymers will have increased solubility [1, 17]. The certainty of the results may therefore depend on the degree of decay existing in the sample, with more degraded samples giving less reliable results [80].
L:C ratios measured by gravimetry need to be cor-rected for the ‘ash’ content, as this also contributes to the total mass [17, 45]. Using TAPPI methods, this is typically determined by burning a known mass of the wood at 600 °C, removing all organic components and leaving behind an ash composing of oxidised inorganic compounds. This can then be weighed to provide a per-centage ash composition [17, 81]. Determination of ash content does not reveal the composition of the ash but allows the correction of other analytical methods [66]. If necessary, the composition of this ash can be further ana-lysed, for example by chemical extraction or instrumental methods suitable for elemental analysis [82]. Ash content can also be determined by thermogravimetry.
Combustion analysis (CHN(S))A combustion analysis system can give a measure of the relative carbon, hydrogen, nitrogen (and sometimes sulfur) content of a sample (CHN(S)) [83]. The oxygen content can be derived by correcting for any inorganic contaminants and moisture content, or by using an alter-native, less widely available combustion system [11]. As cellulose contains more hydrogen relative to carbon than lignin does, a decrease in the hydrogen content relative to the carbon content can signal loss of the carbohydrate fraction [11, 17]. Oxygen to carbon ratios also decrease with increasing degree of decay, characteristic of prefer-ential preservation of the carbon-rich lignin component [84].
Elemental analysis by combustion methods requires small amounts of sample (~ 2 mg) and is quick (approx. 20 min per sample). However, the data obtained is lim-ited, with information on the different mechanisms of decay impossible to elucidate [83]. It must also be noted that the percentages can vary depending on the species of the starting material, and although conserved objects can be analysed, the method is heavily influenced by the presence of preserving agents, so caution should be used if the conservation history of an object is not known [11].
ThermogravimetryIn thermogravimetry (TG) a known mass of sample is heated at a constant rate and changes in the sample mass measured using specialist analytical instrumentation. Rapid changes in mass relate to the loss of different com-ponents (Fig. 6), and are visualised as steps in a plot of mass loss against temperature. Major benefits of TG are the small sample size required (~ 5 mg) and the fast anal-ysis [85].
The application of TG to the analysis of waterlogged archaeological wood has been demonstrated by sev-eral studies [85–87]. Significant changes in the thermal activity of waterlogged wood occur first when water is

Page 11 of 33High and Penkman Herit Sci (2020) 8:83
Tabl
e 3
Sum
mar
y of
tech
niqu
es d
iscu
ssed
for a
sses
smen
t of m
orph
olog
ical
cha
nges
in a
rcha
eolo
gica
l woo
d
Tech
niqu
eIn
form
atio
n yi
elde
dA
dvan
tage
sD
isad
vant
ages
Sam
ple
requ
irem
ents
Phys
ical
eva
luat
ion
Visu
al a
sses
smen
t (de
scrip
tive
appr
oach
)Su
rfac
e de
tail;
initi
al a
sses
s-m
ent o
f qua
lity
Don
e du
ring
exca
vatio
n; fa
st;
chea
p; a
cces
sibl
eD
ifficu
lt to
sta
ndar
dise
; dif-
ficul
t to
accu
rate
ly d
escr
ibe
appe
aran
ce; r
evea
ls o
nly
supe
rfici
al (s
urfa
ce) p
rese
rva-
tion
Dry
, wat
erlo
gged
or c
onse
rved
sa
mpl
e; n
on-d
estr
uctiv
e
Scor
ing
syst
ems
Stan
dard
ised
list
of v
isua
l pr
eser
vatio
n in
dica
tors
; co
mpa
rativ
e da
ta o
n su
rfac
e qu
ality
Can
be d
one
in th
e fie
ld;
incr
ease
d le
vel o
f sta
nd-
ardi
satio
n; a
llow
s co
mpa
rison
ac
ross
stu
dies
Can
still
be
subj
ectiv
e; re
quire
s an
exp
erie
nced
woo
d sp
e-ci
alis
t; re
veal
s on
ly s
uper
ficia
l (s
urfa
ce) p
rese
rvat
ion
Dry
, wat
erlo
gged
or c
onse
rved
sa
mpl
e; n
on-d
estr
uctiv
e
Adv
ance
d vi
sual
isat
ion
tech
-ni
ques
Adv
ance
d ph
otog
raph
y3D
mod
el fr
om d
igita
l pho
to-
grap
hs; s
urfa
ce d
etai
l; sh
ape;
su
rfac
e te
xtur
e
Wid
ely
avai
labl
e; c
heap
; eas
y to
use
App
eara
nce
may
not
refle
ct
pres
erva
tion;
can
stil
l be
open
to in
terp
reta
tion
Dry
, wat
erlo
gged
or c
onse
rved
sa
mpl
e; n
on-d
estr
uctiv
e
Lase
r sca
nnin
gSu
rfac
e qu
ality
; shr
inka
ge
if do
ne m
ore
than
onc
e;
enha
nced
sur
face
det
ail (
e.g.
cu
t mar
ks)
Prov
ides
a lo
ng-t
erm
dig
ital
reco
rd (i
deal
if a
rtef
acts
will
no
t be
cons
erve
d); m
ore
deta
il th
an p
hoto
grap
hy
and/
or il
lust
ratio
n
Requ
ires
spec
ialis
t equ
ipm
ent
and
expe
rtis
e; ti
me
cons
um-
ing;
reve
als
only
sup
erfic
ial
(sur
face
) pre
serv
atio
n
Dry
, wat
erlo
gged
or c
onse
rved
sa
mpl
e; n
on-d
estr
uctiv
e
Loss
of w
ood
subs
tanc
eM
WC
Pote
ntia
l beh
avio
ur u
pon
cons
erva
tion;
loss
of o
rigin
al
mat
eria
l (as
sum
edly
cel
-lu
lose
); br
oad
indi
cato
r of
deca
y
Calc
ulat
ed fr
om e
asily
m
easu
red
para
met
ers;
give
s nu
mer
ical
val
ue a
llow
ing
com
paris
on b
etw
een
stud
ies;
chea
p; a
cces
sibl
e
Lack
of c
onsi
sten
cy b
etw
een
anal
ysts
/labo
rato
ries;
lack
of
det
ail o
n na
ture
of d
ecay
; ca
n va
ry w
ith d
epth
thro
ugh
sam
ple
Wat
erlo
gged
sam
ple;
des
truc
-tiv
e; ~
0.5
g w
ater
logg
ed
sam
ple
is re
com
men
ded
Den
sity
Shrin
kage
Poro
sity
Wat
erlo
gged
sam
ple;
non
-de
stru
ctiv
e
Phys
ical
resi
stan
ce (d
ensi
ty)
Pin
test
Mea
sure
s re
sist
ance
as
a pr
oxy
for d
ensi
tyA
ccou
nts
for v
aria
tion
with
de
pth;
che
ap; w
idel
y av
ail-
able
Lack
of c
onsi
sten
cy b
etw
een
anal
ysts
Wat
erlo
gged
sam
ple;
min
imal
ly
dest
ruct
ive
(a h
ole
is m
ade
in
sam
ple)
Mec
hani
sed
prob
e (P
ilody
n/Si
bert
)G
ives
num
eric
al v
alue
s, al
low
-in
g co
mpa
rison
bet
wee
n st
udie
s
Requ
ires
spec
ialis
t equ
ipm
ent;
requ
ires
data
tran
sfor
mat
ion
Non
-inva
sive
met
hods
for
asse
ssin
g ph
ysic
al s
truc
ture
X-ra
y im
agin
gD
ensi
ty th
roug
h th
e w
hole
st
ruct
ure;
can
sho
w c
hara
c-te
ristic
dec
ay p
atte
rns;
can
be d
one
usin
g sy
nchr
otro
n ra
diat
ion
for h
ighe
r res
olu-
tion
Non
-des
truc
tive;
tech
niqu
es
pene
trat
e in
to a
sam
ple,
pr
ovid
ing
a be
tter
ana
lysi
s of
th
e bu
lk; p
orta
ble
vers
ions
av
aila
ble;
eas
y da
ta in
terp
re-
tatio
n
App
ropr
iate
cal
ibra
tion
requ
ired
to o
btai
n qu
antit
a-tiv
e an
alys
is; t
echn
ique
s no
t co
mm
only
use
d to
ass
ess
stat
e of
pre
serv
atio
n
Dry
, wat
erlo
gged
or c
onse
rved
sa
mpl
e; n
on-d
estr
uctiv
e (b
ut s
ize
of in
stru
men
t may
de
man
d th
at s
ampl
e is
cut
)
Com
pute
d to
mog
raph
y
Ultr
ason
ic te
stin
gPr
ovid
es a
naly
sis
of w
ood
dens
ity th
roug
h th
e en
tire
stru
ctur
e
Fast
; por
tabl
e; n
on-d
estr
uctiv
e;
suita
ble
for u
se in
wat
erCo
mpl
ex d
ata
inte
rpre
tatio
n;
sign
al is
affe
cted
by
mul
tiple
fa
ctor
s th
at re
quire
cal
ibra
t-in
g
Dry
, wat
erlo
gged
or c
onse
rved
sa
mpl
e; n
on-d
estr
uctiv
e
Page 12 of 33High and Penkman Herit Sci (2020) 8:83
Tabl
e 3
(con
tinu
ed)
Tech
niqu
eIn
form
atio
n yi
elde
dA
dvan
tage
sD
isad
vant
ages
Sam
ple
requ
irem
ents
Mic
rosc
opic
ana
lysi
s of
woo
d st
ruct
ure
Opt
ical
(lig
ht) m
icro
scop
yN
atur
e of
det
erio
ratio
n; w
ood
spec
ies;
colla
pse
of c
ell w
alls
; lo
ss o
f cel
lulo
se
Acc
ount
s fo
r spa
tial v
aria
tions
; re
adily
ava
ilabl
e; c
heap
Non
-qua
ntita
tive;
requ
ires
spec
ialis
t inp
ut; d
ifficu
lty
in p
repa
ratio
n of
deg
rade
d sa
mpl
es
Wat
erlo
gged
sam
ple;
des
truc
-tiv
e; a
t lea
st 2
mm
x 2
mm
se
ctio
n re
quire
d (la
rger
sam
ple
usua
lly n
eces
sary
)
UV/
Fluo
resc
ence
mic
rosc
opy
Lign
in c
onte
nt (i
n ad
ditio
n to
ab
ove
info
rmat
ion)
As
abov
e (a
nd p
rovi
des
addi
-tio
nal i
nfor
mat
ion)
Less
wid
ely
avai
labl
e; s
ampl
e pr
epar
atio
n re
quire
d
Scan
ning
ele
ctro
n m
icro
scop
y (S
EM)
Cell
wal
l los
s; na
ture
of a
ttac
k;
incl
usio
ns; s
epar
atio
n of
cel
l w
alls
; fun
gal s
pore
s
Adv
anta
ges
of L
M, b
ut w
ith
muc
h hi
gher
deg
ree
of d
etai
l; ea
sier
on
degr
aded
sam
ples
th
an L
M
Sam
ples
usu
ally
mus
t be
dry;
sa
mpl
es m
ust b
e co
ated
; ex
pens
ive;
not
as
wid
ely
avai
labl
e as
LM
Dry
or c
onse
rved
sam
ple;
de
stru
ctiv
e; a
ppro
x. 3
mm
3 sa
mpl
e re
quire
d (la
rger
sam
ple
usua
lly n
eces
sary
)
Envi
ronm
enta
l SEM
Not
und
er v
acuu
m s
o sa
mpl
e ca
n be
wat
erlo
gged
and
do
es n
ot re
quire
coa
ting
Redu
ced
qual
ity o
f im
ages
co
mpa
red
to n
orm
al S
EM;
less
wid
ely
avai
labl
e th
an
SEM
Dry
, wat
erlo
gged
or c
onse
rved
sa
mpl
e; n
on-d
estr
uctiv
e (b
ut s
ize
of in
stru
men
t may
de
man
d th
at s
ampl
e is
cut
)
Tran
smis
sion
ele
ctro
n m
icro
s-co
py (T
EM)
Exam
ines
inte
rnal
str
uctu
reVe
ry h
igh-
reso
lutio
n im
ages
Expe
nsiv
e; c
ompl
ex s
ampl
e pr
epar
atio
n; li
mite
d ac
cess
to
inst
rum
ents
and
exp
ertis
e
Dry
, wat
erlo
gged
or c
onse
rved
sa
mpl
e; d
estr
uctiv
e; <
1 m
m3
sam
ple
requ
ired
(larg
er s
ampl
e us
ually
nec
essa
ry)
SEM
–ED
X (o
r ED
S)A
s fo
r SEM
, but
incl
udes
el
emen
tal c
ompo
sitio
n m
ap;
can
obta
in li
gnin
dis
trib
utio
n m
ap if
pre
-tre
ated
Qua
ntita
tive;
sim
ulta
neou
s st
ruct
ural
ana
lysi
sLe
ss w
idel
y av
aila
ble
than
no
rmal
SEM
; mor
e ex
pens
ive
inst
rum
enta
tion;
mor
e co
mpl
ex d
ata
anal
ysis
; nee
ds
smoo
th s
ampl
e su
rfac
e
Dry
or c
onse
rved
sam
ple;
de
stru
ctiv
e; a
ppro
x. 5
mm
3 sa
mpl
e re
quire
d (la
rger
sam
ple
usua
lly n
eces
sary
)
Page 13 of 33High and Penkman Herit Sci (2020) 8:83
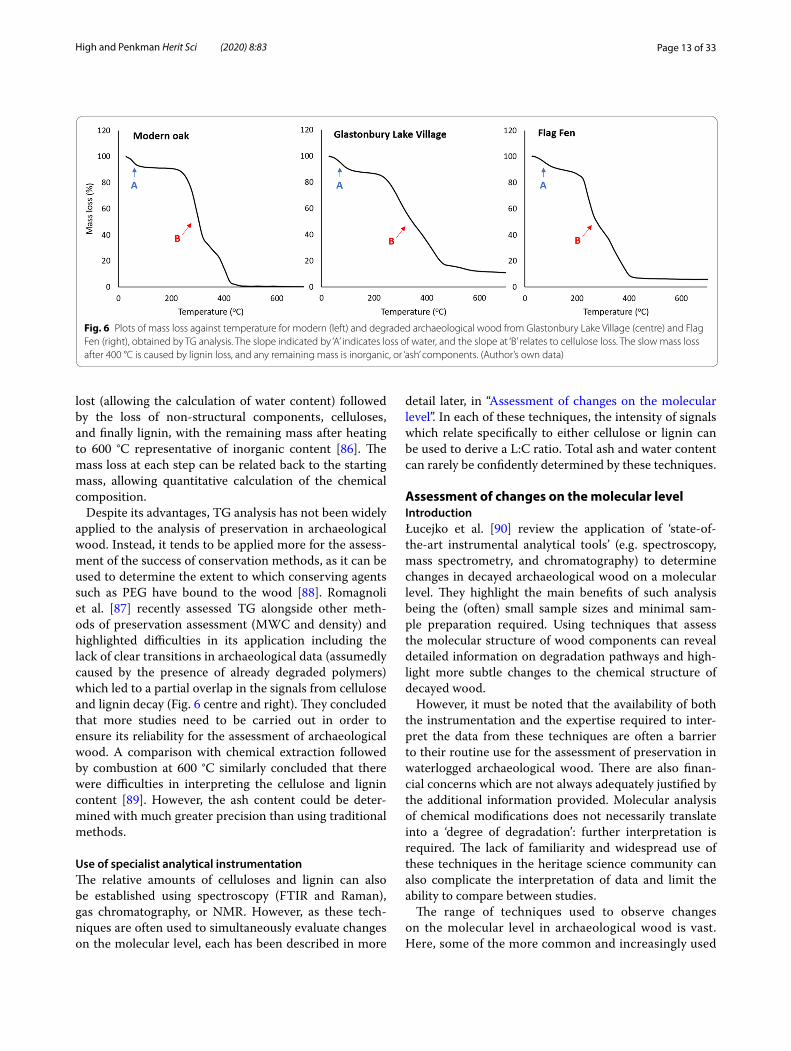
lost (allowing the calculation of water content) followed by the loss of non-structural components, celluloses, and finally lignin, with the remaining mass after heating to 600 °C representative of inorganic content [86]. The mass loss at each step can be related back to the starting mass, allowing quantitative calculation of the chemical composition.
Despite its advantages, TG analysis has not been widely applied to the analysis of preservation in archaeological wood. Instead, it tends to be applied more for the assess-ment of the success of conservation methods, as it can be used to determine the extent to which conserving agents such as PEG have bound to the wood [88]. Romagnoli et al. [87] recently assessed TG alongside other meth-ods of preservation assessment (MWC and density) and highlighted difficulties in its application including the lack of clear transitions in archaeological data (assumedly caused by the presence of already degraded polymers) which led to a partial overlap in the signals from cellulose and lignin decay (Fig. 6 centre and right). They concluded that more studies need to be carried out in order to ensure its reliability for the assessment of archaeological wood. A comparison with chemical extraction followed by combustion at 600 °C similarly concluded that there were difficulties in interpreting the cellulose and lignin content [89]. However, the ash content could be deter-mined with much greater precision than using traditional methods.
Use of specialist analytical instrumentationThe relative amounts of celluloses and lignin can also be established using spectroscopy (FTIR and Raman), gas chromatography, or NMR. However, as these tech-niques are often used to simultaneously evaluate changes on the molecular level, each has been described in more
detail later, in “Assessment of changes on the molecular level”. In each of these techniques, the intensity of signals which relate specifically to either cellulose or lignin can be used to derive a L:C ratio. Total ash and water content can rarely be confidently determined by these techniques.
Assessment of changes on the molecular levelIntroductionŁucejko et al. [90] review the application of ‘state-of-the-art instrumental analytical tools’ (e.g. spectroscopy, mass spectrometry, and chromatography) to determine changes in decayed archaeological wood on a molecular level. They highlight the main benefits of such analysis being the (often) small sample sizes and minimal sam-ple preparation required. Using techniques that assess the molecular structure of wood components can reveal detailed information on degradation pathways and high-light more subtle changes to the chemical structure of decayed wood.
However, it must be noted that the availability of both the instrumentation and the expertise required to inter-pret the data from these techniques are often a barrier to their routine use for the assessment of preservation in waterlogged archaeological wood. There are also finan-cial concerns which are not always adequately justified by the additional information provided. Molecular analysis of chemical modifications does not necessarily translate into a ‘degree of degradation’: further interpretation is required. The lack of familiarity and widespread use of these techniques in the heritage science community can also complicate the interpretation of data and limit the ability to compare between studies.
The range of techniques used to observe changes on the molecular level in archaeological wood is vast. Here, some of the more common and increasingly used
Fig. 6 Plots of mass loss against temperature for modern (left) and degraded archaeological wood from Glastonbury Lake Village (centre) and Flag Fen (right), obtained by TG analysis. The slope indicated by ‘A’ indicates loss of water, and the slope at ‘B’ relates to cellulose loss. The slow mass loss after 400 °C is caused by lignin loss, and any remaining mass is inorganic, or ‘ash’ components. (Author’s own data)
Page 14 of 33High and Penkman Herit Sci (2020) 8:83
Tabl
e 4
Sum
mar
y of
tech
niqu
es d
iscu
ssed
for t
he a
sses
smen
t of t
he re
lati
ve a
mou
nts
of w
ood
com
pone
nts
* D
enot
es th
at a
lthou
gh c
onse
rved
sam
ples
can
be
anal
ysed
, the
con
serv
atio
n hi
stor
y of
the
obje
ct m
ust b
e kn
own
to a
llow
cor
rect
ion
of th
e da
ta
Tech
niqu
eIn
form
atio
n yi
elde
dA
dvan
tage
Dis
adva
ntag
eSa
mpl
e re
quire
men
ts
Gra
vim
etric
ana
lysi
s (A
cid
inso
lubl
e lig
nin/
TAPP
I m
etho
ds)
Rela
tive
com
posi
tion
by m
ass
of
extr
activ
es, c
arbo
hydr
ates
and
lign
in
in w
ood;
ash
con
tent
by
com
bust
ion
usua
lly c
arrie
d ou
t alo
ngsi
de
Num
eric
al v
alue
s al
low
com
paris
on;
wel
l-est
ablis
hed
tech
niqu
e; c
heap
; m
ore
deta
il th
an lo
ss o
f woo
d su
bsta
nce
Tim
e co
nsum
ing;
larg
e de
gree
of e
rror
; po
tent
ially
dan
gero
us c
hem
ical
s; to
o ha
rsh
for h
eavi
ly d
egra
ded
sam
ples
Dry
sam
ple
(not
con
serv
ed);
dest
ruc-
tive;
> 1
g re
com
men
ded
(larg
er
amou
nt re
duce
s er
ror)
Com
bust
ion
anal
ysis
(CH
N(S
))Re
lativ
e co
mpo
sitio
n by
mas
s of
CH
N
(and
S in
som
e ca
ses)
Stra
ight
forw
ard
data
inte
rpre
tatio
n;
read
ily a
vaila
ble
No
stru
ctur
al in
form
atio
n; o
xyge
n co
n-te
nt n
ot d
irect
ly a
naly
sed;
det
erm
ina-
tion
of re
lativ
e am
ount
s on
ly; h
eavi
ly
influ
ence
d by
con
serv
atio
n ag
ents
an
d w
ood
spec
ies
Dry
or c
onse
rved
* sa
mpl
e; d
estr
uctiv
e;
appr
ox. 2
mg
sam
ple
requ
ired
Ther
mog
ravi
met
ryRe
lativ
e co
mpo
sitio
n by
mas
s of
wat
er,
cellu
lose
, lig
nin
and
ash
Smal
l sam
ple
size
; rel
ativ
ely
fast
(com
-pa
red
to e
xtra
ctio
n)Le
ss fa
mili
ar th
an m
any
tech
niqu
es;
requ
ires
spec
ialis
t equ
ipm
ent;
ligni
n co
nten
t can
be
very
diffi
cult
to d
eter
-m
ine
in a
rcha
eolo
gica
l sam
ples
Dry
or c
onse
rved
* sa
mpl
e; d
estr
uctiv
e;
appr
ox. 5
mg
sam
ple
requ
ired
Spec
ialis
t ins
trum
enta
tion
(FTI
R, R
aman
, Py-
GC
, NM
R)Re
lativ
e co
mpo
sitio
n of
cel
lulo
ses
and
ligni
n (L
:C ra
tios)
Sim
ulta
neou
s an
alys
is o
f mol
ecul
ar
chan
ges;
smal
l sam
ple
size
s; fa
st
anal
ysis
(com
pare
d to
gra
vim
etry
)
Requ
ires
spec
ialis
t ins
trum
enta
tion;
ca
nnot
acc
urat
ely
asse
ss a
sh a
nd
wat
er c
onte
nt
See
indi
vidu
al e
ntrie
s in
Tab
le 6
Page 15 of 33High and Penkman Herit Sci (2020) 8:83
approaches are discussed. These approaches are not exhaustive but are being increasingly reported as suit-able for the assessment of preservation in waterlogged archaeological wood.
Fourier transform-infrared spectroscopyIn Fourier transform infrared spectroscopy (FTIR), the absorption of infrared light by a material is used to infer information about the presence or absence of certain chemical bonds and functional groups, indi-cated by the presence of peaks at certain wavenumbers. FTIR is semi-quantitative, as relative concentrations of chemical functional groups are reflected by the relative intensities of the associated peaks.
Traditionally, IR light needed to be transmitted through a sample, requiring preparation in a potassium bromide (KBr) matrix prior to analysis, demanding large quantities of sample. However, the development of FTIR spectrometers fitted with an attenuated total reflectance (ATR) unit means that it is now possible to directly analyse a sample with no prior prepara-tion, reducing both the time and quantity of sample required (analysis can be performed in a matter of minutes using < 10 mg of air-dried wood). As such, the technique has been increasingly adopted for use in the conservation and archaeological science laboratory [22, 66].
Whilst the analysis of wood by ATR-FTIR is straight-forward in a practical sense, the complexity of the mate-rial means that interpretation of the data can vary greatly. In addition, only a very small part of the sample is being measured: a factor common to most instrumental meth-ods, and one that should always be considered in a sam-pling strategy. In FTIR this is exacerbated by the very small depth of penetration (0.5–3 µm) meaning that only the surface of a sample is really being analysed. However, the low cost and high speed of analysis means that these issues can easily be resolved by analysing samples from multiple locations across (or through) an object. ATR-FTIR can theoretically be applied in a non-destructive manner if sufficient contact can be made between the sample and the small optical window on the instrument. Depending on the size of the object, this is sometimes possible without cutting. However, in reality the applica-tion of pressure to ensure sufficient contact is made may result in small indentations. As signals from water might obscure signals from polymeric materials, samples are also usually analysed dry; for waterlogged wood this is an irreversible process. Conserved material can also be ana-lysed provided the influence of any conservation agents are accounted for in data interpretation.
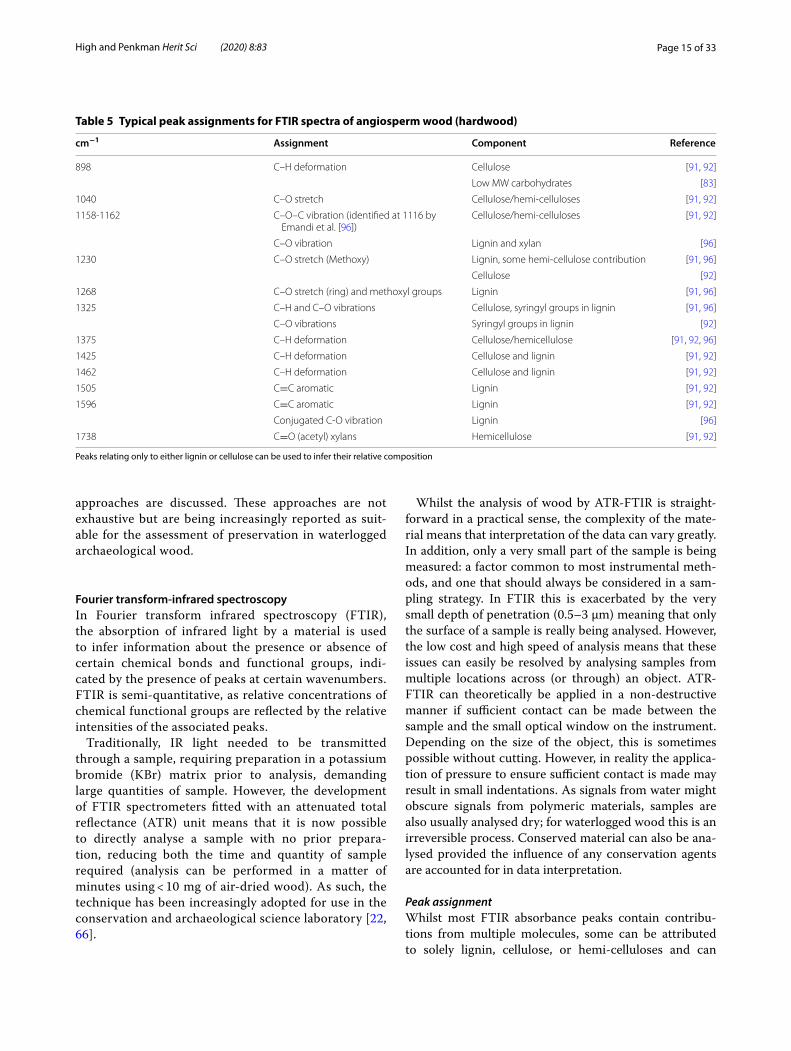
Peak assignmentWhilst most FTIR absorbance peaks contain contribu-tions from multiple molecules, some can be attributed to solely lignin, cellulose, or hemi-celluloses and can
Table 5 Typical peak assignments for FTIR spectra of angiosperm wood (hardwood)
Peaks relating only to either lignin or cellulose can be used to infer their relative composition
cm−1 Assignment Component Reference
898 C–H deformation Cellulose [91, 92]
Low MW carbohydrates [83]
1040 C–O stretch Cellulose/hemi-celluloses [91, 92]
1158-1162 C–O–C vibration (identified at 1116 by Emandi et al. [96])
Cellulose/hemi-celluloses [91, 92]
C–O vibration Lignin and xylan [96]
1230 C–O stretch (Methoxy) Lignin, some hemi-cellulose contribution [91, 96]
Cellulose [92]
1268 C–O stretch (ring) and methoxyl groups Lignin [91, 96]
1325 C–H and C–O vibrations Cellulose, syringyl groups in lignin [91, 96]
C–O vibrations Syringyl groups in lignin [92]
1375 C–H deformation Cellulose/hemicellulose [91, 92, 96]
1425 C–H deformation Cellulose and lignin [91, 92]
1462 C–H deformation Cellulose and lignin [91, 92]
1505 C=C aromatic Lignin [91, 92]
1596 C=C aromatic Lignin [91, 92]
Conjugated C-O vibration Lignin [96]
1738 C=O (acetyl) xylans Hemicellulose [91, 92]
Page 16 of 33High and Penkman Herit Sci (2020) 8:83
therefore be examined to provide information on the relative abundance of each component [91–93]. Changes in the relative composition compared to fresh wood indi-cate the degree of decay and comparing different peaks within the same spectrum makes this semi-quantitative. Although peak assignments can vary between studies, a review of literature sources shows that some can be con-fidently attributed to certain polymers (Table 5).
However, the position of some peaks can shift wave-number depending on wood species, with hardwood and softwoods having quite different spectra [92]. The presence of inorganic salts such as gypsum and pyrite may lead to additional absorption peaks, further com-plicating spectra [94]. Pizzo et al. [95] demonstrate that signals attributed to non-structural compounds (such as lipids and pectins) may overlap with those attributed to structural components, greatly influencing the apparent intensity of peaks related to cell wall material. In practice, assigning peaks in archaeological wood can be challeng-ing, as the spectrum of an archaeological sample can look very different to a modern standard (Fig. 7).
Loss of celluloseL:C ratios (derived from the intensity of the relevant FTIR peaks) have been shown to correlate well with those calculated by chemical extraction [93]. Ratios can be calculated from either the peak heights or areas, of two or more of the assigned peaks. The peaks used can vary between studies, although most use the character-istic aromatic ring peak at 1505 cm−1 as an indication of lignin content, from which relative cellulose content can be calculated using the peaks at 1375 and/or 898 cm−1 [92, 96].
The peak at 1738 cm−1 is attributed to the C=O (acetyl) groups in xylan (a type of hemi-cellulose) and is often observed to have decreased in intensity or been lost completely even before significant cellulose loss has occurred [97, 98]. This is because the acetyl groups are readily hydrolysed to acetic acid, and it does not neces-sarily represent degradation of the polymers [98, 99]. The C–O–C related band at 1024 cm−1 can significantly alter with increasing degradation (Fig. 7). This is attributed to cellulose hydrolysis leading to increased concentrations of carbonyl groups [100].
From a practical perspective, L:C ratios are much easier to calculate using FTIR than from, for example, gravimetric analysis. However, in cases where detailed chemical information on the molecular structure of any residual cellulose is required, a more comprehen-sive analysis, for example using py-GC or NMR (see later sections) is necessary [101].
Lignin deteriorationThere is increasing awareness that lignin deterioration can occur alongside cellulose deterioration, challenging the assumption that L:C ratios alone are a good indica-tor of preservation [101, 102]. Other situations where L:C ratios may be insufficient include cases where cellu-lose has already been completely degraded, or where very subtle differences need to be evaluated.
Several broad indicators of lignin decay have been identified in FTIR spectra. During bacterial degradation, methoxyl groups are removed which can be observed by an increased intensity of the lignin skeleton peaks (1505/1596 cm−1) compared to the lignin functional group stretches (1230/1268 cm−1) [93, 101]. In unde-graded wood the peaks at 1230 and 1268 cm−1 appear as one broad peak, but increasing degradation of lignin results in the separation of these two peaks ([91]; Fig. 7). Durmaz et al. [100] also report a shift of the peak at 1268 cm−1 to 1264 cm−1 with increasing degradation, as well as an increase in intensity of the C-H peaks in lignin at 1425 and 1462 cm−1.
Data collection and interpretationIn some studies, FTIR spectra are smoothed, normalised or baseline corrected prior to evaluation [92, 95] whereas in others spectral manipulation is kept to an absolute minimum [103, 104]. The exact method of calculating peak areas can also vary in terms of where the baseline is drawn [91, 92]. These differences may limit the ability to compare data between studies, but full publication of the raw datasets can circumvent this.
Whilst FTIR analysis most commonly combines analy-sis of peak ratios with visual identification of changes in the spectra, researchers are increasingly employing che-mometric methods to model changes in the entire spec-trum [95, 105]. As most of the peaks in an FTIR spectrum of wood contain contributions from more than one poly-mer, taking this statistical approach to quantify over-all changes can better discriminate between wood with varying degrees of deterioration [105]. Whilst statistical analyses require additional expertise as well as availabil-ity of suitable software, if applied correctly these methods can very easily help identify outliers, as well as character-ise differences in chemical composition between samples [105].
FTIR microscopy/FTIR imagingChemical imaging, or chemical mapping, involves con-ducting multiple analysis of an object to build up a visual image of the distribution of different components. This provides a spatial dimension to the analysis which can be valuable, as previously discussed for SEM-BSE/EDX. FTIR microscopy offers the ability to record multiple
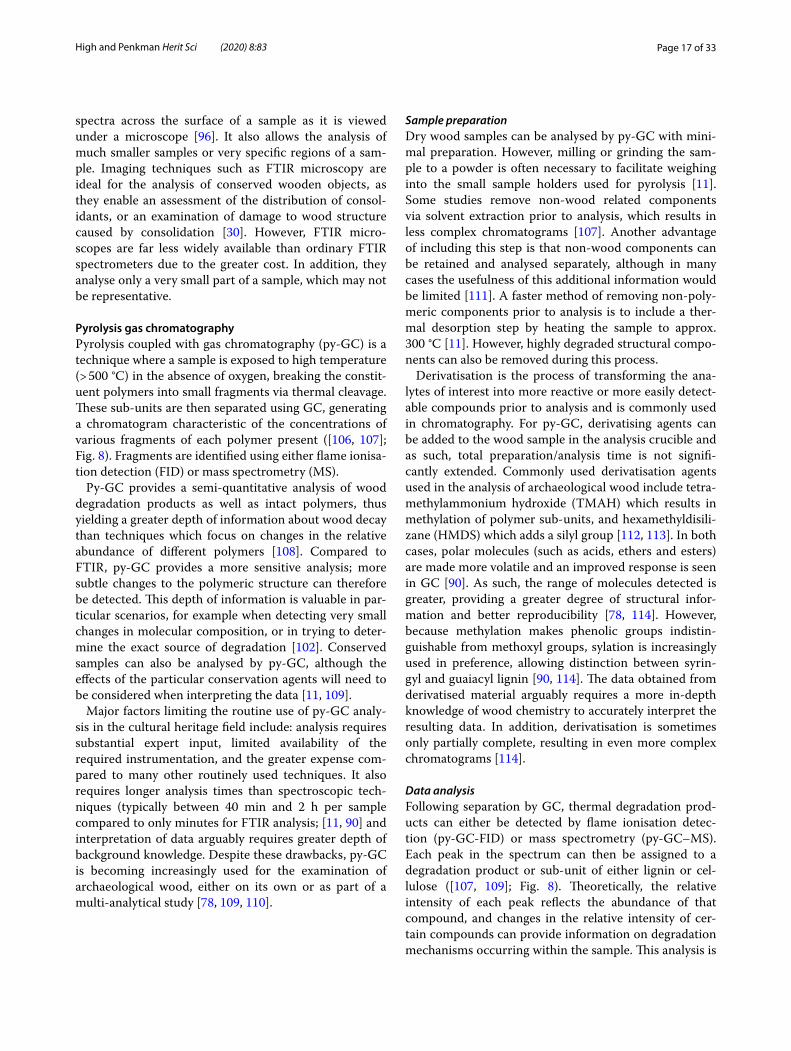
Page 17 of 33High and Penkman Herit Sci (2020) 8:83
spectra across the surface of a sample as it is viewed under a microscope [96]. It also allows the analysis of much smaller samples or very specific regions of a sam-ple. Imaging techniques such as FTIR microscopy are ideal for the analysis of conserved wooden objects, as they enable an assessment of the distribution of consol-idants, or an examination of damage to wood structure caused by consolidation [30]. However, FTIR micro-scopes are far less widely available than ordinary FTIR spectrometers due to the greater cost. In addition, they analyse only a very small part of a sample, which may not be representative.
Pyrolysis gas chromatographyPyrolysis coupled with gas chromatography (py-GC) is a technique where a sample is exposed to high temperature (> 500 °C) in the absence of oxygen, breaking the constit-uent polymers into small fragments via thermal cleavage. These sub-units are then separated using GC, generating a chromatogram characteristic of the concentrations of various fragments of each polymer present ([106, 107]; Fig. 8). Fragments are identified using either flame ionisa-tion detection (FID) or mass spectrometry (MS).
Py-GC provides a semi-quantitative analysis of wood degradation products as well as intact polymers, thus yielding a greater depth of information about wood decay than techniques which focus on changes in the relative abundance of different polymers [108]. Compared to FTIR, py-GC provides a more sensitive analysis; more subtle changes to the polymeric structure can therefore be detected. This depth of information is valuable in par-ticular scenarios, for example when detecting very small changes in molecular composition, or in trying to deter-mine the exact source of degradation [102]. Conserved samples can also be analysed by py-GC, although the effects of the particular conservation agents will need to be considered when interpreting the data [11, 109].
Major factors limiting the routine use of py-GC analy-sis in the cultural heritage field include: analysis requires substantial expert input, limited availability of the required instrumentation, and the greater expense com-pared to many other routinely used techniques. It also requires longer analysis times than spectroscopic tech-niques (typically between 40 min and 2 h per sample compared to only minutes for FTIR analysis; [11, 90] and interpretation of data arguably requires greater depth of background knowledge. Despite these drawbacks, py-GC is becoming increasingly used for the examination of archaeological wood, either on its own or as part of a multi-analytical study [78, 109, 110].
Sample preparationDry wood samples can be analysed by py-GC with mini-mal preparation. However, milling or grinding the sam-ple to a powder is often necessary to facilitate weighing into the small sample holders used for pyrolysis [11]. Some studies remove non-wood related components via solvent extraction prior to analysis, which results in less complex chromatograms [107]. Another advantage of including this step is that non-wood components can be retained and analysed separately, although in many cases the usefulness of this additional information would be limited [111]. A faster method of removing non-poly-meric components prior to analysis is to include a ther-mal desorption step by heating the sample to approx. 300 °C [11]. However, highly degraded structural compo-nents can also be removed during this process.
Derivatisation is the process of transforming the ana-lytes of interest into more reactive or more easily detect-able compounds prior to analysis and is commonly used in chromatography. For py-GC, derivatising agents can be added to the wood sample in the analysis crucible and as such, total preparation/analysis time is not signifi-cantly extended. Commonly used derivatisation agents used in the analysis of archaeological wood include tetra-methylammonium hydroxide (TMAH) which results in methylation of polymer sub-units, and hexamethyldisili-zane (HMDS) which adds a silyl group [112, 113]. In both cases, polar molecules (such as acids, ethers and esters) are made more volatile and an improved response is seen in GC [90]. As such, the range of molecules detected is greater, providing a greater degree of structural infor-mation and better reproducibility [78, 114]. However, because methylation makes phenolic groups indistin-guishable from methoxyl groups, sylation is increasingly used in preference, allowing distinction between syrin-gyl and guaiacyl lignin [90, 114]. The data obtained from derivatised material arguably requires a more in-depth knowledge of wood chemistry to accurately interpret the resulting data. In addition, derivatisation is sometimes only partially complete, resulting in even more complex chromatograms [114].
Data analysisFollowing separation by GC, thermal degradation prod-ucts can either be detected by flame ionisation detec-tion (py-GC-FID) or mass spectrometry (py-GC–MS). Each peak in the spectrum can then be assigned to a degradation product or sub-unit of either lignin or cel-lulose ([107, 109]; Fig. 8). Theoretically, the relative intensity of each peak reflects the abundance of that compound, and changes in the relative intensity of cer-tain compounds can provide information on degradation mechanisms occurring within the sample. This analysis is
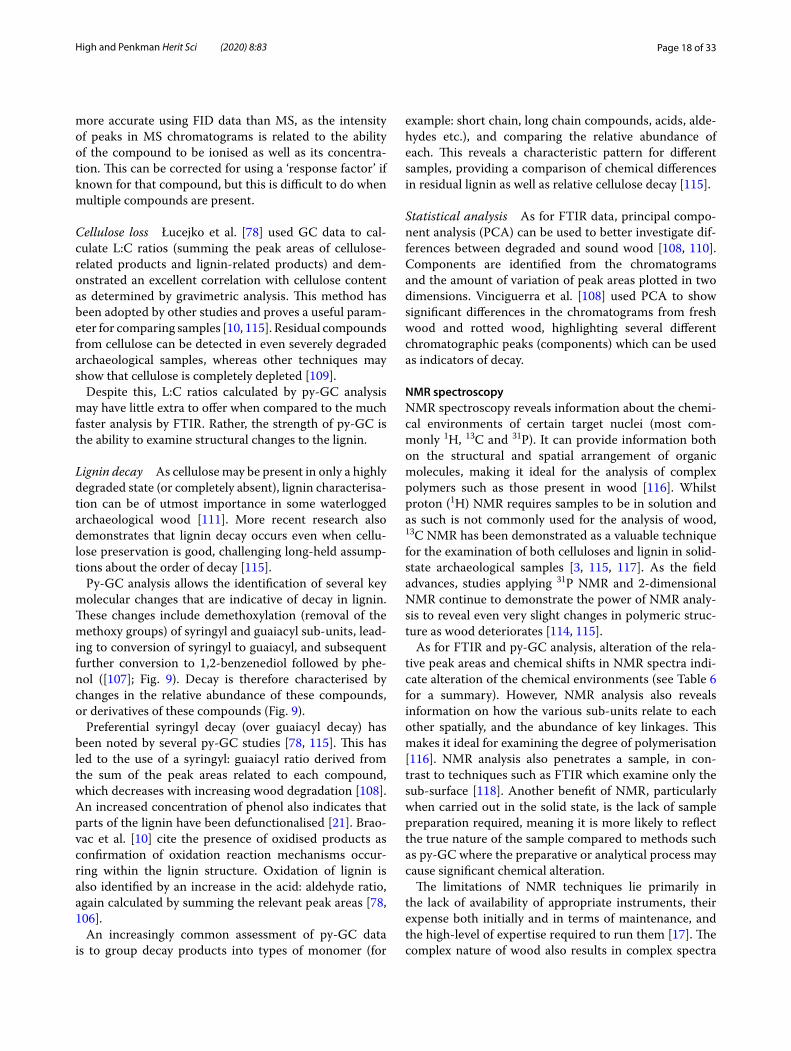
Page 18 of 33High and Penkman Herit Sci (2020) 8:83
more accurate using FID data than MS, as the intensity of peaks in MS chromatograms is related to the ability of the compound to be ionised as well as its concentra-tion. This can be corrected for using a ‘response factor’ if known for that compound, but this is difficult to do when multiple compounds are present.
Cellulose loss Łucejko et al. [78] used GC data to cal-culate L:C ratios (summing the peak areas of cellulose-related products and lignin-related products) and dem-onstrated an excellent correlation with cellulose content as determined by gravimetric analysis. This method has been adopted by other studies and proves a useful param-eter for comparing samples [10, 115]. Residual compounds from cellulose can be detected in even severely degraded archaeological samples, whereas other techniques may show that cellulose is completely depleted [109].
Despite this, L:C ratios calculated by py-GC analysis may have little extra to offer when compared to the much faster analysis by FTIR. Rather, the strength of py-GC is the ability to examine structural changes to the lignin.
Lignin decay As cellulose may be present in only a highly degraded state (or completely absent), lignin characterisa-tion can be of utmost importance in some waterlogged archaeological wood [111]. More recent research also demonstrates that lignin decay occurs even when cellu-lose preservation is good, challenging long-held assump-tions about the order of decay [115].
Py-GC analysis allows the identification of several key molecular changes that are indicative of decay in lignin. These changes include demethoxylation (removal of the methoxy groups) of syringyl and guaiacyl sub-units, lead-ing to conversion of syringyl to guaiacyl, and subsequent further conversion to 1,2-benzenediol followed by phe-nol ([107]; Fig. 9). Decay is therefore characterised by changes in the relative abundance of these compounds, or derivatives of these compounds (Fig. 9).
Preferential syringyl decay (over guaiacyl decay) has been noted by several py-GC studies [78, 115]. This has led to the use of a syringyl: guaiacyl ratio derived from the sum of the peak areas related to each compound, which decreases with increasing wood degradation [108]. An increased concentration of phenol also indicates that parts of the lignin have been defunctionalised [21]. Brao-vac et al. [10] cite the presence of oxidised products as confirmation of oxidation reaction mechanisms occur-ring within the lignin structure. Oxidation of lignin is also identified by an increase in the acid: aldehyde ratio, again calculated by summing the relevant peak areas [78, 106].
An increasingly common assessment of py-GC data is to group decay products into types of monomer (for
example: short chain, long chain compounds, acids, alde-hydes etc.), and comparing the relative abundance of each. This reveals a characteristic pattern for different samples, providing a comparison of chemical differences in residual lignin as well as relative cellulose decay [115].
Statistical analysis As for FTIR data, principal compo-nent analysis (PCA) can be used to better investigate dif-ferences between degraded and sound wood [108, 110]. Components are identified from the chromatograms and the amount of variation of peak areas plotted in two dimensions. Vinciguerra et al. [108] used PCA to show significant differences in the chromatograms from fresh wood and rotted wood, highlighting several different chromatographic peaks (components) which can be used as indicators of decay.
NMR spectroscopyNMR spectroscopy reveals information about the chemi-cal environments of certain target nuclei (most com-monly 1H, 13C and 31P). It can provide information both on the structural and spatial arrangement of organic molecules, making it ideal for the analysis of complex polymers such as those present in wood [116]. Whilst proton (1H) NMR requires samples to be in solution and as such is not commonly used for the analysis of wood, 13C NMR has been demonstrated as a valuable technique for the examination of both celluloses and lignin in solid-state archaeological samples [3, 115, 117]. As the field advances, studies applying 31P NMR and 2-dimensional NMR continue to demonstrate the power of NMR analy-sis to reveal even very slight changes in polymeric struc-ture as wood deteriorates [114, 115].
As for FTIR and py-GC analysis, alteration of the rela-tive peak areas and chemical shifts in NMR spectra indi-cate alteration of the chemical environments (see Table 6 for a summary). However, NMR analysis also reveals information on how the various sub-units relate to each other spatially, and the abundance of key linkages. This makes it ideal for examining the degree of polymerisation [116]. NMR analysis also penetrates a sample, in con-trast to techniques such as FTIR which examine only the sub-surface [118]. Another benefit of NMR, particularly when carried out in the solid state, is the lack of sample preparation required, meaning it is more likely to reflect the true nature of the sample compared to methods such as py-GC where the preparative or analytical process may cause significant chemical alteration.
The limitations of NMR techniques lie primarily in the lack of availability of appropriate instruments, their expense both initially and in terms of maintenance, and the high-level of expertise required to run them [17]. The complex nature of wood also results in complex spectra
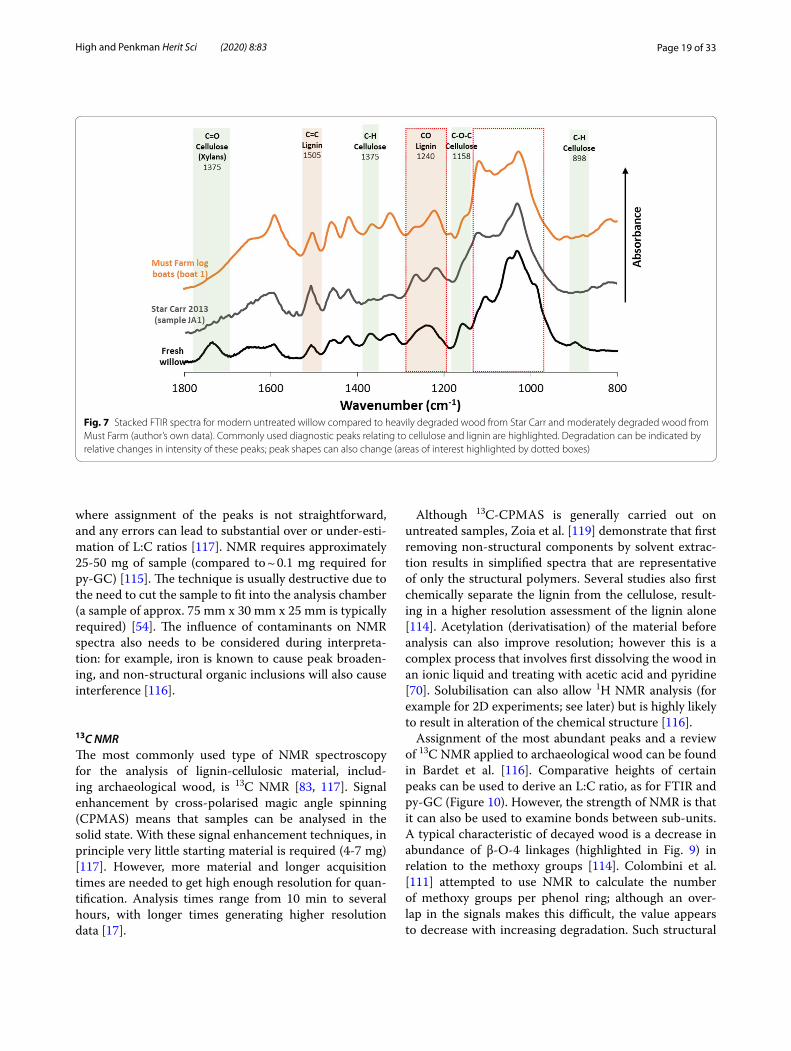
Page 19 of 33High and Penkman Herit Sci (2020) 8:83
where assignment of the peaks is not straightforward, and any errors can lead to substantial over or under-esti-mation of L:C ratios [117]. NMR requires approximately 25-50 mg of sample (compared to ~ 0.1 mg required for py-GC) [115]. The technique is usually destructive due to the need to cut the sample to fit into the analysis chamber (a sample of approx. 75 mm x 30 mm x 25 mm is typically required) [54]. The influence of contaminants on NMR spectra also needs to be considered during interpreta-tion: for example, iron is known to cause peak broaden-ing, and non-structural organic inclusions will also cause interference [116].
13C NMRThe most commonly used type of NMR spectroscopy for the analysis of lignin-cellulosic material, includ-ing archaeological wood, is 13C NMR [83, 117]. Signal enhancement by cross-polarised magic angle spinning (CPMAS) means that samples can be analysed in the solid state. With these signal enhancement techniques, in principle very little starting material is required (4-7 mg) [117]. However, more material and longer acquisition times are needed to get high enough resolution for quan-tification. Analysis times range from 10 min to several hours, with longer times generating higher resolution data [17].
Although 13C-CPMAS is generally carried out on untreated samples, Zoia et al. [119] demonstrate that first removing non-structural components by solvent extrac-tion results in simplified spectra that are representative of only the structural polymers. Several studies also first chemically separate the lignin from the cellulose, result-ing in a higher resolution assessment of the lignin alone [114]. Acetylation (derivatisation) of the material before analysis can also improve resolution; however this is a complex process that involves first dissolving the wood in an ionic liquid and treating with acetic acid and pyridine [70]. Solubilisation can also allow 1H NMR analysis (for example for 2D experiments; see later) but is highly likely to result in alteration of the chemical structure [116].
Assignment of the most abundant peaks and a review of 13C NMR applied to archaeological wood can be found in Bardet et al. [116]. Comparative heights of certain peaks can be used to derive an L:C ratio, as for FTIR and py-GC (Figure 10). However, the strength of NMR is that it can also be used to examine bonds between sub-units. A typical characteristic of decayed wood is a decrease in abundance of β-O-4 linkages (highlighted in Fig. 9) in relation to the methoxy groups [114]. Colombini et al. [111] attempted to use NMR to calculate the number of methoxy groups per phenol ring; although an over-lap in the signals makes this difficult, the value appears to decrease with increasing degradation. Such structural
Fig. 7 Stacked FTIR spectra for modern untreated willow compared to heavily degraded wood from Star Carr and moderately degraded wood from Must Farm (author’s own data). Commonly used diagnostic peaks relating to cellulose and lignin are highlighted. Degradation can be indicated by relative changes in intensity of these peaks; peak shapes can also change (areas of interest highlighted by dotted boxes)

Page 20 of 33High and Penkman Herit Sci (2020) 8:83
Fig. 8 Partial py-GC-FID chromatograms from modern pine (top) and archaeological wood from a heavily decayed coffin (bottom). Points of interest include: a decrease in the relative intensity of cellulose related peaks at the start of the chromatogram and a decrease in the relative intensity of levoglucosan (a cellulose pyrolysis product) in the degraded sample indicating loss of cellulose; an increased intensity of short chain degradation products (e.g. phenol, 2-methyl phenol and 3-methyl phenol) and an increased intensity of oxidised compounds (*) later in the chromatograms in the degraded sample, signifying lignin modification (Image copyright Adam Pinder)
Fig. 9 Simplified schematic showing some of the functional groups formed in lignin via major degradation pathways (left). These pathways result in altered concentrations of different types of sub-unit (right) (summarised from various sources including van Bergen et al. [107] and Filley et al. [102])
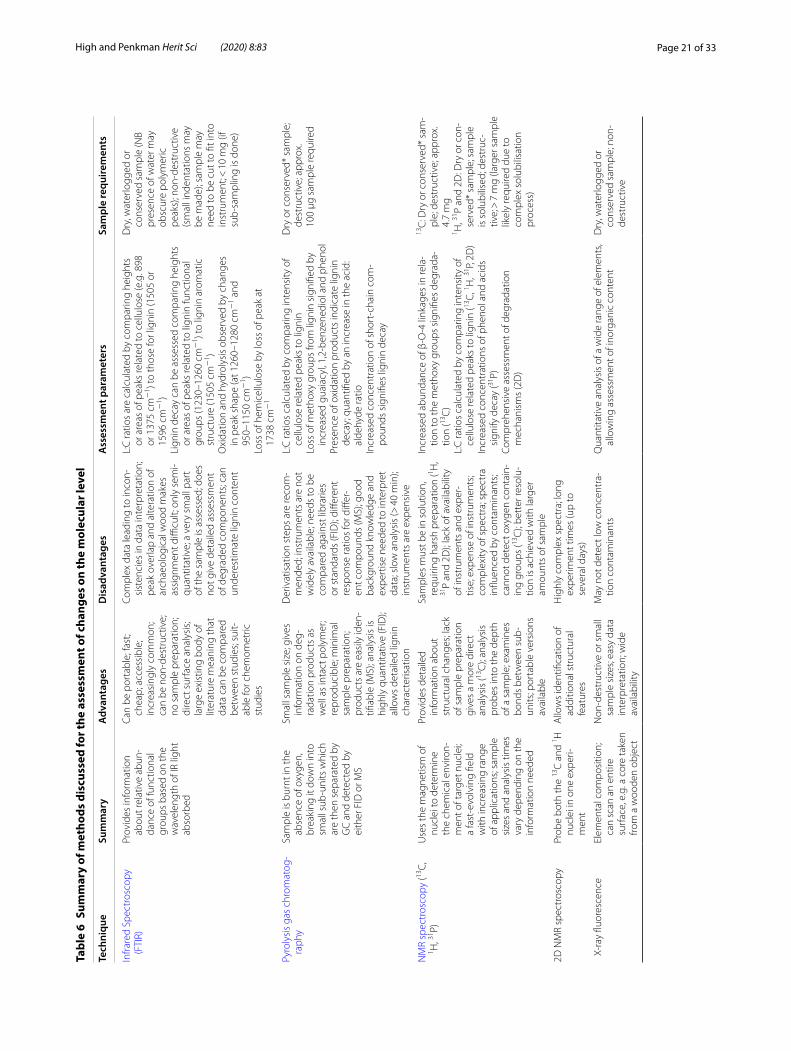
Page 21 of 33High and Penkman Herit Sci (2020) 8:83
Tabl
e 6
Sum
mar
y of
met
hods
dis
cuss
ed fo
r the
ass
essm
ent o
f cha
nges
on
the
mol
ecul
ar le
vel
Tech
niqu
eSu
mm
ary
Adv
anta
ges
Dis
adva
ntag
esA
sses
smen
t par
amet
ers
Sam
ple
requ
irem
ents
Infra
red
Spec
tros
copy
(F
TIR)
Prov
ides
info
rmat
ion
abou
t rel
ativ
e ab
un-
danc
e of
func
tiona
l gr
oups
bas
ed o
n th
e w
avel
engt
h of
IR li
ght
abso
rbed
Can
be p
orta
ble;
fast
; ch
eap;
acc
essi
ble;
in
crea
sing
ly c
omm
on;
can
be n
on-d
estr
uctiv
e;
no s
ampl
e pr
epar
atio
n;
dire
ct s
urfa
ce a
naly
sis;
larg
e ex
istin
g bo
dy o
f lit
erat
ure
mea
ning
that
da
ta c
an b
e co
mpa
red
betw
een
stud
ies;
suit-
able
for c
hem
omet
ric
stud
ies
Com
plex
dat
a le
adin
g to
inco
n-si
sten
cies
in d
ata
inte
rpre
tatio
n;
peak
ove
rlap
and
alte
ratio
n of
ar
chae
olog
ical
woo
d m
akes
as
sign
men
t diffi
cult;
onl
y se
mi-
quan
titat
ive;
a v
ery
smal
l par
t of
the
sam
ple
is a
sses
sed;
doe
s no
t giv
e de
taile
d as
sess
men
t of
deg
rade
d co
mpo
nent
s; ca
n un
dere
stim
ate
ligni
n co
nten
t
L:C
ratio
s ar
e ca
lcul
ated
by
com
parin
g he
ight
s or
are
as o
f pea
ks re
late
d to
cel
lulo
se (e
.g. 8
98
or 1
375
cm−
1 ) to
thos
e fo
r lig
nin
(150
5 or
15
96 c
m−
1 )Li
gnin
dec
ay c
an b
e as
sess
ed c
ompa
ring
heig
hts
or a
reas
of p
eaks
rela
ted
to li
gnin
func
tiona
l gr
oups
(123
0–12
60 c
m−
1 ) to
ligni
n ar
omat
ic
stru
ctur
e (1
505
cm−
1 )O
xida
tion
and
hydr
olys
is o
bser
ved
by c
hang
es
in p
eak
shap
e (a
t 126
0–12
80 c
m−
1 and
95
0–11
50 c
m−
1 )Lo
ss o
f hem
icel
lulo
se b
y lo
ss o
f pea
k at
17
38 c
m−
1
Dry
, wat
erlo
gged
or
cons
erve
d sa
mpl
e (N
B pr
esen
ce o
f wat
er m
ay
obsc
ure
poly
mer
ic
peak
s); n
on-d
estr
uctiv
e (s
mal
l ind
enta
tions
may
be
mad
e); s
ampl
e m
ay
need
to b
e cu
t to
fit in
to
inst
rum
ent;
< 1
0 m
g (if
su
b-sa
mpl
ing
is d
one)
Pyro
lysi
s ga
s ch
rom
atog
-ra
phy
Sam
ple
is b
urnt
in th
e ab
senc
e of
oxy
gen,
br
eaki
ng it
dow
n in
to
smal
l sub
-uni
ts w
hich
ar
e th
en s
epar
ated
by
GC
and
det
ecte
d by
ei
ther
FID
or M
S
Smal
l sam
ple
size
; giv
es
info
rmat
ion
on d
eg-
rada
tion
prod
ucts
as
wel
l as
inta
ct p
olym
er;
repr
oduc
ible
; min
imal
sa
mpl
e pr
epar
atio
n;
prod
ucts
are
eas
ily id
en-
tifiab
le (M
S); a
naly
sis
is
high
ly q
uant
itativ
e (F
ID);
allo
ws
deta
iled
ligni
n ch
arac
teris
atio
n
Der
ivat
isat
ion
step
s ar
e re
com
-m
ende
d; in
stru
men
ts a
re n
ot
wid
ely
avai
labl
e; n
eeds
to b
e co
mpa
red
agai
nst l
ibra
ries
or s
tand
ards
(FID
); di
ffere
nt
resp
onse
ratio
s fo
r diff
er-
ent c
ompo
unds
(MS)
; goo
d ba
ckgr
ound
kno
wle
dge
and
expe
rtis
e ne
eded
to in
terp
ret
data
; slo
w a
naly
sis
(> 4
0 m
in);
inst
rum
ents
are
exp
ensi
ve
L:C
ratio
s ca
lcul
ated
by
com
parin
g in
tens
ity o
f ce
llulo
se re
late
d pe
aks
to li
gnin
Loss
of m
etho
xy g
roup
s fro
m li
gnin
sig
nifie
d by
in
crea
sed
guai
acyl
, 1,2
-ben
zene
diol
and
phe
nol
Pres
ence
of o
xida
tion
prod
ucts
indi
cate
lign
in
deca
y; q
uant
ified
by
an in
crea
se in
the
acid
: al
dehy
de ra
tioIn
crea
sed
conc
entr
atio
n of
sho
rt-c
hain
com
-po
unds
sig
nifie
s lig
nin
deca
y
Dry
or c
onse
rved
* sa
mpl
e;
dest
ruct
ive;
app
rox.
10
0 µg
sam
ple
requ
ired
NM
R sp
ectr
osco
py (13
C,
1 H, 31
P)U
ses
the
mag
netis
m o
f nu
clei
to d
eter
min
e th
e ch
emic
al e
nviro
n-m
ent o
f tar
get n
ucle
i; a
fast
-evo
lvin
g fie
ld
with
incr
easi
ng ra
nge
of a
pplic
atio
ns; s
ampl
e si
zes
and
anal
ysis
tim
es
vary
dep
endi
ng o
n th
e in
form
atio
n ne
eded
Prov
ides
det
aile
d in
form
atio
n ab
out
stru
ctur
al c
hang
es; l
ack
of s
ampl
e pr
epar
atio
n gi
ves
a m
ore
dire
ct
anal
ysis
(13C
); an
alys
is
prob
es in
to th
e de
pth
of a
sam
ple;
exa
min
es
bond
s be
twee
n su
b-un
its; p
orta
ble
vers
ions
av
aila
ble
Sam
ples
mus
t be
in s
olut
ion,
re
quiri
ng h
arsh
pre
para
tion
(1 H,
31P
and
2D);
lack
of a
vaila
bilit
y of
inst
rum
ents
and
exp
er-
tise;
exp
ense
of i
nstr
umen
ts;
com
plex
ity o
f spe
ctra
; spe
ctra
in
fluen
ced
by c
onta
min
ants
; ca
nnot
det
ect o
xyge
n co
ntai
n-in
g gr
oups
(13C
); be
tter
reso
lu-
tion
is a
chie
ved
with
larg
er
amou
nts
of s
ampl
e
Incr
ease
d ab
unda
nce
of β
-O-4
link
ages
in re
la-
tion
to th
e m
etho
xy g
roup
s si
gnifi
es d
egra
da-
tion
(13C
)L:
C ra
tios
calc
ulat
ed b
y co
mpa
ring
inte
nsity
of
cellu
lose
rela
ted
peak
s to
lign
in (13
C, 1 H
, 31P,
2D)
Incr
ease
d co
ncen
trat
ions
of p
heno
l and
aci
ds
sign
ify d
ecay
(31P)
Com
preh
ensi
ve a
sses
smen
t of d
egra
datio
n m
echa
nism
s (2
D)
13C
: Dry
or c
onse
rved
* sa
m-
ple;
des
truc
tive;
app
rox.
4.
7 m
g1 H
, 31P
and
2D: D
ry o
r con
-se
rved
* sa
mpl
e; s
ampl
e is
sol
ubili
sed;
des
truc
-tiv
e; >
7 m
g (la
rger
sam
ple
likel
y re
quire
d du
e to
co
mpl
ex s
olub
ilisa
tion
proc
ess)
2D N
MR
spec
tros
copy
Prob
e bo
th th
e 13
C a
nd 1 H
nu
clei
in o
ne e
xper
i-m
ent
Allo
ws
iden
tifica
tion
of
addi
tiona
l str
uctu
ral
feat
ures
Hig
hly
com
plex
spe
ctra
; lon
g ex
perim
ent t
imes
(up
to
seve
ral d
ays)
X-r
ay fl
uore
scen
ceEl
emen
tal c
ompo
sitio
n;
can
scan
an
entir
e su
rfac
e, e
.g. a
cor
e ta
ken
from
a w
oode
n ob
ject
Non
-des
truc
tive
or s
mal
l sa
mpl
e si
zes;
easy
dat
a in
terp
reta
tion;
wid
e av
aila
bilit
y
May
not
det
ect l
ow c
once
ntra
-tio
n co
ntam
inan
tsQ
uant
itativ
e an
alys
is o
f a w
ide
rang
e of
ele
men
ts,
allo
win
g as
sess
men
t of i
norg
anic
con
tent
Dry
, wat
erlo
gged
or
cons
erve
d sa
mpl
e; n
on-
dest
ruct
ive

Page 22 of 33High and Penkman Herit Sci (2020) 8:83
* D
enot
es th
at a
lthou
gh c
onse
rved
sam
ples
can
be
anal
ysed
, the
con
serv
atio
n hi
stor
y of
the
obje
ct m
ust b
e kn
own
to a
llow
cor
rect
ion
of th
e da
ta
Tabl
e 6
(con
tinu
ed)
Tech
niqu
eSu
mm
ary
Adv
anta
ges
Dis
adva
ntag
esA
sses
smen
t par
amet
ers
Sam
ple
requ
irem
ents
X-r
ay d
iffra
ctio
nX-
ray
tech
niqu
es
pene
trat
e a
sam
ple,
pro
-vi
ding
an
anal
ysis
of t
he
bulk
; inf
orm
atio
n re
late
s to
long
rang
e in
tern
al
stru
ctur
e
Smal
l sam
ple
size
s; gi
ves
deta
iled
stru
ctur
al in
for-
mat
ion
abou
t ino
rgan
ic
incl
usio
ns; a
naly
ses
a la
rger
are
a th
an m
any
othe
r tec
hniq
ues
Lack
of a
vaila
bilit
y of
syn
chro
tron
in
stru
men
ts (X
-ray
abs
orpt
ion)
; ex
act l
ocat
ion
of d
ecay
diffi
cult
to e
luci
date
; may
not
det
ect
low
con
cent
ratio
n co
ntam
i-na
nts
A d
ecre
ase
in c
ellu
lose
cry
stal
linity
sig
nifie
s de
cay
(XRD
)D
ry o
r con
serv
ed; n
on-
dest
ruct
ive
(but
lim
ited
by in
stru
men
t siz
e, a
nd
mill
ing
sam
ples
may
im
prov
e se
nsiti
vity
)
X-r
ay a
bsor
ptio
nH
ighl
y qu
antit
ativ
e an
alys
is o
f ino
rgan
ic c
onte
nt,
incl
udin
g ch
arge
sta
tes
(X-r
ay a
bsor
ptio
n)
Ram
an s
pect
rosc
opy
Cha
ract
eris
tic s
pect
rum
fro
m s
catt
ered
ligh
t; co
mpl
emen
tary
info
r-m
atio
n to
FTI
R
Non
-des
truc
tive;
fast
an
alys
is ti
mes
; can
de
tect
inor
gani
c co
m-
pone
nts;
less
affe
cted
by
pre
senc
e of
wat
er
than
FTI
R is
Not
as
fam
iliar
or w
idel
y av
aila
ble
as F
TIR;
not
ver
y se
nsiti
veCe
llulo
se: l
igni
n co
mpo
sitio
n by
com
parin
g pe
ak
heig
hts
at 1
100–
1150
cm
−1 (c
ellu
lose
) and
16
00-1
650
cm−
1 (lig
nin)
Woo
d cr
ysta
llini
ty in
dica
ted
by b
and
at 9
3 cm
−1
Pres
ence
of i
norg
anic
incl
usio
ns
Dry
, wat
erlo
gged
or
cons
erve
d sa
mpl
e; n
on-
dest
ruct
ive
ICP-
AES
An
adva
nced
met
hod
of
elem
enta
l ana
lysi
sH
ighl
y qu
antit
ativ
e an
d hi
ghly
sen
sitiv
eLe
ss w
idel
y av
aila
ble
than
som
e EA
tech
niqu
es (e
.g. S
EM-E
DX)
; no
str
uctu
ral i
nfor
mat
ion
give
n
Hig
hly
quan
titat
ive
anal
ysis
of i
norg
anic
con
tent
Dry
or c
onse
rved
* sa
mpl
e;
dest
ruct
ive;
app
rox.
5–
10 m
g sa
mpl
e re
quire
d
EGA
-MS
The
gas
evol
ved
from
bu
rnin
g a
sam
ple
is
dete
cted
and
ana
lyse
d by
MS
Smal
l sam
ple
size
; giv
es
info
rmat
ion
on d
egra
da-
tion
prod
ucts
as
wel
l as
inta
ct p
olym
er; m
inim
al
sam
ple
prep
arat
ion;
id
eal f
or a
naly
sing
co
nser
ved
mat
eria
l
Not
wid
espr
ead
or fa
mili
ar; h
igh
cost
of i
nstr
umen
t and
ong
o-in
g m
aint
enan
ce; p
eaks
from
co
nsol
idan
ts c
an o
verla
p w
ith
poly
mer
ic s
igna
ls
As
for p
y-G
C, w
ith a
dditi
onal
info
rmat
ion
rega
rd-
ing
cons
erva
tion
cons
olid
ants
Dry
or c
onse
rved
* sa
mpl
e;
dest
ruct
ive;
app
rox.
10
0 µg
sam
ple
requ
ired
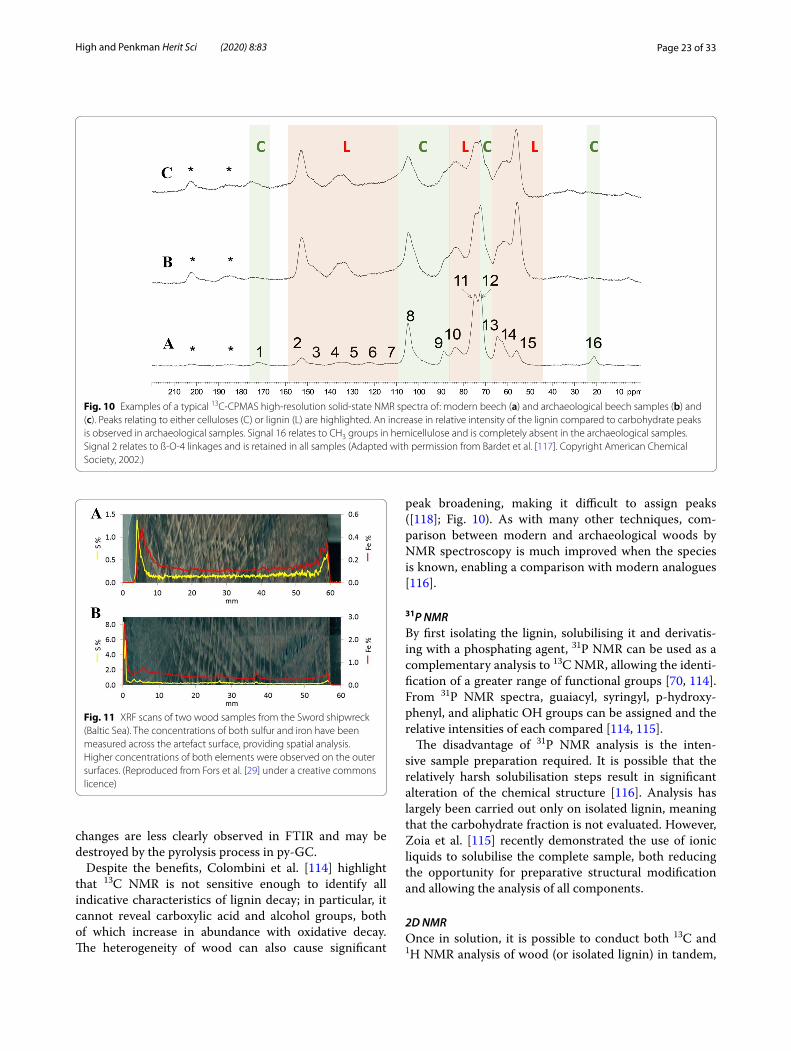
Page 23 of 33High and Penkman Herit Sci (2020) 8:83
changes are less clearly observed in FTIR and may be destroyed by the pyrolysis process in py-GC.
Despite the benefits, Colombini et al. [114] highlight that 13C NMR is not sensitive enough to identify all indicative characteristics of lignin decay; in particular, it cannot reveal carboxylic acid and alcohol groups, both of which increase in abundance with oxidative decay. The heterogeneity of wood can also cause significant
peak broadening, making it difficult to assign peaks ([118]; Fig. 10). As with many other techniques, com-parison between modern and archaeological woods by NMR spectroscopy is much improved when the species is known, enabling a comparison with modern analogues [116].
31P NMRBy first isolating the lignin, solubilising it and derivatis-ing with a phosphating agent, 31P NMR can be used as a complementary analysis to 13C NMR, allowing the identi-fication of a greater range of functional groups [70, 114]. From 31P NMR spectra, guaiacyl, syringyl, p-hydroxy-phenyl, and aliphatic OH groups can be assigned and the relative intensities of each compared [114, 115].
The disadvantage of 31P NMR analysis is the inten-sive sample preparation required. It is possible that the relatively harsh solubilisation steps result in significant alteration of the chemical structure [116]. Analysis has largely been carried out only on isolated lignin, meaning that the carbohydrate fraction is not evaluated. However, Zoia et al. [115] recently demonstrated the use of ionic liquids to solubilise the complete sample, both reducing the opportunity for preparative structural modification and allowing the analysis of all components.
2D NMROnce in solution, it is possible to conduct both 13C and 1H NMR analysis of wood (or isolated lignin) in tandem,
Fig. 10 Examples of a typical 13C-CPMAS high-resolution solid-state NMR spectra of: modern beech (a) and archaeological beech samples (b) and (c). Peaks relating to either celluloses (C) or lignin (L) are highlighted. An increase in relative intensity of the lignin compared to carbohydrate peaks is observed in archaeological samples. Signal 16 relates to CH3 groups in hemicellulose and is completely absent in the archaeological samples. Signal 2 relates to ß-O-4 linkages and is retained in all samples (Adapted with permission from Bardet et al. [117]. Copyright American Chemical Society, 2002.)
Fig. 11 XRF scans of two wood samples from the Sword shipwreck (Baltic Sea). The concentrations of both sulfur and iron have been measured across the artefact surface, providing spatial analysis. Higher concentrations of both elements were observed on the outer surfaces. (Reproduced from Fors et al. [29] under a creative commons licence)
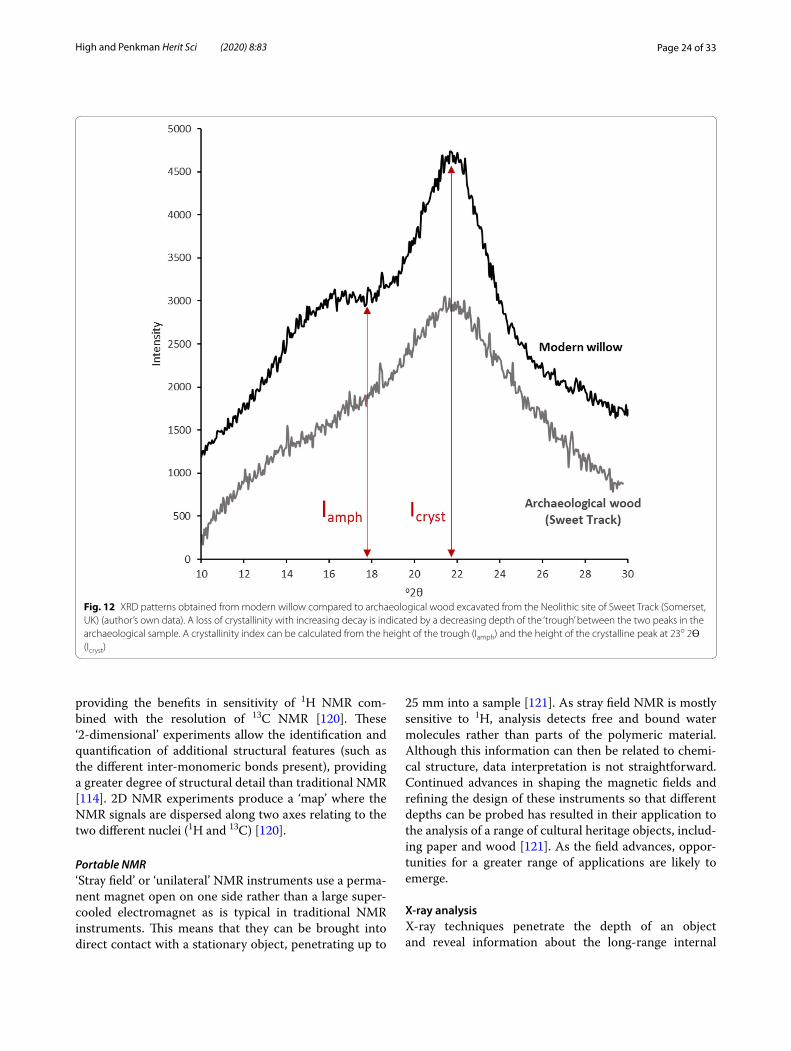
Page 24 of 33High and Penkman Herit Sci (2020) 8:83
providing the benefits in sensitivity of 1H NMR com-bined with the resolution of 13C NMR [120]. These ‘2-dimensional’ experiments allow the identification and quantification of additional structural features (such as the different inter-monomeric bonds present), providing a greater degree of structural detail than traditional NMR [114]. 2D NMR experiments produce a ‘map’ where the NMR signals are dispersed along two axes relating to the two different nuclei (1H and 13C) [120].
Portable NMR‘Stray field’ or ‘unilateral’ NMR instruments use a perma-nent magnet open on one side rather than a large super-cooled electromagnet as is typical in traditional NMR instruments. This means that they can be brought into direct contact with a stationary object, penetrating up to
25 mm into a sample [121]. As stray field NMR is mostly sensitive to 1H, analysis detects free and bound water molecules rather than parts of the polymeric material. Although this information can then be related to chemi-cal structure, data interpretation is not straightforward. Continued advances in shaping the magnetic fields and refining the design of these instruments so that different depths can be probed has resulted in their application to the analysis of a range of cultural heritage objects, includ-ing paper and wood [121]. As the field advances, oppor-tunities for a greater range of applications are likely to emerge.
X-ray analysisX-ray techniques penetrate the depth of an object and reveal information about the long-range internal
Fig. 12 XRD patterns obtained from modern willow compared to archaeological wood excavated from the Neolithic site of Sweet Track (Somerset, UK) (author’s own data). A loss of crystallinity with increasing decay is indicated by a decreasing depth of the ‘trough’ between the two peaks in the archaeological sample. A crystallinity index can be calculated from the height of the trough (Iamph) and the height of the crystalline peak at 23o 2ϴ (Icryst)
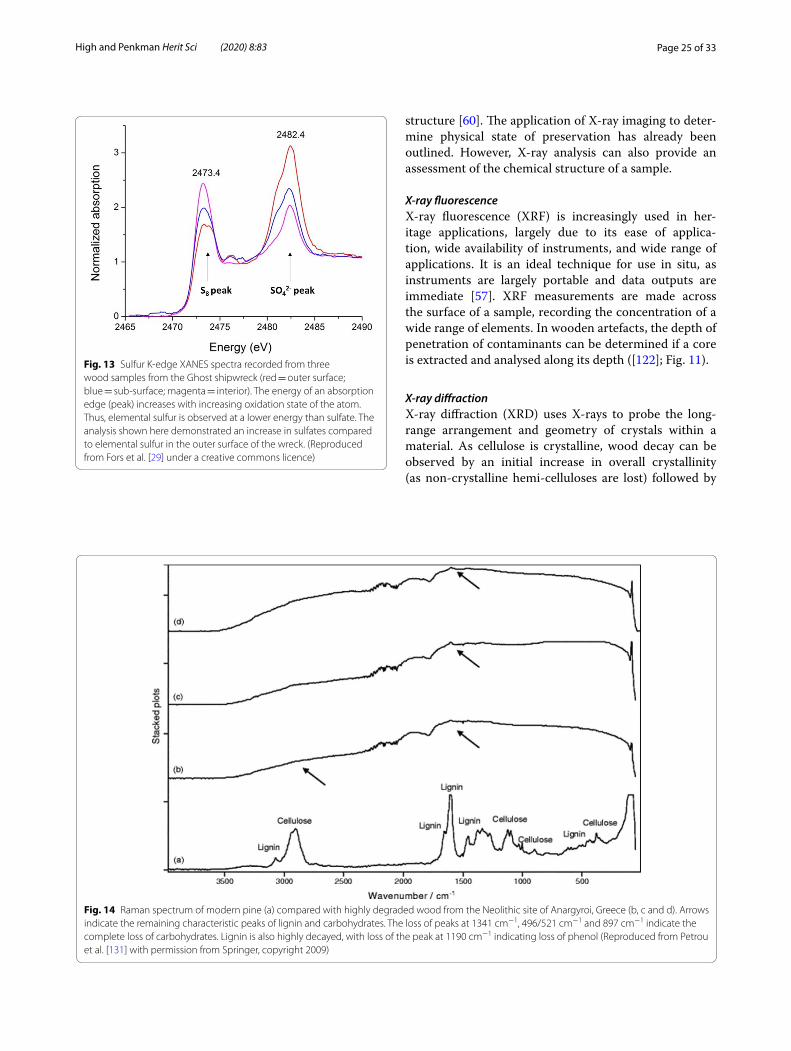
Page 25 of 33High and Penkman Herit Sci (2020) 8:83
structure [60]. The application of X-ray imaging to deter-mine physical state of preservation has already been outlined. However, X-ray analysis can also provide an assessment of the chemical structure of a sample.
X‑ray fluorescenceX-ray fluorescence (XRF) is increasingly used in her-itage applications, largely due to its ease of applica-tion, wide availability of instruments, and wide range of applications. It is an ideal technique for use in situ, as instruments are largely portable and data outputs are immediate [57]. XRF measurements are made across the surface of a sample, recording the concentration of a wide range of elements. In wooden artefacts, the depth of penetration of contaminants can be determined if a core is extracted and analysed along its depth ([122]; Fig. 11).
X‑ray diffractionX-ray diffraction (XRD) uses X-rays to probe the long-range arrangement and geometry of crystals within a material. As cellulose is crystalline, wood decay can be observed by an initial increase in overall crystallinity (as non-crystalline hemi-celluloses are lost) followed by
Fig. 13 Sulfur K-edge XANES spectra recorded from three wood samples from the Ghost shipwreck (red = outer surface; blue = sub-surface; magenta = interior). The energy of an absorption edge (peak) increases with increasing oxidation state of the atom. Thus, elemental sulfur is observed at a lower energy than sulfate. The analysis shown here demonstrated an increase in sulfates compared to elemental sulfur in the outer surface of the wreck. (Reproduced from Fors et al. [29] under a creative commons licence)
Fig. 14 Raman spectrum of modern pine (a) compared with highly degraded wood from the Neolithic site of Anargyroi, Greece (b, c and d). Arrows indicate the remaining characteristic peaks of lignin and carbohydrates. The loss of peaks at 1341 cm−1, 496/521 cm−1 and 897 cm−1 indicate the complete loss of carbohydrates. Lignin is also highly decayed, with loss of the peak at 1190 cm−1 indicating loss of phenol (Reproduced from Petrou et al. [131] with permission from Springer, copyright 2009)
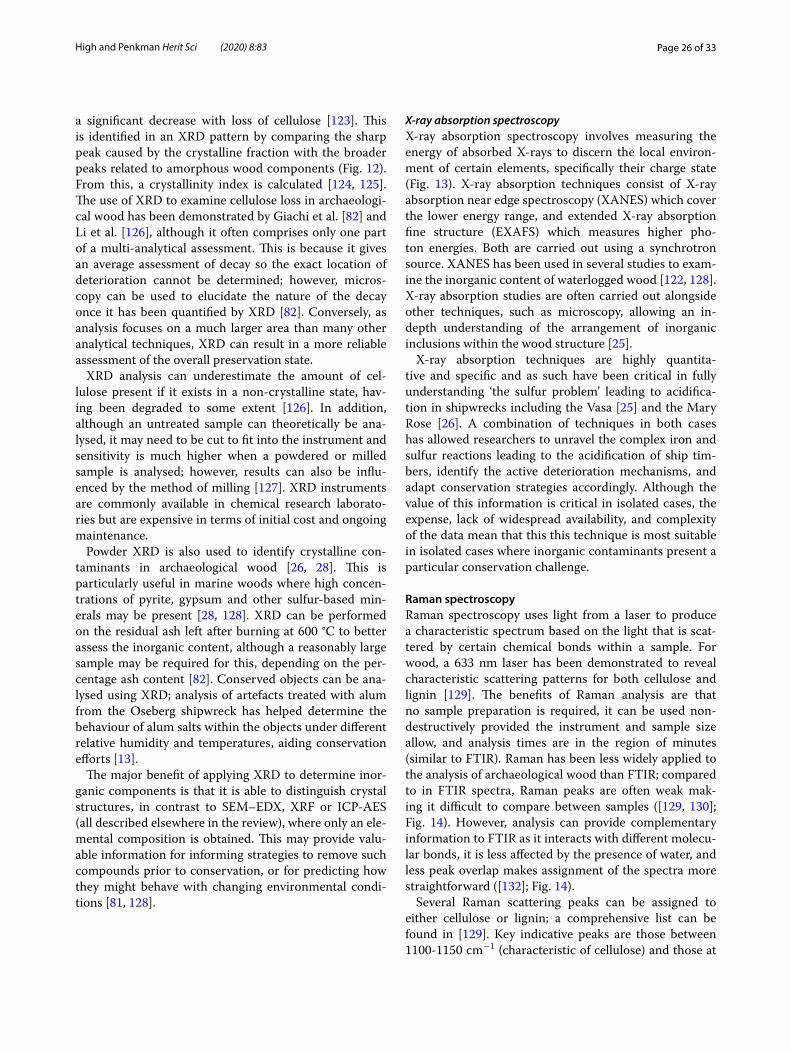
Page 26 of 33High and Penkman Herit Sci (2020) 8:83
a significant decrease with loss of cellulose [123]. This is identified in an XRD pattern by comparing the sharp peak caused by the crystalline fraction with the broader peaks related to amorphous wood components (Fig. 12). From this, a crystallinity index is calculated [124, 125]. The use of XRD to examine cellulose loss in archaeologi-cal wood has been demonstrated by Giachi et al. [82] and Li et al. [126], although it often comprises only one part of a multi-analytical assessment. This is because it gives an average assessment of decay so the exact location of deterioration cannot be determined; however, micros-copy can be used to elucidate the nature of the decay once it has been quantified by XRD [82]. Conversely, as analysis focuses on a much larger area than many other analytical techniques, XRD can result in a more reliable assessment of the overall preservation state.
XRD analysis can underestimate the amount of cel-lulose present if it exists in a non-crystalline state, hav-ing been degraded to some extent [126]. In addition, although an untreated sample can theoretically be ana-lysed, it may need to be cut to fit into the instrument and sensitivity is much higher when a powdered or milled sample is analysed; however, results can also be influ-enced by the method of milling [127]. XRD instruments are commonly available in chemical research laborato-ries but are expensive in terms of initial cost and ongoing maintenance.
Powder XRD is also used to identify crystalline con-taminants in archaeological wood [26, 28]. This is particularly useful in marine woods where high concen-trations of pyrite, gypsum and other sulfur-based min-erals may be present [28, 128]. XRD can be performed on the residual ash left after burning at 600 °C to better assess the inorganic content, although a reasonably large sample may be required for this, depending on the per-centage ash content [82]. Conserved objects can be ana-lysed using XRD; analysis of artefacts treated with alum from the Oseberg shipwreck has helped determine the behaviour of alum salts within the objects under different relative humidity and temperatures, aiding conservation efforts [13].
The major benefit of applying XRD to determine inor-ganic components is that it is able to distinguish crystal structures, in contrast to SEM–EDX, XRF or ICP-AES (all described elsewhere in the review), where only an ele-mental composition is obtained. This may provide valu-able information for informing strategies to remove such compounds prior to conservation, or for predicting how they might behave with changing environmental condi-tions [81, 128].
X‑ray absorption spectroscopyX-ray absorption spectroscopy involves measuring the energy of absorbed X-rays to discern the local environ-ment of certain elements, specifically their charge state (Fig. 13). X-ray absorption techniques consist of X-ray absorption near edge spectroscopy (XANES) which cover the lower energy range, and extended X-ray absorption fine structure (EXAFS) which measures higher pho-ton energies. Both are carried out using a synchrotron source. XANES has been used in several studies to exam-ine the inorganic content of waterlogged wood [122, 128]. X-ray absorption studies are often carried out alongside other techniques, such as microscopy, allowing an in-depth understanding of the arrangement of inorganic inclusions within the wood structure [25].
X-ray absorption techniques are highly quantita-tive and specific and as such have been critical in fully understanding ‘the sulfur problem’ leading to acidifica-tion in shipwrecks including the Vasa [25] and the Mary Rose [26]. A combination of techniques in both cases has allowed researchers to unravel the complex iron and sulfur reactions leading to the acidification of ship tim-bers, identify the active deterioration mechanisms, and adapt conservation strategies accordingly. Although the value of this information is critical in isolated cases, the expense, lack of widespread availability, and complexity of the data mean that this this technique is most suitable in isolated cases where inorganic contaminants present a particular conservation challenge.
Raman spectroscopyRaman spectroscopy uses light from a laser to produce a characteristic spectrum based on the light that is scat-tered by certain chemical bonds within a sample. For wood, a 633 nm laser has been demonstrated to reveal characteristic scattering patterns for both cellulose and lignin [129]. The benefits of Raman analysis are that no sample preparation is required, it can be used non-destructively provided the instrument and sample size allow, and analysis times are in the region of minutes (similar to FTIR). Raman has been less widely applied to the analysis of archaeological wood than FTIR; compared to in FTIR spectra, Raman peaks are often weak mak-ing it difficult to compare between samples ([129, 130]; Fig. 14). However, analysis can provide complementary information to FTIR as it interacts with different molecu-lar bonds, it is less affected by the presence of water, and less peak overlap makes assignment of the spectra more straightforward ([132]; Fig. 14).
Several Raman scattering peaks can be assigned to either cellulose or lignin; a comprehensive list can be found in [129]. Key indicative peaks are those between 1100-1150 cm−1 (characteristic of cellulose) and those at
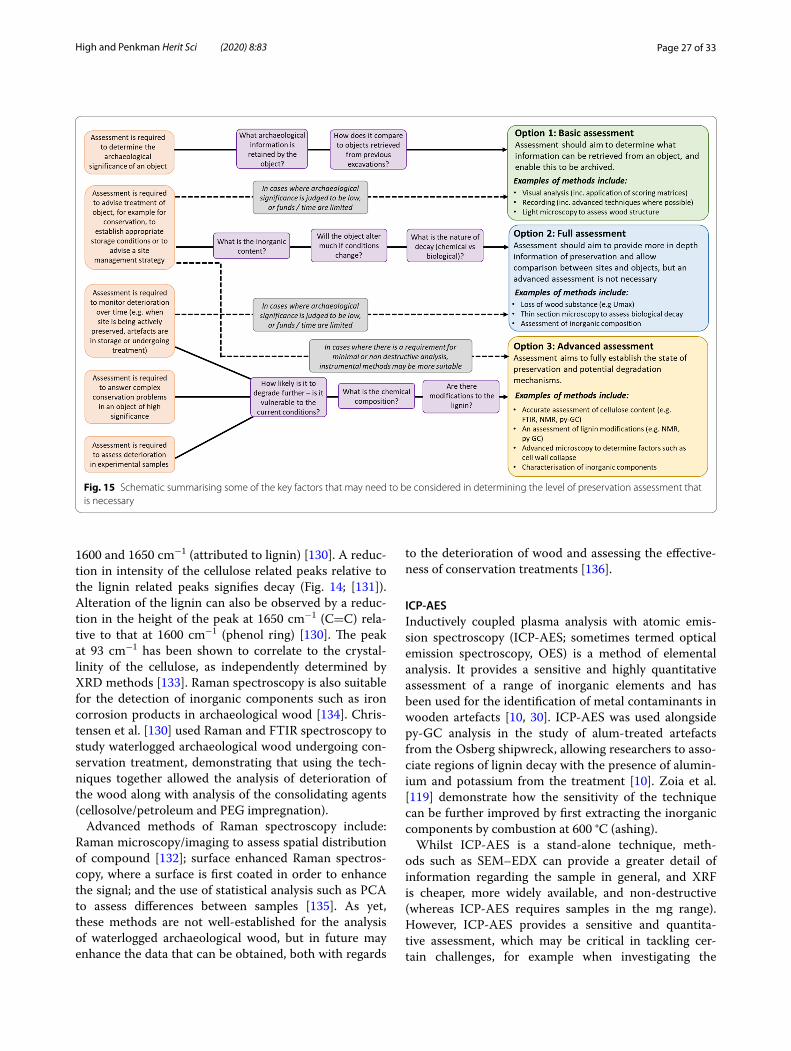
Page 27 of 33High and Penkman Herit Sci (2020) 8:83
1600 and 1650 cm−1 (attributed to lignin) [130]. A reduc-tion in intensity of the cellulose related peaks relative to the lignin related peaks signifies decay (Fig. 14; [131]). Alteration of the lignin can also be observed by a reduc-tion in the height of the peak at 1650 cm−1 (C=C) rela-tive to that at 1600 cm−1 (phenol ring) [130]. The peak at 93 cm−1 has been shown to correlate to the crystal-linity of the cellulose, as independently determined by XRD methods [133]. Raman spectroscopy is also suitable for the detection of inorganic components such as iron corrosion products in archaeological wood [134]. Chris-tensen et al. [130] used Raman and FTIR spectroscopy to study waterlogged archaeological wood undergoing con-servation treatment, demonstrating that using the tech-niques together allowed the analysis of deterioration of the wood along with analysis of the consolidating agents (cellosolve/petroleum and PEG impregnation).
Advanced methods of Raman spectroscopy include: Raman microscopy/imaging to assess spatial distribution of compound [132]; surface enhanced Raman spectros-copy, where a surface is first coated in order to enhance the signal; and the use of statistical analysis such as PCA to assess differences between samples [135]. As yet, these methods are not well-established for the analysis of waterlogged archaeological wood, but in future may enhance the data that can be obtained, both with regards
to the deterioration of wood and assessing the effective-ness of conservation treatments [136].
ICP-AESInductively coupled plasma analysis with atomic emis-sion spectroscopy (ICP-AES; sometimes termed optical emission spectroscopy, OES) is a method of elemental analysis. It provides a sensitive and highly quantitative assessment of a range of inorganic elements and has been used for the identification of metal contaminants in wooden artefacts [10, 30]. ICP-AES was used alongside py-GC analysis in the study of alum-treated artefacts from the Osberg shipwreck, allowing researchers to asso-ciate regions of lignin decay with the presence of alumin-ium and potassium from the treatment [10]. Zoia et al. [119] demonstrate how the sensitivity of the technique can be further improved by first extracting the inorganic components by combustion at 600 °C (ashing).
Whilst ICP-AES is a stand-alone technique, meth-ods such as SEM–EDX can provide a greater detail of information regarding the sample in general, and XRF is cheaper, more widely available, and non-destructive (whereas ICP-AES requires samples in the mg range). However, ICP-AES provides a sensitive and quantita-tive assessment, which may be critical in tackling cer-tain challenges, for example when investigating the
Fig. 15 Schematic summarising some of the key factors that may need to be considered in determining the level of preservation assessment that is necessary
Page 28 of 33High and Penkman Herit Sci (2020) 8:83
behaviours of inorganic contaminants under changing conditions [30].
Evolved gas analysis (EGA)EGA involves detecting the gas evolved when a sample is heated, for example in a TG instrument, providing addi-tional structural information [137]. Methods of detec-tion include by FTIR (EGA-FTIR) or mass spectrometry (EGA-MS; [112]). EGA-MS is ideal for analysing archae-ological wood that has been conserved, as products from the consolidating agents (such as PEG or disodium seba-cate) can be identified [112]. The key advantage of the method is that polymeric material from the wood itself can be analysed at the same time, providing in-depth structural information particularly when combined with MS [138]. The advantage of gathering such sensitive data, particularly regarding lignin alteration, is that small alter-ations can be detected, for example over a short time-scale. However, data can be complex with many signals overlapping, particularly in well-preserved wood. The high cost of initial instrumentation and ongoing main-tenance, alongside the lack of wide-spread familiarity means that EGA is not yet commonly used for the analy-sis of archaeological wood. However, although the tech-nique has only fairly recently been first used specifically for this purpose [138], there is an increasing uptake in the use of EGA for the analysis of organic materials more generally in the field of heritage science [139].
Discussion: designing a scheme of assessmentA scheme of assessment will inevitably be heavily influ-enced by external factors such as the time and finances available, or the availability of both instrumentation and expertise. Several points for consideration are dis-cussed here, having emerged from this review as key considerations. However, this discussion is by no means exhaustive. Ultimately, an analytical strategy needs to be considered on a site by site (and sometimes artefact by artefact) basis, considering a wide range of factors.
A multi-analytical approachMany studies highlight that no single technique is best for determining the level of deterioration in waterlogged wood, advocating a multi-analytical approach [70, 83, 101, 111]. Macchioni et al. [45] demonstrate that using only one technique may lead to misinterpretation of the degree of preservation. As an example, Tamburini et al. [66] highlight that some techniques do not account for the presence of degraded polymers that have remained in situ. Other studies attempt to compare two or more techniques: studies comparing the level of deterioration determined by MWC and NMR [117], gravimetric anal-ysis compared to py-GC [78], and gravimetric analysis
compared to FTIR [93] have all shown discrepancies between the techniques, without demonstrating which of the methods is ‘wrong’. A scheme of assessment will therefore ideally incorporate a wide range of analyses, providing the best possible baseline from which to meas-ure future change.
Aims of assessmentIdentifying the aim of the assessment helps to determine which questions need to be answered, and in what level of detail (Fig. 15). In many cases, a basic visual assess-ment is enough for assessing the archaeological signifi-cance of an object (related to the value of information that may be retrieved).
If the aim is to advise a method of conservation, cheap and accessible methods such as light (optical) microscopy and loss of wood substance indices are likely to provide the additional information required [20, 77]. In cases where a high concentration of inorganic salts may affect the behaviour of a wooden object post excavation, dur-ing conservation or in situ, inorganic components should also be assessed. In cases where an object is considered of high archaeological significance or conservation is likely to be complex, a more advanced assessment of the molecular composition might be considered.
Some situations may demand that preservation assess-ment is quantitative and provides a great amount of detail, for example when deterioration needs to be moni-tored [6, 140, 141]. This might include when a site is to be preserved in situ under active management, when the effect of changes in the burial conditions needs to be assessed, or when investigating the deterioration of an artefact in storage or on display. In these cases, assess-ment of changes on the molecular level using analytical instrumentation should be considered.
If the aim is to compare the material with material from past analysis, it is important to carry out the same analy-sis as far as possible, as different methods are not neces-sarily comparable. If possible, reanalysis of the original artefact may also be useful.
Sampling considerationsThe availability of material for destructive analysis is an important consideration in selecting an assessment method. This could be limited by factors such as the significance or size of an object and may demand that non-destructive (e.g. X-ray analysis or spectroscopy), or minimally destructive techniques (e.g. py-GC) are used. This also allows the analysis of a greater quantity of samples. This may be from one object, or from different locations across a site and would better account for dif-ferences in preservation.

Page 29 of 33High and Penkman Herit Sci (2020) 8:83
Due to the highly heterogenous nature of waterlogged archaeological wood, one analysis is unlikely to be rep-resentative of the entire object, regardless of the method used. This concern is exacerbated in techniques where only very small areas are analysed. An appropriate sam-pling strategy therefore needs to be considered. This may involve taking cores through a sample, dividing this up into zones and performing multiple analysis [142, 143]. If availability of sample is limited, it may be possible to ana-lyse samples taken for other purposes, for example spe-cies identification or dendrochronology.
Constraints on analysisThe methods used for preservation assessment are highly likely to be limited mainly by external factors, such as the time and finances available. However, this does not necessarily mean that instrumental analysis needs to be ruled out; for example, FTIR analysis is much quicker than gravimetric analysis and provides a more sensitive assessment. Another limiting factor may be the availabil-ity of both instrumentation and expertise, which is more of a concern for some instrumental methods than others. However, such concerns may be overcome through col-laborative partnerships.
The current state of the wood may dictate which tech-niques are possible to use, for example if a sample has already dried out some techniques may be difficult or yield little valuable information (e.g. light microscopy, MWC, X-ray imaging). For other techniques samples should be dried, which for waterlogged archaeological wood is an irreversible and therefore destructive process (e.g. FTIR, NMR). If an object has already undergone conservation treatment, that could also rule out tech-niques such as light microscopy, MWC, or gravimetric analysis. For some instrumental techniques the effects of consolidating agents can be accounted for in the analy-sis, although the data interpretation may be more com-plex, and the conservation history of the object must be known.
Different wood species may begin with different chemi-cal compositions; in particular the differences between soft and hardwoods can be significant [16]. Therefore, most analytical approaches are more accurate and more easily interpreted if the wood species is known, allowing comparison to a modern example and gives a clearer pic-ture of what changes have occurred. If the species cannot be identified therefore, the use of expensive techniques which detect very subtle changes in molecular composi-tion may be of limited value.
ConclusionsThe value of undertaking a robust and thorough assess-ment of preservation in waterlogged archaeological wood should not be underestimated: this is critical in guiding successful site management and support-ing decision-making post excavation (e.g. with regards to storage or conservation). An understanding of the various assessment techniques available, their advan-tages and disadvantages, and the practical limitations, is important for designing an appropriate scheme of evaluation. Here, we have provided a critical over-view of some commonly used approaches, ranging from a visual assessment conducted in the field, to advanced molecular characterisation using analytical instrumentation.
Different types of analysis will be applicable in differ-ent scenarios; however, conducting the best possible assessment (taking into account other limitations such as cost, time and availability of expertise) will provide the best baseline against which future changes can be monitored. We conclude that no single technique can be considered the best option, and an assessment should take a multi-analytical approach. As emerging techniques and technologies are increasingly adopted by the heritage science sector, understanding how these can be applied in practice will result in an increasingly evidence-based approach to the protection of water-logged archaeological wood.
AbbreviationsMWC: Maximum water content; SEM: Scanning electron microscopy; TEM: Transmission electron microscopy; SEM-BSE: Scanning electron microscopy back scattered electron; SEM–EDX: Scanning electron microscopy energy dispersive X-ray; L:C ratio: Lignin:cellulose ratio; CHN(S): Carbon, hydrogen, nitrogen (sulfur); TG: Thermogravimetry; XRF: X-ray fluorescence; FTIR: Fourier transform infrared spectroscopy; ATR : Attenuated total reflectance; Py-GC: Pyrolysis gas chromatography; FID: Flame ionisation detection; MS: Mass spec-trometry; S:G ratio: Syringyl:guaiacyl ratio; PCA: Principal component analysis; NMR: Nuclear magnetic resonance; CPMAS: Cross-polarised magic angle spin-ning; XRD: X-ray diffraction; XANES: X-ray absorption near edge spectroscopy; EXAFS: Extended X-ray absorption fine structure; ICP-AES: Inductively coupled plasma atomic emission spectroscopy; ICP-OES: Inductively coupled plasma optical emission spectroscopy; EGA: Evolved gas analysis.
AcknowledgementsThanks to Jim Williams (Historic England), Gill Campbell (Historic England), Karla Graham (Historic England), Ian Panter (York Archaeological Trust) and Michael Bamforth (archaeological wood specialist) who provided feedback and intellectual input. Images were kindly provided by Richard Brunning (South West Heritage Trust; Fig. 2), Angela Middleton (Historic England; Fig. 3), Ian Panter (York Archaeological Trust; Fig. 5) and Michel Bardet (Fig. 11). Data for Fig. 6 was collected at the Centre for Ecology and Hydrology in Bangor with assistance from Inma Lebron, data for Fig. 9 was provided by Adam Pinder, and data for Fig. 12 was collected by Adrian Whitwood (University of York). We would also like to thank three anonymous reviewers for helpful and productive comments on the manuscript.
Page 30 of 33High and Penkman Herit Sci (2020) 8:83
Authors’ contributionsKEH conducted and wrote the review and KEHP contributed considerable intellectual input and feedback on the content of the review. Both authors read and approved the final manuscript.
FundingThe review was conducted as part of KH’s Knowledge Exchange Fellowship funded by the Natural Environment Research Council (Grant number NE/P005799/1).
Availability of data and materialsData sharing is not applicable to this manuscript as no datasets were gener-ated or analysed.
Competing interestsThe review is an abridged and edited version of a longer review published by Historic England (32); the authors declare they have no competing financial interests.
Received: 7 February 2020 Accepted: 20 July 2020
References 1. Gregory D, Jensen P. The importance of analysing waterlogged wooden
artefacts and environmental conditions when considering their in situ preservation. J Wetl Archaeol. 2006;6(1):65–81.
2. Huisman H, van Os B. Relax, don’t do it: a future for archaeological monitoring. Conserv Manag Archaeol Sites. 2016;18(1–3):372–86.
3. Brunning R, Hogan D, Jones J, Jones M, Maltby E, Robinson M, et al. Saving the sweet track: the in situ preservation of a neolithic wooden trackway, Somerset, UK. Conserv Manag Archaeol Sites. 2000;4(1):3–20.
4. Sidell J, Panter I. How to carefully construct a hospital over a Roman Boat in Central London, UK. Conserv Manag Archaeol Sites. 2016;18(1–3):266–75.
5. Huisman DJ, Mauro G. The never-ending story? The lessons of fifteen years of archaeological monitoring at the former island of schokland. Conserv Manag Archaeol Sites. 2012;14(1–4):406–28.
6. High K, Milner N, Panter I, Demarchi B, Penkman KEH. Lessons from Star Carr on the vulnerability of organic archaeological remains to environ-mental change. Proc Natl Acad Sci USA. 2016;113(46):12957–62.
7. Godfrey IN, Bergstrand T, Petersson H, Bohm C, Christensson E, Björdal CG, et al. The RAAR project—heritage management aspects on reburial after ten years of work. Conserv Manag Archaeol Sites. 2012;14(1–4):360–71.
8. Łucejko JJ, Mattonai M, Zborowska M, Tamburini D, Cofta G, Cantisani E, et al. Deterioration effects of wet environments and brown rot fungus Coniophora puteana on pine wood in the archaeological site of Biskupin (Poland). Microchem J. 2018;138:132–46.
9. Lucejko JJ, Tamburini D, Zborowska M, Babiński L, Modugno F, Colombini MP. Oak wood degradation processes induced by the burial environment in the archaeological site of Biskupin (Poland). Herit Sci. 2020;8(1):1–12. https ://doi.org/10.1186/s4049 4-020-00390 -3.
10. Braovac S, Tamburini D, Łucejko JJ, McQueen C, Kutzke H, Colombini MP. Chemical analyses of extremely degraded wood using analytical pyrolysis and inductively coupled plasma atomic emission spectros-copy. Microchem J. 2016;124:368–79.
11. Pinder AP, Panter I, Abbott GD, Keely BJ. Deterioration of the Hanson Logboat: chemical and imaging assessment with removal of polyeth-ylene glycol conserving agent. Sci Rep. 2017;7(1):1–12. https ://doi.org/10.1038/s4159 8-017-14057 -w.
12. Christensen BB. The conservation of waterlogged wood in the National Museum of Denmark. Copenhagen: National Museum of Denmark; 1970.
13. McQueen CMA, Tamburini D, Łucejko JJ, Braovac S, Gambineri F, Modugno F, et al. New insights into the degradation processes and influence of the conservation treatment in alum-treated wood from the Oseberg collection. Microchem J. 2017;132:119–29.
14. Fengel D. Aging and fossilization of wood and its components. Wood Sci Technol. 1991;25(3):153–77.
15. Pedersen NB, Bjordal CG, Jensen P, Felby C. Bacterial degradation of archaeological wood in anoxic waterlogged environments. In: Harding SE (ed) Stability of complex carbohydrate strucres: biofuels, foods, vac-cines and shipwrecks; 2013. p 160–87.
16. Nilsson T, Rowell R. Historical wood—structure and properties. J Cult Herit. 2012;13(3):S5–9. https ://doi.org/10.1016/j.culhe r.2012.03.016.
17. Hedges JI. The Chemistry of Archaeological Wood. In: Archaeological Wood. 1990; p. 111–40.
18. Björdal C, Nilsson T, Bardage S. Three-dimensional visualisation of bacterial decay in individual tracheids of Pinus sylvestris. Holzforschung. 2005;59(2):178–82.
19. Blanchette RA. A review of microbial deterioration found in archaeo-logical wood from different environments. Int Biodeterior Biodegrad. 2000;46(3):189–204.
20. Hoffmann P, Jones MA. Structure and degradation process for water-logged archaeological wood. In: Archaeological Wood. 1990. p. 35–65.
21. Martínez ÁT, Speranza M, Ruiz-Dueñas FJ, Ferreira P, Camarero S, Guillén F, et al. Biodegradation of lignocellulosics: microbial, chemical, and enzymatic aspects of the fungal attack of lignin. Int Microbiol. 2005;8(3):195–204.
22. Gelbrich J, Mai C, Militz H. Chemical changes in wood degraded by bacteria. Int Biodeterior Biodegrad. 2008;61(1):24–32.
23. Björdal CG. Microbial degradation of waterlogged archaeological wood. J Cult Herit. 2012;13(3 SUPPL.):S118–22. https ://doi.org/10.1016/j.culhe r.2012.02.003.
24. Panter I, Spriggs J. Condition assessment and conservation strategies for waterlogged wood assemblages. In: Hoffman P, Grant T, Spriggs J, Daley T, editors. Proceedings of the ICOM-CC Wet Organic Archaeologi-cal Materials conference, York. York; 1997. p. 185–201.
25. Almkvist G, Persson I. Distribution of iron and sulfur and their speciation in relation to degradation processes in wood from the Swedish warship Vasa. New J Chem. 2011;35(7):1491–502.
26. Wetherall KM, Moss RM, Jones AM, Smith AD, Skinner T, Pickup DM, et al. Sulfur and iron speciation in recently recovered timbers of the Mary Rose revealed via X-ray absorption spectroscopy. J Archaeol Sci. 2008;35(5):1317–28.
27. Rémazeilles C, Tran K, Guilminot E, Conforto E, Refait P. Study of Fe(II) sulphides in waterlogged archaeological wood. Stud Conserv. 2013;58(4):297–307.
28. MacLeod I, Richards V. Wood degradation on historic shipwreck sites: The use of FT-IR spectroscopy to study the loss of hemi-cellulose. In: Hoffmann P, Grant T, Spriggs J, Daley T, editors. Proceedings of the ICOM-CC Wet Organic Archaeological Materials conference, York. York; 1997. p. 203–28.
29. Fors Y, Grudd H, Rindby A, Jalilehvand F, Sandström M, Cato I, et al. Sul-fur and iron accumulation in three marine-archaeological shipwrecks in the Baltic Sea: the Ghost, the Crown and the Sword. Sci Rep. 2014;4:1–6.
30. Mortensen MN, Chaumat G, Gambineri F, Kutzke H, Łucejko JJ, McQueen CMA, et al. Climatically induced degradation processes in conserved archaeological wood studied by time-lapse photography. Stud Conserv. 2019;64(2):115–23. https ://doi.org/10.1080/00393 630.2018.14901 03.
31. Jagels R. A deterioration evaluation procedure for waterlogged wood. In: Grattan D., editor. Proceedings of the ICOM Waterlogged wood working group conference, Ottawa. Ottawa; 1981. p. 69–72.
32. High K, Penkman KE. Analytical methods for assessing preservation in waterlogged archaeological wood: their importance for site manage-ment decisions. Res Reports. 2020;42–2019.
33. High K, Penkman K, Milner N, Boreham S, Boreham J, Needham A, et al. Deterioration and Conservation. Star Carr. 2018;II(2):175–95.
34. Van de Noort R, Ellis S, Taylor M, Weir D. Preservation of archaeological sites. In: Van de Noort R, Ellis S, editors. Wetland heriatge of Holderness: an archaeological survey. 1995. p. 341–56.
35. Brittain M. Preservation and degradation of the wood. In: Pryor F, Bamforth M, editors. Flag Fen, Peterborough: Excavation and Research. Oxford: Oxbow; 2010. p. 5–12.
36. Milner N, Conneller C, Elliott B, Koon H, Panter I, Penkman K, et al. From riches to rags: organic deterioration at Star Carr. J Archaeol Sci. 2011;38(10):2818–32. https ://doi.org/10.1016/j.jas.2011.02.015.
Page 31 of 33High and Penkman Herit Sci (2020) 8:83
37. Milner N, Taylor B, Allen S, Bamforth M, Conneller C, Croft S, et al. Meth-ods, Aims and Objectives. In: Milner N, Conneller C, Taylor B, editors. Star Carr Volume 2: Studies in Technology, Subsistence and Environment. White Rose Press; 2018. p. 3–15.
38. Dawn S, Biswas P. Technologies and Methods for 3D Reconstruc-tion in Archaeology. In: International Symposium on Signal Pro-cessing and Intelligent Recognition Systems [Internet]. Singapore: Springer Singapore; 2019. p. 443–53. Available from: http://dx.doi.org/10.1007/978-981-13-5758-9_17.
39. Lobb M, Krawiec K, Howard AJ, Gearey BR, Chapman HP. A new approach to recording and monitoring wet-preserved archaeologi-cal wood using three-dimensional laser scanning. J Archaeol Sci. 2010;37(12):2995–9. https ://doi.org/10.1016/j.jas.2010.06.020.
40. Middleton A. Look closer: observation of changes in reburied archaeo-logical wood using laser scanning. In: Williams E, Hocker E, editors. Proceedings of the 13th ICOM-CC Group onf Wet Organic Archaeologi-cal Materials Conference. Florence; 2016. p. 421–9.
41. De Reu J, Plets G, Verhoeven G, De Smedt P, Bats M, Cherretté B, et al. Towards a three-dimensional cost-effective registration of the archaeological heritage. J Archaeol Sci. 2013;40(2):1108–21. https ://doi.org/10.1016/j.jas.2012.08.040.
42. Jensen P, Gregory DJ. Selected physical parameters to characterize the state of preservation of waterlogged archaeological wood: a practical guide for their determination. J Archaeol Sci. 2006;33(4):551–9.
43. Macchioni N, Pecoraro E, Pizzo B. The measurement of maximum water content (MWC) on waterlogged archaeological wood: a comparison between three different methodologies. J Cult Herit. 2018;30:51–6. https ://doi.org/10.1016/j.culhe r.2017.10.005.
44. Babiński L, Izdebska-Mucha D, Waliszewska B. Evaluation of the state of preservation of waterlogged archaeological wood based on its physical properties: basic density vs. wood substance density. J Archaeol Sci. 2014;46(1):372–83.
45. Macchioni N, Pizzo B, Capretti C, Giachi G. How an integrated diagnostic approach can help in a correct evaluation of the state of preserva-tion of waterlogged archaeological wooden artefacts. J Archaeol Sci. 2012;39(10):3255–63. https ://doi.org/10.1016/j.jas.2012.05.008.
46. Donato ID, Lazzara G. Porosity determination with helium pycnometry as a method to characterize waterlogged woods and the efficacy of the conservation treatments. Archaeometry. 2012;54(5):906–15.
47. Fengel D, Wegener G. Wood: Chemistry, ultrastructure, reactions. Berlin: Walter de Gruyter; 2011.
48. Florian M-LE. Scope and history of Archaeological Wood. In: Rowell R, Barbour RJ, editors. Archaeological Wood. Los Angeles: ASC; 1990. p. 3–32.
49. Gregory D, Jensen P, Matthiesen H, Strætkvern K. The correlation between bulk density and shock resistance of waterlogged archaeo-logical wood using the Pilodyn. Stud Conserv. 2007;52(4):289–98.
50. Southwell ACR, Bultman JD. Marine Borer Resistance of Untreated Woods Over Long Periods of Immersion in Tropical Waters Published by : The Association for Tropical Biology and Conservation Stable URL : http://www.jstor .org/stabl e/29897 09. 2008;3(1):81–107.
51. Knight KY, Cousins TA, Parham D. A comparison of biodegrada-tion caused by Teredinidae (Mollusca:Bivalvia), Limnoriidae (Crustacea:Isopoda), and C. terebans (Crustacea:Amphipoda) across 4 shipwreck sites in the English Channel. J Archaeol Sci Rep. 2019;23:854–67.
52. Karsten A, Earl G. The stirling castle wood recording project. A pilot study to compare traditional and innovative recording techniques for waterlogged wood. Res Rep English Herit. 2010;65:1–40.
53. Lechner T, Sandin Y, Kliger R. Assessment of density in timber using X-ray equipment. Int J Archit Herit. 2013;7(4):416–33.
54. Jones D. Waterlogged Wood: Guidelines on the Recording, Sampling, Conservation and Curation of Waterlogged Wood. English Herit. 2010.
55. Sodini N, Dreossi D, Chen R, Fioravanti M, Giordano A, Herrestal P, et al. Non-invasive microstructural analysis of bowed stringed instruments with synchrotron radiation X-ray microtomography. J Cult Herit. 2012;13(3 SUPPL.):44–9.
56. Mizuno S, Torizu R, Sugiyama J. Wood identification of a wooden mask using synchrotron X-ray microtomography. J Archaeol Sci. 2010;37(11):2842–5.
57. Tuniz C, Bernardini F, Cicuttin A, Crespo ML, Dreossi D, Gianoncelli A, et al. The ICTP-Elettra X-ray laboratory for cultural heritage and archae-ology. Nucl Instr Methods Phys Res Sect A. 2013;711:106–10. https ://doi.org/10.1016/j.nima.2013.01.046.
58. Fors Y, Jalilehvand F, Sandström M. Analytical aspects of waterlogged wood in historical shipwrecks. Anal Sci. 2011;27(8):785–92.
59. Bugani S, Modugno F, Łucejko JJ, Giachi G, Cagno S, Cloetens P, et al. Study on the impregnation of archaeological waterlogged wood with consolidation treatments using synchrotron radiation microtomogra-phy. Anal Bioanal Chem. 2009;395(7):1977–85.
60. Lehmann EH, Mannes D. Wood investigations by means of radiation transmission techniques. J Cult Herit. 2012;13(3 SUPPL.):S35–43. https ://doi.org/10.1016/j.culhe r.2012.03.017.
61. Broda M, Mazela B, Królikowska-Pataraja K, Hill CAS. The use of FT-IR and computed tomography non-destructive technique for waterlogged wood characterisation. Wood Res. 2015;60(5):707–22.
62. Arnott SHL, Dix JK, Best AI, Gregory DJ. Imaging of buried archaeologi-cal materials: the reflection properties of archaeological wood. Mar Geophys Res. 2005;26(2–4):135–44.
63. Zisi A, Dix JK. Simulating mass loss of decaying waterlogged wood: a technique for studying ultrasound propagation velocity in water-logged archaeological wood. J Cult Herit. 2018;33:39–47. https ://doi.org/10.1016/j.culhe r.2018.02.016.
64. Daniel G. Microscope techniques for understanding wood cell structure and biodegradation. Secondary xylem biology: origins, functions, and applications. Cambridge: Academic Press; 2016. p. 309–43.
65. Björdal CG, Nilsson T, Daniel G. Microbial decay of waterlogged archaeological wood found in Sweden. Applicable to archaeology and conservation. Int Biodeterior Biodegrad. 1999;43(1–2):63–73.
66. Tamburini D, Łucejko JJ, Pizzo B, Mohammed MY, Sloggett R, Colombini MP. A critical evaluation of the degradation state of dry archaeologi-cal wood from Egypt by SEM, ATR-FTIR, wet chemical analysis and Py(HMDS)-GC-MS. Polym Degrad Stab. 2017;146(July):140–54.
67. Capretti C, Macchioni N, Pizzo B, Galotta G, Giachi G, Giampaola D. The characterization of waterlogged archaeological wood: the three roman ships found in Naples (Italy). Archaeometry. 2008;50(5):855–76.
68. Schwarze FWMR. Wood decay under the microscope. Fungal Biol Rev. 2007;21(4):133–70.
69. Saka S, Goring DI. The distribution of lignin in white Birch wood as determined by bromination with TEM-EDXA. Holzforschung. 1988;42:149–53.
70. Crestini C, El Hadidi NMN, Palleschi G. Characterisation of archaeologi-cal wood: a case study on the deterioration of a coffin. Microchem J. 2009;92(2):150–4.
71. Powell KL, Pedley S, Daniel G, Corfield M. Ultrastructural observations of microbial succession and decay of wood buried at a Bronze Age archaeological site. Int Biodeterior Biodegrad. 2001;47(3):165–73.
72. Fromm J, Rockel B, Lautner S, Windeisen E, Wanner G. Lignin distribu-tion in wood cell walls determined by TEM and backscattered SEM techniques. J Struct Biol. 2003;143(1):77–84.
73. Xu F, Sun RC, Lu Q, Jones GL. Comparative study of anatomy and lignin distribution in normal and tension wood of Salix gordejecii. Wood Sci Technol. 2006;40(5):358–70.
74. Wallström L, Lindberg KAH. Measurement of cell wall penetration in wood of water-based chemicals using SEM/EDS and STEM/EDS tech-nique. Wood Sci Technol. 1999;33(2):111–22.
75. Hoffman P. Chemical wood analysis as a means of characterizing archaeological wood. In: Grattan D, McCawley C, editors. Proceedings of the icom waterlogged wood working group conference. Ottawa; 1981. p. 73–83.
76. Eriksen AM, Gregory D, Shashoua Y. Selective attack of waterlogged archaeological wood by the shipworm, Teredo navalis and its implica-tions for in situ preservation. J Archaeol Sci. 2015;55:9–15. https ://doi.org/10.1016/j.jas.2014.12.011.
77. Grattan DW, Mathias C. Analysis of waterlogged wood: the value of chemical analysis and other simple methods in evaluating condition. In: Somerset Levels papers 12. 12th ed. 1986. p. 6–12.
78. Łucejko JJ, Zborowska M, Modugno F, Colombini MP, Praogonekdzyński W. Analytical pyrolysis vs. classical wet chemical analysis to assess the decay of archaeological waterlogged wood. Anal Chim Acta. 2012;745:70–7.
Page 32 of 33High and Penkman Herit Sci (2020) 8:83
79. Zabel R, Morrell J. Wood microbiology: decay and it preventionn. San Diego: Academic Press; 1992.
80. Pizzo B, Giachi G, Fiorentino L. Evaluation of the applicability of con-ventional methods for the chemical characterization of waterlogged archaeological wood. Archaeometry. 2010;52(4):656–67.
81. Shen D, Li N, Fu Y, Macchioni N, Sozzi L, Tian X, et al. Study on wood preservation state of Chinese ancient shipwreck Huaguangjiao I. J Cult Herit. 2018;32(2):53–9. https ://doi.org/10.1016/j.culhe r.2018.01.009.
82. Giachi G, Bettazzi F, Chimichi S, Staccioli G. Chemical characterisation of degraded wood in ships discovered in a recent excavation of the Etruscan and Roman harbour of Pisa. J Cult Herit. 2003;4(2):75–83.
83. Wilson MA, Godfrey IM, Hanna JV, Quezada RA, Finnie KS. The deg-radation of wood in old Indian Ocean shipwrecks. Org Geochem. 1993;20(5):599–610.
84. Spiker EC, Hatcher PG. The effects of early diagenesis on the chemical and stable carbon isotopic composition of wood. Geochim Cosmochim Acta. 1987;51(6):1385–91.
85. Cavallaro G, Donato DI, Lazzara G, Milioto S. A comparative thermo-gravimetric study of waterlogged archaeological and sound woods. J Therm Anal Calorim. 2011;104(2):451–7.
86. Campanella L, Tomassetti M, Tomellini R. Thermoanalysis of ancient, fresh and waterlogged woods. J Therm Anal. 1991;37(8):1923–32.
87. Romagnoli M, Galotta G, Antonelli F, Sidoti G, Humar M, Kržišnik D, et al. Micro-morphological, physical and thermogravimetric analyses of waterlogged archaeological wood from the prehistoric village of Gran Carro (Lake Bolsena-Italy). J Cult Herit. 2018;33:30–8.
88. Donato DI, Lazzara G, Milioto S. Thermogravimetric analysis: a tool to evaluate the ability of mixtures in consolidating waterlogged archaeo-logical woods. J Therm Anal Calorim. 2010;101(3):1085–91.
89. Tomassetti M, Campanella L, Tomellini R, Meucci C. Thermogravimetric analysis of fresh and archeological waterlogged woods. Thermochim Acta. 1987;117:297–315.
90. Lucejko JJ, Modugno F, Ribechini E, Tamburini D, Colombini MP. Analyti-cal instrumental techniques to study archaeological wood degradation. Appl Spectrosc Rev. 2015;50(7):584–625.
91. Pandey KK, Pitman AJ. FTIR studies of the changes in wood chemistry following decay by brown-rot and white-rot fungi. Int Biodeterior Biodegrad. 2003;52(3):151–60.
92. Rodrigues J, Faix O, Pereira H. Determination of lignin content of Eucalyptus globulus wood using FTIR spectroscopy. Holzforschung. 1998;52:46–50.
93. Gelbrich J, Mai C, Militz H. Evaluation of bacterial wood degradation by Fourier Transform Infrared (FTIR) measurements. J Cult Herit. 2012;13(3 SUPPL):S135–8. https ://doi.org/10.1016/j.culhe r.2012.03.003.
94. Genestar C, Palou J. SEM-FTIR spectroscopic evaluation of deterioration in an historic coffered ceiling. Anal Bioanal Chem. 2006;384(4):987–93.
95. Pizzo B, Pecoraro E, Alves A, Macchioni N, Rodrigues JC. Quantita-tive evaluation by attenuated total reflectance infrared (ATR-FTIR) spectroscopy of the chemical composition of decayed wood preserved in waterlogged conditions. Talanta. 2015;131:14–20. https ://doi.org/10.1016/j.talan ta.2014.07.062.
96. Emandi A, Vasiliu CI, Budrugeac P, Stamatin I. Quantitative investiga-tion of wood composition by integrated FT-IR and thermogravimetric methods. Cellul Chem Technol. 2011;45(9–10):579–84.
97. Oron A, Liphschitz N, Held BW, Galili E, Klein M, Linker R, et al. Charac-terization of archaeological waterlogged wooden objects exposed on the hyper-saline Dead Sea shore. J Archaeol Sci Reports. 2016;9:73–86. https ://doi.org/10.1016/j.jasre p.2016.06.049.
98. Esteves B, Marques AV, Domingos I, Pereira H. Chemical changes of heat treated pine and eucalypt wood monitored by ftir. Maderas Cienc y Tecnol. 2013;15(2):245–58.
99. Popescu CM, Dobele G, Rossinskaja G, Dizhbite T, Vasile C. Degradation of lime wood painting supports. Evaluation of changes in the structure of aged lime wood by different physico-chemical methods. J Anal Appl Pyrolysis. 2007;79(1–2):71–7.
100. Durmaz S, Özgenç O, Boyaci IH, YIldIz ÜC, Erişir E. Examination of the chemical changes in spruce wood degraded by brown-rot fungi using FT-IR and FT-Raman spectroscopy. Vib Spectrosc. 2016;85:202–7.
101. Faix O, Bremer J, Schmidt O, Tatjana SJ. Monitoring of chemical changes in white-rot degraded beech wood by pyrolysis-gas chromatography
and Fourier-transform infrared spectroscopy. J Anal Appl Pyrolysis. 1991;21(1–2):147–62.
102. Filley TR, Cody GD, Goodell B, Jellison J, Noser C, Ostrofsky A. Lignin demethylation and polysaccharide decomposition in spruce sapwood degraded by brown rot fungi. Org Geochem. 2002;33(2):111–24.
103. High K, Penkman K, Milner N, Panter I, Knight B. Chemical assessment of post-excavation changes observed in bone and antler from Star Carr, UK. In: Williams E, Hocker E, editors. Proceedings of the 12th ICOM-WOAM conference. Florence; 2018. p. 62–71.
104. Traoré M, Kaal J, Martínez Cortizas A. Application of FTIR spectroscopy to the characterization of archeological wood. Spectrochim Acta Part A Mol Biomol Spectrosc. 2016;153:63–70. https ://doi.org/10.1016/j.saa.2015.07.108.
105. Ferraz A, Baeza J, Rodriguez J, Freer J. Estimating the chemical composi-tion of biodegraded pine and eucalyptus wood by DRIFT spectroscopy and multivariate analysis. Bioresour Technol. 2000;74:201–12.
106. Hatcher PG, Nanny MA, Minard RD, Dible SD, Carson DM. Comparison of two thermochemolytic methods for the analysis of lignin in decompos-ing gymnosperm wood: the CuO oxidation method and the method of thermochemolysis with tetramethylammonium hydroxide (TMAH). Org Geochem. 1995;23(10):881–8.
107. Van Bergen PF, Poole I, Ogilvie TMA, Caple C, Evershed RP. Evidence for demethylation of syringyl moieties in archaeological wood using pyrolysis-gas chromatography/mass spectrometry. Rapid Commun Mass Spectrom. 2000;14(2):71–9.
108. Vinciguerra V, Napoli A, Bistoni A, Petrucci G, Sgherzi R. Wood decay characterization of a naturally infected London plane-tree in urban environment using Py-GC/MS. J Anal Appl Pyrolysis. 2007;78(1):228–31.
109. Traoré M, Kaal J, Martínez Cortizas A. Potential of pyrolysis-GC–MS molecular fingerprint as a proxy of Modern Age Iberian shipwreck wood preservation. J Anal Appl Pyrolysis. 2017;126:1–13. https ://doi.org/10.1016/j.jaap.2017.07.003.
110. Tamburini D, Lucejko JJ, Modugno F, Colombini MP. Characterisation of archaeological waterlogged wood from Herculaneum by pyrolysis and mass spectrometry. Int Biodeterior Biodegrad. 2014;86:142–9.
111. Colombini MP, Orlandi M, Modugno F, Tolppa EL, Sardelli M, Zoia L, et al. Archaeological wood characterisation by PY/GC/MS, GC/MS. NMR and GPC techniques. Microchem J. 2007;85(1 SPEC. ISS):164–73.
112. Tamburini D, Łucejko JJ, Modugno F, Colombini MP. Combined pyroly-sis-based techniques to evaluate the state of preservation of archaeo-logical wood in the presence of consolidating agents. J Anal Appl Pyrolysis. 2016;122:429–41. https ://doi.org/10.1016/j.jaap.2016.10.026.
113. Challinor JM. Review: the development and applications of thermally assisted hydrolysis and methylation reactions. J Anal Appl Pyrolysis. 2001;61(1–2):3–34.
114. Colombini MP, Lucejko JJ, Modugno F, Orlandi M, Tolppa EL, Zoia L. A multi-analytical study of degradation of lignin in archaeological water-logged wood. Talanta. 2009;80(1):61–70.
115. Zoia L, Tamburini D, Orlandi M, Łucejko JJ, Salanti A, Tolppa EL, et al. Chemical characterisation of the whole plant cell wall of archaeological wood: an integrated approach. Anal Bioanal Chem. 2017;409(17):4233–45.
116. Bardet M, Gerbaud G, Giffard M, Doan C, Hediger S, Le Pape L. 13C high-resolution solid-state NMR for structural elucidation of archaeological woods. Prog Nucl Magn Reson Spectrosc. 2009;55(3):199–214. https ://doi.org/10.1016/j.pnmrs .2009.02.001.
117. Bardet M, Foray MF, Trân QK. High-resolution solid-state CPMAS NMR study of archaeological woods. Anal Chem. 2002;74(17):4386–90.
118. Alesiani M, Proietti F, Capuani S, Paci M, Fioravanti M, Maraviglia B. 13C CPMAS NMR spectroscopic analysis applied to wood characterization. Appl Magn Reson. 2005;29(2):177–84.
119. Zoia L, Salanti A, Orlandi M. Chemical characterization of archaeologi-cal wood: softwood Vasa and hardwood Riksapplet case studies. J Cult Herit. 2015;16(4):428–37. https ://doi.org/10.1016/j.culhe r.2014.09.015.
120. Sette M, Wechselberger R, Crestini C. Elucidation of lignin structure by quantitative 2D NMR. Chem A Eur J. 2011;17(34):9529–35.
121. Blumich B, Casanova F, Perlo J, Presciutti F, Anselmi C, Doherty B. Non-invasive testing of art and cultural heritage by mobile NMR. Acc Chem Res. 2010;43(6):761–70.
122. Fors Y, Jalilehvand F, Damian Risberg E, Björdal C, Phillips E, Sand-ström M. Sulfur and iron analyses of marine archaeological wood in
Page 33 of 33High and Penkman Herit Sci (2020) 8:83
shipwrecks from the Baltic Sea and Scandinavian waters. J Archaeol Sci. 2012;39(7):2521–32. https ://doi.org/10.1016/j.jas.2012.03.006.
123. Howell C, Steenkjær Hastrup AC, Goodell B, Jellison J. Temporal changes in wood crystalline cellulose during degradation by brown rot fungi. Int Biodeterior Biodegrad. 2009;63(4):414–9.
124. Park S, Baker JO, Himmel ME, Parilla PA, Johnson DK. Cellulose crystal-linity index: measurement techniques and their impact on interpreting cellulase performance. Biotechnol Biofuels. 2010;3:10.
125. Popescu CM, Larsson PT, Vasile C. Carbon-13 CP/MAS solid state NMR and X-ray diffraction spectroscopy studies on lime wood decayed by Chaetomium globosum. Carbohydr Polym. 2011;83(2):808–12. https ://doi.org/10.1016/j.carbp ol.2010.08.049.
126. Li MY, Fang BS, Zhao Y, Tong T, Hou XH, Tong H. Investigation into the deterioration process of archaeological bamboo strips of China from four different periods by chemical and anatomical analysis. Polym Degrad Stab. 2014;109:71–8. https ://doi.org/10.1016/j.polym degra dstab .2014.06.022.
127. Segal L, Creely JJ, Martin AE, Conrad CM. An empirical method for estimating the degree of crystallinity of native cellulose using the X-ray diffractometer. Text Res J. 1959;29(10):786–94.
128. Sandström M, Jalilehvand F, Persson I, Gelius U, Frank P, Hall-Roth I. Deterioration of the seventeenth-century warship Vasa by internal formation of sulphuric acid. Nature. 2002;415(6874):893–7.
129. Agarwal UP. An overview of Raman spectroscopy as applied to lignocellulosic materials. Adv Lignocellul Charact. 1999;201–225. http://128.104.77.228/docum nts/pdf19 99/agarw 99a.pdf.
130. Christensen M, Frisch M, Jensen P, Schnell U, Shashoua Y, Nielsen O. Waterlogged archaeological wood—chemical changes by conserva-tion and degradation. J Raman Spectrosc [Internet]. 2006;37:1171–8. Available from: http://dx.doi.org/10.1002/jrs.1902%5Cnht tp://onlin elibr ary.wiley .com/store /10.1002/jrs.1902/asset /1902_ftp.pdf?v=1&t=h2ddh r1g&s=77a1c 3920a 3ac3b 4f0c5 8c336 4221f 79efd 0cf32 %5CnC:/Vasil i/Labor atory /Artic les/study plasm a.Data/PDF//Kiefe r-2007-Recen t Advances in.
131. Petrou M, Edwards HGM, Janaway RC, Thompson GB, Wilson AS. Fourier-transform Raman spectroscopic study of a Neolithic water-logged wood assemblage. Anal Bioanal Chem. 2009;395(7):2131–8.
132. Agarwal UP. Raman imaging to investigate ultrastructure and composi-tion of plant cell walls: distribution of lignin and cellulose in black spruce wood (Picea mariana). Planta. 2006;224(5):1141–53.
133. Agarwal UP, Ralph SA, Reiner RS, Baez C. New cellulose crystallinity esti-mation method that differentiates between organized and crystalline phases. Carbohydr Polym. 2018;190:262–70. https ://doi.org/10.1016/j.carbp ol.2018.03.003.
134. Rémazeilles C, Saheb M, Neff D, Guilminot E, Tran K, Bourdoiseau JA, et al. Microbiologically influenced corrosion of archaeological artefacts: characterisation of iron(II) sulfides by Raman spectroscopy. J Raman Spectrosc. 2010;41(11):1425–33.
135. Marengo E, Robotti E, Liparota MC, Gennaro MC. A method for monitor-ing the surface conservation of wooden objects by Raman spectros-copy and multivariate control charts. Anal Chem. 2003;75(20):5567–74.
136. Xia Y, Chen TY, Wen JL, Zhao Y, Qiu J, Sun RC. Multi-analysis of chemical transformations of lignin macromolecules from waterlogged archaeological wood. Int J Biol Macromol. 2018;109:407–16. https ://doi.org/10.1016/j.ijbio mac.2017.12.114.
137. Risoluti R, Materazzi S. Mass spectrometry for evolved gas analy-sis: an update. Appl Spectrosc Rev. 2019;54(2):87–116. https ://doi.org/10.1080/05704 928.2018.14522 52.
138. Tamburini D, Łucejko JJ, Ribechini E, Colombini MP. Snapshots of lignin oxidation and depolymerization in archaeological wood: an EGA-MS study. J Mass Spectrom. 2015;50(10):1103–13.
139. Degano I, Modugno F, Bonaduce I, Ribechini E, Colombini MP. Recent advances in analytical pyrolysis to investigate organic materials in herit-age science. Angew Chemie Int Ed. 2018;57(25):7313–23.
140. Tamburini D, Łucejko JJ, Zborowska M, Modugno F, Prądzyński W, Colombini MP. Archaeological wood degradation at the site of Biskupin (Poland): wet chemical analysis and evaluation of specific Py-GC/MS profiles. J Anal Appl Pyrolysis. 2015;115:7–15.
141. Gregory D, Jensen P, Strætkvern K. Conservation and in situ pres-ervation of wooden shipwrecks from marine environments. J Cult Herit. 2012;13(3 SUPPL.):S139–48. https ://doi.org/10.1016/j.culhe r.2012.03.005.
142. McConnachie G, Eaton R, Jones M. A re-evaluation of the use of maximum moisture content data for assessing the condition of waterlogged archaeological wood. E-preservation Sci. 2008;5:29–35. http://www.moran a-rtd.com/e-prese rvati onsci ence/2008/McCon nachi e-09-04-2008.pdf.
143. Macchioni N, Capretti C, Sozzi L, Pizzo B. Grading the decay of water-logged archaeological wood according toanatomical characterisa-tion. The case of the Fiavé site (N-E Italy). Int Biodeterior Biodegrad. 2013;84:54–64. https ://doi.org/10.1016/j.ibiod .2013.05.028.
Publisher’s NoteSpringer Nature remains neutral with regard to jurisdictional claims in pub-lished maps and institutional affiliations.