
A respiratory monitoring device based on clavicular motion
12
A respiratory monitoring device based on clavicular motion This article has been downloaded from IOPscience. Please scroll down to see the full text article. 2013 Physiol. Meas. 34 N51 (http://iopscience.iop.org/0967-3334/34/8/N51) Download details: IP Address: 138.250.89.26 The article was downloaded on 19/07/2013 at 15:09 Please note that terms and conditions apply. View the table of contents for this issue, or go to the journal homepage for more Home Search Collections Journals About Contact us My IOPscience
Transcript of A respiratory monitoring device based on clavicular motion

A respiratory monitoring device based on clavicular motion
This article has been downloaded from IOPscience. Please scroll down to see the full text article.
2013 Physiol. Meas. 34 N51
(http://iopscience.iop.org/0967-3334/34/8/N51)
Download details:
IP Address: 138.250.89.26
The article was downloaded on 19/07/2013 at 15:09
Please note that terms and conditions apply.
View the table of contents for this issue, or go to the journal homepage for more
Home Search Collections Journals About Contact us My IOPscience

IOP PUBLISHING PHYSIOLOGICAL MEASUREMENT
Physiol. Meas. 34 (2013) N51–N61 doi:10.1088/0967-3334/34/8/N51
NOTE
A respiratory monitoring device based on clavicularmotion
D G Pitts1,5, M K Patel2, P-O Lang3, A J Sinclair4 and R Aspinall1
1 Telemedicine Unit, Translational Medicine Group, Cranfield Health, Cranfield University,Cranfield, Bedford MK43 0AL, UK2 Institute of Environmental Health, Food Security and Environmental Health, Cranfield Health,Cranfield University, Cranfield, Bedford MK43 0AL, UK3 Nescens, Clinique de Grenolier, Centre de Medecin Preventative, Rte du Muids 3—CP 100,CH-1272 Genolier, Switzerland4 Bedfordshire and Hertfordshire Postgraduate Medical School, University of Bedfordshire,Putteridge Bury campus, Hitchin Road, Luton, Bedfordshire LU2 8LE, UK
E-mail: [email protected]
Received 25 March 2013, accepted for publication 24 June 2013Published 17 July 2013Online at stacks.iop.org/PM/34/N51
AbstractRespiratory rate is one of the key vital signs yet unlike temperature, heart rate orblood pressure, there is no simple and low cost measurement device for medicaluse. Here we discuss the development of a respiratory sensor based uponclavicular motion and the findings of a pilot study comparing respiratory ratereadings derived from clavicular and thoracic motion with an expiratory breathflow reference sensor. Simultaneously sampled data from resting volunteers(n = 8) was analysed to determine the location of individual breaths inthe data set and from these, breath periods and frequency were calculated.Clavicular sensor waveforms were found to be more consistent and of greateramplitude than those from the thoracic device, demonstrating good alignmentwith the reference waveform. On comparing breath by breath periods a closeagreement was observed with the reference, with mean clavicular respiratoryrate R2 values of 0.89 (lateral) and 0.98 (longitudinal-axis). This pilot studydemonstrates the viability of clavicular respiratory sensing. The sensor isunobtrusive, unaffected by bioelectrical or electrode problems and easier todetermine and more consistent than thoracic motion sensing. With relativelybasic signal conditioning and processing requirements, it could provide an idealplatform for a low-cost respiratory monitor.
Keywords: telemedicine, respiratory rate, dyspnoea, electronic data processing,diagnostic equipment
5 Author to whom any correspondence should be addressed.
0967-3334/13/080051+11$33.00 © 2013 Institute of Physics and Engineering in Medicine Printed in the UK & the USA N51

N52 Note
1. Introduction
Respiration rate (RR) is considered one of the key vital signs. Whilst monitored in hospitalsettings, it is typically checked less frequently than other traditional measures which may inpart be due to a dearth of reliable automatic RR monitoring equipment (McBride et al 2005).
The normal range for resting RR in healthy adults is considered to be between 12 to20 breaths per minute (bpm) whilst respiratory febrile infection tends to show an increase tomore than 20 bpm (Marco et al 1995). Rates in excess of 25 bpm may be indicative of lowerrespiratory tract infections (Mcfadden et al 1982); here, the certainty of diagnosis is greaterif blood oxygen saturation falls below 90% (High et al 2009). Rapid breathing may also besymptomatic of a range of cardiac or respiratory conditions (Janssens and Krause 2004, Rayet al 2006, Browning et al 1990, Tobin et al 1983) and a predictor of cardiopulmonary arrest(when RR > 27) (Fieselmann et al 1993). The level of respiratory effort is also of clinicalinterest. A deterioration in breath depth, gradually becoming shallower over time, couldpotentially be of value; greater respiratory effort may also present with a more pronouncedthoracic motion (Longmore et al 2009).
There are possibly more sensors and methods for RR monitoring than all the other vitalsigns combined. These range from those that rely on direct breath sampling (e.g. capnographspneumotachometers, flow sensors and thermistors mounted in a nasal cannula) to indirectmethods that monitor physiological respiratory response. Of these, many employ a thoracicband (together with an abdominal band in some cases) to measure respiratory activity. Oneof the more common band-based sensing methods is respiratory inductance plethysmography,in which changes in thoracic cross-sectional area produce fluctuations in a magnetic fieldcausing measurable frequency variations in the excitation signal. Other systems use a rangeof sensing techniques such as a pneumatic band and pressure sensor (Vernier InternationalInc., Sarasota, FL, USA), piezoelectric sensors plus thoracic accelerometers (Khoo et al 2008)and ultrasound transducers (Lanata et al 2006). Sensors have been incorporated into wearablegarments to simplify mounting. One such example uses both electrocardiogram (ECG)-derivedresponse and piezo plethysmograph sensors on the thorax and abdomen to measure respirationin a ‘bioshirt’ (Nam et al 2005). This is, arguably, an improvement over a chest-band forrespiration sensing if additional physiological parameters are to be monitored.
Compact acoustic devices have also been reported to compare favourably with a standardcapnograph (Macknet et al 2007). Corbishley’s miniaturized acoustic sensor uses similartechnology to measure RR by monitoring tracheal sounds (Corbishley and Rodrıguez-Villegas2008). Impedance plethysmography, where respiration-induced changes in thoracic impedanceare measured using ECG electrodes, and ECG-signal derived sensing have also found use. Inthe latter, the respiratory response is extracted from an ECG signal based upon respiratorysinus arrhythmia (RSA) (Yasuma and Hayano 2004), where RR is determined from naturalrespiratory-induced heart rate variability, or ECG derived respiration (EDR), which is basedupon respiration-induced R-wave amplitude variation (Cysarz et al 2008).
Finally, a number of studies have investigated the use of single or multi-axisaccelerometers, mostly mounted on the chest, to determine thoracic motion (Reinvuo et al2006, Phan et al 2008, Bates et al 2010). Whilst successful, the waveforms appear insuperposition and must be separated both from each other and from extraneous noise (Phanet al 2008). Use of a triaxial accelerometer (three orthogonal axes) would appear to offeradvantages over uniaxial or biaxial sensing as all three dimensions may be considered (sixdegrees of freedom); hence a viable respiratory signal is not dependent upon the orientation ofthe sensor and angular motion or composite waveforms may be considered (Bates et al 2010).Here we report on a pilot study on RR measurement using an accelerometer upon the clavicle.

Note N53
Figure 1. Diagram showing the sensor locations and orientation of the sensor axes on the body.
2. Materials and methods
2.1. Study participants and assay description
After ethical approval and full consent had been obtained, eight healthy volunteers aged 24to 55 years old (i.e. non-smokers, free from any respiratory condition or infection and takingno medication) were recruited for a pilot study. Five were male (volunteers 01, 02, 04, 07and 12) and three female (volunteers 06, 08 and 11). Each was asked to attach two motionsensing accelerometers with non-allergenic surgical tape—one to the left clavicle, the other,to provide a reference (Phan et al 2008), over the sternum along the sagittal plane along theline of the fifth rib—approximately centre chest as depicted by figure 1. Both sensors werepositioned with the same basic orientation, giving a nominal resting output of x (lateral) =0g, y (vertical) = −1 g and z (longitudinal) = +1 g on the sensors’ axes with respectto gravity with a standing volunteer (figure 1). Volunteers were then fitted with a breathmonitoring mask and allowed to relax and acclimatize for a few minutes before initiating eachexperiment.
Tests commenced with the volunteers standing and breathing normally. After 2 min ofnormal breathing, volunteers were asked to vary their breathing patterns, taking random short,long, shallow and deep breaths for a further 90 s, following which, they were asked to providea full and deep outbreath and resume normal breathing for the last 30 s of the experiment.This provided a 4 min recording of a range of breathing patterns allowing direct comparisonbetween the sensors. Data was downloaded immediately after each test in an ASCII text CSVfile format.
2.2. Respiratory sensors
A small sensor circuit board (18 × 15 × 3 mm3) was designed around the ADXL330accelerometer (Analog Devices Inc. 2007), a triaxial device which benefits from nano-scale

N54 Note
MEMS (micro electro mechanical system) technology to produce a small 4 mm × 4 mmmonolithic package. A feedback capacitor value of 220 nF was chosen to limit the 3dB signalbandwidth to approximately 10 Hz on each axis. A number of boards were assembled; eachattached to a 2.5 m four-core screened connecting cable and wrapped in non-allergenic surgicaltape to provide insulation and protection. For data validation, a mask-mounted AWM720 massflow sensor (Honeywell Sensing and Control, Golden Valley, MN, USA) was used to measureexhalatory breath flow. A basic interface board providing power distribution for the sensors(+3.3 V for accelerometers and +10 V for the mass flow sensor), and connectivity to a datalogger was designed and assembled. No additional signal conditioning or amplification wasapplied. Data acquisition was provided by a Cranfield CardCorder system (formerly producedby Cranfield Impact Centre Ltd, Cranfield, Bedford, UK); 12-bit data was acquired using0–5 V (accelerometers) and 0–10 V input ranges (AWM720) at 100 samples per second, wellabove the Nyquist rate, on each signal channel.
2.3. Calibration
A two-point calibration was applied to the accelerometers by rotating each axis in turn withrespect to gravity upon a true horizontal surface with the aid of an engineer’s square. Thisprovided voltage readings corresponding to positive and negative gravity ( ± 1 g) which wereentered and stored in the logger’s setup software for each respective input. The AWM720 massflow sensor data was recorded as a pure voltage for translation into standardized litres perminute (SLPM) in post-processing. Because of the nonlinear relationship, a calibration curvewas produced and the equation below derived from the table provided on the manufacturer’sdatasheet (Honeywell International Inc. 2008).
Breath SLPM = e(Breath mV−887)/777
2.4. Data analysis
Matlab (Mathworks Ltd, Natick, MA, USA) software was used for data processing,analysis and visualization. A series of scripts were written to automate data importation,signal processing, peak-based breath detection and respiratory rate calculations. With theaccelerometer data, the dc signal offset due to static gravimetric forces was first removed byapplying a dc blocking filter. A 0.5 Hz five-pole low-pass Butterworth filter was then appliedto remove signal noise. Signal processing of the reference data was limited to unit conversion(to SLPM) and the removal of signal noise with a 2.5 Hz five-pole low-pass Butterworth filter.Peak and edge-detection routines were performed using Matlab’s data analysis functions. Theresults of the descriptive analysis of respiratory rates are presented in the form of means ±standard deviation (SD) and median.
Additionally, to assess the agreement between the two techniques used to measure themedian respiratory rates (clavicular motion in the X- and Z-axis and thoracic Z-axis motion withthe exhalatory breath flow reference), Bland–Altman plots (difference plot) were computed.The Bland–Altman plot is a method of data plotting used in analysing agreement betweentwo different techniques of measurement, neither being considered as a gold standard, bycalculating the mean difference between the two methods of measurement (the bias) and95% limits of agreement as the mean difference (1.96 SD) (Altman and Bland 1983). Itis expected that the 95% limits include 95% of differences between the two techniques ofmeasurement.
Note N55
(a) (b)
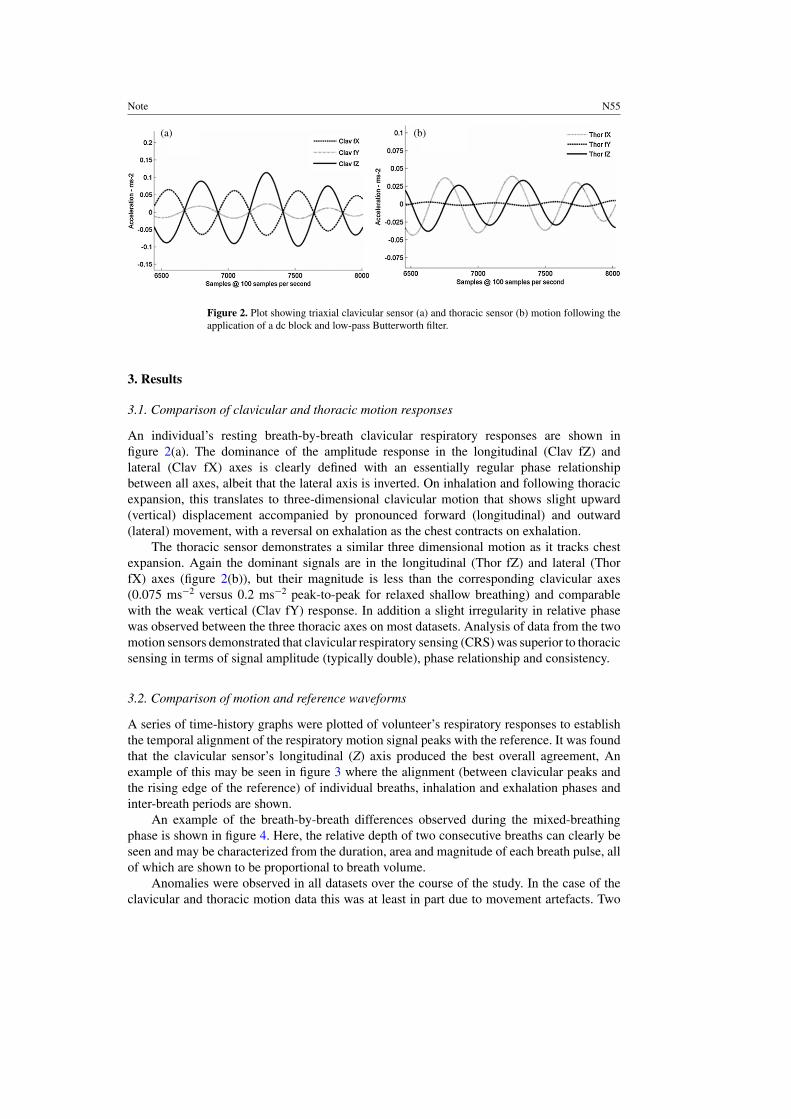
Figure 2. Plot showing triaxial clavicular sensor (a) and thoracic sensor (b) motion following theapplication of a dc block and low-pass Butterworth filter.
3. Results
3.1. Comparison of clavicular and thoracic motion responses
An individual’s resting breath-by-breath clavicular respiratory responses are shown infigure 2(a). The dominance of the amplitude response in the longitudinal (Clav fZ) andlateral (Clav fX) axes is clearly defined with an essentially regular phase relationshipbetween all axes, albeit that the lateral axis is inverted. On inhalation and following thoracicexpansion, this translates to three-dimensional clavicular motion that shows slight upward(vertical) displacement accompanied by pronounced forward (longitudinal) and outward(lateral) movement, with a reversal on exhalation as the chest contracts on exhalation.
The thoracic sensor demonstrates a similar three dimensional motion as it tracks chestexpansion. Again the dominant signals are in the longitudinal (Thor fZ) and lateral (ThorfX) axes (figure 2(b)), but their magnitude is less than the corresponding clavicular axes(0.075 ms−2 versus 0.2 ms−2 peak-to-peak for relaxed shallow breathing) and comparablewith the weak vertical (Clav fY) response. In addition a slight irregularity in relative phasewas observed between the three thoracic axes on most datasets. Analysis of data from the twomotion sensors demonstrated that clavicular respiratory sensing (CRS) was superior to thoracicsensing in terms of signal amplitude (typically double), phase relationship and consistency.
3.2. Comparison of motion and reference waveforms
A series of time-history graphs were plotted of volunteer’s respiratory responses to establishthe temporal alignment of the respiratory motion signal peaks with the reference. It was foundthat the clavicular sensor’s longitudinal (Z) axis produced the best overall agreement, Anexample of this may be seen in figure 3 where the alignment (between clavicular peaks andthe rising edge of the reference) of individual breaths, inhalation and exhalation phases andinter-breath periods are shown.
An example of the breath-by-breath differences observed during the mixed-breathingphase is shown in figure 4. Here, the relative depth of two consecutive breaths can clearly beseen and may be characterized from the duration, area and magnitude of each breath pulse, allof which are shown to be proportional to breath volume.
Anomalies were observed in all datasets over the course of the study. In the case of theclavicular and thoracic motion data this was at least in part due to movement artefacts. Two

N56 Note
Figure 3. A comparison of respiratory periods measured by clavicular motion and exhalatorybreath flow.
Figure 4. A comparison of respiratory depth measured via clavicular motion and exhalatory breathflow.
volunteers experienced problems with CRS and three with thoracic sensor adhesion, causinginadequate coupling which was reflected in the data. This may be easily addressed by the useof alcohol wipes and a more robust adhesive or tape. Thoracic sensor performance would havealso benefitted from the removal of body hair to improve sensor bonding. Glitches observedin the reference signal in one dataset (06) were found to be coincident with notes of thevolunteer briefly talking during the course of the experiment; where clearly confirmed, thesewere removed from the analysis. Missing peaks after the full outbreath from a volunteer (06)were almost certainly due to an imperfect face-seal; the mask being slightly too large for theindividual concerned.
Note N57
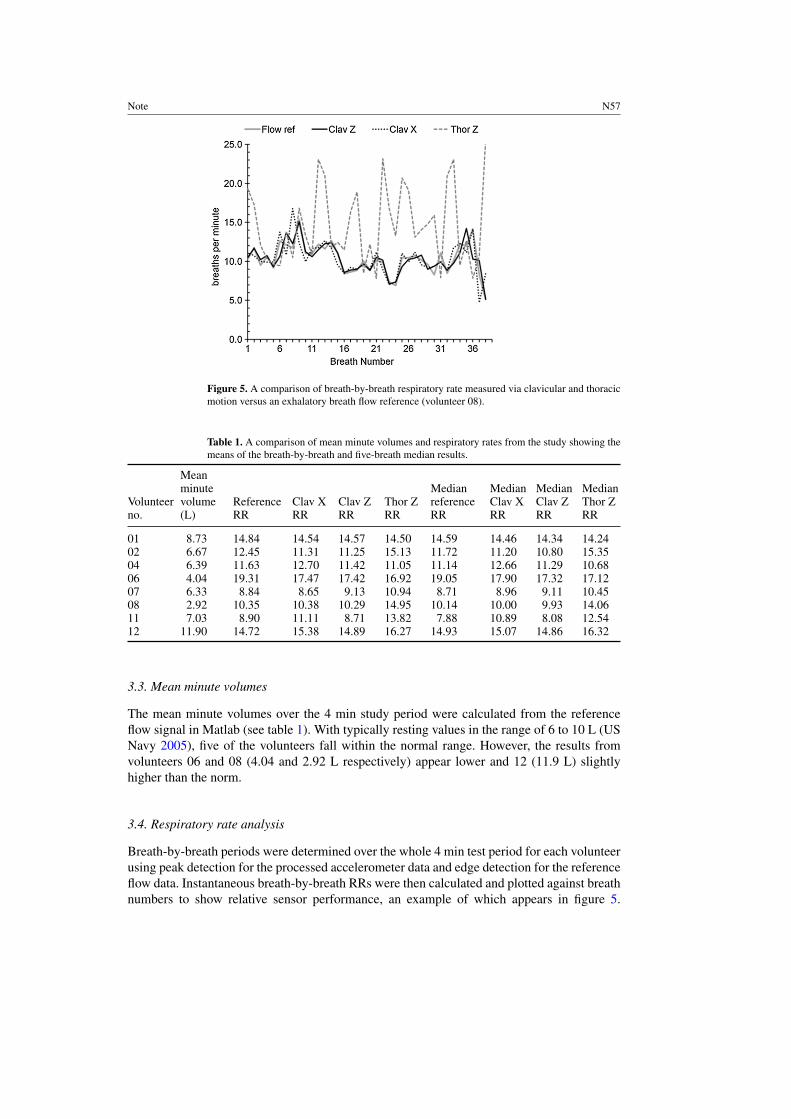
Figure 5. A comparison of breath-by-breath respiratory rate measured via clavicular and thoracicmotion versus an exhalatory breath flow reference (volunteer 08).
Table 1. A comparison of mean minute volumes and respiratory rates from the study showing themeans of the breath-by-breath and five-breath median results.
Volunteerno.
Meanminutevolume(L)
ReferenceRR
Clav XRR
Clav ZRR
Thor ZRR
MedianreferenceRR
MedianClav XRR
MedianClav ZRR
MedianThor ZRR
01 8.73 14.84 14.54 14.57 14.50 14.59 14.46 14.34 14.2402 6.67 12.45 11.31 11.25 15.13 11.72 11.20 10.80 15.3504 6.39 11.63 12.70 11.42 11.05 11.14 12.66 11.29 10.6806 4.04 19.31 17.47 17.42 16.92 19.05 17.90 17.32 17.1207 6.33 8.84 8.65 9.13 10.94 8.71 8.96 9.11 10.4508 2.92 10.35 10.38 10.29 14.95 10.14 10.00 9.93 14.0611 7.03 8.90 11.11 8.71 13.82 7.88 10.89 8.08 12.5412 11.90 14.72 15.38 14.89 16.27 14.93 15.07 14.86 16.32
3.3. Mean minute volumes
The mean minute volumes over the 4 min study period were calculated from the referenceflow signal in Matlab (see table 1). With typically resting values in the range of 6 to 10 L (USNavy 2005), five of the volunteers fall within the normal range. However, the results fromvolunteers 06 and 08 (4.04 and 2.92 L respectively) appear lower and 12 (11.9 L) slightlyhigher than the norm.
3.4. Respiratory rate analysis
Breath-by-breath periods were determined over the whole 4 min test period for each volunteerusing peak detection for the processed accelerometer data and edge detection for the referenceflow data. Instantaneous breath-by-breath RRs were then calculated and plotted against breathnumbers to show relative sensor performance, an example of which appears in figure 5.

N58 Note
(a) (b) (c)
(d) (e) (f)
Figure 6. The correlation of the means of the median respiratory rates from the eight volunteersmeasured via clavicular motion in the X-axis (a) and Z-axis (b) and thoracic Z-axis motion (c) withthe exhalatory breath flow reference (from table 1) and Bland–Altman plots of clavicular motionin the X-axis (d) and Z-axis (e) and thoracic Z-axis motion (f) respectively against the reference.
Negligible difference was observed between the resting and mixed breathing RRs for any ofthe volunteers, with the CRS z-axis found to track the reference the most effectively.
The mean RRs over the 4 min test period for each volunteer were calculated (see table 1)together with the coefficients of determination relative to the reference. The correlation betweenbreath flow and CRS RRs (X-axis R2 = 0.89, Z-axis R2 = 0.97, both p < 0.01) was found to besuperior when compared with thoracic RRs (Z-axis R2 = 0.49, p = 0.05). The mean differencebetween the reference RRs of all volunteers and the CRS Z-axis was 0.42 ± 0.74 bpm.
Displaying instantaneous RRs could be considered impractical for real-world use due to‘jitter’ from normal inter-breath variation, thus additional processing was applied to moderatebreath frequency. Here the median value of a sample window of five ordered consecutivebreaths was used; this method was chosen as intermittent high or low readings have a reducedinfluence on results, but rate changes that occur over a number of readings (>3) are preserved.The means of the median RRs for each test appear on the right of table 1. The regression plots infigures 6(a)–(c) show the relationship between the median motion-based RRs and the reference,which provide a slight improvement in correlation when compared to the instantaneous means(median R2 values CRS X-axis = 0.89 and Z-axis 0.98, both p<001, thoracic Z-axis = 0.60,p = 0.02). The mean difference between the reference median RRs of all volunteers and theCRS Z-axis was 0.30 ± 0.70 bpm.
The Bland–Altman plots in figure 6 show the relative performance of the CRS x-axis (d),z-axis (e) and thoracic z-axis sensors (f) compared with the reference. With a mean differenceclose to zero, the mean bias in (d) and (e) (x = −0.37, z = 0.30) is small, whereas thatexhibited in (f) (−1.58) is much larger. Plot (d) shows greater errors (underestimation) in thelower ranges with a general tendency to overestimate, while (e) demonstrates a tendency tounderestimate slightly and (f) shows the greatest scatter with the same general trend as (d).All but one data point are within the 95% limits of agreement in plot (e) compared with four
Note N59
outliers in (d), albeit within tighter constraints, and three in plot (f), which has the highesterror. A limitation of the study is that there are few data points, it is therefore difficult to statedefinitively whether this reflects any systematic deviation in performance. The results suggestthe superiority of the CRS in the Z-axis (e).
4. Discussion
This pilot study produced encouraging results, demonstrating CRS was able to successfullytrack a resting individual’s changing respiratory rate. The clavicle sensor produced signals ofgreater amplitude and better signal to noise ratio than the thoracic device, giving notablysuperior RR readings using relatively basic signal processing techniques. Precise sensorpositioning upon the clavicle was not found to be particularly critical. In this study thelongitudinal (Z) axis was found to provide the best outcome, although signals may be resolvedfrom all three orthogonal axes. This feature facilitates use by non-clinical staff and in homemonitoring.
Optimal operation requires a compliant subject, whether recumbent, sitting or standing.This should not present any more of a problem than with any other vital sign measurement of aresting individual. In this respect, the sensor waveform is at least as robust as that observed ona basic pulse oximeter. Motion-induced artefacts could potentially mask the sensor’s response,although the simple median filter employed here successfully damped occasional glitchesand should prove tolerant of limited movement in resting subjects. Interference from motionartefacts or ambulatory movement could be minimized by considering composite or angularwaveforms (Anmin et al 2009) or an activity monitoring algorithm (Mathie et al 2004) appliedto qualify the respiratory data. Algorithms used on more sophisticated pulse oximeters tosuppress motion artefacts (Moyle 2002) could also easily be adopted.
With good sensor coupling, a factor that appeared more of an issue with the thoracic sensor,we have shown that the CRS RRs compare well with the reference. CRS does not suffer fromthe contact, noise, interference, arrhythmia or treatment-related problems seen with electrode-based ECG or impedance respiratory sensing methods (Malik 2004). Additionally, with EDRand RSA respiratory measurement, as the ratio between pulse rate and RR narrows there arefewer data points from which an accurate RR reading can be attained. A recent study byWu estimating RRs derived from ECG and photoplethysmograph (pulse oximeter) waveforms(Wu et al 2010) gave mean errors of 0.85 ± 0.53 bpm and 1.46 ± 1.12 bpm respectively,both significantly inferior to the CRS figures (0.30 ± 0.70 bpm). When compared withCysarz’s findings (Cysarz et al 2008), CRS appears superior at lower RRs (<10 bpm) andhas better potential for accurately detecting higher RRs (>20 bpm) than EDR and RSA as thesampling rate may be increased if necessary for higher temporal resolution. Comparing Lin’sconcordance correlation coefficient (ρc), the best EDR and RSA scores reported are 0.76 and0.79 respectively as opposed to 0.97 for CRS.
A practical CRS device would provide RR readings and a measure of respiratory depth.The signal processing techniques employed here are relatively straightforward compared tothose commonly used in many medical devices, thus a simple low-cost onboard microprocessorcould run embedded algorithms in an integrated USB-powered or wireless-enabled integratedsensing device. Power requirements are very low, so many hours operation would be possiblewith a small battery unless continuous real-time wireless monitoring was required.
A further trial is planned to address some of the limitations apparent from this pilot study.This will gather replicate data from a larger study group, and will include factors such asposture, spirometry, body mass index and thoracic measurements to build on the methodologydescribed here for a more thorough understanding of the clavicular respiratory measurement

N60 Note
method and provide comprehensive data prior to clinical testing. A key element will be todetermine the device’s accuracy in the X- and Z-axes and to establish if there is any bias inRR estimation across a wider range of frequencies. Algorithm development, including thatof FFT-based rate adaptive filtering, is ongoing with a view to producing a practical systemincluding additional physiological sensors for telemonitoring. These enhancements, togetherwith further waveform and multi-parameter analysis may yield useful data to characterizerespiratory patterns as an aid to diagnosis (Tobin et al 1983).
5. Conclusion
This pilot study demonstrates that clavicular respiratory motion sensing is superior to thoracicsensing and offers a viable and convenient method for the non-invasive monitoring ofrespiratory rate. Whilst this in itself is of value, especially outside of clinical settings, thesimultaneous measurement of respiratory depth significantly enhances this devices’ potentialas a practical diagnostic or monitoring device. Use of such a discrete respiratory monitorcould benefit dyspnoea sufferers as it could help promote patient compliance for breathingexercises by offering valuable feedback and encouragement. For home-based patients, whetherelderly or suffering from long-term conditions such as COPD, the regular monitoring of RRdepth and breathing patterns with a device such as the CRS, could be of great clinical value.When combined with pulse oximetry and other vital signs in a telemonitoring system, it couldthus provide carers and clinicians with an early warning of acute exacerbations, a worseningcondition or the onset of severe respiratory infection.
References
Altman D G and Bland J M 1983 Measurement in medicine: the analysis of method comparison studiesStatistician 32 307–17
Analog Devices Inc. 2007 ADXL330—Small, Low Power, 3-Axis ± 3 g iMEMS R© Accelerometer (Norwood, MA:Analog Devices Inc.) (available from: http://www.analog.com/static/imported-files/data_sheets/ADXL330.pdf)
Bates A et al 2010 Respiratory rate and flow waveform estimation from tri-axial accelerometer data Proc. IEEE 2010Int. Conf. on Body Sensor Networks (Biopolis, Singapore, 7–9 June 2010) pp 144–50
Browning I B, Dalonzo G E and Tobin M J 1990 Importance of respiratory rate as an indicator of respiratorydysfunction in patients with cystic-fibrosis Chest 97 1317–21
Corbishley P and Rodrıguez-Villegas E 2008 Breathing detection: towards a miniaturized, wearable, battery-operatedmonitoring system IEEE Trans. Biomed. Eng. 55 196–204
Cysarz D et al 2008 Comparison of respiratory rates derived from heart rate variability, ECG amplitude, and nasal/oralairflow Ann. Biomed. Eng. 36 2085–94
Fieselmann J et al 1993 Respiratory rate predicts cardiopulmonary arrest for internal medicine inpatients J. Gen. Int.Med. 8 354–60
High K P et al 2009 Clinical practice guideline for the evaluation of fever and infection in older adult residents of long-term care facilities: 2008 update by the Infectious Diseases Society of America J. Am. Geriatr. Soc. 57 375–94
Honeywell International Inc. 2008 AWM700 Series—Mass Flow Sensor for Gases (Morristown, NJ: Honeywell)(available from: http://sensing.honeywell.com/index.php/ci_id/50061/1a_id/1/document/1/re_id/0)
Janssens J-P and Krause K-H 2004 Pneumonia in the very old Lancet Infect. Dis. 4 112–24Jin A et al 2009 Performance evaluation of a tri-axial accelerometry-based respiration monitoring for ambient
assisted living EMBS 2009: Proc. 31st IEEE Annu. Int. Conf. on Engineering in Medicine and Biology Society(Minneapolis, MN, USA, 2–6 Sept. 2009) pp 5677–80
Khoo J C T, Brown I T H and Lim Y P 2008 Wireless on-body-network breathing rate and depth measurementduring activity EMBS 2008: Proc. 30th IEEE Annu. Int. Conf. on Engineering in Medicine and Biology Society(Vancouver, British Columbia, Canada, 20–24 Aug. 2008) pp 1283–7
Lanata A et al 2006 Performance analysis and early validation of a bi-modal ultrasound transducer EMBS’06: Proc.28th IEEE Annu. Int. Conf. on Engineering in Medicine and Biology Society (New York, NY, 30 Aug.–3 Sept.2006) pp 1858–61

Note N61
Longmore M et al 2009 Oxford Handbook of Clinical Medicine 7th edn (Oxford: Oxford University Press)Macknet M et al 2007 Accuracy of a novel bioacoustic sensor in adult postoperative patients Anesthesi-
ology 107 A83 (available from: http://www.masimo.cn/pdf/clinical/acoustic/macknet-accuracy-of-a-novel-bioacoustic-sensor-in-adult-postoperative-patients-oct-2007.pdf)
Malik M 2004 Errors and misconceptions in ECG measurement used for the detection of drug induced QT intervalprolongation J. Electrocardiol. 37 25–33
Marco C A et al 1995 Fever in geriatric emergency patients: clinical features associated with serious illness Ann.Emerg. Med. 26 18–24
Mathie M et al 2004 Classification of basic daily movements using a triaxial accelerometer Med. Biol. Eng.Comput. 42 679–87
Mcbride J et al 2005 Long-term effect of introducing an early warning score on respiratory rate charting on generalwards Resuscitation 65 41–4
Mcfadden J P et al 1982 Raised respiratory rate in elderly patients—a valuable physical sign Br. Med. J. 284 626–7Moyle J T B 2002 Pulse Oximetry 2nd edn (London: BMJ Books)Nam S H et al 2005 The preliminary study of unobtrusive respiratory monitoring for e-health IEEE-EMBS 2005:
Proc. 27th IEEE Annu. Int. Conf. on Engineering in Medicine and Biology Society (Shanghai, China, 1–4 Sept.2005) pp 3796–8
Phan D H et al 2008 Estimation of respiratory waveform and heart rate using an accelerometer EMBS 2008: Proc.30th IEEE Annu. Int. Conf. on Engineering in Medicine and Biology Society (Vancouver, British Columbia,Canada, 20–24 Aug. 2008) pp 4916–9
Ray P et al 2006 Acute respiratory failure in the elderly: etiology, emergency diagnosis and prognosis Crit.Care 10 R82
Reinvuo T et al 2006 Measurement of respiratory rate with high-resolution accelerometer and EMFit pressure sensorProc. 2006 IEEE Sensors Appl. Symp. (Houston, TX, USA, 7–9 Feb. 2006) pp 192–5
Tobin M J et al 1983 Breathing patterns: 2. Diseased subjects Chest 84 286–94US Navy 2005 Diving principles and policies US Navy Diving Manual revision 5, vol 1 (Washington DC: US
Naval Sea Systems Command) (available from: http://docs.lib.noaa.gov/noaa_documents/NOAA_related_docs/SEALAB/us_navy_diving_manual_rev5 Part 1.pdf)
Wu D et al 2010 The accuracy of respiratory rate estimation using electrocardiography and photoplethysmographyITAB 2010: 10th IEEE Int. Conf. on Information Technology and Applications in Biomedicine (Corfu, 3–5 Nov.2010) pp 1–3
Yasuma F and Hayano J-I 2004 Respiratory sinus arrhythmia Chest 125 683–90