A randomised trial to compare the pharmacokinetic, pharmacodynamic, and antiviral effects of...
10
A randomised trial to compare the pharmacokinetic, pharmacodynamic, and antiviral effects of peginterferon alfa-2b and peginterferon alfa-2a in patients with chronic hepatitis C (COMPARE) Marcelo Silva 1, * , Jorge Poo 2 , Frank Wagner 3 , Mary Jackson 4 , David Cutler 4 , Michael Grace 4 , Ronald Bordens 4 , Connie Cullen 4 , Joann Harvey 4 , Mark Laughlin 4 1 Hospital Universitario Austral, Pilar, Argentina 2 CIF-BIOTEC/Hospital Medical Sur, Mexico City, Mexico 3 Clinical Research, Berlin, Germany 4 Schering-Plough Research Institute, Kenilworth, NJ, USA See Editorial, pages 172–173 Background/ Aims: To compare the pharmacokinetics, pharmacodynamics, and antiviral activity of peginterferon alfa-2b and peginterferon alfa-2a in patients with chronic hepatitis C virus genotype 1. Methods: Thirty-six patients were randomised to peginterferon alfa-2b (1.5 lg/ kg/week) or peginterferon alfa-2a (180 lg/week) for 4 weeks, then in combination with ribavirin (13 mg/kg/day) for a further 4 weeks. The pharmacokinetic profile of both peginterferons, mRNA expression of a selected group of interferon-induced gene transcripts, and serum HCV-RNA levels were assessed. Results: Patients receiving peginterferon alfa-2b had significantly greater up-regulation of interferon-alfa response genes compared with those receiving peginterferon alfa-2a. Correspondingly, patients treated with peginterferon alfa-2b also had a significantly greater log 10 maximum and log 10 time-weighted average decrease in serum HCV-RNA. A greater propor- tion of peginterferon alfa-2b patients achieved a P2.0 log 10 reduction in serum HCV-RNA levels by week 8 (72% vs 44% of peginterferon alfa-2a patients, P = 0.09). There was an approximately 16-fold greater exposure to peginterferon in the serum of patients treated with peginterferon alfa-2a. Conclusions: These findings suggest that the biological activity, measured by early interferon-induced gene transcripts and early antiviral responsiveness, may have been greater in patients treated with peginterferon alfa-2b despite their lower exposure to the drug compared with patients treated with peginterferon alfa-2a. Ó 2006 European Association for the Study of the Liver. Published by Elsevier B.V. All rights reserved. Keywords: Chronic hepatitis C infection; Pegylated interferon; Peginterferon alfa-2b; Peginterferon alfa-2a; Ribavirin 1. Introduction Hepatitis C virus (HCV) is the leading cause of liver transplantation in the US and Europe and is associated with an increased risk of hepatocellular carcinoma [1,2]. Owing to the chronic nature of the disease, estimates suggest that its healthcare burden will increase dramat- ically [3]. The current standard of treatment is based on interferon alfa therapy and consists of the combina- tion of peginterferon alfa-2 plus ribavirin [4]. Type I interferons do not interact directly with the virus but rather exert their effects through interaction with their specific receptor. The interaction initiates a 0168-8278/$32.00 Ó 2006 European Association for the Study of the Liver. Published by Elsevier B.V. All rights reserved. doi:10.1016/j.jhep.2006.03.008 Received 15 August 2005; received in revised form 7 March 2006; accepted 9 March 2006; available online 18 April 2006 * Corresponding author. Tel.: +54 2322 482624. E-mail address: [email protected] (M. Silva). www.elsevier.com/locate/jhep Journal of Hepatology 45 (2006) 204–213
-
Upload
independent -
Category
Documents
-
view
0 -
download
0
Transcript of A randomised trial to compare the pharmacokinetic, pharmacodynamic, and antiviral effects of...

A randomised trial to compare the pharmacokinetic,pharmacodynamic, and antiviral effects of peginterferon alfa-2b
and peginterferon alfa-2a in patientswith chronic hepatitis C (COMPARE)
Marcelo Silva1,*, Jorge Poo2, Frank Wagner3, Mary Jackson4, David Cutler4,Michael Grace4, Ronald Bordens4, Connie Cullen4, Joann Harvey4, Mark Laughlin4
1Hospital Universitario Austral, Pilar, Argentina2CIF-BIOTEC/Hospital Medical Sur, Mexico City, Mexico
3Clinical Research, Berlin, Germany4Schering-Plough Research Institute, Kenilworth, NJ, USA
See Editorial, pages 172–173
Background/Aims:To compare the pharmacokinetics, pharmacodynamics, and antiviral activity of peginterferon alfa-2b
and peginterferon alfa-2a in patients with chronic hepatitis C virus genotype 1.
Methods:Thirty-six patients were randomised to peginterferon alfa-2b (1.5 lg/kg/week) or peginterferon alfa-2a
(180 lg/week) for 4 weeks, then in combination with ribavirin (13 mg/kg/day) for a further 4 weeks. The pharmacokinetic
profile of both peginterferons, mRNA expression of a selected group of interferon-induced gene transcripts, and serum
HCV-RNA levels were assessed.Results:Patients receiving peginterferon alfa-2b had significantly greater up-regulation of interferon-alfa response genes
compared with those receiving peginterferon alfa-2a. Correspondingly, patients treated with peginterferon alfa-2b also had
a significantly greater log10 maximum and log10 time-weighted average decrease in serum HCV-RNA. A greater propor-
tion of peginterferon alfa-2b patients achieved a P2.0 log10 reduction in serum HCV-RNA levels by week 8 (72% vs 44%
of peginterferon alfa-2a patients, P = 0.09). There was an approximately 16-fold greater exposure to peginterferon in the
serum of patients treated with peginterferon alfa-2a.
Conclusions:These findings suggest that the biological activity, measured by early interferon-induced gene transcripts
and early antiviral responsiveness, may have been greater in patients treated with peginterferon alfa-2b despite their lowerexposure to the drug compared with patients treated with peginterferon alfa-2a.
� 2006 European Association for the Study of the Liver. Published by Elsevier B.V. All rights reserved.
Keywords: Chronic hepatitis C infection; Pegylated interferon; Peginterferon alfa-2b; Peginterferon alfa-2a; Ribavirin
1. Introduction
Hepatitis C virus (HCV) is the leading cause of livertransplantation in the US and Europe and is associated
with an increased risk of hepatocellular carcinoma [1,2].Owing to the chronic nature of the disease, estimatessuggest that its healthcare burden will increase dramat-ically [3]. The current standard of treatment is basedon interferon alfa therapy and consists of the combina-tion of peginterferon alfa-2 plus ribavirin [4].
Type I interferons do not interact directly with thevirus but rather exert their effects through interactionwith their specific receptor. The interaction initiates a
0168-8278/$32.00 � 2006 European Association for the Study of the Liver. Published by Elsevier B.V. All rights reserved.
doi:10.1016/j.jhep.2006.03.008
Received 15 August 2005; received in revised form 7 March 2006;
accepted 9 March 2006; available online 18 April 2006* Corresponding author. Tel.: +54 2322 482624.E-mail address: [email protected] (M. Silva).
www.elsevier.com/locate/jhep
Journal of Hepatology 45 (2006) 204–213

cascade of intracellular Janus-kinase-mediated events,leading to changes in gene-transcript expression. Someof these up-regulated genes [e.g., RNA-dependent pro-tein kinase (PKR), 2 05 0 oligoadenylate synthetase(OAS)] are believed to have an important role in theinterruption of HCV replication within infected hepato-cytes [5–7].
Recent advances in pegylation chemistry have led tothe development of interferon alfas with longer half-lives. The covalent attachment of a polyethylene glycol(PEG) molecule to the interferon alfa protein results indecreased renal clearance and a longer half-life in theplasma [8–10]. The size and position of the PEG mole-cule used in the two currently licensed peginterferons:peginterferon alfa-2b (PegIntron�, Schering Corp.,Kenilworth, NJ, USA) and peginterferon alfa-2a (Pega-sys�, Hoffmann-La Roche, Basel, Switzerland) differsignificantly in their respective physical-chemical charac-teristics [11–14]. Although pegylation improves thepharmacokinetic properties of the core protein, it alsoresults in loss of in vitro biological activity [8,15]. Theantiviral activity of peginterferon alfa-2b is approxi-mately 28% of the interferon alfa-2b core protein [12].The antiviral activity of peginterferon alfa-2a rangesbetween 1% and 7% of the antiviral activity of the inter-feron alfa-2a core protein [16]. Recent work has demon-strated that the size and site of attachment of the PEGmoiety on the interferon alfa molecule markedly affectsits specific activity [12,17].
The purpose of this trial was to determine if thesein vitro differences between peginterferon alfa-2b andpeginterferon alfa-2a would translate to observable dif-ferences in their in vivo biological activity. This wasdone by assessing the effect of treatment on early viro-logic response as well as on expression of interferonresponse genes as markers of their mechanism of action[12,17].
2. Materials and methods
2.1. Study design
This was an 8-week, double-blind, randomised, multicentre, paral-lel-group study comparing the pharmacokinetics, pharmacodynamics,and antiviral activity of peginterferon alfa-2b and peginterferon alfa-2ain patients infected with HCV genotype 1. Study drug was prepared bya site pharmacist and administered by a qualified, independent thirdparty who was blinded to protocol assignments. Neither the pharma-cist nor the individual administering the injection had further involve-ment in the study.
Patients eligible for the study were randomised to receive once-weekly subcutaneous injections of either peginterferon alfa-2b 1.5lg/kg or peginterferon alfa-2a 180 lg for 8 weeks. After the fourthweek of treatment, oral ribavirin therapy was added to the regimenat a dose of 13 mg/kg, in a divided BID dose. At the end of the studyperiod, patients were offered a full course of weight-based peginterfer-on alfa-2b and ribavirin. The study protocol and patient-informed con-sent were approved by independent Ethics Committees of theparticipating institutions and regulatory agencies of their respective
countries, and the study was conducted according to the Declarationof Helsinki and the International Conference on Harmonisation ofTechnical Requirements for Registration of Pharmaceuticals forHuman Use (ICH) Guidance for Good Clinical Practice. Writteninformed consent was obtained from all patients prior to conductingstudy-related procedures.
2.2. Patients
Thirty-six treatment-naı̈ve patients between the ages of 18 and 65years who were infected with HCV genotype 1a or 1b [with a minimumof 6.0 · 105 HCV-RNA IU/mL, determined by quantitative polymer-ase chain reaction (PCR)] were eligible for enrollment into the study.Additional inclusion criteria were alanine aminotransferase (ALT)/as-partate aminotransferase (AST) levels 610 times the upper limit ofnormal (ULN), normal haemoglobin, white-blood-cell countP4000 cells/lL, neutrophil count P1500 cells/lL, and platelet countP100,000/lL. Subjects were excluded from participation if they hadevidence of liver disease due to causes other than chronic HCV infec-tion, HIV positivity, haemoglobinopathy, haemophilia, severe pre-ex-isting psychiatric disease, poorly controlled diabetes mellitus,significant ischaemic heart disease, chronic obstructive lung disease,or active autoimmune disease.
2.3. Study endpoints
The primary outcome was to assess the differential impact on inter-feron response genes and early viral kinetics of the two peginterferontreatments. Secondary outcome measures included the proportion ofvirologic responders (i.e., patients with a P2.0 log10 decrease inHCV-RNA by 8 weeks of peginterferon treatment) as well as the safetyand tolerability of treatment.
2.4. Study procedures
When subjects met inclusion/exclusion criteria and qualified toenter the study, the investigator requested randomisation by faxingthe central randomisation service. Only the site pharmacist responsiblefor medication preparation received confirmation of both the assignedtreatment and the subject number. The investigator received the sub-ject number only.
Screening evaluationswere performed at three independent, researchout-patient clinics. Patients were confined to pharmacology in-patientunits on day 1 of week 1 (day 1) and day 1 of week 4 (day 22) forapproximately 72 h while pharmacokinetic, pharmacodynamic, andantiviral samples were collected. Laboratory safety tests were performedat the sites, but viral kinetics, interferon pharmacokinetics, andpharmacodynamics were centrally analysed in a blinded fashion.
2.5. Interferon serum concentrations
Serum interferon samples were drawn at days 1 and 22 immediatelybefore peginterferon administration and at 6, 10, 12, 24, 48, 72, and120 h after the dose. The peginterferon serum concentrations weredetermined in a blinded manner, using a validated immunological(electrochemiluminescent) assay [18,19] and standards for both alfa peg-interferons. Once the study was unblinded, the values from the appro-priate standard were reported in pg/mL as per the assigned treatment.
2.6. Interferon-alfa response-gene-transcript analysis
Blood samples for determination of interferon-stimulated gene reg-ulation were collected into PAX-Gene tubes (Becton–Dickinson,Franklin Lakes, NJ, USA) prior to the first dose and at 6, 24, 48,and 72 h after the first dose of peginterferon. Samples were analysedfor mRNA using quantitative real-time PCR (qRT-PCR) (TaqMan�,Applied Biosystems, Foster City, CA, USA) [19,20]. Interferon-modu-lated genes, including signal transducers and activators of transcrip-tion (STAT)-1, STAT-2, cyclin D, interferon-gamma, inducible
M. Silva et al. / Journal of Hepatology 45 (2006) 204–213 205

protein 10 (IP10), interferon-stimulated gene (ISG)15, ISG54, perforin,PKR, and 2 05 0 OAS, were tested. Data were expressed as fold increasein mRNA over baseline. In order to investigate the cumulative expres-sion or sustained activity of treatment on gene transcription, changesin mRNA observed over the sampling period were expressed as maxi-mal fold increase from baseline (Cmax) and area under the curve(AUC), derived from the time-weighted averages of the mRNA fold-increase data.
2.7. HCV-RNA serum determinations
HCV-RNA was determined prior to the first administration ofstudy drug to establish the baseline and at 0, 24, 48, 72, 120, and168 h after the first and fourth dose of peginterferon alfa. HCV-RNA was also assessed immediately prior to the weekly dose of pegin-terferon alfa at weeks 2, 3, 5, 6, 7, and 8. Data were expressed as log10decrease in HCV-RNA from baseline. Maximal decrease and time-weighted average decrease over the sampling period were calculatedfrom the data at weeks 1 and 4. HCV-RNA was quantified by qRT-PCR (TaqMan�; Schering-Plough Research Institute, Kenilworth,NJ, USA), with a lower limit of detection of 29 IU/mL. HCV genotyp-ing was performed by direct sequencing of the 5 0-noncoding region.
2.8. Adverse events and laboratory testing
Standard safety laboratories were collected weekly. Adverse eventswere recorded at each visit and throughout the confinement. Patientswere withdrawn from the study for a white-blood-cell count<1500 cells/lL, neutrophil count <750 cells/lL, platelet count<80,000/lL, creatinine clearance <50 mL/min, ALT/AST levels>10· ULN, or indirect bilirubin >5 mg/dL. No modification of thepeginterferon alfa or ribavirin dose was allowed.
2.9. Statistical analysis
The assessment of the viral concentration kinetics during weeks 1and 4 was made by determining the time-weighted mean decrease inviral concentration and the mean maximal decrease in viral concentra-tion over the week. For the weekly pre-dosing determinations, patientswere defined as responders if aP2.0 log10 reduction in viral concentra-tion was achieved at the last determination.
The viral kinetic differences between treatment groups were testedusing Wilcoxon rank-sum tests of the average and maximum decreasesfrom weekly baseline. The difference between treatment groups withrespect to the once-weekly measurements of viral load change frombaseline was tested using a model that tested for equality of slopesvia SAS PROC MIXED. The model included fixed effects terms fortreatment, day, and treatment by day interaction (slope). Randomeffects included in the model were the patient and the addition ofribavirin.
Using the observed standard deviation in the sample size calcula-tion, a sample size of 18 in each group would have 80% power to detecta difference in means of log viral change of 1.65 (the difference betweena group 1 mean of �3.65 and a group 2 mean of �2.00) at week 8,assuming that the common standard deviation is 1.700 using a two-group t-test with a 0.050 two-sided significance level.
The association between the mRNA changes and the attainment ofa P2.0 log10 drop in viral load was tested using Wilcoxon rank-sumtests of AUC of the fold increase in mRNA over baseline. The changefrom baseline of a patient’s last virologic observation, carried forwardto week 8 if necessary, was used to ascertain whether a patient hadattained a P2.0 log10 decrease in viral load during the treatmentperiod.
A post hoc multivariate correlation analysis using Spearmancorrelation values was performed in order to further explore the rela-tionship between treatment, gene expression, and viral response. Tocomplement these findings, a secondary post hoc analysis using princi-pal components was conducted. Principal component analysis (PCA) isa variable reduction technique in which a number of [possibly] corre-lated variables are transformed into an equal number of uncorrelatedvariables called principal components [21]. PCA was used to confirm the
findings of the first post hoc analysis by determining whether the inter-feron-response genes identified in the first analysis remained signifi-cantly correlated with treatment and viral response.
Table 1
Baseline characteristics
Baseline parameter Peginterferonalfa-2a (n = 18)
Peginterferonalfa-2b (n = 18)
Age (years) 45.6 (±11.8)a 48.3 (±9.7)a
Males (n) 9 10Ethnicity (n)
Caucasian 16 14Hispanic 2 4
Weight (kg) 71.0 (±11.9)a 69.6 (±15.4)a
Baseline viral load(·106 IU/mL)
1.8 (±0.1)a 1.8 (±0.2)a
Prothrombin time(% of control)
109.5 (±9.4)a 111.4 (±13.1)a
Platelets (·103/lL) 233 (±75.8)a 223 (±80.7)a
Neutrophils (·103/lL) 3.96 (±1.26)a 3.34 (±1.36)a
ALT (IU/L) 82.9 (±59.8)a 70.5 (±51.5)a
AST (IU/L) 60.0 (±42.8)a 46.3 (±25.5)a
a Data are reported as means (±SD).
Fig. 1. Individual time–concentration profiles following subcutaneous
administration of (a) peginterferon alfa-2a 180 lg or (b) peginterferon
alfa-2b 1.5 lg/kg. There was a �16-fold greater exposure in the serum of
patients treated with peginterferon alfa-2a compared with peginterferon
alfa-2b, but there was also a larger variability in patient exposure (38%
vs 20%, respectively).
206 M. Silva et al. / Journal of Hepatology 45 (2006) 204–213

3. Results
The study was conducted in three centres, in Argenti-na, Mexico, and Germany, between November 2002 andNovember 2003.
3.1. Baseline characteristics
The baseline characteristics in the two peginterferontreatment groups were comparable with respect to race,gender, weight, and viral load (Table 1).
3.2. Pharmacokinetics results
The comparative exposure of patients to peginterfer-on alfa-2b and peginterferon alfa-2a during the firstweek of dosing is shown in Fig. 1. There was a �16-foldgreater exposure in the serum of patients treated with
peginterferon alfa-2a; however, there was also a largervariability in their exposure, compared with peginterfer-on alfa-2b (38% vs 20%, respectively). The week 1AUC0–168h for each treatment group plotted againstbodyweight is shown in Fig. 2. There was no effect ofweight on exposure when peginterferon alfa-2b wasdosed according to patient weight. In contrast, whenpeginterferon alfa-2a was administered as a fixed dose,there was a decrease in exposure with increasingbodyweight.
3.3. Interferon-alfa response-gene transcript results
Thirty-one patients had sufficient, recoverablemRNA at baseline (as acquired via sampling priorto and immediately after the first treatment dose).Based on the results of a preliminary Wilcoxonrank-sum test that suggested a correlation with treat-ment response, transcripts were analysed for the fol-lowing interferon-response genes: IP10, ISG15, PKR,2 05 0 OAS, and ISG54 [no statistically significant differ-ences in mRNA expression were observed for patientswith or without a virologic response (P2.0 log10decline in HCV-RNA after 8 weeks of treatment)for the other genes tested].
Patients who achieved a virologic response by 8weeks of treatment had significantly greater up-regula-tion of transcripts for the interferon-alfa response genesIP10, ISG15, PKR, 2 05 0 OAS, and ISG54 as assessed bymRNA Cmax and AUC levels (P < 0.05; Table 2).
There was consistently greater up-regulation of tran-scripts in patients treated with peginterferon alfa-2b(n = 14) compared with patients treated with peginter-feron alfa-2a (n = 17) (Table 2), with the differences
Fig. 2. Week 1 exposure to peginterferon by weight. Unlike peginterferon
alfa-2b (b), in which there was no effect of weight on exposure when dosed
by patient weight, peginterferon alfa-2a (a), administered as a fixed dose,
showed a trend towards decrease in exposure with increasing bodyweight.
Table 2
Mean AUC and Cmax of interferon-alfa response-gene transcripts
analysed by virologic response and treatment group
Responders(n = 17)
Nonresponders(n = 14)
Peginterferonalfa-2a(n = 17)
Peginterferonalfa-2b(n = 14)
Cmax (fold increase)IP10 253.2* 83.4 126.4 237.3ISG15 91.0* 39.7 41.9 99.3PKR 11.3* 6.5 7.5 11.1*
2050 OAS 21.0* 13.3 13.3 22.6*
ISG54 41.1* 17.0 18.0 44.9*
Mean AUC (fold increaseÆh)IP10 4654.1* 1703.7 2427.0 4408.1*
ISG15 3589.8* 1854.8 1886.7 3922.8*
PKR 502.3* 314.9 345.2 505.72050 OAS 1099.6* 669.0 682.1 1176.1*
ISG54 1368.7* 630.6 678.9 1468.1*
* P < 0.05 by Wilcoxon rank-sum test for responders vs nonre-sponders and peginterferon alfa-2b vs peginterferon alfa-2a. (Respond-ers were defined as patients with a P2.0 log10 decrease in HCV-RNAby week 8.)
M. Silva et al. / Journal of Hepatology 45 (2006) 204–213 207
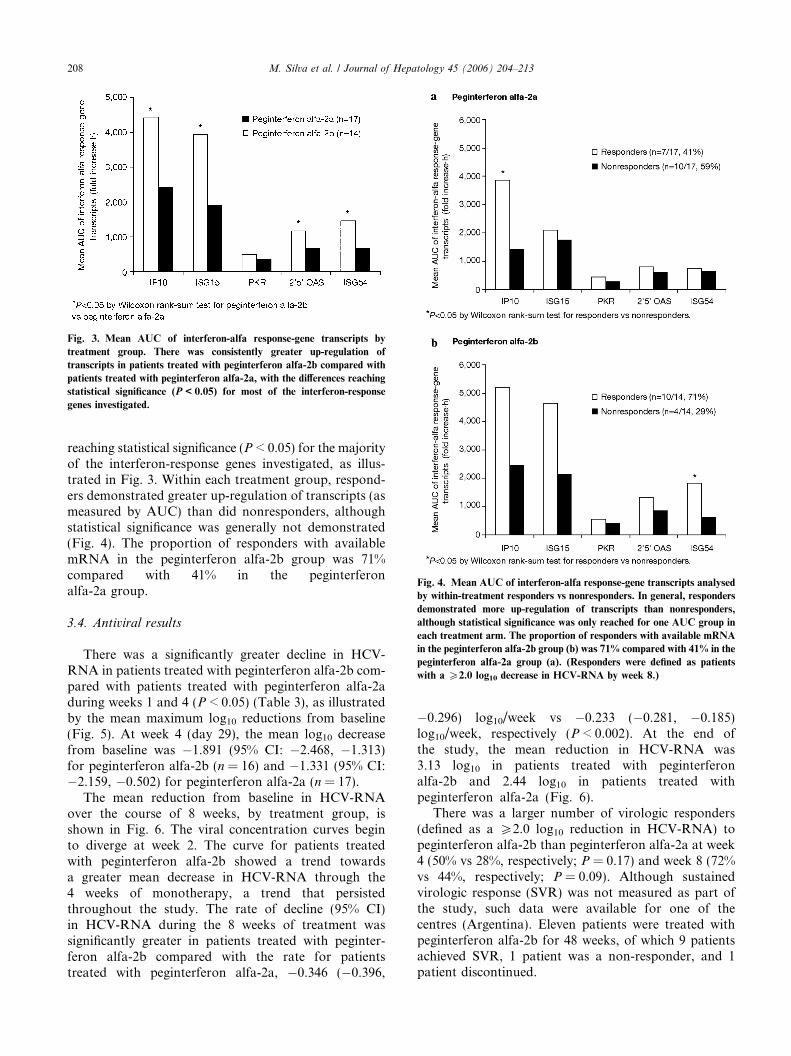
reaching statistical significance (P < 0.05) for the majorityof the interferon-response genes investigated, as illus-trated in Fig. 3. Within each treatment group, respond-ers demonstrated greater up-regulation of transcripts (asmeasured by AUC) than did nonresponders, althoughstatistical significance was generally not demonstrated(Fig. 4). The proportion of responders with availablemRNA in the peginterferon alfa-2b group was 71%compared with 41% in the peginterferonalfa-2a group.
3.4. Antiviral results
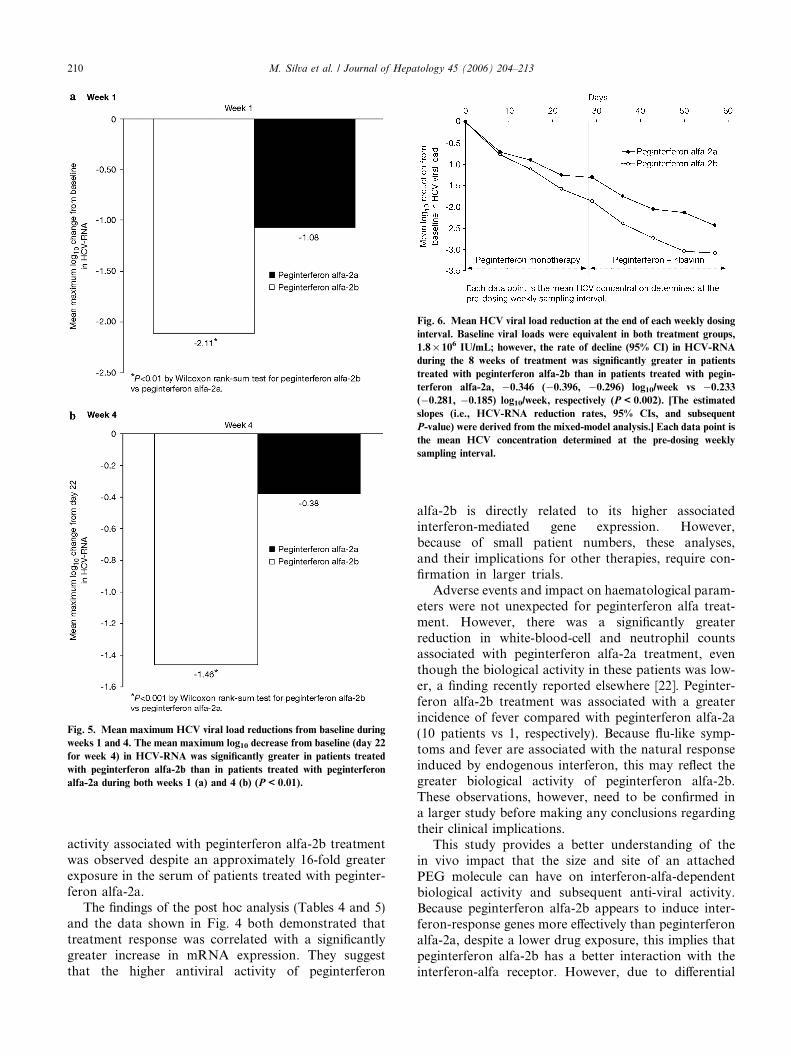
There was a significantly greater decline in HCV-RNA in patients treated with peginterferon alfa-2b com-pared with patients treated with peginterferon alfa-2aduring weeks 1 and 4 (P < 0.05) (Table 3), as illustratedby the mean maximum log10 reductions from baseline(Fig. 5). At week 4 (day 29), the mean log10 decreasefrom baseline was �1.891 (95% CI: �2.468, �1.313)for peginterferon alfa-2b (n = 16) and �1.331 (95% CI:�2.159, �0.502) for peginterferon alfa-2a (n = 17).
The mean reduction from baseline in HCV-RNAover the course of 8 weeks, by treatment group, isshown in Fig. 6. The viral concentration curves beginto diverge at week 2. The curve for patients treatedwith peginterferon alfa-2b showed a trend towardsa greater mean decrease in HCV-RNA through the4 weeks of monotherapy, a trend that persistedthroughout the study. The rate of decline (95% CI)in HCV-RNA during the 8 weeks of treatment wassignificantly greater in patients treated with peginter-feron alfa-2b compared with the rate for patientstreated with peginterferon alfa-2a, �0.346 (�0.396,
�0.296) log10/week vs �0.233 (�0.281, �0.185)log10/week, respectively (P < 0.002). At the end ofthe study, the mean reduction in HCV-RNA was3.13 log10 in patients treated with peginterferonalfa-2b and 2.44 log10 in patients treated withpeginterferon alfa-2a (Fig. 6).
There was a larger number of virologic responders(defined as a P2.0 log10 reduction in HCV-RNA) topeginterferon alfa-2b than peginterferon alfa-2a at week4 (50% vs 28%, respectively; P = 0.17) and week 8 (72%vs 44%, respectively; P = 0.09). Although sustainedvirologic response (SVR) was not measured as part ofthe study, such data were available for one of thecentres (Argentina). Eleven patients were treated withpeginterferon alfa-2b for 48 weeks, of which 9 patientsachieved SVR, 1 patient was a non-responder, and 1patient discontinued.
Fig. 3. Mean AUC of interferon-alfa response-gene transcripts by
treatment group. There was consistently greater up-regulation of
transcripts in patients treated with peginterferon alfa-2b compared with
patients treated with peginterferon alfa-2a, with the differences reaching
statistical significance (P < 0.05) for most of the interferon-response
genes investigated.
Fig. 4. Mean AUC of interferon-alfa response-gene transcripts analysed
by within-treatment responders vs nonresponders. In general, responders
demonstrated more up-regulation of transcripts than nonresponders,
although statistical significance was only reached for one AUC group in
each treatment arm. The proportion of responders with available mRNA
in the peginterferon alfa-2b group (b) was 71% compared with 41% in the
peginterferon alfa-2a group (a). (Responders were defined as patients
with a P2.0 log10 decrease in HCV-RNA by week 8.)
208 M. Silva et al. / Journal of Hepatology 45 (2006) 204–213

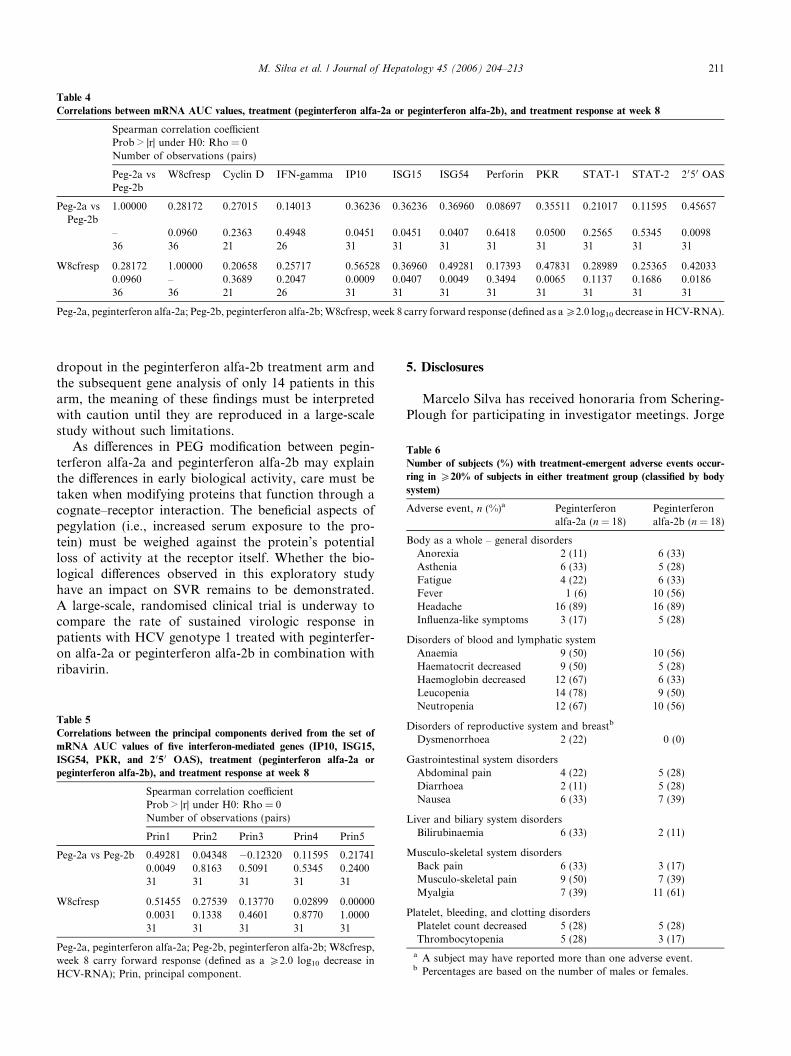
3.5. Post hoc multivariate correlation analysis
Pairwise correlations (Spearman correlation values)between mRNA AUC values (gene expression), treat-ment response, and treatment arm (peginterferon alfa-2b or peginterferon alfa-2a) were determined to explorethe relationship between these variables. IP10, ISG15,ISG54, PKR, and 2 05 0 OAS were significantly correlat-ed with treatment group and virologic response at week8 (Table 4). A secondary correlation analysis using thecombined set of mRNA AUC data for these five genesand their derived principal components showed thatthe first principal component, which accounts for63% of the variability in each individual mRNAAUC value, was significantly correlated with bothtreatment group and treatment response (Table 5), thusproviding further evidence of a link between thesevariables.
3.6. Adverse events
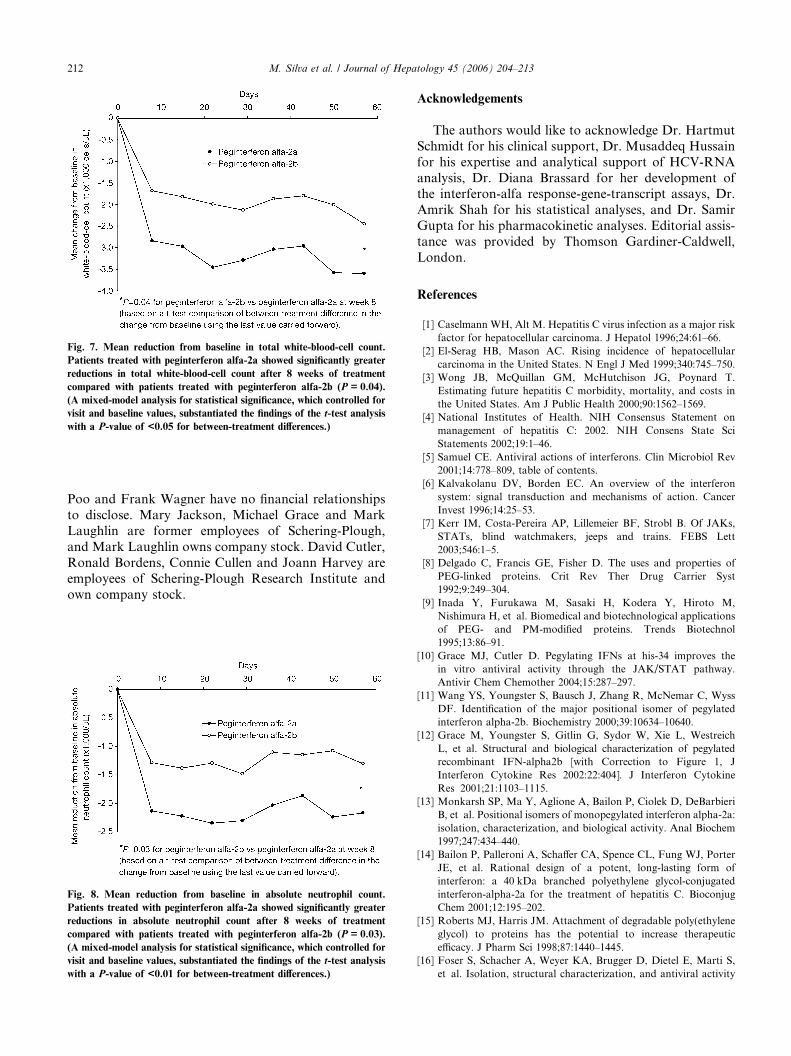
Adverse events were typical of those reported previ-ously with administration of pegylated interferons:fever, myalgia, headache, flu-like symptoms, fatigue,anaemia, and leucopenia. Treatment-emergent adverseevents are shown in Table 6 (classified by body system).Patients treated with peginterferon alfa-2a showed sta-tistically significantly greater reductions in total white-blood-cell count over the 8 weeks of treatmentcompared with patients treated with peginterferonalfa-2b (P = 0.04, Fig. 7). This was due to statisticallysignificantly greater reductions in the absolute neutro-phil count (P = 0.03), as shown in Fig. 8. There wereno differences in monocyte or lymphocyte countsbetween the two groups (data not shown).
Six patients discontinued treatment due to adverseevents prior to completion of the 8-week study, fourreceiving treatment with peginterferon alfa-2b and two
with peginterferon alfa-2a. Three patients in thepeginterferon alfa-2b group discontinued due to reducedplatelet counts (<80,000/lL); however, all three begantreatment with platelet counts close to the exclusionthreshold, ranging from 96,000 to 100,000/lL. Thepatient in the peginterferon alfa-2a group whodiscontinued due to thrombocytopenia had a baselinelevel of 125,000/lL that dropped to 71,000/lL. Theremaining reasons for subject discontinuations were acase of anaemia in the peginterferon alfa-2b group andone of erythaema multiforme in the peginterferonalfa-2a group.
4. Discussion
In this study, we used changes in the mRNA abun-dance for genes known to be regulated by interferonsas a marker of biological activity. The data presentedare consistent with the in vitro data [12,17,20] and sug-gest that biological activity, as indicated by generesponse, is greater with peginterferon alfa-2b than withpeginterferon alfa-2a. Beginning as early as week 2,when the viral concentration curves began to diverge,the rate of decline in HCV-RNA during the 8 weeksof treatment was significantly greater in patients treatedwith peginterferon alfa-2b compared to patients treatedwith peginterferon alfa-2a. The kinetic studies, conduct-ed at weeks 1 and 4 during the monotherapy phase,revealed that treatment with peginterferon alfa-2bresulted in significantly greater reduction in the maximaland time-weighted mean viral concentration during eachweek when compared with peginterfesron alfa-2a. Cor-respondingly, compared with peginterferon alfa-2a,peginterferon alfa-2b treatment also stimulated greaterincreases in many interferon-alfa response-gene tran-scripts for proteins believed to be associated withantiviral activity. The apparently greater biological
Table 3
HCV viral load reductions during weeks 1 and 4
Week 1 Week 4
Peginterferon alfa-2a (n = 18) Peginterferon alfa-2b (n = 18) Peginterferon alfa-2a (n = 18) Peginterferon alfa-2b (n = 18)
Log10 time-weighted average decrease in HCV-RNAMean (±SD) 0.58 (0.76) 1.21 (0.52)* 0.04 (0.29) 0.73 (0.48)***
Median 0.43 1.24 0.04 0.64Max 2.36 2.32 0.44 1.18Min �0.29 0.20 �0.45 �0.01
Maximum log10 decrease from baseline in HCV-RNAMean (±SD) 1.08 (0.93) 2.11 (0.79)** 0.38 (0.33) 1.46 (0.83)***
Median 0.64 2.08 0.29 1.44Max 3.23 3.31 0.96 2.92Min 0.00 0.59 0.00 0.33
* P < 0.05 by Wilcoxon rank-sum test for peginterferon alfa-2b vs peginterferon alfa-2a.** P < 0.01 by Wilcoxon rank-sum test for peginterferon alfa-2b vs peginterferon alfa-2a.*** P < 0.001 by Wilcoxon rank-sum test for peginterferon alfa-2b vs peginterferon alfa-2a.
M. Silva et al. / Journal of Hepatology 45 (2006) 204–213 209
activity associated with peginterferon alfa-2b treatmentwas observed despite an approximately 16-fold greaterexposure in the serum of patients treated with peginter-feron alfa-2a.
The findings of the post hoc analysis (Tables 4 and 5)and the data shown in Fig. 4 both demonstrated thattreatment response was correlated with a significantlygreater increase in mRNA expression. They suggestthat the higher antiviral activity of peginterferon
alfa-2b is directly related to its higher associatedinterferon-mediated gene expression. However,because of small patient numbers, these analyses,and their implications for other therapies, require con-firmation in larger trials.
Adverse events and impact on haematological param-eters were not unexpected for peginterferon alfa treat-ment. However, there was a significantly greaterreduction in white-blood-cell and neutrophil countsassociated with peginterferon alfa-2a treatment, eventhough the biological activity in these patients was low-er, a finding recently reported elsewhere [22]. Peginter-feron alfa-2b treatment was associated with a greaterincidence of fever compared with peginterferon alfa-2a(10 patients vs 1, respectively). Because flu-like symp-toms and fever are associated with the natural responseinduced by endogenous interferon, this may reflect thegreater biological activity of peginterferon alfa-2b.These observations, however, need to be confirmed ina larger study before making any conclusions regardingtheir clinical implications.
This study provides a better understanding of thein vivo impact that the size and site of an attachedPEG molecule can have on interferon-alfa-dependentbiological activity and subsequent anti-viral activity.Because peginterferon alfa-2b appears to induce inter-feron-response genes more effectively than peginterferonalfa-2a, despite a lower drug exposure, this implies thatpeginterferon alfa-2b has a better interaction with theinterferon-alfa receptor. However, due to differential
Fig. 6. Mean HCV viral load reduction at the end of each weekly dosing
interval. Baseline viral loads were equivalent in both treatment groups,
1.8 · 106 IU/mL; however, the rate of decline (95% CI) in HCV-RNA
during the 8 weeks of treatment was significantly greater in patients
treated with peginterferon alfa-2b than in patients treated with pegin-
terferon alfa-2a, �0.346 (�0.396, �0.296) log10/week vs �0.233
(�0.281, �0.185) log10/week, respectively (P < 0.002). [The estimated
slopes (i.e., HCV-RNA reduction rates, 95% CIs, and subsequent
P-value) were derived from the mixed-model analysis.] Each data point is
the mean HCV concentration determined at the pre-dosing weekly
sampling interval.
Fig. 5. Mean maximum HCV viral load reductions from baseline during
weeks 1 and 4. The mean maximum log10 decrease from baseline (day 22
for week 4) in HCV-RNA was significantly greater in patients treated
with peginterferon alfa-2b than in patients treated with peginterferon
alfa-2a during both weeks 1 (a) and 4 (b) (P < 0.01).
210 M. Silva et al. / Journal of Hepatology 45 (2006) 204–213
dropout in the peginterferon alfa-2b treatment arm andthe subsequent gene analysis of only 14 patients in thisarm, the meaning of these findings must be interpretedwith caution until they are reproduced in a large-scalestudy without such limitations.
As differences in PEG modification between pegin-terferon alfa-2a and peginterferon alfa-2b may explainthe differences in early biological activity, care must betaken when modifying proteins that function through acognate–receptor interaction. The beneficial aspects ofpegylation (i.e., increased serum exposure to the pro-tein) must be weighed against the protein’s potentialloss of activity at the receptor itself. Whether the bio-logical differences observed in this exploratory studyhave an impact on SVR remains to be demonstrated.A large-scale, randomised clinical trial is underway tocompare the rate of sustained virologic response inpatients with HCV genotype 1 treated with peginterfer-on alfa-2a or peginterferon alfa-2b in combination withribavirin.
5. Disclosures
Marcelo Silva has received honoraria from Schering-Plough for participating in investigator meetings. Jorge
Table 6
Number of subjects (%) with treatment-emergent adverse events occur-
ring in P20% of subjects in either treatment group (classified by body
system)
Adverse event, n (%)a Peginterferonalfa-2a (n = 18)
Peginterferonalfa-2b (n = 18)
Body as a whole – general disordersAnorexia 2 (11) 6 (33)Asthenia 6 (33) 5 (28)Fatigue 4 (22) 6 (33)Fever 1 (6) 10 (56)Headache 16 (89) 16 (89)Influenza-like symptoms 3 (17) 5 (28)
Disorders of blood and lymphatic systemAnaemia 9 (50) 10 (56)Haematocrit decreased 9 (50) 5 (28)Haemoglobin decreased 12 (67) 6 (33)Leucopenia 14 (78) 9 (50)Neutropenia 12 (67) 10 (56)
Disorders of reproductive system and breastb
Dysmenorrhoea 2 (22) 0 (0)
Gastrointestinal system disordersAbdominal pain 4 (22) 5 (28)Diarrhoea 2 (11) 5 (28)Nausea 6 (33) 7 (39)
Liver and biliary system disordersBilirubinaemia 6 (33) 2 (11)
Musculo-skeletal system disordersBack pain 6 (33) 3 (17)Musculo-skeletal pain 9 (50) 7 (39)Myalgia 7 (39) 11 (61)
Platelet, bleeding, and clotting disordersPlatelet count decreased 5 (28) 5 (28)Thrombocytopenia 5 (28) 3 (17)
a A subject may have reported more than one adverse event.b Percentages are based on the number of males or females.
Table 5
Correlations between the principal components derived from the set of
mRNA AUC values of five interferon-mediated genes (IP10, ISG15,
ISG54, PKR, and 2 05 0 OAS), treatment (peginterferon alfa-2a or
peginterferon alfa-2b), and treatment response at week 8
Spearman correlation coefficientProb > |r| under H0: Rho = 0Number of observations (pairs)
Prin1 Prin2 Prin3 Prin4 Prin5
Peg-2a vs Peg-2b 0.49281 0.04348 �0.12320 0.11595 0.217410.0049 0.8163 0.5091 0.5345 0.240031 31 31 31 31
W8cfresp 0.51455 0.27539 0.13770 0.02899 0.000000.0031 0.1338 0.4601 0.8770 1.000031 31 31 31 31
Peg-2a, peginterferon alfa-2a; Peg-2b, peginterferon alfa-2b; W8cfresp,week 8 carry forward response (defined as a P2.0 log10 decrease inHCV-RNA); Prin, principal component.
Table 4
Correlations between mRNA AUC values, treatment (peginterferon alfa-2a or peginterferon alfa-2b), and treatment response at week 8
Spearman correlation coefficientProb > |r| under H0: Rho = 0Number of observations (pairs)
Peg-2a vsPeg-2b
W8cfresp Cyclin D IFN-gamma IP10 ISG15 ISG54 Perforin PKR STAT-1 STAT-2 2050 OAS
Peg-2a vsPeg-2b
1.00000 0.28172 0.27015 0.14013 0.36236 0.36236 0.36960 0.08697 0.35511 0.21017 0.11595 0.45657
– 0.0960 0.2363 0.4948 0.0451 0.0451 0.0407 0.6418 0.0500 0.2565 0.5345 0.009836 36 21 26 31 31 31 31 31 31 31 31
W8cfresp 0.28172 1.00000 0.20658 0.25717 0.56528 0.36960 0.49281 0.17393 0.47831 0.28989 0.25365 0.420330.0960 – 0.3689 0.2047 0.0009 0.0407 0.0049 0.3494 0.0065 0.1137 0.1686 0.018636 36 21 26 31 31 31 31 31 31 31 31
Peg-2a, peginterferon alfa-2a; Peg-2b, peginterferon alfa-2b;W8cfresp, week 8 carry forward response (defined as aP2.0 log10 decrease inHCV-RNA).
M. Silva et al. / Journal of Hepatology 45 (2006) 204–213 211
Poo and Frank Wagner have no financial relationshipsto disclose. Mary Jackson, Michael Grace and MarkLaughlin are former employees of Schering-Plough,and Mark Laughlin owns company stock. David Cutler,Ronald Bordens, Connie Cullen and Joann Harvey areemployees of Schering-Plough Research Institute andown company stock.
Acknowledgements
The authors would like to acknowledge Dr. HartmutSchmidt for his clinical support, Dr. Musaddeq Hussainfor his expertise and analytical support of HCV-RNAanalysis, Dr. Diana Brassard for her development ofthe interferon-alfa response-gene-transcript assays, Dr.Amrik Shah for his statistical analyses, and Dr. SamirGupta for his pharmacokinetic analyses. Editorial assis-tance was provided by Thomson Gardiner-Caldwell,London.
References
[1] Caselmann WH, Alt M. Hepatitis C virus infection as a major riskfactor for hepatocellular carcinoma. J Hepatol 1996;24:61–66.
[2] El-Serag HB, Mason AC. Rising incidence of hepatocellularcarcinoma in the United States. N Engl J Med 1999;340:745–750.
[3] Wong JB, McQuillan GM, McHutchison JG, Poynard T.Estimating future hepatitis C morbidity, mortality, and costs inthe United States. Am J Public Health 2000;90:1562–1569.
[4] National Institutes of Health. NIH Consensus Statement onmanagement of hepatitis C: 2002. NIH Consens State SciStatements 2002;19:1–46.
[5] Samuel CE. Antiviral actions of interferons. Clin Microbiol Rev2001;14:778–809, table of contents.
[6] Kalvakolanu DV, Borden EC. An overview of the interferonsystem: signal transduction and mechanisms of action. CancerInvest 1996;14:25–53.
[7] Kerr IM, Costa-Pereira AP, Lillemeier BF, Strobl B. Of JAKs,STATs, blind watchmakers, jeeps and trains. FEBS Lett2003;546:1–5.
[8] Delgado C, Francis GE, Fisher D. The uses and properties ofPEG-linked proteins. Crit Rev Ther Drug Carrier Syst1992;9:249–304.
[9] Inada Y, Furukawa M, Sasaki H, Kodera Y, Hiroto M,Nishimura H, et al. Biomedical and biotechnological applicationsof PEG- and PM-modified proteins. Trends Biotechnol1995;13:86–91.
[10] Grace MJ, Cutler D. Pegylating IFNs at his-34 improves thein vitro antiviral activity through the JAK/STAT pathway.Antivir Chem Chemother 2004;15:287–297.
[11] Wang YS, Youngster S, Bausch J, Zhang R, McNemar C, WyssDF. Identification of the major positional isomer of pegylatedinterferon alpha-2b. Biochemistry 2000;39:10634–10640.
[12] Grace M, Youngster S, Gitlin G, Sydor W, Xie L, WestreichL, et al. Structural and biological characterization of pegylatedrecombinant IFN-alpha2b [with Correction to Figure 1, JInterferon Cytokine Res 2002:22:404]. J Interferon CytokineRes 2001;21:1103–1115.
[13] Monkarsh SP, Ma Y, Aglione A, Bailon P, Ciolek D, DeBarbieriB, et al. Positional isomers of monopegylated interferon alpha-2a:isolation, characterization, and biological activity. Anal Biochem1997;247:434–440.
[14] Bailon P, Palleroni A, Schaffer CA, Spence CL, Fung WJ, PorterJE, et al. Rational design of a potent, long-lasting form ofinterferon: a 40 kDa branched polyethylene glycol-conjugatedinterferon-alpha-2a for the treatment of hepatitis C. BioconjugChem 2001;12:195–202.
[15] Roberts MJ, Harris JM. Attachment of degradable poly(ethyleneglycol) to proteins has the potential to increase therapeuticefficacy. J Pharm Sci 1998;87:1440–1445.
[16] Foser S, Schacher A, Weyer KA, Brugger D, Dietel E, Marti S,et al. Isolation, structural characterization, and antiviral activity
Fig. 7. Mean reduction from baseline in total white-blood-cell count.
Patients treated with peginterferon alfa-2a showed significantly greater
reductions in total white-blood-cell count after 8 weeks of treatment
compared with patients treated with peginterferon alfa-2b (P = 0.04).
(A mixed-model analysis for statistical significance, which controlled for
visit and baseline values, substantiated the findings of the t-test analysis
with a P-value of <0.05 for between-treatment differences.)
Fig. 8. Mean reduction from baseline in absolute neutrophil count.
Patients treated with peginterferon alfa-2a showed significantly greater
reductions in absolute neutrophil count after 8 weeks of treatment
compared with patients treated with peginterferon alfa-2b (P = 0.03).
(A mixed-model analysis for statistical significance, which controlled for
visit and baseline values, substantiated the findings of the t-test analysis
with a P-value of <0.01 for between-treatment differences.)
212 M. Silva et al. / Journal of Hepatology 45 (2006) 204–213
of positional isomers of monopegylated interferon alpha-2a(PEGASYS). Protein Expr Purif 2003;30:78–87.
[17] Grace M, Lee S, Bradshaw S, Chapman J, Spond J, Cox S, et al.Site of pegylation and polyethylene glycol molecule size attenuateinterferon-alpha antiviral and antiproliferative activities throughthe JAK/STAT signaling pathway. J Biol Chem2005;280:6327–6336.
[18] Obenauer-Kutner LJ, Jacobs SJ, Kolz K, Tobias LM, BordensRW. A highly sensitive electrochemiluminescence immunoassayfor interferon alfa-2b in human serum. J Immunol Methods1997;206:25–33.
[19] Xie L, Cullen C, Bradshaw S, DeLorenzo M, Grace M. Biologicalcharacterization of pegylated interferons: a case study. In: Smales
M, James DG, editors. Therapeutic proteins: methods andprotocols. Totowa, NJ: Humana Press; 2005. p. 319–336.
[20] Brassard DL, Delorenzo MM, Cox S, Leaman DW, Sun Y, DingW, et al. Regulation of gene expression by pegylated IFN-alpha2b and IFN-alpha2b in human peripheral blood mononu-clear cells. J Interferon Cytokine Res 2004;24:455–469.
[21] Joliffe IT, Morgan BJ. Principal component analysis and explor-atory factor analysis. Stat Methods Med Res 1992;1:69–95.
[22] Peck-Radosavljevic M, Schmid M, Formann E, Homoncik M,Datz C, Gangl A, et al. Hemopoiesis suppression with differentpeylated and nonpegylated interferon alfa regimens for chronichepatitis C. Gastroenterology 2005;128 (Suppl. 2), [Poster pre-sentation S1563].
M. Silva et al. / Journal of Hepatology 45 (2006) 204–213 213