Volterra-System Identification Using Adaptive Real-Coded Genetic Algorithm

REGULAR ARTICLE
A quantitative proteomic approach using two-dimensional
gel electrophoresis and isotope-coded affinity tag labeling
for studying human 20S proteasome heterogeneity
Carine Froment*, Sandrine Uttenweiler-Joseph*, Marie-Pierre Bousquet-Dubouch,Mariette Matondo, Jean-Philippe Borges, Charlotte Esmenjaud, Christelle Lacroix,Bernard Monsarrat and Odile Burlet-Schiltz
Institut de Pharmacologie et de Biologie Structurale, CNRS,Toulouse, France
Mammalian proteasomes are macromolecular complexes formed of a catalytic 20S core asso-ciated to two regulatory complexes. The 20S core complex consists of four stacked rings of sevena or b subunits. Three b subunits contain a catalytic site and can be replaced by three interferong-inducible counterparts to form the immunoproteasome. Cells may constitutively possess amixture of both 20S proteasome types leading to a heterogeneous proteasome population. Puri-fied rat 20S proteasome has been separated in several chromatographic fractions indicating aneven higher degree of complexity in 20S proteasome subunit composition. This complexity mayarise from the presence of subunit isoforms, as previously detected in purified human eryth-rocyte 20S proteasome. In this study, we have used a quantitative proteomic approach based ontwo-dimensional gel electrophoresis and isotope-coded affinity tag (ICAT) labeling to quantifythe variations in subunit composition, including subunit isoforms, of 20S proteasomes purifiedfrom different cells. The protocol has been adapted to the analysis of low quantities of 20S pro-teasome complexes. The strategy has then been validated using standard proteins and has beenapplied to the comparison of 20S proteasomes from erythrocytes and U937 cancer cells. Theresults obtained show that this approach represents a valuable tool for the study of 20S protea-some heterogeneity.
Received: November 15, 2004Revised: January 28, 2005
Accepted: February 8, 2005
Keywords:
Isotope-coded affinity tag / Macromolecular complex / Mass spectrometry / Protea-some / Quantitative proteomics
Proteomics 2005, 5, 2351–2363 2351
1 Introduction
The proteasome is a macromolecular multicatalytic complexconstituting the principal degradation machinery of intra-cellular proteins. It is present in the cytoplasm and thenucleus of all eukaryotic cells. This complex is involved in
the regulation of numerous crucial processes, such as thecell cycle. It is also the major source of antigenic peptidespresented by the major histocompatibility complex (MHC)class I molecules [1]. Recently, the proteasome has beenrecognized as a therapeutic target in cancer therapy [2, 3].
The mammalian proteasome is composed of a catalytic20S core complex associated with two regulatory complexes.The 19S and the interferon g (IFNg)-inducible 11S regulatorycomplexes have been described [4, 5]. Typically one 19S com-plex associates at each end of the 20S core forming a symme-trical structure, but hybrid proteasomes with one 11S complex
Correspondence: Dr. Odile Burlet-Schiltz, Institut de Pharmacolo-gie et de Biologie Structurale, CNRS, 205 route de Narbonne,31077 Toulouse Cedex, FranceE-mail: [email protected]: 133-5-61-17-59-94
Abbreviations: ICAT, isotope-coded affinity tag; IFNª, interferon g * These authors contributed equally.
2005 WILEY-VCH Verlag GmbH & Co. KGaA, Weinheim www.proteomics-journal.de
DOI 10.1002/pmic.200401281
2352 C. Froment et al. Proteomics 2005, 5, 2351–2363
at one end and one 19S complex at the other end have alsobeen described leading to a heterogeneous population of pro-teasomes in the cell [6–8]. The 20S core complex is composedof 28 subunits arranged in four stacked heptameric rings(abba) forming a symmetrical barrel-shaped structure. Thetwo outer a rings interact with the regulatory complexes andthe two inner b rings contain three active sites, each located onthe b1, b2, and b5 subunits. These catalytic subunits can bereplaced by three IFNg-inducible counterparts, b1i, b2i, andb5i, to form the immunoproteasome. These structural varia-tions lead to changes in the proteasome activity, which canaffect the processing of MHC class I antigenic peptides [1, 9,10]. The proportion of standard 20S proteasome and immu-noproteasome in cells may vary as a function of environmen-tal factors, such as the presence of IFNg, but also duringaging, where an increase in immunoproteasome content hasbeen reported based on antibody reactivity of catalytic stand-ard subunits and immunosubunits [11]. Cells may con-stitutively possess a mixture of standard 20S proteasome andimmunoproteasome [12], and their proportions have beenshown to be tissue dependent [13].
In rat muscle tissue, Dahlmann et al., have separated pu-rified 20S proteasome by chromatography in even more thantwo fractions corresponding to different proteasome subtypes.These 20S proteasome subtypes possess different proteolyticactivities and their relative ratios differ between different rattissues [14] and in skeletal muscle of rat after induction of dia-betes mellitus [15]. The detailed subunit composition of eachof these subtypes remains to be characterized. The separationof purified 20S proteasome subunits by 2-DE allows a map ofall the 20S proteasome subunits to be obtained. The 2-D mapof human erythrocytes 20S proteasome subunits has revealedan increase in subunit heterogeneity due to the presence ofisoforms for most of the subunits [16]. These isoforms mayresult from PTMs, splicing variants, and single point muta-tions. The most intense isoform of the a7 subunit, for exam-ple, is phosphorylated [16]. This modification has recentlybeen described to play a role in 26S proteasome stability byinteracting with the 19S regulatory complex rather than hav-ing a direct effect on proteolytic activity [17].
The nature of other isoforms and their impact on pro-teasome activity, however, remains to be determined. In astudy of the effects of coronary occlusion/reperfusion onproteasome subunit modification and peptidase activities,the 2-D gel pattern of purified rat 20S proteasome subunitswas found to be modified due to lipid peroxidation productsafter occlusion/reperfusion compared to perfusion [18].Modification of proteasome subunits during aging is alsoconsidered to alter its peptidase activities [19]. Comparison of2-D gel subunit patterns of 20S proteasomes purified fromhuman erythrocytes and cancer cell lines revealed variationsin the relative intensities of standard catalytic subunits versusimmunosubunits and of subunit isoforms [20, 21]. The pre-cise relative quantification of these variations as a function ofcellular origin and environment has not yet been investi-gated. The use of antibody being restricted to the specific
detection of immunosubunits and their correspondingstandard catalytic subunits, this approach does not allowaccess to the relative quantification of subunit isoforms.
We propose to study the variations in subunit composi-tion of 20S proteasomes from different cellular origins byusing a quantitative proteomic approach based on 2-DEseparation and isotope-coded affinity tag (ICAT) labeling.The use of ICAT reagents was initially proposed to quantifythe variations in protein expression between the two distinctcellular states [22]. Proteins from each cellular extract to becompared are labeled on their cysteine residues with eitherthe heavy or the light ICAT reagent. The two proteinextracts are then combined and digested with trypsin. TheICAT-labeled peptides are subjected to avidin affinity chro-matography taking advantage of the biotin moiety of thereagent. They are then analyzed by online LC-MS/MS todetermine their heavy/light ratio indicating the initial pro-tein variation and to identify the corresponding protein.
More recently, this methodology has been applied to thedetermination of quantitative changes in the abundance andcomposition of the macromolecular protein complexes [23, 24].One limitation of this approach is to label only cysteine-con-taining proteins. To circumvent this drawback, other strategieslike the derivatization of lysine residues and the labeling ofpeptide C-termini after trypsin digestion have been developed,which in turn present other limitations like generating verycomplex mixtures of labeled peptides [25, 26]. Another draw-back of these approaches is their inability to quantitate varia-tions in protein isoforms resulting from PTMs like phospho-rylations, which may be of major importance in protein function[27]. The use of ICAT reagents has been shown to be compat-ible with 2-DE separation of proteins from cellular extracts [28].
For the study of the variations in 20S proteasome subunitcomposition, including the variations in subunit isoforms,we have thus chosen to combine ICAT labeling and 2-DEseparation of the labeled subunits. Given that every 20S pro-teasome subunit contains at least one cysteine residue, ICATlabeling is appropriate and labeling before 2-DE separationallows a single gel to be performed. In the present work, weshow the validity of such an approach for the quantitativeanalysis of 20S proteasome complexes. A comparative analy-sis of 20S proteasomes purified from human erythrocytesand U937 cancer cells then set grounds for further compar-ison of 20S proteasome purified from other cancer cells.
2 Materials and methods
2.1 Standard protein samples
Standard proteins used were BSA, chicken ovalbumin(OVAL), and bovine b-lactoglobulin (LACB), all purchasedfrom Sigma-Aldrich (St. Louis, MO, USA). Two microgramsper micoliter solutions of each protein were prepared by dis-solving lyophilized proteins into solution A (8 M urea, 50 mM
Tris buffer, pH 8.5) or solution B (8 M urea, 2% CHAPS,
2005 WILEY-VCH Verlag GmbH & Co. KGaA, Weinheim www.proteomics-journal.de
Proteomics 2005, 5, 2351–2363 Technology 2353
50 mM Tris buffer, pH 8.5). Several mixtures containingthese three standard proteins were prepared in solutions Aand B at different concentrations.
2.2 20S proteasome purification
Human erythrocytes and U937 20S proteasomes were puri-fied from 100 mL of human blood and 1.1 6 109 cells,respectively. The purification was performed by affinitychromatography using the mAb MCP21 as previouslydescribed [16] except for the lysis buffer (50 mM NaCl, 10 mM
EDTA, 20 mM Tris buffer pH 7.6 with protease and phos-phatase inhibitors). Protein concentration was determinedusing the Bio-Rad Protein Assay. About 2 and 0.5 mg of 20Sproteasome were purified from 100 mL of blood and1.1 6 109 U937 cells, respectively. The purified proteasomesamples were dialyzed against Milli-Q water and con-centrated by TCA precipitation. The pellets were resus-pended either in solution A or B.
2.3 cICAT labeling
Equal amounts (20 mg) of the two different standard proteinmixtures or specified amounts of purified 20S proteasome(ranging from 8 to 40 mg as described in Section 3) werereduced and labeled with 12C- or 13C-cleavable ICAT
(cICAT) reagents (Applied Biosystems, Framingham, MA,USA) using a slightly modified protocol from that recom-mended from the manufacturer. Briefly, each denaturedsamples in solution A or B was reduced, for 1 h at roomtemperature, with trichloroethylphosphine (TCEP, Sigma-Aldrich) diluted in 50 mM Tris buffer, pH 8.5 at a final con-centration of 1 mM. cICAT reagents were dissolved with10% ACN, diluted either in solution A or B and added to thereduced samples at a final concentration of 2.5 mM. Thelabeling reaction was allowed to proceed for 2 h at roomtemperature in the dark. The 12C- and 13C-cICAT-labeledsamples were combined prior to protein separation by gelelectrophoresis (1-D SDS-PAGE or 2-DE).
2.4 1-D SDS-PAGE 2-DE and in-gel trypsin digestion
2.4.1 Effect of CHAPS on cleavable ICAT labeling
efficiency
Forty micrograms of standard protein as well as 80 mg oferythrocytes 20S proteasome were subjected to SDS-PAGEseparation either unlabeled or after labeling in either solu-tion A or B. Appropriated SDS electrophoresis sample buffervolume was added to the samples. Electrophoresis was car-ried out on a Multiphor II flatbed system using 12.5% acryl-amide precast gel (Amersham Biosciences, Uppsala, Swe-den) at 157C during 2 h at 600 V.
2.4.2 2-DE separation and image analysis
Prior to the first dimension, unlabeled and labeled standardprotein mixtures as well as 20S proteasome samples wereresuspended up to 350 mL with the rehydration buffer (9 M
urea, 2.2% CHAPS, 30 mM DTT, 0.2% Immobiline pH gra-dient buffer, pH 3–10 (Bio-Rad, Hercules, CA, USA)). Thefirst dimension was performed on a Protean IEF system (Bio-Rad). The 17 cm pH 3–10 NL IPG strips (Bio-Rad) wererehydrated with sample buffer at 207C under passive condi-tion during 9 h and at 50 V for 6 h. Then the samples werefocused for 2 h with a linear gradient from 50 to 8000 V andthen at 8000 V up to a total of 65 kVh. Prior to the seconddimension, the IPG strips were incubated in 50 mM Tris-HCl, 6 M urea, 2% SDS, 30% glycerol, and 30 mM DTT withshaking for 15 min followed by 15 min in the same solutionin which DTT was replaced by 2.5% iodoacetamide. SDS-PAGE was performed on the Multiphor II flatbed systemusing 12.5% acrylamide precast gel (Amersham Bio-sciences). Complete migration was achieved at 157C after 1 hat 200 V followed by 600 V for a total of 680 Vh. Proteinswere detected by CBB staining and gels were scanned withthe GS-800 densitometer (Bio-Rad).
2-D gel image analysis for standard protein mixtures wasperformed using the Image Master 2-D Platinium V. 5.0software (Amersham Biosciences). Spot detection was per-formed automatically and spot volume percentages werecalculated after normalization of each gel. The relative pro-tein quantification was achieved by calculating the ratio ofthe spot volume percentages of two different standard pro-tein mixtures using duplicate experiments.
2.4.3 In-gel protein digestion
Stained protein spots were excised from the gel, and in-geltryptic digestion was performed as described previously [29]with minor modifications. Briefly, after several washing stepsto eliminate the stain, the gel pieces were dried under vacuumto be rehydrated in a sufficient covering volume (7 mL) ofmodified trypsin solution (12.5 ng?mL21 in 50 mM NH4HCO3;Promega, Madison, WI, USA) for 15 min in an ice-bath. Tryp-sin digestion was performed overnight at 377C during shak-ing. Prior to peptide extraction, 0.5 mL of the tryptic digest wasspotted onto the MALDI target plate for subunit identification.Peptides were extracted three times at 377C for 15 min duringshaking, using once 50 mM NH4HCO3 and twice 5% formicacid in 50% ACN. The peptide mixture was dried undervacuum and resuspended in 10 mL of 2X PBS (0.2 M sodiumphosphate, 0.3 M NaCl, pH 7.2).
2.5 Avidin affinity purification and cICAT reagent
cleavage
The avidin affinity purification was performed with a self-packed micro-column filled with 5 mL UltraLink Immobi-lized monomeric avidin media (Pierce, Rockford, IL, USA)
2005 WILEY-VCH Verlag GmbH & Co. KGaA, Weinheim www.proteomics-journal.de

2354 C. Froment et al. Proteomics 2005, 5, 2351–2363
and using an Eppendorf GeLoader pipette tips as previouslydescribed [30]. The purification conditions followed themanufacturer’s “Cleavable ICAT Kit” instructions (AppliedBiosystems). Six microliters of avidin resin (33% slurry) werepipetted into the GeLoader tip and packed by gently applyingair pressure with a plastic syringe (Eppendorf Combitips,1.25 mL; Hamburg, Germany). The micro-column waswashed twice with 30 mL of 30% ACN/0.4% TFA and equili-brated with 30 mL of 2X PBS. The peptide mixture was loa-ded and successively washed twice with 30 mL of 2X PBS,1X PBS and 20% methanol in 50 mM NH4HCO3. cICAT-labeled peptides were eluted with 30 mL of 30% ACN/0.4%TFA and lyophilized. Cleavage of the cICAT reagent fromthe cICAT-Iabeled peptides was achieved according to themanufacturer’s instructions for 2 h at 377C. After anotherstep of lyophilization, peptides were resuspended with 10 mLof 5% ACN/0.1% TFA, loaded onto a ZipTip mC18 (Milli-pore, Bedford, MA, USA), washed with 0.1% TFA and di-rectly eluted onto the MALDI target plate with a matrix so-lution of CHCA (5 mg?mL21 in 50% ACN/0.1% TFA;Sigma-Aldrich).
2.6 Mass spectrometry analysis, database search,
and protein quantification
MALDI-TOF MS and MS/MS analyses were performedusing a MALDI-TOF/TOF instrument (4700 ProteomicsAnalyser; Applied Biosystems, Foster City, CA, USA). Pep-tide mass mapping of tryptic digest supernatants andMALDI-TOF MS spectra of cICAT-labeled peptide sampleswere acquired in an automated positive reflector mode, fromm/z 800 to 4000 and calibrated with external calibration(2500 shots/spectrum). MALDI-TOF MS/MS spectra wereacquired using 1 keV collision energy and air as collision gas
(7500 shots/spectrum). Peak lists from peptide mass map-ping spectra were automatically extracted from the datastored in the oracle database and submitted, through theGPS Explorer system (Applied Biosystems) databases tosearching against the Swiss-Prot and NCBInr using MAS-COT software (version 1.8; Matrix Science, London, UK).cICAT-labeled peptide pairs were manually detected usingDataExplorer software (Applied Biosystems) or by searchingwith the ExPASy FindPept tool assuming preliminary iden-tification of proteasome subunits and considering cICAT
labeling. MS/MS spectra of cICAT-labeled peptides weremanually interpreted. Proteasome subunit quantificationwas manually performed using isotopic cluster areas givenin the MS spectra by the DataExplorer peak list. The relativequantification was achieved by calculating the abundanceratios of each cICAT-labeled peptide pairs.
3 Results and discussion
3.1 Heterogeneity of 20S proteasome complexes
The subunits composing 20S proteasome complexes puri-fied from monoblastic U937 cultured cells were separated by2-DE and identified by PMF using MALDI-MS. We havepreviously used this approach to establish a detailed map ofhuman erythrocyte 20S proteasome subunits, whichrevealed numerous subunit isoforms [16]. The subunit pat-tern obtained with U937 20S proteasome after CBB is pre-sented in Fig. 1A. PMF analyses of each 2-D gel spot allowed40–80% sequence coverage for all analyzed spots but two andled to the unambiguous identification of all 20S proteasomesubunits (Table 1). Similar to the analysis of erythrocyte
Figure 1. 2-DE maps of human20S proteasome purified fromU937 cells (A) and eryth-rocytes (B). 20S proteasomespurified from U937 cells (60 mg)and erythrocytes (40 mg) wereseparated in the first dimensionby IEF using a pH 3–10 non-lin-ear IPG strip and in the seconddimension by a 12.5% SDS-PAGE gel. The 2-D gels werestained with CBB. All labeledspots from the 2-D gel A wereidentified by MALDI-TOF MSand database search (seeTable 1). The 2-D gel B is repro-duced from [16] for comparison.
2005 WILEY-VCH Verlag GmbH & Co. KGaA, Weinheim www.proteomics-journal.de
Proteomics 2005, 5, 2351–2363 Technology 2355
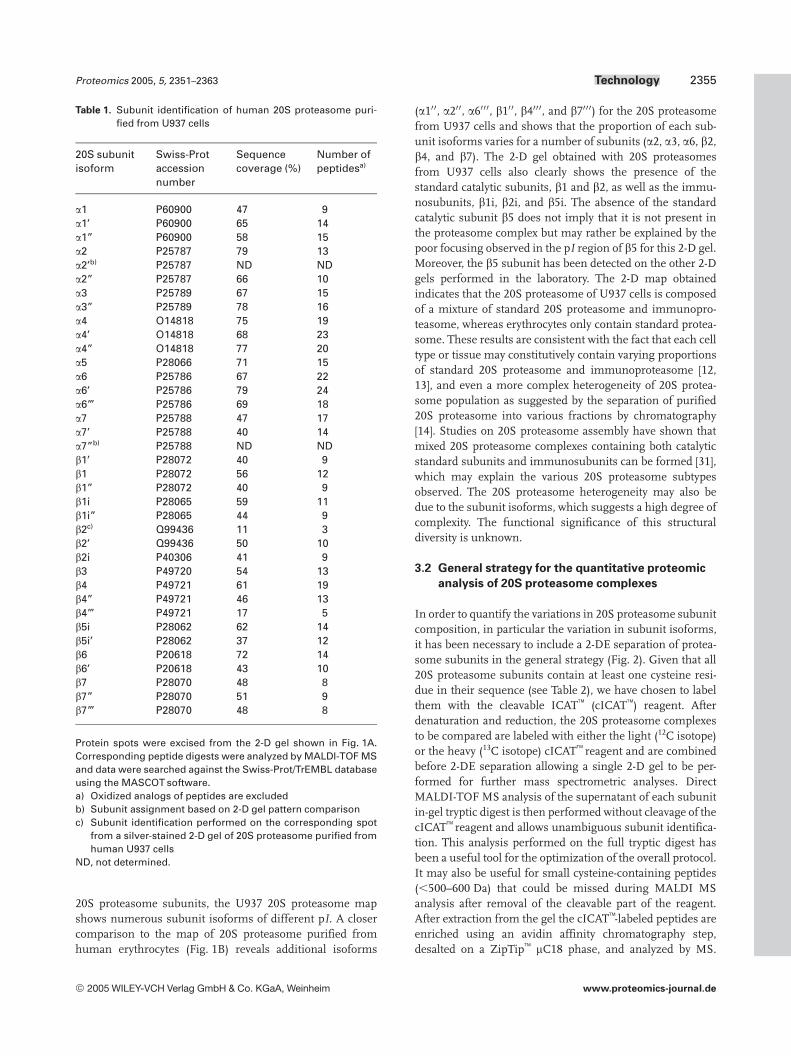
Table 1. Subunit identification of human 20S proteasome puri-fied from U937 cells
20S subunitisoform
Swiss-Protaccessionnumber
Sequencecoverage (%)
Number ofpeptidesa)
a1 P60900 47 9a1’ P60900 65 14a1” P60900 58 15a2 P25787 79 13a2’b) P25787 ND NDa2” P25787 66 10a3 P25789 67 15a3” P25789 78 16a4 O14818 75 19a4’ O14818 68 23a4” O14818 77 20a5 P28066 71 15a6 P25786 67 22a6’ P25786 79 24a6”’ P25786 69 18a7 P25788 47 17a7’ P25788 40 14a7”b) P25788 ND NDb1’ P28072 40 9b1 P28072 56 12b1” P28072 40 9b1i P28065 59 11b1i” P28065 44 9b2c) Q99436 11 3b2’ Q99436 50 10b2i P40306 41 9b3 P49720 54 13b4 P49721 61 19b4” P49721 46 13b4”’ P49721 17 5b5i P28062 62 14b5i’ P28062 37 12b6 P20618 72 14b6’ P20618 43 10b7 P28070 48 8b7” P28070 51 9b7”’ P28070 48 8
Protein spots were excised from the 2-D gel shown in Fig. 1A.Corresponding peptide digests were analyzed by MALDI-TOF MSand data were searched against the Swiss-Prot/TrEMBL databaseusing the MASCOT software.a) Oxidized analogs of peptides are excludedb) Subunit assignment based on 2-D gel pattern comparisonc) Subunit identification performed on the corresponding spot
from a silver-stained 2-D gel of 20S proteasome purified fromhuman U937 cells
ND, not determined.
20S proteasome subunits, the U937 20S proteasome mapshows numerous subunit isoforms of different pI. A closercomparison to the map of 20S proteasome purified fromhuman erythrocytes (Fig. 1B) reveals additional isoforms
(a10 0, a200, a60 0 0, b10 0, b400 0, and b70 0 0) for the 20S proteasomefrom U937 cells and shows that the proportion of each sub-unit isoforms varies for a number of subunits (a2, a3, a6, b2,b4, and b7). The 2-D gel obtained with 20S proteasomesfrom U937 cells also clearly shows the presence of thestandard catalytic subunits, b1 and b2, as well as the immu-nosubunits, b1i, b2i, and b5i. The absence of the standardcatalytic subunit b5 does not imply that it is not present inthe proteasome complex but may rather be explained by thepoor focusing observed in the pI region of b5 for this 2-D gel.Moreover, the b5 subunit has been detected on the other 2-Dgels performed in the laboratory. The 2-D map obtainedindicates that the 20S proteasome of U937 cells is composedof a mixture of standard 20S proteasome and immunopro-teasome, whereas erythrocytes only contain standard protea-some. These results are consistent with the fact that each celltype or tissue may constitutively contain varying proportionsof standard 20S proteasome and immunoproteasome [12,13], and even a more complex heterogeneity of 20S protea-some population as suggested by the separation of purified20S proteasome into various fractions by chromatography[14]. Studies on 20S proteasome assembly have shown thatmixed 20S proteasome complexes containing both catalyticstandard subunits and immunosubunits can be formed [31],which may explain the various 20S proteasome subtypesobserved. The 20S proteasome heterogeneity may also bedue to the subunit isoforms, which suggests a high degree ofcomplexity. The functional significance of this structuraldiversity is unknown.
3.2 General strategy for the quantitative proteomic
analysis of 20S proteasome complexes
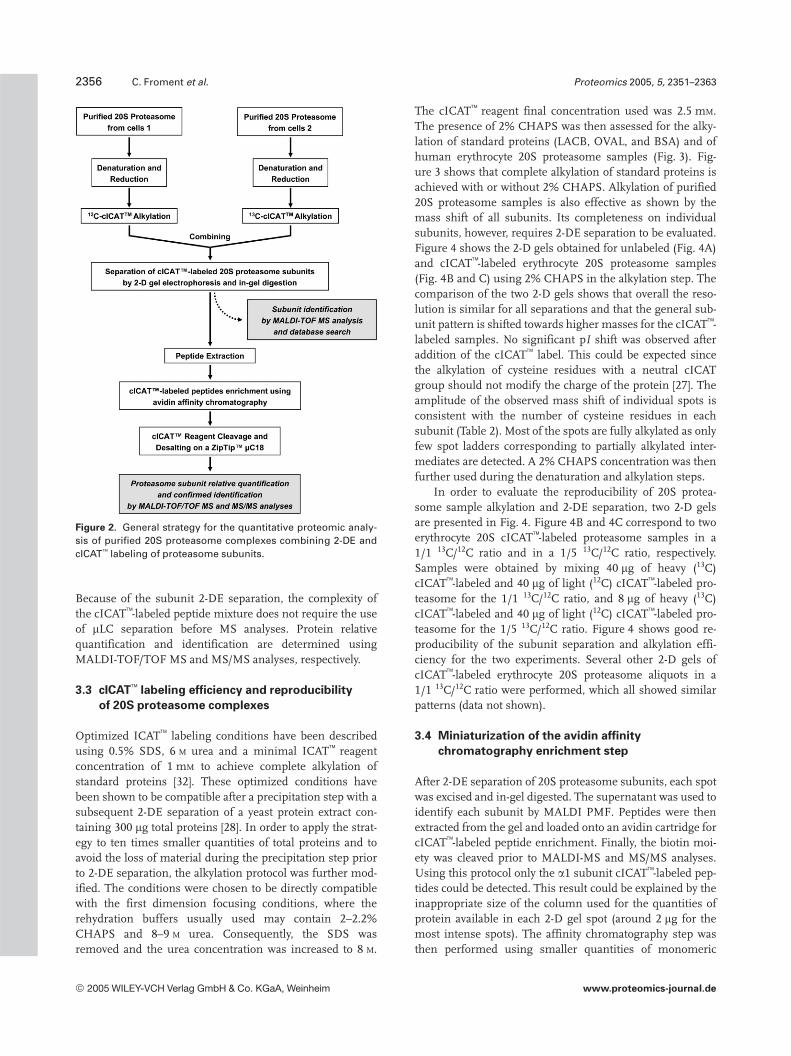
In order to quantify the variations in 20S proteasome subunitcomposition, in particular the variation in subunit isoforms,it has been necessary to include a 2-DE separation of protea-some subunits in the general strategy (Fig. 2). Given that all20S proteasome subunits contain at least one cysteine resi-due in their sequence (see Table 2), we have chosen to labelthem with the cleavable ICAT (cICAT) reagent. Afterdenaturation and reduction, the 20S proteasome complexesto be compared are labeled with either the light (12C isotope)or the heavy (13C isotope) cICAT reagent and are combinedbefore 2-DE separation allowing a single 2-D gel to be per-formed for further mass spectrometric analyses. DirectMALDI-TOF MS analysis of the supernatant of each subunitin-gel tryptic digest is then performed without cleavage of thecICAT reagent and allows unambiguous subunit identifica-tion. This analysis performed on the full tryptic digest hasbeen a useful tool for the optimization of the overall protocol.It may also be useful for small cysteine-containing peptides(,500–600 Da) that could be missed during MALDI MSanalysis after removal of the cleavable part of the reagent.After extraction from the gel the cICAT-labeled peptides areenriched using an avidin affinity chromatography step,desalted on a ZipTip mC18 phase, and analyzed by MS.
2005 WILEY-VCH Verlag GmbH & Co. KGaA, Weinheim www.proteomics-journal.de
2356 C. Froment et al. Proteomics 2005, 5, 2351–2363
Figure 2. General strategy for the quantitative proteomic analy-sis of purified 20S proteasome complexes combining 2-DE andcICAT labeling of proteasome subunits.
Because of the subunit 2-DE separation, the complexity ofthe cICAT-labeled peptide mixture does not require the useof mLC separation before MS analyses. Protein relativequantification and identification are determined usingMALDI-TOF/TOF MS and MS/MS analyses, respectively.
3.3 cICAT labeling efficiency and reproducibility
of 20S proteasome complexes
Optimized ICAT labeling conditions have been describedusing 0.5% SDS, 6 M urea and a minimal ICAT reagentconcentration of 1 mM to achieve complete alkylation ofstandard proteins [32]. These optimized conditions havebeen shown to be compatible after a precipitation step with asubsequent 2-DE separation of a yeast protein extract con-taining 300 mg total proteins [28]. In order to apply the strat-egy to ten times smaller quantities of total proteins and toavoid the loss of material during the precipitation step priorto 2-DE separation, the alkylation protocol was further mod-ified. The conditions were chosen to be directly compatiblewith the first dimension focusing conditions, where therehydration buffers usually used may contain 2–2.2%CHAPS and 8–9 M urea. Consequently, the SDS wasremoved and the urea concentration was increased to 8 M.
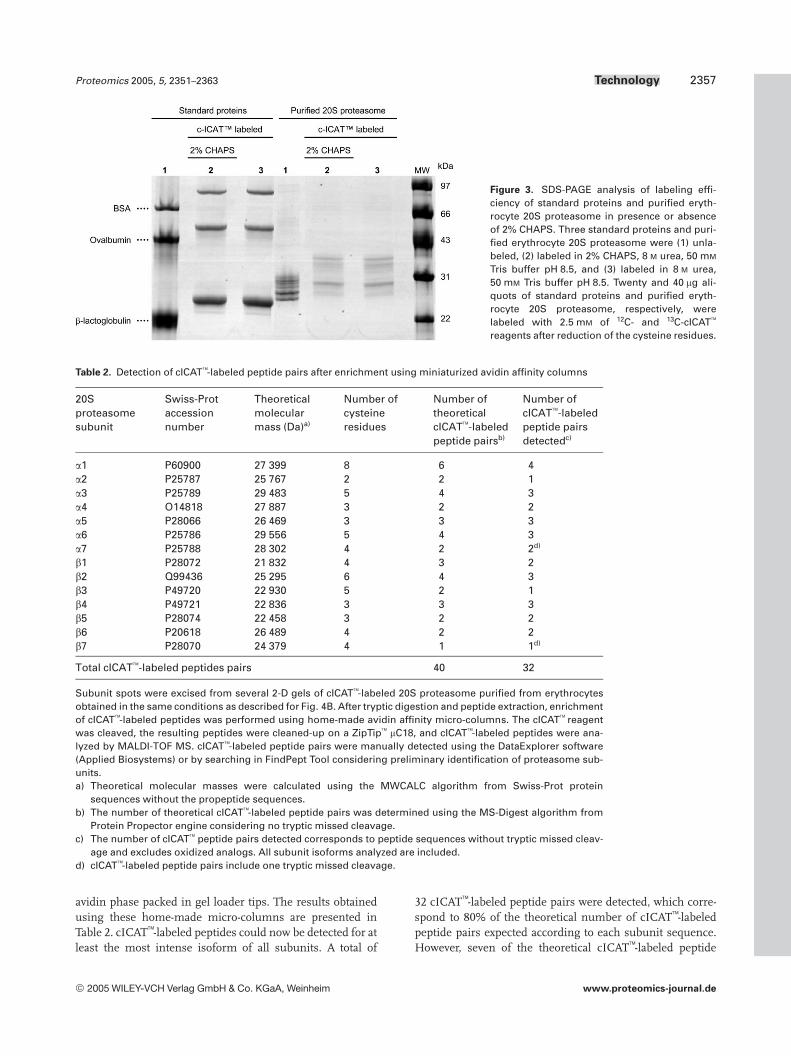
The cICAT reagent final concentration used was 2.5 mM.The presence of 2% CHAPS was then assessed for the alky-lation of standard proteins (LACB, OVAL, and BSA) and ofhuman erythrocyte 20S proteasome samples (Fig. 3). Fig-ure 3 shows that complete alkylation of standard proteins isachieved with or without 2% CHAPS. Alkylation of purified20S proteasome samples is also effective as shown by themass shift of all subunits. Its completeness on individualsubunits, however, requires 2-DE separation to be evaluated.Figure 4 shows the 2-D gels obtained for unlabeled (Fig. 4A)and cICAT-labeled erythrocyte 20S proteasome samples(Fig. 4B and C) using 2% CHAPS in the alkylation step. Thecomparison of the two 2-D gels shows that overall the reso-lution is similar for all separations and that the general sub-unit pattern is shifted towards higher masses for the cICAT-labeled samples. No significant pI shift was observed afteraddition of the cICAT label. This could be expected sincethe alkylation of cysteine residues with a neutral cICATgroup should not modify the charge of the protein [27]. Theamplitude of the observed mass shift of individual spots isconsistent with the number of cysteine residues in eachsubunit (Table 2). Most of the spots are fully alkylated as onlyfew spot ladders corresponding to partially alkylated inter-mediates are detected. A 2% CHAPS concentration was thenfurther used during the denaturation and alkylation steps.
In order to evaluate the reproducibility of 20S protea-some sample alkylation and 2-DE separation, two 2-D gelsare presented in Fig. 4. Figure 4B and 4C correspond to twoerythrocyte 20S cICAT-labeled proteasome samples in a1/1 13C/12C ratio and in a 1/5 13C/12C ratio, respectively.Samples were obtained by mixing 40 mg of heavy (13C)cICAT-labeled and 40 mg of light (12C) cICAT-labeled pro-teasome for the 1/1 13C/12C ratio, and 8 mg of heavy (13C)cICAT-labeled and 40 mg of light (12C) cICAT-labeled pro-teasome for the 1/5 13C/12C ratio. Figure 4 shows good re-producibility of the subunit separation and alkylation effi-ciency for the two experiments. Several other 2-D gels ofcICAT-labeled erythrocyte 20S proteasome aliquots in a1/1 13C/12C ratio were performed, which all showed similarpatterns (data not shown).
3.4 Miniaturization of the avidin affinity
chromatography enrichment step
After 2-DE separation of 20S proteasome subunits, each spotwas excised and in-gel digested. The supernatant was used toidentify each subunit by MALDI PMF. Peptides were thenextracted from the gel and loaded onto an avidin cartridge forcICAT-labeled peptide enrichment. Finally, the biotin moi-ety was cleaved prior to MALDI-MS and MS/MS analyses.Using this protocol only the a1 subunit cICAT-labeled pep-tides could be detected. This result could be explained by theinappropriate size of the column used for the quantities ofprotein available in each 2-D gel spot (around 2 mg for themost intense spots). The affinity chromatography step wasthen performed using smaller quantities of monomeric
2005 WILEY-VCH Verlag GmbH & Co. KGaA, Weinheim www.proteomics-journal.de
Proteomics 2005, 5, 2351–2363 Technology 2357
Figure 3. SDS-PAGE analysis of labeling effi-ciency of standard proteins and purified eryth-rocyte 20S proteasome in presence or absenceof 2% CHAPS. Three standard proteins and puri-fied erythrocyte 20S proteasome were (1) unla-beled, (2) labeled in 2% CHAPS, 8 M urea, 50 mM
Tris buffer pH 8.5, and (3) labeled in 8 M urea,50 mM Tris buffer pH 8.5. Twenty and 40 mg ali-quots of standard proteins and purified eryth-rocyte 20S proteasome, respectively, werelabeled with 2.5 mM of 12C- and 13C-cICAT
reagents after reduction of the cysteine residues.
Table 2. Detection of cICAT-labeled peptide pairs after enrichment using miniaturized avidin affinity columns
20Sproteasomesubunit
Swiss-Protaccessionnumber
Theoreticalmolecularmass (Da)a)
Number ofcysteineresidues
Number oftheoreticalcICAT-labeledpeptide pairsb)
Number ofcICAT-labeledpeptide pairsdetectedc)
a1 P60900 27 399 8 6 4a2 P25787 25 767 2 2 1a3 P25789 29 483 5 4 3a4 O14818 27 887 3 2 2a5 P28066 26 469 3 3 3a6 P25786 29 556 5 4 3a7 P25788 28 302 4 2 2d)
b1 P28072 21 832 4 3 2b2 Q99436 25 295 6 4 3b3 P49720 22 930 5 2 1b4 P49721 22 836 3 3 3b5 P28074 22 458 3 2 2b6 P20618 26 489 4 2 2b7 P28070 24 379 4 1 1d)
Total cICAT-labeled peptides pairs 40 32
Subunit spots were excised from several 2-D gels of cICAT-labeled 20S proteasome purified from erythrocytesobtained in the same conditions as described for Fig. 4B. After tryptic digestion and peptide extraction, enrichmentof cICAT-labeled peptides was performed using home-made avidin affinity micro-columns. The cICAT reagentwas cleaved, the resulting peptides were cleaned-up on a ZipTip mC18, and cICAT-labeled peptides were ana-lyzed by MALDI-TOF MS. cICAT-labeled peptide pairs were manually detected using the DataExplorer software(Applied Biosystems) or by searching in FindPept Tool considering preliminary identification of proteasome sub-units.a) Theoretical molecular masses were calculated using the MWCALC algorithm from Swiss-Prot protein
sequences without the propeptide sequences.b) The number of theoretical cICAT-labeled peptide pairs was determined using the MS-Digest algorithm from
Protein Propector engine considering no tryptic missed cleavage.c) The number of cICAT peptide pairs detected corresponds to peptide sequences without tryptic missed cleav-
age and excludes oxidized analogs. All subunit isoforms analyzed are included.d) cICAT-labeled peptide pairs include one tryptic missed cleavage.
avidin phase packed in gel loader tips. The results obtainedusing these home-made micro-columns are presented inTable 2. cICAT-labeled peptides could now be detected for atleast the most intense isoform of all subunits. A total of
32 cICAT-labeled peptide pairs were detected, which corre-spond to 80% of the theoretical number of cICAT-labeledpeptide pairs expected according to each subunit sequence.However, seven of the theoretical cICAT-labeled peptide
2005 WILEY-VCH Verlag GmbH & Co. KGaA, Weinheim www.proteomics-journal.de

2358 C. Froment et al. Proteomics 2005, 5, 2351–2363
Figure 4. 2-D gels of unlabeled (A) and cICAT-labeled (B and C) human 20S proteasome purifiedfrom erythrocytes. 20S proteasome subunits were separated in the first dimension by IEF using apH 3–10 non-linear IPG strip and in the second dimension by a 12.5% SDS-PAGE gel. The 2-D gelswere stained with CBB. Samples of 20S proteasome purified from erythrocytes were as follows:(A) 40 mg of unlabeled 20S proteasome, (B) a mixture of 40 mg of heavy (13C) cICAT-labeled and40 mg of light (12C) cICAT-labeled proteasome to obtain a 1/1 13C/12C ratio, and (C) a mixture of 8 mgof heavy (13C) cICAT-labeled and 40 mg of light (12C) cICAT-labeled proteasome to obtain a 1/5 13C/12C ratio. All labeled spots from the 2-D gels were identified by MALDI-TOF MS and databasesearch. Quantitative data presented in Table 3 were obtained from MS analyses of cICAT-labeledpeptides of subunit isoforms in square boxes. The MS and MS/MS analyses of the circled 2-D gelspot in B (corresponding to the a1 proteasome subunit) are illustrated in Fig. 5.
pairs possess a molecular mass above 4000 Da after cleavageof the biotin moiety, which may explain why they were notdetected. The use of micro-columns for the avidin affinitychromatography step is a critical improvement in the proto-col for the analysis of 2-D gel spots. The use of an onlineavidin micro-column associated to cation exchange chroma-tography fractionation has previously been proposed for theanalysis of complex protein mixtures at low levels, suggest-ing that this step is also critical for more complex peptidemixture analysis [33].
3.5 Quantitative analyses of cICAT-labeled 20S
proteasome complexes
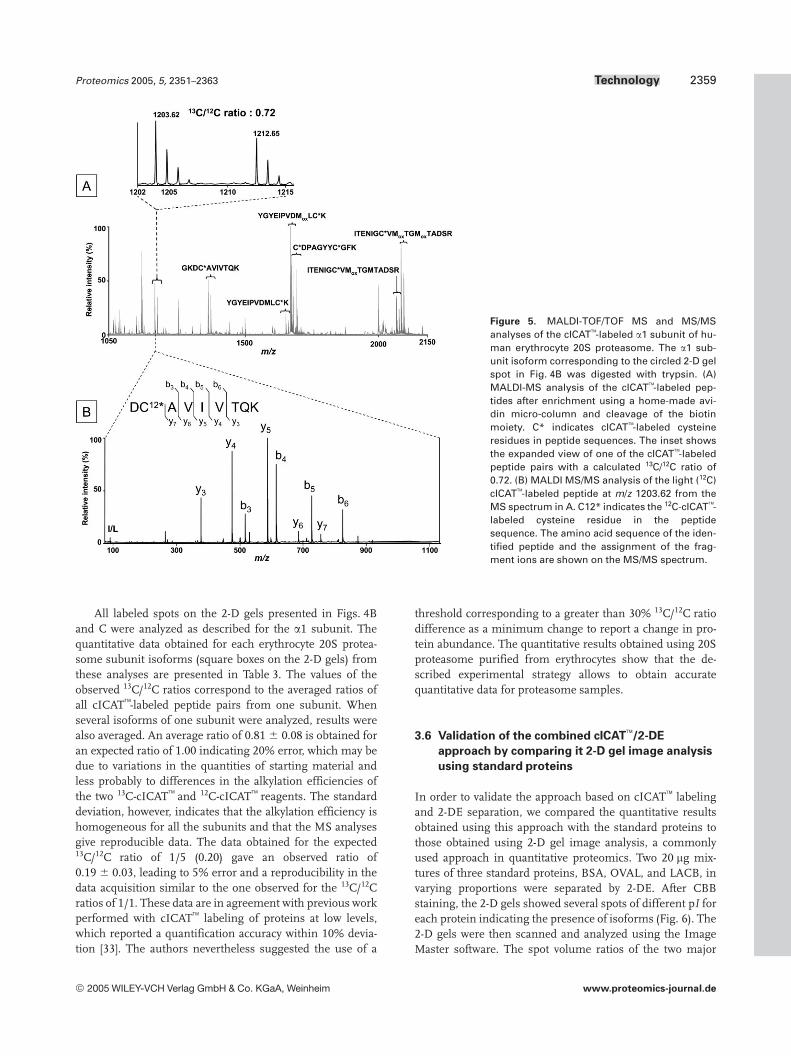
After adapting the alkylation and avidin affinity chromatog-raphy steps to the analysis of low quantities of 20S protea-some samples, 2-D gel spots (Fig. 4B and C) correspondingto cICAT-labeled subunits of erythrocyte 20S proteasome ina 1/1 and 1/5 13C/12C ratio were analyzed to obtain two sets ofquantitative data. These analyses are illustrated in Fig. 5 withthe circled 2-D gel spot in Fig. 4B corresponding to the a1subunit. The MALDI-MS analysis of the cICAT-labeled
peptides after enrichment using a homemade avidin micro-column and cleavage of the biotin moiety (Fig. 5A) displaysseven cICAT-labeled peptide pairs corresponding to fourdistinct peptide sequences, one tryptic missed cleavage, andtwo oxidized analogs. According to the a1 subunit sequencetwo cICAT-labeled peptide pairs were not detected. Thismay be explained by a poor gel extraction efficiency due totheir molecular mass above 4400 Da. Besides, it can benoticed that lower intensity peaks on the spectrum corre-spond to unlabeled peptides resulting from non-specificinteractions with the avidin phase. Because of the low com-plexity of the peptide mixture analyzed, however, the pres-ence of unlabeled peptides does not hinder the detection ofcICAT-labeled peptides. Quantification is then performedon cICAT-labeled peptide pairs as shown in the inset ofFig. 5A by calculating the 13C/12C ratio using the area of eachisotopic cluster given in the peak list of the Data Explorer
software. The 13C/12C ratio determined for this cICAT-labeled peptide pair is 0.72 for an expected ratio of 1, leadingto 28% error that can be expected with the use of ICAT
reagents [33]. The cICAT-labeled peptide sequence is finallyconfirmed by MALDI MS/MS analysis (Fig. 5B).
2005 WILEY-VCH Verlag GmbH & Co. KGaA, Weinheim www.proteomics-journal.de
Proteomics 2005, 5, 2351–2363 Technology 2359
Figure 5. MALDI-TOF/TOF MS and MS/MSanalyses of the cICAT-labeled a1 subunit of hu-man erythrocyte 20S proteasome. The a1 sub-unit isoform corresponding to the circled 2-D gelspot in Fig. 4B was digested with trypsin. (A)MALDI-MS analysis of the cICAT-labeled pep-tides after enrichment using a home-made avi-din micro-column and cleavage of the biotinmoiety. C* indicates cICAT-labeled cysteineresidues in peptide sequences. The inset showsthe expanded view of one of the cICAT-labeledpeptide pairs with a calculated 13C/12C ratio of0.72. (B) MALDI MS/MS analysis of the light (12C)cICAT-labeled peptide at m/z 1203.62 from theMS spectrum in A. C12* indicates the 12C-cICAT-labeled cysteine residue in the peptidesequence. The amino acid sequence of the iden-tified peptide and the assignment of the frag-ment ions are shown on the MS/MS spectrum.
All labeled spots on the 2-D gels presented in Figs. 4Band C were analyzed as described for the a1 subunit. Thequantitative data obtained for each erythrocyte 20S protea-some subunit isoforms (square boxes on the 2-D gels) fromthese analyses are presented in Table 3. The values of theobserved 13C/12C ratios correspond to the averaged ratios ofall cICAT-labeled peptide pairs from one subunit. Whenseveral isoforms of one subunit were analyzed, results werealso averaged. An average ratio of 0.81 6 0.08 is obtained foran expected ratio of 1.00 indicating 20% error, which may bedue to variations in the quantities of starting material andless probably to differences in the alkylation efficiencies ofthe two 13C-cICAT and 12C-cICAT reagents. The standarddeviation, however, indicates that the alkylation efficiency ishomogeneous for all the subunits and that the MS analysesgive reproducible data. The data obtained for the expected13C/12C ratio of 1/5 (0.20) gave an observed ratio of0.19 6 0.03, leading to 5% error and a reproducibility in thedata acquisition similar to the one observed for the 13C/12Cratios of 1/1. These data are in agreement with previous workperformed with cICAT labeling of proteins at low levels,which reported a quantification accuracy within 10% devia-tion [33]. The authors nevertheless suggested the use of a
threshold corresponding to a greater than 30% 13C/12C ratiodifference as a minimum change to report a change in pro-tein abundance. The quantitative results obtained using 20Sproteasome purified from erythrocytes show that the de-scribed experimental strategy allows to obtain accuratequantitative data for proteasome samples.
3.6 Validation of the combined cICAT/2-DE
approach by comparing it 2-D gel image analysis
using standard proteins
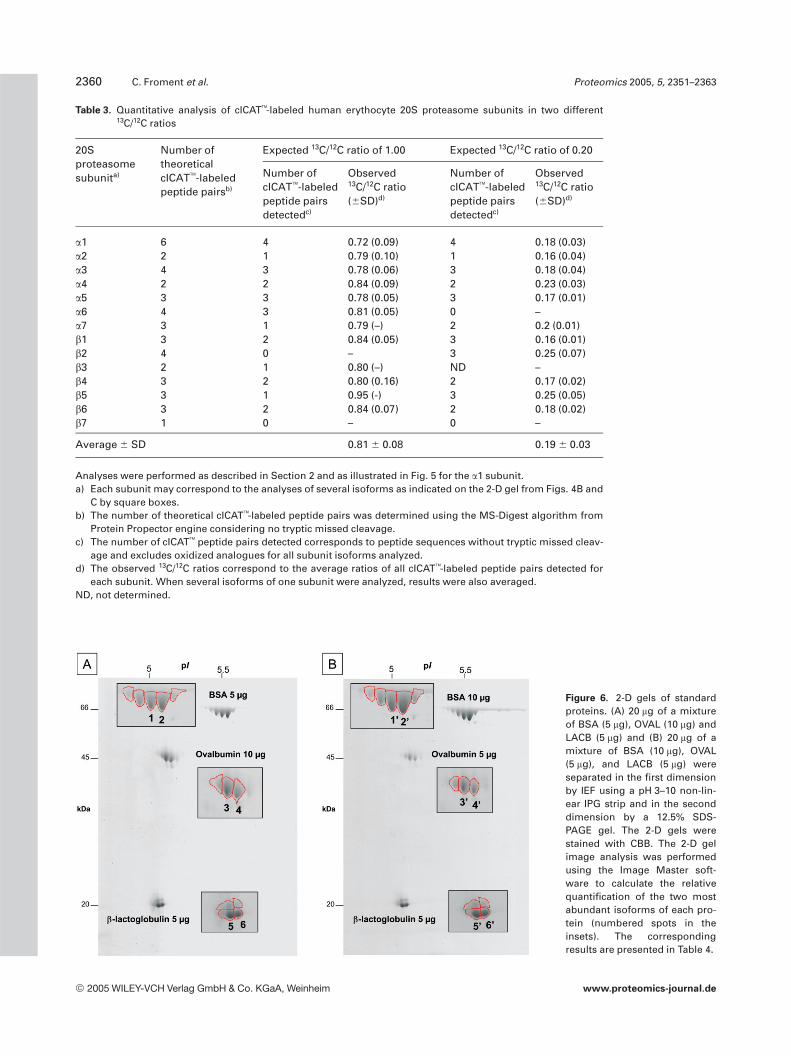
In order to validate the approach based on cICAT labelingand 2-DE separation, we compared the quantitative resultsobtained using this approach with the standard proteins tothose obtained using 2-D gel image analysis, a commonlyused approach in quantitative proteomics. Two 20 mg mix-tures of three standard proteins, BSA, OVAL, and LACB, invarying proportions were separated by 2-DE. After CBBstaining, the 2-D gels showed several spots of different pI foreach protein indicating the presence of isoforms (Fig. 6). The2-D gels were then scanned and analyzed using the ImageMaster software. The spot volume ratios of the two major
2005 WILEY-VCH Verlag GmbH & Co. KGaA, Weinheim www.proteomics-journal.de
2360 C. Froment et al. Proteomics 2005, 5, 2351–2363
Table 3. Quantitative analysis of cICAT-labeled human erythocyte 20S proteasome subunits in two different13C/12C ratios
20Sproteasomesubunita)
Number oftheoreticalcICAT-labeledpeptide pairsb)
Expected 13C/12C ratio of 1.00 Expected 13C/12C ratio of 0.20
Number ofcICAT-labeledpeptide pairsdetectedc)
Observed13C/12C ratio(6SD)d)
Number ofcICAT-labeledpeptide pairsdetectedc)
Observed13C/12C ratio(6SD)d)
a1 6 4 0.72 (0.09) 4 0.18 (0.03)a2 2 1 0.79 (0.10) 1 0.16 (0.04)a3 4 3 0.78 (0.06) 3 0.18 (0.04)a4 2 2 0.84 (0.09) 2 0.23 (0.03)a5 3 3 0.78 (0.05) 3 0.17 (0.01)a6 4 3 0.81 (0.05) 0 –a7 3 1 0.79 (–) 2 0.2 (0.01)b1 3 2 0.84 (0.05) 3 0.16 (0.01)b2 4 0 – 3 0.25 (0.07)b3 2 1 0.80 (–) ND –b4 3 2 0.80 (0.16) 2 0.17 (0.02)b5 3 1 0.95 (-) 3 0.25 (0.05)b6 3 2 0.84 (0.07) 2 0.18 (0.02)b7 1 0 – 0 –
Average 6 SD 0.81 6 0.08 0.19 6 0.03
Analyses were performed as described in Section 2 and as illustrated in Fig. 5 for the a1 subunit.a) Each subunit may correspond to the analyses of several isoforms as indicated on the 2-D gel from Figs. 4B and
C by square boxes.b) The number of theoretical cICAT-labeled peptide pairs was determined using the MS-Digest algorithm from
Protein Propector engine considering no tryptic missed cleavage.c) The number of cICAT peptide pairs detected corresponds to peptide sequences without tryptic missed cleav-
age and excludes oxidized analogues for all subunit isoforms analyzed.d) The observed 13C/12C ratios correspond to the average ratios of all cICAT-labeled peptide pairs detected for
each subunit. When several isoforms of one subunit were analyzed, results were also averaged.ND, not determined.
Figure 6. 2-D gels of standardproteins. (A) 20 mg of a mixtureof BSA (5 mg), OVAL (10 mg) andLACB (5 mg) and (B) 20 mg of amixture of BSA (10 mg), OVAL(5 mg), and LACB (5 mg) wereseparated in the first dimensionby IEF using a pH 3–10 non-lin-ear IPG strip and in the seconddimension by a 12.5% SDS-PAGE gel. The 2-D gels werestained with CBB. The 2-D gelimage analysis was performedusing the Image Master soft-ware to calculate the relativequantification of the two mostabundant isoforms of each pro-tein (numbered spots in theinsets). The correspondingresults are presented in Table 4.
2005 WILEY-VCH Verlag GmbH & Co. KGaA, Weinheim www.proteomics-journal.de
Proteomics 2005, 5, 2351–2363 Technology 2361
isoforms of each protein detected in the two 2-D gels werecalculated using duplicate experiments (Table 4). The resultsindicate 15–30% error, less than 5% error, and less than 10%error between the expected and calculated ratios for isoformsof BSA, OVAL, and LACB, respectively. The error for BSAmay be explained by the multiple isoforms, which appear notto be totally separated on the 2-D gel (Fig. 6) and which maylead to errors in the spot detection. The same standard pro-tein mixtures were then labeled with either the 12C-cICAT
reagent or the 13C-cICAT reagent, mixed, and separated by2-DE. Individual protein spots were excised, destained, andtrypsin digested, the generated peptides were extracted,enriched using avidin affinity chromatography, and analyzedby MALDI-TOF MS. The observed 13C/12C ratios displayed inTable 4 for the three standard proteins show less than 5%error for BSA and OVAL, and 25–30% error for LACB whencompared to the expected ratios. Thus, the comparison of thequantitative data obtained from two independent experi-ments using two different approaches give similar resultswith an error up to 30%. In addition, the standard deviationscalculated for each isoform ratio (Table 4) indicate that theresults obtained with the cICAT labeling approach are moreprecise. The 2-D gel image analysis approach requires sev-eral 2-D gels to be performed and compared, which intro-duces more variations in the results. Finally, for complexmixtures to be compared, overlapping 2-D gel spots mayprevent any quantitative data to be calculated using 2-D gelimage analysis, whereas this is not a limitation using thecICAT labeling approach. Overall, these data validate thecombined cICAT/2-DE strategy for quantitative proteomics.
3.7 Application to the comparison of the 20S
proteasome subunit composition in U937 cells
and human erythrocytes
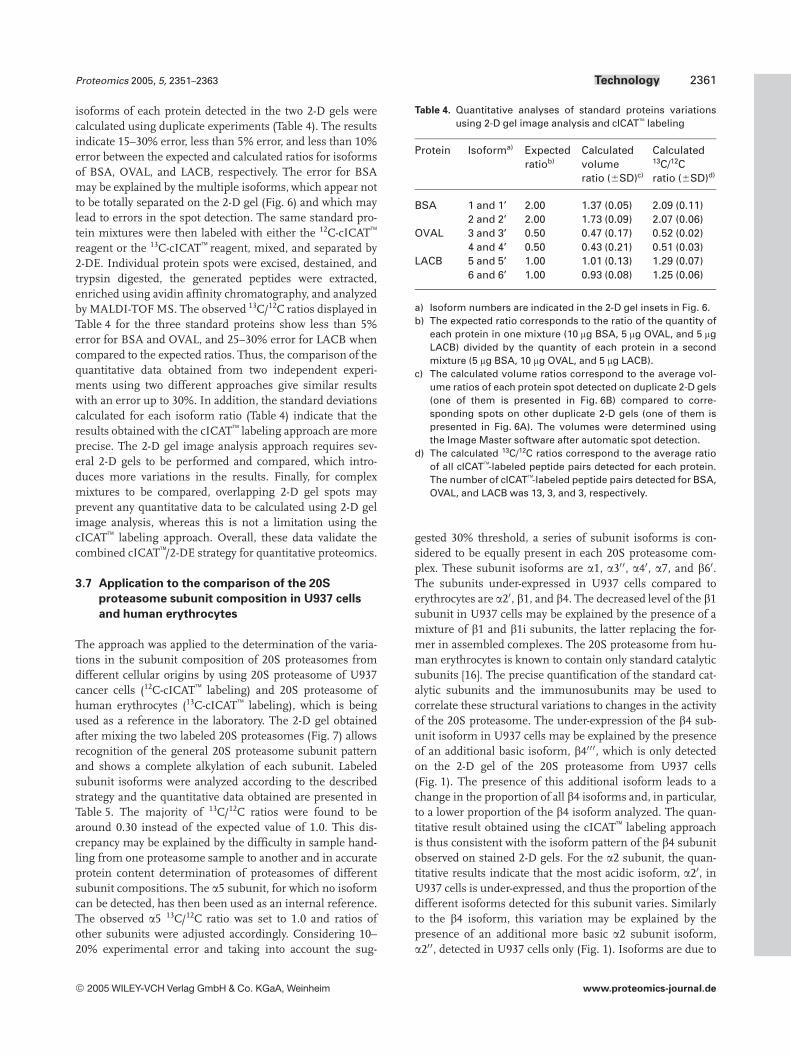
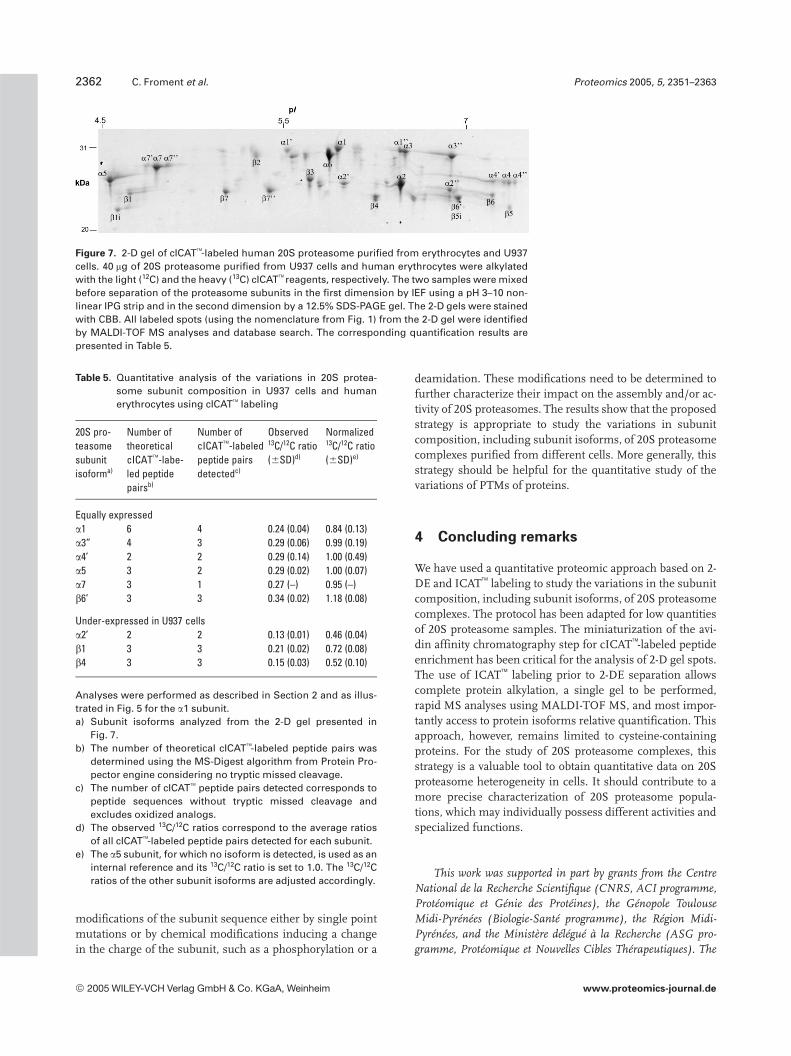
The approach was applied to the determination of the varia-tions in the subunit composition of 20S proteasomes fromdifferent cellular origins by using 20S proteasome of U937cancer cells (12C-cICAT labeling) and 20S proteasome ofhuman erythrocytes (13C-cICAT labeling), which is beingused as a reference in the laboratory. The 2-D gel obtainedafter mixing the two labeled 20S proteasomes (Fig. 7) allowsrecognition of the general 20S proteasome subunit patternand shows a complete alkylation of each subunit. Labeledsubunit isoforms were analyzed according to the describedstrategy and the quantitative data obtained are presented inTable 5. The majority of 13C/12C ratios were found to bearound 0.30 instead of the expected value of 1.0. This dis-crepancy may be explained by the difficulty in sample hand-ling from one proteasome sample to another and in accurateprotein content determination of proteasomes of differentsubunit compositions. The a5 subunit, for which no isoformcan be detected, has then been used as an internal reference.The observed a5 13C/12C ratio was set to 1.0 and ratios ofother subunits were adjusted accordingly. Considering 10–20% experimental error and taking into account the sug-
Table 4. Quantitative analyses of standard proteins variationsusing 2-D gel image analysis and cICAT labeling
Protein Isoforma) Expectedratiob)
Calculatedvolumeratio (6SD)c)
Calculated13C/12Cratio (6SD)d)
BSA 1 and 1’ 2.00 1.37 (0.05) 2.09 (0.11)2 and 2’ 2.00 1.73 (0.09) 2.07 (0.06)
OVAL 3 and 3’ 0.50 0.47 (0.17) 0.52 (0.02)4 and 4’ 0.50 0.43 (0.21) 0.51 (0.03)
LACB 5 and 5’ 1.00 1.01 (0.13) 1.29 (0.07)6 and 6’ 1.00 0.93 (0.08) 1.25 (0.06)
a) Isoform numbers are indicated in the 2-D gel insets in Fig. 6.b) The expected ratio corresponds to the ratio of the quantity of
each protein in one mixture (10 mg BSA, 5 mg OVAL, and 5 mgLACB) divided by the quantity of each protein in a secondmixture (5 mg BSA, 10 mg OVAL, and 5 mg LACB).
c) The calculated volume ratios correspond to the average vol-ume ratios of each protein spot detected on duplicate 2-D gels(one of them is presented in Fig. 6B) compared to corre-sponding spots on other duplicate 2-D gels (one of them ispresented in Fig. 6A). The volumes were determined usingthe Image Master software after automatic spot detection.
d) The calculated 13C/12C ratios correspond to the average ratioof all cICAT-labeled peptide pairs detected for each protein.The number of cICAT-labeled peptide pairs detected for BSA,OVAL, and LACB was 13, 3, and 3, respectively.
gested 30% threshold, a series of subunit isoforms is con-sidered to be equally present in each 20S proteasome com-plex. These subunit isoforms are a1, a30 0, a40, a7, and b60.The subunits under-expressed in U937 cells compared toerythrocytes are a20, b1, and b4. The decreased level of the b1subunit in U937 cells may be explained by the presence of amixture of b1 and b1i subunits, the latter replacing the for-mer in assembled complexes. The 20S proteasome from hu-man erythrocytes is known to contain only standard catalyticsubunits [16]. The precise quantification of the standard cat-alytic subunits and the immunosubunits may be used tocorrelate these structural variations to changes in the activityof the 20S proteasome. The under-expression of the b4 sub-unit isoform in U937 cells may be explained by the presenceof an additional basic isoform, b40 0 0, which is only detectedon the 2-D gel of the 20S proteasome from U937 cells(Fig. 1). The presence of this additional isoform leads to achange in the proportion of all b4 isoforms and, in particular,to a lower proportion of the b4 isoform analyzed. The quan-titative result obtained using the cICAT labeling approachis thus consistent with the isoform pattern of the b4 subunitobserved on stained 2-D gels. For the a2 subunit, the quan-titative results indicate that the most acidic isoform, a20, inU937 cells is under-expressed, and thus the proportion of thedifferent isoforms detected for this subunit varies. Similarlyto the b4 isoform, this variation may be explained by thepresence of an additional more basic a2 subunit isoform,a20 0, detected in U937 cells only (Fig. 1). Isoforms are due to
2005 WILEY-VCH Verlag GmbH & Co. KGaA, Weinheim www.proteomics-journal.de
2362 C. Froment et al. Proteomics 2005, 5, 2351–2363
Figure 7. 2-D gel of cICAT-labeled human 20S proteasome purified from erythrocytes and U937cells. 40 mg of 20S proteasome purified from U937 cells and human erythrocytes were alkylatedwith the light (12C) and the heavy (13C) cICAT reagents, respectively. The two samples were mixedbefore separation of the proteasome subunits in the first dimension by IEF using a pH 3–10 non-linear IPG strip and in the second dimension by a 12.5% SDS-PAGE gel. The 2-D gels were stainedwith CBB. All labeled spots (using the nomenclature from Fig. 1) from the 2-D gel were identifiedby MALDI-TOF MS analyses and database search. The corresponding quantification results arepresented in Table 5.
Table 5. Quantitative analysis of the variations in 20S protea-some subunit composition in U937 cells and humanerythrocytes using cICAT labeling
20S pro-teasomesubunitisoforma)
Number oftheoreticalcICAT-labe-led peptidepairsb)
Number ofcICAT-labeledpeptide pairsdetectedc)
Observed13C/12C ratio(6SD)d)
Normalized13C/12C ratio(6SD)e)
Equally expresseda1 6 4 0.24 (0.04) 0.84 (0.13)a3” 4 3 0.29 (0.06) 0.99 (0.19)a4’ 2 2 0.29 (0.14) 1.00 (0.49)a5 3 2 0.29 (0.02) 1.00 (0.07)a7 3 1 0.27 (–) 0.95 (–)b6’ 3 3 0.34 (0.02) 1.18 (0.08)
Under-expressed in U937 cellsa2’ 2 2 0.13 (0.01) 0.46 (0.04)b1 3 3 0.21 (0.02) 0.72 (0.08)b4 3 3 0.15 (0.03) 0.52 (0.10)
Analyses were performed as described in Section 2 and as illus-trated in Fig. 5 for the a1 subunit.a) Subunit isoforms analyzed from the 2-D gel presented in
Fig. 7.b) The number of theoretical cICAT-labeled peptide pairs was
determined using the MS-Digest algorithm from Protein Pro-pector engine considering no tryptic missed cleavage.
c) The number of cICAT peptide pairs detected corresponds topeptide sequences without tryptic missed cleavage andexcludes oxidized analogs.
d) The observed 13C/12C ratios correspond to the average ratiosof all cICAT-labeled peptide pairs detected for each subunit.
e) The a5 subunit, for which no isoform is detected, is used as aninternal reference and its 13C/12C ratio is set to 1.0. The 13C/12Cratios of the other subunit isoforms are adjusted accordingly.
modifications of the subunit sequence either by single pointmutations or by chemical modifications inducing a changein the charge of the subunit, such as a phosphorylation or a
deamidation. These modifications need to be determined tofurther characterize their impact on the assembly and/or ac-tivity of 20S proteasomes. The results show that the proposedstrategy is appropriate to study the variations in subunitcomposition, including subunit isoforms, of 20S proteasomecomplexes purified from different cells. More generally, thisstrategy should be helpful for the quantitative study of thevariations of PTMs of proteins.
4 Concluding remarks
We have used a quantitative proteomic approach based on 2-DE and ICAT labeling to study the variations in the subunitcomposition, including subunit isoforms, of 20S proteasomecomplexes. The protocol has been adapted for low quantitiesof 20S proteasome samples. The miniaturization of the avi-din affinity chromatography step for cICAT-labeled peptideenrichment has been critical for the analysis of 2-D gel spots.The use of ICAT labeling prior to 2-DE separation allowscomplete protein alkylation, a single gel to be performed,rapid MS analyses using MALDI-TOF MS, and most impor-tantly access to protein isoforms relative quantification. Thisapproach, however, remains limited to cysteine-containingproteins. For the study of 20S proteasome complexes, thisstrategy is a valuable tool to obtain quantitative data on 20Sproteasome heterogeneity in cells. It should contribute to amore precise characterization of 20S proteasome popula-tions, which may individually possess different activities andspecialized functions.
This work was supported in part by grants from the CentreNational de la Recherche Scientifique (CNRS, ACI programme,Protéomique et Génie des Protéines), the Génopole ToulouseMidi-Pyrénées (Biologie-Santé programme), the Région Midi-Pyrénées, and the Ministère délégué à la Recherche (ASG pro-gramme, Protéomique et Nouvelles Cibles Thérapeutiques). The
2005 WILEY-VCH Verlag GmbH & Co. KGaA, Weinheim www.proteomics-journal.de
Proteomics 2005, 5, 2351–2363 Technology 2363
authors would like to thank Caroline Zago for technical assis-tance and Rod Watson of Applied Biosystems for helpful infor-mation and advice.
5 References
[1] Rock, K. L., Goldberg, A. L., Annu. Rev. Immunol. 1999, 17,739–779.
[2] Voorhees, P. M., Dees, E. C., O’Neil, B., Orlowski, R. Z., Clin.Cancer Res. 2003, 9, 6316–6325.
[3] Adams, J., Natl. Rev. Cancer 2004, 4, 349–360.
[4] Bochtler, M., Ditzel, L., Groll, M., Hartmann, C. et al., Annu.Rev. Biophys. Biomol. Struct. 1999, 28, 295–317.
[5] Voges, D., Zwickl, P., Baumeister, W., Annu. Rev. Biochem.1999, 68, 1015–1068.
[6] Tanahashi, N., Murakami, Y., Minami, Y., Shimbara, N. et al.,J. Biol. Chem. 2000, 275, 14336–14345.
[7] Hendil, K. B., Hartmann-Petersen, R., Curr. Protein Pept. Sci.2004, 5, 135–151.
[8] Cascio, P., Call, M., Petre, B. M., Walz, T. et al., EMBO J. 2002,21, 2636–2645.
[9] Morel, S., Levy, F., Burlet-Schiltz, O., Brasseur, F. et al.,Immunity 2000, 12, 107–117.
[10] Van den Eynde, B. J., Morel, S., Curr. Opin. Immunol. 2001,13, 147–153.
[11] Husom, A. D., Peters, E. A., Kolling, E. A., Fugere, N. A. et al.,Arch. Biochem. Biophys. 2004, 421, 67–76.
[12] Macagno, A., Gilliet, M., Sallusto, F., Lanzavecchia, A. et al.,Eur. J. Immunol. 1999, 29, 4037–4042.
[13] Noda, C., Tanahashi, N., Shimbara, N., Hendil, K. B. et al.,Biochem. Biophys. Res. Commun. 2000, 277, 348–354.
[14] Dahlmann, B., Ruppert, T., Kuehn, L., Merforth, S. et al., J.Mol. Biol. 2000, 303, 643–653.
[15] Merforth, S., Kuehn, L., Osmers, A., Dahlmann, B., Int. J.Biochem. Cell Biol. 2003, 35, 740–748.
[16] Claverol, S., Burlet-Schiltz, O., Girbal-Neuhauser, E., Gairin,J. E. et al., Mol. Cell. Proteomics 2002, 1, 567–578.
[17] Bose, S., Stratford, F. L., Broadfoot, K. I., Mason, G. G. et al.,Biochem. J. 2004, 378, 177–184.
[18] Bulteau, A. L., Lundberg, K. C., Humphries, K. M., Sadek, H.A. et al., J. Biol. Chem. 2001, 276, 30057–30063.
[19] Carrard, G., Bulteau, A. L., Petropoulos, I., Friguet, B., Int. J.Biochem. Cell Biol. 2002, 34, 1461–1474.
[20] Uttenweiler-Joseph, S., Burlet-Schiltz, O., Claverol, S., Neu-hauser, E. et al., Mol. Cell. Proteomics 2002, 1, 678.
[21] Froment, C., Uttenweiler-Joseph, S., Bousquet-Dubouch, M.P., Ducoux-Petit, M. et al., Proceedings of the 6th SienaMeeting From Genome to Proteome, August 30-September2, 2004, Siena, Italy, p. 198.
[22] Gygi, S. P., Rist, B., Gerber, S. A., Turecek, F. et al., Nat. Bio-technol. 1999, 17, 994–999.
[23] Ranish, J. A., Yi, E. C., Leslie, D. M., Purvine, S. O. et al., Nat.Genet. 2003, 33, 349–355.
[24] Brand, M., Ranish, J. A., Kummer, N. T., Hamilton, J. et al.,Nat. Struct. Mol. Biol. 2004, 11, 73–80.
[25] Hamdan, M., Righetti, P. G., Mass Spectrom. Rev. 2002, 21,287–302.
[26] Lill, J., Mass Spectrom. Rev. 2003, 22, 182–194.
[27] Patton, W. F., Schulenberg, B., Steinberg, T. H., Curr. Opin.Biotechnol. 2002, 13, 321–328.
[28] Smolka, M., Zhou, H., Aebersold, R., Mol. Cell. Proteomics2002, 1, 19–29.
[29] Wilm, M., Shevchenko, A., Houthaeve, T., Breit, S. et al., Na-ture 1996, 379, 466–469.
[30] Gobom, J., Nordhoff, E., Mirgorodskaya, E., Ekman, R. et al.,J. Mass Spectrom. 1999, 34, 105–116.
[31] De, M., Jayarapu, K., Elenich, L., Monaco, J. J. et al., J. Biol.Chem. 2003, 278, 6153–6159.
[32] Smolka, M. B., Zhou, H., Purkayastha, S., Aebersold, R.,Anal. Biochem. 2001, 297, 25–31.
[33] Hansen, K. C., Schmitt-Ulms, G., Chalkley, R. J., Hirsch, J. etal., Mol. Cell. Proteomics 2003, 2, 299–314.
2005 WILEY-VCH Verlag GmbH & Co. KGaA, Weinheim www.proteomics-journal.de
Copyright © 2022 FDOKUMEN