A proteomic based approach to gain insight into reprogramming of THP-1 cells exposed to Leishmania...
58
Present Address: # Center for Discovery and Innovation in Parasitic Diseases and Department of Pathology, University of California San Francisco, San Francisco, California 94158 ¶ Discovery Biology Group, Institute Pasteur Korea, Sampyeong-dong 696, Bundang-gu, Seongnam-si, Gyeonggi-do 463-400, South Korea, 5 Samsung Medical Center, 81,Irwon-Ro, Gangnam-Gu, Seoul, 135-710, South Korea $ Laborato ́rio Nacional de Biocieˆncias (LNBio), Centro Nacional de Pesquisas em Energias e Materiais (CNPEM), Campinas, Sa ̃o Paulo, Brazil. A proteomic based approach to gain insight into reprogramming of THP-1 cells exposed to 1 Leishmania donovani over an early temporal window 2 3 Alok Kumar Singh 1 , Rajeev Kumar Pandey 2 , Jair Lage Siqueira-Neto 3,# , Yong-Jun Kwon 3,¶ , 4 Lucio H. Freitas-Junior 3,$, Chandrima Shaha 2 and Rentala Madhubala 1* 5 1 School of Life Sciences, Jawaharlal Nehru University, New Delhi, India 6 2 Cell Death and Differentiation Research Laboratory, National Institute of Immunology, New 7 Delhi, India 8 3 Institute Pasteur Korea, South Korea 9 Running Title: Modulation of host cell proteome by L. donovani 10 *Address correspondence to [email protected] 11 IAI Accepted Manuscript Posted Online 17 February 2015 Infect. Immun. doi:10.1128/IAI.02833-14 Copyright © 2015, American Society for Microbiology. All Rights Reserved.
-
Upload
independent -
Category
Documents
-
view
4 -
download
0
Transcript of A proteomic based approach to gain insight into reprogramming of THP-1 cells exposed to Leishmania...

Present Address:
#Center for Discovery and Innovation in Parasitic Diseases and Department of Pathology,
University of California San Francisco, San Francisco, California 94158
¶Discovery Biology Group, Institute Pasteur Korea, Sampyeong-dong 696, Bundang-gu,
Seongnam-si, Gyeonggi-do 463-400, South Korea, 5Samsung Medical Center, 81,Irwon-Ro,
Gangnam-Gu, Seoul, 135-710, South Korea
$Laborato rio Nacional de Biocieˆncias (LNBio), Centro Nacional de Pesquisas em Energias e
Materiais (CNPEM), Campinas, Sa o Paulo, Brazil.
A proteomic based approach to gain insight into reprogramming of THP-1 cells exposed to 1
Leishmania donovani over an early temporal window 2
3
Alok Kumar Singh1, Rajeev Kumar Pandey
2, Jair Lage Siqueira-Neto
3,#, Yong-Jun Kwon
3,¶, 4
Lucio H. Freitas-Junior3,$,
Chandrima Shaha2 and Rentala Madhubala
1* 5
1School of Life Sciences, Jawaharlal Nehru University, New Delhi, India 6
2Cell Death and Differentiation Research Laboratory, National Institute of Immunology, New 7
Delhi, India 8
3Institute Pasteur Korea, South Korea 9
Running Title: Modulation of host cell proteome by L. donovani 10
*Address correspondence to [email protected] 11
IAI Accepted Manuscript Posted Online 17 February 2015Infect. Immun. doi:10.1128/IAI.02833-14Copyright © 2015, American Society for Microbiology. All Rights Reserved.

2
Abstract 12
Leishmania donovani, a protozoan parasite is the causative agent of visceral leishmaniasis. It 13
lives and multiplies within the harsh environment of the macrophages. In order to investigate, 14
how intracellular parasite manipulates the host cell environment, we undertook a quantitative 15
proteomic study of human monocyte derived macrophages (THP-1) following infection with L. 16
donovani. We used isobaric tags for relative and absolute quantification method (iTRAQ) and 17
liquid chromatography-tandem mass spectrometry (LC-MS/MS) to compare the expression 18
profiles in noninfected and L. donovani-infected THP-1 cells. We detected modification of 19
protein expression in key metabolic pathway, including glycolysis and fatty acid oxidation, 20
suggesting a global reprogramming of cell metabolism by the parasite. An increased abundance 21
of proteins involved in gene transcription, RNA splicing (heterogeneous nuclear 22
ribonucleoproteins (hnRNPs), histones, DNA repair and replication was observed at 24 h post 23
infection. Proteins involved in cell survival and signal transduction were more abundant at 24 h 24
post infection. Several of the differentially expressed proteins had not been previously implicated 25
in response to the parasite while the others support the previously identified proteins. Selected 26
proteomics results were validated by real-time PCR and immunoblot analyses. Similar changes 27
were observed in L. donovani-infected human monocyte-derived primary macrophages. The 28
effect of RNA interference (RNAi) mediated gene knock-down of proteins validated the 29
relevance of the host quantitative proteomic screen. Our findings indicate that the host cell 30
proteome is modulated after L. donovani infection and provides evidence for global 31
reprogramming of cell metabolism and demonstrates the complex relations between host-parasite 32
at molecular level. 33
34

3
Introduction 35
Visceral leishmaniasis (VL) is a vector-borne neglected tropical disease caused by an obligate 36
intracellular protozoan parasite Leishmania donovani (1). Infective metacyclic promastigotes 37
infect cells of the monocyte/macrophage lineage where they survive and multiply as intracellular 38
amastigotes in the parasitophorous vacuole, which acts as a safe haven (2). 39
Leishmania has developed an intricate relationship with its host, primarily the cells of 40
monocyte/macrophage lineage where it exploits and subverts host immune system either by 41
inducing immunosuppression or by promoting pro-parasitic host factors to ensure its survival and 42
growth in an otherwise harsh milieu (3). Hijacking innate immune functions of macrophages by 43
Leishmania appears to be a multifarious event as macrophages are inherently evolved to defend 44
host against invading pathogens by a myriad of effectors rather than providing a favorable 45
environment to pathogen. The chief molecular mechanisms by which Leishmania is known to 46
inhibit activation of macrophages towards its own benefit include suppression of deadly 47
antimicrobial free radicals like nitric oxide (NO), faulty antigen presentation, selective induction 48
and suppression of host cell apoptosis, inhibition of cytokine production and hence cytokine-49
inducible macrophage function and activation of T-cells (4–8). Leishmania has evolved 50
sophisticated mechanisms to alter the physiological program and activation of adaptive immune 51
responses of host cells by exploiting host cell signaling mechanisms like down regulation of Ca2+
52
-dependent classical protein kinase C activity and extracellular signal-regulated kinase (ERK) 53
phosphorylation and activity (9, 10). Using mainly host tyrosine phosphatases, Leishmania is 54
known to deactivate mitogen-activated protein kinases (MAPKs) in infected macrophages (5). 55
Extensive manipulations of host cell effector (innate and adaptive) functions by pathogens must 56

4
be reflected at the level of transcripts as well as proteins. Enormous efforts made in the field of 57
host gene expression profiling using different (murine and/or human) cell types and different 58
species of Leishmania provide key insight into an extensive modulation of gene function and 59
contribute to better understanding of the dynamics of gene expression post infection (11–14). 60
This analysis has major limitations, as it does not represent the true effectors of cellular 61
functions-the proteins. 62
A recent study based on comparative proteome analysis revealed differentially expressed 63
proteins in CBA macrophages infected with L. amazonensis or L. major in an effort to identify 64
key proteins likely to play a crucial role in determining the course of infection (15). In the 65
present study we have adopted a quantitative proteomics based approach to get an insight into 66
reprogramming of THP-1 cell line, an acute monocytic leukemia-derived human cell line 67
exposed to L. donovani for different time periods. Activated THP-1 cells have long been used as 68
a versatile model system to study inflammatory responses, host cell apoptosis and autophagy 69
behavior in response to intracellular pathogens (16, 17). It may not completely replicate the in 70
vivo conditions after infection but it is a well established in vitro model system to study host-71
Leishmania interface (18). 72
In the present study, quantitative changes in the dynamics of host proteome status at intervals of 73
12, 24 and 48 h after infection with L. donovani was tracked by isobaric tags for relative and 74
absolute quantification (iTRAQ) followed by high resolution mass spectroscopy (MS). Our data 75
not only provides corroborating evidence for some previously identified specific proteins but is 76
also indicative of a global reprogramming of host metabolic and regulatory events by L. 77
donovani. 78

5
2. Materials and Methods: 79
2.1 Parasites: L. donovani strain AG83 (MHOM/IN/1983/AG83) used in the present study was 80
routinely maintained in BALB/c mice by repeated passage to maintain its virulence. Amastigotes 81
were routinely isolated from the spleen of infected BALB/c mice and were made to undergo 82
transformation from amastigotes to promastigotes, prior to infection as reported earlier (19, 20). 83
Promastigotes of L. donovani AG83 were routinely cultured in modified M199 media (Sigma, St. 84
Louis. MO, USA) supplemented with 10% heat-inactivated fetal bovine serum (FBS; 85
Gibco/BRL, Life Technologies Scotland, UK) and 0.13 mg/ml penicillin and streptomycin at 86
26oC. 87
2.2 Cell culture and Infection: THP-1, an acute monocytic leukemia-derived human cell line 88
(ATCC TIB-202TM), were cultivated in suspension at a density of 105 to 10
6 cells/ml in RPMI-89
1640 (Sigma, St. Louis. MO, USA) medium supplemented with 10% heat inactivated FBS and 90
1% streptomycin/penicillin at 37oC and 5% CO2. PMA (phorbol 12-myristate 13-acetate) 91
(Sigma, St. Louis. MO, USA) treated and subsequently differentiated THP-1 cells act like 92
macrophages and are widely used to study monocyte derived macrophage behavior. The 93
differentiation of THP-1 cells into macrophages was induced by incubating cells for 48 h with 50 94
ng/ml PMA at 37oC, 5% CO2 in flat bottom 6-well tissue culture plates (Greiner Bio-One; 95
Germany). 96
Human peripheral blood mononuclear cells (PBMCs) were isolated using Ficoll Paque 97
(Sigma, St. Louis, MO, USA) density gradient from whole blood collected from healthy donors. 98
Monocyte-derived macrophages (MDM) were isolated as discussed elsewhere (21). Briefly, 99
isolated monocytes were cultured overnight in 6 well plate at a density of 2 x 10⁶ cells per well 100

6
in the presence of the macrophage colony stimulating factor (M-CSF) (300 ng/ml) in RPMI 101
medium with 10% FCS. Non-adherent cells were repeatedly washed and cells were allowed to 102
differentiate into MDMs in the presence of M-CSF and 10% FBS. Differentiated MDMs were 103
harvested after 96 hours. 104
For infection experiments, THP-1 cells as well as MDMs were harvested and distributed 105
at 0.5 x 10⁶ cells/well in six-well plates. Uninfected cells were used as controls. Stationary-phase 106
promastigotes were added to confluent cells at an infection ratio of 20:1 to initiate infection. 107
Excess non-infective promastigotes were removed by washing several times with phosphate 108
buffered saline (PBS). An infection ratio of 20 promastigotes per macrophage was consistently 109
found to be optimal with an average infection ratio of almost 8 parasites per macrophage at 48 h 110
post infection. This infection ratio was hence selected for the following experiments. Infected 111
cells were incubated for different time periods to allow the establishment of infection and 112
transformation and multiplication of the intracellular parasites. 113
2.3 Cell harvest and protein extraction: The uninfected and infected THP-1 cells were 114
harvested by adding 300 µl of 0.05% EDTA per well. Proteins were extracted from cells by 115
frequently washing in ice cold PBS followed by lysis in membrane lysis buffer (Invitrogen, 116
Carlsbad, CA, USA). Briefly, Halt Protease Inhibitor Cocktail (Thermo Fisher Scientific Inc., 117
USA), phenylmethylsulfonyl fluoride (Sigma, St. Louis. MO, USA) and nuclease inhibitor 118
benzonase (Sigma, St. Louis. MO, USA), were added to the lysis buffer. Several freeze thaw 119
cycles were performed in order to completely lyse the cells. Cell lysate was centrifuged at 13000 120
x g for 20 min at 4oC and the supernatant was collected and the protein concentration was 121
determined using a Bio-Rad Proteins assay kit (Bio-Rad Laboratories Inc., Hercules, CA, USA). 122

7
2.4 Quantitative proteomics using iTRAQ labeling and liquid chromatography-tandem 123
mass spectrometry (LC-MS/MS): The iTRAQ labeling was performed as per the 124
manufacturer’s protocol (ABSCIEX Foster City, CA). Briefly, equal amount of protein (100 µg) 125
from control (uninfected THP-1 cells) and infected THP-1 cells were precipitated with acetone. 126
Proteins from each sample were dissolved in 20 µL of dissolution buffer (0.5 M 127
trimethylammonium bicarbonate) and 1 µL of denaturant reagent (2% SDS), reduced for 1 h at 128
60oC with 2 µL reducing agent. Cysteine blocking was performed using 1 µL of cysteine 129
blocking reagent for 10 min at room temperature. The tryptic digestion was performed by adding 130
10 µL of trypsin (Sigma, USA) solution (1µg/µL in double distilled water) followed by 131
incubation for 16 h at 37oC. The peptides were labeled using appropriate iTRAQ labels (-114, -132
115, -116 and -117) (Supplementary Table S1) as per the iTRAQ reagent multiplex kit protocol. 133
Differentially labeled samples were pooled and fractionated using strong cation exchange 134
chromatography. 135
The labeled peptide mixture was separated by strong cation exchange (SCX) chromatography 136
using HPLC (1200 series, Quaternary pumps, Agilent) with a UV detector. The labeled samples 137
were resuspended in SCX low ionic strength buffer (5 mM ammonium formate, 30% acetonitrile 138
(ACN) and loaded onto PolyLC Polysulfoethyl A Zorbax-A SCX column (5 µm (2.1 mm x 150 139
mm), Agilent). Peptide elution was performed by increasing salt concentration (5-500 mM 140
ammonium formate) and detected at an absorbance of 214 nm. Initially, a total of 60 SCX fractions 141
were collected, which in turn were pooled to get 40 fractions. The concatenation (pooling equal interval 142
fractions) strategy was applied to reduce the peptide overlap among SCX fractions. 143

8
After SCX fractionation, the fractions were desalted using desalting columns (ZipTip, Millipore) 144
manually. The eluates were finally concentrated using speedVac™ concentrator 145
(ThermoScientific) prior to analysis by MS. Eluted fractions were further separated by reverse-146
phase chromatography using Nano-LC column (Agilent Technologies, Germany). Mass 147
spectrometric analysis of the column eluate was done using hybrid quadrupole LIT (linear ion 148
trap) mass spectrometer (4000 Q TRAP LC-MS/MS system, ABSCIEX). For collision-induced 149
dissociation (CID) the curtain gas was set at 15 lbs, nitrogen was used as the collision gas and 150
the ionization tip voltage was 2000 V. The Information Dependent Acquisition (IDA) mode of 151
operation was used for the acquisition of a survey scans from 400 to 1600 amu followed by CID 152
of three most intense ions. 153
The peptide MS/MS spectra were extracted using the Analyst®
1.4.2 software (ABSCIEX). The 154
MS/MS spectral data were analyzed for protein identification and quantification using Protein 155
Pilot v.3 software, revision number 114732 (AB SCIEX). Paragon searching algorithm from 156
Protein Pilot was set up to search iTRAQ 4-plex samples as variable modifications and with 157
Methyl methane thiosulfonate (MMTS) as a fixed modification. The detailed information about 158
the Paragon algorithm is reported in the following reference 22. The raw peptide identification 159
results from the Paragon Algorithm (ABSCIEX) searches were further processed by Pro Group 160
Algorithm (ABSCIEX) within the Protein Pilot software before display. The human reference 161
proteome, uniprot_sprot_20081216+Contams.fasta; and L. infantum database, 162
http://tritrypdb.org/release- 4.0 was used for protein identification. Pro Group Algorithm 163
(ABSCIEX) within the Protein Pilot software was used to perform automatic bias-correction to 164
remove variations imparted due to unequal mixing of differentially labeled peptide samples (22). 165
Search effort, through the Pro Group algorithm in Protein Pilot software automatically calculated 166

9
the reporter peak area, effort factor (EF) and p-value. The Proteomics System Performance 167
Evaluation Pipeline incorporated directly in Protein Pilot was employed to conduct target/decoy 168
searches to facilitate false-positive discovery rate (FDR) estimation. A FDR threshold of 5% was 169
employed for identification and quantification. 170
The parameters that were used for identification and quantification of differentially abundant 171
proteins included: (1) proteins identified having ≥ 95% confidence (Unused-Prot Score > 1.3) 172
and a minimum of two peptides; (2) proteins with fold differences ≥ 1.5 or ≤ 0.67 and (3) protein 173
detected in a minimum of two technical replicates. 174
However, a large number of proteins that were significantly modulated in a minimum of 2-3 175
replicates but identified with a single peptide (having >= 95% confidence) were also included in 176
the proteome screen, The correctness of identification was ascertained using the Proteomics System 177
Performance Evaluation Pipeline incorporated directly in Protein Pilot to conduct the false-positive 178
discovery rate estimation for some of the protein that were identified with minimum 1 representative 179
peptide to authenticate the quantification. Although these proteins pass the statistical filter of protein pilot, 180
their differential expression would be tentative. 181
Furthermore, at each time point three biological replicates originating from three different 182
cultures were used to perform quantitative proteomic experiments. Each biological replicate in 183
turn had two different technical replicates represented by THP-1 infected with either Clone 1 184
(C1) or Clone 2 (C2) of AG83 strain. The ratios of peak areas for each of the signature ions were 185
obtained and bias corrected according to the manufacturer’s instructions to account for isotopic 186
overlap (22, 23). The ProGROUP (ABSCIEX) software was used to pool the data from all the 187

10
experiments. A single protein ID was assigned to each protein, thus allowing comparison of 188
replicate datasets. 189
Protein identification, functional classification and possible sub-cellular origin for each protein 190
were performed using Gene Ontology (GO) annotations (http://www.geneontology.org/). The 191
GO provides a set of hierarchical controlled vocabulary split into 3 categories: biological 192
process, cellular component and molecular function that can be manually or electronically 193
assigned to a UniProt KB entry. 194
2.5 RNA preparation and real-time PCR (RT-PCR) analysis: Total RNA was isolated from 195
THP-1 cells and human MDMs, infected or not infected with L. donovani, using Tri reagent 196
(Sigma, St. Louis. MO, USA) treated with RNase-free DNase (Invitrogen Life Technologies, 197
Carlsband, CA, USA) as per the manufacturer’s instruction. Concentration and purity of RNA 198
was determined using nanodrop (Thermo Fisher Scientific, USA). RNA (500 ng) was reverse 199
transcribed using First strand cDNA synthesis kit (Thermo Scientific; Massachusetts, USA). 200
Controls having the same amount of RNA but lacking reverse transcriptase or template were 201
used to rule out the presence of DNA or any other contamination. RT-PCR with gene specific 202
primers was performed on the resulting cDNA using SYBR Fast Green double-stranded DNA 203
binding dye (Applied Biosystems, CA, USA) and the ABI PRISM 700 Sequence Detection 204
System instrument (Applied Biosystems, CA, USA). Accession number of genes used in the 205
study, the primer sequences and the product sizes are given in the Supplementary Table S2. 206
Following cycle was used for PCR amplification: 50oC for 2 min and 95°C followed by 40 207
cycles at 95°C for 30 sec, 62oC for 1 min and 72
oC for 20 sec. The efficiency of primer was 208
assessed by performing 10-fold dilution series experiment with cDNA to get average slope of 209

11
each primer pair (data not shown). The generation of specific PCR product was confirmed by 210
melting curve analysis. All sample analysis was performed in triplicate. Amplification of U6 211
Small nuclear RNA (RNU6A) was used as an internal control. To quantify gene expression, the 212
comparative threshold cycle method for relative quantification (2-ΔΔCT
= n-fold) was used. 213
2.6 RNA interference and intracellular amastigote screening: Gene-knockdown was 214
performed to validate the proteins whose proteomics identification pattern suggested differential 215
expression in uninfected and L. donovani-infected THP-1 cells. 216
Gene knock-down: THP-1 cells were seeded in three 384 wells plates at a confluence of 15,000 217
cells per well in 50 µl of RPMI supplemented with 10% Fetal Bovine Serum (FBS, Gibco, 218
USA), 50 ng/ml of PMA (Sigma; St. Louis. MO, USA) and incubated for 48 h at 37C, 5% CO2. 219
Once differentiated THP-1 cells attached to the bottom of the well, the cells were washed twice 220
with PBS followed by transfection with siRNA (Dharmacon, USA) (Supplementary Table S3). 221
Briefly, transient transfection with siRNAs was carried out using RNAi Max (Invitrogen). For 222
each well, 3.9 µl of serum-free OptiMEM (Invitrogen) and 0.1 µl of RNAi Max were pre-223
incubated for 5 minutes at room temperature. At the same time, 3.5 µl of serum-free OptiMEM 224
were mixed with 0.5 µl of each siRNA (5 µM) and also incubated for 5 minutes at room 225
temperature. These two mixtures were combined and incubated for 20 minutes at room 226
temperature for complex formation. After addition of 42 µl of complete DMEM medium to the 227
mixture, the entire solution was added to the cells in each well resulting in a final concentration 228
of 50 nM of the siRNAs. After transfection, cells were incubated for 48 h to allow gene 229
silencing. The wells were aspirated and 3x10⁵
Leishmania parasites obtained from stationary 230

12
phase culture (5 days after seeding) were added to each well in 50 µL of RPMI supplemented 231
with 10% FBS. 232
Intracellular amastigote screening: The plates were fixed after 12, 24 and 48 h post infection by 233
adding 25 µL of a 2% formaldehyde solution. After incubation for 4 h, the wells were washed 5 234
times with PBS (using BioTek 406 automated liquid handler) and finally 10 ul of 5 µM Draq5 235
(Biostatus DR50200) staining solution was added. The plates were incubated for at least 12 h 236
with the staining solution prior to reading in the Operetta automated fluorescence microscope 237
(Perkin Elmer) with a 635 nm filter at 20x lens magnification. Each well was imaged 5 times and 238
the images were analyzed by the LeishPlugin designed by the IPK-Image Mining Software Suit. 239
The LeishPlugin was able to detect and quantify both host cells and intracellular parasites (24). 240
2.7 SDS-PAGE and Western blotting: Cell lysis was carried out using cell lysis buffer (0.125 241
mol/L Tris, 4% SDS, 20% glycerol, and 10% 2-Mercaptoethanol). CBX protein assay kit (G-242
biosciences, USA) was used to determine the protein concentration. Cell lysate (30-60 µg) was 243
electrophoresed in 12% SDS polyacrylamide gels and transferred onto nitrocellulose membranes 244
at 4oC . Membrane blocking was performed in 5% fat free milk in 0.05% PBS-Tween 20 (PBST) 245
overnight at 4oC. The membranes were incubated with primary antibodies against hnRNP K 246
(R332; 1:1000; Cell Signaling), MAVS (E-3; 1:1000; Santa Cruz Biotechnology), PTPN-6/SHP-247
1 (C-19; 1:1000; Santa Cruz Biotechnology), GRP 78 (A-10; 1:1000; Santa Cruz 248
Biotechnology), HMG-I (EPR7839; 1:10,000; Abcam), Histone H4 (L64C1; Cell Signaling; 249
1:1000) and beta-tubulin (1:5000; Thermo Scientific, US) prepared in PBST at room temperature 250
for 1 h. The blots were subsequently incubated with the secondary antibody conjugated to 251

13
horseradish peroxidase in PBST for 1 h at room temperature. Protein bands were observed on X-252
ray film using enhanced chemiluminiscence kit (G Biosciences, USA) (25). 253
2.8 Ethical statement: All experiments performed on human MDMs were approved by the 254
Institutional Human Ethical Committee of the National Institute of Immunology under the 255
project No. IHEC#84/14. 256
2.9 Statistical analysis: All proteomics results were analyzed and expressed as mean standard 257
error of mean (SEM). Proteins detected and quantified in a minimum of two replicates at each 258
time-point were considered for analysis. One way analysis of variance (ANOVA) was applied to 259
analyze the protein fold abundance at different time points. Student’s t-test was applied to 260
analyze the real-time PCR data and effect of knock-down on infection ratio and intracellular 261
amastigotes. Western blots are representative of three independent experiments. P-values of 262
<0.05 were considered statistically significant. All statistical analyses were performed using 263
GraphPad Prism version 5.01. 264
265

14
3. Results and Discussion 266
3.1 Identification and relative abundance of total number of proteins: Quantitative 267
proteomic approach using isobaric tagging and high resolution mass spectrometry was used to 268
compare differential host proteome abundance in response to L. donovani infection. Proteome 269
comparison of infected and uninfected cells was made at 12, 24 and 48 h post-infection. The 270
major limitation of performing differential host proteome modulation studies where intracellular 271
eukaryotic pathogen is still multiplying inside parasitophorous vacuole (PV) is contaminants 272
originating from pathogenic peptides. To circumvent this issue an equal amount of digested 273
proteins isolated from Leishmania promastigotes used to infect macrophages was mixed to host 274
proteins (uninfected control sample) just before performing peptide labeling using isobaric tags. 275
This kind of approach has earlier been used to normalize any signal related to pathogen proteome 276
(26). Moreover, parasite protein represented relatively a small proportion of the total protein, and 277
any proteins that were of parasite origin were easily detected by MS-identification, thereby 278
ensuring they were not erroneously included in the subsequent analysis. 279
Fig. 1 represents the workflow of the complete experimental strategy followed in this study. 280
Three independent biological replicate experiments were performed to increase the 281
reproducibility and coverage of the total proteins identified. Set A, B and C represent three 282
biological replicates at each time point (Supplementary Table S4). The technical replicates for 283
each set are in turn represented as Group I and II (Supplementary Table S4). A total number of 284
1624 proteins were identified at all three points. 285
Total number of non-redundant proteins identified at 12 h post infection in Set A, B and C were 286
192, 153 and 155 respectively (Supplementary Table S4-A). Further, a total number of 329 non-287

15
redundant proteins (merged data from Set A, B and C) were identified in THP1 cells at 12 h post 288
infection (Supplementary Table S4-B). Total number of proteins identified in THP1 cells at 24 h 289
post infection in Set D, E and F were, 263, 197 and 221 respectively (Supplementary Table S4-290
C). A total number of 441 non-redundant proteins (merged data Set D, E and F) were identified 291
out of which 32 proteins were not quantified while 12 proteins were having unknown function 292
(Supplementary Table S4-D). At 48 h post infection, total number of proteins identified in host 293
cells was 83, 167 and 193 in Set G, H and I respectively (Supplementary Table S4-E). A total 294
number of 310 non-redundant proteins (merged data of Set G, H and I) were identified out of 295
which 29 proteins were not quantified while 4 proteins were having unknown function 296
(Supplementary Table S4-F). Total number of non-redundant proteins identified in this study was 297
637 (Supplementary Table S4-G). The low number of non-redundant proteins identified in the 298
present proteome screen could be attributed to AB Sciex 4000 QTRAP instrument which has 299
relatively lower scan speed (4000 amu/sec) compared to new generation high end mass spectrometers. 300
3.2 Identification and functional annotation of differentially abundant protein signals: 301
Using Gene Ontology (GO) annotations (http://www.geneontology.org/), 9 major functional 302
classes were identified, namely, signal transduction and vesicular trafficking; apoptosis, cell 303
death and differentiation; stress, inflammation and immune response; DNA repair, replication 304
and chromatin remodeling; RNA splicing and transcription regulation; protein folding, 305
modification and synthesis; metabolic pathways; cytoskeleton and proteins with unknown 306
function. The pie diagram shows the percentage distribution of functionally annotated proteins at 307
12, 24 and 48 h post Leishmania infection (Fig. 2 A, B and C). 308

16
3.3 Pattern of differentially abundant proteins: List of differentially modulated proteins in 309
THP-1 cells infected with L. donovani is shown in Supplementary Table 5. A total of 199 host 310
proteins were modulated at 12, 24 and 48 h post Leishmania infection. Supplementary Table 5 311
represents some of the important proteins involved in signal transduction, cell survival responses, 312
immune response, chromatin remodeling and RNA splicing that were critically modulated in 313
macrophages after infection. The number of proteins that showed increased abundance at 12, 24 314
and 48 h in infected THP1 cells as compared to uninfected cells were 35, 69 and 30 respectively 315
(Supplementary Table 5). The number of proteins that were in low abundance was 27, 45 and 40 316
at 12, 24 and 48 h respectively (Supplementary Table 5). Functional distribution of differentially 317
modulated host proteins at 12, 24 and 48 h post Leishmania infection is shown in Fig. 3. Nuclear 318
proteins constituted more than 50% of the total proteins and were high in abundance at 24 h post 319
Leishmania infection (Fig. 3B). Proteins involved in RNA splicing (hnRNPs) and transcription 320
regulation were substantially more abundant at 24 h post infection and this probably represents 321
the most intense phase of transcript-based information reprogramming in the host cells. Histones 322
and proteins involved in chromatin remodeling were highly abundant at all three time points 323
(Fig. 3 A, B and C). This could possibly be an outcome of selective pressure of higher gene 324
expression in infected cells, in order to cater to the need of increased metabolic events. 325
Percentage share of less abundant proteins at 12, 24 and 48 h is shown in Fig. 3 D, E and F 326
respectively. 327
A further classification of differentially abundant proteins based on their origin of sub-cellular 328
location chiefly based on the Gene Ontology (GO) annotations (http://www.geneontology.org/) 329
indicated critical involvement of endoplasmic reticulum (ER), mitochondria and nucleus at 330
different time points during the course of infection and parasite multiplication. Mitochondrial 331

17
and ER resident proteins were in abundance at 48 h post infection (Fig. 4). Majority of nuclear 332
proteins were abundant at all time points; however the number was highest at 24 h after 333
Leishmania infection (Fig. 4). In the present study, transcriptional events represent one of the 334
most important cellular events deregulated at 24 h post infection. 335
A summary list of differentially modulated proteins in THP-1 cells infected with L. donovani 336
when compared to uninfected cells at 12 h, 24 h and 48 h is shown in Table 1. These proteins 337
were further classified into following category: signal transduction, apoptosis, cell death and 338
differentiation, immune and inflammatory response, chromatin remodeling and RNA splicing. 339
We selected representative proteins from each group for further validation by quantitative real-340
time PCR and western blotting. 341
3.4 Leishmania infection modulates heterogeneous nuclear ribonucleoproteins (hnRNPs) in 342
host cells: Regulatory factors involved in alternative splicing include trans-acting proteins 343
(repressors and activators) and corresponding cis-regulatory sites (silencers and enhancers) on 344
the pre-mRNA (27). Heterogeneous nuclear ribonucleoproteins (hnRNPs) are repressors of RNA 345
splicing and act by blocking the access of the spliceosome to the polypyrimidine tract of RNA 346
(28). Apart from their role in splicing these proteins are also involved in mRNA transport 347
regulating secondary structure of pre-mRNA molecules and hence determining its interaction 348
with RNA binding proteins ultimately generating RNA bases information diversity (27). We 349
observed an increased abundance of several hnRNPs like hnRNP K (P61978) (~ 2.6 fold at 24 h) 350
(Fig. 5A), hnRNP A3 (P51991) (~ 2.8 fold) (Fig. 5B) and hnRNP D0 (Q14103) (~ 3.0 fold) (Fig. 351
5C) at 24 h post infection (Table. 1). Relative gene expression pattern of hnRNP K (Fig. 5D), 352
hnRNP A3 (Fig. 5E) and hnRNP D0 (Fig. 5F) was confirmed using quantitative real-time PCR 353

18
in infected THP-1 cells. A consistent and increased expression was observed at all time points 354
though it didn’t reflect the exact protein abundance pattern as identified in the proteomics screen. 355
This could be due to increased stability of the corresponding transcripts. Immunoblot analysis 356
was done to further validate the protein expression of hnRNP K in THP-1 cells after Leishmania 357
infection (Fig. 5G). Maximum expression of hnRNP K was observed at 24 h followed by time 358
dependent decrease in the expression; thereby further validating the proteomics screen results. 359
Heterogeneous nuclear ribonucleoprotein K besides being a transcription factor has a 360
diverse role in pre-mRNA splicing, chromatin remodeling, transcription and translation (29). 361
HnRNPK is a substrate for granzyme (GzmA) and caspases and 362
is cleaved during cell death and its inactivation is a common attribute during apoptosis (30). 363
HnRNP K suppresses apoptosis by suppressing effector caspase-3 and -7 activities by activating 364
caspase inhibitors (31). Role of hnRNP K in host pathogen interaction is well documented in 365
hepatitis B viral replication and hepatitis C virus pathogenesis (32, 33). We further validated the 366
role of hnRNPK by RNAi and assessed the effect of knock-down on parasite infection ratio and 367
proliferation of amastigotes. We performed siRNA mediated knock-down of the gene 368
corresponding to hnRNPK in uninfected THP-1 cells followed by challenge with Leishmania. 369
Quantification of intracellular amastigotes post infection suggested a reduced infection ratio (Fig. 370
6 C) and parasite load (Fig. 6 F) at 48 h post infection, further suggesting the supportive role of 371
hnRNP K in Leishmania infection and proliferation. Microscopy based images showing the 372
effect of knockdown of hnRNP K on infection ratio and intracellular amastigotes is shown in 373
Supplementary Fig. 1. Increased abundance of this protein appears to be a pro-parasitic response, 374
however, the exact molecular mechanism remains to be elucidated. 375

19
3.5 Proteins involved in immune responses: Cells of monocyte-macrophage lineage are the 376
chief source of interleukin 1 (IL-1), the principle mediator of host immune response. Leishmania 377
averts initiation of an effective immune response by suppressing production of cytokines and 378
chemokines involved in pro-inflammatory response (IL-1 and tumor necrosis factor; TNF-α) or 379
in T-cell activation (interleukin-12; IL-12) (3, 34). Leishmania cell surface lipophosphoglycan 380
(LPG) is known to suppress IL-1B transcription by acting through a promoter repression 381
sequence (35). We found lower abundance of IL-1β (P01584) (~ 0.55 fold at 24 h) in this screen 382
further validating the earlier findings reported in vitro experiments (35). Chitinase-3-like protein 383
1 (P36222) (~ 0.5 fold at 24 h, Supplementary Table 5) is secreted by various cell types 384
including macrophages (acts as a Th2 promoting cytokine) and is known to play an important 385
role in inflammatory response and activation of the AKT pro-survival signaling pathway (36, 386
37). CD166 antigen (Q13740), also known as activated leukocyte cell adhesion molecule is a 387
transmembrane glycoprotein and is expressed in activated monocytes (38), showed higher levels 388
(~ 1.7 fold, Supplementary Table 5) at 48 h post infection, possibly promoting cell-cell adhesion 389
and most likely contributing to information exchange in the form of signaling 390
molecule(Supplementary Table 5). 391
Mitochondrial antiviral signaling protein (MAVS) is the first mitochondrial protein known to 392
activate ‘nuclear factor kappa-light-chain-enhancer of activated B cells (NF-ΚB) and ‘interferon 393
regulatory factors’ (IRF3 and IRF7) responsible for synthesis of type-I interferons (IFN-α and 394
IFN-β), an important component of antiviral signaling. Silencing of endogenous MAVS 395
expression by RNAi prevents the activation of NF-κB, IRF3, and IRF7, thus blocking interferon 396
production and promoting viral infection (39). 397

20
Our proteomic screen showed MAVS (Q7Z434) (~ 7.9 fold at 12 h) was significantly abundant 398
in host cells after Leishmania infection (Table 1). In order to ascertain the correctness of 399
identification of a protein having a single peptide, we carried out validation by western blotting 400
and RNAi. Immunoblot analyses were done to further validate the protein expression of MAVS 401
in THP1 cells after Leishmania infection. An increase in MAVS expression was evidenced by 402
western blotting during progressive infection and proliferation of parasites (Fig. 7G). We found a 403
gradual decline in the protein level of MAVS after 48 hours of infection. The RNAi experiment 404
for MAVS indicates a critical pro-parasitic role for this protein during Leishmania-macrophage 405
interaction as knock-down of MAVS was adequate for the reduction of average number of 406
parasites per infected cell only at 48 h post infection (Fig.7F). Microscopy based images showing 407
effect of knock-down of MAVS on infection ratio and intracellular amastigotes is shown in 408
Supplementary Fig. 2. 409
A possible cross-talk of MAVS with the components of NF-κB and IRF signaling pathways for 410
proinflammatory cytokine and type-I IFN production makes it an important regulator of immune 411
response for non-viral pathogens (40). Type-I IFNs exhibit enhanced expression of class I major 412
histocompatibility complex molecules, activation of natural killer cells, production of cytokines 413
and promotes T cells towards Th1 phenotype (41). The role of type-I IFN (IFN-α and IFN-β) by 414
host macrophages infected with L. major has been well documented (42). IFN-α/β has been 415
demonstrated to be responsible for the early induction of NOS2 in L. major infected mouse 416
macrophages. L. major infected dendritic cells (DCs) exhibit type-I IFN (IFN-α and IFN-β) 417
associated upregulation of IRF2, IRF9, STAT1/2 and IFNAR leading to enhanced production of 418
IL-12. However, L. major, but not L. donovani, was found to induce expression of IRF2, IRF7, 419
and IFIT5 thereby ruling out the possible involvement of type-I IFN (IFN-α and IFN-β) signaling 420

21
pathways as mediating factors towards production of IL-12 in L. donovani infected human 421
myeloid derived DCs (43). Our finding further indicates that pro-parasite effect of MAVS is 422
probably independent of type-I IFN (IFN-α and IFN-β) signaling pathways in case of L. 423
donovani infected macrophages. MAVS has been shown to have multitude of functions 424
depending upon the cellular context. Alteration in the expression of MAVS may have differential 425
outcome depending upon its interaction with diverse mitochondrial and/or non-mitochondrial 426
proteins; as MAVS functions are subject to fine tuning by its interactors (44). 427
3.6 Host proteins are involved in signal transduction: Leishmania has evolved sophisticated 428
mechanisms by which it is able to sabotage host defense responses. We found different signaling 429
proteins having altered expression and possibly playing a significant role in Leishmania infection 430
and multiplication (Supplementary Table 5). 431
‘Rho family of GTPases’ (Cdc42, Rac1and RhoA), a subfamily of Ras superfamily are known to 432
organize actin cytoskeleton and regulate phagocytic oxidative burst in macrophages (45). Rac 1 433
and Rho A are associated with phagosome harboring Leishmania and act as an important 434
component of cytoskeleton rearrangement during phagosome assembly (46, 47). Like all 435
GTPases, Rho proteins act as binary switches oscillating between an inactive (GDP-bound) and 436
active (GTP-bound) conformations. GEFs (guanine nucleotide exchange factors) and GAPs 437
(GTPase activating proteins) are involved in activating and inactivating this switch and thus are 438
important regulators of cellular events during phagocytosis and pathogen establishment (46). 439
SH3 domain-binding protein 1 (SH3BP) (Q9Y3L3) demonstrates GAP activity was more 440
abundant in infected cells at 12 h (~ 1.6 fold) thus repressing this switch to facilitate parasite 441
survival. Interestingly, Rab GDP dissociation inhibitor beta (P50395) (~ 0.6 fold at 24 h and ~ 442

22
0.5 fold at 48 h) was found to be in low abundance in the proteomics screen. Rab GDP 443
dissociation inhibitor beta, regulates the GDP/GTP exchange reaction of most Rab proteins and 444
activates the binary switch. These modulations of components of the GTPase mediated signaling, 445
point towards down regulation of the host defense responses against Leishmania infection and 446
proliferation. Guanine nucleotide exchange factors (GEFs) including ‘Rho guanine nucleotide 447
exchange factor 18’ (ARHGEF18) (Q6ZSZ5) are also involved in actin cytoskeleton 448
reorganization and act as guanine nucleotide exchange factor for RAC1, inducing production of 449
reactive oxygen species (ROS) (47). This protein was highly abundant (~ 3.6 fold) at 12 h post-450
infection (Table 1) further suggesting the role of Rho family GTPases in host-Leishmania 451
interaction. Knock-down of the gene corresponding ARHGEF18 suggests the essentiality of this 452
gene during Leishmania infection, as infection ratio as well as total number of amastigotes 453
showed reduction at 48 h post infection in ARHGEF18 depleted THP-1 cells (Fig. 7C). 454
Protein tyrosin phosphatases (PTPs) dephosphorylate a wide variety of phosphoproteins involved 455
in a myriad of signaling events involved in cell growth, differentiation and cell death (48). 456
Tyrosine-protein phosphatase non-receptor type 6 (PTPN6) also known as Src homology region 457
2 domain-containing phosphatase-1 (SHP-1) (P29350) was lower in abundance at 48 h (~ 0.22 458
fold, Table 1) (49). SHP-1 reversibly associates with the IFN-α receptor complex upon IFN 459
stimulation and selectively inhibits JAK/STAT signaling pathway (3). SHP-1 is also known to 460
have inhibitory effect on JAK2, Erk1/Erk2 MAP kinase, NF-κB, IRF-1 and AP-1 which in turn 461
inhibit IFN-γ-inducible macrophage function (5, 50). The pattern of abundance of SHP-1 was 462
observed in two of the replicates and was identified based on a single peptide in the proteomic 463
screen. Expression pattern of SHP-1 was further validated by immunoblot analyses (Fig. 8E). 464
Western blot analysis showed increased expression of SHP1 at 12 h after infection. However, a 465

23
time dependent decrease of SHP1 expression was observed from 24-60 h. It was interesting to 466
find down regulation of SHP-1 as a delayed response in host cells against Leishmania infection. 467
Necroptosis, an alternative form of programmed cell death depends on two structurally related 468
kinases, receptor-interacting serine-threonine kinase (RIPK1) and RIPK3. Activation of RIPK1 469
begins by oligomerization of Fas- associated protein with death domain (FADD) and TNF 470
receptor-associated death domain (TRADD) that is triggered by TNF-α (51). Increased 471
abundance of RIPK1 (Q13546) (~ 3.0 fold at 24 h) suggests a possible involvement of this 472
phenomenon in a subset of macrophages infected with Leishmania. 473
Leishmania promastigotes initially exploit complement or mannose-fucose receptor to enter 474
macrophages a process assisted by Leishmania LPG (3). Newly formed phagosomes harboring 475
Leishmania are partially covered by periphagosomal F-actin that prevents the interaction of early 476
phagosome with late endocytic-lysosomal compartment (52). Similar kind of mechanism has 477
been reported in mycobacterial phagosomes where coronin 1 (F-actin-interacting proteins 478
exclusively expressed in mammalian leukocytes) is involved in preventing fusion of early 479
phagosomes with late endosomes by F-actin recruitment (52, 53). Early phagosomes that retain 480
coronin 1 are resistant to acidification and hence increased pathogen fitness (54). Increased 481
abundance of coronin 1C (Q9ULV4) (~ 2.3 fold at 12 h) during initial phase of host-Leishmaia 482
interaction is an indication of a similar kind of mechanism possibly operating in early 483
phagosomes retaining Leishmania. 484
Transcriptional activator cAMP-responsive element-binding protein 3-like protein 4 (CREB-4) 485
(Q8TEY5) in combination with NF-κB, C/EBPδ and NFAT is involved in transcriptional up 486
regulation of genes that leads to counter stress induced damage (55). CREB-4 was 15.0 fold 487

24
higher at an earlier time point (12 h) after infection and is a possible adaptation mechanism in 488
Leishmania infected macophages against oxidative stress. No detectable levels of CREB-4 were 489
observed at 24 and 48 h post infection. 490
3.7 Proteins involved in cell survival: While programmed cell death or apoptosis is an 491
indispensable mechanism of host cells to counter intracellular pathogens, these pathogens 492
including Leishmania are known to modulate and selectively suppress apoptotic machinery and 493
successfully multiply inside the parasitophorous vacuole (56). 494
Perforin (P14222) induces cell death either in association with granzymes (Gzm A and Gzm B) 495
by forming the pore on target cell while granzymes enter through receptor mediated endocytosis 496
and/or by activating Bid or directly activates caspase-3 (effector caspase) (57). Perforin was 497
higher in abundance (~ 1.75 fold) at 24 h post infection. Annexins can bind to certain membrane 498
phospholipids in a Ca2+
-dependent manner and it is a link between Ca2+
signaling and membrane 499
function. Annexin A5 (P08758), a highly specific ligand for phosphatidylserine, which once 500
exposed to outer surface of plasma membrane, acts as “eat me” signal for phagocytosis and 501
necrotic cells (58). Regardless of higher level of perforin at 24 h, a consistent low abundance of 502
annexin A5 (~ 0.34 fold at 24 h and ~ 0.35 fold at 24 h) clearly indicates a containment of 503
apoptosis in Leishmania infected cells and it appears as a probable competition between pro-504
apoptotic and anti-apoptotic events. 505
Vimentin (P08670) is an organizer of critical proteins involved in attachment, migration, cell 506
signaling, inflammation and apoptosis. It is one of the targets of caspases where its cleavage 507
disrupts association of intermediate filaments and coincides transiently with nuclear 508
fragmentation and facilitates apoptosis (59). Activated human macrophages are known to secrete 509

25
vimentin into the extracellular space. Pro-inflammatory cytokines like TNF-α can trigger its 510
secretion while IL-10 (Th2 cytokine) is known to block its secretion in PKC dependent manner 511
(60). It is essential for replication of foot-and-mouth disease virus and its level has been 512
deregulated during Toxoplasma infection (26, 61). An early lower abundance (~ 0.58 fold at 12 513
h) followed by an augmentation in its abundance (~ 1.74 fold at 24 h and ~ 2.2 fold at 48 h) and 514
gene expression (Fig. 8 A and B) suggests its participation in host response to Leishmania 515
infection and multiplication. 516
We found an increased abundance of several high mobility group (HMG) proteins (Table. 1). 517
HMG proteins act like ‘anti-repressor’ molecules that outcompete the binding of inhibitory 518
proteins (of transcription) to scaffold attachment regions (i.e. SARs) sequences (62). High 519
mobility group protein HMG-I/HMG-Y (P17096) showed increased abundance at all time points 520
(~ 1.56 fold at 12 h, 3.54 fold at 24 h and 5.74 fold at 48 h). These proteins are critical regulators 521
of several genes involved in immune response and signal transduction (most importantly CD44, 522
NOS2, IL2, TNFB, IFNB, COX2 and PKCG) and physically interact with a large number of 523
transcription factors (namely AP-1, IRF-1, NF-κB, C/EBP β, and NF-AT) (62) that are known to 524
play a significant role in host-Leishmania interaction. 525
Mammalian heat shock proteins (HSPs) and glucose regulated proteins (GRPs) are molecular 526
chaperons essentially involved in protein folding, stabilization and translocation under normal 527
and adverse conditions like heat and oxidative stress including infection. ER resident chaperon, 528
78 kDa glucose-regulated protein (GRP78) (P11021) is elevated during glucose starvation, ER 529
Ca2+
depletion, accumulation of mis-folded proteins and reductive stress. A rapid elevation in the 530
cytosolic level of Ca2+
as a result of depletion of Ca2+
from ER is a widely known phenomenon 531

26
during Leishmania infection (3). Initial lower abundance (~ 0.4 fold at 12 h) possibly as a result 532
of decreased production of pro-inflammatory cytokines followed by the increased abundance (~ 533
1.9 fold at 48 h) (Fig. 8C) which can be a direct consequence of increased stress conditions, 534
including unfolded protein response (UPR) and depletion of Ca2+
level further mirrors these 535
events in this study. Further, validation of GRP78 gene expression was done by qRT-PCR of 536
macrophages infected with Leishmania for 12, 24 and 48 h (Fig. 8D). Immunoblot analyses were 537
done to validate the protein expression of HMG-I, vimentin and GRP 78 in THP1 cells after 538
Leishmania infection (Fig. 8E). A time-dependent increase in HMG-I and GRP 78 protein 539
expression was observed in Leishmania infected THP1 cells (Fig. 8E). 540
3.8 Increased abundance of proteins involved in translation: Modulation in host protein 541
synthesis is a widely known event in Toxoplasma infected human fibroblast cells (26). Two 542
important proteins, elongation factor 1-alpha 1 (P68104) (~ 2.29 fold at 12 h and ~ 1.55 fold at 543
24 h) and elongation factor 1-alpha 2 (Q05639) (~ 2.27 fold at 12 h) were more abundant in 544
infected macrophages. Notably elongation factor 1-α in association with ‘poly [ADP-ribose] 545
polymerase 1 (PARP1)’ and ‘protein tyrosine kinase (TXK)’ forms a complex that acts as a T 546
helper 1 (Th1) cell-specific transcription factor to promote IFNG transcription (63). Several 547
ribosomal proteins (both 60s and 40s ribosomal subunits) were high in abundance across 548
different time points after Leishmania infection. A relatively higher abundance of proteins 549
involved in translation appears to be an adaptive mechanism to meet the increasing demand of 550
metabolites and proteins during extended period of parasite multiplication inside host cell. 551
3.9 Histones are highly abundant in infected host cells: We detected a significantly higher 552
level of histone proteins that correlates with increased transcriptional events after Leishmania 553

27
infection. Histone H2A is composed of several non-allelic variants whose composition varies 554
during cell differentiation. Several H2A and H2B proteins were significantly and consistently 555
higher at different time points (Table. 1). Histone H3.3 (P84243) (~ 1.87 fold at 24 h) and 556
Histone H3.2 (Q71DI3) (~ 3.45 fold at 24 h) were the only histone H3 variants more abundant in 557
the infected macrophages. Histone H1x (Q92522) was the only variant of linker histone H1 that 558
was identified in this study (~ 2.0 fold at 24 h). We also found a strong and consistent induction 559
in the level of histone H4 (P62805). Immunoblot analysis showed time-dependent increase in 560
expression of H4 in THP1 infected macrophages (Fig. 8E). 561
3.10 Altered expression pattern of identified proteins in L. donovani infected human 562
monocyte derived macrophages: Since our proteomic screen was done using infected THP1 563
cells that were differentiated to macrophages by treatment with PMA, we decided to validate 564
some of the identified proteins in our proteome screen using, human monocyte derived 565
macrophages (MDM). Real time PCR analyses of hnRP K (Fig. 9A), hnRP A3 (Fig. 9B), hnRP 566
D0 (Fig. 9C), vimentin (Fig. 9D), and GRP78 (Fig. 9E) in human monocyte derived 567
macrophages infected with L. donovani across different time points was done. A significant 568
increase in expression of hnRP K (Fig. 9A), hnRP A3 (Fig. 9B), hnRP D0 (Fig. 9C) was 569
observed at earlier time points (6-12 h) in L. donovani infected human MDMs. Immunoblot 570
analyses was done to further compare and validate the protein expression of hnRNP K, MAVS, 571
HMG-I, vimentin, SHP-1and GRP 78 in human monocyte derived macrophages after 572
Leishmania infection (Fig. 9). A time dependent increase in expression of hnRNP K, MAVS, 573
HMG-I and GRP 78 was observed in human MDMs (Fig. 9F) after Leishmania infection 574
suggesting the possible involvement of these proteins during the course of infection and 575
proliferation of parasites. The pattern of abundance of SHP-1 was also validated by immunoblot 576

28
analyses (Fig. 9 F). SHP-1 showed an initial increase at 12 h then the levels went down at later 577
time points. The real time PCR and western analysis using MDMs, clearly confirms the data 578
obtained with the infected THP1 cells. 579
3.11 Altered expression pattern of metabolic enzymes and their functional significance: In 580
order to survive in the host macrophages, intracellular parasites require highly adaptable 581
physiological and metabolic systems. Earlier reports show a decrease in glycolytic capacity of L. 582
donovani during the course of differentiation (64). At the same time, beta-oxidation, amino acid 583
catabolism, tricarboxylic acid (TCA) cycle, mitochondrial respiration chain, and oxidative 584
phosphorylation capacities are all up-regulated. These results indicate that the differentiating 585
parasite shifts from glucose to fatty acids and amino acids as its main energy source (64). 586
Leishmania promastigotes have also been reported to counter ROS and RNS effects during the 587
initial stage of infection as observed by changes in enzymatic machinery of pathways involved in 588
maintaining redox homeostasis, trypanothione metabolism, oxidative phosphorylation, 589
superoxide metabolism, mitochondrial respiration process and other essential metabolic 590
pathways (65). 591
Metabolomics together with proteomics approaches could form one of the most important 592
post-genomic analyses to reveal changes in metabolic fluxes and identification of biomarkers 593
during the course of pathogenic challenge inside macrophages. In a recent study, using 1H NMR 594
(nuclear magnetic resonance) based metabolic profiling of classically activated (caMΦ), 595
alternatively activated (aaMΦ) and non-activated macrophages (naMΦ), with or without 596
infection with L. major revealed clear metabolic differences between aaMΦ’s, caMΦ’s and 597
naMΦ’s in -infected and uninfected state (66). The internal and external metabolome of L. major 598

29
infected macrophages showed an elevated level of acetate, alanine, pyruvate, succinate and 599
lactate that appeared to be the main end product of intramacrophagial parasites. The enhanced 600
level of creatine (aa, ca. and naMΦ’s) and creatine phosphate (aa and naMΦ’s), in infected 601
macrophages on the other hand reflected the higher energy demand of the macrophages in order 602
to cope with the infection, since creatine phosphate represents a major cellular short-term energy 603
reserve for ATP generation. 604
A similar enhanced state of metabolic status was reflected in the present proteomics 605
screen where a large number of enzymes involved in metabolic pathways were differentially 606
modulated in macrophages in response to infection with L. donovani. Majority of differentially 607
modulated enzymes were involved in glycolysis, Kreb’s cycle, fatty acid oxidation and electron 608
transport reflecting the altered metabolic needs of the infected macrophages (Supplementary 609
Table 5). 610
Glycolysis is critically modulated inside Leishmania infected macrophages: Apart from acting 611
like a safe haven for parasites, parasitophorous vacuole (PV) provides essential nutrients, cations 612
and carbon sources for a successful infection. Leishmania, on the other hand is known to salvage 613
low molecular weight nutrients (hexoses, amino acids, polyamines, purines and vitamins) 614
through their membrane transporters while multiplying inside PV (67). Larger macromolecules 615
like proteins, carbohydrates, DNA and RNA are taken up by parasites directly through 616
endocytosis. Fructose-bisphosphate aldolase A (P04075) is known to bind and sequester Fe (II), 617
a soluble form of iron available in the cellular pool (68), while Leishmania is an excellent iron 618
miner and the uptake of Fe (II) by the parasite plays a key role in amastigote differentiation in 619
PV (69). Lower abundance of this enzyme (~ 0.3 and 0.5 fold at 24 h at 48 h respectively) 620

30
appears to be a host cell adaptation mechanism to deplete the intracellular pool of available iron 621
to the parasite to further resist their proliferation. Nevertheless, lower level of fructose-622
bisphosphate aldolase A can promote entry of the substrate of the enzyme to pentose phosphate 623
pathway, thus generating reducing equivalents (NADPH) and pentoses. 624
Pyruvate kinase M1 / M2 (PKM1 / M2) besides catalyzing the transfer of a phosphoryl group 625
from phosphoenolpyruvate (PEP) to ADP and generating ATP, is also involved in caspase 626
independent cell death of tumor cells (70). Development of hypoxic conditions during infections 627
and inflammatory events is a normal phenotype in cancer tumors and immune effector cells. 628
Leishmania is known to activate mammalian oxygen sensing transcription factor hypoxia 629
inducible factor (HIF-1) for its survival and multiplication inside macrophages (71). PKM2 is 630
known to act as co-activator that stimulates HIF-1 transactivation of target genes involved in 631
glucose uptake and cell survival (72). A sustained lower level of PKM1/M2 appears to be one of 632
the antagonistic mechanisms inside host cells against infection. Lower abundance of another 633
glycolytic enzyme, α-enolase (0.4 and 0.5 fold at 24 and 48 h respectively) during the pay-off 634
phase of the reaction suggests the re-routing the glycolytic reaction intermediates in anabolic 635
pathways to supplement the sustained need of metabolites inside the persistently infected cells. 636
Higher abundance of other key glycolytic enzymes, glyceraldehyde-3-phosphate 637
dehydrogenase (P04406) (~ 1.66 fold) and triose phosphate isomerase (P60174) (~ 1.5 fold) was 638
also observed. 639
Modulation of enzymes in Kreb’s cycle: Kreb’s cycle provides precursors of amino acid 640
biosynthesis as well as the reducing agent NADH used in various biochemical reactions. 641
Fumarate hydrates, mitochondrial (P07954) (~ 1.8 fold at 24 h and 1.3 fold at 48 h) was higher in 642

31
abundance. Malate dehydrogenase was initially lower in abundance but it was induced as 643
infection progressed showed (~ 0.5 fold at 12 h, and~ 1.7 fold at 48 h) and host cells underwent 644
metabolic burden to synthesize a higher amount of amino acid precursor needed to support the 645
parasite proliferation and auxotrophy for several metabolic needs. Another enzyme NAD-646
dependent malic enzyme, mitochondrial (P23368) (~ 1.9 fold at 24 h) acts on malate to form 647
pyruvate, which is accompanied by the production of NADPH, an essential cofactor for fatty 648
acid biosynthesis along with acetyl-CoA through an auxiliary pathway. The increased abundance 649
of these enzymes reflects the need to generate reaction intermediates and reducing power to fuel 650
amino acid biosynthesis and other anabolic pathways. 651
Enzymes involved in β-oxidation of fatty acid are differentially upregulated: Fatty acid 652
oxidation inside mitochondria generates acetyl Co-A which enters TCA cycle while NADH and 653
FADH2 are used in electron transport chain. Key enzymes in this pathway like acyl-CoA 654
dehydrogenase family member 10 (Q6JQN1) (~ 7.0 fold at 12 h), trifunctional enzyme subunit 655
alpha, mitochondrial (P40939) (~ 1.56 fold at 24 h) and 2,4-dienoyl-CoA reductase, 656
mitochondrial (Q16698) (~ 2.0 fold at 12 h) were higher in abundance. This would provide an 657
increased energy (ATP) supply and acetyl-CoA that in conjugation with oxaloacetate can fuel 658
TCA cycle and complement the ever increasing demand of reaction intermediates and reducing 659
power (NADPH). 660
Enzymes involved in electron transport and mitochondrial respiration were up regulated: The 661
shift in pattern of energy production was visible in electron transport where ATP synthase 662
subunit beta, mitochondrial (P06576) (~ 0.47 fold at 12 h and ~ 3.1 fold at 48 h) and cytochrome 663
b-c1 complex subunit 2, mitochondrial (P22695) (~ 1.71 fold at 24 h) showed a consistent higher 664

32
abundance in the infected host cells. This over abundance of some of the key enzymes in 665
mitochondrial respiration indicates the active involvement of host mitochondrial machinery of 666
oxidative phosphorylation in Leishmania infection. 667
In conclusion, our data provides the first comprehensive mechanistic insight into the host 668
proteome dynamics and manipulation of gene regulatory events as one of the mechanisms by 669
which Leishmania is known to command the host defense responses for its own benefit. The host 670
quantitative proteomics modulation screen in combination with RNAi approach has the potential 671
to identify the critical host factors involved in Leishmania infection and multiplication. Future 672
strategies will involve innovative genomics and proteomics approaches to identify potential 673
targetable host factors against Leishmania using different host backgrounds. These studies can 674
become the backbone for intuitive approaches of targeting host components, particularly 675
signaling molecules, which may be important for parasite clearance from the infected host. Since 676
leishmaniasis is a complex of diseases (VL is one among them) with a greater diversity of 677
pathologies caused by different species throughout diverse geographical locations, using a single 678
strain or species to identify host factors and altered mechanisms in a single cell type will not 679
represent the true picture and hence conflicting results. A larger number of studies involving 680
actual patient samples and large number of clinical isolates are need of the hour for host and 681
parasitoproteomic and metabolomic studies to get the true picture of the host parasite interface. 682
Public availability and accessibility of proteomic data: To make our findings publicly 683
available and accessible to the research community, we have submitted our quantification data 684
and the list of proteins and peptides identified to Human Proteinpedia (HUPA, 685

33
www.humanproteinpedia.org) (73, 74). The data can be freely downloaded following the link 686
given below: 687
Experiment details link- http://www.humanproteinpedia.org/data_display?exp_id=00807 688
Download data link - http://www.humanproteinpedia.org/download_data?exp_id=00807 689
690

34
Acknowledgements 691
Rentala Madhubala is a JC Bose National Fellow and is supported by a grant from the 692
Department of Science and Technology, Government of India. Alok K. Singh is a Senior 693
Research Fellow of the Council for Scientific and Industrial Research, Government of India. We 694
would like to acknowledge the usage of the Central Instrumentation Facility (CIF) at School of 695
Life Sciences, Jawaharlal Nehru University. The technical support provided for the data 696
submission at Human Proteinpedia (HUPA, www.humanproteinpedia.org) by Dr. Dipankar 697
Malakar (ABSCIEX, India), Dr. Annu Uppal (ABSCIEX, India), Dr. T. S. Keshava Prasad 698
(Institute of Bioinformatics, Bangalore) and Ms. Jayshree Advani (Institute of Bioinformatics, 699
Bangalore) is acknowledged. 700
701

35
References 702
1. Herwaldt BL. 1999. Leishmaniasis. Lancet 354:1191–1199. 703
2. Bogdan C, Röllinghoff M. 1999. How do protozoan parasites survive inside macrophages? 704
Parasitol. Today Pers. Ed 15:22–28. 705
3. Olivier M, Gregory DJ, Forget G. 2005. Subversion mechanisms by which Leishmania 706
parasites can escape the host immune response: a signaling point of view. Clin. Microbiol. 707
Rev. 18:293–305. 708
4. Proudfoot L, O’Donnell CA, Liew FY. 1995. Glycoinositolphospholipids of Leishmania 709
major inhibit nitric oxide synthesis and reduce leishmanicidal activity in murine 710
macrophages. Eur. J. Immunol. 25:745–750. 711
5. Forget G, Siminovitch KA, Brochu S, Rivest S, Radzioch D, Olivier M. 2001. Role of host 712
phosphotyrosine phosphatase SHP-1 in the development of murine leishmaniasis. Eur. J. 713
Immunol. 31:3185–3196. 714
6. Moore KJ, Matlashewski G. 1994. Intracellular infection by Leishmania donovani inhibits 715
macrophage apoptosis. J. Immunol. Baltim. Md 1950 152:2930–2937. 716
7. Carrera L, Gazzinelli RT, Badolato R, Hieny S, Muller W, Kuhn R, Sacks DL. 1996. 717
Leishmania promastigotes selectively inhibit interleukin 12 induction in bone marrow-718
derived macrophages from susceptible and resistant mice. J. Exp. Med. 183:515–526. 719
8. Reiner NE. 1987. Parasite accessory cell interactions in murine leishmaniasis. I. Evasion 720
and stimulus-dependent suppression of the macrophage interleukin 1 response by 721
Leishmania donovani. J. Immunol. Baltim. Md 1950 138:1919–1925. 722
9. Descoteaux A, Matlashewski G, Turco SJ. 1992. Inhibition of macrophage protein kinase 723
C-mediated protein phosphorylation by Leishmania donovani lipophosphoglycan. J. 724
Immunol. Baltim. Md 1950 149:3008–3015. 725
10. Martiny A, Meyer-Fernandes JR, de Souza W, Vannier-Santos MA. 1999. Altered tyrosine 726
phosphorylation of ERK1 MAP kinase and other macrophage molecules caused by 727
Leishmania amastigotes. Mol. Biochem. Parasitol. 102:1–12. 728
11. Buates S, Matlashewski G. 2001. General suppression of macrophage gene expression 729
during Leishmania donovani infection. J. Immunol. Baltim. Md 1950 166:3416–3422. 730

36
12. Gregory DJ, Sladek R, Olivier M, Matlashewski G. 2008. Comparison of the effects of 731
Leishmania major or Leishmania donovani infection on macrophage gene expression. 732
Infect. Immun. 76:1186–1192. 733
13. Guerfali FZ, Laouini D, Guizani-Tabbane L, Ottones F, Ben-Aissa K, Benkahla A, 734
Manchon L, Piquemal D, Smandi S, Mghirbi O, Commes T, Marti J, Dellagi K. 2008. 735
Simultaneous gene expression profiling in human macrophages infected with Leishmania 736
major parasites using SAGE. BMC Genomics 9:238. 737
14. Ramírez C, Díaz-Toro Y, Tellez J, Castilho TM, Rojas R, Ettinger NA, Tikhonova I, 738
Alexander ND, Valderrama L, Hager J, Wilson ME, Lin A, Zhao H, Saravia NG, 739
McMahon-Pratt D. 2012. Human macrophage response to L. (Viannia) panamensis: 740
microarray evidence for an early inflammatory response. PLoS Negl. Trop. Dis. 6:e1866. 741
15. Menezes JPB, Almeida TF, Petersen ALOA, Guedes CES, Mota MSV, Lima JGB, Palma 742
LC, Buck GA, Krieger MA, Probst CM, Veras PST. 2013. Proteomic analysis reveals 743
differentially expressed proteins in macrophages infected with Leishmania amazonensis or 744
Leishmania major. Microbes Infect. Inst. Pasteur 15:579–591. 745
16. Rose SJ, Bermudez LE. 2014. Mycobacterium avium biofilm attenuates mononuclear 746
phagocyte function by triggering hyperstimulation and apoptosis during early infection. 747
Infect. Immun. 82:405–412. 748
17. Biswas D, Qureshi OS, Lee W-Y, Croudace JE, Mura M, Lammas DA. 2008. ATP-induced 749
autophagy is associated with rapid killing of intracellular mycobacteria within human 750
monocytes/macrophages. BMC Immunol. 9:35. 751
18. Cheekatla SS, Aggarwal A, Naik S. 2012. mTOR signaling pathway regulates the IL-12/IL-752
10 axis in Leishmania donovani infection. Med. Microbiol. Immunol. (Berl.) 201:37–46. 753
19. Mukherjee A, Padmanabhan PK, Singh S, Roy G, Girard I, Chatterjee M, Ouellette M, 754
Madhubala R. 2007. Role of ABC transporter MRPA, gamma-glutamylcysteine synthetase 755
and ornithine decarboxylase in natural antimony-resistant isolates of Leishmania donovani. 756
J. Antimicrob. Chemother. 59:204–211. 757
20. Sharma A, Madhubala R. 2009. Ubiquitin conjugation of open reading frame F DNA 758
vaccine leads to enhanced cell-mediated immune response and induces protection against 759

37
both antimony-susceptible and -resistant strains of Leishmania donovani. J. Immunol. 760
Baltim. Md 1950 183:7719–7731. 761
21. Alanne-Kinnunen M, Lappalainen J, Öörni K, Kovanen PT. 2014. Activated human mast 762
cells induce LOX-1-specific scavenger receptor expression in human monocyte-derived 763
macrophages. PloS One 9:e108352. 764
22. Shilov IV, Seymour SL, Patel AA, Loboda A, Tang WH, Keating SP, Hunter CL, Nuwaysir 765
LM, Schaeffer DA. 2007. The Paragon Algorithm, a next generation search engine that uses 766
sequence temperature values and feature probabilities to identify peptides from tandem 767
mass spectra. Mol. Cell. Proteomics MCP 6:1638–1655. 768
23. Martin B, Brenneman R, Becker KG, Gucek M, Cole RN, Maudsley S. 2008. iTRAQ 769
analysis of complex proteome alterations in 3xTgAD Alzheimer’s mice: understanding the 770
interface between physiology and disease. PloS One 3:e2750. 771
24. Siqueira-Neto JL, Moon S, Jang J, Yang G, Lee C, Moon HK, Chatelain E, Genovesio A, 772
Cechetto J, Freitas-Junior LH. 2012. An image-based high-content screening assay for 773
compounds targeting intracellular Leishmania donovani amastigotes in human 774
macrophages. PLoS Negl. Trop. Dis. 6:e1671. 775
25. Kenedy MR, Vuppala SR, Siegel C, Kraiczy P, Akins DR. 2009. CspA-mediated binding of 776
human factor H inhibits complement deposition and confers serum resistance in Borrelia 777
burgdorferi. Infect. Immun. 77:2773–2782. 778
26. Nelson MM, Jones AR, Carmen JC, Sinai AP, Burchmore R, Wastling JM. 2008. 779
Modulation of the host cell proteome by the intracellular apicomplexan parasite 780
Toxoplasma gondii. Infect. Immun. 76:828–844. 781
27. Black DL. 2003. Mechanisms of alternative pre-messenger RNA splicing. Annu. Rev. 782
Biochem. 72:291–336. 783
28. Tazi J, Bakkour N, Stamm S. 2009. Alternative splicing and disease. Biochim. Biophys. 784
Acta 1792:14–26. 785
29. Michelotti EF, Michelotti GA, Aronsohn AI, Levens D. 1996. Heterogeneous nuclear 786
ribonucleoprotein K is a transcription factor. Mol. Cell. Biol. 16:2350–2360. 787

38
30. Van Domselaar R, Quadir R, van der Made AM, Broekhuizen R, Bovenschen N. 2012. All 788
human granzymes target hnRNP K that is essential for tumor cell viability. J. Biol. Chem. 789
287:22854–22864. 790
31. Xiao Z, Ko HL, Goh EH, Wang B, Ren EC. 2013. hnRNP K suppresses apoptosis 791
independent of p53 status by maintaining high levels of endogenous caspase inhibitors. 792
Carcinogenesis 34:1458–1467. 793
32. Ng LFP, Chan M, Chan S-H, Cheng PC-P, Leung EH-C, Chen W-N, Ren E-C. 2005. Host 794
heterogeneous ribonucleoprotein K (hnRNP K) as a potential target to suppress hepatitis B 795
virus replication. PLoS Med. 2:e163. 796
33. Fan B, Lu K-Y, Reymond Sutandy FX, Chen Y-W, Konan K, Zhu H, Kao CC, Chen C-S. 797
2014. A human proteome microarray identifies that the heterogeneous nuclear 798
ribonucleoprotein K (hnRNP K) recognizes the 5’ terminal sequence of the hepatitis C virus 799
RNA. Mol. Cell. Proteomics MCP 13:84–92. 800
34. Reiner SL, Zheng S, Wang ZE, Stowring L, Locksley RM. 1994. Leishmania promastigotes 801
evade interleukin 12 (IL-12) induction by macrophages and stimulate a broad range of 802
cytokines from CD4+ T cells during initiation of infection. J. Exp. Med. 179:447–456. 803
35. Hatzigeorgiou DE, Geng J, Zhu B, Zhang Y, Liu K, Rom WN, Fenton MJ, Turco SJ, Ho 804
JL. 1996. Lipophosphoglycan from Leishmania suppresses agonist-induced interleukin 1 805
beta gene expression in human monocytes via a unique promoter sequence. Proc. Natl. 806
Acad. Sci. U. S. A. 93:14708–14713. 807
36. Kawada M, Hachiya Y, Arihiro A, Mizoguchi E. 2007. Role of mammalian chitinases in 808
inflammatory conditions. Keio J. Med. 56:21–27. 809
37. Chen C-C, Llado V, Eurich K, Tran HT, Mizoguchi E. 2011. Carbohydrate-binding motif in 810
chitinase 3-like 1 (CHI3L1/YKL-40) specifically activates Akt signaling pathway in 811
colonic epithelial cells. Clin. Immunol. Orlando Fla 140:268–275. 812
38. Lunter PC, van Kilsdonk JWJ, van Beek H, Cornelissen IMHA, Bergers M, Willems 813
PHGM, van Muijen GNP, Swart GWM. 2005. Activated leukocyte cell adhesion molecule 814
(ALCAM/CD166/MEMD), a novel actor in invasive growth, controls matrix 815
metalloproteinase activity. Cancer Res. 65:8801–8808. 816

39
39. Seth RB, Sun L, Ea C-K, Chen ZJ. 2005. Identification and characterization of MAVS, a 817
mitochondrial antiviral signaling protein that activates NF-kappaB and IRF 3. Cell 818
122:669–682. 819
40. Buss C, Opitz B, Hocke AC, Lippmann J, van Laak V, Hippenstiel S, Krüll M, Suttorp N, 820
Eitel J. 2010. Essential role of mitochondrial antiviral signaling, IFN regulatory factor 821
(IRF)3, and IRF7 in Chlamydophila pneumoniae-mediated IFN-beta response and control 822
of bacterial replication in human endothelial cells. J. Immunol. Baltim. Md 1950 184:3072–823
3078. 824
41. Belardelli F, Gresser I. 1996. The neglected role of type I interferon in the T-cell response: 825
implications for its clinical use. Immunol. Today 17:369–372. 826
42. Mattner J, Schindler H, Diefenbach A, Röllinghoff M, Gresser I, Bogdan C. 2000. 827
Regulation of type 2 nitric oxide synthase by type 1 interferons in macrophages infected 828
with Leishmania major. Eur. J. Immunol. 30:2257–2267. 829
43. Favila MA, Geraci NS, Zeng E, Harker B, Condon D, Cotton RN, Jayakumar A, Tripathi V, 830
McDowell MA. 2014. Human dendritic cells exhibit a pronounced type I IFN signature 831
following Leishmania major infection that is required for IL-12 induction. J. Immunol. 832
Baltim. Md 1950 192:5863–5872. 833
44. Belgnaoui SM, Paz S, Hiscott J. 2011. Orchestrating the interferon antiviral response 834
through the mitochondrial antiviral signaling (MAVS) adapter. Curr. Opin. Immunol. 835
23:564–572. 836
45. Etienne-Manneville S, Hall A. 2002. Rho GTPases in cell biology. Nature 420:629–635. 837
46. Morehead J, Coppens I, Andrews NW. 2002. Opsonization modulates Rac-1 activation 838
during cell entry by Leishmania amazonensis. Infect. Immun. 70:4571–4580. 839
47. Niu J, Profirovic J, Pan H, Vaiskunaite R, Voyno-Yasenetskaya T. 2003. G Protein 840
betagamma subunits stimulate p114RhoGEF, a guanine nucleotide exchange factor for 841
RhoA and Rac1: regulation of cell shape and reactive oxygen species production. Circ. Res. 842
93:848–856. 843
48. Zhang ZY. 2001. Protein tyrosine phosphatases: prospects for therapeutics. Curr. Opin. 844
Chem. Biol. 5:416–423. 845

40
49. Beghini A, Ripamonti CB, Peterlongo P, Roversi G, Cairoli R, Morra E, Larizza L. 2000. 846
RNA hyperediting and alternative splicing of hematopoietic cell phosphatase (PTPN6) gene 847
in acute myeloid leukemia. Hum. Mol. Genet. 9:2297–2304. 848
50. Contreras I, Gómez MA, Nguyen O, Shio MT, McMaster RW, Olivier M. 2010. 849
Leishmania-induced inactivation of the macrophage transcription factor AP-1 is mediated 850
by the parasite metalloprotease GP63. PLoS Pathog. 6:e1001148. 851
51. Shindo R, Kakehashi H, Okumura K, Kumagai Y, Nakano H. 2013. Critical contribution of 852
oxidative stress to TNFα-induced necroptosis downstream of RIPK1 activation. Biochem. 853
Biophys. Res. Commun. 436:212–216. 854
52. Lodge R, Descoteaux A. 2005. Modulation of phagolysosome biogenesis by the 855
lipophosphoglycan of Leishmania. Clin. Immunol. Orlando Fla 114:256–265. 856
53. Pieters J. 2008. Coronin 1 in innate immunity. Subcell. Biochem. 48:116–123. 857
54. Seto S, Tsujimura K, Koide Y. 2012. Coronin-1a inhibits autophagosome formation around 858
Mycobacterium tuberculosis-containing phagosomes and assists mycobacterial survival in 859
macrophages. Cell. Microbiol. 14:710–727. 860
55. Gerlo S, Kooijman R, Beck IM, Kolmus K, Spooren A, Haegeman G. 2011. Cyclic AMP: a 861
selective modulator of NF-κB action. Cell. Mol. Life Sci. CMLS 68:3823–3841. 862
56. Heussler VT, Küenzi P, Rottenberg S. 2001. Inhibition of apoptosis by intracellular 863
protozoan parasites. Int. J. Parasitol. 31:1166–1176. 864
57. Trapani JA, Smyth MJ. 2002. Functional significance of the perforin/granzyme cell death 865
pathway. Nat. Rev. Immunol. 2:735–747. 866
58. Gerke V, Creutz CE, Moss SE. 2005. Annexins: linking Ca2+ signalling to membrane 867
dynamics. Nat. Rev. Mol. Cell Biol. 6:449–461. 868
59. Byun Y, Chen F, Chang R, Trivedi M, Green KJ, Cryns VL. 2001. Caspase cleavage of 869
vimentin disrupts intermediate filaments and promotes apoptosis. Cell Death Differ. 8:443–870
450. 871
60. Mor-Vaknin N, Punturieri A, Sitwala K, Markovitz DM. 2003. Vimentin is secreted by 872
activated macrophages. Nat. Cell Biol. 5:59–63. 873

41
61. Gladue DP, O’Donnell V, Baker-Branstetter R, Holinka LG, Pacheco JM, Fernández Sainz 874
I, Lu Z, Ambroggio X, Rodriguez L, Borca MV. 2013. Foot-and-mouth disease virus 875
modulates cellular vimentin for virus survival. J. Virol. 87:6794–6803. 876
62. Reeves R. 2001. Molecular biology of HMGA proteins: hubs of nuclear function. Gene 877
277:63–81. 878
63. Maruyama T, Nara K, Yoshikawa H, Suzuki N. 2007. Txk, a member of the non-receptor 879
tyrosine kinase of the Tec family, forms a complex with poly(ADP-ribose) polymerase 1 880
and elongation factor 1alpha and regulates interferon-gamma gene transcription in Th1 881
cells. Clin. Exp. Immunol. 147:164–175. 882
64. Rosenzweig D, Smith D, Opperdoes F, Stern S, Olafson RW, Zilberstein D. 2008. 883
Retooling Leishmania metabolism: from sand fly gut to human macrophage. FASEB J. Off. 884
Publ. Fed. Am. Soc. Exp. Biol. 22:590–602. 885
65. Sardar AH, Kumar S, Kumar A, Purkait B, Das S, Sen A, Kumar M, Sinha KK, Singh D, 886
Equbal A, Ali V, Das P. 2013. Proteome changes associated with Leishmania donovani 887
promastigote adaptation to oxidative and nitrosative stresses. J. Proteomics 81:185–199. 888
66. Lamour SD, Choi B-S, Keun HC, Müller I, Saric J. 2012. Metabolic characterization of 889
Leishmania major infection in activated and nonactivated macrophages. J. Proteome Res. 890
11:4211–4222. 891
67. McConville MJ, de Souza D, Saunders E, Likic VA, Naderer T. 2007. Living in a 892
phagolysosome; metabolism of Leishmania amastigotes. Trends Parasitol. 23:368–375. 893
68. Spasojević I, Mojović M, Blagojević D, Spasić SD, Jones DR, Nikolić-Kokić A, Spasić 894
MB. 2009. Relevance of the capacity of phosphorylated fructose to scavenge the hydroxyl 895
radical. Carbohydr. Res. 344:80–84. 896
69. Mittra B, Andrews NW. 2013. IRONy OF FATE: role of iron-mediated ROS in Leishmania 897
differentiation. Trends Parasitol. 29:489–496. 898
70. Steták A, Veress R, Ovádi J, Csermely P, Kéri G, Ullrich A. 2007. Nuclear translocation of 899
the tumor marker pyruvate kinase M2 induces programmed cell death. Cancer Res. 900
67:1602–1608. 901

42
71. Singh AK, Mukhopadhyay C, Biswas S, Singh VK, Mukhopadhyay CK. 2012. Intracellular 902
pathogen Leishmania donovani activates hypoxia inducible factor-1 by dual mechanism for 903
survival advantage within macrophage. PloS One 7:e38489. 904
72. Luo W, Hu H, Chang R, Zhong J, Knabel M, O’Meally R, Cole RN, Pandey A, Semenza 905
GL. 2011. Pyruvate kinase M2 is a PHD3-stimulated coactivator for hypoxia-inducible 906
factor 1. Cell 145:732–744. 907
73. Kandasamy K, Keerthikumar S, Goel R, Mathivanan S, Patankar N, Shafreen B, Renuse S, 908
Pawar H, Ramachandra YL, Acharya PK, Ranganathan P, Chaerkady R, Keshava Prasad 909
TS, Pandey A. 2009. Human Proteinpedia: a unified discovery resource for proteomics 910
research. Nucleic Acids Res. 37:D773–781. 911
74. Prasad TSK, Kandasamy K, Pandey A. 2009. Human Protein Reference Database and 912
Human Proteinpedia as discovery tools for systems biology. Methods Mol. Biol. Clifton NJ 913
577:67–79. 914
915
916
917
918
919
920
921

43
Figure Legends 922
Fig. 1: Work-flow of the experimental strategy used in the study. Inf: infection 923
Fig. 2: Pie-diagram showing functional annotation and relative distribution of the total proteins 924
detected in THP-1 cells infected with L. donovani. 9 major functional classes were identified 925
depending on their cellular function using iTRAQ methodology as described in the methods 926
section. Percentage distribution of the functionally annotated host proteins at A: 12 h; B: 24 h 927
and C: 48 h after Leishmania infection. 928
Fig. 3: Functional distribution of differentially modulated host proteins (more and less abundant 929
proteins) at 12, 24 and 48 h after Leishmania infection. A, B and C represent percentage share of 930
more abundant proteins at 12, 24 and 48 h post infection. D, E and F represent percentage share 931
of less abundant proteins at 12, 24 and 48 h respectively. 932
Fig. 4: Gene ontology based classification of differentially abundant proteins present in different 933
intracellular compartments. 934
Fig. 5: Bar diagram showing differential abundance of A: hnRNP K, B: hnRNP A3 and C: 935
hnRNP D0 protein levels in host macrophages after Leishmania infection at different time points. 936
One way analysis of variance (ANOVA) was applied to analyze the fold abundance for 937
proteomics data. The expression pattern of genes was assessed in infected cells at different time 938
points after Leishmania infection by qRT-PCR D: hnRNP K, E: hnRNP A3 and F: hnRNP D0 939
Real time PCR data represents mean of three independent experiments. Student’s t-test was 940
applied to analyze the data. U6 Small RNA (RNU6A) was used as an internal control. Data 941
analysis was performed using 2-∆∆Ct
method. *, (P <0.05), Inf: Infection; h: time in hours. G: 942

44
Western blot showing time dependent expression of hnRNP K in THP-1 cells infected with L. 943
donovani. Beta tubulin was used as a loading control. Densitometric analysis showing –fold 944
change in expression in infective THP1 cells with respect to untreated control group is shown. 945
The data is representative of three independent experiments. 946
Fig. 6 Bar diagram showing effect of gene knockdown of hnRNP K on variation of infection 947
ratio at A: 12 h, B: 24 h C: 48 h. Average no. of parasite/infected cell at D: 12 h, E: 24 h, F: 48 h 948
Results are representative data from three separate experiments. Student’s two-tailed t-test was 949
applied to analyze the data. * P (<0.05). Inf.: infected; transf: transfection. 950
Fig. 7 Bar diagram showing effect of gene knockdown of ARHGEF18 (rho guanine nucleotide 951
exchange factor 18) and MAVS (mitochondrial antiviral-signaling protein) on variation of 952
infection ratio at A: 12 h; B: 24 h C: 48 h. Average no. of parasite/infected cell at D: 12 h; E: 24 953
h; F: 48 h. Results are representative data from three separate experiments. Student’s two-tailed 954
t-test was applied to analyze the data. * P (<0.05). Inf.: infected; transf: transfection. G: Western 955
blot showing time dependent expression of MAVS in THP-1 cells infected with L. donovani. 956
Beta tubulin was used as a loading control. Densitometric analysis showing –fold change in 957
expression in infective THP1 cells with respect to untreated control group is shown. The data is 958
representative of three independent experiments. 959
Fig. 8 Bar diagram showing differential abundance of A: vimentin, C: 78 kDa glucose regulated 960
protein at different time points post Leishmania infection. The expression pattern of genes was 961
assessed in infected cells at different time points after Leishmania infection by qRT-PCR. B: 962
vimentin; D: 78 kDa glucose regulated protein. One way analysis of variance (ANOVA) was 963
applied to analyze the fold abundance for proteomics data. Real time PCR data represents mean 964

45
of three independent experiments. Student’s t-test was applied to analyze the data. U6 Small 965
RNA (RNU6A) was used as an internal control. Data analysis was performed using 2-∆∆Ct
966
method. *,(P <0.05). Inf: Infection; h: time in hours. E: Western blot of proteins PTPN6/SHP-1, 967
GRP78, HMGI and histone H4 across different time points in THP-1 cells infected with L. 968
donovani. Beta tubulin was used as a loading control. Densitometric analysis showing –fold 969
change in expression in infective THP1 cells with respect to untreated control group is shown. 970
The data is representative of three independent experiments. 971
Fig. 9. Real time PCR analyses of hnRP K (A), hnRP A3 (B), hnRPD0 (C), vimentin (D), and 972
GRP78 (E) across different time points in human monocyte derived macrophages infected with 973
L. donovani. The data are representative of three different biological experiment replicates. 974
Student’s t-test was applied to analyze the data. U6 Small RNA (RNU6A) was used as an 975
internal control. Data analysis was performed using 2-∆∆Ct
method. *,(P <0.05). F: Western 976
blots for hnRNP K, MAVS, PTPN 6/SHP-1, GRP 78, and HMG I. Beta tubulin was used as 977
loading control. Densitometric analysis showing –fold change in expression in infective THP1 978
cells with respect to untreated control group is shown. The data are representative of three 979
independent experiments. 980
981
982
. 983
984
985

PMA ( phorbol 12-myristate 13-acetate) induced activation of THP-1 cells for 48 h
THP-1 cell harvested at 12, 24 and 48 h
Cell lysis and total protein extraction
Trypsin mediated protein digestion and peptide labeling using
iTRAQ reagents (isobaric labels -114, -115. -116 and -117)
Uninfected control Inf. 12h Inf. 24h Inf. 48h
(Mixing of the Samples, SCX Fractionation, LC-MS/MS
Analysis)
Protein Classification
(GO Annotation) Validation Strategies
(qRT-PCR , Immunoblotting, and RNAi)
Fig 1
Infection with Leishmania donovani for 6 h

12%
9%
6%
8%
17% 16%
19%
11%
2%
Signal transduction andvesicular trafficking
Apoptosis,cell death anddifferentiation
Stress, inflammtion andimmune response
DNA repair, replication andchromatin remodeling
RNA splicing andtranscription regulation
Protein folding,modification and synthesis
Metabolic pathways
Cytoskeleton
Unknown function
15%
7%
5%
10%
14% 19%
15%
12%
3%
12%
8%
7%
6%
12%
20%
17%
17%
1%
B
Fig. 2
C
A

Metabolic
Pathways
(9%)
Metabolic
pathways
(10%)
Metabolic
pathways
(7%)
Cytoskeleton
(20%) Cytoskeleton
(7.5%)
Cytoskeleton
(21%)
Transport and
vesicular trafficking
(6%)
Transport and
vesicular trafficking
(1.5%)
Signal
Transduction
(9%)
Signal
Transduction
(6%)
Signal
Transduction
(3.3%)
Apoptosis, cell death
and differentiation
(12%)
Apoptosis, cell death
and differentiation
(8%)
Apoptosis, cell death
and differentiation
(23%)
Stress response,
inflammation
and immune response
(7%)
Stress response, inflammation
and immune response
(5%)
Stress response,
inflammation
and immune response
(3%)
DNA repair,
replication,
histones
and chromatin
Remodeling
(15%)
DNA repair,
replication,
histones
and chromatin
Remodeling
(27%)
DNA repair,
replication,
histones
and chromatin
Remodeling
(20%)
RNA Splicing,
transcription
and cell cycle regulation
(12%)
RNA Splicing,
transcription
and cell cycle regulation
(27%)
RNA Splicing,
transcription
and cell cycle regulation
(7%)
Protein folding,
modification,
proteolysis,
synthesis and
targeting
(12%)
Protein folding,
modification,
proteolysis,
synthesis and
targeting
(9%)
Protein folding,
modification,
proteolysis,
synthesis and
targeting
(13%)
Fig. 3
A B C
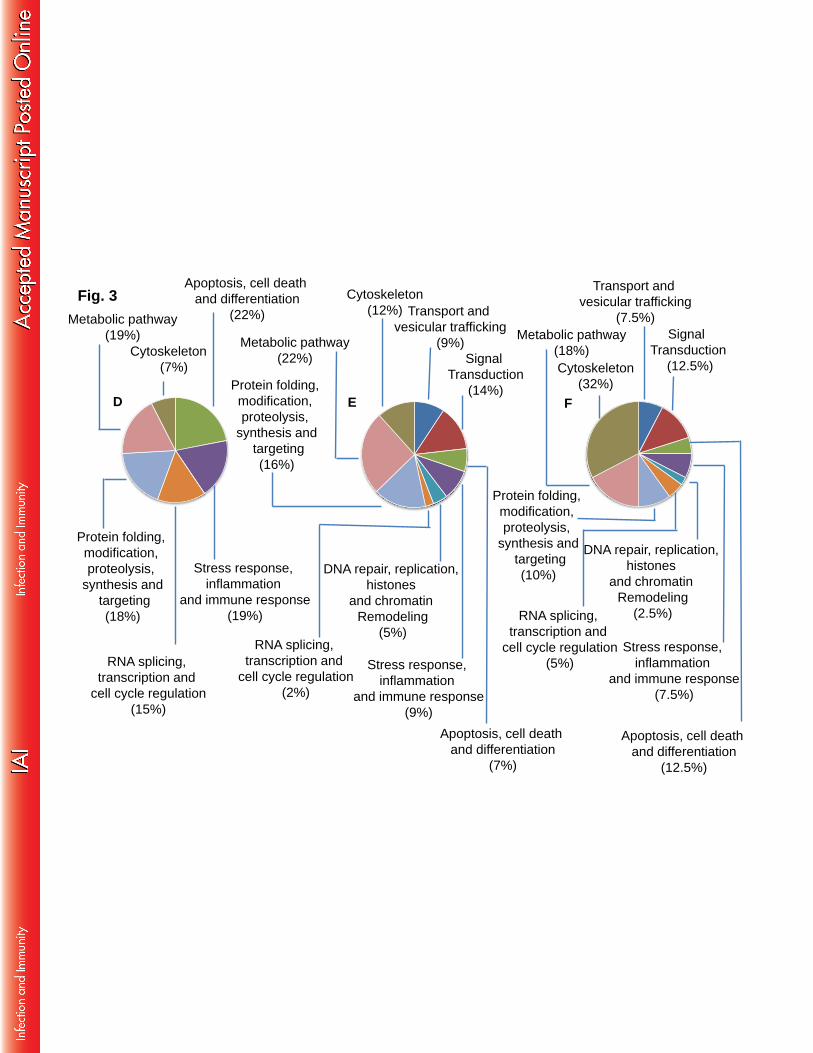
Metabolic pathway
(19%) Metabolic pathway
(22%)
Metabolic pathway
(18%) Cytoskeleton
(7%)
Cytoskeleton
(12%)
Cytoskeleton
(32%)
Apoptosis, cell death
and differentiation
(22%)
Apoptosis, cell death
and differentiation
(7%)
Apoptosis, cell death
and differentiation
(12.5%)
Transport and
vesicular trafficking
(9%)
Transport and
vesicular trafficking
(7.5%)
Signal
Transduction
(14%)
Signal
Transduction
(12.5%)
Stress response,
inflammation
and immune response
(19%)
Stress response,
inflammation
and immune response
(9%)
Stress response,
inflammation
and immune response
(7.5%)
RNA splicing,
transcription and
cell cycle regulation
(15%)
RNA splicing,
transcription and
cell cycle regulation
(2%)
DNA repair, replication,
histones
and chromatin
Remodeling
(5%)
DNA repair, replication,
histones
and chromatin
Remodeling
(2.5%)
RNA splicing,
transcription and
cell cycle regulation
(5%)
Protein folding,
modification,
proteolysis,
synthesis and
targeting
(18%)
Protein folding,
modification,
proteolysis,
synthesis and
targeting
(10%)
Protein folding,
modification,
proteolysis,
synthesis and
targeting
(16%)
Fig. 3
D E F

0
5
10
15
20
25
30
35
40
12h 24h 48h 12h 24h 48h 12h 24h 48h 12h 24h 48h 12h 24h 48hNu
mb
er
of
dif
fere
nti
all
y m
od
ula
ted
pro
tein
s
Plasma membrane Endoplasmic
reticulum
Cytoplasm Mitochondria Nucleus
More abundant
Less abundant
Fig. 4

Fig. 5
hnRNP D0 (Q14103)
Fo
ld a
bu
nd
an
ce
C
0
1
2
3
4
5
12 24 48
*
hnRNP A3 (P51991)
12 24 48
Fo
ld a
bu
nd
an
ce
B
0
1
2
3
4
*
hnRNP K (P61978)
12 24 48
Fo
ld a
bu
nd
an
ce
A
0
1
2
3 *
Inf. (h)
0 12 24 48
Fo
ld e
xp
res
sio
n r
ati
o
hnRNP K (P61978)
D
0
2
4
6
8
10
*
*
*
Fo
ld e
xp
res
sio
n r
ati
o
hnRNP A3 (P51991)
E
0
5
10
15
20
0 12 24 48
*
*
*
Fo
ld e
xp
res
sio
n r
ati
o
hnRNP D0 (Q14103)
F
0
5
10
15
20
25
0 12 24 48
*
*
*
Inf. (h)
0 12 24 36 48 60
hnRNP K (P61978)
β-Tubulin
Infection (h)
G
1.0 1.0 1.2 1.0 0.7 0.6

0.0
0.1
0.2
0.3
0.4
0.5
0.0
0.1
0.2
0.3
0.4
0.5
0.0
0.1
0.2
0.3
0.4
0.5
0.0
2.5
5.0
7.5
10.0
0.0
2.5
5.0
7.5
10.0
0.0
2.5
5.0
7.5
10.0
A B C
Infection (12 h) Infection (24 h) Infection (48 h)
D E F
Infection (12 h) Infection (24 h) Infection (48 h)
*
*
*
Infe
ctio
n r
atio
Infe
ctio
n r
atio
Infe
ctio
n r
atio
Ave
rag
e n
o. o
f
pa
rasite
s/in
f. c
ell
Ave
rag
e n
o. o
f
pa
rasite
s/in
f. c
ell
Ave
rag
e n
o. o
f
pa
rasite
s/in
f. c
ell
Fig 6

0.0
0.1
0.2
0.3
0.4
0.5
0.0
0.1
0.2
0.3
0.4
0.5
0.0
0.1
0.2
0.3
0.4
0.5
0.0
2.5
5.0
7.5
10.0
0.0
2.5
5.0
7.5
10.0
0.0
2.5
5.0
7.5
10.0
A B C
D E F
Infection (12 h) Infection (24 h) Infection (48 h)
Infection (12 h) Infection (24 h) Infection (48 h)
*
*
Infe
ctio
n r
atio
Infe
ctio
n r
atio
Infe
ctio
n r
atio
Ave
rag
e n
o o
f
pa
rasite
s/in
f. c
ell
Ave
rag
e n
o o
f
pa
rasite
s/in
f. c
ell
Ave
rag
e n
o o
f
pa
rasite
s/in
f. c
ell
Β-Tubulin
Infection (h)
0 12 24 36 48 60
1 1.7 1.5 1.6 1.4 0.7
G
MAVS
(Q7Z434)
Fig 7

Fig. 8
GRP 78 (P11021)
C
Vimentin (P08670)
0
0.5
1
1.5
2
2.5
A
* *
Fo
ld a
bu
nd
an
ce
0
0.5
1
1.5
2
2.5
12 24 48 12 24 48
Fo
ld a
bu
nd
an
ce
Inf. (h)
0
1
2
3
4
5
6
Fo
ld e
xp
res
sio
n r
ati
o
0 12 24 48
*
*
Vimentin (P08670)
B D
0
2
4
6
8
10
Fo
ld e
xp
res
sio
n r
ati
o
0 12 24 48
*
*
*
GRP 78 (P11021)
Inf. (h)
GRP78 (P11021)
Histone H4 (P62805)
HMG I (P17096)
β-Tubulin
0 12 24 36 48 60
PTPN6/SHP-1 (P29350)
Infection (h)
1 1.3 2.1 1.4 1.6 2.4
1 1.3 1.9 2.1 2.0 2.4
1 1.5 2.2 2.1 2.0 2.4
1 1.3 0.9 0.6 0.64 0.5
E

0
0.5
1
1.5
2
2.5
3
HNRNP D0 (Q14103)
* *
*
Fo
ld e
xp
res
sio
n r
ati
o
0 6 12 24 48
Fo
ld e
xp
res
sio
n r
ati
o
0
0.5
1
1.5
2
HNRNP A3 (P51991)
*
*
0 6 12 24 48 0
0.5
1
1.5
2
2.5
3
HNRNP K (P61978)
*
Fo
ld e
xp
res
sio
n r
ati
o
0 6 12 24 48
0
1
2
3
4
5
Vimentin (P08670)
*
*
Fo
ld e
xp
res
sio
n r
ati
o
0 6 12 24 48 0
0.5
1
1.5
2
2.5
3
GRP 78 (P11021)
*
*
Fo
ld e
xp
res
sio
n r
ati
o
0 6 12 24 48
Fig. 9 A B C
E D
Inf.(h)
Inf.(h)
0 1 2 24 48
F
GRP 78 (P11021)
HNRNP K (P61978)
HMG I (P17096)
MAVS (Q7Z434)
Infection (h)
β-Tubulin
PTPN6/SHP-1 (P29350)
1 2.23 2.19 2.57
1 1.5 2.3 1.98
1 1.08 0.5 0.48
1 2.03 2.11 2.28
1 1.72 2.1 1.74

Table 1: List of selected differentially modulated proteins in THP-1 cells infected with Leishmania donovani when compared to
uninfected cells at 12 h, 24 h and 48 h.
12 h 24 h 48 h
N Uniprot
ID
Name Biological Process Fold
(±SD)
R Fold
(±SD)
R Fold
(±SD)
R
Signal transduction
1 Q01518 Adenylyl cyclase-associated
protein
activation of adenylate
cyclase activity
0.93
(±0.01)
3 0.44
(±0.21)
3 0.25
(±0.01)
3
2 Q8TEY5 cAMP-responsive element
binding protein 3-like protein
4
positive regulation of
transcription from RNA
polymerase II promoter
15.3
(±1.98)
3
3 Q9ULV4 Coronin-1C actin cytoskeleton
organization
2.28
(±1.03)
2 0.84
(±0.06)
2
4 Q13546 Receptor-interacting
serine/threonine-protein
kinase
1
TRIF-dependent toll like
receptor signaling
pathway
3.06
(±0.94)
2
5 P29350 Tyrosine-protein phosphatase
non-receptor type
JAK-STAT cascade
involved in growth
hormone signaling
pathway
0.22
(±0.005)
2
Apoptosis, cell death and differentiation
6 P11021 78 kDa glucose-regulated
protein
ER overload response 0.43
(±0.04)
3 1.03
(±
0.16)
3 1.95
(± 0.38)
3
7 P61604 10 kDa heat shock protein,
mitochondrial
activation of cysteine type
endopeptidase
activity involved in
apoptotic process
0.59
(±0.05)
3 0.84
(±0.12)
3 1.9
(± 0.88)
3
8 P08670 Vimentin cellular component
disassembly involved in
execution phase of
0.58
(±0.16)
3 1.74
(±0.55)
3 2.19
(± 0.10)
3

apoptosis
9 P17096 High mobility group protein
HMG-I/HMG-Y
DNA unwinding
involved in replication
1.56
(±0.07)
3 3.54
(± 0.1)
3 5.74
(± 0.34)
3
10 P08758 Annexin A5 negative regulation of
apoptotic process
0.34
(±0.13)
3 0.35
(± 0.12)
2
Immune and inflammatory response
11 Q7Z434 Mitochondrial antiviral
signaling protein
activation of innate
immune response
7.86
(±3.55)
2
12 P01584 Interleukin-1 beta cytokine-mediated
signaling pathway
0.75
(±0.45)
2 0.55
(±0.03)
2
13 Q13740 CD166 antigen cell adhesion 1.71
(± 0.12)
2
Chromatin remodeling and RNA splicing
14 P62805 Histone H4 CENP-A containing
nucleosome assembly at
centromere
1.62
(±0.28)
3 5.51
(±2.94)
3 13.6
(± 3.23)
3
15 P19338 Nucleolin Transcription regulation 1.46
(±0.43)
3 3.23
(± 2.3)
3 1
(± 0.02)
3
16 P22626 Heterogeneous nuclear
ribonucleoproteins A2/B1
RNA transport and
mRNA splicing via
spliceosome
0.89
(±0.04)
3 2.96
(±0.49)
3 1.0
(±0.029)
3
17 P31943 Heterogeneous nuclear
ribonucleoprotein H
mRNA splicing via
spliceosome
0.98
(±0.24)
2 2
(±0.54)
3 0.99
(±0.108)
3
18 Q14103 Heterogeneous nuclear
ribonucleoprotein D0
mRNA splicing via
spliceosome
0.71
(±0.08)
3 3.07
(±1.64)
3 1.08
(±0.09)
3
19 P09651 Heterogeneous nuclear
ribonucleoprotein A1
RNA export from
nucleus and mRNA
splicing via spliceosome
1.17
(±0.26)
3 2.57
(±0.25)
2
20 P61978 Heterogeneous nuclear
ribonucleoprotein K
mRNA splicing via
spliceosome
0.46
(±0.23)
3 2.64
(±0.34)
3 0.88
(± 0.28)
3
21 P07910 Heterogeneous nuclear
ribonucleoproteins C1/C2
mRNA splicing via
spliceosome
1.13
(±0.10)
3 2.28
(±1.04)
3 1.37
(±0.24)
3
22 P51991 Heterogeneous nuclear mRNA splicing via 0.69 2 2.79 3 1.16 3

ribonucleoprotein A3 spliceosome (±0.13) (±1.16) (±0.15)
The parameters used for identification and quantification of differentially modulated proteins included: (1) proteins
having ≥95% confidence (Unused-Prot Score > 1.3); (2) proteins with fold differences ≥1.5 or ≤0.67 were considered
more abundant and less abundant respectively and (3) protein detected in a minimum of two technical replicates.
R: no. of replicate experiment. Fold represents fold abundance (higher/lower) in infected versus uninfected THP-1 cells. *nearest fold
ratio for threshold cut off.