A precision measurement of the average lifetime of B hadrons
30
(To be submitted to Zeit. Phys. C) OCR Output TB :1.582 :t: 0.012 (stat.) :l: 0.032 (syst.) ps. of of these two methods were combined to give an average lifetime for B hadrons Taking into account both the statistical and systematic correlations, the results TB = 1.599 i 0.014 (stat.) i 0.035 (syst.) ps. constructed secondary vertices to measure The second method was based on a new technique, which used inclusively re TB : 1.542 sk 0.021 (stat.) dz 0.045 (syst.) ps. of rameter distributions. This analysis measured an average lifetime for B hadrons improvement on a previous technique. which used charged particle impact pa surement was performed using two different analyses. The first method was an the DELPHI detector at the LEP collider during 1991 and 1992. The mea The average lifetime of B hadrons was measured using data collected with Abstract DELPHI Collaboration Average L1fet 1me of B Hadrons A PYQCISIOH Measurement of the sw s 4oQ 4_ “ U BRRR IE lII\\ ||\\||\\\\|\\l\ lL EUROPEAN ORGANIZATION POR NUCLEAR. RESEARCH C 4
-
Upload
independent -
Category
Documents
-
view
4 -
download
0
Transcript of A precision measurement of the average lifetime of B hadrons

(To be submitted to Zeit. Phys. C) OCR Output
TB :1.582 :t: 0.012 (stat.) :l: 0.032 (syst.) ps.
of
of these two methods were combined to give an average lifetime for B hadronsTaking into account both the statistical and systematic correlations, the results
TB = 1.599 i 0.014 (stat.) i 0.035 (syst.) ps.
constructed secondary vertices to measureThe second method was based on a new technique, which used inclusively re
TB : 1.542 sk 0.021 (stat.) dz 0.045 (syst.) ps.
of
rameter distributions. This analysis measured an average lifetime for B hadronsimprovement on a previous technique. which used charged particle impact pasurement was performed using two different analyses. The first method was anthe DELPHI detector at the LEP collider during 1991 and 1992. The mea
The average lifetime of B hadrons was measured using data collected with
Abstract
DELPHI Collaboration
Average L1fet 1me of B Hadrons
A PYQCISIOH Measurement of thesw s 4oQ
4_ “
U BRRR IE
lII\\ ||\\||\\\\|\\l\ lL
EUROPEAN ORGANIZATION POR NUCLEAR. RESEARCH
C 4
2Fachbereich Physik, University of VVuppertal, Postfach 100 127, D-5600 VVuppertal 1, Germany OCR Output1Inst. Nuclear Studies and University of Warsaw, Ul. Hoza 69, PL-00681 V)/arsaw, PolandOlnstitut fiir Hochenergiephysik, Osterr. Akad. d. Viiissensch., Nikolsdorfergasse 18, A-1050 Vienna, AustriaQIFIC, Valencia-CSIC, and D.F.A.M.N., U. de Valencia. Avda. Dr. Moliner 50, E—46100 Burjassot (Valencia), Spain8Department of Radiation Sciences, University of Uppsala, P.O. Box 535, 5-751 21 Uppsala, Sweden7Univ. Federal do Rio de Janeiro, C.P. 68528 Cidade Univ,. Ilha do Fundao BR-21945-970 Rio de Janeiro, Braziland Istituto di Fisica, Université di Udine, 1-33100 Udine, Italy6Dipartimento di Fisica, Université di Trieste and INFN, Via A. Valerio 2, 1-34127 Trieste, Italy5Dipartimento di Fisica Sperimentale, Université di Torino and INFN, Via P. Giuria 1. 1-10125 Turin, Italy4Fysikum, Stockholm University. Box 6730. S·113 85 Stockholm, Sweden3J. Stefan Institute and Department of Physics, University of Ljubljana, Jamova 39, S1-61000 Ljubljana, Slovenia2Inst. for High Energy Physics. Serpukov P.O. Box 35. Protvino, (Moscow Region). Russian Federation1C.E.A.F.M., C.S.I.C. - Univ. Cantabria, Avda. los Castros, S/N-39006 Santander, SpainOlstituto Superiore di Sanité, Ist. Naz. di Fisica Nucl. (INFN), Viale Regina Elena 299, I-00161 Rome, Italy9Centre d’Etude de Saclay. DSM/DAPNIA, F-91191 Gif-sur-Yvette Cedex. France8Dipartiment0 di Fisica. Université di Roma II and INFN, Tor Vergata, I-00173 Rome, Italy'V Rutherford Appleton Laboratory, Chilton, Didcot OX11 OQX, UK6Depto. de Fisica, Pontihcia Univ. Catélica, C.P. 38071 RJ-22453 Rio de Janeiro, Brazil5Dipartimento di Fisica, Université di Padova and INFN, Via Marzolo 8, 1-35131 Padua, Italy4Department of Physics. University of Oxford, Keble Road, Oxford OX1 3RH, UK3Dpto. Fisica, Univ. Oviedo, C/P.Jimenez Casas. S/N-33006 Oviedo, Spain2Physics Department. University of Oslo. Blindern, N-1000 Oslo 3, NorwaylNational Technical University. Physics Department. Zografou Campus, GR-15773 Athens, GreeceONIKHEF-H, Postbus 41882, NL—1009 DB Amsterdam. The Netherlands9NC. Nuclear Centre of1V1FF, Charles University. Areal MFF, V Holesovickach 2, CS—180 00, Praha 8, Czechoslovakia8Niels Bohr Institute, Blegdamsvej 17, DK—2100 Copenhagen 0, Denmark[Dipartimento di Fisica. Université di Milano and INFN. Via Celoria 16, 1-20133 Milan, Italy6Univ. d’Aix - l\’1arseille II - CPP. 1N2P3-CNRS, F—13288 Marseille Cedex 09. France5Universidad Complutense. Avda. Complutense s/n, E—28040 Madrid, Spain‘*L'niversité Claude Bernard de Lyon. IPNL. IN2P3-CNRS, F-69622 Villeurbanne Cedex, France3Department of Physics, University of Lund. Solvegatan 14, S-22363 Lund, SwedenZLPNHE. IN2P3-CNRS, Universités Paris V1 et VII. Tour 33 (RdC), 4 place Jussieu, F-75252 Paris Cedex 05, France1Department of Physics, 1`niversity of Liverpool, P.O. Box 147, Liverpool L69 BBX, UKOtipiisi, pcEE.X.. ET.§§S§.C,£lZYiO?§.i033E§E.-L €S§ZE.i...,..g.¤9Er;Pdi ;IN\g0,IS ' .t`.'*`t·fL t, rLA14,1 ”Sa’l`’°'?lgUrvesiecLe Paris-SuiLab. 1ebAccelerateur Lmeaire. IZP3-CNRS, Bat0§—9140a Orsay, FrancegCentro Brasileiro de Pesquisas Fisicasrua Xavier Sigaud 150, RJ-22290 Rio de Janeir0,Brazil6High Energy Physics Laboratory, Institute of Nuclear Physics, Ul. Kawiory 26a, PL—30055 Krakow 30, Poland5Institut fiir Experimentelle Kernphysik, Universitat Karlsruhe, Postfach 6980, D-76128 Karlsruhe, Germany4Joint Institute for Nuclear Research. Dubna. Head Post Ofhce. P.O. Box 79. 101 000 Moscow, Russian Federation3Research Institute for High Energy Physics. SEFT, P.O. Box 9, FIN-00014 University of Helsinki, FinlandInstitut des Sciences Nucléaires. 1N2P3-CNRS, Université de Grenoble 1, F-38026 Grenoble, France
;Dipartimento di Fisica, Université di Genova and INFN, Via Dodecaneso 33, 1-16146 Genova. ItalyOFZU, Inst. of Physics of the C.A.S. High Energy Physics Division, Na Slovance 2, CS-180 40, Praha 8, Czechoslovakiaglnstitute of Nuclear Physics, N.C.S.R. Demokritos, P.O. Box 60228, GR-15310 Athens, Greece8Centre de Recherche Nucléaire, 1N2P3 - CNRS/ULP — BP20, F-67037 Strasbourg Cedex, France(CERN, CH—1211 Geneva 23, SwitzerlandGCollege de France, Lab. de Physique Corpusculaire, IN2P3-CNRS, F—75231 Paris Cedex 05, France5Dipartimento di Fisica, Université di Bologna and INFN. Via Irnerio 46, I-40126 Bologna, Italy4Department of Physics, University of Bergen, Allégaten 55, N-5007 Bergen, Norwayl"Physics Laboratory, University of Athens, Solonos Str. 104, GR—10680 Athens. Greeceand Faculté des Sciences, Univ. de l`Etat Mons, Av. Maistriau 19, B-7000 Mons, Belgiumand IIHE, ULB-VUB, Pleinlaan 2, B-1050 Brussels, BelgiumPhysics Department, Univ. Instelling Antwerpen, Universiteitsplein 1, B-2610 VVilrijk, BelgiumlAmes Laboratory and Department of Physics. Iowa State University. Ames IA 50011, USA
A.Zalewskal6, D.Zavrtanik43, E.Zevgolatakos9, N.I.Zimin14, M.Zito39, D.Zontar4, R.Zuberi, G.Zumerle334
G.R.VVi1kinson“, VV.S.C.Williams°“ , M.Winter, M.VVitek, G.VVormser**, K.Woschnagg°“, A.Zaitsev°”,B7
4652F.Wald.ner, A.Wehr, M.VVeierstall52. P.VVeilhammerI, A.M.w€th€r€u7, J.H.w*1Ck€¤S2, M.\/Vielersls,L.Vitale46, E.Vlasov42, A.S.Vod0pyanovM , M.Vollmer52 , M.Voutilainenl3 , H.Wahlen52, C.Walck44 ,G.Vegni27, L.Ventura3, VV.Venus, F.Verbeure2, M.Verlato35, L.S.VertogradovH, D.Vilan0va, P.Vincent,537 3924
G.W.Van Apeldoomm, P.Van Dam3°, M.Van Der Heijdengo, VV.K.Van Doninckz, J.V2m Eldikgo, P.VazI,S.Ueberschaer52, O.Ul1aland7, V.Uvarov42. G.Valenti5, E.Vallazza7, J.A.Valls Ferrer", C .Vander Velde2,M.Tura.la1°, M-L.Turluer39, T.Tuuva13, I.A.Tyapkin22, lVI.Tynde137, S.Tzamarias21, B.Ueberschaer52,E.Torassa45, L.T0rtora, D.Treille, W.Trischuk7, G.Tristram5, C.Troncon2, A.Tsir0u, E.N.Tsygan0v14,4°7 77
J.Timmermar1s30, V.G.Tim0feevH, L.G.TkatchevH, T.'I`odorov8, D.Z.Toet3O, A.Tomaradze, B.T0me220
M.Szeptycka51 , P.Szymanski51 , T.Tabarelli27, O.Tchikilev42, G.E.Theodosi0u9, Z.Thome47, A.Tilquin2G.Stavr0pou.los9 , F.Stichelbaut7, A.Stocchi18, J.Strauss5°, J.Straver7, R.Strub8, B.Stugu4, M.Szczekowski5l ,R.Sosn0wski5*, D.Souza-Santos, T.Spassov, E.Spiriti, S.Squarcia, H.Staeck, C.Stanescu, S.Stapnes,u52gé2O4° 4°32
s.samO¤€m“, F.s1mO¤€mP5, A.N.SisakianM, G.Skjevling32, o.smsdja39»24, O.SmimovaM, G.R.Smith37,
“15F.Scun46, A.M.s€gaI, A.Seitz, R.Sekulin37, R.s€urm¢5, R.C.Shellard36, 1.Siccama3°, P.Siegrist39,o.saj0t, J.Salt, J.sa¤Ch€z”, l\/l.Sannino11, S.Schael7, H.Schneider15, 1xr..»..E.s¤hy¤S52, G.Scio1la°5,
OCR Output111
track extrapolation to the interaction region was measured using high momentum muons OCR OutputAfter alignment corrections had been applied, the resolution of the charged particle
30° and 150°.
0(p)/p : 0.001 p (where p is expressed in units of GeV/c),·in the polar region betweencells. The avera.ge momentum resolution of the tracking system was measured to beOuter Detector (OD) at a radius of 198 cm to 206 cm consisted of live layers of drift(TPC), which provided up to 16 space points between radii of 30 cm and 122 cm. Thewere surrounded by the main DELPHI tracking chamber, the Time Projection ChamberDetector (ID), a jet chamber giving up to 24 spatial measurements. The VD and ID
radius of 6.3 cm. Outside the VD between radii of 12 cm and 28 cm was the Inner
in 1991, which allowed the extra layer of silicon microstrip detectors to be added at a6.3 cm, 8.8 cm, and 10.9 cm. A beryllium beam pipe with a radius of 5.5 cm was installedand consisted of three concentric layers of silicon microstrip detectors at average radii of(VD), loca.ted nearest the LEP interaction region, had an intrinsic resolution of 5-6 pmpositive z pointing in the direction of the outgoing electron beam. The Vertex Detectorof the beam. The z axis was defined to be along the axis of the magnetic field, withdetectors whose axes were oriented along the 1.23 T magnetic field and the direction
The tracking of charged particles was accomplished with a set of cylindrical tracking
nents which were relevant to these analvses are discussed here.The DELPHI detector has been described in detail elsewhere [3], only those compo
2 The DELPHI detector
the previously published DELPHI result.lived heavy flavored hadrons. Therefore, the result presented in this paper supersedesuncertainties associated with the measurement and increasing the sensitivity to shortprecise reconstruction of charged particles, improving the knowledge of the systematica factor of 10 increase in statistics and an improved vertex detector. This allowed a more
In addition, compared to the previous DELPHI result [2], both analyses benefit from
hadrons.
of these two analyses leads to a more precise measurement of the average lifetime of Btwo measurements, the number of events in common was small. Thus, the combinationto be smaller in the vertex analysis. Due to the differing selection requirements of theseratios of b and c hadrons, and the uncertainty in the lifetimes of D mesons were foundof the lifetime arising from the knowledge of the production fractions and branchingcomparison with the impact parameter analysis. The uncertainties in the measurement.the uncertainty of the charged particle tracking resolution was found to be negligible inZ0 into B hadrons was reduced compared to the vertex analysis; in the vertex analysis,B hadrons. In the impact parameter analysis, the uncertainty of the fragmentation of the
These two analyses provided complementary measurements of the average lifetime ofsecondary vertices.eter distributions. The second analysis is based on a new technique for reconstructingan improvement on a previous technique [2], which used charged particle impact parampp colliders In this paper, two different analyses are presented. The first analysis ismeasurements of the average lifetime of B hadrons, TB, have been performed at e+e` andweak decays of the b quark and of its couplings to the u and c quarks. Several direct
The precise measurement of the B hadron lifetime is important for the study of the
production point. This distance was evaluated in the ry-plane, perpendicular to the beam OCR Outputparticle to the centre of the beam interaction region, which was assumed to be the Z0
The impact parameter, 5, was defined as the distance of closest approach of a charged
4.1 Analysis Method
distributions.
to extract the average lifetime of B hadrons from charged particle impact parameteraccurate determination of the lifetime. The following section describes the method usedThis improved purity, combined with an increase in statistics. has permitted a moreof B hadrons. Using a new selection technique, the data have been enriched in bb events.
The impact parameter method has been widely used to extract the average lifetime
4 Impact Parameter Analysis
B hadrons a.nd fragmentation functions.This was used to create large simulated data samples with different average lifetimes ofcharged particle track efficiency, position and momentum resolution of DELPHI detector.B hadrons in this sample was 1.576 ps. Another simulation was developed to model thehadrons were 1.600 ps, except for the A;. for which it wa.s 1.300 ps. The average lifetime ofaverage lifetime for B hadrons of 1.208 ps. In the other sample, the lifetimes of a.ll Bto 1.200 ps, except the Ab lifetime which was set to 1.300 ps. This corresponded to ana detailed simulation of the detector. ln one sample. all the B hadron lifetimes were setThus, two Monte Carlo data sets of hadronic events were generated [5] and passed throughdecays and extract the physics functions (described later) used to measure the lifetime.
A detailed Monte Carlo simulation was needed to help identify events containing B
1992 data contained 670 000 hadronic events.
12 GeV/c2. After these cuts, the 1991 data. contained 240 000 hadronic events and theof the charged particles (neglecting the mass of each particle) had to be greater thanparticles in these events was required to be greater than 16 GeV or the inva.riant massFurthermore, the sum of both the momentum of charged particles and energy of neutralsum of the squared transverse mornenta of these particles was greater than 9 GeV2/c2
Hadronic events were selected which contained at least 7 charged particles, where theenergy of at least 100 MeV and less than 50 GeV.in radius and less than 10 cm in z. Neutral particles were required to have a. measureddistance of closest approach to the centre of the beam interaction region of less than 5 cmless than 160°, a reconstructed charged particle track length of more than 20 cm, and agreater than 100 MeV/c and less than 50 GeV/c, a polar angle, 61, greater than 20° and
ln both a.nalyses, charged particles were required to have a measured momentum, p,1992, which corresponded to a total integrated luminosity of 33.9 pb`
These analyses used the data collected with the DELPHI detector during 1991 and
3 Data Sets and Event Selection
respect to the z axis and is measured in units of GeV/crange to be (/262 —|- 692/p? pm, where p, is the transverse momentum of the particle withhadronic events, the extrapolation accuracy has been measured over the full momentumfrom Z0 —-> ,u+;r` events. A value of 26 ;l; 2 pm for this resolution was obtained. In
vertex reconstructed with no beam centre constraint and using only the charged partiOCR Outputparticles used for selecting bb events were measured with respect to a hemisphere primarywere measured with respect to the beam centre. The impact parameters of the chargedhemispheres, must be uncorrelated. In the lifetime determination the impact parametersavoid biasing the lifetime measurement the impact parameters, of particles in oppositeparticles in the opposite hemisphere were used to measure the B hadron lifetime. Toa large impact parameter in one hemisphere, while the impact parameters of the charged
Enrichment of bb events was performed by selecting a number of charged particles with
4.2 B Enrichment
while NC was constrained by the value obtained in the simulation.by finding the combination of Nb, and TB which gave the best description of the data,particles which originated from the different quark flavors. The value of TB was extracteding on the average lifetime of B hadrons), and Nuds, Nc, Nb, are the number of chargedcles from u, d, s and c respectively. D;,(<Y, TB) is the same quantity from bb events (dependwhere Dud,(6), DC(6) are the impact parameter probability distributions of charged parti
D(<$, TB) = NtdSDt.iS(<Y,) + NCDA6) + Ne>Db(6.TB).
different quarks:The impact parameter distribution. D(6, TB), is the sum of the contributions from
particles were found in the 1992 data sample.selection, 20342 charged particles remained in the 1991 data sample and 85609 chargeduncertainty on the sign of the impact parameter. After enrichment and charged particlelayers. These requirements improved the impact parameter resolution and reduced thenearest jet axis above 0.8 GeV/c. and having associated measurements in the three VDparticles with momentum above 3.0 GeV / c, transverse momentum with respect to the
Impact parameters, used to measure the lifetime, were calculated for the chargeddetail in the following section.hemisphere was used to determine the lifetime. This method will be described in morethrust axis. One of these hemispheres was used to select bb events, while the oppositeEach event was divided into two hemispheres, defined by the plane perpendicular to the
To improve the sensitivity of the measurement, the data were enriched in bb events.analysis was 157 000 events in 1991 and 424 000 events in 1992.
the beam centre was not well reconstructed. The number of hadronic events used in thiscontained inside the VD acceptance. Less than 3% of the events were discarded, where
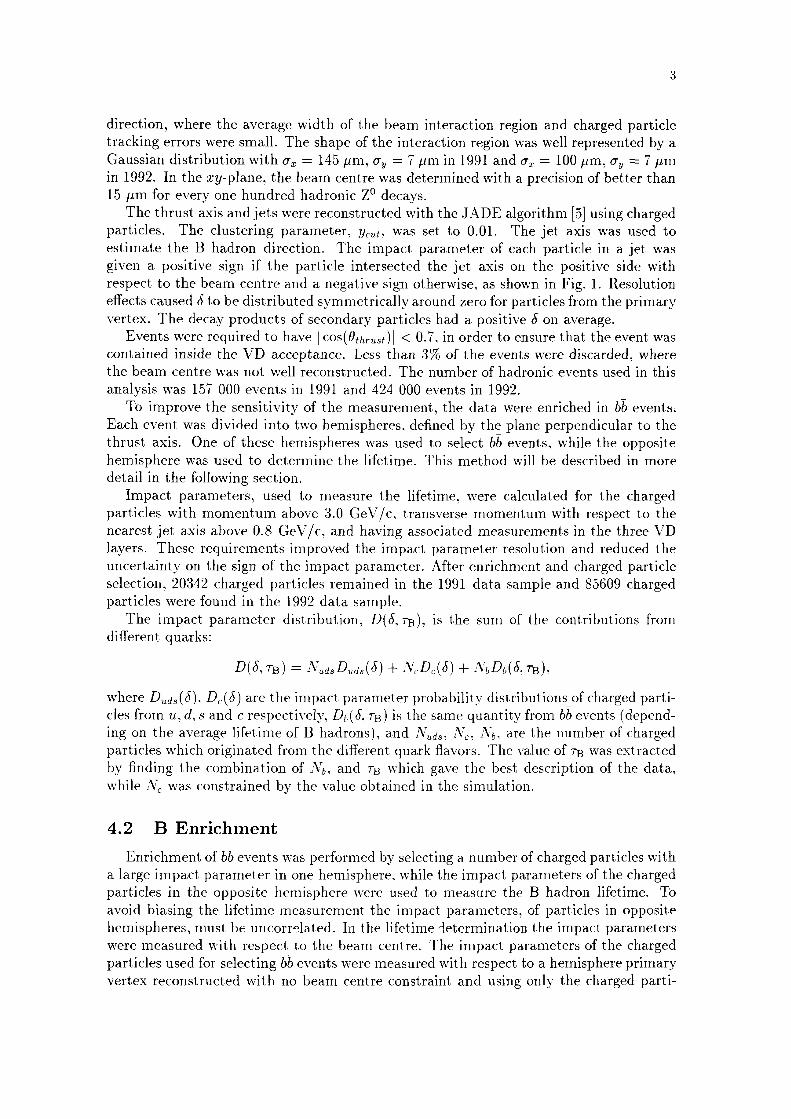
Events were required to have | cos(9,;,,,,$,;)| < 0.7, in order to ensure that the event wasvertex. The decay products of secondary particles had a positive 5 on average.effects caused 6 to be distributed symmetrically around zero for particles from the primaryrespect to the beam centre and a negative sign otherwise, as shown in Fig. 1. Resolutiongiven a. positive sign if the particle intersected the jet axis on the positive side withestimate the B hadron direction. The impact parameter of each particle in a jet wasparticles. The clustering parameter, yam, was set to 0.01. The jet axis was used to
The thrust axis and jets were reconstructed with the JADE algorithm [5] using charged15 pm for every one hundred hadronic Z0 decays.in 1992. In the my-plane, the beam centre was determined with a precision of better thanGaussian distribution with ax = 145 pm, ay = 7 pm in 1991 and 0, = 100 pm, ay = 7 pmtracking errors were small. The shape of the interaction region was well represented by adirection, where the average width of the beam interaction region and charged particle

that the contribution of charged particles from B decays to the negative part of this OCR Outputhemisphere was used to approximate the resolution function. The simulation showedthan 300 pm. The impact parameter distribution of the charged particles in the oppositehaving at least 2 associated measurements in the VD, had an impact parameter largerselected if in at least one hemisphere, no charged particle with momentum above 1 GeV / c,extract the resolution function. Simulation showed that light quark events could be
The impact parameter distribution of light quark events, in the data, was used to
accounted for in the resolution function.
The signing error due to the beam centre resolution and track extrapolation errors wasgenerated particle and the jet axis determined from the reconstructed charged particles.the uncertainty in the B hadron direction, 6 was signed using the intersection point of thedirection due to the jet reconstruction. ln order to account for the signing error due tolution, charged particle track extrapolation errors, and the uncertainty in the B hadron
The signing error on the impact parameter was dependent on the beam centre resoZ0 production point.The Monte Carlo generated impact parameters were computed with respect to the truelifetime. were generated in the range 1.0-1.8 ps by means of a weighting procedurelution function. The physics functions, corresponding to different values of the B hadronMonte Carlo generated impact parameter distributions (physics functions) with the reso
The impact parameter probability distributions were determined by convoluting the
4.3 Average Lifetime of B Hadrons
the sample was estimated to be 50.5 5; 0.7 %.particle multiplicity, the fraction of charged particles produced by bb events, Pgmck. inmeasured to be 5.6 in the simulation. From the measured B purity and the chargedfor the same parameters. The average charged particle multiplicity in a B decay wascg = 0.631 1 0.003 in 1992, in agreement with the results extracted from the simulationwere Pg = 50.385 :k 0.003. cg : 0.546 zh 0.005 in 1991, and PB : 0.385 :l: 0.001,efficiency, a value of N = 2 was chosen. The corresponding purities and efficienciesin Fig. 2. For this analysis, in order to maximize the purity while maintaining high
The correlation between PB and cg, corresponding to different values of N, is shown
selected.
were computed by counting the number of events in which one or two hemispheres werethe correlation between the both hemispheres (obtained from the simulation), PB and cgstudied using data. Assuming the Standard Model value of 1],;/l`;wd and accounting foracceptance, which remained in the selected sample. Both the B purity and efficiency wereB efficiency, cg, was defined as the fraction of bb events initially produced, within the VD
The B purity, PB, was defined as the fraction of bb events in the selected sample. The
sions in the detector.
wrongly reconstructed primary vertices, long lived particle decays, and photon conver0.1 mm §_ |<$l f 2.0 mm. The upper limit removed part of the background due towas selected if at least some number, N, of charged particles satisfied the condition:1 GeV/ c and associated measurements in at least 2 layers of the VD. A hemispherespect to the primary vertex was calculated for charged particles with momentum abovemary vertex were rejected. ln the remaining events, the impact parameter with re·
Events which contained less than three charged particles in the hemisphere priresolution was 0,, 2 ay 2 200 ,um.cles from that hemisphere. According to the simulation, the hemisphere primary vertex
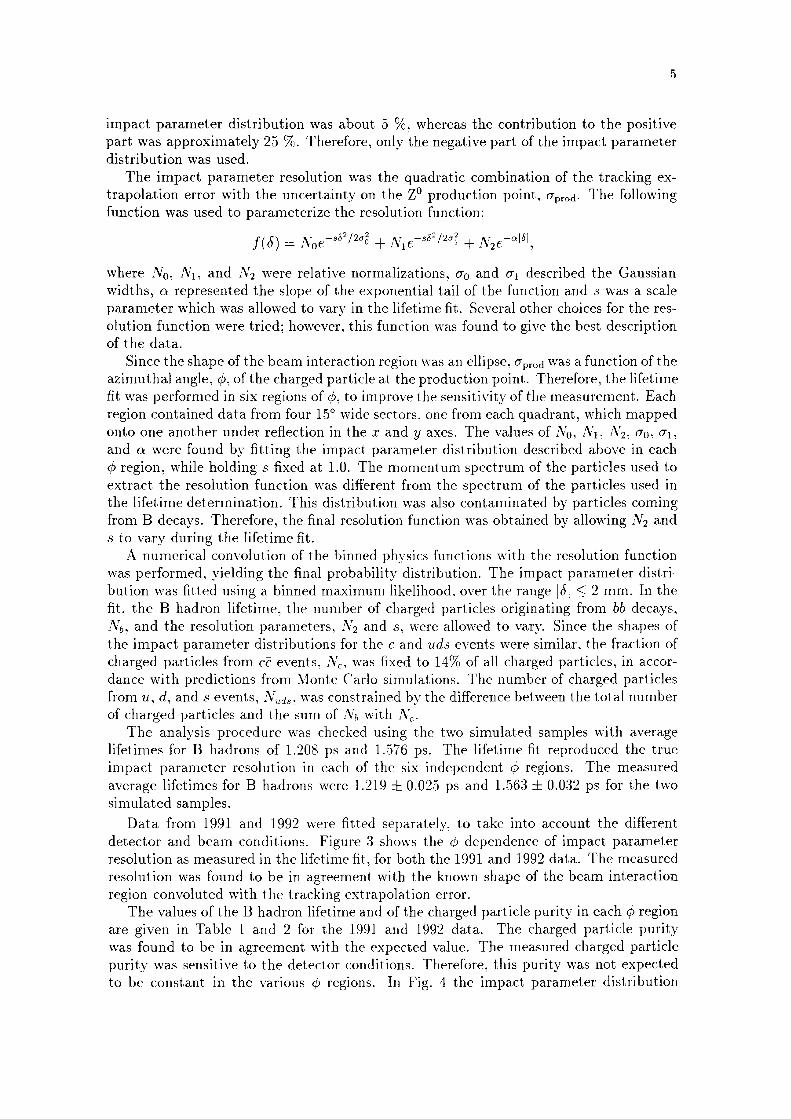
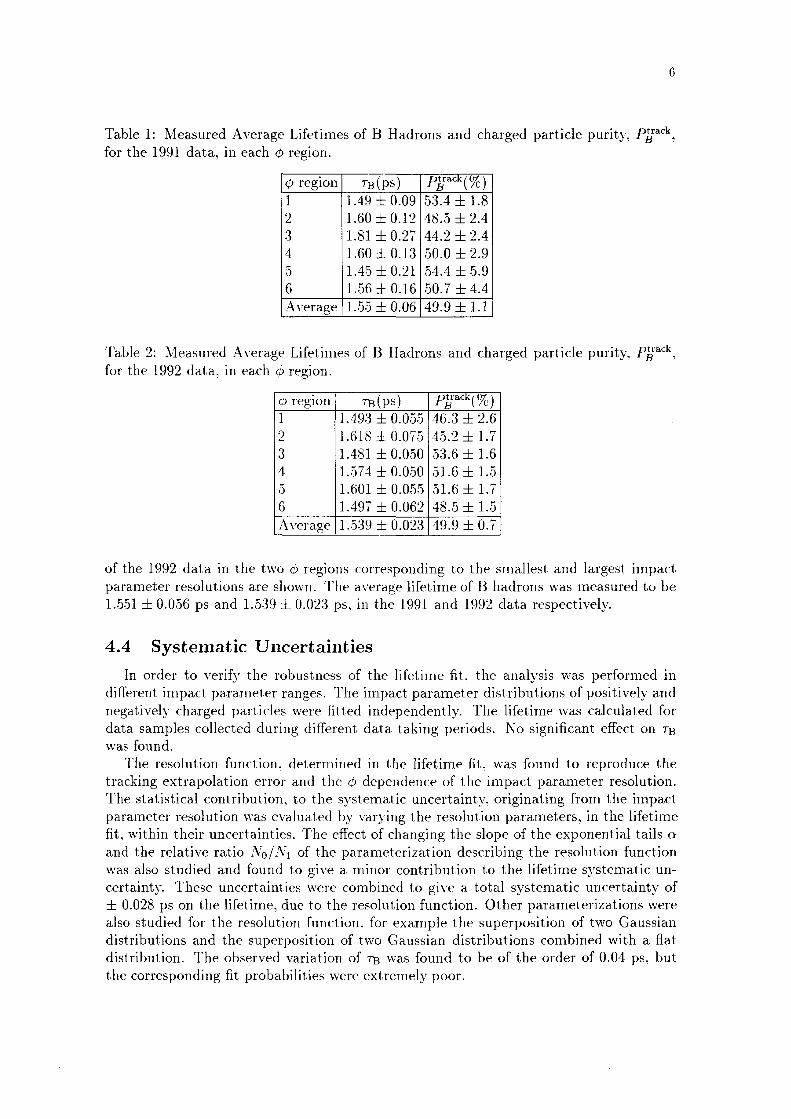
to be constant in the various gb regions. In Fig. 4 the impact parameter distribution OCR Outputpurity was sensitive to the detector conditions. Therefore, this purity was not expectedwas found to be in a.greement with the expected va.1ue. The measured charged particleare given in Table 1 and 2 for the 1991 and 1992 data. The charged particle purity
The values of the B hadron lifetime and of the charged particle purity in each cb regionregion convoluted with the tracking extrapolation error.resolution was found to be in agreement with the known shape of the beam interactionresolution as measured in the lifetime fit, for both the 1991 and 1992 data. The measureddetector and beam conditions. Figure 3 shows the cb dependence of impact parameter
Data from 1991 and 1992 were fitted separately, to take into account the different
simulated samples.average lifetimes for B hadrons were 1.219 :l; 0.025 ps and 1.563 :l; 0.032 ps for the twoimpact parameter resolution in each of the six independent cb regions. The measuredlifetimes for B hadrons of 1.208 ps and 1.576 ps. The lifetime fit reproduced the true
The analysis procedure was checked using the two simulated samples with averageof charged particles and the sum of Nb with NC.from u, d, and .9 events, ]Vud,,, was constrained by the difference between the total numberdance with predictions from Monte Carlo simulations. The number of charged particlescharged particles from 05 events, NC, was fixed to 14% of all charged particles, in accorthe impact parameter distributions for the c and uds events were similar, the fraction ofNb, and the resolution parameters, N2 and s, were allowed to vary. Since the shapes offit, the B hadron lifetime, the number of charged particles originating from bb decays,bution was fitted using a binned maximum likelihood, over the range |5l § 2 mm. In thewas performed, yielding the final probability distribution. The impact parameter distri
A numerical convolution of the binned physics functions with the resolution function.9 to vary during the lifetime fit.from B decays. Therefore, the final resolution function was obtained by allowing N2 andthe lifetime determination. This distribution was also contaminated by particles comingextract the resolution function was different from the spectrum of the particles used ingb region, while holding s fixed at 1.0. The momentum spectrum of the particles used toand a were found by fitting the impact parameter distribution described above in eachonto one another under reflection in the ;1? and y axes. The values of N0, N1, N2, 00, 01,region contained data from four 15° wide sectors, one from each quadrant, which mappedfit was performed in six regions of gb, to improve the sensitivity of the measurement. Eachazimuthal angle, qb, of the charged particle at the production point. Therefore, the lifetime
Since the shape of the beam interaction region was an ellipse, 0,,,00 was a function of the
of the data.
olution function were tried; however, this function was found to give the best descriptionparameter which was allowed to vary in the lifetime fit. Several other choices for the reswidths, a represented the slope of the exponential tail of the function and s was a scalewhere N0, N1, and N2 were relative normalizations, 00 and 01 described the Gaussian
Z ]\*0€—s62/203 + A/x16-·.s62/2a? + ]V2€—o4|5|’
function was used to parameterize the resolution function:trapolation error with the uncertainty on the Z0 production point, 0;,,00. The following
The impact parameter resolution was the quadratic combination of the tracking ex
distribution was used.
part was approximately 25 %. Therefore, only the negative part of the impact parameterimpact parameter distribution was about 5 %, whereas the contribution to the positive
the corresponding fit probabilities were extremely poor. OCR Outputdistribution. The observed variation of TB was found to be of the order of 0.04 ps, butdistributions and the superposition of two Gaussian distributions combined with a flatalso studied for the resolution function. for example the superposition of two Gaussian1 0.028 ps on the lifetime, due to the resolution function. Other parameterizations werecertainty. These uncertainties were combined to give a total systematic uncertainty ofwas also studied and found to give a minor contribution to the lifetime systematic unand the relative ratio NO/N1 of the parameterization describing the resolution functionfit, within their uncertainties. The effect of changing the slope of the exponential tails oparameter resolution was evaluated by varying the resolution parameters, in the lifetimeThe statistical contribution, to the systematic uncertainty, originating from the impacttracking extrapolation error and the gb dependence of the impact parameter resolution.
The resolution function. determined in the lifetime fit, was found to reproduce the
was found.
data samples collected during different data taking periods. No significant effect on TBnegatively cha.rged particles were fitted independently. The lifetime was calculated fordifferent impact parameter ranges. The impact parameter distributions of positively and
ln order to verify the robustness of the lifetime fit, the analysis was performed in
4.4 Systematic Uncertainties
1.551 1 0.056 ps and 1.539 1 0.023 ps. in the 1991 and 1992 data respectively.parameter resolutions are shown. The average lifetime of B hadrons was measured to beof the 1992 data in the two gb regions corresponding to the smallest and largest impact
1.539 :1; 0.023Average 49.9 1 0.7
48.5 11.51.497 :1: 0.062
1.601 51; 0.055 51.6 11.7
51.6 11.51.574 ;t 0.050
1.481 :1; 0.050 53.6 11.6
1.618 1 0.075 45.2 11.7
1.493 :1; 0.055 46.3 ;t 2.6
6) region @195) Pgrack(%)
for the 1992 data, in each Q region.Table 2: Measured Average Lifetimes 01 B Hadrons and charged particle purity. Pgack.
49.9 :1: 1.1Average [ 1.55 :1: 0.06
50.7 :1; 4.46 l1.50 1 0.16
54.4 ;b 5.95 I1.45 1 0.21
50.0 ;l; 2.94 I1.00 a 0.13
44.2 ;b 2.43 |1.81 1 0.27
48.5 :1; 2.42 I1.60 i 0.12
53.4 ;t 1.81 11.49 i 0.09Pgrack(%)gb regionl ·rB(ps)
for the 1991 data, in each ¢ region.Table 1: Measured Average Lifetimes 0f B Hadrons and charged particle purity, Pgmck,

secondary decay vertices and explicitly measure the projected decay distribution. This OCR Outputbefore decaying. Using the high precision vertex detector, it was possible to reconstructpoint of the B hadron. At LEP, a 35 GeV B meson will travel, on average, 3 mmparameter methods. ln these methods there was no explicit reconstruction of the decay
Most previous measurements of the B hadron lifetimes have been based on impact
5 Secondary Vertex Analysis
by adding all the contributions in quadrature.A total systematic uncertainty of zh 0.045 ps on the measured lifetime was obtained
uncertainties associated with the lifetime for each of these effects are listed in Table 3.
ing and doubling the number of decays arising from B baryons in the simulation. Thesystematic uncertainty due to the unknown fraction of B baryons was studied by remov
in order to determine the systematic variation due to the charmed hadron content. The
fraction of charged particles originating from charmed decays was varied by zh 8.2% [10]charmed hadron lifetime was estimated by changing the average lifetime by 2.5% Thethe fragmentation of the charm quark. The systematic effect due to the uncertainty onthe number of Di and the number of D0 and Df in the B hadron decays [9] and indifferent charmed hadron species was computed by varying by zh 30% the ratio betweenB [7] and c hadrons The systematic uncertainty due to the relative abundance offragmentation was estimated by varying the mean fraction of beam energy carried by thetainty of the OPAL measurement The effect of the uncertainty in the b and c quark
The avera.ge charged decay multiplicity in B decay was varied according to the uncerclustering effects and impact parameter signing were negligible.between the simulation and data in this figure implied tha.t the systematic effects due toreconstructing secondary vertices will be described in the next section. The agreementin the Reb plane for the data and simulation has been plotted in Fig. 5. The method forgorithm, the difference between the reconstructed jet axis and secondary vertex directionagreement. ln order to study the systematic effects associated with the jet clustering al
The acoplanarity distributions of jets in the simulation and data were found to be inregions, in either the 1991 or 1992 data.boundaries. No systematic uncertainty resulted from the fits in these different angular
The data were divided into different q§ and 0 regions, corresponding to known detector
i 0.045Total
Charmed Hadron Content I i 0.006
zh 0.007c Fragmentation
Charmed Hadron Lifetime] i 0.008
zh 0.008B Baryon ContentD Sample Composition [ i 0.015
zh 0.016B FragmentationB Decay Multiplicity [ dz 0.023Resolution Function I zh 0.028Source of Uncertainty [ATB (ps)
rameters.
Table 3: Sources of systematic uncertainty in the measurement of TB, using impact pa~
charged particle was removed from vertex i. For vertices that were close together OCR Outputcorresponding value BQ, calculated with respect to the beam centre. If < Bj thenthat were associated with the secondary vertex. the value of Bj was compared to the
In order to minimize the number of charged particles coming from the primary vertex,
be removed.
position was calculated and this process repeated until no further charged particles couldfrom the vertex if Bj > 2.5. If any charged particle was removed then a new vertex(in the Réplane), and A 6j was the associated error. A charged particle was removedwhere 5j was the distance of closest approach of the charged particlej to the vertex vj
x2 = (L 2 E B? ? M9 ? J
position was computed by minimizingin the following iterative procedure. For each candidate vertex a more precise vertexaverage intersection point (< Big >) was computed. This was used as a reference pointa.nd hence improve the secondary vertex resolution. For each candidate vertex the
The candidate vertices were refined to remove wrongly associated charged particles
vertex.
could belong to more than one intersection point and thus more than one candidateAn intersection point was allowed to belong to only one vertex, but a charged particlecharged particles associated with each intersection point) pointed in opposite directions.hemispheres or between intersection points where the sum of the momenta (for the pair ofd/Ad < 1.0. Links were not permitted between pairs of intersection points in oppositedistance. d, between the points in the Rc§—plane divided by the error, Ad, was such thatseparation between each pair of intersection points. Intersection points were linked if the
The remaining intersection points were clustered into candidate vertices based on thegreater than 5 cm.the beam centre, or if the ra.dial distance of the intersection point to the beam centre wasas the intersection point, the intersection point lay within three standard deviations ofdid not intersect in the R0-plane, both charged particles were not in the same hemisphereparticles were computed. Pairs of charged particles were rejected if: the charged particlespaired with every other charged particle and the intersection points for these charged
To find the initial candidate vertices, each reconstructed charged particle track wastwo layers of the VD.each reconstructed charged particle had to be associated with measurements in at leastticles were well reconstructed, their polar angle was restricted to 45° f 0 § 135° andthat all charged particles had a momentum above 1.0 GeV / c. To ensure the charged particle tracks. In order to minimize the effect of multiple Coulomb scattering, it was requiredmeasurements in the R<p—plane, the following conditions were imposed on the charged par
As the determination of the B hadron lifetime was dependent upon accurate spatialproperties of the remaining candidate vertices.to refine these vertices by removing mis—associated charged particles and measuring theto define which charged particles belonged to candidate vertices. The second part was
The procedure to find secondary vertices consisted of two parts. The first part was
5.1 Secondary Vertex Identiiication
DELPHI and how these vertices were used to extract an average lifetime for B hadrons.section describes a method developed to find secondary vertices in hadronic events at
First, by fitting the momentum distributions of the leptons in these events and assuming OCR OutputThe purity measured using the simulation was verified with the data in two ways.
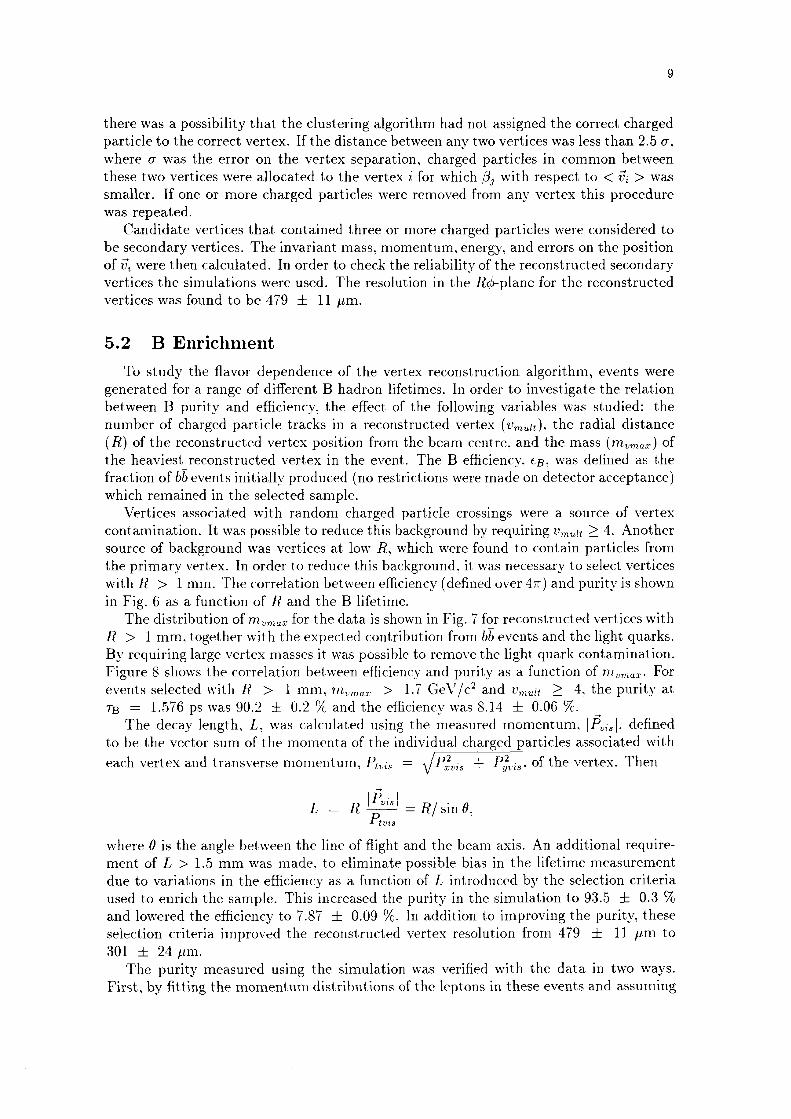
301 ;l; 24 pm.
selection criteria improved the reconstructed vertex resolution from 479 ;l: 11 pm toand lowered the efficiency to 7.87 zi: 0.09 %. ln addition to improving the purity, theseused to enrich the sample. This increased the purity in the simulation to 93.5 :1: 0.3 %due to variations in the efficiency as a function of L introduced by the selection criteriament of L > 1.5 mm was made, to eliminate possible bias in the lifetime measurementwhere 0 is the angle between the line of flight and the beam axis. An additional require
L = R1;%=R/sind,
each vertex and transverse momentum, Pm, : \/Pfm + Pfm, of the vertex. Thento be the vector sum of the momenta of the individual charged particles associated with
The decay length, L, was calculated using the measured momentum, |P,,,$|, definedTB : 1.576 ps was 90.2 i 0.2 % and the efficiency was 8.14 i 0.06 %.events selected with R > 1 mm, nzumax > 1.7 GeV/c2 and 11,,,,,;, 2 4, the purity atFigure 8 shows the correlation between efficiency and purity as a function of mma,. ForBy requiring large vertex masses it was possible to remove the light quark contamination.R > 1 mm, together with the expected contribution from bb events and the light quarks.
The distribution of mvmw for the data is shown in Fig. 7 for reconstructed vertices within Fig. 6 as a function of R and the B lifetime.with R > 1 mm. The correlation between efficiency (defined over 4rr) and purity is shownthe primary vertex. ln order to reduce this background, it was necessary to select verticessource of background was vertices at low R, which were found to contain particles fromcontamination. lt was possible to reduce this background by requiring Umm 2 4. Another
Vertices associated with random charged particle crossings were a source of vertexwhich remained in the selected sample.fraction of bb events initially produced (no restrictions were made on detector acceptance)the heaviest reconstructed vertex in the event. The B efficiency, cg, was defined as the(R) of the reconstructed vertex position from the beam centre. and the mass (mmm) ofnumber of charged particle tracks in a reconstructed vertex (vmult), the radial distancebetween B purity and efficiency, the effect of the following variables was studied: thegenerated for a range of different B hadron lifetimes. ln order to investigate the relation
To study the flavor dependence of the vertex reconstruction algorithm, events were
5.2 B E11richment
vertices was found to be 479 :1: 11 pm.vertices the simulations were used. The resolution in the Rd>—plane for the reconstructedof 5, were then calculated. fn order to check the reliability of the reconstructed secondarybe secondary vertices. The invariant mass, momentum, energy, and errors on the position
Candidate vertices that contained three or more charged particles were considered towas repeated.smaller. ff one or more charged particles were removed from any vertex this procedurethese two vertices were allocated to the vertex i for which Bj with respect to < 17, > waswhere 0 was the error on the vertex separation, charged particles in common betweenparticle to the correct vertex. lf the distance between any two vertices was less than 2.5 0,there was a possibility that the clustering algorithm had not assigned the correct charged
data. For the 1991 data, this effect was not seen. This shift was observed in an area of the OCR Output
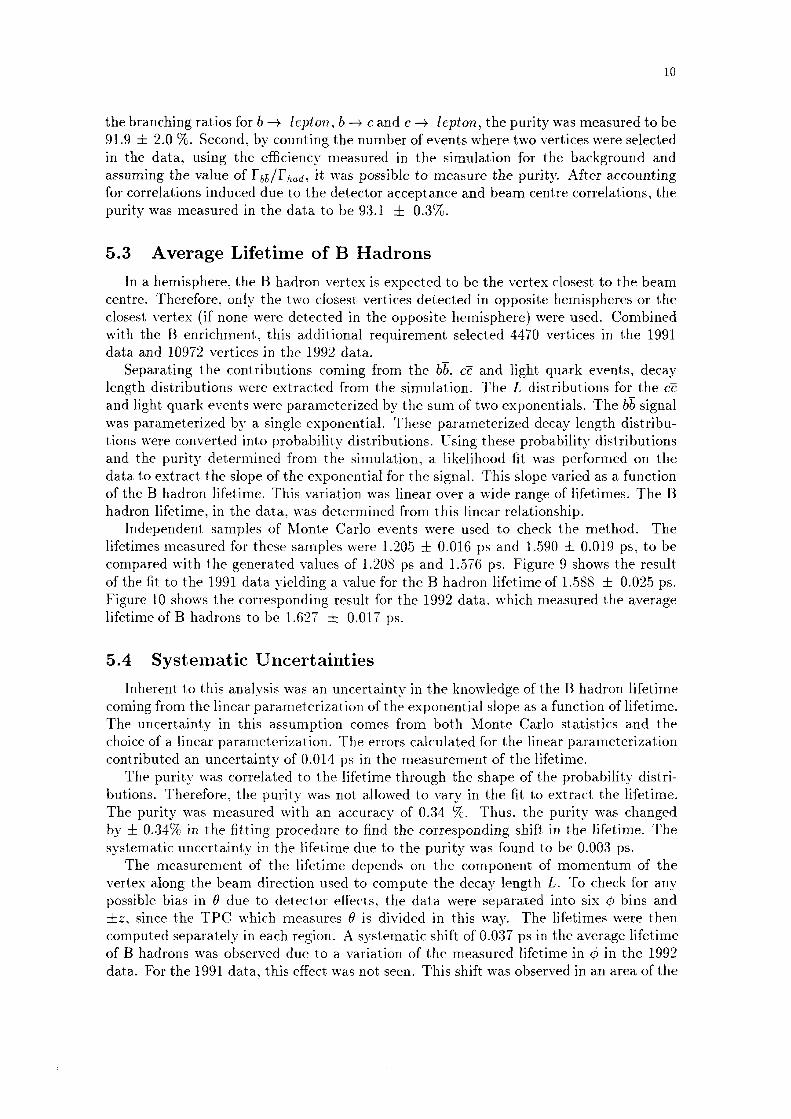
of B hadrons was observed due to a variation of the measured lifetime in cb in the 1992computed separately in each region. A systematic shift of 0.037 ps in the average lifetimezhz, since the TPC which measures 9 is divided in this way. The lifetimes were thenpossible bias in 9 due to detector effects, the data were separated into six ¢ bins andvertex along the beam direction used to compute the decay length L. To check for any
The measurement of the lifetime depends on the component of momentum of thesystematic uncertainty in the lifetime due to the purity was found to be 0.003 ps.by zh 0.34% in the litting procedure to Hnd the corresponding shift in the lifetime. TheThe purity was measured with an accuracy of 0.34 %. Thus, the purity was changedbutions. Therefore, the purity was not allowed to vary in the fit to extract the lifetime.
The purity wa.s correlated to the lifetime through the shape of the probability districontributed an uncertainty of 0.014 ps in the measurement of the lifetime.choice of a linear parameterization. The errors calculated for the linear parameterizationThe uncertainty in this assumption comes from both Monte Carlo statistics and thecoming from the linear parameterization of the exponential slope as a function of lifetime.
Inherent to this analysis was an uncertainty in the knowledge of the B hadron lifetime
5.4 Systematic Uncertainties
lifetime of B hadrons to be 1.627 i 0.017 ps.Figure 10 shows the corresponding result for the 1992 data, which measured the averageof the fit to the 1991 data yielding a value for the B hadron lifetime of 1.588 zh 0.025 ps.compared with the generated values of 1.208 ps and 1.576 ps. Figure 9 shows the resultlifetimes measured for these samples were 1.205 zh 0.016 ps and 1.590 i 0.019 ps, to be
Independent samples of Monte Carlo events were used to check the method. Theha.dron lifetime, in the data, was determined from this linear relationship.of the B hadron lifetime. This variation was linear over a wide range of lifetimes. The Bdata to extract the slope of the exponential for the signal. This slope varied as a functionand the purity determined from the simulation, a likelihood lit was performed on thetions were converted into probability distributions. Using these probability distributionswas parameterized by a single exponential. These parameterized decay length distribuand light quark events were parameterized by the sum of two exponentials. The bb signallength distributions were extracted from the simulation. The L distributions for the ce
Separating the contributions coming from the bb, ce and light quark events, decay
data and 10972 vertices in the 1992 data.
with the B enrichment, this additional requirement selected 4470 vertices in the 1991closest vertex (if none were detected in the opposite hemisphere) were used. Combinedcentre. Therefore, only the two closest vertices detected in opposite hemispheres or the
In a hemisphere, the B hadron vertex is expected to be the vertex closest to the beam
5.3 Average Lifetime of B Hadrons
purity was measured in the data to be 93.1 zh 0.3%.for correlations induced due to the detector acceptance and beam centre correlations, theassuming the value of Fbg/Fwd, it was possible to measure the purity. After accountingin the data, using the efficiency measured in the simulation for the background and91.9 zlz 2.0 %. Second, by counting the number of events where two vertices were selectedthe branching ratios for b —> lepton, b -—> c and c —> lepton, the purity was measured to be
10
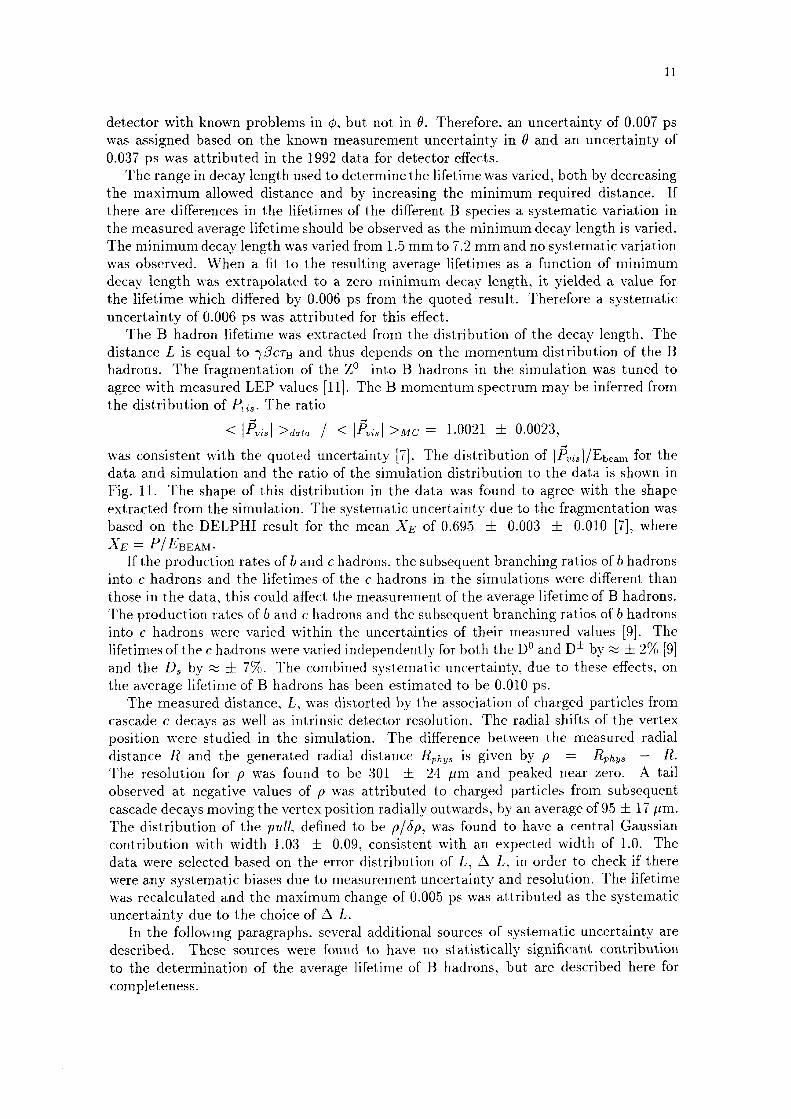
completeness. OCR Outputto the determination of the average lifetime of B hadrons, but are described here fordescribed. These sources were found to have no statistically significant contribution
In the following paragraphs, several additional sources of systematic uncertainty areuncertainty due to the choice of A L.was recalculated and the maximum change of 0.005 ps was attributed as the systematicwere any systematic biases due to measurement uncertainty and resolution. The lifetimedata were selected based on the error distribution of L, A L, in order to check if therecontribution with width 1.03 ;h 0.09, consistent with an expected width of 1.0. TheThe distribution of the pull, defined to be p/rip, was found to have a central Gaussiancascade decays moving the vertex position radially outwards, by an average of 95 ;l; 17 pm.observed at negative values of p was attributed to cha.rged particles from subsequentThe resolution for p was found to be 301 i 24 pm and peaked near zero. A taildistance R and the generated radial distance Rphys is given by p = Rphys — R.position were studied in the simulation. The difference between the measured radialcascade c decavs as well as intrinsic detector resolution. The radial shifts of the vertex
The measured dista.nce, L, was distorted by the association of charged particles fromthe average lifetime of B hadrons has been estimated to be 0.010 ps.and the DS by M zh 7%. The combined systematic uncertainty, due to these effects, onlifetimes of the c hadrons were varied independently for both the D0 and Di by x i 2% [9]into c hadrons were varied within the uncertainties of their measured values The
The production rates of b and c hadrons and the subsequent branching ratios of b hadronsthose in the data, this could affect the measurement of the average lifetime of B hadrons.
into c hadrons and the lifetimes of the c hadrons in the simulations were different than
If the production rates of b and c hadrons, the subsequent branching ratios of b hadronsXE = P/EBEAM·based on the DELPHI result for the mean XE of 0.695 zh 0.003 ;|: 0.010 [7], whereextracted from the simulation. The systematic uncertainty due to the fragmentation wasFig. 11. The shape of this distribution in the data was found to agree with the shape
data and simulation and the ratio of the simulation distribution to the data is shown in
was consistent with the quoted uncertainty The distribution of [Pm]/Ebcam for the
< {PMI >.i.,.f.. / < IPMI >Ma = 1.0021 ck 0.0023,
the distribution of PWS. The ratioagree with measured LEP values [11]. The B momentum spectrum may be inferred fromhadrons. The fragmentation of the 20 into B hadrons in the simulation was tuned todistance L is equal to ·y,Bc7·B and thus depends on the momentum distribution of the B
The B hadron lifetime was extracted from the distribution of the decay length. Theuncertainty of 0.006 ps was attributed for this effect.the lifetime which differed by 0.006 ps from the quoted result. Therefore a systematicdecay length was extrapolated to a zero minimum decay length, it yielded a value forwas observed. VVhen a fit to the resulting average lifetimes as a function of minimumThe minimum decay length was varied from 1.5 mm to 7.2 mm and no systematic variationthe measured average lifetime should be observed as the minimum decay length is varied.there are differences in the lifetimes of the different B species a systematic variation inthe maximum allowed distance and by increasing the minimum required distance. If
The range in decay length used to determine the lifetime was varied, both by decreasing0.037 ps was attributed in the 1992 data for detector effects.was assigned based on the known measurement uncertainty in 0 and an uncertainty ofdetector with known problems in gb, but not in 9. Therefore, an uncertainty of 0.007 ps
11
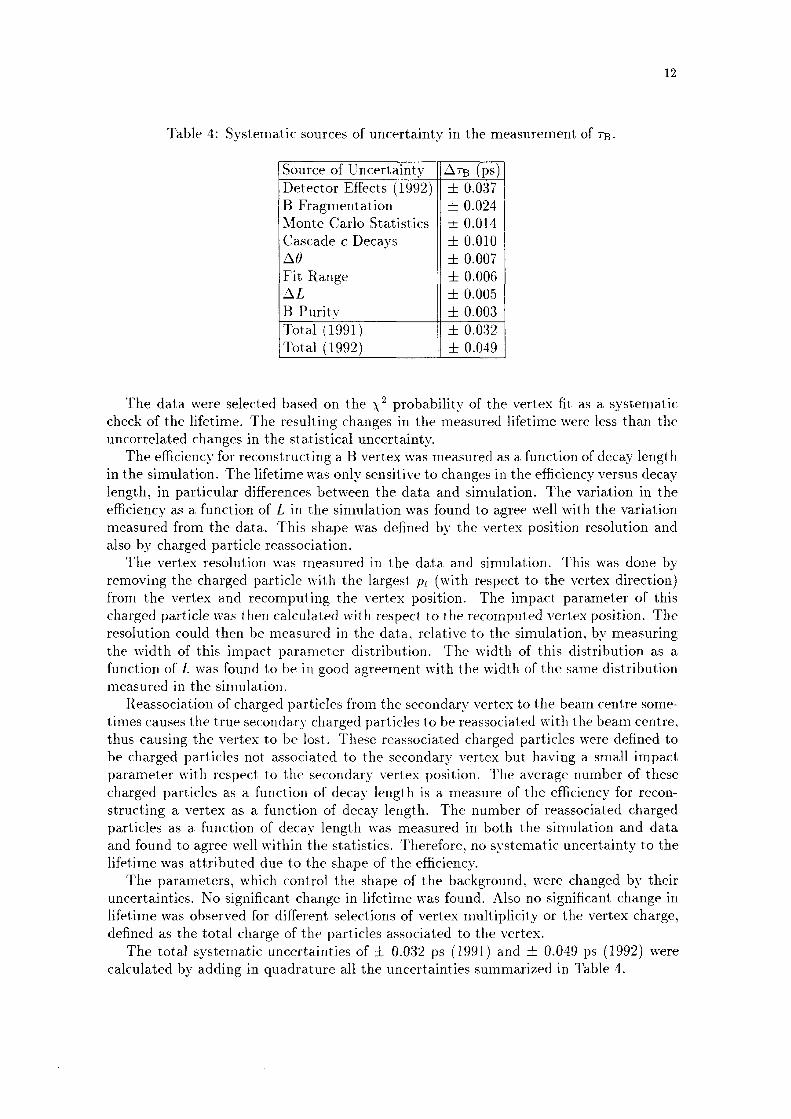
calculated by adding in quadrature all the uncertainties summarized in Table 4. OCR OutputThe total systematic uncertainties of i 0.032 ps (1991) and ;l; 0.049 ps (1992) were
defined as the total charge of the particles associated to the vertex.lifetime was observed for different selections of vertex multiplicity or the vertex charge,uncertainties. No significant change in lifetime was found. Also no significant change in
The parameters, which control the shape of the background. were changed by theirlifetime was attributed due to the shape of the efhciency.and found to agree well within the statistics. Therefore, no systematic uncertainty to theparticles as a function of decay length was measured in both the simulation and datastructing a vertex as a function of decay length. The number of reassociated chargedcharged particles as a function of decay length is a measure of the efficiency for reconparameter with respect to the secondary vertex position. The average number of thesebe charged particles not associated to the secondary vertex but having a small impactthus causing the vertex to be lost. These reassociated charged particles were defined totimes causes the true secondary charged particles to be reassociated with the beam centre.
Reassociation of charged particles from the secondary vertex to the beam centre some
measured in the simulation.
function of L was found to be in good agreement with the width of the same distributionthe width of this impact parameter distribution. The width of this distribution as aresolution could then be measured in the data, relative to the simulation, by measuringcharged particle was then calculated with respect to the recomputed vertex position. Thefrom the vertex and recomputing the vertex position. The impact parameter of thisremoving the charged particle with the largest p, (with respect to the vertex direction)
The vertex resolution was measured in the data and simulation. This was done byalso by charged particle reassociation.measured from the data. This shape was defined by the vertex position resolution andefficiency as a function of L in the simulation was found to agree well with the variationlength, in particular differences between the data and simulation. The variation in thein the simulation. The lifetime was only sensitive to changes in the efficiency versus decay
The efficiency for reconstructing a B vertex was measured as a function of deca.y lengthuncorrelated changes in the statistical uncertainty.check of the lifetime. The resulting changes in the measured lifetime were less than the
The data were selected based on the X2 probability of the vertex fit as a systematic
i 0.049Total (1992)
i 0.032Total (1991)
:1: 0.003B Purity
zh 0.005AL
i 0.006Fit Range
;l: 0.007A0
Cascade c Decavs Il ;t 0.010
Monte Carlo Statistics Il :1; 0.014B Fragmentation i 0.024Detector Effects (1992) ;l; 0.037Source of Uncertainty HATE (ps)
Table 4: Systematic sources of uncertainty in the measurement of TB.
TB : 1.627 ;|; 0.017 ;l: 0.049 ps (1992), OCR Output
TB :1.588 :l; 0.025 zi: 0.032 ps (1991),
measured to be
in hadronic events at DELPHI. ln this analysis, the average lifetime of B hadrons wasThe second analysis used a new algorithm for inclusively reconstructing secondary vertices
TB : 1.542 ;|; 0.021 ;|; 0.045 ps (1991 -1- 1992).
and
TB : 1.539 i 0.023 i 0.045 ps (1992),
TB : 1.551 zh 0.056 :b 0.045 ps (1991),
distributions to find a result. for the average lifetime of B hadrons of1991 and 1992 DELPHI data. The first analysis used charged particle impact parameter
Two analyses, measuring the average lifetime of B hadrons, have been performed on the
6 Conclusions
in this section was found to be consistent with the aforementioned 1991 result.to the previous analysis, have been estimated to be 0.04 ps. The lifetime result presentedshown in Fig. 12. The uncorrelated systematic uncertainties, for this analysis compared1.58 zi; 0.03 ps was found. The result of the fit and the distribution of these vertices istmin. A maximum likelihood fit was then performed to this distribution and a result ofby event basis and the lifetime was expressed in terms of the difference between tpmp andTo overcome this deficiency. the minimum detectable time, tmin, was eva.luated on an eventby DELPHI. Short lived particles have a small probability to be detected in this technique.the B was given by the jet direction and estimating the boost from the mean XE measured
The proper time, tpmp, was then estimated from R, by assuming that the polar angle ofwith a purity of 97.6 :1; 0.2%, and selected 3669 vertices in the 1991 data.larger than 0.8 GeV/c2. In simulation, this selection was found to give an event sampleof bb events. This vertex was required to have R larger than 0.6 mm and a visible masssmaller than 10°. The secondary vertex of the opposite jet was used to enrich the samplethan 1 GeV/c2, and an angle between the direction to the vertex and the jet directionR with respect to the reconstructed main vertex larger than 1 mm, a visible mass largerThe vertex of the jet used in the lifetime analysis was required to have a radial distance
ln order to increase the B purity, a selection of events with two vertices was made.giving the largest contribution to the X2 was removed and the X2 probability recomputed.X2 probability was bigger than 0.1%. If this last condition was not fulfilled, the particleand smaller than that with respect to the primary vertex. The vertex was accepted if its73; >2, or the impact parameter with respect to the candidate vertex was less than 1 mmrt; : 6/0; greater than two. Charged particles were included in the secondary vertex ifvertex search was initiated if at least two charged particles were found to have the ratioto the reconstructed primary vertex and 0.; was defined to be the error on 6. A secondaryeach event. The impact parameter of the charged particles, 6, was defined with respectwere found in the two most energetic jets. A primary vertex was then reconstructed forThis method used all charged particles with momentum greater than 1 GeV / c, which
A second technique was developed and used as a cross—check of the vertexing analysis.

the CERN—SL Division for the excellent performance of the LEP collider. OCR Outputtheir support in building and operating the DELPH1 detector, and to the members of
`We are greatly indebted to our technical collaborators and to the funding agencies for
Acknowledgements
TB :1.582 1 0.012 1 0.032 ps.
yield an average lifetime for B hadrons of
lations and correlations in the systematic uncertainties. the two results were combined toanalyses where taken to be uncorrelated. Taking into a.ccount both the statistical corremesons were considered to be correlated. whereas the other svstematic effects in these twoand branching ratios of b and c hadrons, and the uncertainty in the lifetimes of the Dsystematic effects from the B fragmentation, the knowledge of the production fractionswere found to be in common with the events used in the charged particle analysis. Thethe events used in both analyses. Only 4.7% of the events used in the vertex analysis
The statistical correlation between these two analyses was computed by comparing
B hadrons have lifetimes of 1.60 ps.to the fraction of these hadrons originally produced in the simulation, assuming all thehadrons remaining in these two analyses after applying all selection criteria, comparedthe measurement of the average lifetime. Table 5 lists the fraction of the various Bwhich causes the relative fractions of the species to differ is a source of discrepancy inlifetimes of the various B hadrons. Therefore, any selection bias, in choosing events,
The average lifetime for B hadrons is determined by the production fractions and
TB : 1.599 1 0.014 1 0.035 ps (1991+1992).
and
10.002 0.008 10.001OtherBBarvons[I 0.010 l0.007
;t0.002 0.069 10.0020.030 I 0.077
;I;0.002 0.123 10.0030.120 I 0.114
i0.005 0.395 10.0050.396 I 0.375
10.0050.394 I 0.427 0.405 10.005
B Hadron Type Generatedllmpact Analysis|\’ertex Analysis
for these analyses, where the lifetime for each B hadron was 1.60 ps.
Table 5: Fraction 0f B hadrons before and after event selection measured in the simulation
14
S. Hegarty, et al. (VVorld Scientific, Singapore, 1992) p 301. OCR Outputand Europhysics Conference on High Energy Physics (Geneva, July 1991), Vol.2, edsP. Roudeau, Heavy flavour physics at LEP, in: Proc. Joint International Symposium[111LEP experiments ”, CERN—PPE/93-157 August (1993).
[10] ‘ Updated Parameters of the 20 Resonance from Combined Preliminary Data of theParticle Data Group, Phys. Rev. D 45 (1992).[9}P. Abreu et al. (DELPHI Collaboration), Zeit. Phys. C 59 (1993) 533.[8]Physics, Marseille, July 1993.Semileptonic Decays ”, submitted to the Europhysics Conference on High EnergyP. Abreu et al. (DELPHI Collaboration), “ Determination of Pb; and BR(b —> I) using[7]R. Akers et al. (OPAL Collaboration), CERN—PPE/93-174, submitted to Zeit. Phys.[6]367.
LUND JETSET 7.3, T.Sj6strand and M.Bengtsson, Comp. Phys. Comm.43 (1987)[5]. Bingefors et al. Nucl. Instr. and Meth. A 328 (1993) 447.[4]. Aarnio et al. (DELPHI Collaboration),Nucl. Instr. and Meth. A 303 (1991) 233.[3}. Abreu et al. (DELPH1 Collaboration), Z. Phys. C 53 (1992) 567.[2}. Abe et al. (CDF Collaboration), Phys. Rev. Lett., 71 (1993) 3421.. Akers et al. (OPAL Collaboration), Phys. Lett.316B (1993) 435;. Adriuni et al. (L3 Collaboration), Phys. Lett.317B (1993) 474;. Buskulic et al. (ALEPH Collaboration), Phys. Lett.295B (1992) 174;[1]
References
15
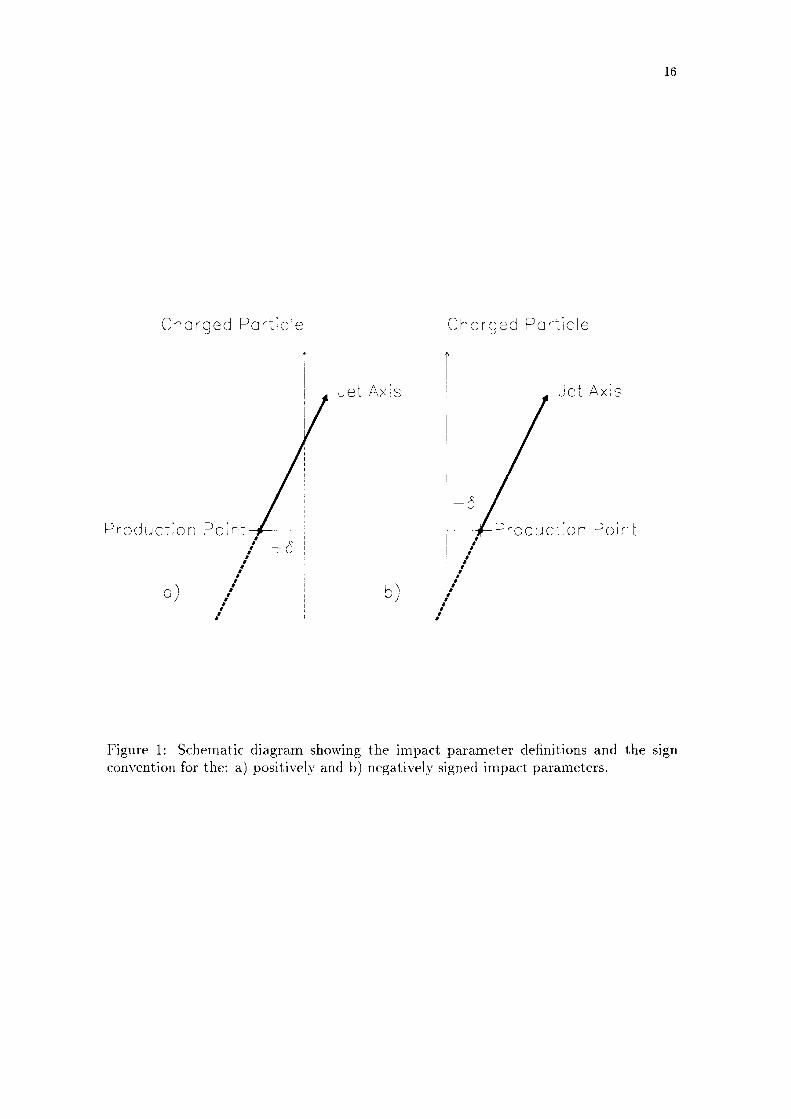
convention for the: a) positively and b) negatively signed impact parameters. OCR OutputFigure 1: Schematic diagram showing the impact parameter deiinitions and the sign
l
0/ .· \ lr, bx r\ {I
,•' +5lDrodoetioo Foiotj lv-he-aLl-Uroductiom ?oirit
Jet%\><Ys JetA><§s
Chorged Poribie Claorged Forticle
16

1991 and 1992 data. OCR OutputFigure 2: B efficiency versus event purity, for the impact parameter technique, in the
Purity (%)
GOSOBO
N = 5
20.
A N : 4
40. N = 5
/\ GO. N = 2
92 Dctc A
91 mgm .N :1
EO.
DEl.p|·||
17

variation due to the shape of the beam interaction region. OCR Outputand 1992 data. The curves represent a fit to the points which reproduced the expectedFigure 3: The measured qé dependence of the impact parameter resolution for the 1991
<p (degrees)GO2O GO
GO.
GO.
1 OO.
20.
Q2 Doto AWALOIY Ooto O
1 GO.
18
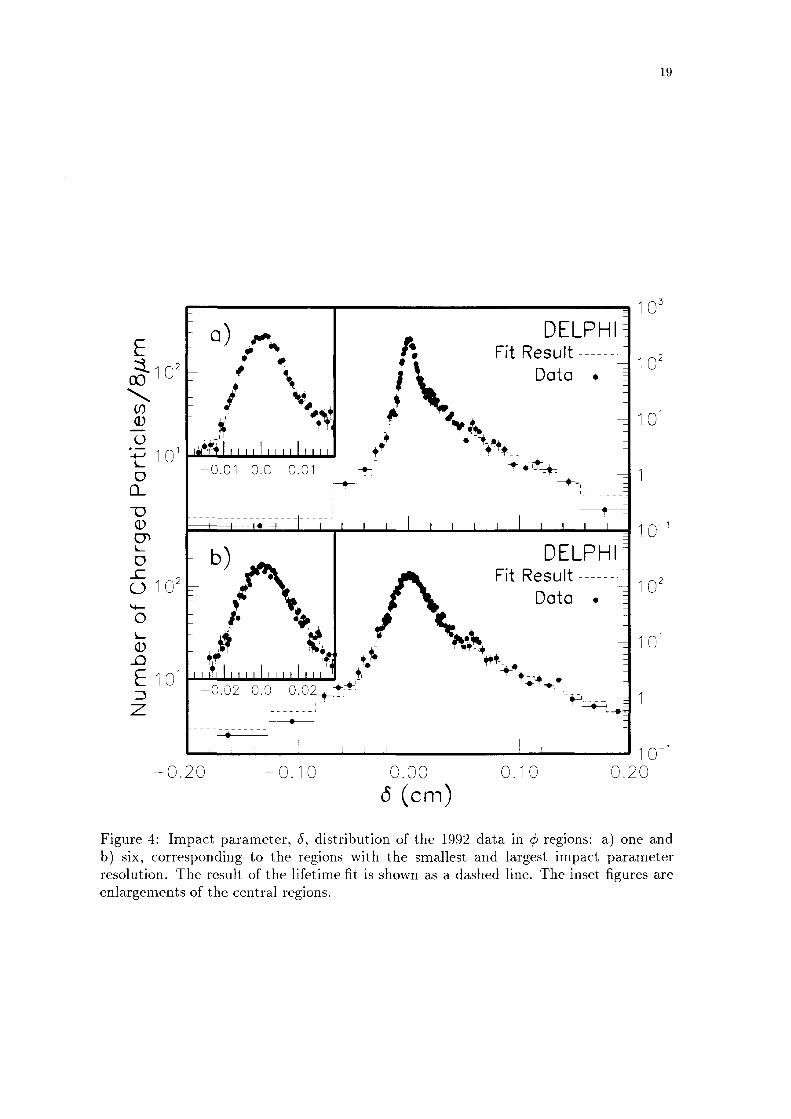
enlargements of the central regions. OCR Outputresolution. The result of the lifetime Ht is shown as a dashed line. The inset Hgures areb) six, corresponding to the regions with the smallest and largest impact parameterFigure 4: Impact parameter, 6, distribution of the 1992 data in gb regions: a) one and
6 (cm)O.lO OOO O.lO O.2OO.2O
l O`
+=— *T**W ' gt WO e0.02 0.0 0.02_ +#- . .Q +,9 ¤+‘l J9
‘ OW”`¢,, 4 N3ll? `l’a»Doto
O lO l OFit Result e
DELRI-ll
l OR
0.0i 0.0 0.01 53 **2*2Qqg*E l Twig {5+ ’ $*3, W O,,l 4 ‘l *0 TV
fl V Q +'OO Doto1 ,W O2 L "
,,,2, Fit Result
) _,.` * DELRI-ll
t0;
19
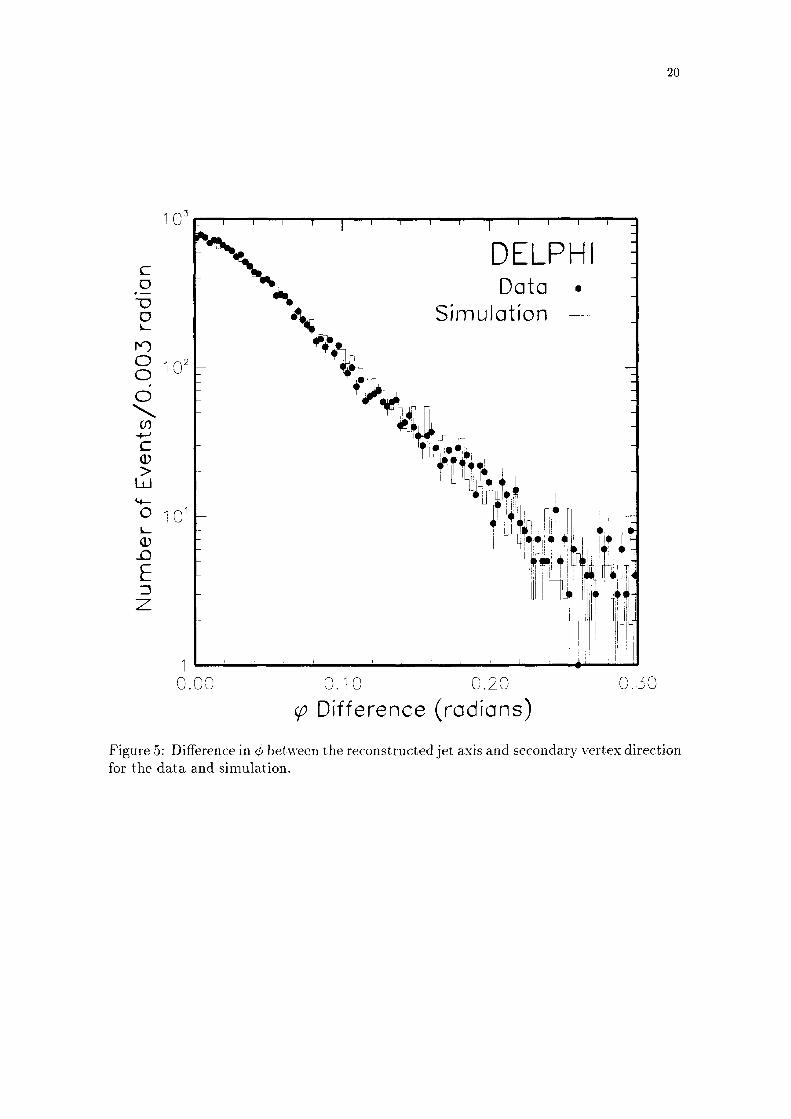
for the data and simulation. OCR Output
Figure 5: Difference in gb between the reconstructed jet axis and secondary vertex direction
<,0 Difference (rodions)ONOOOO O20 OBO
iiiii} Hifiiii iiiiT‘ Fi Wi ii? ffMi iw itat
+tio»¤ "“ 4 iiiiiii iii Ly
Wl} i, 1 l WW ;+ oiiimyi
Ttfi M;ei
Q f 0
Sim u I otion
DGJLG •
i G
20
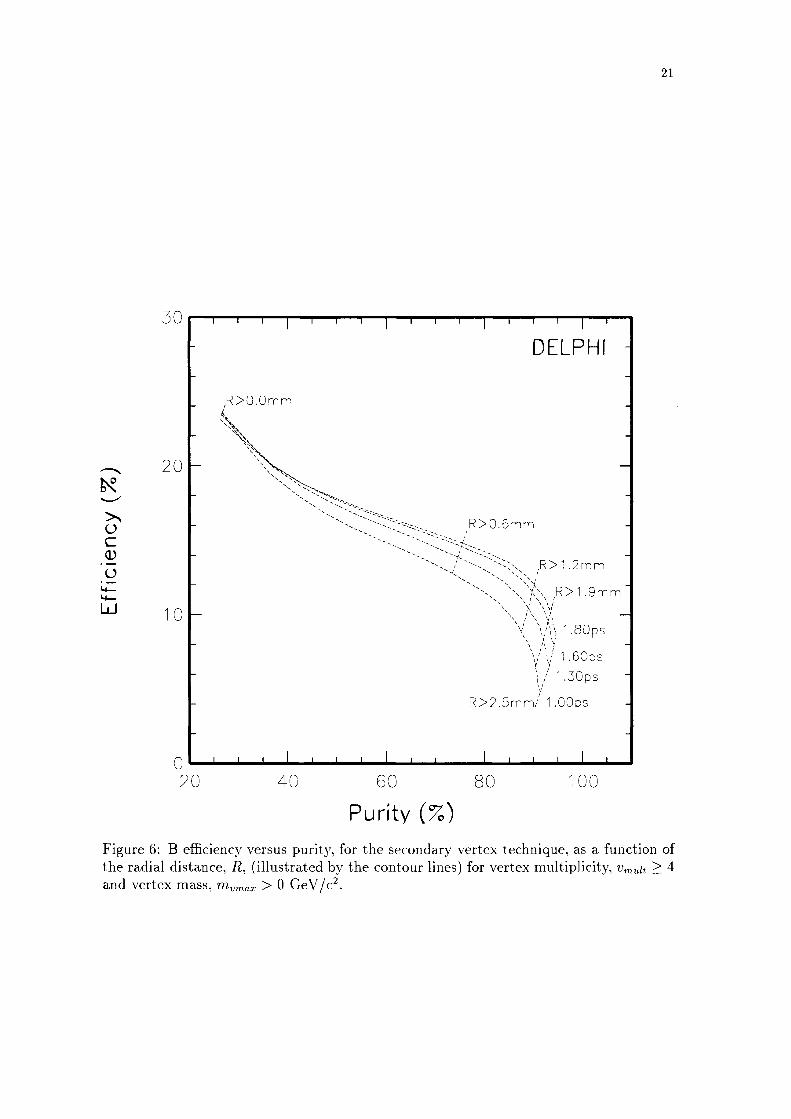
and vertex mass, mmm > O GeV/c2 OCR Outputthe radial distance, R, (illustrated by the c0nt0ur lines) for vertex multiplicity, vmult 2 4Figure 6: B eiliciency versus purity, for the secondary vertex technique, as at function 0f
P u rity ( %)
2O 4O GO BO l OO
R>2.5mm/ l.OOps
i / W.50ps\Y/\_/1 .60ps\/ {
X /l W*<\ \,*\‘, 7.80ps\ l\ y\ \ \r \y
\\?;\\\XLJJ ’l O\\\\I
,R> i smm
·— R> 1 .2mm
¤`\"`;\``~i~`~ ``f??I;`;g`_\ ,R>©.emm
,,\\5 2O
;§\
,R>0.0mm
EO
21
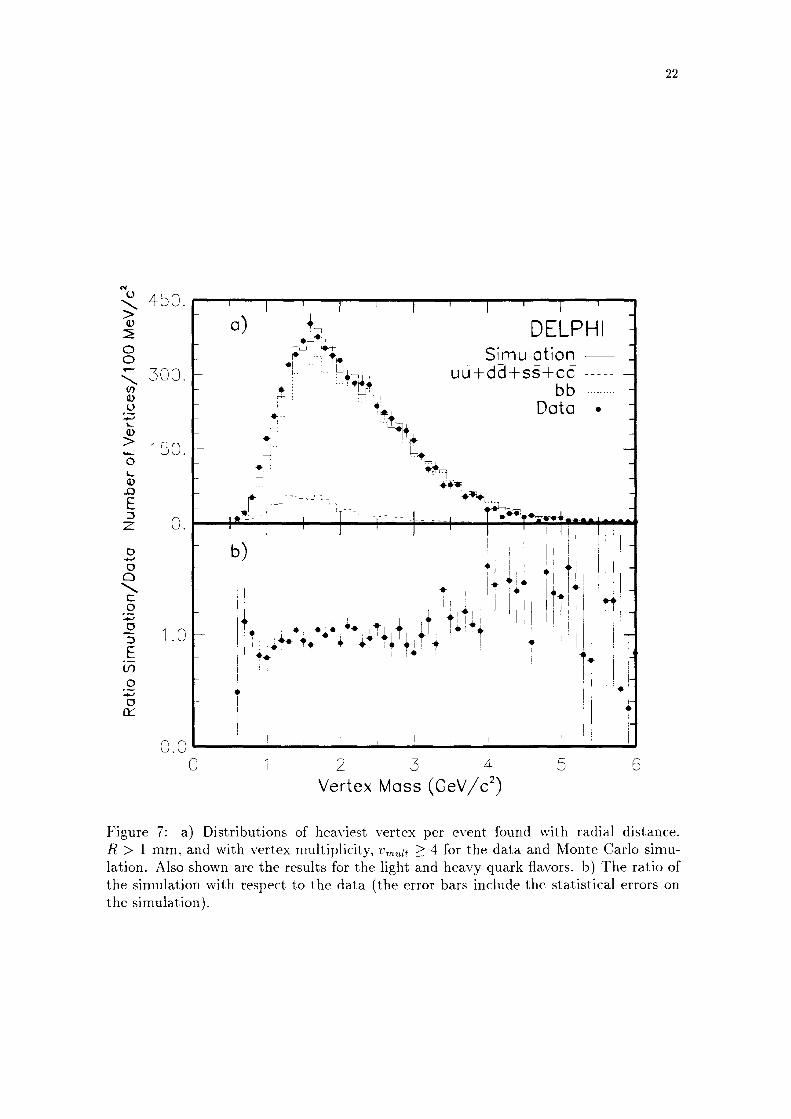
the simulation). OCR Outputthe simulation with respect to the data (the error bars include the statistical errors onlation. Also shown are the results for the light and heavy quark flavors. b) The ratio ofR > 1 mm, and with vertex multiplicity, vmm 2 4 for the data and Monte Carlo simuFigure 7: a) Distributions of heaviest vertex per event found with radial distance,
Vertex Mess (Ge\//cz)
OO
i
V X Mi_O
i i ii iiii ’|{UM
i50.
DGJCO •
bb5©@_ uQ+dd+s§+c6
SimulationJV_ w ~· 2 · i22 m¥“QY$
DELPH1¤> %450,
22

and radial distance, R > 1 mm. OCR Outputthe vertex mass, mivmm., (illustrated by the contour lines) for vertex multiplicity, umm 2 4Figure 8: B eiliciency versus purity, for the secondary vertex technique, as a function of
0 Purntv (%)
QQSO Q580 WOO
} ` E J I
x_.1é’*'
’
,~,;;~
/»;/;L"/
iIs [Zz/,
{`/£/lhqix
i
' 2 7 /',m>2.5G&\//c\ ` gr
, V R v?v\\ X /‘
X X [Q2 \ \ \l\m>2.0C3©\//c
X X * W
\ \ / U`X `X~
» \ ~\\¤*1>w.7G€\//c\ 1 x \\» I \ ‘\
1.00pSf
\
VBOR?/{ ~\—¤m>w.$c@v/612
W.60ps{`~\1_3@DSAm>O.OG©\//cz
jg DELPHI
23
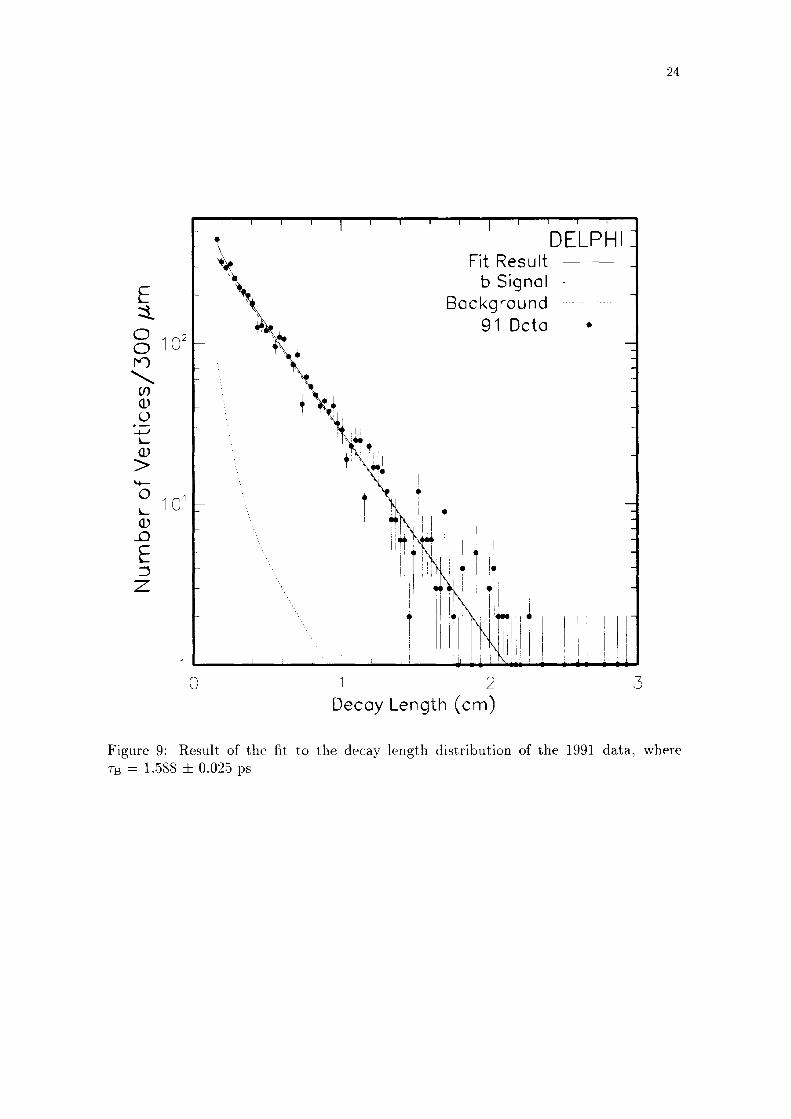
TB : 1.588 :l: 0.025 ps OCR OutputFigure 9: Result 0f the fit t0 the decay length distribution 0f the 1991 data, where
Decay Length (cm
Nlllllll l
T ll l?l’lxa l’mli+l l li
ll mll lllll * l 1*
llrN».l l l llllll\L.i l
img l __ wa0 l
l\—#l
+ W
O<> l g N.mO 2
Q1 Data •
Backgroundb Signal
Fit Result
DELPH
24
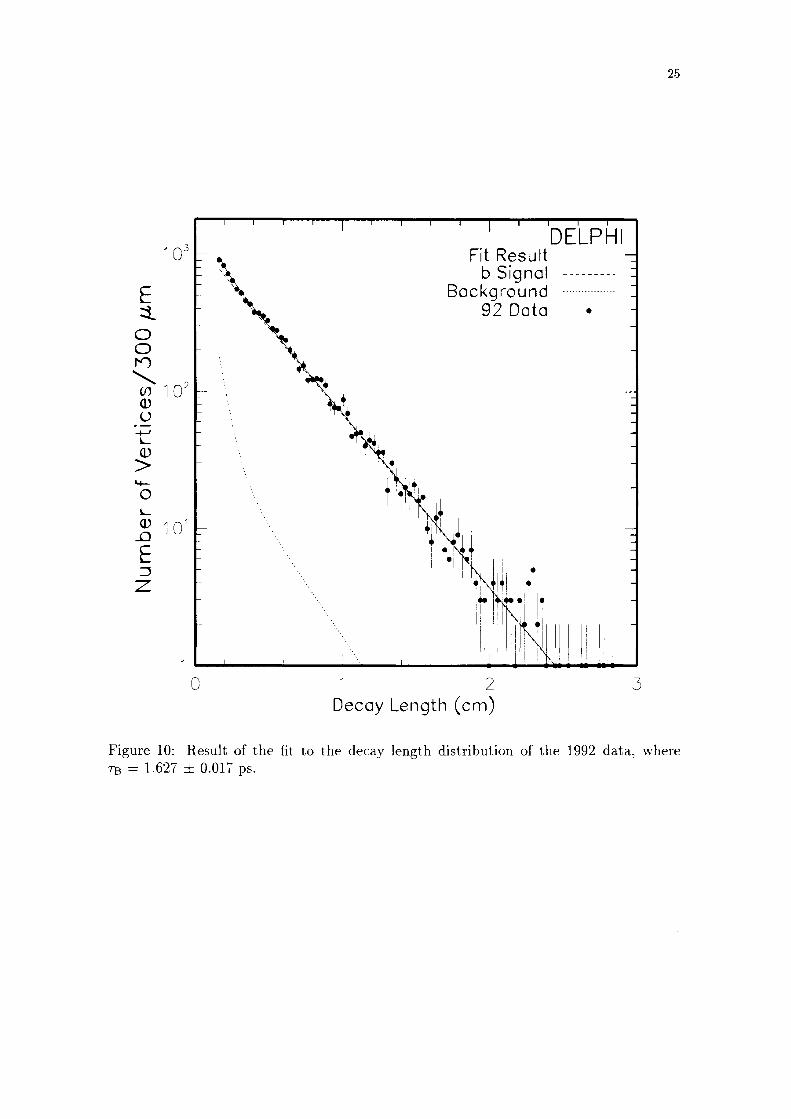
TB : 1.627 :1; 0.017 ps. OCR OutputFigure 10: Result 0f the fit t0 the decay length distribution of the 1992 data, where
Decoy Length (cm)
Mrs M M A iz
i.+z¤ W rw up ll. irin 1 '* ll
. . l+” M l92 in"
lll 2
cn WO
Q2 Dgtg •Bgckground
b Sngncnl_ Fat Result
DELPH
25
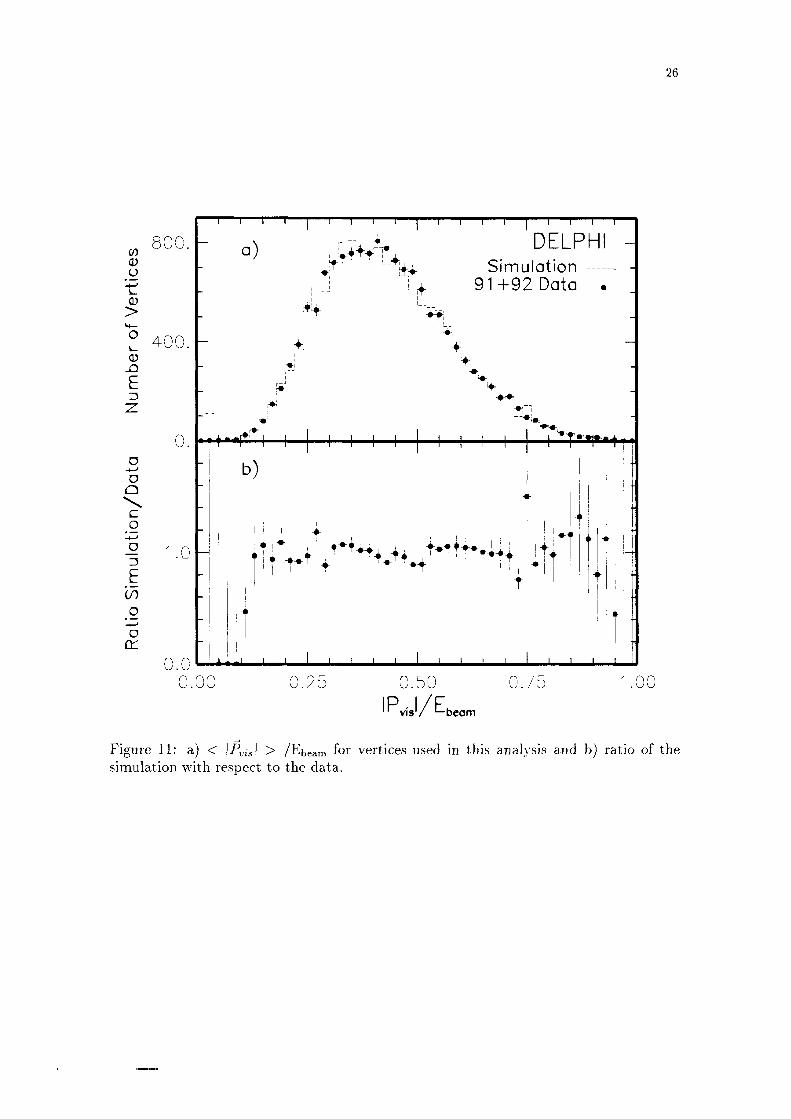
simulation with respect to the data. OCR OutputFigure ll: a) < |Pm| > /Eb€am for vertices used in this analysis and b) ratio of the
Pvisl/EbccmOOOOOO O.25 O.75 WOO
0.0
9 < , il WT ·'+*+i ~ #i+*+”`l +?l ¤“·Chl T¤rl++* » +’*¢*»+ " *`*‘lTi lm
[ 400.
Ls, 91 +92 Dato .4 Svmulotnon
#+Wv# * “·lU) soo'- O DQLPHI
26
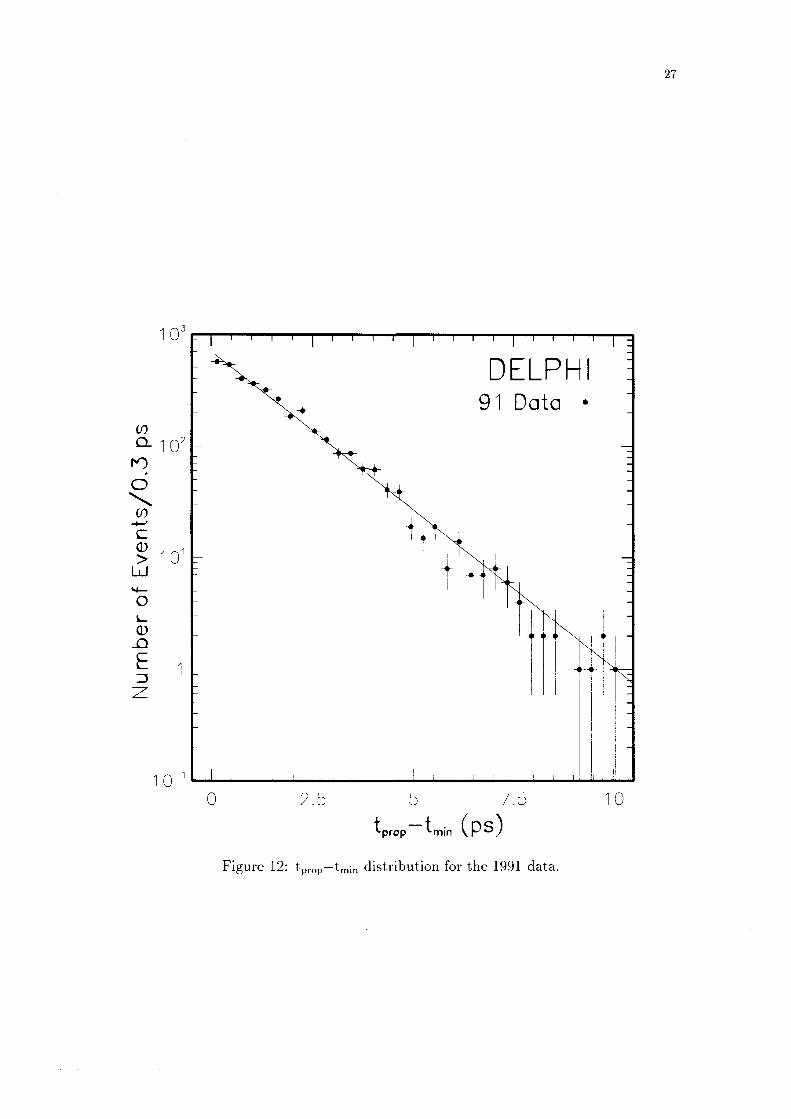
Figure 12: tpmp—tmin distribution for the 1991 data.
tprop_tmin
2.5 7.5 W O
W O
. + tmW O >G) W
Q 1 02
9 W Octcn
D E LP I-W
W O
27