A Pluralistic Account of Homology: Adapting the Models to the Data
16
Perspective A Pluralistic Account of Homology: Adapting the Models to the Data Leanne S. Haggerty, 1 Pierre-Alain Jachiet, 2 William P. Hanage, 3 David A. Fitzpatrick, 1 Philippe Lopez, 2 Mary J. O’Connell, 4 Davide Pisani, 1,5 Mark Wilkinson, 6 Eric Bapteste, 2 and James O. McInerney* ,1,3 1 Bioinformatics and Molecular Evolution Unit, Department of Biology, National University of Ireland Maynooth, Maynooth, Co. Kildare, Ireland 2 Unite ´ Mixte de Recherche 7138 Syste ´matique, Adaptation, Evolution, Universite ´ Pierre et Marie Curie, Paris, France 3 Center for Communicable Disease Dynamics, Harvard School of Public Health, Boston, MA 4 Bioinformatics and Molecular Evolution Group, School of Biotechnology, Dublin City University, Glasnevin, Dublin, Ireland 5 School of Biological Sciences and School of Earth Sciences, University of Bristol, Bristol, United Kingdom 6 Department of Life Sciences, The Natural History Museum, Cromwell Road, London, United Kingdom *Corresponding author: E-mail: [email protected]. Associate editor: David Irwin Abstract Defining homologous genes is important in many evolutionary studies but raises obvious issues. Some of these issues are conceptual and stem from our assumptions of how a gene evolves, others are practical, and depend on the algorithmic decisions implemented in existing software. Therefore, to make progress in the study of homology, both ontological and epistemological questions must be considered. In particular, defining homologous genes cannot be solely addressed under the classic assumptions of strong tree thinking, according to which genes evolve in a strictly tree-like fashion of vertical descent and divergence and the problems of homology detection are primarily methodological. Gene homology could also be considered under a different perspective where genes evolve as “public goods,” subjected to various introgressive processes. In this latter case, defining homologous genes becomes a matter of designing models suited to the actual complexity of the data and how such complexity arises, rather than trying to fit genetic data to some a priori tree-like evolutionary model, a practice that inevitably results in the loss of much information. Here we show how important aspects of the problems raised by homology detection methods can be overcome when even more funda- mental roots of these problems are addressed by analyzing public goods thinking evolutionary processes through which genes have frequently originated. This kind of thinking acknowledges distinct types of homologs, characterized by distinct patterns, in phylogenetic and nonphylogenetic unrooted or multirooted networks. In addition, we define “family resem- blances” to include genes that are related through intermediate relatives, thereby placing notions of homology in the broader context of evolutionary relationships. We conclude by presenting some payoffs of adopting such a pluralistic account of homology and family relationship, which expands the scope of evolutionary analyses beyond the traditional, yet relatively narrow focus allowed by a strong tree-thinking view on gene evolution. Key words: homology, network, comparative genomics, epaktolog, ortholog, paralog. The meaning of scientific terms cannot and should not remain fixed forever by the priority of the original definition. This is simply because our experience con- stantly outruns our terminology. —Theodosius Dobzhansky (Dobzhansky 1955) Defining Gene Families: A Central Complex Task in Evolutionary Studies Homology is acknowledged as an elusive concept, and yet it is central to comparative evolutionary biology, underpins phylogeny reconstruction (Felsenstein 2004) and develop- mental biology (Brigandt 2003), and is used extensively in ethology and psychology (Ereshefsky 2007). On the one hand, we have ontological concepts of homology, and on the other hand, practical homology definitions and the relationship between these theoretical and operational issues is a neglected area of evolutionary biology. In this manuscript, we explore a plurality of ontological bases for understanding homology in macromolecular sequences, and by extension, we explore concepts and definitions of gene family. The ontology—the study of what objects exist and how they relate to one another—is an important aspect of enquiry that is generally addressed before any practical effort to apply this ontology. We contend that a tree-thinking perspective has strongly influenced consid- eration of what the ontological basis of homology might be and has needlessly and unhelpfully constrained understand- ing through the notion that homologs fit into neat gene- alogical families that have evolved their differences according to some underlying phylogenetic tree. ß The Author 2013. Published by Oxford University Press on behalf of the Society for Molecular Biology and Evolution. This is an Open Access article distributed under the terms of the Creative Commons Attribution Non-Commercial License (http:// creativecommons.org/licenses/by-nc/3.0/), which permits non-commercial re-use, distribution, and reproduction in any medium, provided the original work is properly cited. For commercial re-use, please contact [email protected] Open Access Mol. Biol. Evol. 31(3):501–516 doi:10.1093/molbev/mst228 Advance Access publication November 22, 2013 501 by guest on March 23, 2016 http://mbe.oxfordjournals.org/ Downloaded from
-
Upload
sorbonne-fr -
Category
Documents
-
view
0 -
download
0
Transcript of A Pluralistic Account of Homology: Adapting the Models to the Data

Persp
ectiveA Pluralistic Account of Homology Adapting the Models to theDataLeanne S Haggerty1 Pierre-Alain Jachiet2 William P Hanage3 David A Fitzpatrick1 Philippe Lopez2
Mary J OrsquoConnell4 Davide Pisani15 Mark Wilkinson6 Eric Bapteste2 and James O McInerney13
1Bioinformatics and Molecular Evolution Unit Department of Biology National University of Ireland Maynooth MaynoothCo Kildare Ireland2Unite Mixte de Recherche 7138 Systematique Adaptation Evolution Universite Pierre et Marie Curie Paris France3Center for Communicable Disease Dynamics Harvard School of Public Health Boston MA4Bioinformatics and Molecular Evolution Group School of Biotechnology Dublin City University Glasnevin Dublin Ireland5School of Biological Sciences and School of Earth Sciences University of Bristol Bristol United Kingdom6Department of Life Sciences The Natural History Museum Cromwell Road London United Kingdom
Corresponding author E-mail jamesomcinerneynuimie
Associate editor David Irwin
Abstract
Defining homologous genes is important in many evolutionary studies but raises obvious issues Some of these issues areconceptual and stem from our assumptions of how a gene evolves others are practical and depend on the algorithmicdecisions implemented in existing software Therefore to make progress in the study of homology both ontological andepistemological questions must be considered In particular defining homologous genes cannot be solely addressedunder the classic assumptions of strong tree thinking according to which genes evolve in a strictly tree-like fashion ofvertical descent and divergence and the problems of homology detection are primarily methodological Gene homologycould also be considered under a different perspective where genes evolve as ldquopublic goodsrdquo subjected to variousintrogressive processes In this latter case defining homologous genes becomes a matter of designing models suited tothe actual complexity of the data and how such complexity arises rather than trying to fit genetic data to some a prioritree-like evolutionary model a practice that inevitably results in the loss of much information Here we show howimportant aspects of the problems raised by homology detection methods can be overcome when even more funda-mental roots of these problems are addressed by analyzing public goods thinking evolutionary processes through whichgenes have frequently originated This kind of thinking acknowledges distinct types of homologs characterized by distinctpatterns in phylogenetic and nonphylogenetic unrooted or multirooted networks In addition we define ldquofamily resem-blancesrdquo to include genes that are related through intermediate relatives thereby placing notions of homology in thebroader context of evolutionary relationships We conclude by presenting some payoffs of adopting such a pluralisticaccount of homology and family relationship which expands the scope of evolutionary analyses beyond the traditionalyet relatively narrow focus allowed by a strong tree-thinking view on gene evolution
Key words homology network comparative genomics epaktolog ortholog paralog
The meaning of scientific terms cannot and should
not remain fixed forever by the priority of the original
definition This is simply because our experience con-
stantly outruns our terminology
mdashTheodosius Dobzhansky (Dobzhansky 1955)
Defining Gene Families A Central ComplexTask in Evolutionary StudiesHomology is acknowledged as an elusive concept and yetit is central to comparative evolutionary biology underpinsphylogeny reconstruction (Felsenstein 2004) and develop-mental biology (Brigandt 2003) and is used extensively inethology and psychology (Ereshefsky 2007) On the onehand we have ontological concepts of homology and on
the other hand practical homology definitions and therelationship between these theoretical and operationalissues is a neglected area of evolutionary biology In thismanuscript we explore a plurality of ontological bases forunderstanding homology in macromolecular sequencesand by extension we explore concepts and definitions ofgene family The ontologymdashthe study of what objects existand how they relate to one anothermdashis an importantaspect of enquiry that is generally addressed before anypractical effort to apply this ontology We contend thata tree-thinking perspective has strongly influenced consid-eration of what the ontological basis of homology might beand has needlessly and unhelpfully constrained understand-ing through the notion that homologs fit into neat gene-alogical families that have evolved their differencesaccording to some underlying phylogenetic tree
The Author 2013 Published by Oxford University Press on behalf of the Society for Molecular Biology and EvolutionThis is an Open Access article distributed under the terms of the Creative Commons Attribution Non-Commercial License (httpcreativecommonsorglicensesby-nc30) which permits non-commercial re-use distribution and reproduction in any mediumprovided the original work is properly cited For commercial re-use please contact journalspermissionsoupcom Open AccessMol Biol Evol 31(3)501ndash516 doi101093molbevmst228 Advance Access publication November 22 2013 501
by guest on March 23 2016
httpmbeoxfordjournalsorg
Dow
nloaded from
It has long been recognized that sequence evolution is nottree-like in particular because of domain shuffling (Enrightet al 1999 Marcotte et al 1999 Portugaly et al 2006) It hasalso long been recognized that this non-treendashlike evolutionresults in a network of sequence relationships (Sonnhammerand Kahn 1994 Park et al 1997 Enright and Ouzounis 2000Heger and Holm 2003 Ingolfsson and Yona 2008 Song et al2008) However for an almost equally long period of time ithas been assumed that the right way to process this networkwas to carve it into homologous parts by clustering (Tatusovet al 1997 Enright and Ouzounis 2000 Yona et al 2000)Relevant clusters have generally been considered to be genefamilies with all members presenting full homology with oneanother Smaller relevant clusters have also been proposed byidentifying homologous domains for example families ofsequences presenting homology over their entire length butfrequently of smaller size than entire genes (Sonnhammerand Kahn 1994 Park and Teichmann 1998 Apic GoughTeichmann 2001b Wuchty 2001 Enright et al 2003 Songet al 2008) Both of these relatively local perspectives onsequence relationships are familiar to most biologists
Consequently the task of defining gene families has beengenerally delegated to software programs that search for clus-ters or communities of phylogenetically related sequencesIncreasingly with genomic data sets of genuinely enormoussizes the problem is considered best handled by such pro-grams And yet the practice of placing genes into discretegene families seems somehow at odds with the existence ofdomain databases (Corpet et al 2000 Majumdar et al 2009)that clearly demonstrate the pervasive influence of non-tree-like processes in molecular evolution (Levitt 2009) Wepropose not to carve up this network but to analyze its local(Sasson et al 2003 Atkinson et al 2009) and global structure(Adai et al 2004)
In the last 20 years as public repositories of macromolec-ular data have been greatly expanded it has become increas-ingly apparent that a tree-thinking perspective on molecularevolution while useful in many situations is inadequate in abroader context and is far short of universality (because forinstance many perhaps most genomes do not evolve solelyin a tree-like fashion) We address the fundamental meaningsof homology and its processual causes because without pre-cise insights into their meanings we can only design algo-rithms or methods of defining homologies and families thatcarry caveats about the kinds of homologies that are beingprioritized
Without wishing to be critical of the useful and importantwork of others it nonetheless seems unavoidable that wemust take examples from the literature to provide somecontext The TribeMCL (Enright et al 2003) approach to de-fining gene families illustrates the problem quite clearly Inthe manuscript describing the algorithm analysis of a data-base of 311257 proteins is reported Depending on the set-tings of the software 82692 ldquofamiliesrdquo could be identified or75635 families or 60934 families with the entire automatedprocess taking ~14 h on a large computing cluster (Enrightet al 2003) In this case the ldquoconceptrdquo of family was notexplicitly explored at an ontological level (though it built on
a general understanding of gene family at that time) there-fore the ldquodefinitionrdquo of a family was an operational one basedon a setting in a software programme instead of exploringevolutionary history and whether it might be simple or com-plex In this case family definition is a uniformly applied rulewhere one software option fits all Here we suggest thatalternatives to such simple approaches are desirablethough perhaps more difficult to achieve Similarly whilewe stress that the TribeMCL approach has proved to be ofenormous benefit we argue that many important evolution-ary events and types of family relationship can be missed ifthis kind of approach is the only one that is taken
A number of points should be made at this stage beforegetting to the main argument of the article In this article wespecifically wish to discuss homology in the context of genesand other genetic components such as promoters and sub-gene elementsmdashwhat we term genetic goods (McInerneyet al 2011) For such data the notion of ldquohomologrdquo andldquogene familyrdquo has been written about extensively but thereis still no universally agreed consensus on what either of theseterms mean (Duret et al 1994 Natale et al 2000 Perriere et al2000 Tatusov et al 2000 Dessimoz et al 2012 Miele et al2012) Additionally there are significant technical limitationsfor the detection of homologies Certain cutoffs are imposedon any analysis which leads to de facto homologies beingmissed because the sequences no longer manifest a level ofsimilarity that is greater than expected by random chanceDespite ambitious efforts to reduce this complication it islikely that large-scale underdetection of homologs is still aproblem (Weston et al 2004 Noble et al 2005) The argu-ment therefore might be made that every sequence is possiblyhomologous to every other sequence That is to say all extantmolecular sequences can trace their ancestry to a single nu-cleotide that has evolved by duplication and mutation Thisidea is not better than the alternative hypothesis that they donot all share common ancestry because terminal transferaseenzymes that exist can generate DNA sequences in a tem-plate-independent manner (Greider and Blackburn 1985)Nonetheless fundamental limitations for software programsdo not mean we cannot make progress in understandinghomology concepts and improve gene family classificationAcknowledging a plurality of concepts will enhance practicalgene family classifications In particular we wish to acknowl-edge that homologies are embedded within a wider set ofrelationships that we call ldquofamily resemblancesrdquo and this isfundamentally different to the traditional notion ofhomology
Homology Concepts and HomologyDefinitionsThe notion of homology has a long and rich history startingfrom before DNA was discovered In 1868 Owen (1868)wrote a now classic book summarizing his ideas on homolo-gies of the vertebrate skeleton Owen did not have an evolu-tionary explanation for homology and interpreted thehomologies that he inferred as variants on some kind ofldquoarchetyperdquomdashan ideal form of the organ that was constructed
502
Haggerty et al doi101093molbevmst228 MBE by guest on M
arch 23 2016httpm
beoxfordjournalsorgD
ownloaded from
by a creator In his book Owen (1868) declared that therewere three different kinds of homology Special homologydescribes when two organs had the same connection tothe body and performed the same function This meantthat the pectoral fin of a porpoise was homologous to thepectoral fin of a fish even though they were manifestly dif-ferent otherwise General homology referred to morphologi-cal features or parts of features that were of ldquothe same organrdquounder every variety of form and function Finally serialhomology referred to organs that were repeated on thebodymdashbristles on the legs of a fly for instance Owenrsquos chiefreason for writing this book seems to have arisen from hisfrustration with his fellow scientists using the word ldquoanalogrdquowhen they meant homolog
Since then within the field of morphology the concept ofhomology has been subject to substantial debate much ofwhich can be seen as reflecting tensions between qualitativecomparative anatomy and quantitative phylogenetics on theone hand and causal and acausal accounts on the otherThus there have been proposals to synonymize homologywith the cladistic concept of synapomorphy and accounts ofldquobiological homologyrdquo (Mindell and Meyer 2001) that seek toaccommodate new data from developmental biology on pat-terning and differential gene expression by explicating thenotion of homology in terms of shared developmental path-ways The importance of ontogeny notwithstanding of par-ticular conceptual interest is the notion of genetic piracy(Roth 1988) in which homology of some morphological char-acter persists despite the genetic basis of the trait changingmore or less completely over evolutionary time These otherdebates illustrate how new data and new understandings ofevolution often necessitate new usage of terms and clarifica-tion of concepts and models
When similar frustrations arose almost 140 years afterOwenrsquos work a collection of prestigious scientists felt theneed to clarify the meaning of the word homology in molec-ular sequence data (Reeck et al 1987) Interestingly this clar-ification did not entertain the notion that different types ofhomology may be required to handle molecular data possiblybecause to a certain extent there was a general consensus onthe ontological concept of homology (corresponding toOwenrsquos general homology) though a lack of consensus onthe practical identification of homologs A reading of theliterature today would corroborate the feeling that the prac-tical level seems to be the one at which the problems ofldquodefiningrdquo homologous genes lies though in fact the prob-lems have much deeper ontological roots
Walter Fitch commented that ldquohomology [ ] is indivis-iblerdquo (Fitch 2000) This sentiment is often used in the teachingof evolutionary biology classes and indeed is often quotedHowever Fitch (2000) also allowed for chimeric genes as oneexception to this general model Thus he wrote
If the domain that is homologous to the low-den-
sity lipoprotein receptor constitutes 20 of entero-
kinase then enterokinase is only 20 homologous
to that lipoprotein receptor irrespective of its per-
cent identity If at the same time this common
domain were half of the lipoprotein receptor the
receptor would be 50 homologous to the entero-
kinase The homologies are not the same in both
directions if the proteins are of unequal length This
is the only situation where ldquopercent homologyrdquo has
a legitimate meaning and even there it is danger-
ous and better called as Hillis has suggested partial
homology
In Fitchrsquos view saying that two proteins were homologousalong part of their length was fraught with the potential formisinterpretation Therefore the phrase ldquopartial homologyrdquoneeds to be used with care and should only mean that ldquothispart (X) of sequence 1 is homologous to that part (Y) ofsequence 2rdquo In this case some parts of sequences 1 and 2 dohave a common ancestor but we are implicitly acknowledg-ing that their last common ancestor is not also a commonancestor of sequences 1 and 2 in their entirety It would be amistake to consider such a change in phrasing merely asa matter of rhetoric Reeck et al (1987) pointed out that aprecise definition of homology would indeed be ldquoan unim-portant semantic issuerdquo if it did not ldquointerfere with our think-ing about evolutionary relationshipsrdquo At that time in the late1980s the problem stemmed from the common interchan-ging of the words ldquosimilarityrdquo with ldquohomologyrdquo (eg sayingthat two sequences were 80 homologous when the authorsreally meant that they were 80 similar in sequence) Reecket al offered the solution that ldquohomology should mean lsquopos-sessing a common evolutionary originrsquo and in the vast major-ity of reports should have no other meaningrdquo AccordinglyFitch later offered the opinion that homology was ldquo[ ] anabstraction in that it is a relationship common ancestry[ ]rdquo (Fitch 2000) This last point we feel is particularlyimportant
Thus the consensus among molecular biologists becamethat similarity was defined as quantitative by comparing thesequences in question but that homology was qualitativemdashsequences are homologs or they are not In fact the majorityof the literature from that time to present day suggests thathomology is a term that specifically refers to genes or proteinsthat manifest significant sequence similarity along the major-ity of their length Databases such as homologene (httpwwwncbinlmnihgovhomologene last accessed December10 2013) and COG (httpwwwncbinlmnihgovCOG lastaccessed December 10 2013) only contain genes that areallowed to be in one family Although we do not deny thatdatabase entries of such sequences are likely or certain to behomologs sole focus on those kinds of evolving entities(entries that trace their heredity to a single common ances-tor) and the heuristic of requiring homologs to manifest near-or full-length significant sequence similarity has clearly re-sulted in biases and information loss as has been demon-strated (Sonnhammer and Kahn 1994 Park et al 1997 Enrightand Ouzounis 2000 Heger and Holm 2003 Ingolfsson andYona 2008 Song et al 2008) Even if we had a universallyagreed definition of the gene (Epp 1997) it remains muchmore complicated to decide what might be a gene family
503
A Pluralistic Account of Homology doi101093molbevmst228 MBE by guest on M
arch 23 2016httpm
beoxfordjournalsorgD
ownloaded from
Gene length can vary from dozens of nucleotides (the short-est human gene is 252 nucleotides in length) to several hun-dreds of thousands of nucleotides Genes evolve by pointmutation legitimate and illegitimate recombination exonshuffling fusion fission invasion by selfish mobile elementsdomain replacement and so forth Is a gene that has a trans-poson inserted into the middle no longer considered to be amember of this family If a gene loses an exon and is nowquite different in length from other members then is it nolonger considered to be a member of this family In otherwords our current knowledge of the diversity of evolutionaryprocesses means that the generally agreed upon concept ofhomology needs revision and clarification and other con-cepts such as family resemblance need to be introduced
Recently there has been an increased focus on the prob-lems that domain shuffling in particular has created for effortsto distinguish orthologs and paralogs from sequences thatappear to be orthologous and paralogous when in factthey are not Strictly speaking two genes are orthologouswhen they are found in different species and can trace adirect lineage back to a single genomic locus in a commonancestor It can be expected that the sequence in thiscommon ancestor was not significantly different in domainarchitecture to the orthologs we observe todaymdashthough it isnot clear how different is too different Paralogs can tracetheir most recent common ancestor to a duplication eventagain with the expectation that the most recent commonancestor will have had a similar structure However in theevent that two genes or proteins look similar because theyhave been independently assembled through domain shuf-fling they will not fulfill these criteria In such cases the wordldquoEpaktologrdquo has been suggested to reflect similarity that is aconsequence of independently ldquoimportedrdquo domains (NagyBanyai et al 2011 Nagy Szlama et al 2011) Specificallythe authors ldquo[ ] refer to proteins that are related to eachother only through acquisition of the same type of mobiledomains as epaktologsrdquo (Nagy Banyai et al 2011) This is animportant consideration and to date we do not have a rig-orous analysis of known proteins to understand the extent towhich similar proteins are in fact epaktologs and not ortho-logs or paralogs However we argue here that there are ad-ditional important relationships beyond those found inepaktologs (see later)
The most widely used method of allocating genes to a genefamily is the Markov Clustering Algorithm (MCL) (Enrightet al 2002) which simulates flow through a network of se-quence similarity and cuts the network at those places whereflow is most restricted A sequence similarity network is com-posed of nodes and edges with the nodes representing geneor protein sequences and the edges representing some mea-sure of similarity between the sequences In practice onlyldquosignificantrdquo levels of sequence similarity are represented atall and these significant similarities are likely to representhomologous relationships because they are too similar tohave arisen by random chance Examples of such networksare given in figures 2 4 and 5 and will be discussed later in thisarticle The idea behind the clustering approaches such asMCL is that unimportant relationships as defined by small
common promiscuous domains can be safely deleted leavingthe more important relationships and these can be used todefine families This approach is hugely successful garneringwell in excess of 1500 citations at the time of writing Theauthors have been careful to say that this method should beused with care and indeed appropriate usage of MCL forconservative analyses of particular kinds of homologs is ex-pected to result in few if any errors However an ontologicalpremise for this method is that a gene can only belong to onehomologous familymdashthe method explicitly does not allow agene to belong to more than one family This is because it isassumed that either there are ldquonaturalrdquo discrete families andthe relative strength of association between a gene and itsfamily will emerge from the analysis or that some relation-ships are more important than others and the minor rela-tionships can be dismissed as relatively unimportantAlthough the philosophy of the approach (clearly influencedby the underlying assumption that gene evolution might betree-like and takes place independently in different families)has not been explored extensively in the literature we willargue that the effect of this algorithm is to principally enforcea tree-based viewpoint on gene families This introduces per-sistent issues in homology definition that can best be over-come by first adopting more realistic starting assumptions onhow genes evolve second by adopting new concepts of ho-mology and third by adjusting our methods accordingly
Defining Homologs Meets Different Kindsof ProblemsThe lack of agreement in how to define homologs (Fitch 2000Enright et al 2003 Li et al 2003 Wong and Ragan 2008Majumdar et al 2009 Dessimoz et al 2012 Miele et al2012) reflects the historical ideas concerning homology andthe attempt to fit notions that were developed for one pur-pose (morphological systematics and comparative anatomy)to data that are only obliquely related to this purpose Thefirst evolutionary character matrices (Abel 1910 Tillyard1919) were rectangular consisting of M rows N columnsMost phylogenetic software programs today require suchrectangular matrices and if the sequence data do not fitinto a matrix then the user has two choicesmdasheither addcharacters to represent ldquomissingrdquo data or prune the datauntil it becomes rectangular (Capella-Gutierrez et al 2009)Therefore there is an implicit assumption that data matricesshould look like this and an explicit requirement that the datais made to look this way Given that discussions of the prunedparts of alignments rarely make their way into the final man-uscript we have no clear idea how often these nonconform-ing data sets arise as a result of introgression and gene familymembership that involves more than one family
Additionally focusing on different aspects of sequence re-lationships that is the homology of entireties or of partsleads to different inferences of relationships and conse-quently to a lack of consensus The reality is of course thatdifferent parts of a gene sequence might have different his-tories so an honest appraisal of homology might require amore radical view of homology than is traditional Recently
504
Haggerty et al doi101093molbevmst228 MBE by guest on M
arch 23 2016httpm
beoxfordjournalsorgD
ownloaded from
Song et al (2008) offered a good example of this when theyasserted the restrictive caveat that homologous genes mustbe descended from a common ancestor that had the samemultidomain structure as contemporary sequences Twogenes that share a single domain and whose common ances-tor had quite a different structure are not considered to behomologous in their model The distinction between the twodifferent kinds of evolutionary trajectory is of course impor-tant however it does seem to confuse the notion of homol-ogy being the concept of relationship through commonancestry irrespective of how subsequent introgressiveevents have changed the overall domain neighbourhood Itis quite likely that what Song et al (2008) call domain sharingbut not homology is what Fitch (2000) and Hillis (1994)would call partial homology Though it is perfectly reasonableto say that convergently remodeled proteins with similarstructures cannot be true orthologs or paralogs they are ho-mologs nonetheless
Three Homology ModelsIn terms of homology concept and delineating homologygroupings a fundamental problem lies in the a priori modelthat we apply to our approach Here we define three sets ofmodels and we discuss how these models can affect notionsof homology First we have ldquostrong tree thinkingrdquo (STT) Thisperspective sees that the important perhaps only relation-ships are those that have arisen along a diversifying phyloge-netic tree and events such as residue substitution and smallindel events account for the changes between sequencesA phylogenetic tree we emphasize allows no introgressiveevents (Bapteste et al 2012) STT is useful when analyzing setsof homologs that have a tree-like history and is generally seenin the analysis of nonrecombining orthologs to determinespecies relationships (Doherty et al 2012) or nonrecombiningparalogs to understand duplication events (eg Feuda et al2012) Next we define ldquophylogenetic network thinkingrdquo(PNT) where legitimate recombination events are allowedand these turn a phylogenetic tree into a phylogenetic web(Huson and Scornavacca 2011) relating closely related se-quences without affecting homology relationships PNT isextremely useful for analyzing legitimate recombination(Huson and Bryant 2006) and understanding incongruencein gene or genome histories Finally we have ldquogoods thinkingrdquo(GT) that sees evolutionary history as being characterized bythe vertical and horizontal transmission of genetic goodsallowing introgressive evolutionary events (eg legitimateand illegitimate recombination events fusion fission etc)and depicting relationships between sequences in a morepluralistic manner (McInerney et al 2011 Bapteste et al2012) GT is the least conservative perspective and is themain focus of this manuscript Its biological implications arepotentially huge because it has been proposed that introgres-sion of domains has resulted in the evolution of various sig-naling systems (Apic and Russell 2010) and a correlation hasbeen suggested between the prevalence of proteins withmultidomain architectures and organismal complexity(Apic Gough Teichmann 2001a) Indeed a modest increasein number of domains allows for numerous novel genetic
interactions thus a small increase in genes sharing goodscould be largely sufficient to construct complex hosts(Koonin et al 2002)
Going back to Reeck et al (1987) important definitionaccording to which ldquohomology should mean lsquopossessing acommon evolutionary originrsquo and in the vast majority of re-ports should have no other meaningrdquo we want to stress that afundamental issue stems from the interpretation of the wordldquoardquo in the quoted sentence Traditionally evolutionary biolo-gists have used the word ldquoardquo in the STT sense (OrsquoHara 1997)or the PNT sense and judge that it means ldquoonerdquo For both ofthese perspectives the definition of homology can only meanthat homologs must trace back to a single common ancestorwithout gene remodeling by sharing of DNA from other lin-eages According to these perspectives the community ofdescent that unites complete genes with complete genescorresponds to the objects such as the branches on phyloge-netic trees or networks when these structures have beenconstructed from genes that are homologous along theirentire length (Li et al 2003) and where the genes have notbeen remodeled by illegitimate recombination throughouttheir history This is probably the most commonly under-stood definition of homology and it is certainly the focusof many software tools and algorithmic developmentsEmbracing this perspective (STTPNT homology concept) astandard operational criterion (STTPNT homology defini-tion) for homology is for instance that homology extendsfor at least say 70 or 90 of the length of the two genesbeing examined
However if we interpret a in GT sense McInerney et al2011) ldquoa common ancestorrdquo means ldquoat least onerdquo ancestor incommon with other proteins Then our concept of homologyis quite different and allows us to analyze a greater number ofevolutionary events and relationships though we must bemuch more careful about what we say about these evolvingentities So far this GT perspective has not been exploredmuch The concept of homology has usually been describedin terms of just the STTPNT viewpointmdashrather than the GTviewpointmdashand software and databases have been gearedtoward the analysis of homologs defined under the aegis ofthe STTPNT concept
Instead of the traditional narrower view of homology weadvocate that the pluralistic account of evolutionary pro-cesses and thus a pluralistic interpretation of the term ldquoardquoin Reecks et alrsquos definition is now scientifically most fruitfulbecause it results in definitions of GT-style homologs andfamily resemblances that can encompass a greater varietyof our empirical observations on sequence structures and isa better fit to our observations on the processes responsiblefor sharing of genetic ldquopartsrdquo at the molecular level in evo-lution Indeed STTPNT expectations for how homologsshould look have resulted in practical definitions of homologythat have often restricted how we have viewed gene genomeand protein evolution have affected the software and data-bases that have been developed to analyze genomic datahave affected the ways in which we think we should analyzemacromolecular sequence data and may have frequently suc-ceeded in blinding us to many crucial evolutionary events For
505
A Pluralistic Account of Homology doi101093molbevmst228 MBE by guest on M
arch 23 2016httpm
beoxfordjournalsorgD
ownloaded from
instance a recent publication (Miele et al 2012) that dealswith finding homologs from an exhaustive comparison of allmacromolecular sequences in a data set against all other se-quences in that data set starts with an opening line in theldquomotivationrdquo section of the abstract thusly ldquoProteins can benaturally classified into families of homologous sequencesthat derive from a common ancestorrdquo The manuscriptthen goes on to describe a very promising method for clus-tering protein sequences into groups that manifest extensivesimilarity along almost their entire length This clearly is aSTTPNT view of protein evolution where a family is definedin explicit though narrow terms and all segments of sequenceare expected to descend from one same common ancestornot many ancestors While being a completely legitimate wayof thinking about some protein relationships the complexityof the majority of data falls outside this narrow frameworkand we advocate that additional homology concepts canprovide an augmented view of protein evolution
Homology Concepts That Do Not AssumeTree-Like EvolutionIs there a homology concept that fits the data better than theSTTPNT concept and could it conceivably reduce the likeli-hood of overly restrictive and potentially incorrect inferencesoccurring We think that the most efficient way to amelioratethe risk of error and to really account for evolutionary rela-tionships between sequences is to realize where the mostfundamental problem lies Most algorithms would run quicklyif genetic data had genuinely evolved in a tree-like way In factno sophisticated algorithm would be necessary at all as thegene families could be easily parsed from an all-versus-all genesimilarity search and assuming the search was sensitiveenough they would naturally fit into their respective familiesHowever real data have experienced more complex evolu-tionary processes (Nagy Banyai et al 2011 Nagy Szlama2011)
We propose that methods for defining homologous genes(gene families) that require homology to extend along mostof the sequence (Miele et al 2012) might be described by thesearch for ldquotribesrdquo of proteins We choose the word tribesbecause this is the original meaning for the word phylogeny(from the Greek Phylos meaning ldquotriberdquo and Genis meaningldquooriginrdquo Sapp 2009) Therefore such tribes of sequences arelikely to be amenable to phylogenetic tree or network con-struction using standard software currently available(Felsenstein 2004 Huson and Scornavacca 2011) We notethat this fits well with the objective of such programs asTribeMCL (Enright et al 2003)
In continuing with the etymology of the word phylogenywe wish to point out however that tribes are known to splitand merge with other tribes to subsume and to be sub-sumed Although analyzing homology along the entirelength of a sequence is somewhat akin to a tribal origin anal-ysis (a phylogenetic analysis of that tribe) it is by no meansthe only way that we can look at homology We might con-sider that at one extreme there are tribes of sequences thatare mostly isolated ldquoclosedrdquo tribes (fig 1 Family A) but that
there are also tribes that are more ldquoopenrdquo in terms of tribalmergers and divisions (fig 1 Family B Boucher and Bapteste2009) In the case of Family B it would be standard practice tosplit the family into four tribes to carry out phylogeneticanalyses thereby missing out the context in which theentire family has evolved These open tribes are not readilyanalyzed using current phylogenetic methods because thecomponents of some of the sequences have separate originsand separate roots (in our toy example the black blue yellowand red gene parts all have separate roots) In other wordsevolution has frequently occurred through introgression(Bapteste et al 2012) with genes and parts of genes actingas goods (McInerney et al 2011) that can be shared such thata homology concept that only accommodates STTPNT islikely to be incomplete as a basis for categorizing and describ-ing the evolutionary histories (Bapteste et al 2012) To dem-onstrate this we explore the assumptions and expectations ofSTTPNT
Building on the historical role of morphology in the studyof homology STTPNT considers either a complete organ or asignificant part of an organ This perspective has some con-sequences for the breadth and depth of analyses that can becarried out The first consequence is that the organ should beclearly defined as a 11 correspondence In contrast most newgenes are constructed from existing parts fusions of genespromoters introns exons and motifs are common (Levitt2009 Bapteste et al 2012) This means that different partsof proteins can be expected to have different evolutionaryhistories The different parts of a protein-coding gene mightthemselves be homologs of one another and may have arisenby tandem duplication or introgression of previously spatiallyseparated DNA sequences (Bapteste et al 2012) Even withinmorphology it has been recognized that partial homologiesoffer a much broader view of evolution (Sattler 1984)
The second consequence of STTPNT-based explanationsof homology is that the notion of homology being indivisibleis easy to understandmdashtwo organsgenes are either homologsor they are not The problem we have with molecular se-quence data is that we now know that a great number ofmolecular sequences are related to a great many other mo-lecular sequences with varying amounts of structural (eg
FIG 1 Two extremes of family evolution Family A is a closed familyshown to evolve according to a strict tree-like process Family B is anopen family that evolve by horizontal and vertical evolutionary pro-cesses Its members display family resemblances as they can be con-nected through intermediates and relationships of GT homology (seemain text)
506
Haggerty et al doi101093molbevmst228 MBE by guest on M
arch 23 2016httpm
beoxfordjournalsorgD
ownloaded from
domain content) similarity (Adai et al 2004 Halary et al 2010McInerney et al 2011 Bapteste et al 2012 Alvarez-Ponce et al2013) Consider the thought experiment where we have fourproteins (see table 1) each protein has two domains and wehave four domains in total Gene1 has domains A and BGene2 has domains B and C Gene3 has domains C and Dand Gene4 has domains A and D All four proteins haveparticular kinds of relationships to the others that cannotbe described by an ldquoall or nothingrdquo model This problem af-fects both the homology concept and the homology defini-tion We will refer to this thought experiment when dealingwith real data in ldquocase 4rdquo later
Current STTPNT thinking does not address most of theissues we have just raised because being founded on an as-sumption of tree-like evolution it produces a bias against thedetection of introgressive processes Relied upon exclusively itprevents us from investigating those non-tree-like evolution-ary events and relationships that could be revealed througha more pluralistic view of homology In the following threeexamples we use a standard set of analytical tools to dem-onstrate how our views of what constitutes a homologousfamily are influenced by the use of such heuristic approachesWe use BlastP (Altschul et al 1997) and then pass the datathrough the MCL software (Enright et al 2002) using defaultparameters
Case 1 A Ten-Gene Data Set from Four EntericBacterial Genomes
In this case we analyze data from four enteric bacterial ge-nomesmdashone Escherichia coli one Salmonella one Yersiniaand one Shigella genome (data available as supplementaryinformation S1 Supplementary Material online Case1aln)Homologous proteins with a helix-turn-helix motif arefound ten times in these four genomes using a standard sim-ilarity search algorithm (Altschul et al 1997) However thesegenes are short and quite variable Short gene length reducesthe possibility that Blast can detect significant sequence sim-ilarity Figure 2 depicts the gene similarity network that can beconstructed from this gene family when an all-versus-all Blastanalysis is carried out with a cutoff e-value of 106 As can beseen not all genes show significant sequence similarity withall other genes according to this analysis However usingClustal Omega (Sievers et al 2011) the alignment shown infigure 2 can be produced and using FastTree with the defaultparameters (Price et al 2010) the tree shown in figure 2 canbe produced from that alignment The Blast network alsoshows an analysis of what happens if the MCL software(Enright et al 2002) is used to identify homologs with thedefault inflation value set at 20 MCL cuts this graph intothree tribes The color coding of the sequences on the Blastgraph the alignment and the phylogenetic tree reflects howMCL would carve up the data The STTPNT proposition isthat a gene family would be characterized by all members ofthe gene family recognizing all other members in a similarityanalysis This does not happen so MCL divides up the genefamily into three tribes In these tribes all members recognizeall other members
One of the features of note in this alignment is that theproteins are quite variable in length and indeed this is likelyto be part of the reason why Blast does not produce a com-pletely connected component where all sequences show sig-nificant similarity to all other sequences The four sequencesshaded in brown contain a conserved 18-amino acid stretchthat has either been gained by these sequences or lost in the
Table 1 An Illustration of Four Hypothetical Genes That Manifest aHistory of Introgressive Processes
NOTEmdashEach gene consists of two domains the colors are the same for homologousdomains
Box 1Term Meaning
Homologs Having a relationship through descent from at least one common ancestor
Family resemblance Having an evolutionary relationship through intermediate sequences and common descent
Clique A subgraph in a network where every member of the subgraph is connected to all other members
STT Strong tree thinking A perspective that sees homology statements as valid when the homologs haveevolved down the branches of a bifurcating phylogenetic tree
PNT Phylogenetic network thinking A perspective that sees homology statements as valid when the homologshave evolved through tree-like processes but allowing for some homologous recombination therebymaking a phylogenetic network
GT Goods thinking A perspective that sees homology relationships encompass illegitimate recombinationfusion and fission of evolving entities in addition to vertical descent Gene evolution is expected attimes to be very complex and involve merging of evolving entities
N-rooted fusion networks A new kind of network that depicts rooted networks with at least one fusion node and at least tworoots
TRIBES Homologs that have a 11 correspondence in terms of being homologous for most or all their length
TribeMCL One of the most successful approaches to finding communities in networks of gene similarity
507
A Pluralistic Account of Homology doi101093molbevmst228 MBE by guest on M
arch 23 2016httpm
beoxfordjournalsorgD
ownloaded from
FIG
2
Ate
n-g
ene
data
set
ofa
fam
ilyof
shor
tp
rote
ins
wit
hco
nsi
dera
ble
vari
atio
ni
ncl
udin
gse
gmen
tall
engt
hva
riat
ion
and
pos
sibl
ya
chim
eric
hist
ory
(a)
Mul
tip
lese
quen
ceal
ign
men
tw
ith
com
ple
tely
con
serv
edp
osit
ion
sin
the
alig
nm
ent
are
indi
cate
dby
colu
mn
sw
ith
are
dba
ckgr
oun
dan
dw
hite
typ
efac
est
rong
lyco
nse
rved
posi
tion
sar
ein
red
typ
efac
ean
dsu
rrou
nde
dby
abl
uere
ctan
gle
and
the
mos
tva
riab
lep
osit
ion
sar
ein
blac
kty
pef
ace
Posi
tion
sw
here
ther
eis
no
hom
olog
ous
resi
due
are
rep
rese
nte
dby
ado
t(b
)R
esul
tsof
anal
l-ver
sus-
allB
last
sear
chw
ith
allp
rote
ins
rep
rese
nte
dby
ano
dean
dal
lsig
nifi
can
thi
tsre
pre
sen
ted
byan
arc
draw
nbe
twee
nn
odes
Arc
sdr
awn
asda
shed
lines
refle
ctth
ose
edge
sth
atar
ere
mov
edin
ast
anda
rdT
ribe
MC
L(E
nrig
htet
al2
002)
anal
ysis
(c)
Ap
hylo
gen
etic
tree
infe
rred
from
the
alig
nm
ent
See
mai
nte
xtfo
rde
tails
ofan
alys
is
508
Haggerty et al doi101093molbevmst228 MBE by guest on M
arch 23 2016httpm
beoxfordjournalsorgD
ownloaded from
others In addition there is considerable length variation atthe N- and C-termini of the sequences
In the analysis of this alignment of sequences an STTPNTperspective will be faced with a conundrum The foursequences at the bottom of the alignment identified by thebrown taxon labels on the alignment brown nodes on thenetwork and brown tip labels in the tree have an 18-aminoacid stretch that is clearly homologous among these foursequences and is absent in the other six sequencesAlthough the sequences clearly manifest homologous rela-tionships should this process of insertion or deletion occurfrequently then descendants of these sequences might notcontain any amino acid residues homologous to the residuesthat exist today As a thought experiment imagine if we dis-covered a series of proteins that differed from each other bythe presence or absence of small domains eventually leadingto a collection of sequences where at the two extremes of thisseries we have proteins that do not share any domains (as intable 1) Then both the STT and PNT perspectives would saythat these proteins at the extremes do not have a relationshipthrough common ancestry whereas a GT perspective wouldsay that they do A GT model for homology that we coulddesignate as the ldquoopen tribesrdquo or family resemblance modelwould better accommodate this kind of situation which weshow later in this manuscript to be a very common situation
Case 2 A Set of Orthologs from Closely RelatedYeast Species
The Candida Gene Order Browser (CGOB) database (httpcgobucdie last accessed December 11 2013) is a carefullycurated data set of 13 yeast (mostly Candida) genomes thathave been aligned so that any particular gene can act as aldquofocus pointrdquo and all its orthologs (if present) are presented
to the viewer as pillars and their neighbors are also visible (seeFitzpatrick et al 2010 for details) Figure 3a shows an examplefrom this database Open reading frame 192962 from thegenome of Candida albicans is the focus gene and its ortho-logs are displayed underneath it On the left and the right ofthis gene are two genes that are strongly conserved in allspecies Orthology is easily recognized in these neighborsusing standard analyses of similarity In the pillar that is infocus (the orf192962 pillar) are 11 orthologs of this gene withthe ortholog being absent in the genome of C lusitaniaeFigure 3b shows a network representation of the all-versus-all database search for this set of orthologs The nodes ingreen produce a significant Blast hit when compared withorf192962 As can be seen only three genes produce a signif-icant result The other orthologs are included in the networkonly as a consequence of the full analysis of Blast searchesApplying MCL to this data set results in six Blast hits (state-ments of homology) being discarded and consequently splitsthe data into two communities In standard phylogenomicanalyses this set of orthologs that are weakly conserved insequence but strongly conserved in genomic location mightbe analyzed as though they are two separate families when infact by any reasonable criterion they should be analyzed as asingle albeit quite variable family
We used the CGOB database to explore how often thestandard Blast approach to detecting orthology would fail todetect de facto orthologs The CGOB contains 6548 orthol-ogy pillars that obviously contain two or more orthologs Ofthese 707 contain at least one ortholog that would be missedin an all-against-all Blast search of the database They havebeen manually included in orthology pillars based on syntenyand weak Blast hits This constitutes ~108 of CGOBs orthol-ogy pillars where on the basis of Blast alone the orthologs
FIG 3 Analysis of a family of divergent orthologs in Candida and close relatives (a) A view of three pillars from the CGOB database showingorthologous genomic locations for 13 organisms with gene names as per the CGOB database The focus gene (orf192962) is colored in white the threeorthologs that are identified in a standard Blast search are colored in green and the other orthologs are colored in orange if they are identified in theBlast search as a ldquohitrdquo but not a significant hit an the gene is colored red if no hit was returned (b) A sequence similarity network constructed usingCytoscape (Shannon et al 2003) based on the pattern of significant Blast hits from an all-versus-all search Dashed lines indicate where the MCLalgorithm splits the data into two partitions
509
A Pluralistic Account of Homology doi101093molbevmst228 MBE by guest on M
arch 23 2016httpm
beoxfordjournalsorgD
ownloaded from
would be split into more than one family Naturally we an-ticipate that this figure will increase substantially as we movetoward examining organisms that are more distantly relatedthan a group of closely related Ascomycota Many or mostldquounknownrdquo proteins could or should be placed into existingfamilies were it not for the limitations on computationaltools andmdashvery specificallymdashapproaches
Case 3 N-Rooted Networks
Figure 4 presents the results of two analyses of proteins thathave likely experienced a gene fusion This gene fusion isclearly seen in figure 4a which is a sequence similarity net-work based on Blast searches There are in fact two maximalcliques (completely connected subgraphs that do not existexclusively within the vertex set of a larger clique) in thisnetwork The collection of three genes on the left of thenetwork and the three genes in the middle of the networkcollectively form a clique In addition the three genes in thecenter of the network and the seven genes on the right also
form a clique The three genes on the left and the seven geneson the right are not directly connected to each other Thiskind of graph topology strongly suggests a gene fusion orfission event In this example we are going to assume thatthe three genes in the middle clique are derived fusion genesand not ancestral (note that the following will be true for anygenuine product of gene fusion even if this specific network isnot)
One set of proteins (the three genes on the left in fig 4a)are members of the COG1123 family as defined in the COGdatabase (Tatusov et al 2000) and they function as ATP-binding proteins The second family of seven genes on theright belong to COG0842 and function as ABC-2 type trans-porters The fusion genes are bifunctional ATP-binding andtransport proteins For this analysis we aligned the fusionproteins (a total of three proteins) separately with theCOG1123 proteins (a total of three proteins in this familyresulting in a six-sequence alignment) and separately wealigned the three fusion proteins with the seven membersof COG0842 These two alignments were merged into a
FIG 4 An example of a data set that cannot fit onto a conventional phylogenetic tree diagram The sequence similarity network displays the significantsimilarity results from a Blast search of the collection of proteins against one another The tree on the left is the tree recovered from a concatenated dataanalysis and rooted arbitrarily on the internal branch separating the COG1123 proteins from the rest The network on the right is what we call anN-rooted network (in this case N = 2 so it is a two-rooted network)
510
Haggerty et al doi101093molbevmst228 MBE by guest on M
arch 23 2016httpm
beoxfordjournalsorgD
ownloaded from
single alignment (available in supplementary information S1Supplementary Material online) and two analyses were car-ried out
The first analysis is seen in figure 4b left tree This tree wasconstructed from a complete alignment of the data withmissing parts padded out in the alignment using gap charac-ters The resulting tree is manifestly incorrect from two per-spectives First COG1123 and COG0842 should have twodifferent roots because they have two different origins yetthis diagram depicts a single origin of the entire tree Secondthere is no rooting of this tree that can depict the fusion eventproperly This is because this representationmdasha treemdashis nothow the data have arisen A fusion event is accurately repre-sented by a node with an in-degree of two and standardphylogenetic trees do not contain such nodes The networkon the right of figure 4b is an accurate representation of howthe data have arisen In this case the N-terminal end of thefusion proteins were aligned to the COG1123 sequences (re-sulting in a six-sequence alignment) and the C-terminus por-tions of the fusion proteins were aligned to COG0842 TheFastTree software (Price et al 2010) was used to constructtwo maximum likelihood trees from the data and then thesetrees were midpoint rooted and merged manually using theAdobe Illustrator software (naturally there is more than oneway to generate such a graph but for illustration purposes wechose this method) The resulting network which we call anN-rooted fusion network is a more accurate representation ofthe evolutionary history of these sequences The two rootsof the network are indicated and the approximate location ofthe fusion event is indicated using the black dot We note thatthis is an ad hoc placement of the fusion eventmdashfuture workcan focus on methods for accurately investigating the loca-tion of a fusion node We cannot rule out the possibility orindeed likelihood that the genes described here are in factrelated through some ancient undetectable community ofdescent This would mean that for the two-rooted networkin figure 4b we would simply be leaving out the edges of thenetwork that would unite the two root edges further back intime turning this two-rooted network into a more classicphylogenetic network as expected in PNT Of course it isalso possible that these two roots would join other kinds offamilies that would join other kinds of families and so forthconsistent with GT Thus although this simple example hastwo root nodes (it is a two-rooted fusion network) largemultidomain proteins probably need to have their evolution-ary history represented by 3- 4- or N-rooted networks asindicated by our next example
Is it possible that COG1123 and COG0842 are indeedhomologous in the PNT sense but this homology cannotbe detected As we have said earlier and as seen in Cases 1and 2 there is a severe technical limitation that means thatmany homologies are not detected This affects our homologydefinitions more than our homology concepts Even if there isdeep undetected homology of the PNT variety betweenthese two groups of genes N-rooted networks are useful forproviding a more complete picture of evolutionaryrelationships
Case 4 Composite Genes in the Genomes of 15Eukaryotes
The single connected component shown in figure 5 illustratesthe value of GT (McInerney et al 2011) in the study ofhomology To generate this figure we have used sequencesfrom a total of 15 eukaryotic genomes (see supplementaryinformation S1 Supplementary Material online) The totalnumber of genes was 199592 A similarity network was con-structed from this data set using the BlastP program (Altschulet al 1997) with the cutoff set to an e-value threshold of1e10 We searched through this network for compositegenes using the program FusedTripletspy (Jachiet et al2013) and a verification test at 1e20 threshold Thus agene C is identified as composite if there are two componentgenes A and B such that A and C are similar with an e-valueless than 1e20 B and C are similar with an e-value less than1e20 In addition A and B Blast matches on C do notoverlap and A and B are not similar with an e-value greaterthan 1e10 Next we looked for multicomposite geneswhich is the name we give to composite genes whose com-ponent genes (A and B) are themselves composites
The similarity network has a giant connected component(GCC) This GCC contains 414 of the nodes (82702) andmore than 90 of the edges (8826323) It is very dense with amean degree of 200 This makes it impossible to visualize withCytoscape (Shannon et al 2003) or Gephi (Bastian et al 2009)
Interestingly we have a situation for this relatively smalldata set of just 15 genomes where we can find a chain ofsignificant sequence similarity between any two pairs of genesfor almost half of the genes in the network Under the con-ventional homology concept the distant homology betweenany pair of dissimilar sequences is only retrieved by a chain ofhomologous intermediates with entire length similarities Analternative GT-based explanation is that sequences with dif-ferent ancestors recombine to create intermediate sequencesthat share partial homology with both of their ancestral se-quences Figure 5 illustrates that this alternative explains mostof this pattern in the data This is the situation that is outlinedin table 1 In this case we do not suggest that we alter themeaning of homology so extensively that sequences that haveno ancestorndashdescendent relationship to one another are stillconsidered homologous Instead homologous relationshipsare those where descent from at least one common ancestorhas occurred and family resemblance relationships(Wittgenstein 2009) are those where a path of significantsimilarity can be found through a graph like we see infigure 5 that links the two sequences
Composite sequences as identified by FusedTriplets(Jachiet et al 2013) uncover this kind of nontransitive rela-tionship that may result from nonhomologous recombina-tion domain shuffling gene fusion or indeed fission eventsMost of the represented communitiesmdashand almost all of thelargest and central communitiesmdashcontain at least a smallproportion of such composite sequences A total of 24 ofthe sequences in the GCC contain a composite signature(which explains the yellowish look of the result) to be com-pared with the 6 proportion of composite sequences for the
511
A Pluralistic Account of Homology doi101093molbevmst228 MBE by guest on M
arch 23 2016httpm
beoxfordjournalsorgD
ownloaded from
FIG 5 GCC from all-against-all BlastP search of 15 eukaryotic genomes Nodes represent communities as identified using a single pass of the Louvainalgorithm Node area representing size of community and edge thickness is the square root of the number of edges connecting two nodes with theexception of the largest edge that has its size represented by a thickness five times smaller (corresponding to 220000 edges instead of the actual110000) Nodes on the left diagram are colored according to the proportion of composite genes in the community (from green = 0 to purple = 100)Subnetworks of four communities are displayed around the figure These communities have been chosen along the range of composite proportion(from light green to light red) to illustrate the variety of community structures Nodes from these insets are colored in green for noncompositesequences yellow for composite sequences and red for multicomposite sequences that is composites sequences whose component genes arethemselves composites See supplementary figure S1 (Supplementary Material online) for a pie chart representation of the proportion of noncompositecomposite and multicomposite genes in each community
512
Haggerty et al doi101093molbevmst228 MBE by guest on M
arch 23 2016httpm
beoxfordjournalsorgD
ownloaded from
rest of the network (outside the GCC) Furthermore somecomposite sequences also tend to recombine with 10 ofsequences identified as multicomposite sequences in theGCC The structure of the GCC (and of some communities)exhibits large cycles without chords (holes) which also pro-vides evidence of multiple introgressive events in the historyof these proteins This demonstrates the extent to which wecan see non-tree-like evolution in many places in this data set
Phylogenetic software tools or methods have not tackledthe evolution of composite molecular sequences despite thepervasiveness of introgression The complex yet real relation-ships between remodeled genes remains a blind spot for mostanalyses because most analyses are performed at a muchmore local scale after the clustering steps It is not clearwhy this perspective is the one usually adopted becausethere are several databases of multidomain proteins(Majumdar et al 2009) and a high level of interest in howdomains combine (Sonnhammer and Kahn 1994 Park andTeichmann 1998 Enright et al 1999 Marcotte et al 1999Apic Gough Teichmann 2001b Wuchty 2001 Enright et al2003 Portugaly et al 2006 Song et al 2008) However thedominant concept of STT homology the focus on tree think-ing as the prism through which we should view evolutionaryhistories has undoubtedly played a role
A Pluralistic Account of HomologyThe concept of homology is defined as ldquodescent from acommon ancestorrdquo However unless we include situationswhere the number of ancestors is greater than one then itis necessary to ignore many real relationshipsmdashat themoment this is a very common situation The standard clas-sifications of homologs place them into the category of ortho-log (originating as a consequence of speciation) paralog(created by gene duplication) xenolog (created by horizontalgene transfer of an entire sequence) or ohnolog (created bywhole genome duplication) all of whom are divergent eventsthat are expected to appear under the standard concept ofhomology and are adequately analyzed using phylogenetictrees or phylogenetic networks In contrast the merger oftwo evolving entities (Bapteste et al 2012) is not expectedunder a tree-thinking perspective and the standard conceptof homology Very little software has been developed to takeaccount of this kind of process and indeed where softwarehas been developed to analyze introgressive events the re-sulting homologs have been described as not being homologsat all (Song et al 2008)
Evolutionary biologists might wish to know about the evo-lution of more complex gene families for example the originsof entire connected components in a gene network and notjust members of the same tribe Alternatively it might not beinteresting to carry out such a broad-scale analysis and in-stead a narrower focus on a closed family or a subset ofmembers of an open tribe is desired If the latter is it possibleto clearly articulate why this subset of evolutionary events arethe only ones to be studied We do not say that this is aninvalid thing to domdashfar from it but it is necessary to be clear apriori why this is the only kind of evolutionary event that is tobe studied when a more pluralistic account of evolutionary
processes is possible Gene evolutionary analyses and phylo-genetic analyses are not the same thing (Bapteste et al 2009)Complete reliance upon only full-length homologs in phylo-genetic analysis has the potential to censor our understandingof nature (see Dagan [2011] for instance) The pervasive con-tribution of introgression is a strong incentive to developtools to handle data created by such events
It would be absurd to suggest that all the genes in figure 5are homologs of one another (in the traditional sense) how-ever it is clear that there are relationships that can be ex-plored that are outside what is conventionally expected ofhomologs Going back to our earlier thought experimentswith four genes and four domains with each gene havingtwo domains (see table 1) these genes will form a ring struc-ture in a network analysis (a situation we see repeatedly in theempirical data used to construct fig 5) We can clearly seethat Gene1 has partially homologous relationships withGene2 and Gene4 Likewise Gene2 has partially homologousrelationships with Gene3 and Gene1 Gene3 has partially ho-mologous relationships with Gene4 and Gene2 Gene4 haspartially homologous relationships with Gene1 and Gene3We can also say that Gene1 and Gene3 have a family resem-blance relationship that is only evident because of the pres-ence of intermediates Gene2 and Gene4 also have a familyresemblance relationship This is to say that they are notrelated through common ancestry but through intermediategene sequences that show a line of common ancestry In thevernacular form it might be said that they are related throughmarriage (a union of their relatives) In terms of networkanalyses two nodes that are directly connected to one an-other on a network are homologs (shortest path length of 1)while two nodes that are connected with a shortest pathlength that is greater than 1 can be considered to have afamily resemblance (whose origin can be explored do theydisplay STTPNT homology that is no longer detectable byBlast Are they made of components that are shared withinan open tribe etc) Thus molecular data are complex withpairs of genes that have only one last common ancestor andother pairs that have more than one last common ancestor
By stating a pluralistic concept of homology emphasizingthe possibility of both partial homology and linkages that leadto family resemblances between pairs of sequences in theabsence of any direct homology (partial or complete) wewish to offer some ways to deal more inclusively with agreater range of homologies and similarities in sequencesFor the most part such pluralistic homology relationshipshave been depicted using connected components in se-quence similarity networks (Dagan et al 2008 Dagan andMartin 2009 Dagan 2011 Kloesges et al 2011 Baptesteet al 2012 Jachiet et al 2013 also see figs 2ndash5 in this man-uscript) However in this article we have also introduced theidea of using N-rooted fusion networks as an additionalmeans of analyzing such data Thus a combination of genesimilarity networks and N-rooted fusion networks could pro-vide a more inclusive analysis and visualization approach withthe ability to deal with multiple (gt1) multiple sequence align-ments generating multiple phylogenetic trees or networks
513
A Pluralistic Account of Homology doi101093molbevmst228 MBE by guest on M
arch 23 2016httpm
beoxfordjournalsorgD
ownloaded from
that can be fused together to reflect evolutionary historiesmore realistically
The timing of fusions could be estimated using for in-stance maximum likelihood or Bayesian approaches by ref-erence to a fossil record or some such external timing Relativeor absolute timescales for fusion events can place them in thecontext of environmental change for instance Currentlyestimating historical dates is restricted to ramifications onbi- or multifurcating phylogenetic trees (eg Tamura et al2012) However the amount of introgression we see infigure 5 suggests the presence of large-scale introgressiveevents whose timing and context are poorly understood
Enzymatic properties and how they change can bemapped onto these new structures and the frequency ofldquoemergentrdquo properties (Fani et al 2007) or shifts in selectivepressures on individual amino acids can be estimated withrespect to N-rooted fusion networks Currently tracing func-tional evolution is most often carried out by mapping traitsonto phylogenetic trees of full-length homologs (eg seeFeuda et al 2012 and also Adai et al 2004) The hotly debatedldquoortholog conjecturerdquo states that orthologs are more similarin function despite being in different species compared withparalogs that are to be found in the same species (Nehrt et al2011 Altenhoff et al 2012 Chen and Zhang 2012) Sequencesimilarity network and N-rooted fusion networks offer thepossibility of tracing functional evolution in a much moreinclusive manner We can ask whether functional variationand family resemblance are strongly or weakly linked andwhether there are patterns that can emerge from such ananalysis Because there are many constraints on the kinds ofgenetic goods that can be joined together (see eg the con-tent of the fusionDB database that clearly shows patterns offusions are not random) a ldquofamily resemblance conjecturerdquofor instance would suggest that nonhomologous sequencesthat have a closer family resemblance relationship are moresimilar in function than sequences that lack or have a moredistant family resemblance relationship
Adjusting our models to the data may well demonstratewhether there are as-yet unknown barriers to introgressionwhether gene fusion occurs at different rates at differenttimes and in different contexts and whether there are pre-ferred routes for introgression and preferred partnersAlthough it is well known that homology relationshipsstrongly suggest functional similarities analysis of networkscould reveal additional functional connections through theanalysis of extended family resemblances (Bapteste et al2012) It has already been shown that additional evolutionaryinformation can be obtained by the analysis of extended genesimilarity networks (Alvarez-Ponce et al 2013 Jachiet et al2013) however there are further analyses that can be carriedout
In figures 2ndash4 we show that a rush to ldquoatomizerdquo evolu-tionary relationships and to only use a conservative perspec-tive when analyzing homologies can completely blind us tointeresting evolutionary events Similarity network analysescan be used not only to understand recombination and fu-sion but also to find if there are transitive homology state-ments that can be made (Alvarez-Ponce et al 2013) Distant
homologies may be recognized through intermediatesequences so if GeneX and GeneY manifest homologyalong a particular region and GeneY and GeneZ manifesthomology along the same region then even if a tool suchas Blast cannot directly detect the homology between GeneXand GeneZ we can use the network information to assignhomology even though our standard software tools mightnot see this homology
Concluding RemarksAt this stage we know much more about evolutionary rela-tionships than we did 26 years ago when Reeck et al (1987)felt the need to clarify the terminology It is now much clearerthat fusion and fission (Snel et al 2000 Kummerfeld andTeichmann 2005 Pasek et al 2006 Durrens et al 2008Jachiet et al 2013) of (parts of) molecules is a frequent processand a significant source of genetic and genomic novelty Theconsequent muddying of gene-level relationships affect se-quence relationships to a point that justifies proposition ofan extended notion of evolutionary relationships and of whatconstitutes a gene family Overlooking of introgressive pro-cesses is causing considerably fewer evolutionary events to beappraised than would be the case if family relationships weredefined more broadly For this reason future notions abouthomology should be explicit about the kind of homologousrelationship that is observedmdashthe model must be informedby the data and not just assumed at the cost of excludingmassive amounts of data Recognizing different homologyand family resemblance concepts (STT PNT and GT) isuseful and important In other words any operational defini-tion of homology must be pragmatically oriented Under thatcondition reconsidering how we define relationships be-tween genes may open the door to a new biology
To conclude adopting a more pluralistic view of homologyentails that a number of methodological issues need to beresolved Proteins or genes must be allowed to be a memberof more than one family Sequence similarity that is due toextensive remodeling (eg Epaktology [Nagy Banyai et al2011 Nagy Szlama et al 2011]) must be distinguishedfrom similarity that is not due to remodeling Methods forassessing the importance of family resemblance relationshipsneed to be developedmdashwhether such family resemblancesare relevant for function for instance or whether they arenot Statistically robust approaches for constructing N-rootednetworks need to be developed in addition to methods fortiming introgressive events on these structures The analysisof connected component topological features must be devel-oped so that we can understand the relationship betweentopology protein function and evolutionary historyEmbedding phylogenetic trees or networks into networks ofgene sharing can allow a far greater level of detail in assessingevolutionary histories
Supplementary MaterialSupplementary information S1 and figure S1 are available atMolecular Biology and Evolution online (httpwwwmbeoxfordjournalsorg)
514
Haggerty et al doi101093molbevmst228 MBE by guest on M
arch 23 2016httpm
beoxfordjournalsorgD
ownloaded from
Acknowledgments
The authors acknowledge the generous funding of ScienceFoundation Ireland to LH JMcI (RFP EOB2510) DP (RFPEOB3106) and MJOC (RFP EOB2673) MW was funded bythe Biotechnology and Biological Sciences Research Councilgrant BBK0074401 The authors also thank Slim Karkar andtwo anonymous reviewers for helpful discussions
ReferencesAbel O 1910 Kritische Untersuchungen uber die palaogenen
Rhinocerotiden Europas Abhandlungen Kaiserlich-KoeniglicheGeologische Reichsanstal 201ndash22
Adai AT Date SV Wieland S Marcotte EM 2004 LGL creating a map ofprotein function with an algorithm for visualizing very large biolog-ical networks J Mol Biol 340179ndash190
Altenhoff AM Studer RA Robinson-Rechavi M Dessimoz C 2012Resolving the ortholog conjecture orthologs tend to be weaklybut significantly more similar in function than paralogs PLoSComput Biol 8e1002514
Altschul SF Madden TL Schaffer AA Zhang J Zhang Z Miller WLipman DJ 1997 Gapped BLAST and PSI-BLAST a new generationof protein database search programs Nucleic Acids Res 253389ndash3402
Alvarez-Ponce D Bapteste E Lopez P McInerney JO 2013 Gene simi-larity networks provide new tools for understanding eukaryoteorigins and evolution Proc Natl Acad Sci 110(17)E1594ndash1603
Apic G Gough J Teichmann SA 2001a Domain combinations inarchaeal eubacterial and eukaryotic proteomes J Mol Biol 310311ndash325
Apic G Gough J Teichmann SA 2001b An insight into domain com-binations Bioinformatics 17(Suppl 1) S83ndash89
Apic G Russell RB 2010 Domain recombination a workhorse for evo-lutionary innovation Sci Signal 3pe30
Atkinson HJ Morris JH Ferrin TE Babbitt PC 2009 Using sequencesimilarity networks for visualization of relationships across diverseprotein superfamilies PloS One 4e4345
Bapteste E Lopez P Bouchard F Baquero F McInerney JO Burian RM2012 Evolutionary analyses of non-genealogical bonds produced byintrogressive descent Proc Natl Acad Sci U S A 10918266ndash18272
Bapteste E OrsquoMalley MA Beiko RG Ereshefsky M Gogarten JP Franklin-Hall L Lapointe FJ Dupre J Dagan T Boucher Y et al 2009Prokaryotic evolution and the tree of life are two different thingsBiol Direct 434
Bastian M Heymann S Jacomy M 2009 Gephi an open source softwarefor exploring and manipulating networks In International AAAIConference on Weblogs and Social Media
Boucher Y Bapteste E 2009 Revisiting the concept of lineage in pro-karyotes a phylogenetic perspective Bioessays 31526ndash536
Brigandt I 2003 Homology in comparative molecular and evolutionarydevelopmental biology the radiation of a concept J Exp Zool B MolDev Evol 2999ndash17
Capella-Gutierrez S Silla-Martinez JM Gabaldon T 2009 trimAl a toolfor automated alignment trimming in large-scale phylogenetic anal-yses Bioinformatics 251972ndash1973
Chen X Zhang J 2012 The ortholog conjecture is untestable by thecurrent gene ontology but is supported by RNA sequencing dataPLoS Comput Biol 8e1002784
Corpet F Servant F Gouzy J Kahn D 2000 ProDom and ProDom-CGtools for protein domain analysis and whole genome comparisonsNucleic Acids Res 28267ndash269
Dagan T 2011 Phylogenomic networks Trends Microbiol19(10)483ndash491
Dagan T Artzy-Randrup Y Martin W 2008 Modular networks andcumulative impact of lateral transfer in prokaryote genome evolu-tion Proc Natl Acad Sci U S A 10510039ndash10044
Dagan T Martin W 2009 Getting a better picture of microbial evolutionen route to a network of genomes Philos Trans R Soc Lond B Biol Sci3642187ndash2196
Dessimoz C Gabaldon T Roos DS Sonnhammer EL Herrero J 2012Toward community standards in the quest for orthologsBioinformatics 28900ndash904
Dobzhansky T 1955 A review of some fundamental concepts andproblems of population genetics Cold Spring Harb Symp QuantBiol 201ndash15
Doherty A Alvarez-Ponce D McInerney JO 2012 Increased genomesampling reveals a dynamic relationship between gene duplicabilityand the structure of the primate protein-protein interaction net-work Mol Biol Evol 293563ndash3573
Duret L Mouchiroud D Gouy M 1994 HOVERGEN a database ofhomologous vertebrate genes Nucleic Acids Res 222360ndash2365
Durrens P Nikolski M Sherman D 2008 Fusion and fission of genesdefine a metric between fungal genomes PLoS Comput Biol 4e1000200
Enright AJ Iliopoulos I Kyrpides NC Ouzounis CA 1999 Protein inter-action maps for complete genomes based on gene fusion eventsNature 40286ndash90
Enright AJ Kunin V Ouzounis CA 2003 Protein families and TRIBES ingenome sequence space Nucleic Acids Res 314632ndash4638
Enright AJ Ouzounis CA 2000 GeneRAGE a robust algorithm forsequence clustering and domain detection Bioinformatics 16451ndash457
Enright AJ Van Dongen S Ouzounis CA 2002 An efficient algorithm forlarge-scale detection of protein families Nucleic Acids Res 301575ndash1584
Epp CD 1997 Definition of a gene Nature 389537Ereshefsky M 2007 Psychological categories as homologies lessons from
ethology Biol Philos 22659ndash674Fani R Brilli M Fondi M Lio P 2007 The role of gene fusions in the
evolution of metabolic pathways the histidine biosynthesis caseBMC Evol Biol 7S4
Felsenstein J 2004 Inferring phylogenies Sunderland (MA) SinauerAssociates
Feuda R Hamilton SC McInerney JO Pisani D 2012 Metazoan opsinevolution reveals a simple route to animal vision Proc Natl Acad SciU S A 10918868ndash18872
Fitch WM 2000 Homology a personal view on some of the problemsTrends Genet 16227ndash231
Fitzpatrick DA OrsquoGaora P Byrne KP Butler G 2010 Analysis of geneevolution and metabolic pathways using the Candida Gene OrderBrowser BMC Genomics 11290
Greider CW Blackburn EH 1985 Identification of a specific telomereterminal transferase activity in Tetrahymena extracts Cell 43405ndash413
Halary S Leigh JW Cheaib B Lopez P Bapteste E 2010 Network analysesstructure genetic diversity in independent genetic worlds Proc NatlAcad Sci U S A 107127ndash132
Heger A Holm L 2003 Exhaustive enumeration of protein domainfamilies J Mol Biol 328749ndash767
Hillis DM 1994 Homology in molecular biology In Hall B editorHomology the hierarchical basis of comparative biology SanDiego (CA) Academic Press p 483
Huson DH Bryant D 2006 Application of phylogenetic networks inevolutionary studies Mol Biol Evol 23254ndash267
Huson DH Scornavacca C 2011 A survey of combinatorial methods forphylogenetic networks Genome Biol Evol 323
Ingolfsson H Yona G 2008 Protein domain prediction Methods MolBiol 426117ndash143
Jachiet PA Pogorelcnik R Berry A Lopez P Bapteste E 2013MosaicFinder identification of fused gene families in sequence sim-ilarity networks Bioinformatics 29(7)837ndash844
Kloesges T Popa O Martin W Dagan T 2011 Networks of gene sharingamong 329 proteobacterial genomes reveal differences in lateralgene transfer frequency at different phylogenetic depths Mol BiolEvol 281057ndash1074
515
A Pluralistic Account of Homology doi101093molbevmst228 MBE by guest on M
arch 23 2016httpm
beoxfordjournalsorgD
ownloaded from
Koonin EV Wolf YI Karev GP 2002 The structure of the protein uni-verse and genome evolution Nature 420218ndash223
Kummerfeld SK Teichmann SA 2005 Relative rates of gene fusion andfission in multi-domain proteins Trends Genet 2125ndash30
Levitt M 2009 Nature of the protein universe Proc Natl Acad Sci U S A10611079ndash11084
Li L Stoeckert CJ Jr Roos DS 2003 OrthoMCL identification of orthologgroups for eukaryotic genomes Genome Res 132178ndash2189
Majumdar I Kinch LN Grishin NV 2009 A database of domain defini-tions for proteins with complex interdomain geometry PloS One 4e5084
Marcotte EM Pellegrini M Thompson MJ Yeates TO Eisenberg D 1999A combined algorithm for genome-wide prediction of protein func-tion Nature 40283ndash86
McInerney JO Pisani D Bapteste E OrsquoConnell MJ 2011 The publicgoods hypothesis for the evolution of life on Earth Biol Direct 641
Miele V Penel S Daubin V Picard F Kahn D Duret L 2012 High-qualitysequence clustering guided by network topology and multiple align-ment likelihood Bioinformatics 281078ndash1085
Mindell DP Meyer A 2001 Homology evolving Trends Ecol Evol 16434ndash440
Nagy A Banyai L Patthy L 2011 Reassessing domain architecture evo-lution of metazoan proteins major impact of errors caused by con-fusing paralogs and epaktologs Genes 2516ndash561
Nagy A Szlama G Szarka E Trexler M Banyai L Patthy L 2011Reassessing domain architecture evolution of metazoan proteinsmajor impact of gene prediction errors Genes 2449ndash501
Natale DA Galperin MY Tatusov RL Koonin EV 2000 Using the COGdatabase to improve gene recognition in complete genomesGenetica 1089ndash17
Nehrt NL Clark WT Radivojac P Hahn MW 2011 Testing the orthologconjecture with comparative functional genomic data from mam-mals PLoS Comput Biol 7e1002073
Noble WS Kuang R Leslie C Weston J 2005 Identifying remote proteinhomologs by network propagation FEBS J 2725119ndash5128
OrsquoHara RJ 1997 Population thinking and tree thinking in systematicsZoologica Scripta 26323ndash329
Owen R 1868 On the archetype and homologies of the vertebrateskeleton London Richard and John E Taylor
Park J Teichmann SA 1998 DIVCLUS an automatic method in theGEANFAMMER package that finds homologous domains in single-and multi-domain proteins Bioinformatics 14144ndash150
Park J Teichmann SA Hubbard T Chothia C 1997 Intermediate se-quences increase the detection of homology between sequencesJ Mol Biol 273349ndash354
Pasek S Risler JL Brozellec P 2006 Gene fusionfission is a major con-tributor to evolution of multi-domain bacterial proteinsBioinformatics 221418ndash1423
Perriere G Duret L Gouy M 2000 HOBACGEN database system forcomparative genomics in bacteria Genome Res 10379ndash385
Portugaly E Harel A Linial N Linial M 2006 EVEREST automatic iden-tification and classification of protein domains in all protein se-quences BMC Bioinformatics 7277
Price MN Dehal PS Arkin AP 2010 FastTree 2ndashapproxi-mately maximum-likelihood trees for large alignments PloS One 5e9490
Reeck GR de Haen C Teller DC Doolittle RF Fitch WM Dickerson REChambon P McLachlan AD Margoliash E Jukes TH et al 1987ldquohomologyrdquo in proteins and nucleic acids a terminology muddleand a way out of it Cell 50667
Roth VL 1988 The biological basis of homology In Humphries CJ editorOntogeny and systematics New York Columbia University Pressp 236
Sapp J 2009 The new foundations of evolution On the tree of life NewYork Oxford University Press p 425
Sasson O Vaaknin A Fleischer H Portugaly E Bilu Y Linial N Linial M2003 ProtoNet hierarchical classification of the protein spaceNucleic Acids Res 31348ndash352
Sattler R 1984 Homology-a continuing challenge Syst Bot 9382ndash394
Shannon P Markiel A Ozier O Baliga NS Wang JT Ramage D Amin NSchwikowski B Ideker T 2003 Cytoscape a software environmentfor integrated models of biomolecular interaction networksGenome Res 132498ndash2504
Sievers F Wilm A Dineen D Gibson TJ Karplus K Li W Lopez RMcWilliam H Remmert M Soding J et al 2011 Fast scalable gen-eration of high-quality protein multiple sequence alignments usingClustal Omega Mol Syst Biol 7539
Snel B Bork P Huynen M 2000 Genome evolution-gene fusion versusgene fission Trends Genet 169ndash11
Song N Joseph JM Davis GB Durand D 2008 Sequence similarity net-work reveals common ancestry of multidomain proteins PLoSComput Biol 4e1000063
Sonnhammer EL Kahn D 1994 Modular arrangement of proteins asinferred from analysis of homology Protein Sci 3482ndash492
Tamura K Battistuzzi FU Billing-Ross P Murillo O Filipski A Kumar S2012 Estimating divergence times in large molecular phylogeniesProc Natl Acad Sci U S A 10919333ndash19338
Tatusov RL Galperin MY Natale DA Koonin EV 2000 The COG data-base a tool for genome-scale analysis of protein functions and evo-lution Nucleic Acids Res 2833ndash36
Tatusov RL Koonin EV Lipman DJ 1997 A genomic perspective onprotein families Science 278631ndash637
Tillyard RJ 1919 The panorpoid complex Part 3 the wing venation ProcLinn Soc N S W 44533ndash717
Weston J Elisseeff A Zhou D Leslie CS Noble WS 2004 Protein rankingfrom local to global structure in the protein similarity network ProcNatl Acad Sci U S A 1016559ndash6563
Wittgenstein L 2009 Philosophical investigations Wiley-BlackwellWong S Ragan MA 2008 MACHOS Markov clusters of homologous
subsequences Bioinformatics 24i77ndashi85Wuchty S 2001 Scale-free behavior in protein domain networks Mol
Biol Evol 181694ndash1702Yona G Linial N Linial M 2000 ProtoMap automatic classification of
protein sequences and hierarchy of protein families Nucleic AcidsRes 2849ndash55
516
Haggerty et al doi101093molbevmst228 MBE by guest on M
arch 23 2016httpm
beoxfordjournalsorgD
ownloaded from
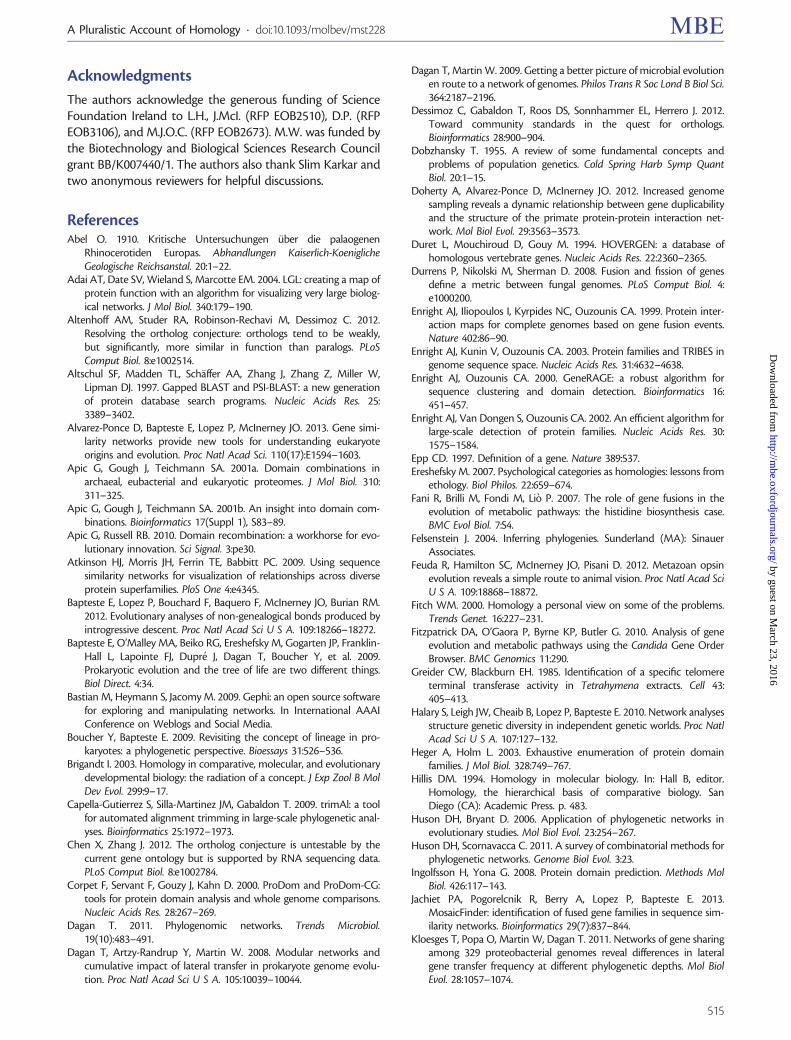