A pilot study on groundwater natural organics removal by low-pressure membranes
10
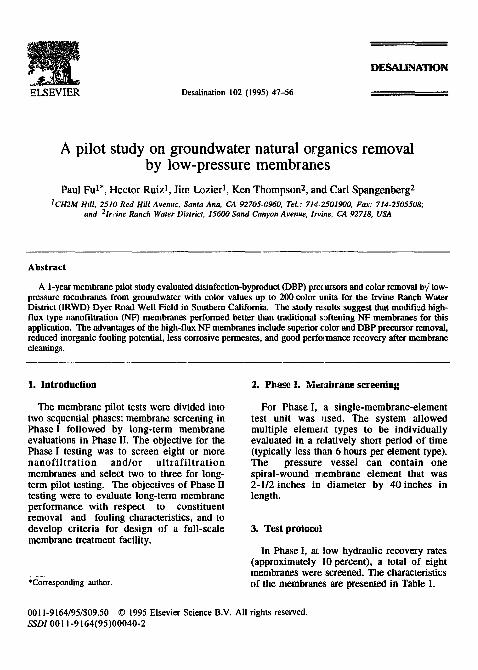
ELSEVIER Desalination 102 (1995) 47-56 DESALINATION A pilot study on groundwater natural organics removal by low-pressure membranes Paul Fut*, Hector Ruiz 1, Jim Lozier 1, Ken Thompson 2, and Carl Spangenberg 2 ICH2M Hill, 2510 Red Hill Avenue', Santa Aria, CA 92705-0960, Tel.: 714-2501900, Fax: 714-2505508; and 2Ir,'ine Ranch Water District, 15600 Sand Canyon Avenue, lrvine, CA 92718, USA Abstract A 1-year membrane pilot study evaluated disinfection-byproduct (DBP) precursors and color removal by"low- pressure membranes from groundwater with color values up to 200 color units for the Irvine Ranch Water District (IRWD) Dyer Road Well Field in Southern California. The study re;ults suggest that modified high- flux type nanofiltration (NF) membranes performed better than traditional s,aftening NF membranes for this application. The advantages of the high-flux NF membranes include superior color and DBP precursor removal, reduced inorganic fouling potential, less corrosive permeates, and good performance recovery after membrane cleanings. 1. Introduction The membrane pilot tests were divided into two sequential phases: membrane screening in Phase I followed by long-term membrane evaluations in Phase II. The objective for the Phase I testing was to screen eight or more nanofiltration and/or ultrafiltration membranes and select two to three for long- term pilot testing. The objectives of Phase II testing were to evaluate long-term membrane performance with respect to constituent removal and fouling characteristics, and to develop criteria for design of a full-scale membrane treatment facility. *Corresponding author. 2. Ph~e I. Merabrane screening For Phase I, a single-membrane-element test unit was used. The system allowed multiple element types to be individually evaluated in a relatively short period of time (typically less than 6 hours per element type). The pressure vessel can contain one spiral-wound membrane element that was 2-1/2 inches in diameter by 40inches in length. 3. Test protocol In Phase I, at low hydraulic recovery rates (approximately 10 percent), a total of eight membranes were screened. The characteristics of the membranes are presented in Table 1. 0011-9164/95/$09.50 © 1995 Elsevier Science B.V. All rights reserved. SSDI 0011-9 ! 64(95)00040-2
-
Upload
independent -
Category
Documents
-
view
2 -
download
0
Transcript of A pilot study on groundwater natural organics removal by low-pressure membranes
ELSEVIER Desalination 102 (1995) 47-56
DESALINATION
A pilot study on groundwater natural organics removal by low-pressure membranes
Paul Fut*, Hec tor Ruiz 1, Jim Lozier 1, Ken Thompson 2, and Carl Spangenberg 2
ICH2M Hill, 2510 Red Hill Avenue', Santa Aria, CA 92705-0960, Tel.: 714-2501900, Fax: 714-2505508; and 2Ir,'ine Ranch Water District, 15600 Sand Canyon Avenue, lrvine, CA 92718, USA
Abstract
A 1-year membrane pilot study evaluated disinfection-byproduct (DBP) precursors and color removal by" low- pressure membranes from groundwater with color values up to 200 color units for the Irvine Ranch Water District (IRWD) Dyer Road Well Field in Southern California. The study re;ults suggest that modified high- flux type nanofiltration (NF) membranes performed better than traditional s,aftening NF membranes for this application. The advantages of the high-flux NF membranes include superior color and DBP precursor removal, reduced inorganic fouling potential, less corrosive permeates, and good performance recovery after membrane cleanings.
1. Introduction
The membrane pilot tests were divided into two sequential phases: membrane screening in Phase I fol lowed by long-term membrane evaluations in Phase II. The objective for the Phase I testing was to screen eight or more n a n o f i l t r a t i o n a n d / o r u l t r a f i l t r a t i o n membranes and select two to three for long- term pilot testing. The objectives of Phase II testing were to evaluate long-term membrane performance with respect to constituent removal and fouling characteristics, and to develop criteria for design of a full-scale membrane treatment facility.
*Corresponding author.
2. P h ~ e I. Merabrane screening
For Phase I, a single-membrane-element test unit was used. The system allowed multiple element types to be individually evaluated in a relatively short period of time (typically less than 6 hours per element type). The pressure vessel can contain one spiral-wound membrane element that was 2-1/2 inches in diameter by 40 inches in length.
3. Test protocol
In Phase I, at low hydraulic recovery rates (approximately 10 percent), a total of eight membranes were screened. The characteristics of the membranes are presented in Table 1.
0011-9164/95/$09.50 © 1995 Elsevier Science B.V. All rights reserved. SSDI 0011-9 ! 64(95)00040-2
48 P. Fu et al. / Desalination 102 (1995) 47-56
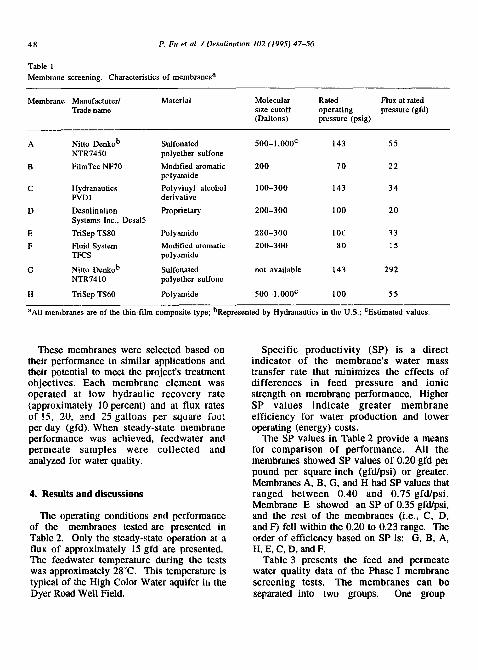
Table 1 Membrane screening. Characteristics of membranes a.
Membrane Manufacturer/ Material Molecular Rated Trade name size cutoff operating
(Daltons) pressure (psig)
Flux at rated pressure (gfd)
A Nitto Denko b Sulfonated 500-1,000 c 143 55 NTR7450 polyether sulfone
B FilmTec NF70 Modified aromatic 200 70 22 polyamide
C Hydranautics Polyvinyl alcohol 100-300 143 34 PVD1 derivative
D Desalination Proprietary 200-300 100 20 Systems Inc., Desal5
E TriSep TS80 Polyamide 280-300 10t" a 3 F Fluid System Modified aromatic 200-300 80 '. 5
TFCS polyamide
G Nitro Denko b Sulfonated not available 143 292 NTR7410 polyether sulfone
H TriSep TS60 Polyamide 500-1,000 c 100 55
aAll membranes are of the thin-film composite type; bRepresented by Hydranautics in the U.S.; CEstimated values.
These membranes were selected based on their performance in similar applications and their potential to meet the project's treatment objectives. Each membrane e lement was operated at low hydraulic recovery rate (approximately 10 percent) and at flux rates of !5, 20, and 25 gallons per square foot per day (gfd). When steady-state membrane performance was achieved, feedwater and pe rmea te s amples were co l l ec ted and analyzed for water quality.
4. Results and discussions
The operating conditions and performance of the membranes tested are presented in Table 2. Only the steady-state operation at a flux of approximately 15 gfd are presented. The feedwater temperature during the tests was approximately 28°C. This temperature is typical of the High Color Water aquifer ill the Dyer Road Well Field.
Specif ic product iv i ty (SP) is a direct indicator o f the membrane ' s water mass transfer rate that minimizes the effects of d i f fe rences in feed pressure and ionic strength on membrane performance. Higher SP values indica te g rea te r m e m b r a n e efficiency for water production and lower operating (energy) costs.
The SP values in Table 2 provide a means for compar ison of performance . All the membranes showed SP values of 0.20 gfd per pound per square inch (gfd/psi) or greater. Membranes A, B, G, and H had SP values that ranged be tween 0.40 and 0.75 gfd/psi . Membrane E showed an SP of 0.35 gftYpsi, and the rest of the membranes (i.e., C, D, and F) fell within the 0.20 to 0.23 range. The order of efficiency based on SP is: G, B, A, H, E, C, D, and F.
Table 3 presents the feed and permeate water quality data of the Phase I membrane screening tests. The membranes can be separated into two groups. One group
P. Fu et o2. / Desalination 102 (1995) 47-56
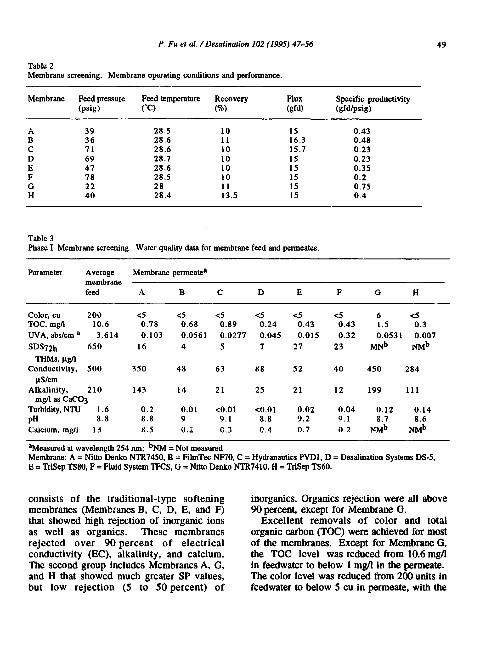
Table 2 Membrane screening. Membrane operating conditions and performance.
Membrane Feed pressure Feed temperature Recovery Flux Specific productivity (psig) (°C) (%) ( g f d ) (gfd/psig)
A 39 28.5 10 15 0.43 B 36 28.6 11 16.3 0.48 C 71 28.6 10 15.7 0.23 D 69 28.7 10 15 0.23 E 47 28.6 10 15 0.35 F 78 28.5 10 15 0.2 G 22 28 11 15 0.75 H 40 28.4 13.5 15 0.4
Table 3 Phase I. Membrane screening. Water quality data for membrane feed and permeates.
Parameter Average Membrane permeate a membrane feed A B C D E F G H
Color, cu 200 <5 <5 <5 <5 <5 <5 6 <5 TOC, mg/l 10.6 0.78 0.68 0.89 0.24 0.43 0.43 1.5 0.3 UVA, abs/cm a 3.614 0.103 0.0561 0.0277 0.045 0.015 0.32 0.0531 0.007 SDS72 h 650 16 4 5 7 27 23 MN b NM b
THMs, pg/l Conductivity, 500 350 48 63 88 52 40 450 284
pS/cm Alkalinity, 210 143 14 21 25 21 12 199 111
mg/l as CaCO 3 Turbidity, NTU 1.6 0.2 0.01 <0.01 <0.01 0.02 0.04 0.12 0.14 pH 8.8 8.8 9 9.1 8.8 9.2 9.1 8.7 8.6 Calcium, mgtl 13 8.5 0.2 0.3 0.4 0.7 0.2 NM b NM b
aMeasured at wavelength 254 nm; bNM = Not measured Membrane: A = Nitro Denko NTR7450, B = FilmTec NFT0, C -- Hydranautics PVDI, D = Desalination Systems DS-5, E = TriSep TS80, F = Fluid System TFCS, G = Nitro Denko NTR7410, H = TriSep TS60.
cons is t s o f the t r ad i t i ona l - type so f t en ing membranes (Membranes B, C, D, E, and F) that showed high reject ion of inorganic ions as wel l as o rganics . These membranes r e j e c t e d o v e r 9 0 p e r c e n t o f e l e c t r i c a l conduct iv i ty (EC), a lkal ini ty , and calcium. The second group includes Membranes A, G, and H that showed much greater SP values, bu t low r e j e c t i o n (5 to 50 pe rcen t ) o f
inorganics. Organics reject ion were all above 90 percent, except for Membrane G.
E xce l l en t r e m o v a l s of co lor and total organic carbon (TOC) were achieved for most o f the membranes . Except for Membrane G, the TOC level was reduced from 10.6mg/ l in feedwater to below 1 mg/l in the permeate. The color level was reduced from 200 units in feedwater to below 5 cu in permeate, with the
50 P. Fu et al. /Desalination 102 (1995) 47-56
exception of Membrane G, which yielded a color level of 6 cu. The permeates of Membranes A, E, and F showed greater 72-hour trihalomethanes (THMs) values than for the other membranes tested, while their TOC levels were comparable. However, all the reported THMs values were less than the anticipated future Stage 2 THMs maximum contaminant level (MCL) of 40 ~tg/l.
Permeate water quality was also monitored at recoveries up to 30 percent. No significant deterioration in water quality was found at a recovery up to 30 percent when compared to operation at a 10 percent recovery, except for Membrane G. Tids finding suggests that a full-scale plant using Membrane G is not likely to produce permeate that would meet the finished water quality goals.
Based on the results of the Phase I screening tests, Membrane A (Nitto Denko NTR7450), Membrane B (FilmTec NF70), Membrane E (TriSep TS80), and Membrane H (TriSep TS60) were recommended for consideration of long-term testing for the following reasons: - Membranes A, B, E, and H produced
permeate with water quality comparable to or better than that of the other membranes, but with much higher specific productivity (i.e., with less energy required).
- Reject ion rates of the inorganic constituents for Membranes A and H were substantially lower than those of the other membranes; this could be advantageous with respect to reducing membrane fouling, membrane concentrate disposal, and reducing the requirements for post- treatment (stabilization) of the permeate.
5. Phase II. L o n g - t e r m e v a l u a t i o n
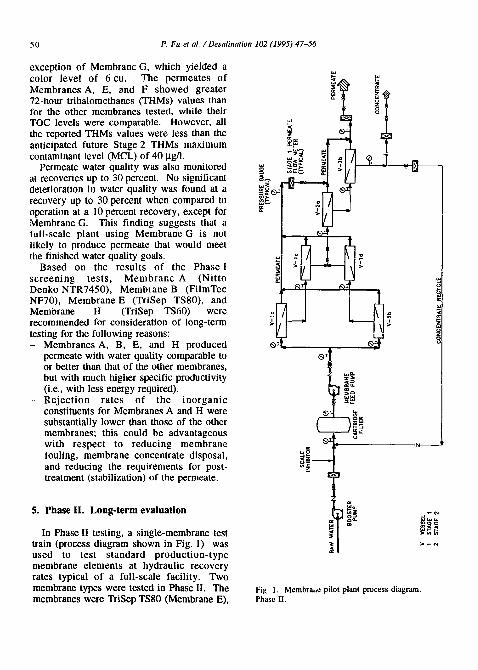
In Phase II testing, a single-membrane test train (process diagram shown in Fig. 1) was used to test standard production-type membrane elements at hydraulic recovery rates typical of a full-scale facility. Two membrane types were tested in Phase II. The membranes were TriSep TS80 (Membrane E),
w
~ o -~
u l w
~ L a ~ m o o
Fig. 1. Membrai~e pilot plant process diagram. Phase 1I.
P. Fu et al. /Desal inat ion 102 (1995) 47-56 51
a traditional type NF membrane, and Nitro Denko NTR7450 (Membrane A), a high-SP type with low inorganic-rejection. Membrane feedwater pretreatment includes cartridge filtration and antiscalant addition. Cartridge filters were installed upstream of the membranes to protect fouling by suspended solids.
Antiscalant, Hypersperse AF, provided by Argo Scientific, was used through most of the operation. Acid was not used for control of calcium carbonate scaling. Results and discussions of these long-term tests are presented below.
6 . T r i S e p T S 8 0 t e s t i n g
TriSep TS80 membrane was operated for approximately 120 days. Some operational changes were implemented during the TriSep run to maximize membrane product water flow and increase membrane fouling potential so that fouling characteristics could be evaluated. These changes included: - Increasing the recovery from 75 to
87 percent and then to 90 percent - Increasing flux from 15.8 to 20 gfd on
Day 93 - Discontinuing antiscalant addition from
Days 79 to 103.
6.1. Water qt~,~lity
Table4 summarizes the average feed, permeate, and concentrate water qualities of TS80 and NTR7450. The permeate and concentrate water qualities are shown for operating conditions at 90 percent recovery. The data in Table 4 suggested the following findings for TS80 membrane: - High rejections were found for inorganic
constituents such as calcium, total dissolved solids (TDS), and EC. The high concentrations of alkalinity, calcium, and TDS in the membrane concentrate at 90percent recovery indicated scaling potential by calcium carbonate.
- Membrane permeate has low level of calcium and TDS. Post-treatmem may be required for water stability.
- High rejections were found for organic constituents including color, TOC, and 72-hour THMs. The permeate's color was consistently less than 5, TOC at approximately 0.3 mg/l, and THMs was less than 20 ~tg/l.
6.2. Hydraulic operation
The operating conditions of the TriSep TS80 test run were monitored continuously throughout the test run. The monitoring results are presented below.
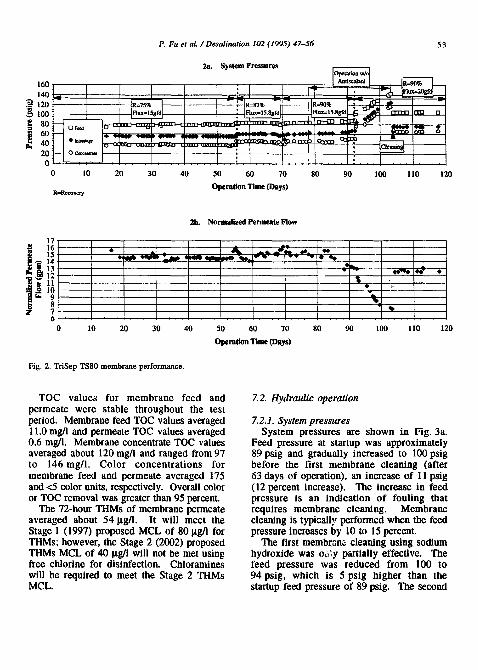
6.2.1. System pressures System pressure data, consisting of feed
and concentrate pressures, are shown in Fig. 2a. The membrane feed, interstage, and concentrate pressures varied as a function of flux. At 15 gfd flux, the feed pressure was about 80 psig. When the flux was increased to 20 gfd, the feed pressure increased to 104psig. In general, the IJressures were stable if operating conditions remained unchanged. An exception to the stable operating pressures occurred when the membrane was operated without antiscalant from Days 79 through 103. The pressures initially increased gradually and then surged when the flux was raised from 15.8 to 20 gfd on Day 93. The pressure surge was a clear indication of membrane scaling, and membrane cleaning was performed. The membrane cleaning brought down the system pressures, which then remained stable through the end of the run.
6.2.2. Normalized permeate flow Permeate flows corrected (normalized) for
temperature, pressure variations, and s~inities are presented in Fig. 2b. The normalized permeate flow was approximately 15 gpm with a corresponding flux of 15 gfd (from Days 1 through 88), and it decreased to about 13 gpm when the flux was increased to 20
52 P. Fu et al. / Desalination 102 (1995) 47-56
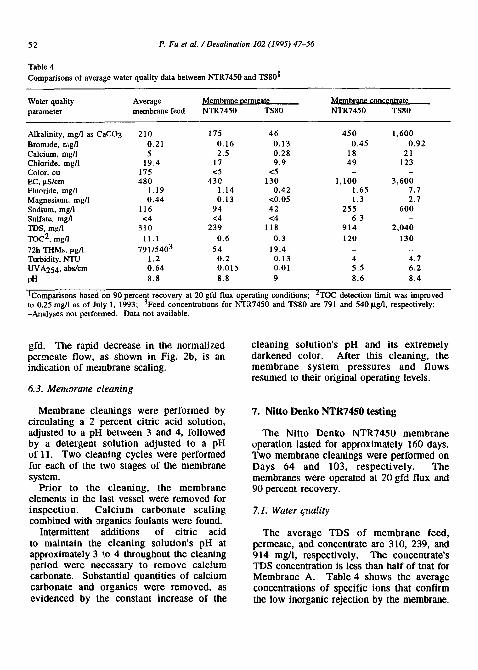
Table 4 Comparisons of average water quality data between NTR7450 and TS801
Water quality Average Membrane permeate Membrane concentrate parameter membrane feed NTR7450 TS80 NTR7450 TS80
Alkalinity, mg/l as CaCO 3 210 175 46 450 1,600 Bromide, ri,g/1 0.21 0.16 0.13 0.45 0.92 Calcium, rag/1 5 2.5 0.28 18 21 Chloride, mg/l 19.4 17 9.9 49 123 Color, cu 175 <5 <5 - - EC, laS/cm 480 430 130 1,100 3,600 Fluoride, mg/l 1.19 1.14 0.42 1.65 7.7 Magnesimn, rag/1 0.44 0.13 <0.05 1.3 2.7 Sodium, mg/l 116 94 42 255 600 Sulfate, mg/l <4 <4 <4 6.3 - TDS, mg/l 310 239 118 914 2,040 TOC 2, mg/i 11.1 0.6 0.3 120 130 72h THMs, ~tg/l 791/5403 54 19.4 - - Turbidity, NTU 1.2 0.2 0.13 4 4.7 UVA254, abs/cm 0.64 0.015 0.01 5.5 6.2 pH 8.8 8.8 9 8.6 8.4
IComparisons based on 90 percent recovery at 20 gfd flux operating conditions; 2TOC detection limit was improved to 0.25 mg/i as of July 1, 1993; 3Feed concentrations for NTR7450 and TS80 are 791 and 540 p.g/l, respectively; -Analyses not performed. Data not available.
gfd. The rapid decrease in the normalized permeate flow, as shown in Fig. 2b, is an indication of membrane scaling.
6.3. M e m v r a n e c leaning
Membrane cleanings were performed by circulating a 2 percent citric acid solution, adjusted to a pH between 3 and 4, followed by a detergent solution adjusted to a pH of 11. Two cleaning cycles were performed for each of the two stages of the membrane system.
Prior to the cleaning, the membrane elements in the last vessel were removed for inspection. Calc ium carbonate scaling combined with organics foulants were found.
Intermittent additions of citric acid to maintain the cleaning solution's pH at approximately 3 to 4 throughout the cleaning period were necessary to remove calcium carbonate. Substantial quantifies of calcium carbonate and organics were removed, as evidenced by the constant increase of the
cleaning solution's pH and its extremely darkened color. After this cleaning, the membrane system pressures and flows resumed to their original operating levels.
7. Nitto Denko NTR7450 testing
Tile Nitto Denko NTR7450 membrane operation lasted for approximately 160 days. Two membrane cleanings were performed on Days 64 and 103, respect ively. The membranes were operated at 20 gfd flux and 90 percent recovery.
Z1. Water q.,.~ality
The average TDS of membrane feed, permeate, and concentrate are 310, 239, and 914 mg/l, respectively. The concentrate's TDS concentration is less than half of taat for Membrane A. Table 4 shows the average concentrations of specific ions that confirm the low inorganic rejection by the membrane.
P. Fu et al. / Desalination 102 (1995) 47-56 53
2a. System Pressures
160 ,4o~ I "1 IT : _ % I~=~dl_ 120 ::-- R:75% -- :--R=87% "[ -- I R=90% ~i--~.~.. ~ ~ |00 : [ lRux"15gfd: ! lFlux=15.88f.! !Rux=IS.8gfd ~ ~
4O ., 20 '-- o c~,== l 0 ............ :::,'.:::':
0 I0 20 30 40 50 60 70 80 90 100 110 120
R=Re¢overy Oper~lion Time (Days)
17 2~ 1 6 - - - - -
• 10 ~ 9
8 7 6 -
0 10
2b. Normalized Permeate Flow
• . _ _ & I m l l r
. . . . . .
20 30 40 50 60 70
Operation Time (Days)
• %
. . . . . .
80 90 100 110 120
Fig. 2. TriSep TS80 membrane performance.
TOC values for membrane feed and permeate were stable throughout the test period. Membrane feed TOC values averaged 11.0 mg/l and permeate TOC values averaged 0.6 mg/1. Membrane concentrate TOC values averaged about 120 mg/l and ranged from 97 to 146mg/l . Color concentrations for membrane feed and permeate averaged 175 and <5 color units, respectively. Overall color or TOC removal was greater than 95 percent.
The 72-hour THMs of membrane permeate averaged about 54 lxg/1. It will meet the Stage 1 (1997) proposed MCL of 80 Ilg/I for THMs; however, the Stage 2 (2002) proposed THMs MCL of 40 $tg/l will not be met using free chlorine for disinfection. Chloramines will be required to meet the Stage 2 THMs MCL.
7.2. Hydraulic operation
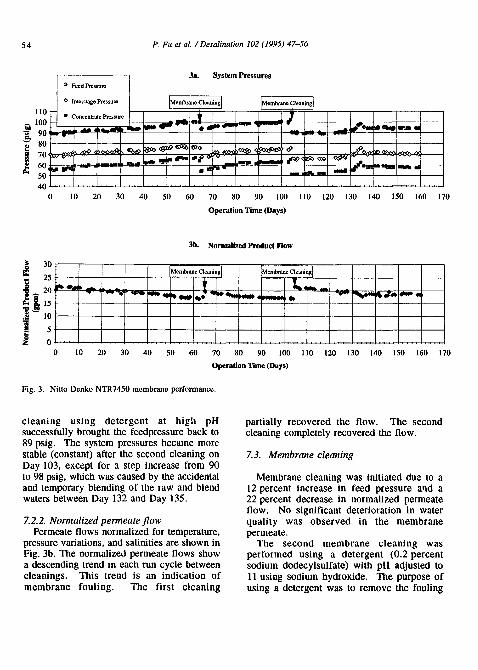
7.2.1. System pressures System pressures are shown in Fig. 3a.
Feed pressure at startup was approximately 89 psig and gradually increased to 100 psig before the first membrane cleaning (after 63 clays of operation), an increase of 11 psig (12 percent increase). The increase in feed pressure is an indication of fouling that requires membrane cleaning. Membrane cleaning is typically performed when the feed pressure increases by 10 to 15 percent.
The first membrane, cleaning using sodium hydroxide was oz~,~y partially effective. The feed pressure was reduced from 100 to 94 psig, which is 5 psig higher than the startup feed pressure of 89 psig. The second
54 P. Fu et al. / Desalination 102 (1995) 47-56
i ® Feed Pressure
O Interstage Pressure
! 10 s Concentrate Pressure
i 70 ,. 60
50 4o..
o lO 20
3a. System Pressures
~emb~oao~,,~ I I.oo~e~,o~o~J
~ 1 9 o 7"- ,w I I
. . . . . . . . . . i . . . . . I . . . . . . . . . . .
30 40 50 60 70 80 90 100 110 120 130 140 150 160 170
Operation Time (Days)
3b. Normalized Product Flow
30 IMemb~o c,o~o~ I .omb~o clo~.~ I ~ 25 ~- 2o . . o , . . . . . . f . I ~ . . . . . . eE~ 15 . . N
~ 0 . . . . . . . . . . . . . . . . . . . . . . . . . . . . . . . . . 0 10 20 30 40 50 60 70 80 90 100 110 120 130 140 150 160 170
Operation Time (Days)
Fig. 3. Nitto Denko NTR7450 membrane performance.
cleaning using detergent at high pH successfully brought the feedpressure back to 89 psig. The system pressures became more stable (constant) after the second cleaning on Day 103, except for a step increase from 90 to 98 psig, which was caused by the accidental and temporary blending of the raw and blend waters between Day 132 and Day 135.
7. 2.2. Normal ized permeate f l ow Permeate flows normalized for temperature,
pressure variations, and salinities are shown in Fig. 3b. The normalized permeate flows show a descending trend in each run cycle between cleanings. This trend is an indication of membrane fouling. The first cleaning
partially recovered the flow. The second cleaning completely recovered the flow.
7.3. Membrane cleaning
Membrane cleaning was initiated due to a 12 percent increase in feed pressure and a 22 percent decrease in normalized permeate flow. No significant deterioration in water quality was observed in the membrane permeate.
The second membrane cleaning was performed using a detergent (0.2 percent sodium dodecylsulfate) with pH adjusted to 11 using so0ium hydroxide. The purpose of using a detergent was to remove the fouling
P. Fu et al. / Desalination 102 (1995) 47-56 55
organics. Acid cleaning was not needed because of low TDS of the membrane concentrate. The cleaning was successful in bringing the system feed pressure and normalized permeate flow back to the system startup conditions.
8. Comparisons of TS80 to NTR7450
Comparisons of Phase II testing results using TS80 and NTR7450 membranes are presented in the following paragraphs.
8.1. Operating conditions
At 90 percent recovery and a 20 gfd flux, the startup feed pressure of the TS80 was 104 psig while the NTR7450 membrane was 89 psig, or 15 psig lower than that of the TS80. This implies energy savings with NTR7450.
8.2. Water quality
The average water quality data for the two membranes are compared in Table 4. Both membranes show comparable water quality with respect to organic constituents except for THMs. The THMs, with free chlorine disinfection, for the NTR7450 permeate was 54 gg/1 versus 19 4 gg/l for the TS80 permeate. The future Stage 2 THM MCL is 40 gg/l.
Overall, the inorganic concentrations for the NTR7450 permeate was higher than those of the TS80 permeate. As a result, the NTR7450 concentrate is substantially lower in TDS and inorganic constituents.
8.3. Hydraulic conditions
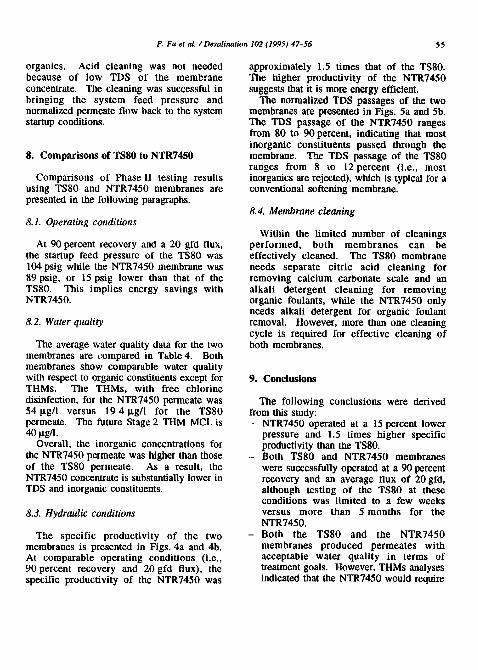
The specific productivity of the two membranes is presented in Figs. 4a and 4b. At comparable operating conditions (i.e., 90 percent recovery and 20 gfd flux), the specific productivity of the NTR7450 was
approximately 1.5 times that of the TS80. The higher productivity of the NTR7450 suggests that it is more energy efficient.
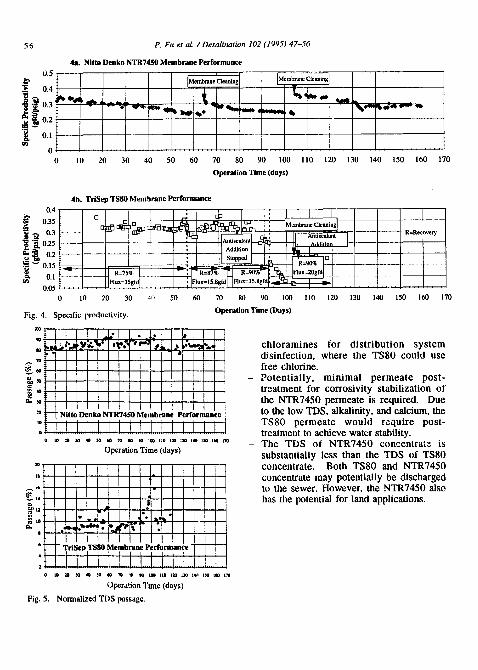
The normalized TDS passages of the two membranes are presented in Figs. 5a and 5b. The TDS passage of the NTR7450 ranges from 80 to 90 percent, indicating that most inorganic constituents passed through the membrane. The TDS passage of the TSS0 ranges from 8 to 12 percent (i.e., most inorganics are rejected), which is typical for a conventional softening membrane.
8.4. Membrane cleaning
Within the limited number of cleanings performed, both membranes can be effectively cleaned. The TS80 membrane needs separate citric acid cleaning for removing calcium carbonate scale and an alkali detergent cleaning for removing organic foulants, while the NTR7450 only needs alkali detergent for organic foulant removal. However, more than one cleaning cycle is required for effective cleaning of both membranes.
9. Conclusions
The following conclusions were derived from this study: - NTR7450 operated at a 15 percent lower
pressure and 1.5 times higher specific productivity than the TS80.
- Both TS80 and NTR7450 membranes were successfully operated at a 90 percent recovery and an average flux of 20 gfd, although testing of the TS80 at these conditions was limited to a few weeks versus more than 5 months for the NTR7450. Both the TS80 and the NTR7450 membranes produced permeates with acceptable water quality in terms of treatment goals. However, THMs analyses indicated that the NTR7450 would require
56
0.5
.~ 0.4
~ -~ 0.3' ~ 0 . 2
~ 0.1
0 0 10 20
P. Fu et al. /Desal inat ion 102 (1995) 47-56
4a. Nitto D e n k o N T R 7 4 5 0 Membrane Performance
[Membrane Cleanin[ IMembrane Cleaning[
._
.. .[ . . . . . . . . .
30 40 50 60 70 80 90 I00 1 I0 120 130 140 150 160 170
Operation "rime (days)
4b. TriSep TS80 Membrane Performance
0.4 / I - ~ I i I I I I ~ 0.3 [~ ~ ', Membrane Cleaning
" 0 . 2 5 ; l ', t . . . . . .:~- V I I t ~ ! b d d i t i c m I I ., [ Addition I [ : I W~ I
0.I lFlux=lSgtd| . .... ! lRux=tS.Sgfdl, ll~ux=lS.Sgfdl.., ~ | 0.05 . . . . . . . . . . . . . .
0 10 20 30 zf) 50 60
Fig. 4. Specific productivity.
i I! I ,
! . . . . . . . . . . . . . . . . . . . . . . . . . . . . 10 ~ 30 40 ~ t 60 ?0 it , 90 100 I I0 I sn 130 lee I~lO 160 170
Operation Time (days)
i
| | l t I-I I I |
-- "Tr iSep TSS0 Membrane Performance ~ '
] I ]1 I. i o to m ~o 4o so eo 7o ~Jo m tm tie I~ 1~ t~l tso tee t~
Operation Time (days)
Fig. 5. Normalized TDS passage.
70 80 90 100 110 120 130 140 150 160 170
Operation Time (Days)
chloramines for distribution system disinfection, where the TS80 could use flee chlorine. Potentially, minimal permeate post- treatment for corrosivity stabilization of the NTR7450 permeate is required. Due to the low TDS, alkalinity, and calcium, the TS80 permeate would require post- treatment to achieve water stability. The TDS of NTR7450 concentrate is substantially less than the TDS of TS80 concentrate. Both TS80 and NTR7450 concentrate may potentially be discharged to the sewer. However, the NTR7450 also has the potential for land applications.