Toxicity of brominated volatile organics to freshwater biota
10
Environmental Toxicology TOXICITY OF BROMINATED VOLATILE ORGANICS TO FRESHWATER BIOTA MONIQUE T. BINET,*y JENNY L. STAUBER, y MERRIN S. ADAMS, y STUART RHODES, z and JANINE WECH§ yCentre for Environmental Contaminants Research, CSIRO Land and Water, Locked Bag 2007, Kirrawee NSW 2232, Australia zRio Tinto Health Safety and Environment, 4B/7-9 Kent Rd, Mascot NSW 2020, Australia §National Institute of Water and Atmospheric Research Limited, 10 Kyle St, Ricarton, Christchurch 8011 New Zealand (Submitted 2 September 2009; Returned for Revision 12 October 2009; Accepted 10 March 2010) Abstract —As part of a larger study investigating the fate and effects of brominated volatile organic compounds (VOCs) in contaminated groundwaters discharging to surface waters, the toxicity of 1,2 dibromoethene (DBE) and 1,1,2-tribromoethene (TriBE) to freshwater aquatic biota was investigated. Their toxicity to bacteria (Microtox 1 ), microalgae (Chlorella sp.), cladocerans (Ceriodaphnia dubia), duckweed (Lemna sp.) and midges (Chironomus tepperi) was determined after careful optimization of the test conditions to minimize chemical losses throughout the tests. In addition, concentrations of DBE and TriBE were carefully monitored throughout the bioassays to ensure accurate calculation of toxicity values. 1,2-Dibromoethene showed low toxicity to most species, with concentrations to cause 50% lethality or effect (LC/EC50 values) ranging from 28 to 420 mg/L, 10% lethality or effect (LC/EC10 values) ranging from 18 to 94 mg/L and no-observed-effect concentrations (NOECs) ranging from 22 to 82 mg/L. 1,1,2-Tribromoethene was more toxic than DBE, with LC/EC50 values of 2.4 to 18 mg/L, LC/EC10 values of 0.94 to 11 mg/L and NOECs of 0.29 to 13 mg/L. Using these limited data, together with data from the only other published study on TriBE, moderate-reliability water quality guidelines (WQGs) were estimated from species sensitivity distributions. The proposed guideline trigger values for 95% species protection with 50% confidence were 2 mg/L for DBE and 0.03 mg/L for TriBE. The maximum concentrations of DBE and TriBE in nearby surface waters (3 and 1 mg /L, respectively) were well below these WQGs, so the risk to the freshwater environment receiving contaminated groundwater inflows was considered to be low, with hazard quotients <1 for both VOCs. Environ. Toxicol. Chem. 2010;29:1984–1993. # 2010 SETAC Keywords —Tribromoethene Dibromoethene Species sensitivity distribution Toxicity testing Groundwater INTRODUCTION A lack of published ecotoxicological data has hampered the derivation of reliable screening criteria for many contaminants in aquatic systems, with moderate or high reliability guideline values (trigger values) only available for around a third of the 300 chemicals listed in the Australian and New Zealand Guidelines for Fresh and Marine Water Quality ([1]; http://www. mincos. gov.au/publications/australian_and_new_zealand_guidelines_ for_fresh_and_marine_water_quality). Where limited data pre- clude the use of species sensitivity distributions (SSDs), water quality guidelines (WQGs) are derived by the application of safety factors to data from the most sensitive species, often resulting in overly conservative values. Safety factors of 10 to 10,000 are applied to the concentration to cause 50% lethality or effect (LC or EC50 value) to the most sensitive species, depending on the type and amount of data (acute versus chronic), and the applicable method for that jurisdiction ([1,2]; http://www.oecd.org/dataoecd/35/39/31177672.pdf; [3]; http:// ecb.jrc.ec.europa.eu/DOCUMENTS/TECHNICAL_GUIDANCE_ DOCUMENT/EDITION_2/tgdpart2_2ed.pdf). More recently, stat- istical distributions (SSDs) of laboratory ecotoxicity data for a pre- determinedlevel of protection (usually 95%), have been used to derive guideline values [4]. These approaches incorporate toxicity data from several trophic levels and have been used over the last decade by regulatory authorities in Australia and New Zealand, USA, Netherlands, South Africa, Denmark, and Europe to develop WQGs [1,3]. In the present study, the toxicity of two brominated volatile organic compounds to a range of freshwater biota was investi- gated. These data were then used in SSDs to derive guideline trigger values applicable to freshwater biota. The proposed WQGs were applied in a case study where groundwater near a former mineral processing laboratory was contaminated with brominated volatile organic compounds (VOCs). During the laboratory’s operational years (1980-2000), 1,1,2,2,-tetrabro- moethane (TBA) was used for density separation of minerals [5]. Since the laboratory’s closure, by-products of TBA have been detected in groundwater near the site, with up to 3 mg/L 1,2-dibromoethene (DBE), 220 mg/L 1,1,2-tribromoethene (TriBE) and 100 mg/L of both bromoethyne and vinyl bromide detected. Of these, only TriBE has previously been assessed for aquatic toxicity [6], being found to be toxic to three freshwater organisms, a green alga, a cladoceran and a fish, with LC/EC50 values ranging from 3.5 to 7.2 mg TriBE/L. Practical difficulties associated with the supply and handling of vinyl bromide (a gas) and bromoethyne (not commercially available) preclude their safe testing in conventional laboratory toxicity test systems. Additional ecotoxicological data were required for DBE and TriBE to derive reliable screening criteria and hence assess their potential impact on biota in surface waters receiving contaminated groundwater. 1,2-Dibromoethene and TriBE are poorly soluble in water and are highly volatile. Canton and Wegman [6] found that in open test systems, greater than 90% of TriBE was lost within 48 h, suggesting that volatilization was a major dissipa- tion pathway. Maintaining constant exposure concentrations, in particular maintaining acceptable control responses while minimizing chemical losses over the duration of the toxicity tests (e.g., through the use of sealed test containers, flow-through test systems or static-renewal tests) remains a Environmental Toxicology and Chemistry, Vol. 29, No. 9, pp. 1984–1993, 2010 # 2010 SETAC Printed in the USA DOI: 10.1002/etc.239 * To whom correspondence may be addressed ([email protected]). Published online 29 April 2010 in Wiley Online Library (wileyonlinelibrary.com). 1984
-
Upload
independent -
Category
Documents
-
view
4 -
download
0
Transcript of Toxicity of brominated volatile organics to freshwater biota

tal Toxicology
Environmental Toxicology and Chemistry, Vol. 29, No. 9, pp. 1984–1993, 2010# 2010 SETAC
Printed in the USADOI: 10.1002/etc.239
Environmen
TOXICITY OF BROMINATED VOLATILE ORGANICS TO FRESHWATER BIOTA
MONIQUE T. BINET,*y JENNY L. STAUBER,y MERRIN S. ADAMS,y STUART RHODES,z and JANINE WECH§yCentre for Environmental Contaminants Research, CSIRO Land and Water, Locked Bag 2007, Kirrawee NSW 2232, Australia
zRio Tinto Health Safety and Environment, 4B/7-9 Kent Rd, Mascot NSW 2020, Australia
§National Institute of Water and Atmospheric Research Limited, 10 Kyle St, Ricarton, Christchurch 8011 New Zealand
(Submitted 2 September 2009; Returned for Revision 12 October 2009; Accepted 10 March 2010)
* T(moniq
Pub(wileyo
Abstract—As part of a larger study investigating the fate and effects of brominated volatile organic compounds (VOCs) in contaminatedgroundwaters discharging to surface waters, the toxicity of 1,2 dibromoethene (DBE) and 1,1,2-tribromoethene (TriBE) to freshwateraquatic biota was investigated. Their toxicity to bacteria (Microtox1), microalgae (Chlorella sp.), cladocerans (Ceriodaphnia dubia),duckweed (Lemna sp.) and midges (Chironomus tepperi) was determined after careful optimization of the test conditions to minimizechemical losses throughout the tests. In addition, concentrations of DBE and TriBE were carefully monitored throughout the bioassays toensure accurate calculation of toxicity values. 1,2-Dibromoethene showed low toxicity to most species, with concentrations to cause50% lethality or effect (LC/EC50 values) ranging from 28 to 420 mg/L, 10% lethality or effect (LC/EC10 values) ranging from 18 to94 mg/L and no-observed-effect concentrations (NOECs) ranging from 22 to 82 mg/L. 1,1,2-Tribromoethene was more toxic than DBE,with LC/EC50 values of 2.4 to 18 mg/L, LC/EC10 values of 0.94 to 11 mg/L and NOECs of 0.29 to 13 mg/L. Using these limiteddata, together with data from the only other published study on TriBE, moderate-reliability water quality guidelines (WQGs) wereestimated from species sensitivity distributions. The proposed guideline trigger values for 95% species protection with 50% confidencewere 2 mg/L for DBE and 0.03 mg/L for TriBE. The maximum concentrations of DBE and TriBE in nearby surface waters (3 and 1mg /L,respectively) were well below these WQGs, so the risk to the freshwater environment receiving contaminated groundwater inflows wasconsidered to be low, with hazard quotients <1 for both VOCs. Environ. Toxicol. Chem. 2010;29:1984–1993. # 2010 SETAC
Keywords—Tribromoethene Dibromoethene Species sensitivity distribution Toxicity testing Groundwater
INTRODUCTION
A lack of published ecotoxicological data has hampered thederivation of reliable screening criteria for many contaminantsin aquatic systems, with moderate or high reliability guidelinevalues (trigger values) only available for around a third of the300 chemicals listed in the Australian and New Zealand Guidelinesfor Fresh and Marine Water Quality ([1]; http://www. mincos.gov.au/publications/australian_and_new_zealand_guidelines_for_fresh_and_marine_water_quality). Where limited data pre-clude the use of species sensitivity distributions (SSDs), waterquality guidelines (WQGs) are derived by the application ofsafety factors to data from the most sensitive species, oftenresulting in overly conservative values. Safety factors of 10 to10,000 are applied to the concentration to cause 50% lethalityor effect (LC or EC50 value) to the most sensitive species,depending on the type and amount of data (acute versuschronic), and the applicable method for that jurisdiction ([1,2];http://www.oecd.org/dataoecd/35/39/31177672.pdf; [3]; http://ecb.jrc.ec.europa.eu/DOCUMENTS/TECHNICAL_GUIDANCE_DOCUMENT/EDITION_2/tgdpart2_2ed.pdf). More recently, stat-istical distributions (SSDs) of laboratory ecotoxicity data for a pre-determined level of protection (usually 95%), have been used toderive guideline values [4]. These approaches incorporatetoxicity data from several trophic levels and have been usedover the last decade by regulatory authorities in Australia andNew Zealand, USA, Netherlands, South Africa, Denmark, andEurope to develop WQGs [1,3].
o whom correspondence may be [email protected]).lished online 29 April 2010 in Wiley Online Librarynlinelibrary.com).
1984
In the present study, the toxicity of two brominated volatileorganic compounds to a range of freshwater biota was investi-gated. These data were then used in SSDs to derive guidelinetrigger values applicable to freshwater biota. The proposedWQGs were applied in a case study where groundwater neara former mineral processing laboratory was contaminated withbrominated volatile organic compounds (VOCs). During thelaboratory’s operational years (1980-2000), 1,1,2,2,-tetrabro-moethane (TBA) was used for density separation of minerals[5]. Since the laboratory’s closure, by-products of TBA havebeen detected in groundwater near the site, with up to 3 mg/L1,2-dibromoethene (DBE), 220 mg/L 1,1,2-tribromoethene(TriBE) and 100mg/L of both bromoethyne and vinyl bromidedetected. Of these, only TriBE has previously been assessed foraquatic toxicity [6], being found to be toxic to three freshwaterorganisms, a green alga, a cladoceran and a fish, with LC/EC50values ranging from 3.5 to 7.2 mg TriBE/L. Practical difficultiesassociated with the supply and handling of vinyl bromide (a gas)and bromoethyne (not commercially available) preclude theirsafe testing in conventional laboratory toxicity test systems.Additional ecotoxicological data were required for DBEand TriBE to derive reliable screening criteria and hence assesstheir potential impact on biota in surface waters receivingcontaminated groundwater.
1,2-Dibromoethene and TriBE are poorly soluble inwater and are highly volatile. Canton and Wegman [6] foundthat in open test systems, greater than 90% of TriBE was lostwithin 48 h, suggesting that volatilization was a major dissipa-tion pathway. Maintaining constant exposure concentrations,in particular maintaining acceptable control responseswhile minimizing chemical losses over the duration of thetoxicity tests (e.g., through the use of sealed test containers,flow-through test systems or static-renewal tests) remains a
Toxicity of brominated volatile organic compounds Environ. Toxicol. Chem. 29, 2010 1985
challenge ([7,8]; http://www.olis.oecd.org/olis/2000doc.nsf/LinkTo/NT00002DCA/$FILE/00087241.PDF; [9]). Use ofinitial test concentrations, rather than a concentration declinemodel, may result in overestimation of LC/EC50 values, i.e.,underestimation of toxicity. For example, Simpson et al. [10]showed that calculated inhibitory concentrations of copper(e.g., IC25, IC50 values) for a 72-h algal growth bioassay wereunderestimated by two-fold if the declining concentration ofcopper in test solutions was not considered. Furthermore, for atoxicant in which the concentration declines exponentially to lessthan 5% of its initial concentration within 36 h, the inhibitoryconcentration was underestimated by a factor of 50. Site-specificguideline values for compounds that decline over time musttherefore use data from toxicity tests where the concentrationdecline over the duration of the test has been accurately measured.
A recent preliminary survey of biota in a stream near theformer laboratory, via which contaminated groundwater entersa nearby river, showed that the salinity of the stream rangedfrom <0.1% in the main channel to 5% in the wetlands, and 9to 12% at the confluence with the river. Species present in thestream were mainly of freshwater origin, including midges,snails, leeches, roundworms, flatworms, copepods, duckweed,and microalgae. Some saline-tolerant species such as yellow tailtrumpeter, goby, mosquito fish, prawns, and rotifers were alsofound at the stream/river confluence (unpublished data). Toprotect the environmental values in the stream, freshwatertoxicity tests for the present study were selected based on theirenvironmental relevance, known sensitivity to a range of com-pounds, and the availability of standard, well validated tests,with documented quality assurance procedures. Toxicity testsincluded three acute tests and two chronic tests after optimi-zation of test conditions to minimize losses of DBE and TriBEin the test solutions. In the present study, acute tests includedmidge (Chironomus tepperi) survival, cladoceran (Ceriodaph-nia dubia) immobilization and bacterial (Vibrio fisheri, Micro-tox1, Strategic Diagnostics) light inhibition, while chronic testsincluded microalgal (Chlorella sp.) growth inhibition andinhibition of duckweed (Lemna sp.) growth and biomass.Together with data from the one previous TriBE study, mod-erately reliable guideline values for DBE and TriBE, accordingto the Australian and New Zealand Environment and Conser-vation Council/Agricultural and Resource Management Coun-cil of Australia and New Zealand (ANZECC/ARMCANZ)[1] approach, were derived. Guidelines are categorized byANZECC/ARMCANZ as being of high, moderate or lowreliability, depending on the data available for their derivation.When acute data are used (after application of an acute tochronic ratio) in combination with chronic data, the resultingguideline is considered to be of moderate reliability. TheANZECC/ARMCANZ [1] approach requires at least fivespecies from four different taxonomic groups, with eight ormore species generally recommended. This is somewhat lessstringent than the requirements in Europe [3].
METHODS
Reagents and glassware
Dibromoethene (or dibromoethylene) was purchased fromSigma-Aldrich as a 98% mixture of cis- and trans- 1,2-dibro-moethene. A >97% stock solution of (TriBE) (or tribromo-ethylene) was purchased from TCI Tokyo Kasei KogyoCompany, Japan. Dibromoethene was stored at 48C in the dark,while TriBE was stored at �208C in the dark.
Reagent grade acetone (>99.8% purity; Merck), ethanol(>99.7% purity; Merck), methanol (99.8% purity; Merck)and dimethlyformamide (DMF) (99.9% purity, Sigma-Aldrich)were trialled for use as solvent carriers for DBE and TriBE.
All glassware was cleaned prior to use by soaking in 10% (v/v)HNO3 (reagent grade, 69% purity, Merck) overnight, followed byat least five rinses with demineralized water and five rinses withMilli-Q water (Millipore1).
Chemical analyses
Sub-samples from each test concentration of each definitivetoxicity test were prepared in 20-ml amber glass vials withTeflon1 lid inserts, ensuring that there was no head-space. Thevials were wrapped in aluminium foil, sealed in snap lockplastic bags and stored at 48C until the end of the toxicity test.Six samples for chemical analyses were selected from thoseprepared to cover a range of toxic effects (0 to 100%) on the testspecies and sent to the National Association of Testing Author-ities (NATA)-accredited laboratory at Leeder Consulting(maintained at 48C) for immediate analysis.
Samples were analyzed for 17 brominated VOCs usingpurge and trap gas chromatography-mass spectrometry (Leedermethod MA-15.WW.05 brominated volatile organic com-pounds). The 17 brominated compounds analyzed includedcis-1,2-DBE, trans-1,2-DBE, 1,1,2-TriBE, tetrabromoethene(TBE), tetrabromoethane, 1,1,2-tribromoethane, 1,1-dibromo-methane, 1,2-dibromo-3-chloropropane, 1,2-dibromoethane,bromobenzene, bromochloromethane, bromodichloromethane,bromoethane, bromoethyne, dibromochloromethane, tribromo-ethane, and vinyl bromide. The detection limit for all bromi-nated compounds was 1mg/L.
Analysis of the full suite of 60 VOCs was also carried outon some of the samples using Leeder method MA-15 volatileorganic compounds in water. Concentrations of these compo-unds were always below the detection limit of 1mg/L.
Test organisms
Vibrio fisheri (Microtox) was purchased freeze-dried and storedin the freezer until required for use. Immediately prior to thetoxicity tests, one vial of reagent was reconstituted in Microtox1
reconstitution solution at 158C ([11]; http://www.etc-cte. ec.gc.ca/organization/bmd/pubs/pubs_en/1RM24Englishfinal.pdf).
Starter cultures of Ceriodaphnia dubia were originally iso-lated from Lake Parramatta, Sydney, Australia. Mass cultureswere maintained in 500 ml of diluted mineral water (DMW)[12] supplemented with 100mg/L of vitamin B12 and 5mg/L ofNa2SeO3, at 25� 18C under ambient laboratory light levels on alight:dark cycle of 16:8 h light:dark. The cultures were trans-ferred three times a week into fresh DMW with 400,000 cells/mlof Pseudokirchneriella subcapitata (also known as Selenastrumcapricornutum) and 6 mg/L fish food supplement (Algro-Nat-ural, Cognis, Tullamarine, Victoria, Australia). Twenty-fourhours prior to test commencement, adults were isolated from themass cultures and the resulting neonates (<24 h old) were usedin the toxicity tests.
The midge Chironomus tepperi was cultured using a pro-tocol based on the U.S. Environmental Protection Agency (U.S.EPA) [13] methods for Chironomus tentans and Chironomusriparius. Nine days prior to testing, egg masses were collectedfrom laboratory cultures and placed in 2� 1 L beakers (2 eggmasses/beaker) with 800 ml of moderately hard water (con-ductivity 130 to 160mS/cm, pH 6.8 to 6.9, dissolved oxy-gen> 60%) [12], containing 7.5 g of artificial substrate(shredded tissue). Over the next 9 d, egg masses in these beakers
1986 Environ. Toxicol. Chem. 29, 2010 M.T. Binet et al.
were aerated continuously, fed twice with ground fish flakes(3.2 g/100 ml) and incubated under constant temperature con-ditions (20� 18C) with a 16:8 h light:dark photo period usingcool white fluorescent lamps (10 to 20mmol photons s�1 m�2).Nine-day-old larvae (early fourth instar) were used for testing.The cultures were considered suitable for use in toxicity testsif they provided a constant supply of larvae, if the larvae werehealthy and behaved normally, and if mortality was low.
The unicellular green alga Chlorella sp., originally isolatedfrom Lake Aesake, Papua New Guinea, was cultured axenicallyin one fifth strength Jaworki’s medium [14]. The culture wasmaintained on a 12:12 h light:dark cycle (cool white fluorescentlight, 100mmol photons s�1 m�2) at 278C. Cells in log phasegrowth were used in the algal bioassays after washing andcentrifuging three times to remove culture medium.
The duckweed Lemna sp. originally isolated from a pond atMacquarie University, Sydney, Australia, was cultured axeni-cally in modified Swedish Standard (SIS) medium, includingMOPS buffer [15] with a pH of 6.6, conductivity of 500mS/cmand hardness of 47 mg CaCO3/L. The culture was maintainedon a continuous fluorescent light cycle (cool white light at 60 to80mmol photons s�1 m�2) at 24� 28C. Plants that were 7 to10 d old were used in the bioassays.
Test optimisation for VOCs
Optimization experiments were carried out to establish theusefulness of closed test systems to minimize the loss of DBEand TriBE from test solutions and appropriate carrier solvents(and concentrations) for use in each toxicity test. While the useof carrier solvents can potentially affect toxicant uptake andtoxicity, their use was necessary to solubilize the brominatedVOCs and to achieve environmentally realistic exposure con-centrations, similar to those detected in the contaminatedgroundwater at the site. Toxicity tests were ultimately carriedout using lids with Teflon inserts to avoid interactions betweenthe carrier solvent and plastic in the lids which had been foundto cause significant immobility (85%) in the cladocerans.
Initial microalgal growth tests using the standard open testsystem (to allow gas exchange) showed losses of up to 90% ofboth DBE and TriBE in the first 24 h. The eventual use of aclosed test system was effective in minimizing these losses toapproximately 30% for DBE and 10% for TriBE over the 72-htest period. Algal growth in the closed test system (1.9 dou-blings/d) was slightly lower than in the open test system (2.3doublings/d) but still within test acceptability criteria of1.8� 0.5 doublings/d. Neither inverting test vials (20-ml glassvials) to ensure an air tight system, supplementing media with300 mg NaHCO3/L to counteract the loss of CO2 [16] norincreasing the test volume from 6 ml to 20 ml to minimizehead-space, improved algal growth rates. There was a slight butsignificant (p< 0.05) increase in sensitivity of the alga tocopper in the closed test system (IC50 of 10 [95% confidencelimits of 9.3 to 12] mg Cu/L) compared to the open testsystem (IC50 of 15 [95% confidence limits of 13 to 18] mgCu/L). Microalgal tests were therefore carried out in closed testsystems and new acceptability criteria for the reference toxicant(copper) were derived. Methanol (0.17%), rather than ethanol,was selected as the carrier solvent due to the slightly higheralgal growth observed in methanol.
For the Lemna sp. growth rate and biomass test, a closedtest system was not suitable due to the significant reduction inLemna sp. growth and/or biomass. Reducing the head-space inthe vial and addition of NaHCO3 (0 to 5 g/L) did not improveLemna sp. growth or biomass to acceptable levels. While
duckweed fronds in the control treatment (10 ml and openlid) met test acceptability criteria [15] (>7-fold increase inthe number of fronds after 7 d), growth in the sodium bicar-bonate treatments (closed lids) was at best 84% of the controlwith a poor biomass (dry wt) of only 54% of the control.Therefore, an open test system was adopted to ensure acceptablegrowth/biomass with test solutions renewed twice (day 2 and 4)throughout the 7-d test. Of the solvents used in the trials, poorgrowth was observed in the static-renewal methanol treatments(31 to 97% inhibition in growth) compared to that in the acetoneand DMF treatments. Acetone (0.2%) was therefore selected asthe carrier solvent.
The use of a closed test system did not affect cladoceranmobility in controls (�90%) nor their sensitivity to the refer-ence toxicant copper (EC50 values of 6.8� 2.0 and 5.7� 2.8mgCu/L for open and closed tests respectively). Concentrations of0.01 to 0.3% methanol (v/v) had no adverse effect on cladoceranmobility. A final concentration of 0.1% methanol (v/v) wasselected for use. Test conditions for the midge survival test werebased on the optimized conditions for the cladoceran test, with acarrier solvent concentration of 0.17% methanol (based on in-house quality assurance [QA] data).
Final toxicity test protocols
Range-finding tests were carried out to determine the appro-priate concentration range for use in subsequent definitive testswith DBE and TriBE. Chemical analyses of VOCs in five toseven test concentrations taken at four to six time points fromeach definitive test were used to assess concentration declineover the test duration, so that EC50, EC10, NOEC, and LOECvalues could be calculated using measured concentrations ofDBE and TriBE.
Initial stocks of both chemicals were prepared volumetri-cally in reagent grade methanol or acetone, depending on thetoxicity test. These were diluted (v/v) using the appropriatesolvent to form several working stock concentrations of thechemical (generally 1000 times higher than the desired nominaltest concentration). By adding the same volume of each respec-tive working stock directly to test vessels (containing testmedium), the final concentration of solvent in all test solutionsand solvent controls was identical. To minimize losses of thechemicals during preparation, stock and test solutions were onlyprepared in glassware immediately prior to use and care wastaken to minimize agitation of the test solutions.
Acute Microtox test
The Microtox bioassays were carried out using the Microtox90% test protocol. Salinity adjustments were made using Micro-tox Osmotic Adjustment Solution (22% NaCl), while 2% NaClwas used as the diluent [11]. The concentration of the solventcarrier, methanol (NOEC 2% methanol, unpublished data) was0.9% (v/v) in the methanol control and all DBE and TriBE testsolutions. Two exposure times (5 and 15 min) were used, tomonitor any increases or decreases in toxicity over the exposureduration. This test was carried out under standard test conditions(open system) and test solutions were subsampled at time zerofor chemical analyses. Due to the short exposure times, theloss of DBE and TriBE throughout the test was considerednegligible.
Acute cladoceran test
Immobilization tests with Ceriodaphnia dubia measure theacute toxicity of toxicants over 48 h. The method used wasbased on the protocol described by U.S. EPA [17]. A control,

Toxicity of brominated volatile organic compounds Environ. Toxicol. Chem. 29, 2010 1987
solvent control (0.1% methanol) and six to seven concentrationsof DBE or TriBE were prepared in quadruplicate using DMW asthe diluent. Each test vial contained 20 ml test solution andfive randomly assigned neonates (<24 h old). Vials were tightlycapped and incubated under the culture conditions describedabove. The numbers of immobile C. dubia were recorded after24 and 48 h. An additional 10 replicate vials (no cladoceransadded) containing 0.1% methanol and each test concentration ofDBE and TriBE were also prepared and incubated alongside testvials in the test chambers. These were sub-sampled at 0-, 3-, 6-,24- and 48-h for chemical analyses of DBE and TriBE.
Acute midge test
This static-renewal test measures the survival of midgeChironomus tepperi larvae after exposure to the toxicant for48 h. Toxicity tests conducted for both DBE and TriBE con-sisted of four replicates per concentration, with five midgelarvae per replicate (total of 20 midge larvae/test concentra-tion). Moderately hard water [12] was used as the diluent. Thefinal concentration of methanol in the solvent controls and alltest concentrations of DBE and TriBE for midge tests was0.17% (v/v). Seven to nine test concentrations of DBE or TriBE,together with a solvent control, were prepared in 20-ml glassscintillation vials containing 18 ml of test solution. Lids weretightened to minimize losses due to volatilization.
The test was renewed after 24 h by transferring midge larvaeto freshly prepared test solutions. Midge larvae were notfed for the duration of the test. The test was incubated at25� 18C under a 16:8 h light:dark photoperiod. The numberof surviving midges was recorded after 24 and 48 h, andobservations of the behavior of the midges were also recordedthroughout the toxicity tests. Additional replicates of eachsolvent control, DBE or TriBE test solution were also prepared(no midges added) and sub-sampled for chemical analyses at0 h, 24 h (prior to test renewal), 24 h (after test renewal) and 48 h(test completion).
Chronic microalgal test
This bioassay measures the decrease in cell division rate inthe tropical unicellular alga Chlorella sp. over a 3-d exposureand was carried out according to the protocol described inFranklin et al. [18] with modifications (described above). Theprotocol was originally based on Organization for EconomicCo-operation and Development (OECD) Guideline 201 [19]and the protocol of Stauber et al. [20]. Filtered synthetic soft-water with a hardness of 80 to 90 mg CaCO3/L and pH 7.5 [12]was used as the diluent and control in the algal bioassays. Asoftwater control, solvent control and seven to eight concen-trations of DBE or TriBE were prepared in triplicate. The finalconcentration of methanol was 0.17% in the solvent control andall DBE or TriBE test solutions. Six ml of each test solution wasdispensed into 20-ml silanized (Coatasil, BDH) glass vials. Toeach vial, 60ml of 26 mM sodium nitrate and 60ml of 0.13 mMpotassium dihydrogen phosphate were added as nutrients tomaintain algal exponential growth over 72 h.
Each vial was inoculated with 2 to 4� 103 cells/ml of a pre-washed algal suspension and incubated at 278C on a 12:12 hlight:dark cycle at 100 mmol photons s�1 m�2 for 72 h. Vialswere incubated with the lids screwed tight to minimize losses ofthe chemicals by volatilization. Cell densities in each vial weredetermined daily for three days by counting cells using aFACSCalibur flow cytometer (BD Biosciences) equipped witha 488 nm excitation laser with gating on chlorophyll fluores-cence [18]. A regression line was fitted to a plot of log10 cell
density versus time (h) for each vial and the cell division rate(growth rate) per h (m) was determined from the slope. Celldivision rates per day (3.32�m� 24) were calculated for eachreplicate.
An additional 30 replicate vials of the solvent controland each concentration of DBE and TriBE were also preparedand inoculated with algae (as above). The vials were incubatedalongside test vials and sub-sampled for chemical analysis attime points 0-, 3-, 6-, 24-, 48- and 72 h.
Chronic duckweed test
This static-renewal test determines the inhibition of growthrate and biomass of the freshwater macrophyte Lemna sp. over7 d. The test is based on the OECD Test Guideline 221 [15] andthe Environment Canada protocol [21], with modifications(described above). To improve uniformity throughout thestatic-renewal bioassay, sufficient SIS medium for the entiretest period was prepared 24 h prior to the start of the test andstored at 48C. Aliquots of the SIS media were then used for thepreparation of test solutions on Day 0 and again when renewedon Days 2 and 4.
For each definitive bioassay, a control, solvent control andfour to six concentrations of DBE or TriBE were prepared inquadruplicate. Working stock solutions of DBE and TriBE wereprepared in acetone on Day 0 of the test and stored in 20-mlamber glass vials with Teflon-lined lids. The vials were wrap-ped in aluminium foil, double-bagged, and stored at 48C untilrequired. Test dilutions were prepared directly in 20-ml glassvials with 10 ml of SIS medium. The final concentration ofacetone in each treatment was 0.2% (v/v).
Each vial was inoculated with one randomly-assigned threefrond colony of duckweed using a sterile plastic inoculationloop. Vials were incubated at 248C under continuous fluores-cent light (cool white light at 60 to 80mmol photons s�1m�2).At renewal, the colonies were carefully transferred from thetest solution into the appropriate freshly prepared test solution,using plastic inoculation loops. An additional three vials of eachtreatment were prepared and incubated under the same testconditions (no duckweed added). These were sub-sampled onDays 0, 2, 4 and 7, before and after renewals, for chemicalanalyses.
The number of fronds in each treatment was counted on days2, 4, and 7. A regression line was fitted to a plot of the log offrond density (ln) versus time (h) for each vial and the averagespecific growth rate (m) was determined from the slope. Lemnagrowth was determined as growth rate (doublings) per day(ln2�m� 24), overall growth (final number of fronds/initialnumber of fronds), and 7-d biomass (dry wt).
Quality assurance
Test acceptability criteria for each test included a coefficientof variation of <20% in controls, reference toxicant within QAchart limits, water quality parameters (pH, salinity, conductiv-ity, dissolved oxygen) within acceptable limits and controlresponses within test limits (e.g., >90% survival) [12,13,15,17–21]. Reference toxicants used were phenol for the Microtoxtest, copper (as CuSO4) for microalgal, cladoceran and midgetests, and potassium chloride for the duckweed test. For themidge and duckweed tests, the reference toxicant test solutionswere not renewed.
Statistical analyses
For all tests, the EC10, EC50, LOEC and NOEC values werecalculated. For the Microtox test, the EC50 value was calculated
1988 Environ. Toxicol. Chem. 29, 2010 M.T. Binet et al.
using Microtox software [11], while the EC10 value wascalculated using Linear interpolation with ToxCalcTM (Version5.0.23, Tidepool Scientific). The LOEC and NOEC values weredetermined using Bonferroni’s t test in ToxCalc. For thecladoceran and midge tests, LOEC and NOEC values weredetermined (after arc-sine transforming the data) using Dun-nett’s multiple comparison test or Steel’s many one rank test,depending on the distribution and equality of variances. TheEC50 values were calculated using the trimmed Spearman-Karber method, while EC10 values were calculated usingMaximum likelihood regression models or non-linear interpo-lation, depending on the number of partial responses. Formicroalgal growth and duckweed growth and biomass bio-assays, ToxCalc was used to determine LOEC and NOECvalues (using Dunnett’s multiple comparison test) as well asIC10 and IC50 values (using Linear interpolation).
RESULTS AND DISCUSSION
Quality assurance
Quality assurance criteria were met for each test on eachoccasion. For Microtox, the 5-min EC50 for phenol ranged from22 to 25 mg/L, within the range of 13 to 26 mg/L for testacceptability. Mean control mobility in cladoceran controlswas 95 to 100% and the copper EC50 values ranged from6.7 to 8.1mg/L, within the acceptable range of 6.5� 3.0mg Cu/L. Survival of midge larvae in controls was 95%, while theEC50 for the reference toxicant copper was 119mg CuSO4/L,within the acceptable limit of 128� 25mg/L. Mean algalgrowth rates in the microalgal tests ranged from 1.9 to 2.2doublings per day, within the acceptability limits of 1.8� 0.5doublings per day, while the copper IC50 values ranged from8.1 to 10mg Cu/L within the range of 9.2� 1.8mg/L acceptablefor closed tests. The number of fronds in the duckweed controlsover the 7-d test increased by 12 to 22 times in the renewedcontrols and 14 to 20 times in the non-renewed controls, wellabove the >7-fold increase required for test acceptability. Thepotassium chloride IC50 values ranged from 4.4 to 4.8 g/L forLemna growth rate (doublings/day) and 4.9 to 5.7 g/L forbiomass (dry wt), both of which were within acceptable limits(4.9� 1.4 g/L and 5.7� 3.3 g/L, respectively). All water qualityparameters were also within normal test limits for all tests.
Chemical stability of DBE and TriBE
For all tests, the initial measured concentrations of DBE andTriBE in test treatments were usually less than their nominalconcentrations due to losses that occurred during test set-up andsub-sampling (e.g., as a result of volatilization). For example, inthe microalgal test, which has a relatively long test set-up time,the initial measured concentrations of DBE and TriBE wereapproximately 30 and 40% of their nominal concentrations,respectively. In comparison, in the cladoceran test, which has ashorter test set-up time, initial measured concentrations of DBEand TriBE were approximately 70 and 80% of their nominalconcentrations.
The concentrations of DBE and TriBE in all test solutionswere only measured once in the definitive Microtox tests andranged from 17 to 740 mg DBE/L and 0.29 to 15 mg TriBE/L.These measured concentrations were used to derive NOEC,LOEC, EC10, and EC50 values.
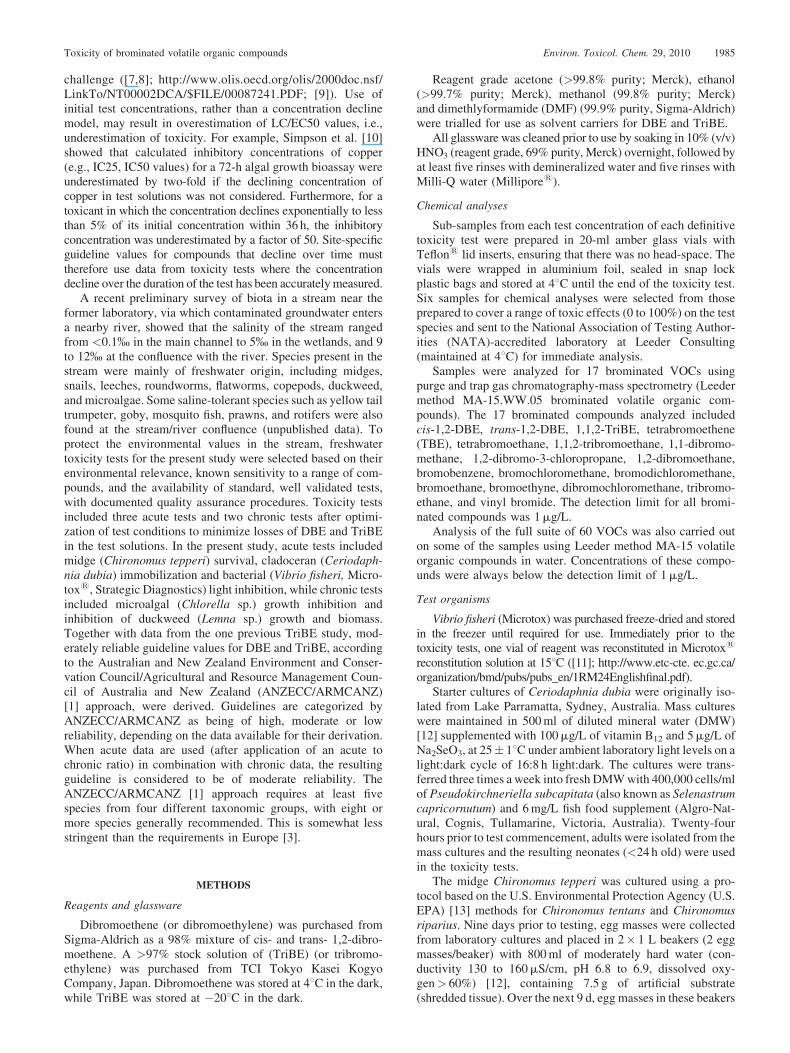
Measured concentrations of DBE and TriBE at the end ofthe cladoceran test were within 80 to 100% of the initialconcentrations (Fig. 1a and 2a), indicating that the closed testsystems had effectively reduced volatilization of DBE and
TriBE over the 48-h test. Because there was less than a 20%decline in concentrations throughout the tests, toxicity testresults could have been calculated using initial measuredconcentrations of DBE and TriBE. However, the averageof each test concentration over the five sub-samplings wasused for the derivation of EC10, EC50, LOEC, and NOECvalues.
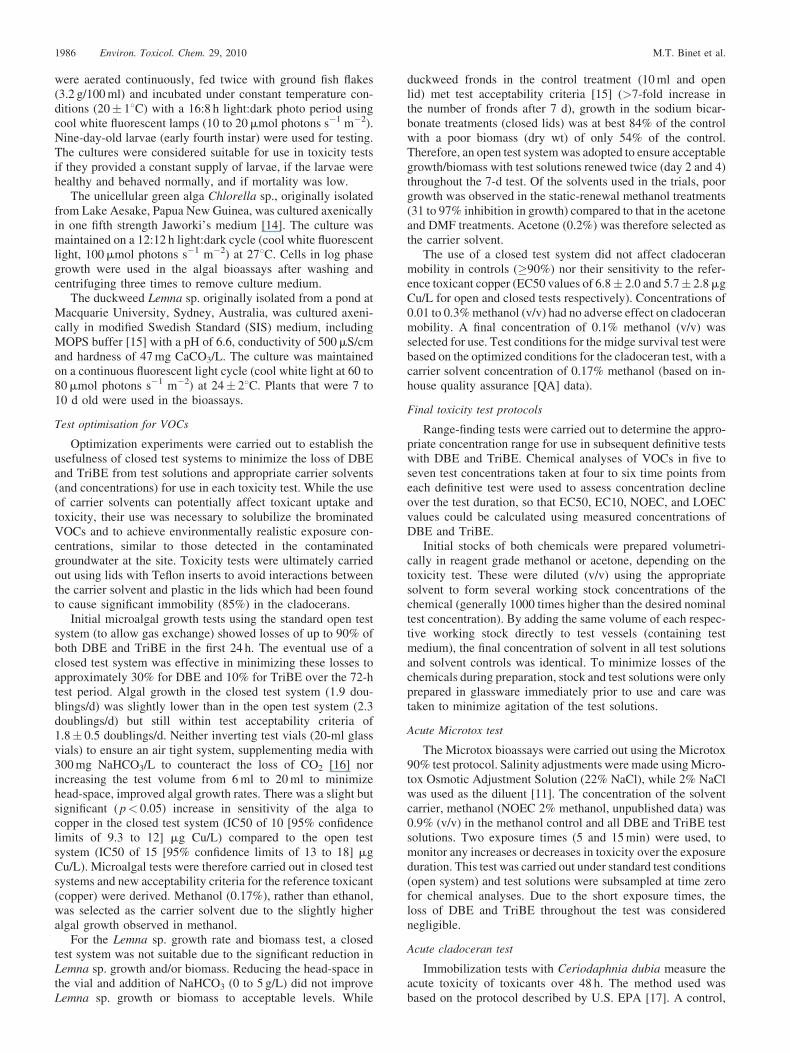
In the midge survival test, although a closed system wasemployed, average losses of approximately 40% DBE and 25%TriBE were found within the first 24 h, at which time thesolutions were renewed (Fig. 1b and 2b). The highest concen-tration of DBE (nominal concentration of 150 mg/L) was notrenewed however, as there were no surviving midge larvae after24 h in this test concentration. The average of the measuredconcentrations of DBE and TriBE (including pre-and post-renewal) were used to calculate the EC10, EC50, LOEC, andNOEC values.
In the microalgal test, there was an initial decrease in themeasured concentrations of DBE within the first 3 h of the test(Fig. 1c). After 72 h, DBE concentrations were 51 to 94% ofthose initially measured. Measured concentrations of TriBE inthe 12.5 and 25 mg/L (nominal) treatments were constant overthe 72 h test duration (Fig. 2c) with an average of 4.6 and9.3 mg/L, respectively (<10% loss compared to initial concen-trations of 4.9 and 9.9 mg/L, respectively). Concentrations ofTriBE in the lowest and highest concentrations tested (6.25 and37.5 mg/L, nominal) decreased over the 72 h test duration, withlosses of up to 34 and 29%, respectively. The average of themeasured concentrations (0 to 72 h) was used to calculatethe toxicity test endpoints for both DBE and TriBE, withthe exception of the TriBE 37.5 mg/L (nominal) treatment,for which the 48 h datum was excluded as an outlier.
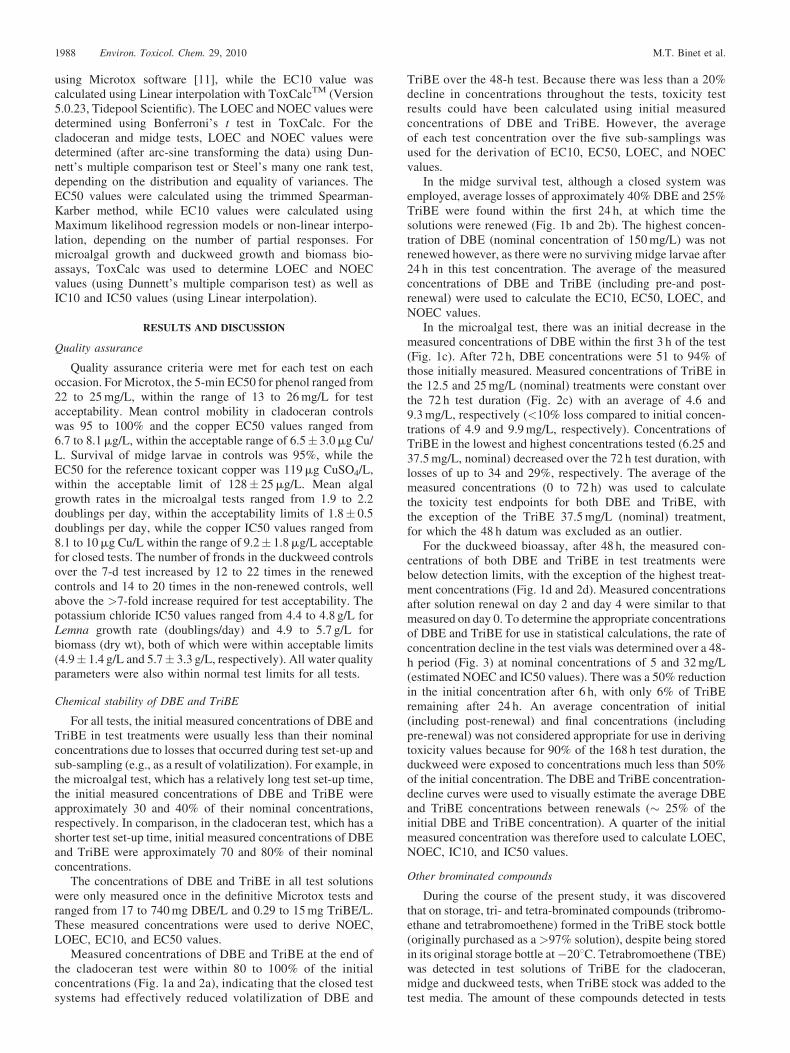
For the duckweed bioassay, after 48 h, the measured con-centrations of both DBE and TriBE in test treatments werebelow detection limits, with the exception of the highest treat-ment concentrations (Fig. 1d and 2d). Measured concentrationsafter solution renewal on day 2 and day 4 were similar to thatmeasured on day 0. To determine the appropriate concentrationsof DBE and TriBE for use in statistical calculations, the rate ofconcentration decline in the test vials was determined over a 48-h period (Fig. 3) at nominal concentrations of 5 and 32 mg/L(estimated NOEC and IC50 values). There was a 50% reductionin the initial concentration after 6 h, with only 6% of TriBEremaining after 24 h. An average concentration of initial(including post-renewal) and final concentrations (includingpre-renewal) was not considered appropriate for use in derivingtoxicity values because for 90% of the 168 h test duration, theduckweed were exposed to concentrations much less than 50%of the initial concentration. The DBE and TriBE concentration-decline curves were used to visually estimate the average DBEand TriBE concentrations between renewals (� 25% of theinitial DBE and TriBE concentration). A quarter of the initialmeasured concentration was therefore used to calculate LOEC,NOEC, IC10, and IC50 values.
Other brominated compounds
During the course of the present study, it was discoveredthat on storage, tri- and tetra-brominated compounds (tribromo-ethane and tetrabromoethene) formed in the TriBE stock bottle(originally purchased as a >97% solution), despite being storedin its original storage bottle at �208C. Tetrabromoethene (TBE)was detected in test solutions of TriBE for the cladoceran,midge and duckweed tests, when TriBE stock was added to thetest media. The amount of these compounds detected in tests
Fig. 1. Measured concentration decline of 1,2-dibromoethene (DBE) over the duration of the (a) 48-h closed cladoceran test, (b) 48-h closed midge test, (c) 72-hclosed microalgal test and (d) 168-h duckweed open test. Values in parentheses represent time since solution was renewed. Concentrations in legends are nominal.[Color figure can be seen in the online version of this article, available at wileyonlinelibrary.com.]
Toxicity of brominated volatile organic compounds Environ. Toxicol. Chem. 29, 2010 1989
completed with newly purchased TriBE (microalgal and duck-weed tests) was negligible (<2%). In the cladoceran test, thesecompounds were not detected in solutions at concentrationsnear the EC10, EC50, LOEC, or NOEC values, so it is unlikelythat TBE was contributing to the observed toxicity in these tests.For the midge test, negligible concentrations (<1% of totalbrominated compounds) of tribromoethane were detected inthree TriBE test solutions. However, approximately 17% of thedetected brominated VOCs in all TriBE solutions was actuallyTBE, so it is possible that TBE also contributed to toxicity to themidge. The toxicity of TBE alone was not determined for anytest species.
Toxicity of DBE and TriBE
Tribromoethene was more toxic than DBE to all test species,with NOEC values ranging from 0.29 to 13 mg TriBE/L andEC10 values ranging from 0.94 to 11 mg TriBE/L comparedto NOEC values of 22 to 82 mg DBE/L and EC10 values of 18to 94 mg DBE/L (Tables 1 and 2). Based on both EC10 andEC50 values, cladoceran immobilization and microalgal growthinhibition were the most sensitive tests to DBE, with EC10values of 18 and 19 mg DBE/L, respectively, and EC50 valuesof 28 and 39 mg DBE/L, respectively. Microtox was theleast sensitive test with an EC10 of 94 mg DBE/L and anEC50 of 420 mg DBE/L. For TriBE, the duckweed biomasstest and cladoceran immobilization tests were more sensitivethan the other tests and had similar EC10 (0.94 and 1.4 mgTriBE/L, respectively) and EC50 values (2.4 and 2.6 mg TriBE/
L, respectively) (Table 2). The least sensitive test to TriBE wasthe midge survival test, with an EC10 of 11 mg TriBE/L and anEC50 of 18 mg TriBE/L.
Very few literature data are available on the toxicity of DBEand TriBE to freshwater aquatic biota. Canton and Wegman [6]investigated the effect of TriBE on growth of the microalgaChlorella pyrenoidosa, immobilization and survival in thecladoceran Daphnia magna and survival and abnormal behaviorin the fish (guppy) Poecilia reticulata in closed test systems.Of these species, microalgal growth appeared to be the mostsensitive test, although measured TriBE concentrations werenot reported. The 48-h EC50 for algal growth was 3.5 mg/L,with a NOEC of 0.52 mg/L. Chlorella pyrenoidosa appeared tobe more sensitive than theChlorella sp. (identified tentatively asa new, as yet un-named species) used in the present study (72-hIC50 of 6.3 mg/L and NOEC of 2.2 mg/L), although compar-isons are difficult because the actual endpoint (growth rate orbiomass) was not reported. The methodology used by Cantonand Wegman [6] is poorly described and it is unclear whether asolvent carrier and solvent controls were used. Nevertheless,NOEC values for both studies for TriBE for the two differentspecies of microalgae were within a factor of 4.5.
Canton and Wegman [6] also reported a 48-h EC50 forTriBE for Daphnia magna of 7.2 mg/L, with a NOEC of5.3 mg/L, which was within a factor of 5 of Ceriodaphniadubia used in the present study. Measured concentrations ofTriBE at two test concentrations of the D. magna study weresimilar at 0 h and after 48 h. Long-term toxicity of TriBE to

Fig. 2. Measured concentration decline of 1,1,2-tribromoethene (TriBE) over the duration of the (a) 48-h closed cladoceran test, (b) 48-h closed midge test,(c) 72-h closed microalgal test and (d) 168-h duckweed open test. Values in parentheses represent time since solution was renewed. Concentrations in legends arenominal. [Color figure can be seen in the online version of this article, available at wileyonlinelibrary.com.]
1990 Environ. Toxicol. Chem. 29, 2010 M.T. Binet et al.
D. magna was also reported. The test duration was not statedbut is presumed to be 21 d, typical of chronic tests with thisspecies [22,23]. The reported long-term EC50 for TriBE forboth survival and inhibition of reproduction was 5.4 mg/L,with a NOEC of 3.1 mg/L, suggesting that there is littledifference in acute and chronic toxicity of TriBE to D. magna
0
5
10
15
20
25
0 12 24 36 48
Exposure Time (h)
Tri
BE
(m
g/L
)
a
Fig. 3. Measured concentration decline of 1,1,2-tribromoethene (TriBE) over 48concentrations of (a) 32 mg TriBE/L and (b) 5 mg TriBE/L. [Color figure can be se
(acute:chronic ratio of � 2). This supports the present studyresults (Tables 1 and 2). Ceriodaphnia dubia in the presentstudy (48-h EC50 of 2.6 mg/L and NOEC of 1 mg/L) wasmore sensitive to TriBE than D. magna, possibly due to itssmaller size and hence larger surface area/volume ratio foruptake of TriBE.
Exposure Time (h)
0
0.5
1
1.5
0 12 24 36 48
b
h in the open test system used in the duckweed bioassays in nominal testen in the online version of this article, available at wileyonlinelibrary.com.]

Table 1. Summary of Toxicity Test Results for 1,2-Dibromoethene (DBE)
Test Species Endpoint EC/IC10a (mg/L) EC/IC50b (mg/L) NOECc (mg/L)
AcuteMicrotox (Vibrio fischeri) 5-min luminescence 70 (46–96)d 340 (230–390) 35
15-min luminescence 94 (56–130) 420 (360–490) 73Cladoceran (Ceriodaphnia dubia) 48-h immobilization 18 (6.9–25) 28 (22–35) 22Midge (Chironomus teperri) 48-h survival 81 (64–90) 95 (89–100) 82
ChronicMicroalgae (Chlorella sp.) 72-h growth rate 19 (0–42) 39e 28Duckweed (Lemna sp.) 7-day growth rate 39 (36–40) 69 32Duckweed (Lemna sp.) 7-day biomass 36 (0–36) 53 (46–54) 32
a Concentration to cause 10% effect or inhibition.b Concentration to cause 50% effect or inhibition.c No-observed-effect concentration.d 95% Confidence limits.e 95% Confidence limits could not be determined.
Toxicity of brominated volatile organic compounds Environ. Toxicol. Chem. 29, 2010 1991
The guppy was also sensitive to TriBE, with a 96-h LC50 of12.4 mg/L, a 96-h EC50 of 4.7 mg/L, and a NOEC of 3.5 mg/L(endpoint not reported) [6]. Acute data for these three speciesfrom the Canton and Wegman study (including the Chlorellapyrenoidosa which was a different Chlorella species than theone used in the present study) were included in the speciessensitivity distributions used to derive the trigger value forTriBE.
Derivation of guideline trigger values
Toxicity data were plotted in SSDs to estimate DBE andTriBE guideline trigger values that would be protective of 95%of the species in receiving waters with 50% confidence, i.e. thehazard concentration, HC5(50) [1]. Although at least eight datapoints are recommended, preferably including biota from threetrophic levels, due to the volatile nature of the test chemicalsand the animal ethics requirements associated with fish testingin Australia, fish bioassays were not included in this suite oftests. For DBE, SSDs used only five data points from threetrophic levels, the minimum required [1]. Where two toxicityendpoints were measured (i.e., duckweed biomass and growthrate, and Microtox 5- and 15-min luminescence), the mostsensitive of the two toxicity values was used. There are noother published toxicity data for DBE.
The derivation of a guideline requires the use of chronicNOECs. A mixture of acute and chronic data can be combined,however, acute data must first be converted to chronic NOECs.It is usual to divide acute LC/EC50 values by an acute to chronicratio (ACR) of 10, to produce a chronic NOEC to combine withother chronic NOEC data in the SSD [1]. For DBE, the best datafit (Fig. 4) was obtained by using NOEC data from the two
Table 2. Summary of Toxicity Test Resul
Test Species Endpoint
AcuteMicrotox (Vibrio fischeri) 5-min luminescence
15-min luminescenceCladoceran (Ceriodaphnia dubia) 48-h immobilizationMidge (Chironomus teperri) 48-h survival
ChronicMicroalgae (Chlorella sp.) 72-h growth rateDuckweed (Lemna sp.) 7-day growth rateDuckweed (Lemna sp.) 7-day biomass
a Concentration to cause 10% effect or inhibition.b Concentration to cause 50% effect or inhibition.c No-observed-effect concentration.d 95% Confidence limits.
chronic tests (duckweed and microalgae) and acute NOEC datafrom the bacteria, cladoceran and midge tests, after applicationof an ACR of 10 to the acute NOECs. This approach has beenused by both the World Health Organization for risk assessmentof individual chemicals [24] and by regulatory authoritiesassessing the risk of desalination brine effluents.
Sensitivity analyses of the SSDs were undertaken byexamining the effects of using either EC50 values divided byan ACR of 10, or EC5 data divided by an ACR of 10, from acutetests, combined with the chronic NOEC data (or EC5 data),according to the ANZECC/ARMCANZ [1] approach. On thebasis of these iterations, HC5(50) ranged from 1 to 3 mg/L.Taking into account the best data fits, a trigger value of 1.9 mg/LDBE (rounded up to 2 mg/L) was estimated.
For derivation of the TriBE trigger value, NOEC data fromthe two chronic tests (duckweed and algae) were combined withacute NOEC data from the bacteria, cladoceran and midgetests, after application of an ACR of 10 to the acute NOECs.In addition, three literature values (NOECs) from acute tests(under closed conditions) with algae, cladoceran and fish,reported by Canton and Wegman [6] were also used in theSSD, after application of an ACR of 10, giving a total of eightdata points for the trigger value derivation. The derived triggervalue (HC5(50)) was 0.03 mg/L TriBE (to be protective of 95%of species with 50% confidence) (Fig. 5). Species sensitivitydistributions were also plotted using EC5 data in place ofNOECs, however no literature data were available and onlythe five data points from the present study could be used. Thederived HC5(50) from the EC5 data was 0.04 mg/L, similar tothe value derived from the eight NOEC data (0.03 mg/L). Aguideline trigger value of 0.03 mg/L was therefore adopted as a
ts for 1,1,2-Tribromoethene (TriBE)
EC/IC10a (mg/L) EC/IC50b (mg/L) NOECc (mg/L)
1.1 (0.32–1.7)d 6.1 (5.4–6.8) 0.291.1 (0.58–1.7) 5.5 (4.8–6.1) 0.29
1.4 (0–1.7) 2.6 (2.1–3.2) 1.011 (4–14) 18 (15–22) 13
3.1 (2.6–3.6) 6.3 (5.5–7.0) 2.21.6 (0.74–2.0) 4.5 (3.8–5.1) 0.630.94 (0.82–1.1) 2.4 (2.0–2.9) 0.63

Fig. 4. Species sensitivity distribution to estimate 1,2-dibromoethene(DBE) guideline value for 95% species protection (50% confidence).[Color figure can be seen in the online version of this article, available atwileyonlinelibrary.com.]
1992 Environ. Toxicol. Chem. 29, 2010 M.T. Binet et al.
conservative value. This value was well above a previousscreening criterion for TriBE of 3.5 mg/L, which was derivedby applying a safety factor of 1000 to the lowest NOEC value of3.5 mg/L in the Canton and Wegman study [6]. According toANZECC/ARMCANZ [1], this screening criterion would becategorised as low reliability, due to the use of a safety factorapplied to a limited dataset, whereas the current guideline valueof 0.03 mg/L is considered to be of moderate reliability due tothe combination of acute and chronic data in an SSD.
The main assumptions associated when applying SSDs arethat the endpoints are ecologically relevant, the chosen level ofprotection is relevant, the chosen confidence limits around theprotection level are appropriate, the species used to constructthe SSD are an unbiased representation of the target group ofspecies, the shape of the distribution is appropriate, and thenumber of species used in the SSD is adequate to meetassumptions [25]. When using smaller datasets in SSDs, itbecomes increasingly difficult to address the latter three ofthese assumptions, therefore introducing a level of uncertaintythat is highly dependant on sample size. It has been argued thatthese limitations make the use of smaller data sets (fewer thaneight species) in SSDs for deriving trigger values questionable[26,27,3].
Aldenberg and Jaworska [28] showed that although theuncertainty around the HC5 and the actual factor affected
Fig. 5. Species sensitivity distribution to estimate 1,1,2-tribromoethene(TriBE) guideline value for 95% species protection (50% confidence). [Colorfigure can be seen in the online version of this article, available atwileyonlinelibrary.com.]
decreases with increasing sample size, the difference betweenthe uncertainty when n¼ 5 is not very different to that whenn¼ 8. For example, the upper confidence limit of the medianestimate HC5 was 32% when n¼ 5. This was only reduced to23% when n¼ 8, 16% when n¼ 15 and still 12% when n¼ 30.Given that an increased level of uncertainty is acknowledged, itcan also be counter-argued that the advantages of the SSDapproach justify its use, even with small datasets. In contrast tothe safety factor approach, the SSD approach uses all availabletoxicity data (not just the most sensitive endpoint), it allows forthe definition of a particular level of protection, it providesconfidence limits around the derived HC value and it alsopromotes the generation of additional toxicity data to reducethe conservatism of the derived value.
Implications for receiving waters
Although concentrations of 3 mg DBE/L and 220 mgTriBE/L were found in groundwaters near the former process-ing site, maximum concentrations of these compounds weremuch lower over several years of monitoring in the stream thatdischarges into the nearby river, with up to 3mg/L for DBE and1mg/L for TriBE, indicating that VOCs in the groundwaterunderwent substantial attenuation by the time the groundwaterreached the river. These maximum concentrations were severalorders of magnitude lower than the trigger values of 2 mg/L forDBE and 0.03 mg/L for TriBE derived in the present study,suggesting that DBE and TriBE pose minimal risk to freshwateraquatic biota in the stream. This can be quantified using themaximum values as the predicted environmental concentration(PEC) and the trigger values as the predicted no effect con-centration (PNEC), giving a PEC/PNEC, i.e., a hazard quotientof 0.0015 and 0.03 for DBE and TriBE respectively. Hazardquotients of <1 confirm that DBE and TriBE pose minimal riskto aquatic biota in the stream and river waters [3]
CONCLUSIONS
The present study provides freshwater guideline triggervalues of 2 mg/L and 0.03 mg/L for DBE and TriBE, respec-tively. The TriBE value was substantially higher and morereliable than the low reliability screening criterion of 3.5mgTriBE/L, derived using a safety factor approach with the limitedTriBE data previously available (three datapoints).
Data used to derive the guideline values were from toxicitytests that were optimized (e.g. closed test systems, solutionrenewals) to minimize the loss of DBE and TriBE during theexposure period. In addition, using careful measurements ofDBE and 1,1,2-tribromomethane throughout each toxicity test,declining concentrations of the compounds were incorporatedinto final toxicity values. 1,1,2-tribromoethene was more toxicthan DBE, with lower EC10, EC50, and NOEC values.
Maximum concentrations of DBE and TriBE in surface wat-ers of the stream that discharges groundwater into the nearbyriver were several orders of magnitude below the newly derivedtrigger values. Hazard quotients of <1 further confirmed thatDBE and TriBE pose minimal risk to aquatic biota in the streamand river receiving waters.
Acknowledgement—The authors would like to thank Anu Kumar andMarianne Woods (Commonwealth Scientific and Industrial ResearchOrganization, Land and Water, Adelaide) for carrying out the midgebioassays, Margaux Park and Sarah Stephenson for technical work during theprogram, John Leeder and the staff of Leeder Consulting for the chemicalanalyses and Rick Cardwell from Parametrix, USA for reviewing the testprogram.
Toxicity of brominated volatile organic compounds Environ. Toxicol. Chem. 29, 2010 1993
REFERENCES
1. Australian and New Zealand Environment and Conservation Council/Agricultural and Resource Management Council of Australia and NewZealand. 2000. Australian and New Zealand guidelines for fresh andmarine water quality. Canberra, Australia.
2. Organization for Economic Cooperation and Development. 2002.Manual for the Investigation of HPV Chemicals. Chapter 4.2 Guidancefor the Initial Assessment of Aquatic Effects. Paris, France.
3. European Commission. 2003. Technical Guidance Document on RiskAssessment Part II. EUR 20418 EN/2. Luxembourg.
4. Aldenberg T, Slob W. 1993. Confidence limits for hazardousconcentrations based on logistically distributed NOEC toxicity data.Ecotoxicol Environ Saf 25: 48–63.
5. Patterson BM, Cohen E, Prommer H, Thomas DG, Rhodes S, McKinlayAJ. 2007. Origin of a mixed brominated ethene plume: contaminantdegradation pathways and reactions. Environ Sci Technol 41: 1352–1358.
6. Canton JH, Wegman RCC.1983. Studieson the toxicity of tribromoethene,cyclohexene and bromocyclohexane to different freshwater organisms.Water Res 17: 743–747.
7. Rufli H, Fisk PR, Girling AE, King JMH, Lange R, Lejeune X, Stelter N,Stevens C, Suteau P, Tapp J, Thus J, Versteeg DJ, Niessen HJ. 1998.Aquatic toxicity testing of sparingly soluble, volatile and unstablesubstances and interpretation and use of data.Ecotoxicol Environ Saf 39:72–77.
8. Organization for Economic Cooperation and Development. 2000.Guidance documenton aquatic toxicity testing of difficult substances andmixtures. Guideline 23. Paris, France.
9. U.S. Environmental Protection Agency. 1996. Ecological effects testguidelines. Special considerations for conducting aquatic laboratorystudies. OPPTS 850.1000. EPA 712-C- 96-113. Office of Prevention,Pesticides and Toxic Substances, Washington, DC.
10. Simpson SL, Roland MGE, Stauber JL, Batley GE. 2003. Effect ofdeclining toxicant concentrations on algal bioassay endpoints. EnvironToxicol Chem 22: 2073–2079.
11. Environment Canada. 1992. Biological Test Method: Toxicity TestUsing Luminescent Bacteria (Photobacterium phospherum). ReportEPS 1/RM/24. Ottawa, ON.
12. U.S. Environmental Protection Agency. 1993. Methods for measuringthe acute toxicity of effluents and receiving waters to freshwater andmarine organisms. 4th ed. EPA/600/4-90/027F. Office of Research andDevelopment, Washington DC.
13. U.S. Environmental Protection Agency. 1994. Methods for measuringthe toxicity and bioaccumulation of sediment-associated contaminateswith freshwater invertebrates. EPA-600/R-94/024. Office of Researchand Development, Duluth, MN.
14. Thompson AS, Rhodes JC, Pettman I. 1988. Culture Collection of Algaeand Protozoa Catalogue of Strains. Natural Environmental ResearchCouncil, Swindon, UK.
15. Organization for Economic Cooperation and Development. 2004.Guideline for the testing of chemicals. Revised protocol for Lemna sp.inhibition test. Guideline 221. Paris, France.
16. Mayer P, Nyholm N, Verbruggen MJ, Hermens LM, Tolls J. 2000. Algalgrowth inhibition test in filled, closed bottles for volatile and sorptivematerials. Environ Toxicol Chem 19: 2551–2556.
17. U.S. Environmental Protection Agency. 2002. Methods for measuringthe acute toxicity of effluents and receiving waters to freshwater andmarine organisms. 5th ed. EPA-821-R- 02-012. Office of Research andDevelopment, Washington DC.
18. Franklin NM, Stauber JL, Adams MS. 2005. Improved methods ofconductingmicroalgal bioassaysusingflow cytometry. In OstranderGK,ed, Techniques in Aquatic Toxicology, Vol 2. CRC, Boca Raton, FL,USA pp 735–756.
19. Organization for Economic Cooperation and Development. 1984.Guideline for testing of chemicals.Alga growth inhibition test. Guideline201. Paris, France.
20. Stauber JL, Tsai J, Vaughan GT, Peterson SM, Brockbank CI. 1994.Algae as indicators of toxicity of the effluent from bleached eucalyptkraft paper mills. National Pulp Mills Research Program TechnicalReport 3. Commonwealth Scientific and Industrial Research Organ-ization, Canberra, Australia.
21. Environment Canada. 1999. Biological Test Method: Test for Measuringthe Inhibition of Growth Using the Freshwater Macrophyte, Lemnaminor. EPS 1/RM/37. Ottawa, ON.
22. Organization for Economic Cooperation and Development. 2008.Guidelines for the Testing of Chemicals, Guideline 211: Daphnia magnaReproduction Test. Paris, France.
23. U.S. Environmental Protection Agency. 1996. Daphnid chronic toxicity test.EPA 712–C– 96-120. Office of Research and Development, Duluth, MN.
24. International Program on Chemical Safety. 2003.Environmental HealthCriteria 230 Nitrobenzene, Appendix 2. World Health Organisation,Geneva, Switzerland.
25. Forbes VE, Calow P. 2002. Species sensitivity distributions revisited: acritical appraisal. Hum Ecol Risk Assess 8: 473–492.
26. Wheeler JR, Grist EPM, Leung KMY, Morritt D, Crane M. 2002. Speciessensitivity distributions: data and model choice.MarPollut Bull 45: 192–202.
27. Scheringer M, Steinbach D, Escher B, Hungerbuhler K. 2002. Probalisticapproaches in the effect assessment of toxic chemicals. Environ SciPollut Res 9: 307–314.
28. Aldenberg T, Jaworska JS. 2000. Uncertainty of the hazardousconcentration and fraction affected for normal species sensitivitydistributions. Ecotoxicol Environ Saf 46: 1–18.