A participatory approach to the establishment of a baseline scenario for a reforestation Clean...
22
Abstract This paper is part of a two-year study to investigate the feasibility of initiating a Clean Development Mechanism (CDM) project in an indigenous com- munity of Eastern Panama ´, Ipetı´-Embera ´ . We use participatory mapping and matrices as well as household surveys to develop a land-use/land-cover baseline scenario and examine the role of local participation in assessing land-use change. In Ipetı´, land-use change has not occurred in a linear way over the last decades, and our data unveils socio-economic factors as potential key drivers of change. The concor- dance that we observed between geographic information and individual and collec- tive perceptions of land-use change substantiates the possibility of using local knowledge in the establishment of baseline data for CDM projects. Our calculations C. Potvin (&) P. Tschakert F. Lebel K. Kirby S. Goldenberg P. Hayes Department of Biology, McGill University, 1205 Dr Penfield, H3A 1B1 Montre ´al, Que ´ bec, Canada e-mail: [email protected] Present Address: P. Tschakert Pennsylvania State University, University Park, USA Present Address: K. Kirby University of British Columbia, Vancouver, Canada H. Barrios Universidad de Panama ´, Panama ´ , Panama ´ J. Bocariza J. Caisamo L. Caisamo C. Cansari J. Casama ´ M. Casama ´ L. Chamorra N. Dumasa V. Guainora J. Ruı ´z Ipetı ´-Embera ´, Panama ´, Panama ´ C. Potvin Smithsonian Tropical Research Institute, Panama ´, Panama ´ T. Moore Department of Geography, McGill University, Montre ´ al, Canada 123 Mitig Adapt Strat Glob Change DOI 10.1007/s11027-006-9056-3 ORIGINAL PAPER A participatory approach to the establishment of a baseline scenario for a reforestation Clean Development Mechanism project Catherine Potvin Petra Tschakert Fre ´de ´ric Lebel Kate Kirby Hector Barrios Judith Bocariza Jaime Caisamo Leonel Caisamo Charianito Cansari Juan Casama ´ Maribel Casama ´ Laura Chamorra Nesar Dumasa Shira Goldenberg Villalaz Guainora Patrick Hayes Tim Moore Johana Ruı´z Received: 18 May 2006 / Accepted: 26 September 2006 ȑ Springer Science+Business Media B.V. 2006
Transcript of A participatory approach to the establishment of a baseline scenario for a reforestation Clean...
Abstract This paper is part of a two-year study to investigate the feasibility ofinitiating a Clean Development Mechanism (CDM) project in an indigenous com-munity of Eastern Panama, Ipetı-Embera. We use participatory mapping andmatrices as well as household surveys to develop a land-use/land-cover baselinescenario and examine the role of local participation in assessing land-use change. InIpetı, land-use change has not occurred in a linear way over the last decades, and ourdata unveils socio-economic factors as potential key drivers of change. The concor-dance that we observed between geographic information and individual and collec-tive perceptions of land-use change substantiates the possibility of using localknowledge in the establishment of baseline data for CDM projects. Our calculations
C. Potvin (&) Æ P. Tschakert Æ F. Lebel Æ K. Kirby Æ S. Goldenberg Æ P. HayesDepartment of Biology, McGill University, 1205 Dr Penfield, H3A 1B1 Montreal,Quebec, Canadae-mail: [email protected]
Present Address:P. TschakertPennsylvania State University, University Park, USA
Present Address:K. KirbyUniversity of British Columbia, Vancouver, Canada
H. BarriosUniversidad de Panama, Panama, Panama
J. Bocariza Æ J. Caisamo Æ L. Caisamo Æ C. Cansari Æ J. Casama Æ M. Casama Æ L. Chamorra ÆN. Dumasa Æ V. Guainora Æ J. RuızIpetı-Embera, Panama, Panama
C. PotvinSmithsonian Tropical Research Institute, Panama, Panama
T. MooreDepartment of Geography, McGill University, Montreal, Canada
123
Mitig Adapt Strat Glob ChangeDOI 10.1007/s11027-006-9056-3
ORI GI N A L P A PE R
A participatory approach to the establishmentof a baseline scenario for a reforestation CleanDevelopment Mechanism project
Catherine Potvin Æ Petra Tschakert Æ Frederic Lebel Æ Kate Kirby ÆHector Barrios Æ Judith Bocariza Æ Jaime Caisamo Æ Leonel Caisamo ÆCharianito Cansari Æ Juan Casama Æ Maribel Casama Æ Laura Chamorra ÆNesar Dumasa Æ Shira Goldenberg Æ Villalaz Guainora Æ Patrick Hayes ÆTim Moore Æ Johana Ruız
Received: 18 May 2006 / Accepted: 26 September 2006� Springer Science+Business Media B.V. 2006
suggest that the total carbon (C) stocks in the Tierra Colectiva (TC) of Ipetı-Emberain 2004 represents a 47% reduction from the estimated C stock at the onset ofsettlement in the early 1970’s. Results from the participatory assessments predict that,in 2024 and in absence of a CDM project, the C stocks will decline from 301,859 t C in2004 to 155,730 t C, which constitutes a reduction of 52%. The scenario with CDMestimates C stocks of 305,853 t C for 2024, a value slightly superior to the 2004 value.In the TC there is ground to believe that cattle ranching is likely to become an evermore important activity as the population is young and growing and cannot easilymove elsewhere. Forests tend to be cleared for cultivation while pastures areestablished on short fallows. Our baseline scenario underlines the potential for aCDM project to make a significant difference in the future C stocks of this landscape.
Keywords Carbon stocks Æ CDM baseline Æ Participatory approaches ÆPasture Æ Demography
1 Introduction
The Clean Development Mechanism (CDM), an agreement negotiated under theUnited Nations Framework Convention on Climate Change (UNFCCC) KyotoProtocol, allows industrialized countries to meet part of their commitment ofgreenhouse gases reduction by supporting initiatives, in developing countries, thatcontribute to the reduction of atmospheric carbon dioxide (CO2) while enhancingsustainable development in these host countries. Practices recognized in the firstcommitment period of the Kyoto Protocol (2008–2012) include afforestation andreforestation projects (AR) both of which refer to the human conversion of land fromnon-forest uses to forest (Smith and Scherr 2003). Small-scale AR activities includeagroforestry, community forest plantations, forest regeneration, and improved fal-lows while large-scale ones include industrial plantations. The capital requirementnecessary for investment in new land-use practices is a well-known barrier to theadoption of potentially more sustainable or desirable land-use practices among poorfarmers (Place and Dewees 1999). In Panama, the lack of financial resources preventssuccessful adoption of agroforestry practices among smallholders (Fischer and Vas-seur 2000). Therefore, the possibility of implementing CDM projects might presentunique opportunities to modify land-use patterns and increase carbon (C) sinks in this‘‘environmentally important region of Central America’’ (Nelson et al. 2001). Plan-tations on land previously dedicated to non-forest uses, from small to medium size,have been proposed as viable AR strategies in several communities of Chiapas,Mexico (Nelson and De Jong 2003). Benefits are likely to include increased pro-duction to meet subsistence and monetary needs. However, potential drawbacksinclude the reduction of land available for food production, increased vulnerability tomarket forces, and uneven distribution of social and economic benefits among par-ticipants (Smith and Scherr 2003; Brown and Corbera 2003, Brown et al. 2004).
There is still much debate surrounding methodological issues for CDM projects,especially around the notions of leakage and additionality. To ensure that a CDMproject indeed contributes to the stabilization of atmospheric CO2, it must be shownthat AR activities will not be counter balanced elsewhere by deforestation, hencethe concept of leakage, and that they would not have occurred without the CDM,hence the concept of additionality. Establishing the baseline scenario, i.e. the most
Mitig Adapt Strat Glob Change
123
plausible scenario of land-use and land-use change without the CDM project, is akey step in this entire process. It provides the null or ‘‘business as usual’’ (BAU)model with which the efficiency of a proposed CDM project at decreasing CO2
emissions must be compared.This paper is part of a two-year study to investigate the feasibility of implementing
a CDM project in an indigenous community of Eastern Panama, Ipetı-Embera. Inorder to develop an effective land management plan, the pilot project comprises aseries of steps to assess the physical and social potential for C sequestration (Kirbyand Potvin in press; Tschakert et al. 2006) and to investigate realistic land-use optionsthat could both store additional C and improve local livelihoods. The specificobjective of this part of the study was to provide the information needed to establish abaseline for C stocks by studying past changes and elaborating future trends in land-use. In a recent review, Lambin et al. (2003) emphasize the intricate processes gov-erning changes in land-cover. According to these authors, prediction of land-usechanges must be grounded in a solid understanding of the human-environmentsystem. Consequently, we largely rely on participatory exercises, carried out in 1998and 2004, and on household surveys (2004) to develop a reliable baseline scenario.
2 Methods
2.1 Study site
The study took place in Ipetı-Embera, an indigenous community situated in thewatershed of Alto Bayano about 160 km east of the city of Panama. Ipetı-Embera islocated in the District of Chepo in the Eastern part of the Province of Panama. Thecommunity holds 3,145 ha of communal land, the Tierra Colectiva (TC), which isdivided into plots or parcelas managed by individual households (Tschakert et al.2006). Primary economic activities include subsistence cultivation, cattle ranching,day labor, and handicraft production (Tschakert et al. 2006).
The Embera settled in the Bayano region when they migrated from the easternDarien in the 1950s. Between 1972 and 1976, the construction of a hydroelectric damon Lake Bayano forced the resettlement of 500 Emberas, 1,500 Kunas, and 2,500colonist farmers within the region (Herrera 2000). The Emberas, mostly living indispersed family settlements, were relocated into two villages along the PanAmerican highway, Piriati and Ipetı-Embera. In Ipetı-Embera, twelve familiesconstituted the first ‘‘official’’ inhabitants of the TC, a land promised to them byGeneral Omar Torrijos, then president of Panama, in an agreement known as ‘‘elConvenio de Majecito’’. It is reported that, before the flooding of the Bayano dam,the landscape of Ipetı was largely pristine forest (McKay 1984).
2.2 Socio-economic and land-use data collection at the household level
In order to understand the socio-economic drivers of land-use change within the TC,information on land-use patterns, demographic and economic household characteristics,and the settlement history of Ipetı-Embera was obtained through formal interviews withmembers of 36 different households, corresponding to roughly half of the householdsfrom the TC. Details on the interview methodology can be found in Tschakert et al.(2006). A stratified random sampling strategy was used to capture households from the
Mitig Adapt Strat Glob Change
123
various parts of the community and different wealth strata, as determined through aparticipatory wealth ranking. The interviews were carried out by four local (MC, LaC,JR, JB) and one McGill (PT) researchers. Questions on household demographics in-cluded name, sex, age, education, place of birth, and, when appropriate, the arrival dateof each family member in Ipetı-Embera and the year at which the family built its firsthouse. Land-use information was obtained by outlining the household’s parcela(s) on apiece of paper, indicating the proportions of the various land-use types and recordingparcelas’ histories, including crop-fallow rotations and establishment of pasture andsmall-scale tree plantations. Household income and expenditures for 2004 were assessedthrough a participatory household budget ranking.
Data from the household surveys were analyzed using two different types ofmultivariate analysis. Multivariate analysis (MA), employed widely in ecology toexplain patterns of correlation within complex data (Legendre and Legendre 1998),is now advocated to bridge the gap between anthropological and biological research(Potvin et al. 2005, Pereira and da Fonseca 2003, Abel and Stepp 2003). MA allowsthe relationships between multiple predictor and response variables to be quantified.As in regression or correlation analysis, the patterns exposed do not imply cause andeffect relations; they do however highlight groups of variables that vary in a coor-dinated way. We used MA to identify the socio-economic variables that are moststrongly associated with land-use change.
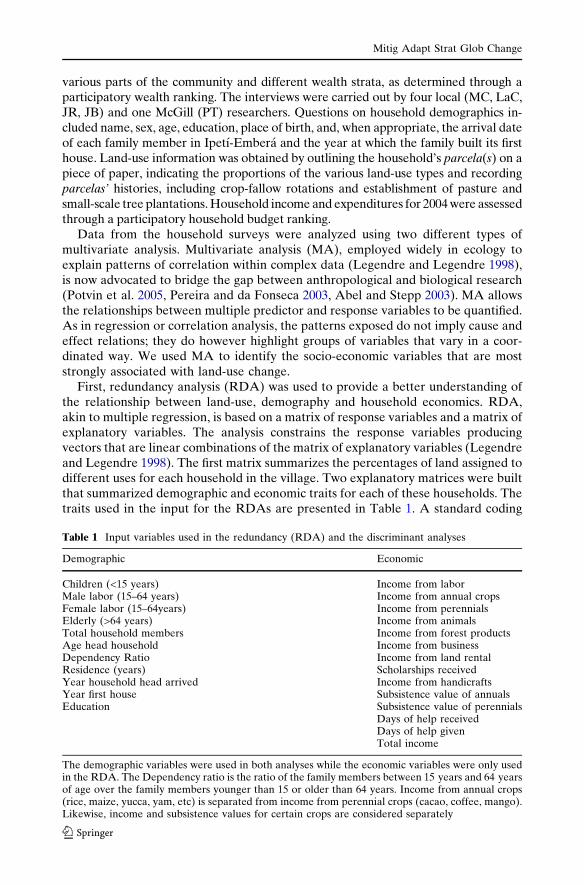
First, redundancy analysis (RDA) was used to provide a better understanding ofthe relationship between land-use, demography and household economics. RDA,akin to multiple regression, is based on a matrix of response variables and a matrix ofexplanatory variables. The analysis constrains the response variables producingvectors that are linear combinations of the matrix of explanatory variables (Legendreand Legendre 1998). The first matrix summarizes the percentages of land assigned todifferent uses for each household in the village. Two explanatory matrices were builtthat summarized demographic and economic traits for each of these households. Thetraits used in the input for the RDAs are presented in Table 1. A standard coding
Table 1 Input variables used in the redundancy (RDA) and the discriminant analyses
Demographic Economic
Children (<15 years) Income from laborMale labor (15–64 years) Income from annual cropsFemale labor (15–64years) Income from perennialsElderly (>64 years) Income from animalsTotal household members Income from forest productsAge head household Income from businessDependency Ratio Income from land rentalResidence (years) Scholarships receivedYear household head arrived Income from handicraftsYear first house Subsistence value of annualsEducation Subsistence value of perennials
Days of help receivedDays of help givenTotal income
The demographic variables were used in both analyses while the economic variables were only usedin the RDA. The Dependency ratio is the ratio of the family members between 15 years and 64 yearsof age over the family members younger than 15 or older than 64 years. Income from annual crops(rice, maize, yucca, yam, etc) is separated from income from perennial crops (cacao, coffee, mango).Likewise, income and subsistence values for certain crops are considered separately
Mitig Adapt Strat Glob Change
123
system was implemented for the qualitative socio-economic traits. The explanatoryvariables were standardized and centered prior to the analysis. Monte Carlo per-mutation tests were then performed with 999 permutations, in other words data werereshuffled and re-sampled at random 999 times (ter Braak and Verdonschot 1995).RDAs were performed using the program CANOCO, version 4.0 (ter Braak andSmilauer 1998). Second, a discriminant analysis was carried out to identify demo-graphic factors separating the respondents that did or did not have pastures withintheir land portfolios. The analysis helped identify the socio-economic conditionsrelated to the presence of pasture. This is important as creation of pasture has adrastic effect on land-cover. A discriminant analysis is akin to multiple regression butproceeds in two steps. First explanatory variables are assigned to pre-determinedgroups; then linear combinations of explanatory variables are identified for eachgroup. The analysis was performed using SYSTAT version 10.2.
2.3 Visualizing land-use change: Participatory mapping and change matrices
As a complement to the socio-economic household data, we relied on two locallyconstructed maps that indicate the extent of various land-use types at two points in time(1998 and 2004) and participatory change matrices to understand proportional changesin land-use and management practices since the beginning of settlement in Ipetı.
As part of a project examining the sustainable use of plants of cultural importance(Dalle and Potvin 2004), a participatory map of land-use was produced for the TC in1998 (Fig. 1), using a 1990 survey map of the TC as the base map. With the help ofone member of the local organization, each land owner drew his/her parcela(s) andland-uses on the base map. The land-use categories were pasture, primary forest,secondary forest and cropland. Once the land-use map was completed, it was pre-sented and discussed in a community meeting to verify accuracy and ensure that thedifferent land owners agreed, not only on the position and use of their own land, butalso on the position and use of the land of their neighbors. The area occupied byeach of the land-uses from the 1998 exercise was measured by superimposing amillimetric grid over the map. Knowing that the entire TC is of 3,145 ha, the pro-portion of the area allocated to the different land-uses in 1998 was estimated. Theland-use information was verified by dividing the entire TC was in 50 blocks with onerandom point selected by X–Y coordinates in each block. The exact position of those50 points was estimated in the field using a Geographical Positioning System (GPS12XL Garmin). For each point, the name of the plot owner and land-use wererecorded. The GPS points were revisited in 2005 and any changes in land-userecorded.
The 2004 land-use map relied on a combination of geographic informationsystem (GIS) technology and participatory mapping. The first step in the 2004mapping process was to create an updated base map of the TC. A detailed seriesof 16 digital aerial photographs comprising the region of Ipetı-Embera taken in2000 were joined to create a mosaic using Adobe PhotoShop. The mosaic was thenimported into a GIS software package, IDRISI32 to create a raster image file. Theraster image file was geo-referenced by taking GIS points along the boundaryof the TC as well as throughout the territory. Once the aerial photograph wasgeo-referenced, the base map was created by digitising, on a new vector layer, thevarious rivers, roads and key trails. To these features was added the territorial
Mitig Adapt Strat Glob Change
123
boundary made out of the relevant GPS points. This vector layer file was saved asa map composition and then printed in a 36¢¢ · 42¢¢ format. Two members of thecommunity were trained to lead the participatory mapping exercise involving the
Fig. 1 Participatory map of the TC of Ipetı-Embera developed in 1998. The land-use categorieswere pasture (pastos e potrero), primary forest (bosque intacto), secondary forest (bosquesecundario) and cropland (cultivo agrıcola)
Mitig Adapt Strat Glob Change
123
large majority of all land owners who indicated the proportion of their variousland-uses within their outlined parcela(s), using different colors. The final versionof the land map (Fig. 2) was approved by individual land owners. A digital versionof the participatory map was obtained by photographing the hand-drawn mapaccording to the guidelines established by the Integrated Approaches to Partici-patory Development for Participatory 3D Mapping group (IAPAD 2003). Thedifferent land-uses were then digitized as polygons and attributed values bothaccording to land-use type and ‘‘ownership’’.
Fig. 2 Participatory map of the TC of Ipetı-Embera developed in 2004. The land-use categorieswere: forest, tree plantation, tall fallow, short fallow, newly cleared land, agroforest, cropland,mechanized rice, plantain, and pasture
Mitig Adapt Strat Glob Change
123
As suggested by IAPAD (2003), a cross-verification of the participatory map wasachieved by georeferencing the boundaries of every distinct land-use within theparcelas of five owners using GPS. The GPS points for the five parcelas were thenimported into IDRISI and a vector file was created in which the GPS points for eachland-use in each parcela were connected to make polygons. The vector file was thenrasterized and the area within each polygon calculated. A Pearson’s correlationcoefficient of 0.862 was calculated between the areas estimated by the land ownerson the map and those measured by GPS in the field. The correlation rose to 0.88when the percent of land attributed to different uses was compared rather than theestimated area of land attributed to each use. Therefore, land owners were com-fortable assessing the surface that they allocated to each land use but they were moreprecise when expressing land-use as proportions of their total asset. Overall, the datashow that the participatory mapping can provide robust estimates of surface area perland-use type.
In addition to the mapping exercises, two participatory change matrices were builtin Ipetı in 2004 in order to obtain a greater understanding of the extent of, andfactors contributing to, changes in land-use and management. Historical matriceshave been recognized as a valuable methodological tool to address resource use as adynamic process (Schoonmaker-Freudenberger and Schoonmaker-Freudenberger1994). Community leaders were asked to select 8–10 participants including men andwomen, community elders with recollection of the land when Ipetı was founded, andpeople with a good perception of more recent changes. The first matrix exerciseaddressed changes in land-use types. The land-use categories were: forest, reforestedland and tree plantation, tall fallow (5 years or more without cultivation), short fallow(1 to 4 years without cultivation), newly cleared land, agroforest, cropland (bean,rice, corn, yucca and/or yam), mechanized rice (rice fields managed using mechanicalequipment), plantain (Musa sapientum) and pasture. This classification represents aconsensus achieved during a prior community discussion. After the categories ofland-use were explained, the participants were asked to define specific time periodsto which they all could relate. The group chose four periods of time: the 1970’s,1980’s, 1990’s, and present (2000 until the end of 2004).
For each time period, the participants were asked to distribute a total of 30pebbles within the corresponding cells of the matrix representing the approximatedistribution of land-use in the TC. After some discussion, participants placed acertain number of pebbles in each category based on their collective perception ofthe correct values. Because each pebble represented approximately 3.3% of the totalland area, the values provided best estimates of land-use proportions not exactfigures. In addition, participants were asked to explain the reasons for changesidentified in the matrix. The discussion was directed by PT to ensure the involvementof all participants.
Participants were also asked to give their perspective on two land-use scenarios20 years into the future, one with the realization of a C offset project (CDM) in thecommunity and one ‘‘business as usual’’ (BAU) scenario without a CDM project. Atthis point, after a series of workshops and discussion groups, the participants werealready familiar with ‘‘C’’ as an element, its relationship to vegetation, land-use, andclimate change. They were informed of the existing international agreement onclimate change and of emerging market mechanisms involving C sequestration. As acounterbalance to large-scale deforestation surrounding the TC, community mem-bers had discussed options for reforestation and agroforestry on their own parcelas,
Mitig Adapt Strat Glob Change
123
depending on livelihood needs and opportunities. Although no explicit financialgains had been calculated for potentially available options, the assumption of thecommunity was that any C bond transaction would offset the economic opportunitycosts of not pursuing a BAU scenario. Participants in the land-use matrix did takeinto account approximate economic and environmental health benefits, as collec-tively understood and anticipated, when constructing the two future scenarios, onewith a CDM project and the BAU.
A second related exercise used the same matrix method to address changes inland management. The same time periods were used so that comparisons could bemade between the two exercises. The land management categories included: use offertilizer and pesticide, pasture management, reforestation, timber harvesting, andfield burning. Changes in land management practices were quantified for most cat-egories according to the proportion of people engaged in the practice. A maximumof 10 pebbles per cell was used, 0 indicating that nobody in the community used acertain practice and 10 indicating that the entire population used the practice. Thisprocess differed only for the categories of cattle stocking and field burning. Forcattle, the average number of cattle per landowner was used. For burning, the unit ofmeasurement was frequency of burning, with 0 indicating that landowners neverburned their fields and 10 indicating that landowners burned their fields every year.Similarly to the land-use matrix, scenarios for the next 20 years were addressed andparticipants were asked to estimate future land management practices, with orwithout a community C project. Information pertaining to the modernization ofagricultural practices (e.g. pesticide vs organic vs. chemical fertilizer) was alsogathered during this exercise.
2.4 Calculation of C stocks
The participatory maps allowed us to estimate C stocks in 1998 (C98) and 2004 (C04).according to equation (1)
C ¼ RA�i Ci ð1Þ
where Ai is the total area (in ha) occupied by land-use i as obtained by either the1998 or the 2004 mapping exercise and Ci is the above-ground C content (in t C ha–1)estimated for land-use i (Table 2). The overall C content for pasture, forest, agro-forest, cropland, plantain, mechanized rice, short fallow, and tall fallow were esti-mated in 2004 (Kirby 2005; Tschakert et al. 2006) (Table 2). Estimates for teakplantation are from sites in central Panama (Kraenzel et al. 2003). Because of thedifficulties in assessing below-ground C content, estimates are based on aboveground values only. Although fewer land-use types were included in the 1998mapping exercise, discussions with community members suggest that the 1998‘secondary forest’ correspond roughly to the 2004 ‘tall fallow’ while the 1998 crop-land were represented as cropland (including plantain) and short fallow in 2004. Wehave no explicit information on agroforests, mechanized rice, or teak plantation for1998, although it is possible that the cropland category of 1998 included agroforest.
Two future scenarios were developed based on knowledge of the current Cstocks and on the participatory land-use change matrix. The first is the BAUscenario, while the second one reflects villagers’ perceptions of land-use changeunder a CDM project. The area of each land-use type in the future was estimated
Mitig Adapt Strat Glob Change
123
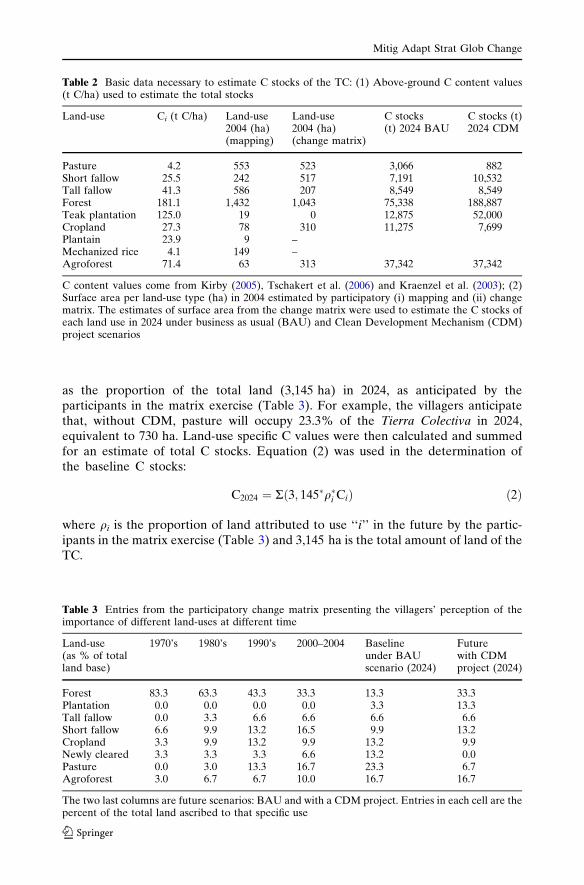
as the proportion of the total land (3,145 ha) in 2024, as anticipated by theparticipants in the matrix exercise (Table 3). For example, the villagers anticipatethat, without CDM, pasture will occupy 23.3% of the Tierra Colectiva in 2024,equivalent to 730 ha. Land-use specific C values were then calculated and summedfor an estimate of total C stocks. Equation (2) was used in the determination ofthe baseline C stocks:
C2024 ¼ Rð3; 145�q�i CiÞ ð2Þ
where qi is the proportion of land attributed to use ‘‘i’’ in the future by the partic-ipants in the matrix exercise (Table 3) and 3,145 ha is the total amount of land of theTC.
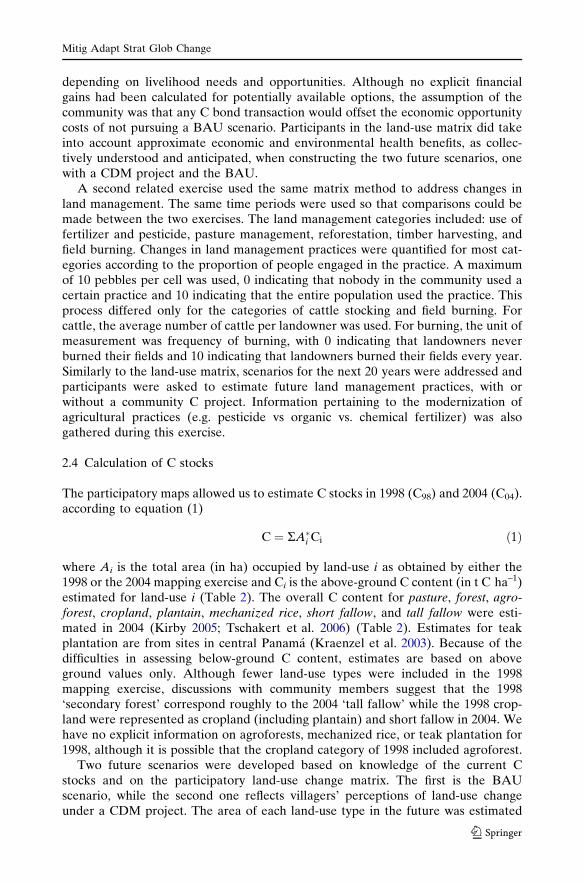
Table 2 Basic data necessary to estimate C stocks of the TC: (1) Above-ground C content values(t C/ha) used to estimate the total stocks
Land-use Ci (t C/ha) Land-use2004 (ha)(mapping)
Land-use2004 (ha)(change matrix)
C stocks(t) 2024 BAU
C stocks (t)2024 CDM
Pasture 4.2 553 523 3,066 882Short fallow 25.5 242 517 7,191 10,532Tall fallow 41.3 586 207 8,549 8,549Forest 181.1 1,432 1,043 75,338 188,887Teak plantation 125.0 19 0 12,875 52,000Cropland 27.3 78 310 11,275 7,699Plantain 23.9 9 –Mechanized rice 4.1 149 –Agroforest 71.4 63 313 37,342 37,342
C content values come from Kirby (2005), Tschakert et al. (2006) and Kraenzel et al. (2003); (2)Surface area per land-use type (ha) in 2004 estimated by participatory (i) mapping and (ii) changematrix. The estimates of surface area from the change matrix were used to estimate the C stocks ofeach land use in 2024 under business as usual (BAU) and Clean Development Mechanism (CDM)project scenarios
Table 3 Entries from the participatory change matrix presenting the villagers’ perception of theimportance of different land-uses at different time
Land-use(as % of totalland base)
1970’s 1980’s 1990’s 2000–2004 Baselineunder BAUscenario (2024)
Futurewith CDMproject (2024)
Forest 83.3 63.3 43.3 33.3 13.3 33.3Plantation 0.0 0.0 0.0 0.0 3.3 13.3Tall fallow 0.0 3.3 6.6 6.6 6.6 6.6Short fallow 6.6 9.9 13.2 16.5 9.9 13.2Cropland 3.3 9.9 13.2 9.9 13.2 9.9Newly cleared 3.3 3.3 3.3 6.6 13.2 0.0Pasture 0.0 3.0 13.3 16.7 23.3 6.7Agroforest 3.0 6.7 6.7 10.0 16.7 16.7
The two last columns are future scenarios: BAU and with a CDM project. Entries in each cell are thepercent of the total land ascribed to that specific use
Mitig Adapt Strat Glob Change
123
3 Results
3.1 Socio-economic variables affecting land-use
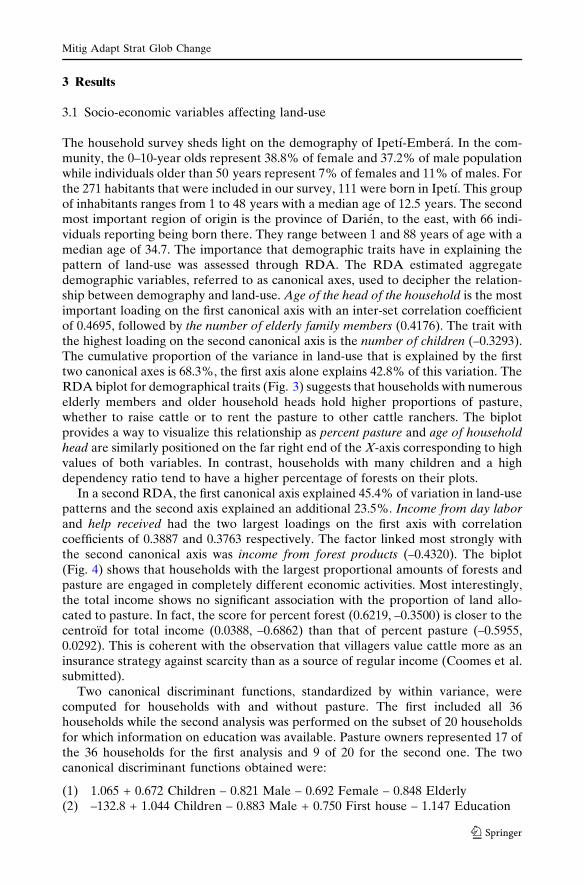
The household survey sheds light on the demography of Ipetı-Embera. In the com-munity, the 0–10-year olds represent 38.8% of female and 37.2% of male populationwhile individuals older than 50 years represent 7% of females and 11% of males. Forthe 271 habitants that were included in our survey, 111 were born in Ipetı. This groupof inhabitants ranges from 1 to 48 years with a median age of 12.5 years. The secondmost important region of origin is the province of Darien, to the east, with 66 indi-viduals reporting being born there. They range between 1 and 88 years of age with amedian age of 34.7. The importance that demographic traits have in explaining thepattern of land-use was assessed through RDA. The RDA estimated aggregatedemographic variables, referred to as canonical axes, used to decipher the relation-ship between demography and land-use. Age of the head of the household is the mostimportant loading on the first canonical axis with an inter-set correlation coefficientof 0.4695, followed by the number of elderly family members (0.4176). The trait withthe highest loading on the second canonical axis is the number of children (–0.3293).The cumulative proportion of the variance in land-use that is explained by the firsttwo canonical axes is 68.3%, the first axis alone explains 42.8% of this variation. TheRDA biplot for demographical traits (Fig. 3) suggests that households with numerouselderly members and older household heads hold higher proportions of pasture,whether to raise cattle or to rent the pasture to other cattle ranchers. The biplotprovides a way to visualize this relationship as percent pasture and age of householdhead are similarly positioned on the far right end of the X-axis corresponding to highvalues of both variables. In contrast, households with many children and a highdependency ratio tend to have a higher percentage of forests on their plots.
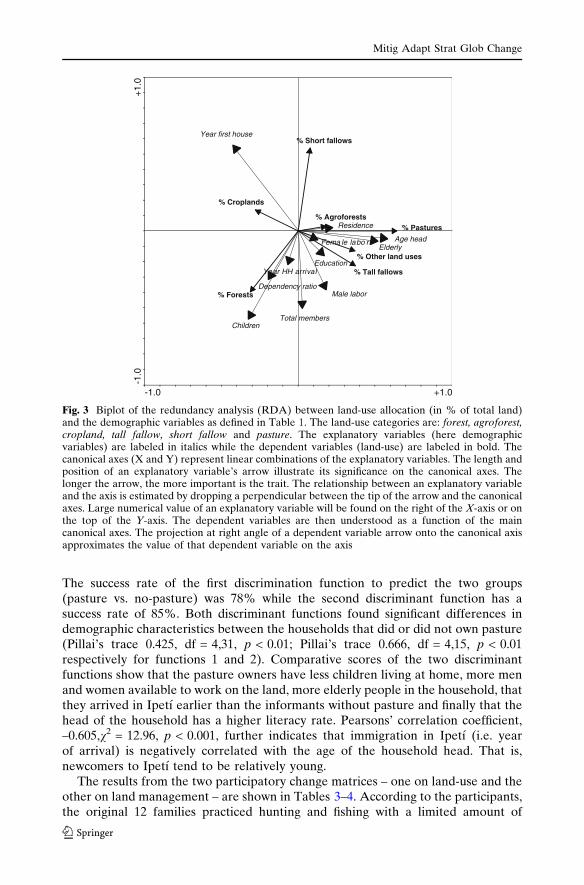
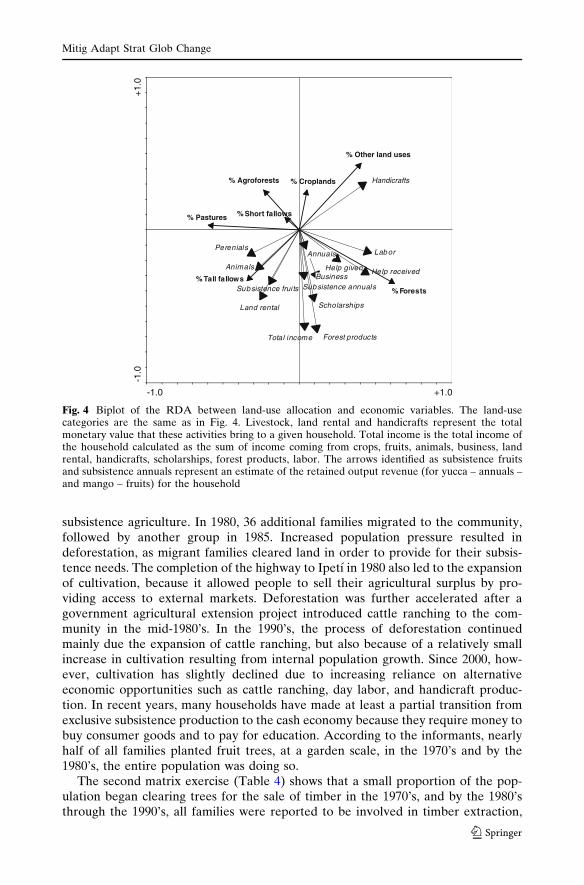
In a second RDA, the first canonical axis explained 45.4% of variation in land-usepatterns and the second axis explained an additional 23.5%. Income from day laborand help received had the two largest loadings on the first axis with correlationcoefficients of 0.3887 and 0.3763 respectively. The factor linked most strongly withthe second canonical axis was income from forest products (–0.4320). The biplot(Fig. 4) shows that households with the largest proportional amounts of forests andpasture are engaged in completely different economic activities. Most interestingly,the total income shows no significant association with the proportion of land allo-cated to pasture. In fact, the score for percent forest (0.6219, –0.3500) is closer to thecentroıd for total income (0.0388, –0.6862) than that of percent pasture (–0.5955,0.0292). This is coherent with the observation that villagers value cattle more as aninsurance strategy against scarcity than as a source of regular income (Coomes et al.submitted).
Two canonical discriminant functions, standardized by within variance, werecomputed for households with and without pasture. The first included all 36households while the second analysis was performed on the subset of 20 householdsfor which information on education was available. Pasture owners represented 17 ofthe 36 households for the first analysis and 9 of 20 for the second one. The twocanonical discriminant functions obtained were:
(1) 1.065 + 0.672 Children – 0.821 Male – 0.692 Female – 0.848 Elderly(2) –132.8 + 1.044 Children – 0.883 Male + 0.750 First house – 1.147 Education
Mitig Adapt Strat Glob Change
123
The success rate of the first discrimination function to predict the two groups(pasture vs. no-pasture) was 78% while the second discriminant function has asuccess rate of 85%. Both discriminant functions found significant differences indemographic characteristics between the households that did or did not own pasture(Pillai’s trace 0.425, df = 4,31, p < 0.01; Pillai’s trace 0.666, df = 4,15, p < 0.01respectively for functions 1 and 2). Comparative scores of the two discriminantfunctions show that the pasture owners have less children living at home, more menand women available to work on the land, more elderly people in the household, thatthey arrived in Ipetı earlier than the informants without pasture and finally that thehead of the household has a higher literacy rate. Pearsons’ correlation coefficient,–0.605,v2 = 12.96, p < 0.001, further indicates that immigration in Ipetı (i.e. yearof arrival) is negatively correlated with the age of the household head. That is,newcomers to Ipetı tend to be relatively young.
The results from the two participatory change matrices – one on land-use and theother on land management – are shown in Tables 3–4. According to the participants,the original 12 families practiced hunting and fishing with a limited amount of
Children
% Forests
Year HH arrival
Dependency ratio
Total members
Male labor
ElderlyAge head
Education
Fema le labo r
Residence
Year first house
% Other land uses
% Tall fallows
% Pastures % Agroforests
% Croplands
% Short fallows
-1.0 +1.0
-1.0
+1.
0
Fig. 3 Biplot of the redundancy analysis (RDA) between land-use allocation (in % of total land)and the demographic variables as defined in Table 1. The land-use categories are: forest, agroforest,cropland, tall fallow, short fallow and pasture. The explanatory variables (here demographicvariables) are labeled in italics while the dependent variables (land-use) are labeled in bold. Thecanonical axes (X and Y) represent linear combinations of the explanatory variables. The length andposition of an explanatory variable’s arrow illustrate its significance on the canonical axes. Thelonger the arrow, the more important is the trait. The relationship between an explanatory variableand the axis is estimated by dropping a perpendicular between the tip of the arrow and the canonicalaxes. Large numerical value of an explanatory variable will be found on the right of the X-axis or onthe top of the Y-axis. The dependent variables are then understood as a function of the maincanonical axes. The projection at right angle of a dependent variable arrow onto the canonical axisapproximates the value of that dependent variable on the axis
Mitig Adapt Strat Glob Change
123
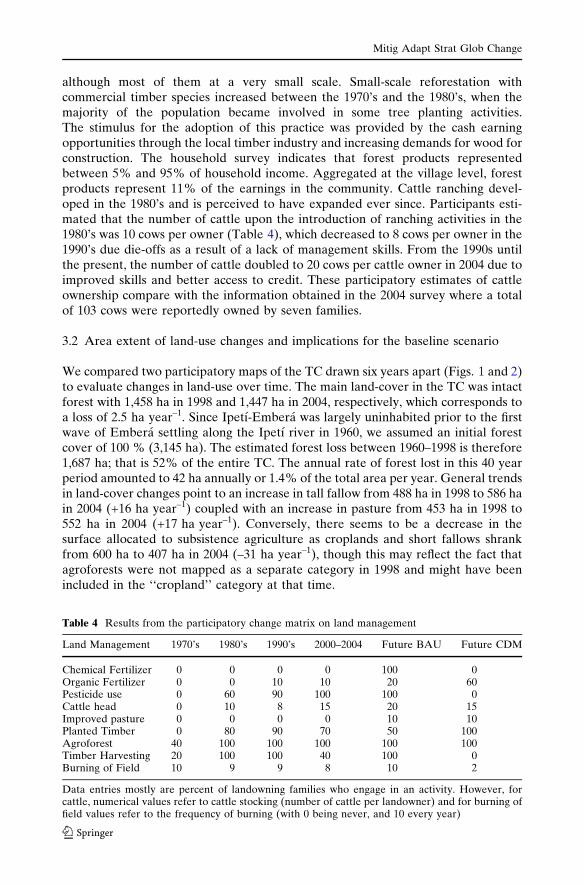
subsistence agriculture. In 1980, 36 additional families migrated to the community,followed by another group in 1985. Increased population pressure resulted indeforestation, as migrant families cleared land in order to provide for their subsis-tence needs. The completion of the highway to Ipetı in 1980 also led to the expansionof cultivation, because it allowed people to sell their agricultural surplus by pro-viding access to external markets. Deforestation was further accelerated after agovernment agricultural extension project introduced cattle ranching to the com-munity in the mid-1980’s. In the 1990’s, the process of deforestation continuedmainly due the expansion of cattle ranching, but also because of a relatively smallincrease in cultivation resulting from internal population growth. Since 2000, how-ever, cultivation has slightly declined due to increasing reliance on alternativeeconomic opportunities such as cattle ranching, day labor, and handicraft produc-tion. In recent years, many households have made at least a partial transition fromexclusive subsistence production to the cash economy because they require money tobuy consumer goods and to pay for education. According to the informants, nearlyhalf of all families planted fruit trees, at a garden scale, in the 1970’s and by the1980’s, the entire population was doing so.
The second matrix exercise (Table 4) shows that a small proportion of the pop-ulation began clearing trees for the sale of timber in the 1970’s, and by the 1980’sthrough the 1990’s, all families were reported to be involved in timber extraction,
Help receivedHelp given
Subsistence annuals
Scholarships
Forest productsTotal income
Land rental
Subsistence fruits
Animals
Perenials
Handicrafts
% Forests
% Tall fallows
% Short fallows% Pastures
% Agroforests % Croplands
% Other land uses
-1.0 +1.0
-1.0
+1.
0
Labor
Business
Annuals
Fig. 4 Biplot of the RDA between land-use allocation and economic variables. The land-usecategories are the same as in Fig. 4. Livestock, land rental and handicrafts represent the totalmonetary value that these activities bring to a given household. Total income is the total income ofthe household calculated as the sum of income coming from crops, fruits, animals, business, landrental, handicrafts, scholarships, forest products, labor. The arrows identified as subsistence fruitsand subsistence annuals represent an estimate of the retained output revenue (for yucca – annuals –and mango – fruits) for the household
Mitig Adapt Strat Glob Change
123
although most of them at a very small scale. Small-scale reforestation withcommercial timber species increased between the 1970’s and the 1980’s, when themajority of the population became involved in some tree planting activities.The stimulus for the adoption of this practice was provided by the cash earningopportunities through the local timber industry and increasing demands for wood forconstruction. The household survey indicates that forest products representedbetween 5% and 95% of household income. Aggregated at the village level, forestproducts represent 11% of the earnings in the community. Cattle ranching devel-oped in the 1980’s and is perceived to have expanded ever since. Participants esti-mated that the number of cattle upon the introduction of ranching activities in the1980’s was 10 cows per owner (Table 4), which decreased to 8 cows per owner in the1990’s due die-offs as a result of a lack of management skills. From the 1990s untilthe present, the number of cattle doubled to 20 cows per cattle owner in 2004 due toimproved skills and better access to credit. These participatory estimates of cattleownership compare with the information obtained in the 2004 survey where a totalof 103 cows were reportedly owned by seven families.
3.2 Area extent of land-use changes and implications for the baseline scenario
We compared two participatory maps of the TC drawn six years apart (Figs. 1 and 2)to evaluate changes in land-use over time. The main land-cover in the TC was intactforest with 1,458 ha in 1998 and 1,447 ha in 2004, respectively, which corresponds toa loss of 2.5 ha year–1. Since Ipetı-Embera was largely uninhabited prior to the firstwave of Embera settling along the Ipetı river in 1960, we assumed an initial forestcover of 100 % (3,145 ha). The estimated forest loss between 1960–1998 is therefore1,687 ha; that is 52% of the entire TC. The annual rate of forest lost in this 40 yearperiod amounted to 42 ha annually or 1.4% of the total area per year. General trendsin land-cover changes point to an increase in tall fallow from 488 ha in 1998 to 586 hain 2004 (+16 ha year–1) coupled with an increase in pasture from 453 ha in 1998 to552 ha in 2004 (+17 ha year–1). Conversely, there seems to be a decrease in thesurface allocated to subsistence agriculture as croplands and short fallows shrankfrom 600 ha to 407 ha in 2004 (–31 ha year–1), though this may reflect the fact thatagroforests were not mapped as a separate category in 1998 and might have beenincluded in the ‘‘cropland’’ category at that time.
Table 4 Results from the participatory change matrix on land management
Land Management 1970’s 1980’s 1990’s 2000–2004 Future BAU Future CDM
Chemical Fertilizer 0 0 0 0 100 0Organic Fertilizer 0 0 10 10 20 60Pesticide use 0 60 90 100 100 0Cattle head 0 10 8 15 20 15Improved pasture 0 0 0 0 10 10Planted Timber 0 80 90 70 50 100Agroforest 40 100 100 100 100 100Timber Harvesting 20 100 100 40 100 0Burning of Field 10 9 9 8 10 2
Data entries mostly are percent of landowning families who engage in an activity. However, forcattle, numerical values refer to cattle stocking (number of cattle per landowner) and for burning offield values refer to the frequency of burning (with 0 being never, and 10 every year)
Mitig Adapt Strat Glob Change
123
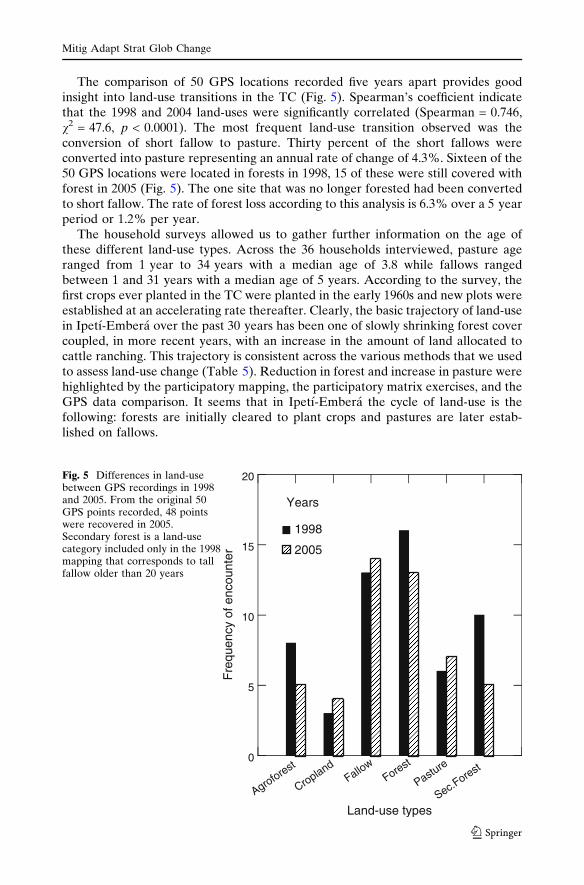
The comparison of 50 GPS locations recorded five years apart provides goodinsight into land-use transitions in the TC (Fig. 5). Spearman’s coefficient indicatethat the 1998 and 2004 land-uses were significantly correlated (Spearman = 0.746,v2 = 47.6, p < 0.0001). The most frequent land-use transition observed was theconversion of short fallow to pasture. Thirty percent of the short fallows wereconverted into pasture representing an annual rate of change of 4.3%. Sixteen of the50 GPS locations were located in forests in 1998, 15 of these were still covered withforest in 2005 (Fig. 5). The one site that was no longer forested had been convertedto short fallow. The rate of forest loss according to this analysis is 6.3% over a 5 yearperiod or 1.2% per year.
The household surveys allowed us to gather further information on the age ofthese different land-use types. Across the 36 households interviewed, pasture ageranged from 1 year to 34 years with a median age of 3.8 while fallows rangedbetween 1 and 31 years with a median age of 5 years. According to the survey, thefirst crops ever planted in the TC were planted in the early 1960s and new plots wereestablished at an accelerating rate thereafter. Clearly, the basic trajectory of land-usein Ipetı-Embera over the past 30 years has been one of slowly shrinking forest covercoupled, in more recent years, with an increase in the amount of land allocated tocattle ranching. This trajectory is consistent across the various methods that we usedto assess land-use change (Table 5). Reduction in forest and increase in pasture werehighlighted by the participatory mapping, the participatory matrix exercises, and theGPS data comparison. It seems that in Ipetı-Embera the cycle of land-use is thefollowing: forests are initially cleared to plant crops and pastures are later estab-lished on fallows.
Agroforest
CroplandFallow
Forest
Pasture
Sec.Forest
Land-use types
0
5
10
15
20
Fre
quen
cy o
f enc
ount
er 2005
1998
Years
Fig. 5 Differences in land-usebetween GPS recordings in 1998and 2005. From the original 50GPS points recorded, 48 pointswere recovered in 2005.Secondary forest is a land-usecategory included only in the 1998mapping that corresponds to tallfallow older than 20 years
Mitig Adapt Strat Glob Change
123
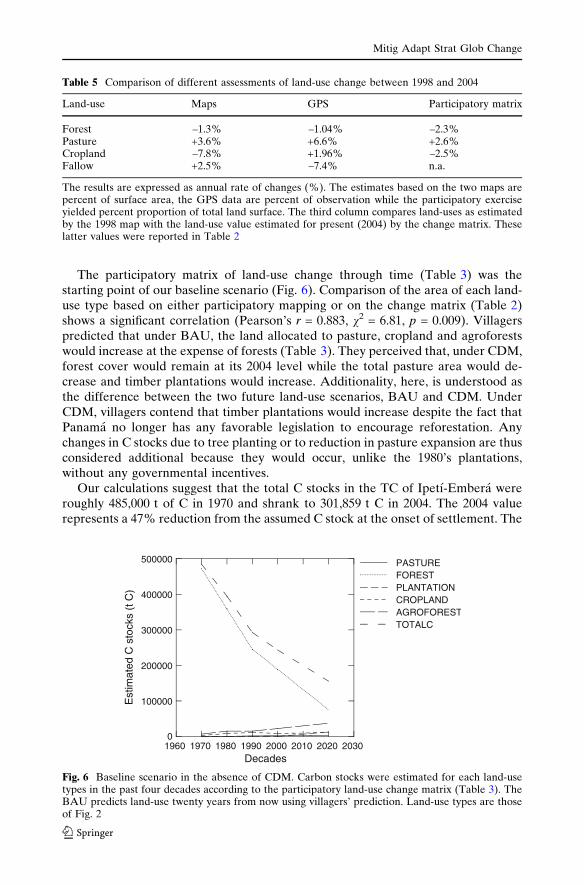
The participatory matrix of land-use change through time (Table 3) was thestarting point of our baseline scenario (Fig. 6). Comparison of the area of each land-use type based on either participatory mapping or on the change matrix (Table 2)shows a significant correlation (Pearson’s r = 0.883, v2 = 6.81, p = 0.009). Villagerspredicted that under BAU, the land allocated to pasture, cropland and agroforestswould increase at the expense of forests (Table 3). They perceived that, under CDM,forest cover would remain at its 2004 level while the total pasture area would de-crease and timber plantations would increase. Additionality, here, is understood asthe difference between the two future land-use scenarios, BAU and CDM. UnderCDM, villagers contend that timber plantations would increase despite the fact thatPanama no longer has any favorable legislation to encourage reforestation. Anychanges in C stocks due to tree planting or to reduction in pasture expansion are thusconsidered additional because they would occur, unlike the 1980’s plantations,without any governmental incentives.
Our calculations suggest that the total C stocks in the TC of Ipetı-Embera wereroughly 485,000 t of C in 1970 and shrank to 301,859 t C in 2004. The 2004 valuerepresents a 47% reduction from the assumed C stock at the onset of settlement. The
Table 5 Comparison of different assessments of land-use change between 1998 and 2004
Land-use Maps GPS Participatory matrix
Forest –1.3% –1.04% –2.3%Pasture +3.6% +6.6% +2.6%Cropland –7.8% +1.96% –2.5%Fallow +2.5% –7.4% n.a.
The results are expressed as annual rate of changes (%). The estimates based on the two maps arepercent of surface area, the GPS data are percent of observation while the participatory exerciseyielded percent proportion of total land surface. The third column compares land-uses as estimatedby the 1998 map with the land-use value estimated for present (2004) by the change matrix. Theselatter values were reported in Table 2
1960 1970 1980 1990 2000 2010 2020 2030Decades
0
100000
200000
300000
400000
500000
Est
imat
ed C
sto
cks
(t C
)
TOTALCAGROFORESTCROPLANDPLANTATIONFORESTPASTURE
Fig. 6 Baseline scenario in the absence of CDM. Carbon stocks were estimated for each land-usetypes in the past four decades according to the participatory land-use change matrix (Table 3). TheBAU predicts land-use twenty years from now using villagers’ prediction. Land-use types are thoseof Fig. 2
Mitig Adapt Strat Glob Change
123
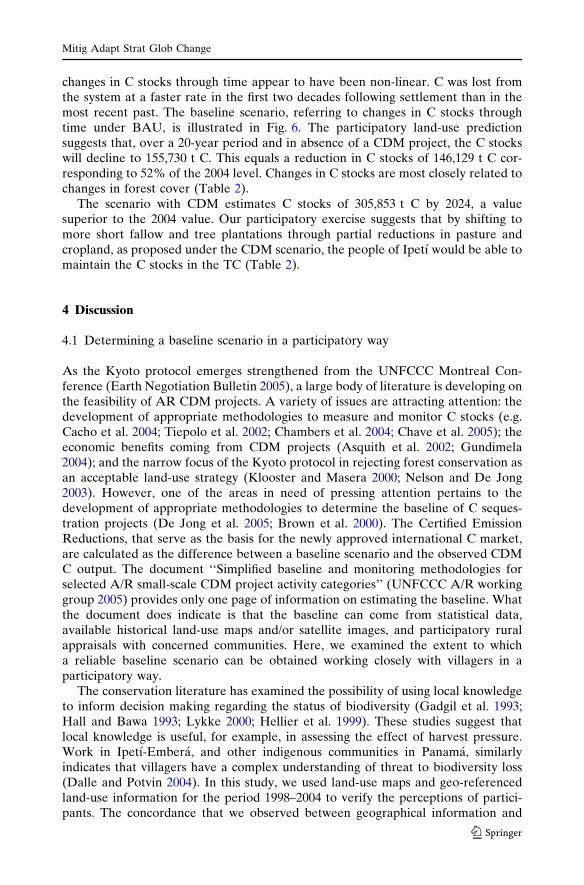
changes in C stocks through time appear to have been non-linear. C was lost fromthe system at a faster rate in the first two decades following settlement than in themost recent past. The baseline scenario, referring to changes in C stocks throughtime under BAU, is illustrated in Fig. 6. The participatory land-use predictionsuggests that, over a 20-year period and in absence of a CDM project, the C stockswill decline to 155,730 t C. This equals a reduction in C stocks of 146,129 t C cor-responding to 52% of the 2004 level. Changes in C stocks are most closely related tochanges in forest cover (Table 2).
The scenario with CDM estimates C stocks of 305,853 t C by 2024, a valuesuperior to the 2004 value. Our participatory exercise suggests that by shifting tomore short fallow and tree plantations through partial reductions in pasture andcropland, as proposed under the CDM scenario, the people of Ipetı would be able tomaintain the C stocks in the TC (Table 2).
4 Discussion
4.1 Determining a baseline scenario in a participatory way
As the Kyoto protocol emerges strengthened from the UNFCCC Montreal Con-ference (Earth Negotiation Bulletin 2005), a large body of literature is developing onthe feasibility of AR CDM projects. A variety of issues are attracting attention: thedevelopment of appropriate methodologies to measure and monitor C stocks (e.g.Cacho et al. 2004; Tiepolo et al. 2002; Chambers et al. 2004; Chave et al. 2005); theeconomic benefits coming from CDM projects (Asquith et al. 2002; Gundimela2004); and the narrow focus of the Kyoto protocol in rejecting forest conservation asan acceptable land-use strategy (Klooster and Masera 2000; Nelson and De Jong2003). However, one of the areas in need of pressing attention pertains to thedevelopment of appropriate methodologies to determine the baseline of C seques-tration projects (De Jong et al. 2005; Brown et al. 2000). The Certified EmissionReductions, that serve as the basis for the newly approved international C market,are calculated as the difference between a baseline scenario and the observed CDMC output. The document ‘‘Simplified baseline and monitoring methodologies forselected A/R small-scale CDM project activity categories’’ (UNFCCC A/R workinggroup 2005) provides only one page of information on estimating the baseline. Whatthe document does indicate is that the baseline can come from statistical data,available historical land-use maps and/or satellite images, and participatory ruralappraisals with concerned communities. Here, we examined the extent to whicha reliable baseline scenario can be obtained working closely with villagers in aparticipatory way.
The conservation literature has examined the possibility of using local knowledgeto inform decision making regarding the status of biodiversity (Gadgil et al. 1993;Hall and Bawa 1993; Lykke 2000; Hellier et al. 1999). These studies suggest thatlocal knowledge is useful, for example, in assessing the effect of harvest pressure.Work in Ipetı-Embera, and other indigenous communities in Panama, similarlyindicates that villagers have a complex understanding of threat to biodiversity loss(Dalle and Potvin 2004). In this study, we used land-use maps and geo-referencedland-use information for the period 1998–2004 to verify the perceptions of partici-pants. The concordance that we observed between geographical information and
Mitig Adapt Strat Glob Change
123
individual and collective perceptions of land-use change substantiates the fact thatlocal knowledge has a role to play in the establishment of base-line data in thecontext of the CDM, as put forward by Asquith et al. (2002).
Our participatory methodology allowed us to quantify and propose a baselinescenario recognizing some of the key drivers of land-use change as perceived andobserved by community members. We suggest that an important benefit of partici-patory methods for establishing a base line scenario lies in the transparency of theapproach and the ease with which local actors can agree upon, identify with, andeventually monitor desirable future land-use options while taking into account dif-ferential livelihood needs and opportunities. Both the baseline and the CDM sce-narios were developed after numerous workshops, meetings, interviews, andparticipatory exercises all of which provided ample room for discussion, debates, andrecognition of heterogeneity within a seemingly homogeneous community. The twoscenarios are the people’s best projections given current economic constraints, landavailability, and anticipated future demographic and environmental dynamics. Ourstudy therefore contributes to a growing body of evidence that remote sensing andGIS information can be informed by participatory activities. For example, quanti-fying land-use transitions can be challenging (e.g. Fearnside 1996) and participatorymethods could increase the precision of estimates.
4.2 Baseline scenarios, household life cycle, and land-use changes
Early studies on baseline scenarios have mainly focused on historical changes inland-use (Brown et al. 2000; Dale et al. 2003) without incorporating in depth anal-ysis of the factors influencing land-use dynamics (De Jong et al. 2005). The Castilloet al. (2006) analysis of the causal factors of land-use change served as a basis for anew baseline methodology, referred to as ‘‘Climafor’’, proposed by De Jong et al.(2005). This methodology provides an important step forward by linking predictionsof land-use change to prevailing socio-economic conditions. However, as the authorspointed out, the reliability of the prediction depends on the stability of the pressurefactors on land-use. In Ipetı, land-use change has not occurred in a linear way overthe last decades, which emphasizes the importance of socio-economic factors asdrivers of change.
Most efforts to develop baseline scenarios for forest projects under the CDMhave concentrated at the regional (Brown et al. 2000; Dale et al. 2003; Grau et al.2004; De Jong et al. 2005) or national level (Pfaff et al. 2000). Because of thecollective land tenure structure and management of the Embera settlements, werestricted our analysis to land-use dynamics inside the TC. As pointed out byLambin et al. (2003) land-use change is a spatial aggregate of many small local-scalechanges. Our approach allowed us to explicitly account for household level decisionsas a key element in developing land-use scenarios. It is recognized that householdformation has a more profound effect on land-use/land-cover change than popula-tion growth per se (Lutz 1994; Perz 2001; Liu et al. 2003). For example, O’Neill et al.(2001) report that the changes in the number of households is a better predictorof greenhouse gas emissions than overall population growth. Field et al. (2003)proposed that demographic data could readily be integrated within the framework ofa biophysical landscape allowing a better understanding of changes at the landscapelevel.
Mitig Adapt Strat Glob Change
123
Our MA allows identifying which households are likely to engage in cattleranching and in turn better predicting land-use change through time. Indeed, whileonly a small segment of the population is currently engaged in cattle ranching, thisactivity is developing in importance through time; in 2004, pasture occupied 18% ofthe total area of the TC. The discriminant and RDA analyses that we performedsuggest that households are more likely to engage in cattle ranching when childrenare less numerous i.e. when the household is ‘‘older’’ (sensu Walker et al. 2002).Households with pasture are usually those that find themselves at a fairly advancedstage in their household cycle – meaning they can afford losing cropland to pasture,they can afford investing in pasture, and they have the means (social networks) topurchase cattle on credit. Our socio-economic analysis suggests that household lifecycle analysis (Walker and Homma 1996; McCracken et al. 1999) might provide anappropriate framework to understand changes in land-uses and inform baselinescenarios.
Residence time in Ipetı was also important in explaining the decision to engage incattle ranching as was reported elsewhere (Perz 2001). Adoption of cattle ranching,however, seems to be slower in Ipetı-Embera than among small farm households inthe Brazilian Amazon. In the Amazon, small scale farmers began to invest heavily incattle ranching five years after arrival (McCracken et al. 1999), while in Ipetı, the ofthe average time of residence for households that did not own cattle was nine years.We believe that these differences can be explained by the fact that pasture is not atypical land-use for the Emberas who have traditionally relied on hunting andgathering and then on subsistence agriculture (Dalle and Potvin 2004). Therefore,adoption of cattle ranching does not only represent a shift in land-use, it is also acompletely new economic activity and, hence, involves a shift in landowners’srelationship with the environment. Furthermore, it has been suggested that theformation of Embera villages in the 1970s brought about an increased need forinsertion in the economic system, hence the rather gradual adoption of new land-usestrategies (Pastor Nunez 1998).
The cycle of land-use under slash-and-burn agriculture has been well studied inother parts of Latin America (Scatena et al. 1996; Fujisaka et al. 1998; Coomes et al.2000). Typically, forests are slashed to grow crops for a few years. Farmers thendecide either to leave the land fallow or to convert the crop field into pasture. In theTC where the population is young and growing and cannot easily move elsewhere weexpect to see the establishment of several new young households in the near future.Our results suggest that these households will clear forests to cultivate crops andsubsequently will clear fallows to establish pasture. Therefore, our baseline scenariosuggesting a 50% reduction in total C stocks within the next 20–25 years is bothalarming and highly plausible.
Acknowledgements From the community of Ipetı-Embera, we would like to thank the Organi-zacion para la unidad y el desarollo de Ipetı-Embera, the dirigencia, Ultiminio Cabrera, OmairaCasama, Bonarge Pacheco, Pablo Guainora, Flugencio Pacheco, Jeremia Cansari, as well as all of theother community members who participated in this study and graciously hosted us in the community.We would also like to extend our thanks to the Smithsonian Tropical Research Institute for logisticalsupport, and El Programa de Desarrollo del Darien for the aerial photos. Funds for this researchwere provided by Fondo Canada-Panama through the Canadian Embassy in Panama and by aNSERC discovery grant to CP.
Mitig Adapt Strat Glob Change
123
References
A/R UNFCCC working group. Simplified baseline and monitoring methodologies for selectedafforestation and reforestation clean development mechanism project activity categories. AnnexII of the 6th meeting report. Oct. 14th 2005
Abel T, Stepp JR (2003) A new ecosystems ecology for anthropology. Conserv Ecol 7(3):Article 12Asquith NM, Vargas Rios MT, Smith J (2002) Can forest-protection carbon projects improve rural
livelihoods? Analysis of the Noel Kempf Mercado climate action project, Bolivia. Mitigation andAdaptation Strategies for Global Change 7:323–337
Brown S, Burnham M, Delaney M, Powell M, Vaca R, Moreno A (2000) Issues and challenges forforest-based carbon-offset projects: a case study of the Noel Kempff climate action project inBolivia. Mitigation and Adaptation Strategies for Global Change 5:99–121
Brown K, Corbera E (2003) Exploring equity and sustainable development in the new carboneconomy. Climate Policy 3S1:41–56
Brown K, Adger WN, Boyd E, Corbera-Elizalde E, Shackley S (2004) How do CDM projectscontribute to sustainable development? Technical Report 16, Tyndall Centre for Climate ChangeResearch
Cacho OJ, Wise RM, Macdicken KG (2004) Carbon monitoring costs and their effect on incentivesto sequester carbon through forestry. Mitigation and Adaptation Strategies for Global Change154:273–293
Castillo MA, Hellier A, Tipper R, De Jong, B (2006) Carbon emissions from land-use change: aregional analysis of causal factors in Chiapas, Mexico. Mitigation and Adaptation Strategies forGlobal Change (in press)
Chambers JQ, Higuchi N, Texeira LM, dos Santos J, Laurance SG, Trumbore SE (2004) Response oftree biomass and wood litter to disturbance in Central Amazon forest. Oecologia 141(40):596–611
Chave J, Andalo C, Brown S, Cairns MA, Chambers JQ, Eamus D, Folster H, Fromard S, HiguchiN, Kira T, Lescure J-P, Nelson BW, Ogawa H, Puig H, Rience B, Yamakura T (2005) Treeallometry and improved estimation of carbon stocks and balance in tropical forests. Oecologia145:87–99
Coomes OT, Grimard F, Potvin C, Sima P (Submitted) The fate of tropical forests: cattle or carbon?Coomes OT, Grimard F, Burt GJ (2000) Tropical forests and shifting cultivation: secondary forest
fallow dynamics among traditional farmers of the Peruvian Amazon. Ecol Econ 32:109–124Dale VH, Brown S, Calderon MO, Montoya A, Martinez RE (2003) Estimating baseline carbon
emissions for the eastern Panama Canal watershed. Mitigation and Adaptation Strategies forGlobal Change 8:323–248
Dalle SP, Potvin C (2004) Conservation of useful plants: an evaluation of local priorities from twoindigenous communities in eastern Panama. Econ Bot 58(1):38–57
De Jong B, Hellier A, Castilo-Santiago MA, Tipper R (2005) Application of the ‘‘climafor’’approach to estimate baseline carbon emissions of a forest conservation project in the selvalacandona, Chiapas, Mexico. Mitigation and Adaptation Strategies for Global Change10:265–278
Earth Negotiation Bulletin (2005) 12(291):1–20, (www.iisd.ca/download/pdf/enb12291e.pdf)Fearnside P (1996) Amazonian deforestation and global warming: carbon stocks in vegetation
replacing Brazil’s Amazon forest. For Ecol Manage 80:21–34Field DR, Voss PR, Kuczenski TK, Hammer RB, Radelopp VC (2003) Reaffirming social landscape
analysis in landscape ecology: a conceptual framework. Soc Natu Resour 16: 349–361Fischer A, Vasseur L (2000) The crisis in shifting cultivation practices and the promise of agrofor-
estry: a review of the Panamanian experience. Biodivers Conserv 9:739–756Fujisaka S, Castilla C, Escobar G, Rodrigues V, Veneklaas EJ, Thomas R, Fisher M (1998) The
effects of forest conservation on annual crops and pastures: estimates of carbon emissions andplant species loss in a Brazilian Amazon colony. Agric Ecosyst Environ 69:17–26
Gadgil M, Berkes F, Folke C (1993) Indigenous knowledge for biodiversity conservation. Ambio22(2–3):151–156
Grau HR, Mitchell Aide T, Zimmerman JK, Thomlinson JR (2004), Trends and scenarios of thecarbon budget in postagricultural Puerto Rico (1936–2060). Glob Change Biol 10:1163–1179
Gundimela H (2004) How sustainable is the sustainable development objective of CDM in devel-oping country like India?. Forest Policy Econ 6:329–343
Hall P, Bawa K (1993) Methods to assess the impact of extraction of non-timber tropical forestproducts on plant populations. Econ Bot 47(3):234–247
Mitig Adapt Strat Glob Change
123
Hellier A, Nelson AC, Ochoa Gaona SO (1999) Use of indigenous knowledge for rapidly assessingthe trends in biodiversity: A case study from Chiapas, Mexico. Biodivers Conserv 8:869–889
Herrera F (2000) Las lecciones de Bayano. La otra cuenca del Canal? Oportunidad o amenaza?Panama Hoy 8:48–55
IAPAD (2003) Participatory 3-Dimensional Modeling (P3DM), On-line: http://www.iapad.org/par-ticipatory_p3dm.htm
Kirby KR, Potvin C (In press) Species-level management in carbon sink projects: a case study froman Embera territory in Eastern Panama. For Ecol Manage
Kirby K (2005) Land-use change in the Neotropics: regional-scale predictors of deforestation andlocal effects on carbon storage and tree-species diversity. Masters of Science Thesis. Departmentof Biology, Neotropical Environments Option, McGill University, Montreal, 117 pp
Klooster D, Masera O (2000) Community forest management in Mexico: carbon mitigation andbiodiversity conservation through rural development. Global Environ Change 10:259–272
Kraenzel MB, Moore T, Castillo A, Potvin C (2003) Carbon storage of harvest-age teak (Tectonagrandis) plantations, Panama. For Ecol Manage 173:213–225
Lambin EF, Geist HJ, Lepers E (2003) Dynamics of land-use and land-cover change in tropicalregions. Annual Rev Environ Resources 28:205–241
Legendre P, Legendre L (1998) Numerical ecology, 2nd edn. Elsevier, Amsterdam Lausanne NYOxford Shannon Singapore Tokyo, pp 853
Liu J, Daily GC, Ehrlich PR, Luck GW (2003) Effects of household dynamics on resourceconsumption and biodiversity. Nature 412:530–533
Lutz W (1994) Population, development, environment: understanding their interactions in Mauritius.Springer-Verlag, New-York
Lykke AM (2000) Local perceptions of vegetation change and priorities for conservation of woody-savanna vegetation in Senegal. J Exp Manage 59:107–120
McCracken SD, Brondizio SD, Nelson D (1999) Remote sensing and GIS at the faro property level:demography and deforestation in the Brazilian Amazon. Photogrammetric Eng Remote Sensing65(100):1311–1320
McKay A (1984) Colonizacon de tierras nuevas en Panama (1975) In: S Heckadon-Moreno,A McKay (eds) Colonizacion y destruccion de bosques en Panama, Asociacion Panamenade Antropologia, pp 45–62
Nelson GC, Harris V, Stone SW (2001) Deforestation, land-use, and property rights: empiricalevidence from Darien, Panama. Land Econ 77(2):187–205
Nelson KC, De Jong B (2003) Making global initiatives local realities: carbon mitigation projects inChiapas, Mexico. Global Environ Chang 13:19–30
O’Neil B, MacKellar FL, Lutz W (2001) Population and climate change. Cambridge UniversityPress, New York
Pastor Nunez A (1998) El processo de colonizacion del Darien y su impacto en el ambiente. Revistacultural Loteria 420:49–60
Pereira PM, da Fonseca MP (2003) Nature vs nurture: the making of the Montado ecosystem.Conserv Ecol 7(3):Article 7
Perz SG (2001) Household demographic factors as life cycle determinants of land-use in theAmazon. Popul Res Policy Rev 20:159–186
Pfaff ASP, Kerr S, Hughes RF, Liu S, Sanchez-Azofeifa GA, Schimel D, Tosi J, Watson V (2000)The Kyoto protocol and payments for the tropical forest: An interdisciplinary method forestimating carbon-offset supply and increasing the feasibility of a carbon market under theCDM. Ecol Econ 35:203–221
Place F, Dewees P (1999) Policies and incentives for the adoption of improved fallows. AgroforestSyst 47:323–343
Potvin C, Owen C, Melzi S, Beaucage P (2005) Ecological and socioeconomic analyses of four coffeeproducing villages of Mexico. Ecol Soc 10(1):18, [online]
Scatena FN, Walker RT, Homma AKO, de Conto AJ, Ferreira CAP, de Amorim Carvhalo R, daRocha ACPN, dos Santos AIM, de Oliveira PM (1996) Cropping and fallowing sequences ofsmall farms in the terra firme landscape of Brazilian Amazon: a case study from Santarem, Para.Ecol Econ 18:29–40
Schoonmaker-Freudenberger K, Schoonmaker-Freudenberger M (1994) Livelihoods, livestock andchange: The versatility and richness of historical matrices. RRA Notes 20:144–148
Smith J, Scherr SJ (2003), Capturing the value of forest carbon for local Livelihoods. World Dev31(12):2143–2160
Mitig Adapt Strat Glob Change
123

ter Braak CJ, Verdonschot PFM (1995) Canonical correspondence analysis and related multivariatemethods in aquatic ecology. Aquat Sci 57(3):153–187
ter Braak CJ, Smilauer P (1998) CANOCO Reference Manual and User’s Guide to CANOCO forwindows. Microcomputer Power, Ithaca NY USA, pp 352
Tiepolo G, Calmon M, Feretti AR (2002) Measuring and Monitoring Carbon stocks at the Guar-aquecaba climate action project, Parana, Brazil. Taiwan Forestry Res Inst Ext Series 153:98–115
Tschakert P, Coomes OT, Potvin C (2006) Shifting cultivation, carbon stocks and indigenous live-lihood options in Eastern Panama. Ecol Econ (in press)
Walker R, Homma AKO (1996) Land-use and cover dynamics in the Brazilian Amazon, an over-view. Ecol Econ 18(1):67–80
Walker R, Perz S, Caldas M, Texeira Silva LG (2002) Land-use and land cover changes in forestfrontiers: The role of household life cycles. Int Regional Sci Rev 25(2):169–199
Mitig Adapt Strat Glob Change
123