A novel synthetic method for oxygen-17 labelling of metal ...
111
A novel synthetic method for oxygen-17 labelling of metal-dioxygen complexes by James Robert Tsang Palmer A thesis submitted to the Department of Chemistry in conformity with the requirements for the degree of Master of Science Queen’s University Kingston, Ontario, Canada February 2022 Copyright © James Robert Tsang Palmer, 2022
-
Upload
khangminh22 -
Category
Documents
-
view
0 -
download
0
Transcript of A novel synthetic method for oxygen-17 labelling of metal ...
A novel synthetic method for oxygen-17 labelling of metal-dioxygen complexes
by
James Robert Tsang Palmer
A thesis submitted to the Department of Chemistry in conformity with the requirements for the
degree of Master of Science
Queen’s University
Kingston, Ontario, Canada
February 2022
Copyright © James Robert Tsang Palmer, 2022

i
Abstract
This thesis investigates the synthesis of 17O-labelled metal-dioxygen complexes by
utilizing 17O2 gas produced from H217O electrolysis as a source of 17O isotopes. Because of the
high cost of H217O, a miniature water electrolysis device was built to collect 17O2 gas at a rate of
6.1 x 10⁻⁴ mol O2/hr (~15 mL/hr) over water. Two 17O-labelled dinuclear cobalt(III)-dioxygen
complexes, [(en)2Co(μ-17O2)(μ-OH)Co(en)2]3+ where en is ethylenediamine (1b) and
[(NH3)5Co(μ-17O2)Co(NH3)5]4+ (2b) were successfully synthesized for the first time. Their 17O
Nuclear Magnetic Resonance (NMR) signals were found to appear at 242 and 208 ppm for 1b
and 2b, respectively. These 17O chemical shifts represent the most shielded values to date for
metal-dioxygen complexes. We also discovered that the μ-hydroxo ligand in [(en)2Co(O2)(μ-
OH)Co(en)2]3+ can be readily 17O-labelled by exchange with H217O, thus producing
[(en)2Co(O2)(μ-17OH)Co(en)2]3+ (1c). We found that the 17O and 1H NMR signals for the μ-
hydroxo ligand in 1c are highly shielded ((17O) = -239 ppm and (1H) = -2.43 ppm).
Furthermore, we report new 17O NMR data for a 17O-labelled mononuclear metal-dioxygen
complex, Pd(PPh3)2(2-17O2) (4b), δiso(17O) = 561 ppm. Lastly, a preliminary investigation of the
crystallization and stability of oxymyoglobin (oxyMb) was conducted. Optimal crystallization of
oxyMb was observed in a Tris-HCl buffer at pH 6.5 with 75% saturated ammonium sulfate.
Optimal storage conditions of oxyMb microcrystals were found in a Tris-HCl buffer at pH 8.5
with 75% saturated ammonium sulfate, where the autooxidation rate of oxyMb microcrystals
was determined to be (8.1 ± 0.8) x 10-4 hrs-1 at 253 K, corresponding to t1/2 = 850 hrs. We
concluded that oxyMb is a suitable candidate for 17O-labelling via the new H217O-electrolysis
route.
ii
Acknowledgements
First, I would like to express my sincere gratitude to my supervisor, Dr. Gang Wu, who
took a chance on me, believing in my abilities as a scientist despite my struggles during
undergraduate studies. Dr. Wu has helped me grow as a scientist and his guidance through these
years have been invaluable. Second, I would like to thank Dr. Igor Kozin for his assistance in
Raman spectroscopy and guidance as a teacher. Dr. Kozin’s dedication to the students is
admirable and I aspire to demonstrate the same dedication he has shown during my time at
Queen’s. I would also like to thank Dr. Françoise Sauriol for her assistance in NMR
spectroscopy – her knowledge and training on NMR were invaluable to my studies.
I must also express my gratitude to my friends from the Department of Chemistry –
Lucas, Andre, Ishwar and Sophia, their companionship in and out of the lab helped me get
through the hard times. I also need to thank my lifelong friends Cameron, Will, Taylor, Jack,
Nigel, Thomas, Owen, Kevin, Cody and Fice for their constant support despite being away from
Kingston.
I am grateful for everyone who I have worked with in the Wu Group. I thank Jiahui Shen,
Sherry Dai, and Betty Lin for helping me learn to be a better researcher, for assistance and
guidance in quantum chemical calculations and for welcoming me into the Wu Group during my
first year. I must also thank past and current lab members, Stephanie Han, Mandy Ye, Ailsa
Geddis, Sarah Hall, Kaisy Ren, Marco Gomez, Zhonghao Yu and Yuying Huang for their
support and assistance during my time in the Wu Group.

iii
Lastly, I must thank my family, including my sisters Sydney and Kasey, my Nanna, my
Grandma, and Grandpa and most importantly, my parents John and Tina for their unconditional
love and support throughout life. I would not be here with you all.
iv
Table of Contents
Abstract ........................................................................................................................................... i
Acknowledgements ....................................................................................................................... ii
List of Figures ............................................................................................................................... vi
List of Tables ................................................................................................................................ ix
List of Abbreviations .................................................................................................................... x
List of Symbols ............................................................................................................................ xii
1 Introduction ........................................................................................................................... 1
1.1 Historical review of syntheses and applications of metal-dioxygen complexes ........ 1
1.1.1 Nature of Dioxygen ................................................................................................... 1
1.1.2 Review of cobalt-dioxygen complexes ...................................................................... 6
1.1.3 Review of Group 8 – 10 metal-dioxygen complexes ............................................... 10
1.1.4 Biological oxygen carrying systems........................................................................ 14
1.2 Review of 17O NMR studies of metal-dioxygen complexes ....................................... 16
1.3 Thesis Objectives .......................................................................................................... 22
1.4 Organization of Thesis ................................................................................................. 23
2 Device development and synthesis ..................................................................................... 24
2.1 Design of water electrolysis apparatus ....................................................................... 24
2.1.1 Design considerations ............................................................................................. 25
2.1.2 Design process ........................................................................................................ 30
2.1.3 The final design ....................................................................................................... 35
2.2 Syntheses of metal-dioxygen complexes ..................................................................... 37
2.2.1 Synthesis of μ-peroxo-μ-hydroxo-bis[bis(ethylenediamine)cobalt(III)] (1) ........... 37
2.2.2 Synthesis of μ-peroxo-bis[pentamminecobalt(III)] (2) ........................................... 38
2.2.3 Synthesis of bis(triphenylphosphine)oxygenoplatinum(II) (3) ................................ 39
2.2.4 Synthesis of bis(triphenylphosphine)oxygenopalladium(II) (4) .............................. 40
2.2.5 Synthesis of oxymyoglobin ...................................................................................... 41

v
2.3 Spectroscopic methods ................................................................................................. 41
2.3.1 Infrared spectroscopy ............................................................................................. 41
2.3.2 Raman spectroscopy ............................................................................................... 42
2.3.3 UV-Vis spectroscopy ............................................................................................... 42
2.3.4 Solution-state NMR spectroscopy ........................................................................... 42
3 Characterization of metal-dioxygen complexes ............................................................... 44
3.1 Characterization of μ-peroxo-μ-hydroxo-bis[bis(ethylenediamine)cobalt(III)] (1a/b/c) ...................................................................................................................................... 44
3.2 Characterization of μ-peroxo-bis-[pentamminecobalt(III)] (2a/b) .......................... 62
3.3 Characterization of bis(triphenylphosphine)oxygenoplatium(II)/palladium(II) (3a/b) and (4a/b) ...................................................................................................................... 67
3.4 Preliminary investigation and characterization of oxymyoglobin (oxyMb) ........... 76
3.5 Summary of 17O NMR data ......................................................................................... 82
4 Conclusion and Future Works ........................................................................................... 88
References .................................................................................................................................... 91
vi
List of Figures
Figure 1.1. Molecular orbital diagram of dioxygen. *Diagram not to scale .................................. 3
Figure 1.2. Major classifications of metal-dioxygen complexes: superoxo and peroxo complexes. Dinuclear complexes are denoted by the symbol “µ”, while the symbol “η” denotes the hapticity of the ligand. .............................................................................................................. 4
Figure 1.3. General structure of a Schiff base where R is an alkyl or aryl group. ......................... 6
Figure 1.4. a) Structure of cis-β-[Co(R, R:S, S-fars)(η2-O2)]Br as prepared by Bosnich et al., where M is cobalt.25 b) The structure of the “fars” tetradentate ligand coordinated to a). ............. 8
Figure 1.5. General structure of the dinuclear cobalt(III)-dioxygen complexes, [Co2(ea)2(phen)2(μ-O2)]∙5.5H2O∙2Cl and [Co2(ea)2(bipy)2(μ-O2)]∙2H2O∙2NO3, synthesized by Shahid et al..27 ................................................................................................................................. 9
Figure 1.6. Structure of Vaska's complex and reaction with O2(g) to form oxy-Vaska's complex........................................................................................................................................................ 10
Figure 1.7. Structure of [Rh(dppe)2(η2-O2)][PF6] (not including counterion) synthesized by McGinnety et al..33 ........................................................................................................................ 12
Figure 1.8. General structure of heterobimetallic MCu-bis(μ-oxo) complexes synthesized by York et al., where M is Pd or Pt and L is a Schiff base ligand.34 ................................................. 13
Figure 1.9. a) Resonance structures of ozone b) Structure of Fe-O-O linkage akin to ozone as proposed by McClure,47 Harcourt,48, 49 and Goddard and Olafson.50 ........................................... 15
Figure 1.10. General structure of picket-fence porphyrin, modelling the FeO2 heme centre of hemoglobin and myoglobin. Figure reproduced from Gerothanassis and Momenteau.79 ............ 19
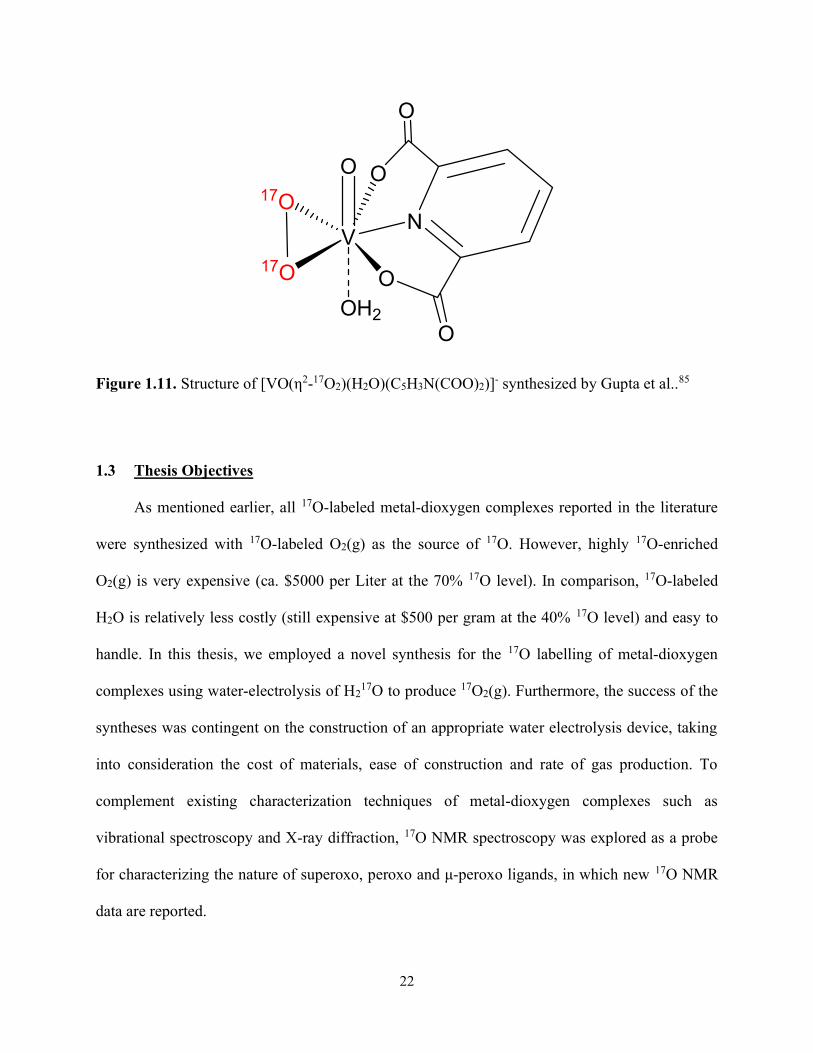
Figure 1.11. Structure of [VO(η2-17O2)(H2O)(C5H3N(COO)2)]- synthesized by Gupta et al..85 .. 22
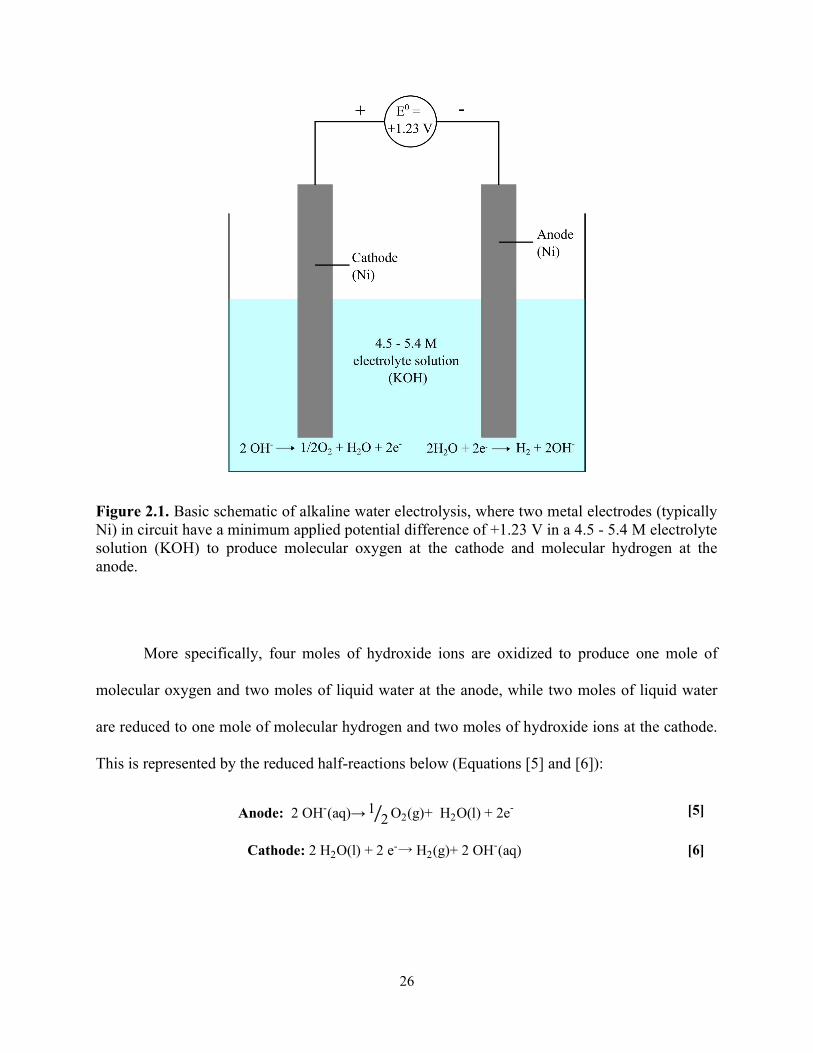
Figure 2.1. Basic schematic of alkaline water electrolysis, where two metal electrodes (typically Ni) in circuit have a minimum applied potential difference of +1.23 V in a 4.5 - 5.4 M electrolyte solution (KOH) to produce molecular oxygen at the cathode and molecular hydrogen at the anode. ............................................................................................................................................ 26
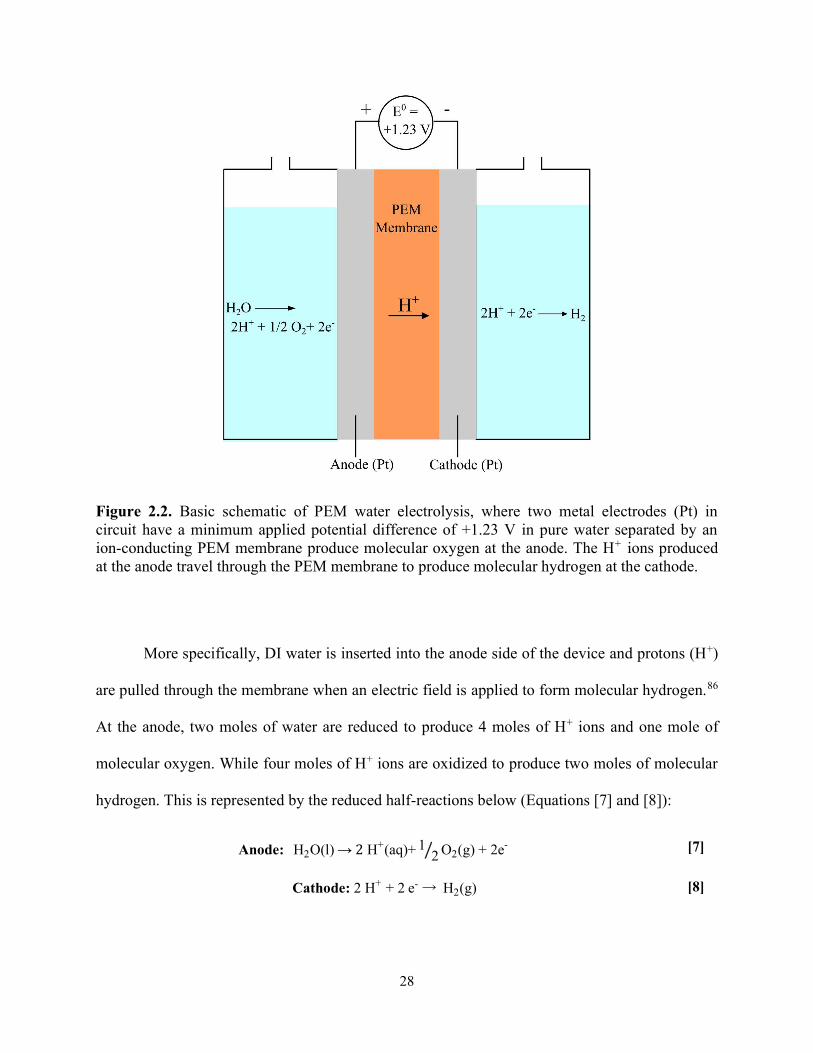
Figure 2.2. Basic schematic of PEM water electrolysis, where two metal electrodes (Pt) in circuit have a minimum applied potential difference of +1.23 V in pure water separated by an ion-conducting PEM membrane produce molecular oxygen at the anode. The H+ ions produced at the anode travel through the PEM membrane to produce molecular hydrogen at the cathode. 28
Figure 2.3. Schematic diagram of the first testing water electrolysis device designed. .............. 31
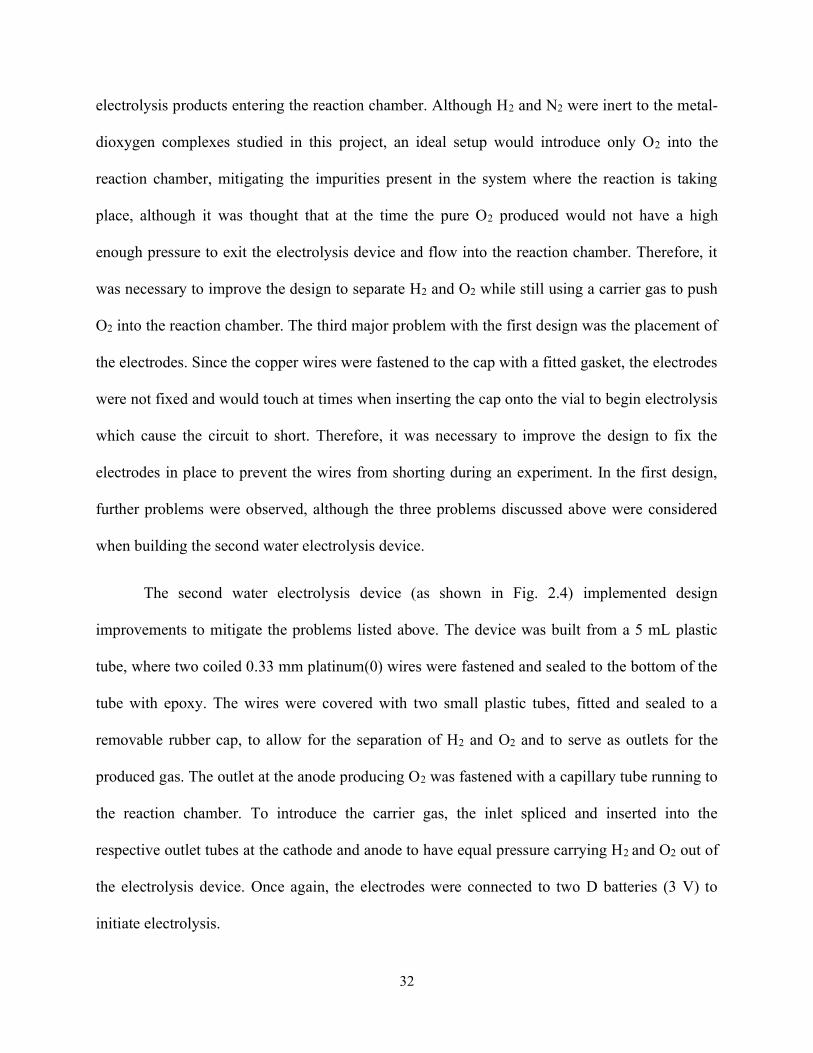
Figure 2.4. Schematic diagram of the second water electrolysis device designed. ..................... 33
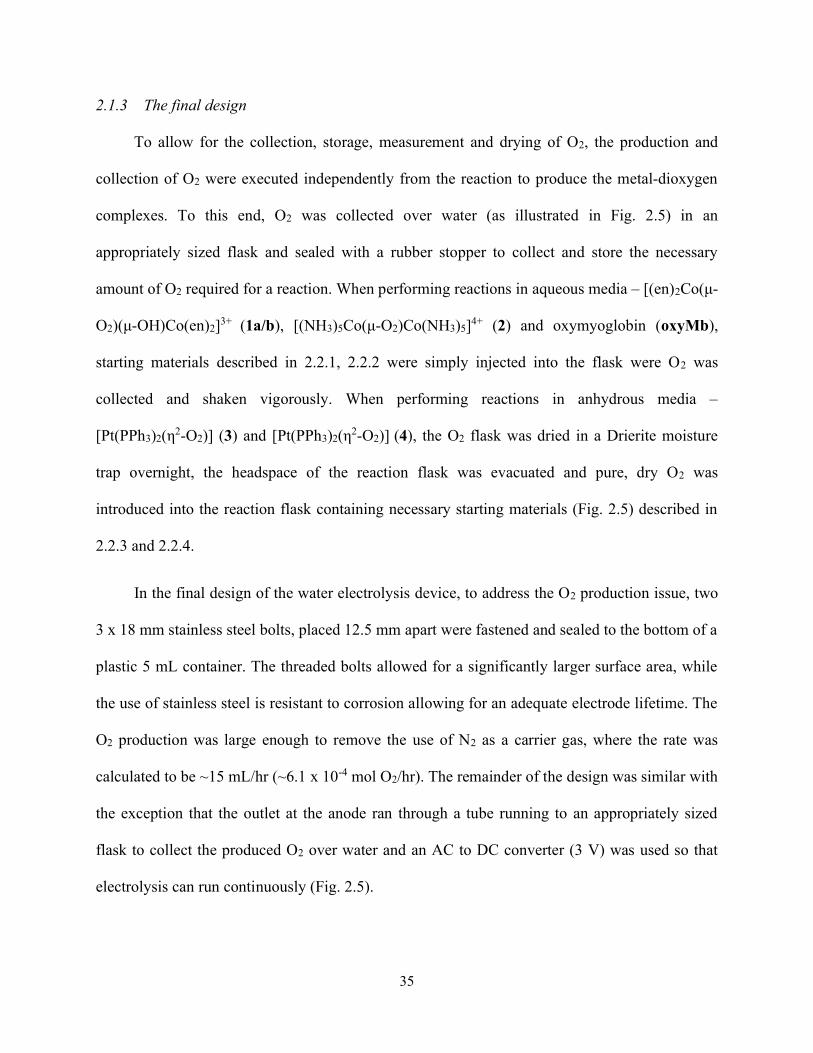
Figure 2.5. a) Schematic diagram of O2 collection over water with final electrolysis design setup. The H2 produced is released into the atmosphere and the O2 produced is collected over water in an appropriately sized flask and stored for synthesis. b) Reaction setup following O2 collection for metal-dioxygen complexes synthesized in aqueous media. c) Reaction setup following O2 collection for metal-dioxygen complexes synthesized in anhydrous media. .......... 36
vii
Figure 3.1. IR spectrum of 1a acquired on a Bruker ALPHA FT-IR spectrometer, dispersed in a KBr disk. The structure of the ΔΔ isomer of 1 is inset to illustrate the symmetry of the complex, where X is O – O and Y is O – H. ................................................................................................ 45
Figure 3.2. Solid-state Raman spectrum of 1a acquired on a Avantes AvaSpec ULS-TEC Raman spectrometer at a laser wavelength of 785 nm and laser power 166 mW (550 mA), integration time: 30 s. ...................................................................................................................................... 48
Figure 3.3. General structures of optically active (a) octahedral cis coordination complexes of M(AA)2X2 and (b) octahedral coordination complexes of M(AA)3 forms and their naming conventions “Λ” and “Δ”. .............................................................................................................. 49
Figure 3.4. Structures of the three isomers of 1, where the racemic (rac) “ΔΔ” and “ΛΛ” isomers exist in a 1:1 ratio and are the major product of the synthesis, while the meso isomer is the minor product. ......................................................................................................................................... 50
Figure 3.5. 1H NMR spectrum of 1a in DMSO-d6 acquired at 16.4 T, DVT= 298 K on a Bruker Avance NEO 700 NMR spectrometer. The window displays the shielded peaks of the µ-hydroxo proton of the rac (-2.43 ppm) and meso (-1.70 ppm) isomers of 1a. Asterix (*) indicates signals from the meso isomer. ................................................................................................................... 52
Figure 3.6. 13C NMR spectrum of 1a in DMSO-d6 acquired at 16.4 T, DVT= 298 K on a Bruker Avance NEO 700 NMR spectrometer. The four larger peaks (black) at 43.74, 43.99, 44.15 and 44.52 ppm are the CH2 ligands in the rac isomer, while the small peaks (red) at 43.55, 44.10, 44.20 and 44.25 ppm are the CH2 ligands in the meso isomer. .................................................... 53
Figure 3.7. 1H – 13C heteronuclear correlation 2D HSQC NMR spectrum of 1a in DMSO-d6 acquired at 16.4 T, DVT = 298 K on a Bruker Avance NEO 700 NMR spectrometer. Dashed lines connect each 13C correlation their respective 1H NMR correlation. .................................... 55
Figure 3.8. 1H – 1H homonuclear correlation 2D COSY NMR spectrum of 1a in DMSO-d6 acquired at 16.4 T, DVT = 298 K on a Bruker Avance NEO 700 NMR spectrometer. The dashed lines represent 1H – 1H correlations on respective ligands of 1a. ................................................. 57
Figure 3.9. Structure of 1 in the ΔΔ rac-conformer with carbon and hydrogen assignments from NMR analysis. The numbers in bold represent the respective carbons of and the letter in brackets represent the corresponding hydrogens of 1 as labelled in Table 3.1.2. ....................................... 58
Figure 3.10. 17O Hahn-echo NMR solution spectra of 1b dissolved in CD3CN acquired at 16.4 T on a Bruker Avance NEO 700 NMR spectrometer. DVT = 298, 323, 343 K, 180 ⁰ pulse, 64 W. *Note: 17O NMR signal for perchlorate is due to natural abundance of 17O in counterion. ......... 59
Figure 3.11. Overlaid 17O NMR spectrum of 1c acquired at 11.4 T on a Bruker Avance 500 NMR spectrometer after one (blue), two (red) and four (green) days in solution with H2
17O (70 %), DVT = 298 K. ........................................................................................................................ 61
Figure 3.12. Structure of 2 synthesized in this project, first isolated by Werner.21 ..................... 62
Figure 3.13. IR spectrum of 2a acquired on a Bruker ALPHA FT-IR spectrometer, dispersed in a KBr disk. .................................................................................................................................... 63
Figure 3.14. Solid-state Raman spectrum of 2a acquired on a Avantes AvaSpec ULS-TEC Raman spectrometer at a laser wavelength of 7785 nm and power 170 mW (560 mA), integration time: 40 s. ...................................................................................................................................... 65
viii
Figure 3.15. 17O Hahn-echo NMR solution spectra of 2b dissolved in 7 M NH3(aq), acquired at 16.4 T on a Bruker Avance NEO 700 NMR spectrometer. DVT = 298 K, 180 ⁰ pulse, 64 W. *Note: 17O NMR signal for sulfate and borosilicate are due to the natural abundance of 17O in the counterion and NMR tube. ............................................................................................................ 66
Figure 3.16. Structure of [M(PPh3)2(η2-O2)] – 3 and 4 synthesized in this project. .................... 68
Figure 3.17. IR spectrum of 3a acquired on a Bruker ALPHA FT-IR spectrometer, dispersed in a KBr disk. ....................................................................................................................................... 69
Figure 3.18. IR spectrum of 4a acquired on a Bruker ALPHA FT-IR spectrometer, dispersed in a KBr disk. ....................................................................................................................................... 70
Figure 3.19. 31P NMR spectrum of 3 in CDCl3 acquired at 11.4 T on a Bruker Avance NEO 500 NMR spectrometer, DVT = 298 K. .............................................................................................. 72
Figure 3.20. 31P NMR spectrum of 4 in CDCl3 acquired at 11.4 T on a Bruker Avance NEO 500 NMR spectrometer, DVT = 298 K. .............................................................................................. 73
Figure 3.21. 17O Hahn-echo NMR solution spectra of 3b (lb = 1000 Hz) and 4b (lb = 400 Hz) dissolved in CDCl3, acquired at 16.4 T on a Bruker Avance NEO 700 NMR spectrometer. DVT = 298 K, 180 ⁰ pulse, 64 W. .......................................................................................................... 75
Figure 3.22. Structures of the iron O2 binding site of metMb, deoxyMb and oxyMb. (Functional groups are excluded from structures for clarity) ....................................................... 77
Figure 3.23. Overlaid UV-Vis absorbance spectra of 0.2 mg/mL metMb (red), deoxyMb (green) and oxyMb (blue) in a sodium phosphate buffer, pH 7, acquired on a JASCO CD spectrometer. ................................................................................................................................. 79
Figure 3.24. First-order rate of the autooxidation of oxyMb, reduced with a 25-fold molar excess of sodium dithionite, bubbled for 4 hours and stored in a 0.05 M Tris-HCl buffer at pH 8.5 at 253 K, acquired on a JASCO CD spectrometer. ................................................................. 81
Figure 3.25. Comparison of reported 17O NMR shifts of organic peroxides (green), µ-peroxo complexes (blue), η2-monoperoxo complexes (red circle), η2-diperoxo complexes (red triangle) and η1-superoxo complexes (black). The data points represented by black triangles are the bridging oxygen in η1-superoxo complexes, while the data points represented by black circles are the terminal oxygen in η1-superoxo complexes. ........................................................................... 83
ix
List of Tables
Table 1.1. Comparison of O - O stretching frequency from vibrational spectroscopy and reported O - O bond lengths of free dioxygen, superoxide ion, peroxide ion, superoxo type η1 and µ complexes and, peroxo type η2 and µ complexes. .......................................................................... 5
Table 3.1. Summary of vibrational modes of the FT-IR spectrum of 1a acquired on a Bruker ALPHA IR spectrometer dispersed in a KBr disk. ....................................................................... 46
Table 3.2. NMR analysis of 1a reporting and labelling 13C (numbers) and 1H (letters) NMR shifts of 1a, correlated to the 2D 13C – 1H HSQC and 1H – 1H COSY NMR experiments, elucidating the spectral assignment of the major rac product of 1a. ............................................ 54
Table 3.3. Summary of vibrational modes of the FT-IR spectrum of 2a acquired on a Bruker ALPHA IR spectrometer dispersed in a KBr disk. ....................................................................... 64
Table 3.4. Summary of vibrational modes of the IR spectrum of 3a and 4a acquired on a Bruker ALPHA FT-IR spectrometer dispersed in a KBr disk. ................................................................. 71
Table 3.5. UV-Vis absorbance data of 0.2 mg/mL metMb and oxyMb in a sodium phosphate buffer at pH 7, acquired on JASCO CD spectrometer. Concentration of each solution was calculated using Beer's Law. ......................................................................................................... 80
Table 3.6. Summary of all 17O NMR chemical shifts and linewidths for metal-dioxygen complexes studied to date. ............................................................................................................ 84
x
List of Abbreviations
AC Alternating current ADF Amsterdam Density Functional ARDS Acute Respiratory Distress Syndrome bipy 2,2’-bipyridine CD Circular dichroism COSY Correlated Spectroscopy CV Cyclic voltammetry CS Chemical shift DC Direct current DFT Density Functional Theory DI Deionized DMF Dimethylformamide DMSO Dimethylsulfoxide DOR Double rotation dppe 1,2-Bis(diphenylphosphino)ethane ea Ethanolamine EDTA Ethylenediaminetetraacetic acid en Ethylenediamine fars 1-((R)-(3-(dimethylarsanyl)propyl)(methyl)arsanyl)-2-((S)-(3-
(dimethylarsanyl)propyl)(methyl)arsanyl)benzene FT Fourier Transform HMPA Hexamethylphosphoramide HSQC Heteronuclear Single Quantum Coherence IDA Iminodiacetic acid Im Imidazole IR Infrared lb Line broadening LMCT Ligand-to-metal charge transfer MAS Magic angle spinning Mb Myoglobin Me Methyl MIL Matériaux de l'Institut Lavoisier MOFs Metal organic frameworks MQMAS Multiple quantum magic angle spinning NMR Nuclear magnetic resonance ox Oxidation PEM Proton exchange membrane phen 1,10-phenanthroline PPh3 Triphenylphosphine py Pyridine QC Quadrupolar coupling QCPMG Quantum Carr-Purcell Meiboom-Gill
xi
QCT Quadrupole Central Transition red Reduction SARS-CoV-2 Severe acute respiratory syndrome coronavirus 2 Tam N-vinylformamide TMS Trimethylsilane TpivPP Picket-fence porphyrin USD United States Dollars UV-Vis Ultraviolet-Visible
xii
List of Symbols
<r> Average distance ⁰C Celsius A Amperes Å Angstrom Da Daltons e Elementary charge E Energy ℏ Reduced Planck's constant Hz Hertz I Nuclear spin quantum number J Coupling constant k Rate constant K Kelvin K Equilibrium constant kHz Kilohertz m Mass M Molarity MHz Megahertz ppm Parts per million Pu P electron imbalance S Spin T Tesla t1/2 Half-life V Volts W Watts δ Chemical shift λ Wavelength μ0 Permeability constant ν Wavenumber σ Shielding constant σd Diamagnetic shielding constant σp Paramagnetic shielding constant
1
1 Introduction
1.1 Historical review of syntheses and applications of metal-dioxygen complexes
1.1.1 Nature of Dioxygen
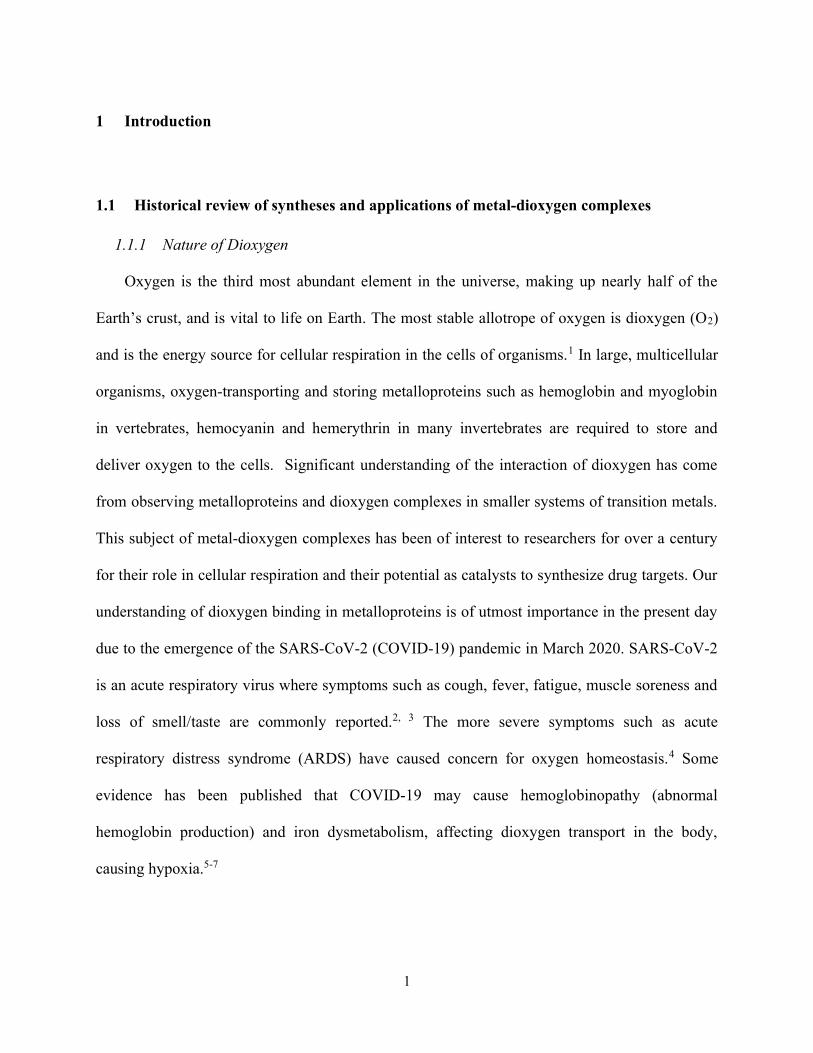
Oxygen is the third most abundant element in the universe, making up nearly half of the
Earth’s crust, and is vital to life on Earth. The most stable allotrope of oxygen is dioxygen (O2)
and is the energy source for cellular respiration in the cells of organisms.1 In large, multicellular
organisms, oxygen-transporting and storing metalloproteins such as hemoglobin and myoglobin
in vertebrates, hemocyanin and hemerythrin in many invertebrates are required to store and
deliver oxygen to the cells. Significant understanding of the interaction of dioxygen has come
from observing metalloproteins and dioxygen complexes in smaller systems of transition metals.
This subject of metal-dioxygen complexes has been of interest to researchers for over a century
for their role in cellular respiration and their potential as catalysts to synthesize drug targets. Our
understanding of dioxygen binding in metalloproteins is of utmost importance in the present day
due to the emergence of the SARS-CoV-2 (COVID-19) pandemic in March 2020. SARS-CoV-2
is an acute respiratory virus where symptoms such as cough, fever, fatigue, muscle soreness and
loss of smell/taste are commonly reported.2, 3 The more severe symptoms such as acute
respiratory distress syndrome (ARDS) have caused concern for oxygen homeostasis.4 Some
evidence has been published that COVID-19 may cause hemoglobinopathy (abnormal
hemoglobin production) and iron dysmetabolism, affecting dioxygen transport in the body,
causing hypoxia.5-7
2
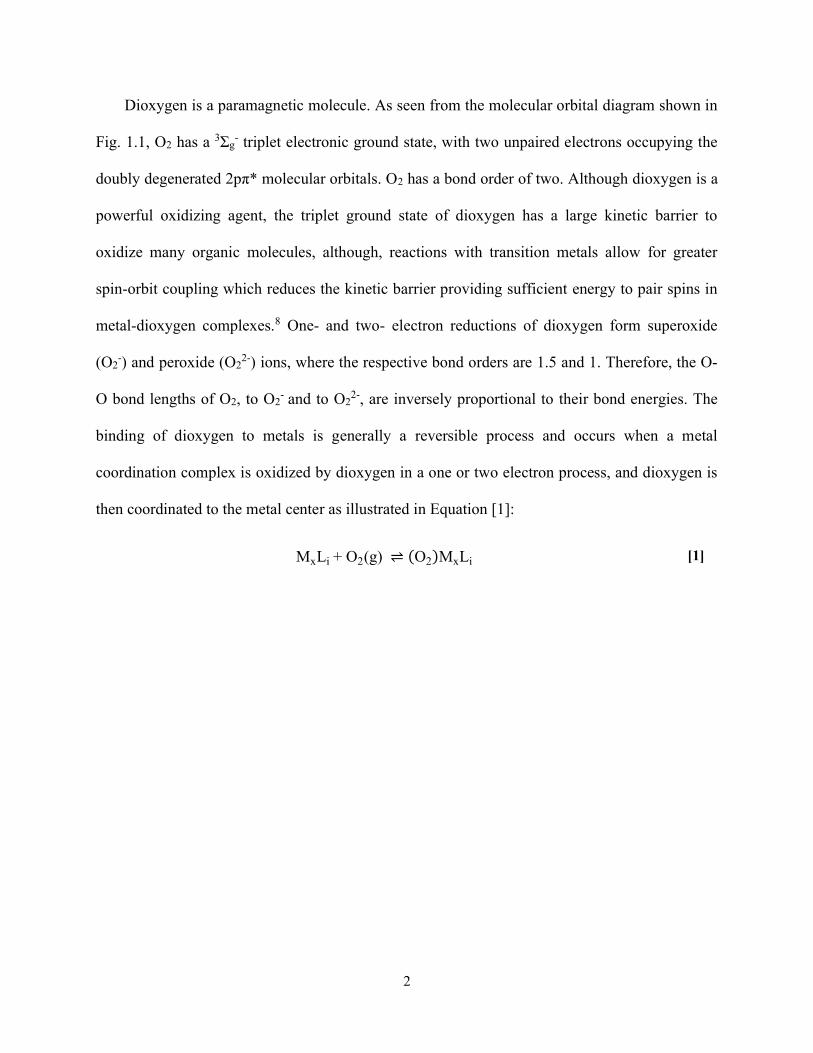
Dioxygen is a paramagnetic molecule. As seen from the molecular orbital diagram shown in
Fig. 1.1, O2 has a 3Σg- triplet electronic ground state, with two unpaired electrons occupying the
doubly degenerated 2pπ* molecular orbitals. O2 has a bond order of two. Although dioxygen is a
powerful oxidizing agent, the triplet ground state of dioxygen has a large kinetic barrier to
oxidize many organic molecules, although, reactions with transition metals allow for greater
spin-orbit coupling which reduces the kinetic barrier providing sufficient energy to pair spins in
metal-dioxygen complexes.8 One- and two- electron reductions of dioxygen form superoxide
(O2-) and peroxide (O2
2-) ions, where the respective bond orders are 1.5 and 1. Therefore, the O-
O bond lengths of O2, to O2- and to O2
2-, are inversely proportional to their bond energies. The
binding of dioxygen to metals is generally a reversible process and occurs when a metal
coordination complex is oxidized by dioxygen in a one or two electron process, and dioxygen is
then coordinated to the metal center as illustrated in Equation [1]:
MxLi + O2(g) ⇌ (O2)MxLi [1]
3
Figure 1.1. Molecular orbital diagram of dioxygen. *Diagram not to scale
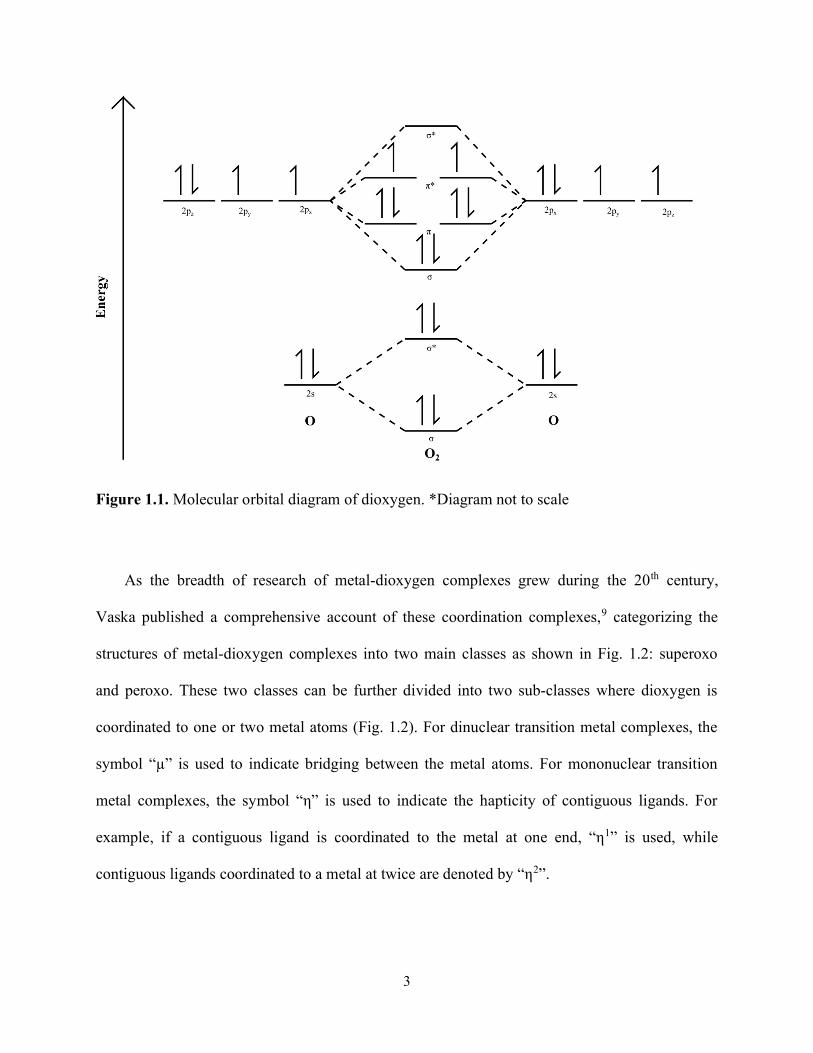
As the breadth of research of metal-dioxygen complexes grew during the 20th century,
Vaska published a comprehensive account of these coordination complexes,9 categorizing the
structures of metal-dioxygen complexes into two main classes as shown in Fig. 1.2: superoxo
and peroxo. These two classes can be further divided into two sub-classes where dioxygen is
coordinated to one or two metal atoms (Fig. 1.2). For dinuclear transition metal complexes, the
symbol “µ” is used to indicate bridging between the metal atoms. For mononuclear transition
metal complexes, the symbol “η” is used to indicate the hapticity of contiguous ligands. For
example, if a contiguous ligand is coordinated to the metal at one end, “η1” is used, while
contiguous ligands coordinated to a metal at twice are denoted by “η2”.
4
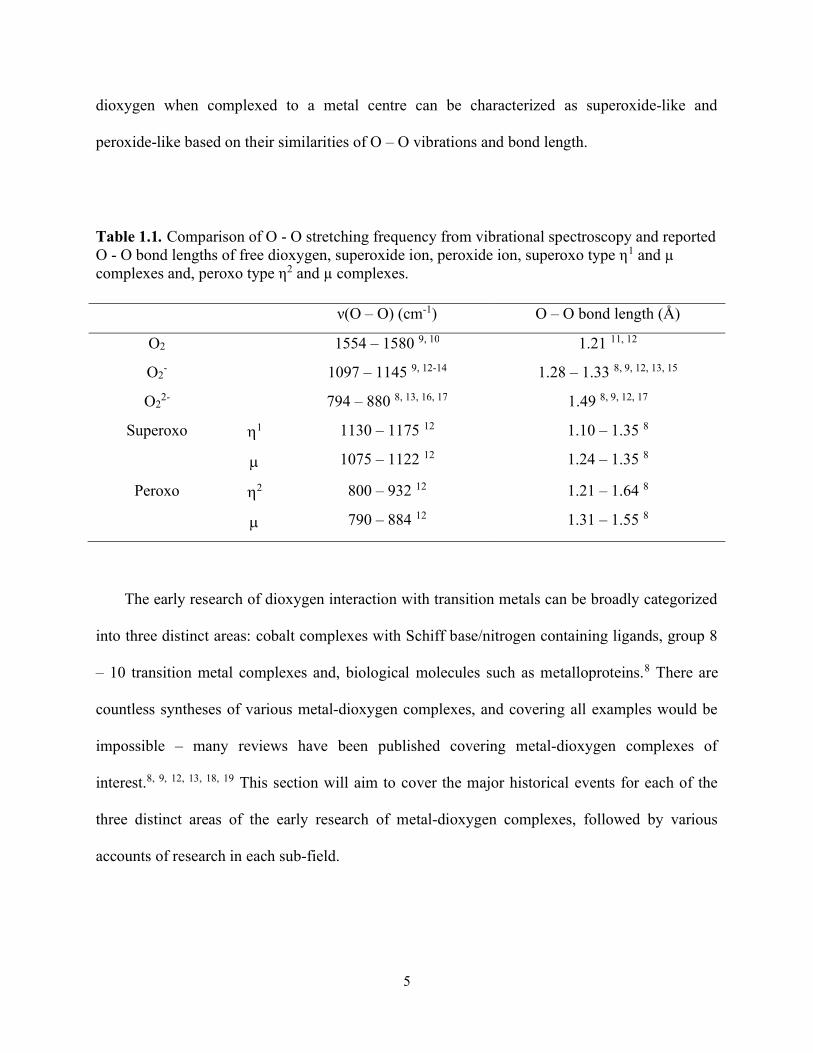
Figure 1.2. Major classifications of metal-dioxygen complexes: superoxo and peroxo complexes. Dinuclear complexes are denoted by the symbol “µ”, while the symbol “η” denotes the hapticity of the ligand.
Although the superoxo and peroxo complexes of dioxygen differ from the superoxide and
peroxide ions, they exhibit similar physical characteristics,9 thus the nature of metal-dioxygen
complexes has long been characterized in reference to their free ions by vibrational spectroscopy
such as infrared (IR) and Raman spectroscopy and, x-ray diffraction. Reported O – O stretching
and bond lengths for free dioxygen, the superoxide ion, peroxide ion, superoxo complex and
peroxo complex have been summarized in Table 1.1. We can see that the superoxide ion and
superoxo complex have similar O – O stretching frequencies and similar bond lengths. The same
observation is also true for the peroxide ion and peroxo complex. Thus, the nature of the
5
dioxygen when complexed to a metal centre can be characterized as superoxide-like and
peroxide-like based on their similarities of O – O vibrations and bond length.
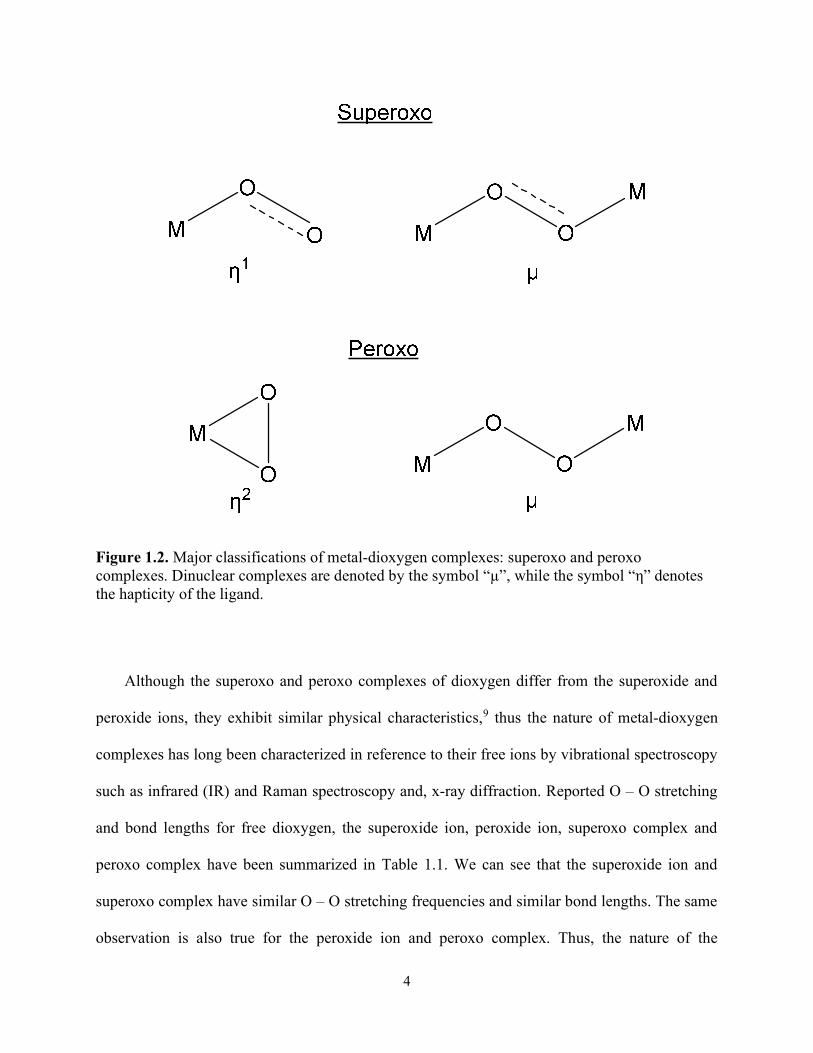
Table 1.1. Comparison of O - O stretching frequency from vibrational spectroscopy and reported O - O bond lengths of free dioxygen, superoxide ion, peroxide ion, superoxo type η1 and µ complexes and, peroxo type η2 and µ complexes.
ν(O – O) (cm-1) O – O bond length (Å)
O2 1554 – 1580 9, 10 1.21 11, 12
O2- 1097 – 1145 9, 12-14 1.28 – 1.33 8, 9, 12, 13, 15
O22- 794 – 880 8, 13, 16, 17 1.49 8, 9, 12, 17
Superoxo 1
1130 – 1175 12
1075 – 1122 12
1.10 – 1.35 8
1.24 – 1.35 8
Peroxo 2
800 – 932 12
790 – 884 12
1.21 – 1.64 8
1.31 – 1.55 8
The early research of dioxygen interaction with transition metals can be broadly categorized
into three distinct areas: cobalt complexes with Schiff base/nitrogen containing ligands, group 8
– 10 transition metal complexes and, biological molecules such as metalloproteins.8 There are
countless syntheses of various metal-dioxygen complexes, and covering all examples would be
impossible – many reviews have been published covering metal-dioxygen complexes of
interest.8, 9, 12, 13, 18, 19 This section will aim to cover the major historical events for each of the
three distinct areas of the early research of metal-dioxygen complexes, followed by various
accounts of research in each sub-field.
6
1.1.2 Review of cobalt-dioxygen complexes
The first observation of metal-dioxygen complexes began with oxygenated ammoniacal
cobalt salts by Frémy in 1852.20 The subsequent work of Alfred Werner published in 1910
greatly furthered the understanding of the interaction of dioxygen with transition metals by
exploring dinuclear cobalt(III)-dioxygen complexes.19, 21 In 1938, Tsumaki reported that
chelating Schiff base ligands of cobalt(III) bind dioxygen and to this date, a great deal of metal-
dioxygen complex syntheses are of this nature. A Schiff base is classified as a sub-class of
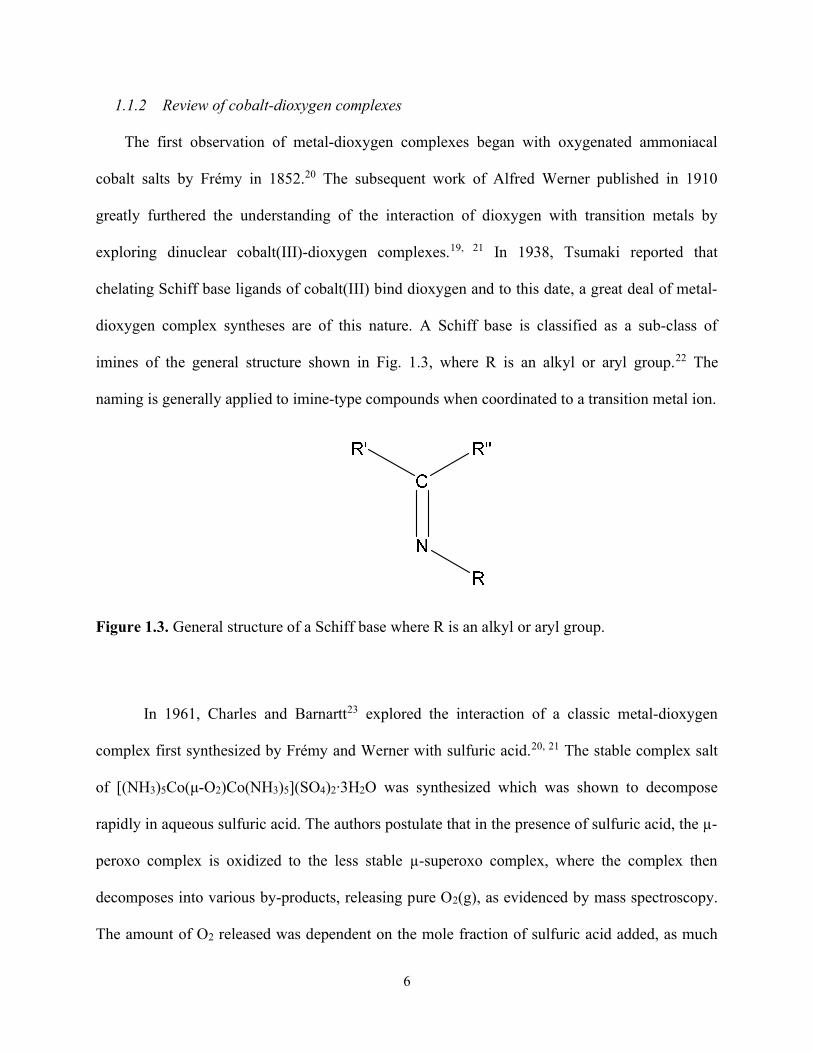
imines of the general structure shown in Fig. 1.3, where R is an alkyl or aryl group.22 The
naming is generally applied to imine-type compounds when coordinated to a transition metal ion.
Figure 1.3. General structure of a Schiff base where R is an alkyl or aryl group.
In 1961, Charles and Barnartt23 explored the interaction of a classic metal-dioxygen
complex first synthesized by Frémy and Werner with sulfuric acid.20, 21 The stable complex salt
of [(NH3)5Co(μ-O2)Co(NH3)5](SO4)2∙3H2O was synthesized which was shown to decompose
rapidly in aqueous sulfuric acid. The authors postulate that in the presence of sulfuric acid, the µ-
peroxo complex is oxidized to the less stable µ-superoxo complex, where the complex then
decomposes into various by-products, releasing pure O2(g), as evidenced by mass spectroscopy.
The amount of O2 released was dependent on the mole fraction of sulfuric acid added, as much
7
as 50% of pure dioxygen was evolved from the complex at 5 – 40-fold molar excesses, where the
dioxygen evolution sharply decreased to as little as 20% at 50-fold or higher molar excesses.23
Furthermore, the decomposition of [(NH3)5Co(μ-O2)Co(NH3)5](SO4)2∙3H2O yielded eight
distinct products separated by ion-exchange chromatography, four of which were identified by
UV-Vis spectroscopy. This study is a classic example of the potential applications of cobalt(III)
complexes as synthetic oxygen carriers.
In 1969, Foong et al.24 synthesized two dibridged μ-peroxo cobalt complex salts and one
dibridged μ-superoxo cobalt complex salt: [(en)2Co(μ-O2)(μ-OH)Co(en)2](ClO4)∙H2O,
[(en)2Co(μ-O2)(μ-NH)Co(en)2](ClO4)∙H2O and [(en)2Co(μ-O2)(μ-NH)Co(en)2](NO3). The
authors explored the mechanism by which the µ-hydroxo and µ-amido bridging occurs by
varying the stoichiometric ratios of the starting materials: cobalt(II) coordination complex,
binding ligand (en – ethylenediamine) and dioxygen. At a ratio of 2:5:1, it was observed from 1H
NMR spectroscopy, that [(en)2Co(μ-O2)(μ-OH)Co(en)2]3+ is formed by an initial reaction of the
initial cobalt (II) complex, ethylenediamine and dioxygen to form [Co2(en)5(μ-O2)]4+. The
authors claim this complex is then further oxidized in the presence of water to reversibly form
[(en)2Co(μ-O2)(μ-OH)Co(en)2]3+.24 The authors offer an interesting theory into the formation of
dibridged cobalt-dioxygen complexes.
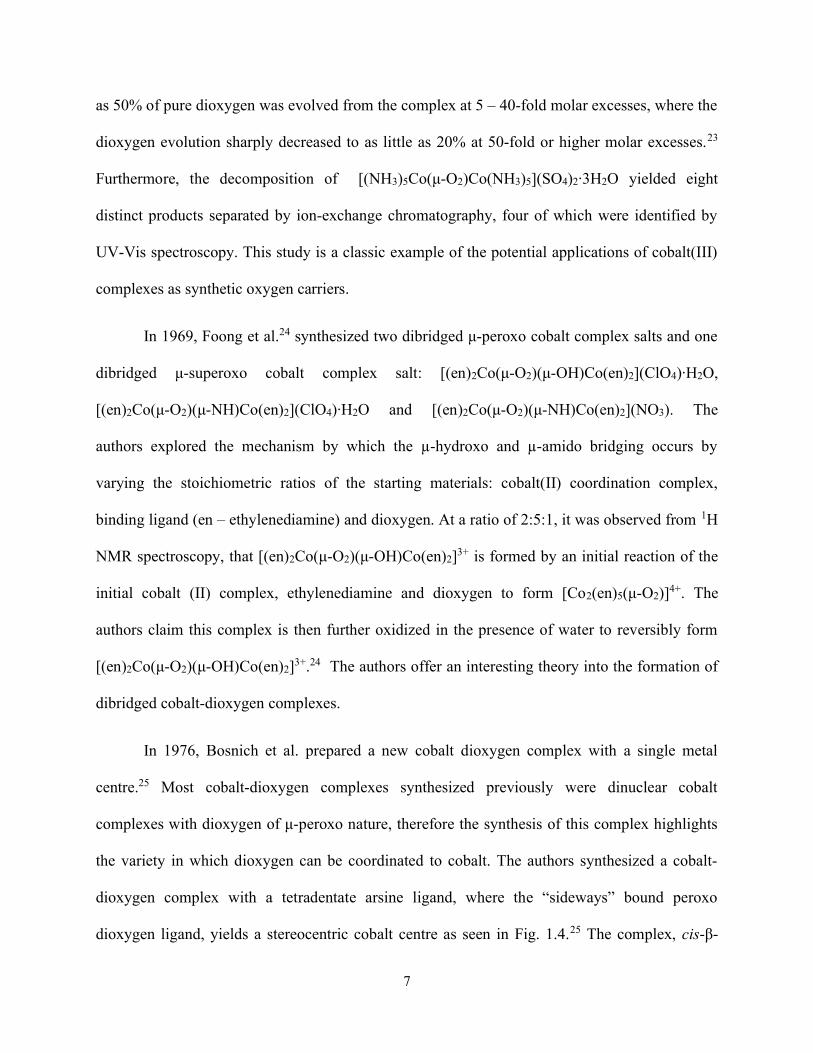
In 1976, Bosnich et al. prepared a new cobalt dioxygen complex with a single metal
centre.25 Most cobalt-dioxygen complexes synthesized previously were dinuclear cobalt
complexes with dioxygen of μ-peroxo nature, therefore the synthesis of this complex highlights
the variety in which dioxygen can be coordinated to cobalt. The authors synthesized a cobalt-
dioxygen complex with a tetradentate arsine ligand, where the “sideways” bound peroxo
dioxygen ligand, yields a stereocentric cobalt centre as seen in Fig. 1.4.25 The complex, cis-β-
8
[Co(R, R:S, S-fars)(η2-O2)]Br was synthesized by preparing a sample of trans-[Co(R, R:S, S-
fars)(H)Br]+ in reaction with triethylamine to deprotonate the complex and generate a reactive
cobalt(I) adduct. The cobalt(I) adduct is then oxidized by dioxygen to form cis-β-[Co(R, R:S, S-
fars)(η2-O2)]Br.25
Figure 1.4. a) Structure of cis-β-[Co(R, R:S, S-fars)(η2-O2)]Br as prepared by Bosnich et al., where M is cobalt.25 b) The structure of the “fars” tetradentate ligand coordinated to a).
In 1989, Chen et al. synthesized sixteen cobalt-Schiff base complexes, including ten new
cobalt-Schiff base complexes.26 Of the sixteen cobalt-Schiff base complexes synthesized, the
authors report a wide range of dioxygen affinities (logK), where K is the equilibrium constant,
for twelve the cobalt-Schiff base complexes (K = 1.58 x 10⁻⁴ to 436). The five dinuclear
complexes synthesized displayed large dioxygen affinities and all twelve cobalt-dioxygen
complexes were calculated to have favourable enthalpies of formation.26 The authors were not
able to predict whether the cobalt-Schiff base complex would form a mononuclear or dinuclear
9
cobalt-dioxygen complex as there was no obvious trend in stability constants of mono- and
dinuclear complexes. The authors speculated that the lack of observed trend may be due to the
variance of Schiff base ligands and the steric factors involved in the coordinated ligands.26
Nonetheless, the authors demonstrated that a great variety of cobalt-dioxygen complexes can be
synthesized with Schiff base ligands.
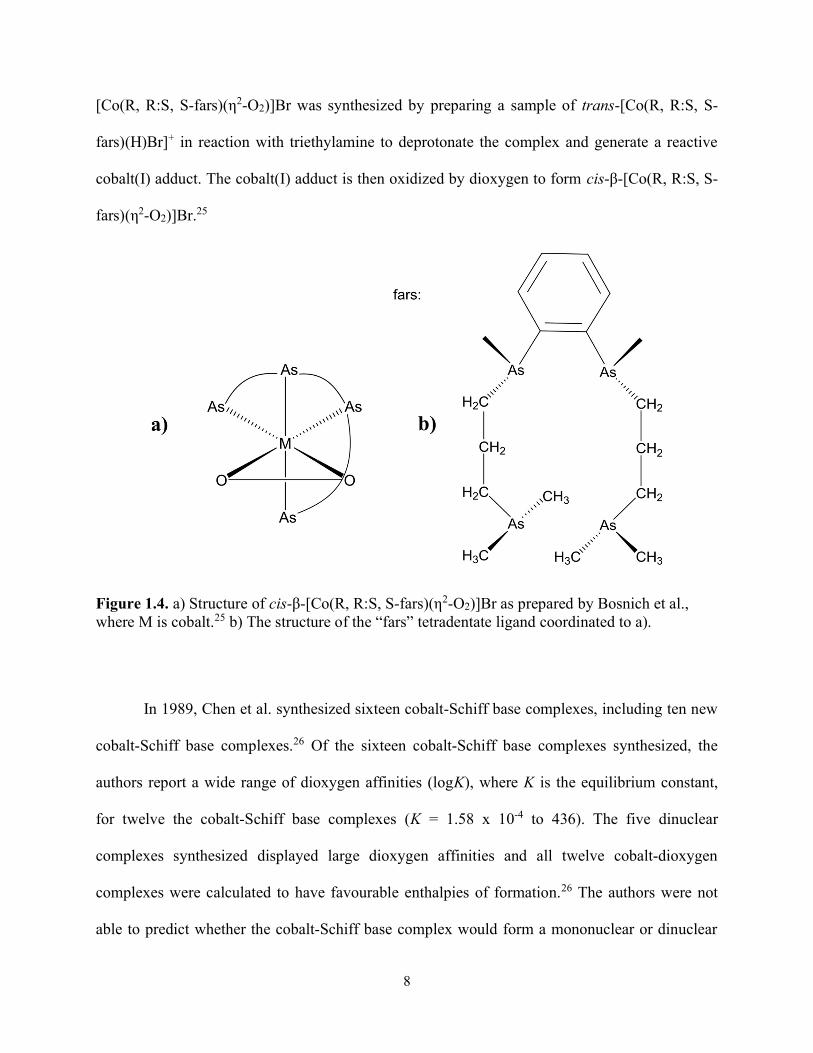
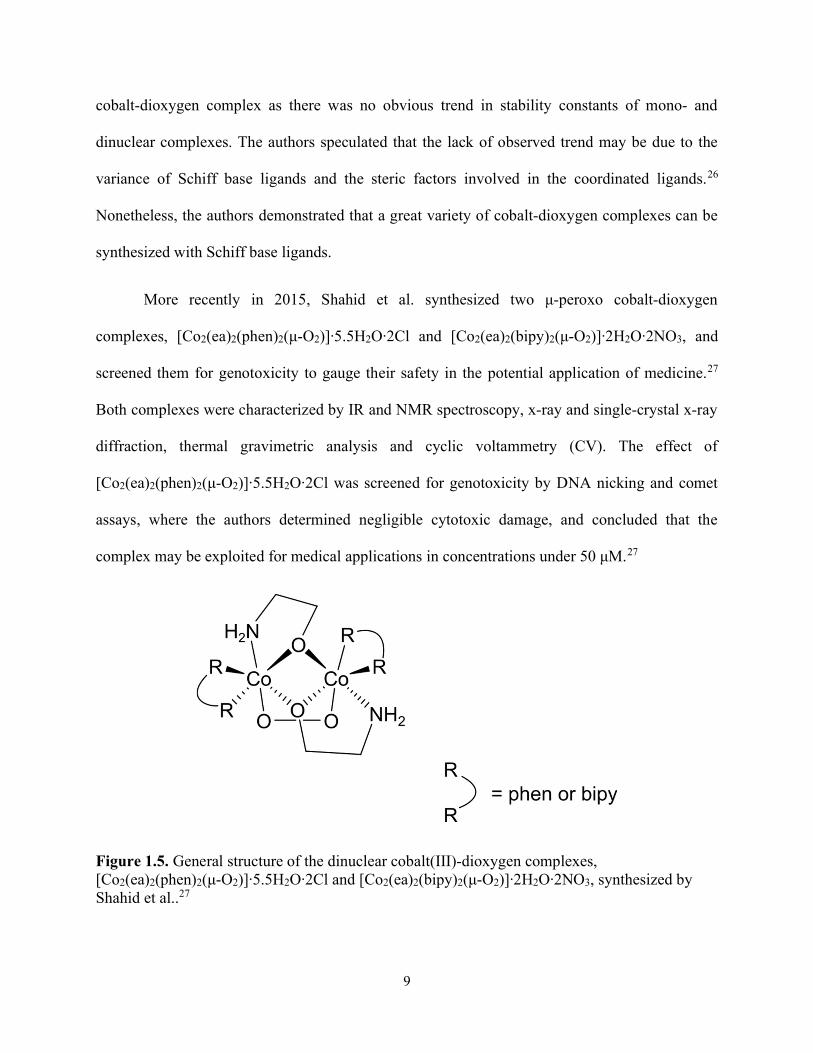
More recently in 2015, Shahid et al. synthesized two μ-peroxo cobalt-dioxygen
complexes, [Co2(ea)2(phen)2(μ-O2)]∙5.5H2O∙2Cl and [Co2(ea)2(bipy)2(μ-O2)]∙2H2O∙2NO3, and
screened them for genotoxicity to gauge their safety in the potential application of medicine.27
Both complexes were characterized by IR and NMR spectroscopy, x-ray and single-crystal x-ray
diffraction, thermal gravimetric analysis and cyclic voltammetry (CV). The effect of
[Co2(ea)2(phen)2(μ-O2)]∙5.5H2O∙2Cl was screened for genotoxicity by DNA nicking and comet
assays, where the authors determined negligible cytotoxic damage, and concluded that the
complex may be exploited for medical applications in concentrations under 50 μM.27
Figure 1.5. General structure of the dinuclear cobalt(III)-dioxygen complexes, [Co2(ea)2(phen)2(μ-O2)]∙5.5H2O∙2Cl and [Co2(ea)2(bipy)2(μ-O2)]∙2H2O∙2NO3, synthesized by Shahid et al..27
10
1.1.3 Review of Group 8 – 10 metal-dioxygen complexes
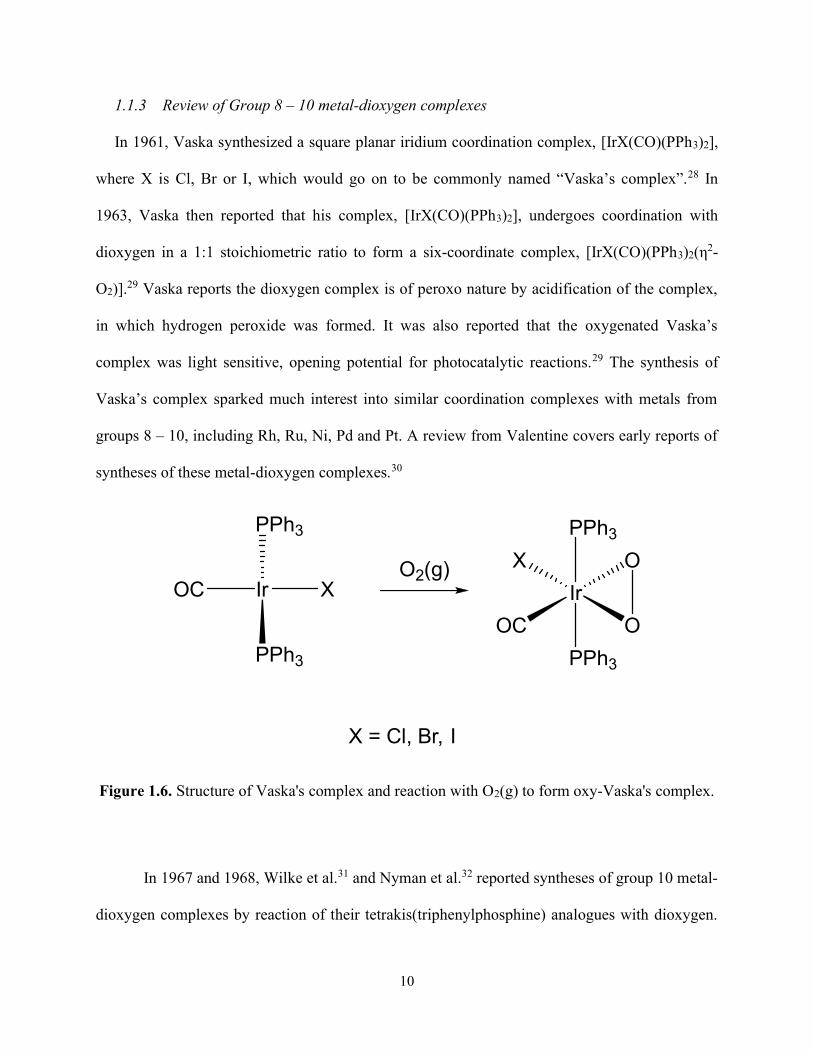
In 1961, Vaska synthesized a square planar iridium coordination complex, [IrX(CO)(PPh3)2],
where X is Cl, Br or I, which would go on to be commonly named “Vaska’s complex”.28 In
1963, Vaska then reported that his complex, [IrX(CO)(PPh3)2], undergoes coordination with
dioxygen in a 1:1 stoichiometric ratio to form a six-coordinate complex, [IrX(CO)(PPh3)2(η2-
O2)].29 Vaska reports the dioxygen complex is of peroxo nature by acidification of the complex,
in which hydrogen peroxide was formed. It was also reported that the oxygenated Vaska’s
complex was light sensitive, opening potential for photocatalytic reactions.29 The synthesis of
Vaska’s complex sparked much interest into similar coordination complexes with metals from
groups 8 – 10, including Rh, Ru, Ni, Pd and Pt. A review from Valentine covers early reports of
syntheses of these metal-dioxygen complexes.30
Ir
PPh3
OC X
PPh3
Ir
PPh3
X O
PPh3
OOC
O2(g)
X = Cl, Br, I
Figure 1.6. Structure of Vaska's complex and reaction with O2(g) to form oxy-Vaska's complex.
In 1967 and 1968, Wilke et al.31 and Nyman et al.32 reported syntheses of group 10 metal-
dioxygen complexes by reaction of their tetrakis(triphenylphosphine) analogues with dioxygen.
11
Their relative stabilities were reported, where [Pt(PPh3)2(η2-O2)] > [Pd(PPh3)2(η2-O2)] >
[Ni(PPh3)2(η2-O2)], by observing the formation of triphenylphosphine oxide. The Pd and Pt
complexes were characterized by IR spectroscopy, where an O – O stretch was observed at 870
and 835 cm-1 respectively.31
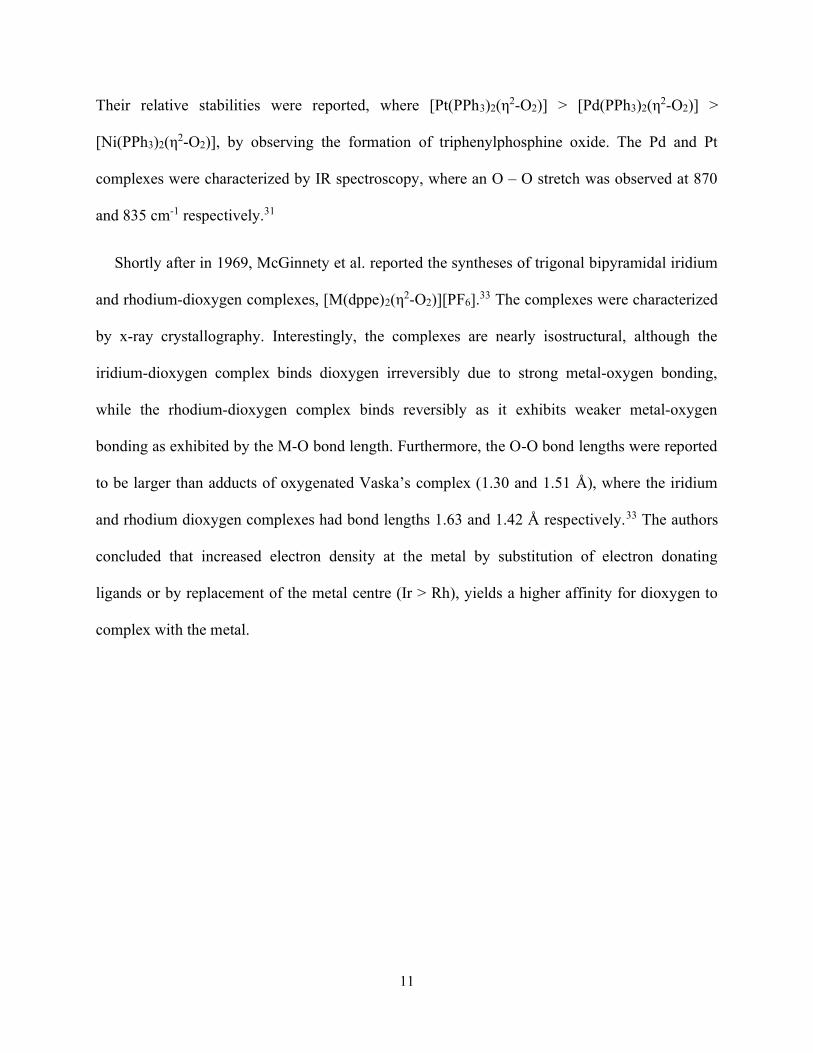
Shortly after in 1969, McGinnety et al. reported the syntheses of trigonal bipyramidal iridium
and rhodium-dioxygen complexes, [M(dppe)2(η2-O2)][PF6].33 The complexes were characterized
by x-ray crystallography. Interestingly, the complexes are nearly isostructural, although the
iridium-dioxygen complex binds dioxygen irreversibly due to strong metal-oxygen bonding,
while the rhodium-dioxygen complex binds reversibly as it exhibits weaker metal-oxygen
bonding as exhibited by the M-O bond length. Furthermore, the O-O bond lengths were reported
to be larger than adducts of oxygenated Vaska’s complex (1.30 and 1.51 Å), where the iridium
and rhodium dioxygen complexes had bond lengths 1.63 and 1.42 Å respectively.33 The authors
concluded that increased electron density at the metal by substitution of electron donating
ligands or by replacement of the metal centre (Ir > Rh), yields a higher affinity for dioxygen to
complex with the metal.
12
Figure 1.7. Structure of [Rh(dppe)2(η2-O2)][PF6] (not including counterion) synthesized by McGinnety et al..33
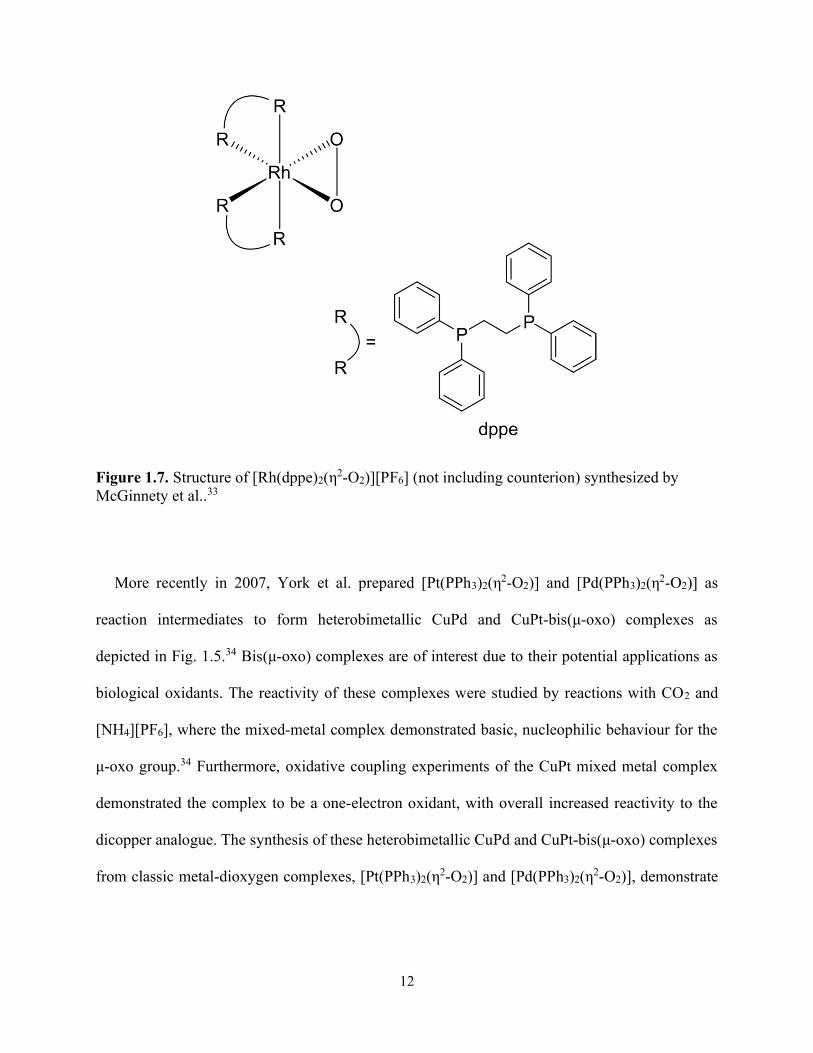
More recently in 2007, York et al. prepared [Pt(PPh3)2(η2-O2)] and [Pd(PPh3)2(η2-O2)] as
reaction intermediates to form heterobimetallic CuPd and CuPt-bis(μ-oxo) complexes as
depicted in Fig. 1.5.34 Bis(μ-oxo) complexes are of interest due to their potential applications as
biological oxidants. The reactivity of these complexes were studied by reactions with CO2 and
[NH4][PF6], where the mixed-metal complex demonstrated basic, nucleophilic behaviour for the
μ-oxo group.34 Furthermore, oxidative coupling experiments of the CuPt mixed metal complex
demonstrated the complex to be a one-electron oxidant, with overall increased reactivity to the
dicopper analogue. The synthesis of these heterobimetallic CuPd and CuPt-bis(μ-oxo) complexes
from classic metal-dioxygen complexes, [Pt(PPh3)2(η2-O2)] and [Pd(PPh3)2(η2-O2)], demonstrate
13
the biological potential of these complexes and the variety in chemical properties of
heterobimetallic bis(μ-oxo) complexes.
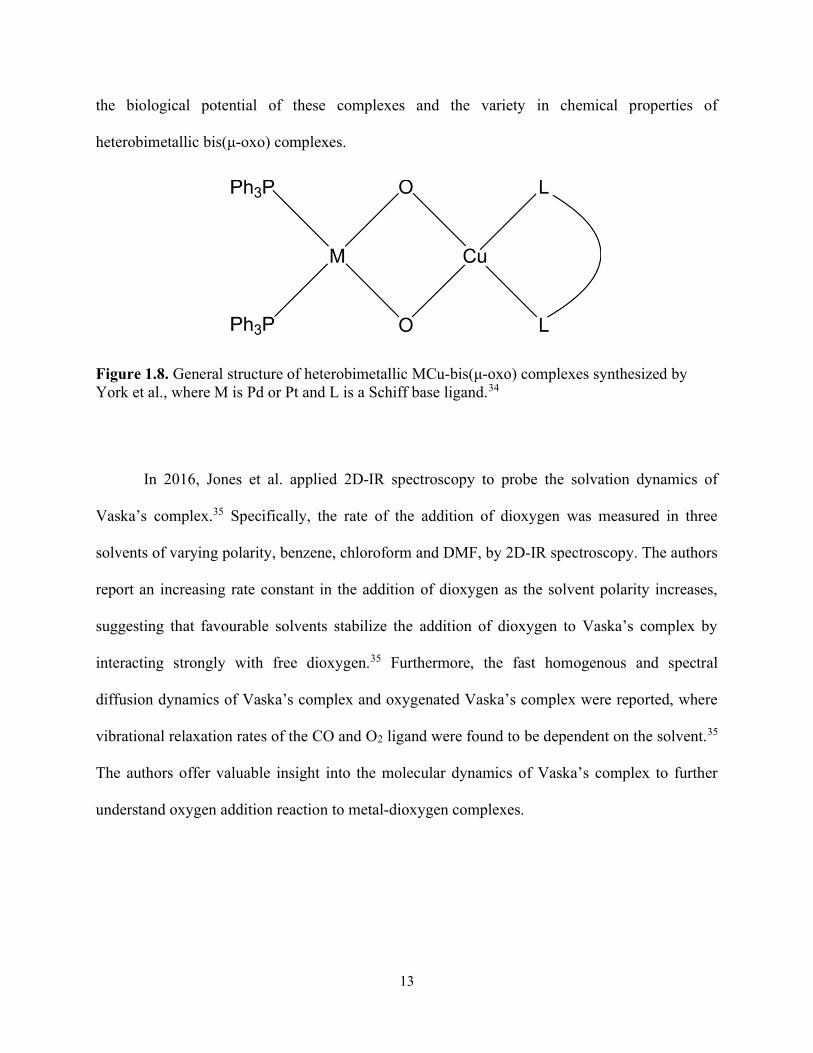
Figure 1.8. General structure of heterobimetallic MCu-bis(μ-oxo) complexes synthesized by York et al., where M is Pd or Pt and L is a Schiff base ligand.34
In 2016, Jones et al. applied 2D-IR spectroscopy to probe the solvation dynamics of
Vaska’s complex.35 Specifically, the rate of the addition of dioxygen was measured in three
solvents of varying polarity, benzene, chloroform and DMF, by 2D-IR spectroscopy. The authors
report an increasing rate constant in the addition of dioxygen as the solvent polarity increases,
suggesting that favourable solvents stabilize the addition of dioxygen to Vaska’s complex by
interacting strongly with free dioxygen.35 Furthermore, the fast homogenous and spectral
diffusion dynamics of Vaska’s complex and oxygenated Vaska’s complex were reported, where
vibrational relaxation rates of the CO and O2 ligand were found to be dependent on the solvent.35
The authors offer valuable insight into the molecular dynamics of Vaska’s complex to further
understand oxygen addition reaction to metal-dioxygen complexes.
14
1.1.4 Biological oxygen carrying systems
Pauling and Coryell published the first investigation of the structure of oxygen binding
proteins, hemoglobin and myoglobin in 1936, in which the authors proposed a diamagnetic, bent,
end-on Fe(II)O2 bond.36 However, in 1956, Griffith proposed a peroxide-like FeO2 moiety for the
metalloproteins.37 In 1980 and 1983, the structure proposed by Pauling and Coryell was
confirmed by elucidation of the crystal structures of oxymyoglobin and oxyhemoglobin by
Phillips and Simon, and by Shaanan, respectively.38, 39 Understanding the properties of oxygen
carrying metalloproteins has been a subject of great interest in the decades since. Once again,
there are countless studies of the metalloproteins, where a great deal of research has gone into
the reversible binding kinetics of the dioxygen ligand (autooxidation) and understanding the
detailed electronic structure of the FeO2 moiety.
As early as 1935, the autooxidation of myoglobin was observed and has been extensively
studied to the present day.40 Shikama reported that the rate of autooxidation is dependent on the
nature of the metalloprotein itself; bovine, sperm whale, human and equine myoglobin all have
very different autooxidation rates ranging from 0.11 h-1 (t1/2 = 6.3 h) to 0.50 x 10⁻² h-1 (t1/2 =
138.6 h) at a pH of 7.2 at 298 K .41 Furthermore, Shikama et al. reported that the autooxidation
rate is highly dependent on pH, where myoglobin is most stable against autooxidation at pH
8.5.42 Moreover, several reports by Arcon et al., Snyder and Ayres, and Satoh and Shikama have
emphasized the fact that the autooxidation rate is also dependent on temperature, where lower
temperatures can reduce the rate of autooxidation to rates as low as 0.12 x 10⁻³ h-1 (t1/2 = 240
days) at 273 K. 41, 43-45 Snyder and Ayres also reported that the rate of autooxidation is dependent
on the amount of reducing agent. In this study, sodium dithionite is used to reduce metmyoglobin
15
to synthesize oxymyoglobin, where the authors report that the autooxidation rate increases
linearly with amount of reducing agent.44
Since the first proposal of the electronic structure of the FeO2 moiety in heme-proteins by
Pauling and Coryell,36 there has been much debate over the electronic structure of this moiety.
Specifically, Pauling and Coryell proposed the electronic structure FeO2 where both the iron
centre and complexed dioxygen exist in a singlet state (S = 0), thus proposing a low-spin d6
ferrous iron(II) centre.36 In 1956, Weiss proposed a model where both the iron centre and
complexed dioxygen are in a doublet state (S = ½), thus proposing a low-spin d5 ferric iron(III)
centre and superoxide-like dioxygen complex (O2-).46 Furthermore, McClure,47 Harcourt,48, 49
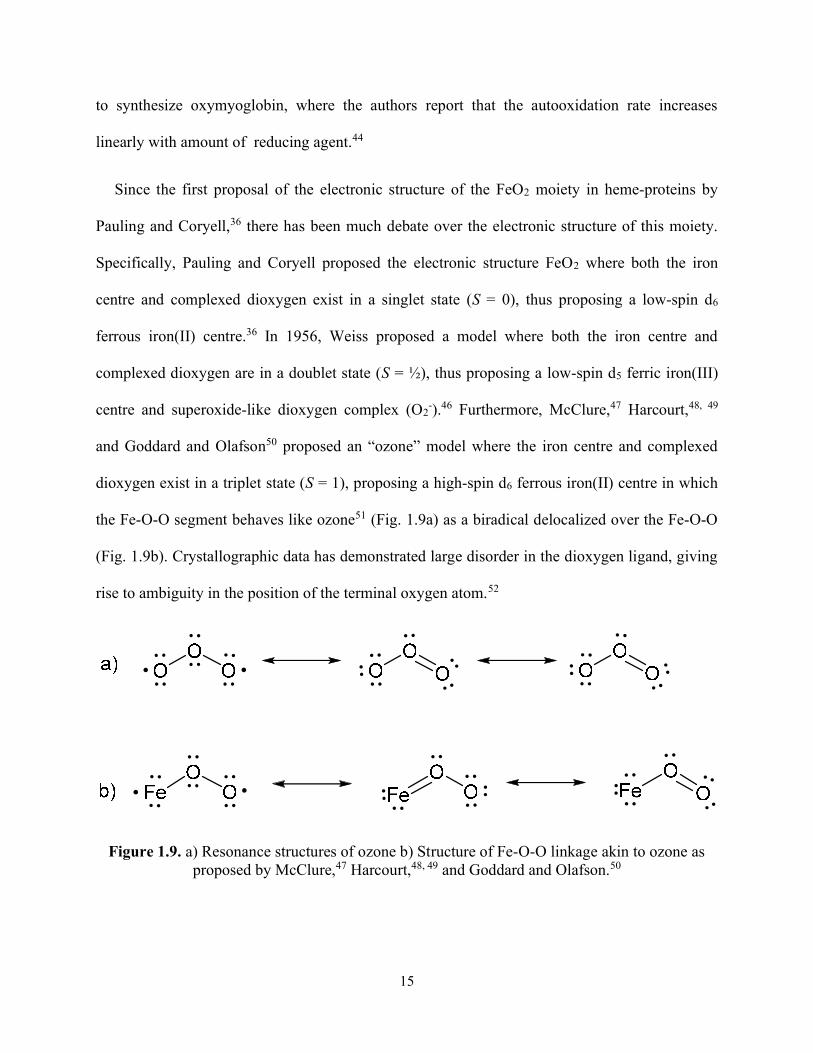
and Goddard and Olafson50 proposed an “ozone” model where the iron centre and complexed
dioxygen exist in a triplet state (S = 1), proposing a high-spin d6 ferrous iron(II) centre in which
the Fe-O-O segment behaves like ozone51 (Fig. 1.9a) as a biradical delocalized over the Fe-O-O
(Fig. 1.9b). Crystallographic data has demonstrated large disorder in the dioxygen ligand, giving
rise to ambiguity in the position of the terminal oxygen atom.52
Figure 1.9. a) Resonance structures of ozone b) Structure of Fe-O-O linkage akin to ozone as proposed by McClure,47 Harcourt,48, 49 and Goddard and Olafson.50
16
1.2 Review of 17O NMR studies of metal-dioxygen complexes
Nuclear magnetic resonance (NMR) is a phenomenon associated with atomic nuclei that
possess a non-zero spin. Under a constant magnetic field, nuclear spins can absorb characteristic
radio-wave frequencies.53 Scientists have taken advantage of this phenomenon to structurally
characterize and probe physical characteristics of molecules. Nuclei commonly found in organic
and biological molecules such as H, C, N, P and O are widely studied in NMR spectroscopy with
the exception of oxygen. The only NMR-active stable oxygen isotope is 17O, which has two
major unfavourable characteristics for the acquisition of NMR spectroscopic data. First, the
observation of 17O NMR signals requires the enrichment/labelling of 17O isotopes by synthesis
due to its exceedingly low natural abundance (0.037%). Second, 17O has a nuclear spin quantum
number (I) of 5/2. Nuclei with I > 1/2 often experience nuclear electric quadrupolar interactions
which are significantly larger than other nuclear spin interactions like magnetic shielding, dipole-
dipole and indirect spin-spin interactions, leading to broad signals in their NMR spectra.54
However, with the development of higher field spectrometers and experiments which can
mitigate the line broadening effects from nuclear quadrupolar interactions, 17O NMR
spectroscopy has been proven as a sensitive probe for measuring 17O NMR quadrupolar coupling
(QC) and chemical shift (CS) tensors of hydrogen bonding and metal-ligand interactions.55
Furthermore, studies of biological molecules using solution and solid-state 17O NMR have
expanded significantly in recent years.54-61
A vast number of 17O NMR studies of organic compounds have been conducted, including
investigations of organic peroxides by Lu et al. and Zhang et al..62, 63 In the study by Zhang et al.,
the authors investigate lithium-peroxide batteries and the effect on their lifecycle in relation to
CO2.63 Investigations of drug molecules using 17O NMR have been conducted by Kong et al. in
17
2015 and 2017.64, 65 In particular, the authors acquired 17O NMR spectra for two Pt(II)
coordination complexes commonly used as anticancer drugs, Carboplatin and Oxyplatin,64 and
the anticoagulant, warfarin.65 Furthermore, metal-ligand interactions have been studied by 17O
NMR in a new class of hybrid materials – metal organic frameworks (MOFs). In 2014, Wang et
al. reported the CO2 ligand dynamics of MOFs CPO-27-Mg and CPO-27-Zn with experimental
and theoretical calculation of 17O NMR tensors with static solid-state spectra and variable
temperature experiments.66 Carboxylate and hydroxyl linkages in MOFs, Al MIL-53 and Ga
MIL-53 have been studied more recently by Bignami et al., where changes in the local structure
of open and closed pore forms of both MOFs and the mixed Al-Ga MIL-53 were observed by
17O MAS, MQMAS and DOR experiments.67 Further studies of Al-MIL-53 by Martins et al. in
2020 and 2021 have demonstrated the remarkable sensitivity of 17O NMR at ultra-high magnetic
fields (35.2 T).68, 69 The authors were able to observe subtle changes and assign all μ2 bridged
hydroxyl and non-equivalent carboxylate sites in all open and closed pore forms of Al-MIL-53.
Furthermore, Kong et al. reported 17O NMR tensors of various paramagnetic coordination
complexes, marking the first 17O NMR study of antiferromagnetically coupled dinuclear
coordination complexes.70 As mentioned earlier, studies of biological molecules using 17O NMR
have expanded significantly in recent years, including studies of two larger proteins (human
serum albumin and ovotransferrin) by 17O quadrupole-central-transition (QCT) NMR conducted
by Zhu et al..71 More recently in 2021, Lin et al. demonstrated specific 17O labelling of amino
acid residues in yeast ubiquitin by recombinant expression with an auxotrophic E. coli strain.72
Another significant advancement was reported most recently by Shen et al., where the authors
were able to specifically label all hydroxyl sites of α-D-glucose where all CS and QC tensors are
obtained, marking the first report of a full characterization of all oxygen functional groups in a
18
carbohydrate.73 A full review of recent studies of 17O NMR, including solid-state, solution state
and labelling techniques are reported by Wu,54 Palmer and Wu,56 and Theodorou et al.,74
respectively.
17O NMR spectroscopy may serve as a useful technique in the characterization of metal-
dioxygen complexes, complementing the established x-ray and vibrational spectroscopic
techniques. Furthermore, 17O solid-state NMR is an attractive technique to probe the physical
properties and further our understanding of the metal-dioxygen bond. Several early attempts to
acquire 17O NMR data of Vaska’s complex and several oxoperoxomolybdenum complexes were
made by Lapidot and Irving,75 and Postel et al.76 respectively. However, neither were able to
observe signals attributed to 17O2. The first observation of 17O2 NMR signals came in 1985 from
Curci et al., when similar 17O-labelled oxoperoxomolybdenum and chromium complexes were
synthesized.77 17O NMR signals attributed to the peroxo ligand were reported at 450 – 458 ppm
and 726 – 772 ppm for the molybdenum and chromium dioxygen complexes respectively.
However, broad 17O NMR signals with line widths up to 3 kHz were observed due to slow
molecular tumbling and exchange with paramagnetic dioxygen.77
In 1986, Lee and Oldfield prepared 17O-labelled samples of two adducts of Vaska’s
complex and [Pt(PPh3)2(η2-O2)].78 17O NMR spectra were acquired at 11.7 T and signals
attributed to the peroxo ligand of [IrCl(CO)(PPh3)2(η2-17O2)], [IrI(CO)(PPh3)2(η2-17O2)] and
[Pt(PPh3)2(η2-17O2)] were reported at 325, 350 and 385 ppm respectively, with again large line
widths of 9 – 10 kHz.78
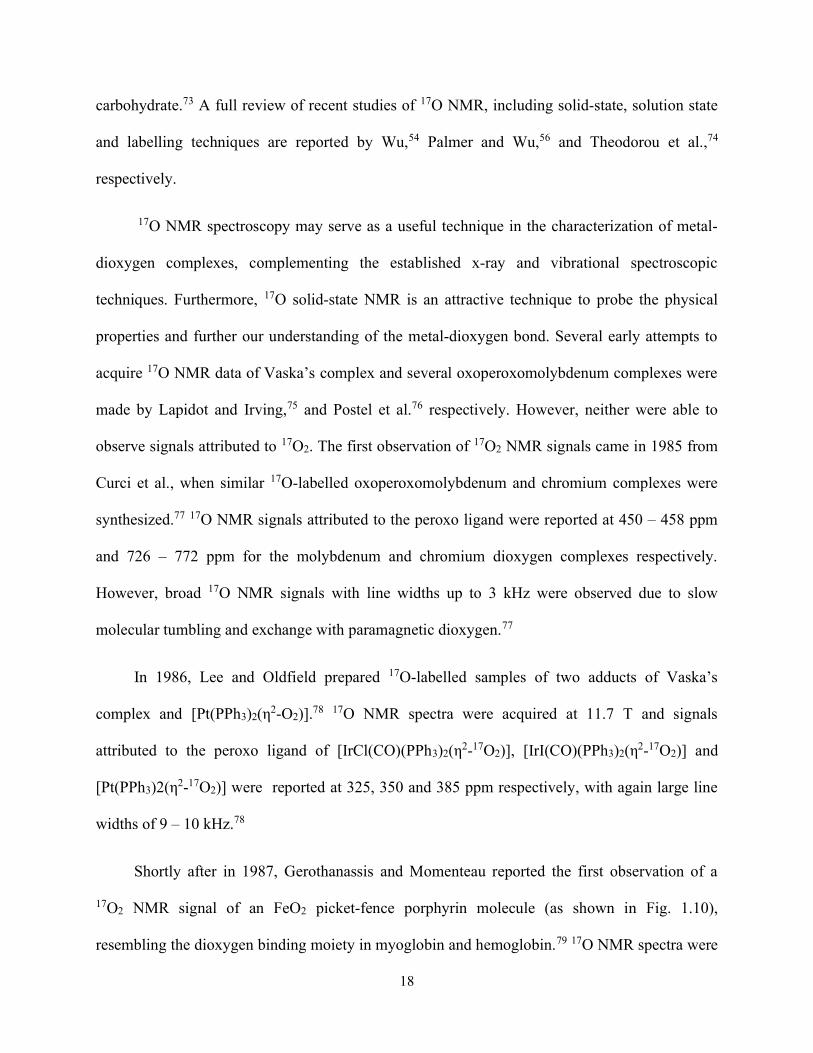
Shortly after in 1987, Gerothanassis and Momenteau reported the first observation of a
17O2 NMR signal of an FeO2 picket-fence porphyrin molecule (as shown in Fig. 1.10),
resembling the dioxygen binding moiety in myoglobin and hemoglobin.79 17O NMR spectra were
19
acquired at 273, 283, 297 and 307 K, where two signals were observed between 1755 and 1760
ppm for the bridging oxygen, and 2484 and 2488 ppm for the terminal oxygen. Interestingly, the
chemical shift of the terminal oxygen was not reported at 273 K, as the line width exceeded 7
kHz, but the linewidth at higher temperatures was between 726 and 733 Hz, which was lower
than the reported linewidth of the signal for the bridging oxygen between 811 and 2017 Hz.
Furthermore, the authors note the similarity in the chemical shift difference between the bridging
and terminal oxygens of the Fe(17O2) complex synthesized (733 ppm) and ozone (566 ppm),80
offering evidence to the ozone model of the FeO2 moiety proposed by McClure,47 Harcourt,48, 49
and Goddard and Olafson50.
Figure 1.10. General structure of picket-fence porphyrin, modelling the FeO2 heme centre of hemoglobin and myoglobin. Figure reproduced from Gerothanassis and Momenteau.79
20
In 1991, Oldfield et al. reported the first solid-state 17O NMR spectra of [17O2]-picket-
fence porphyrin, myoglobin, and hemoglobin.81 Solid-state 17O NMR spectra were acquired at
8.45 T. While the solid-state 17O NMR data of picket-fence porphyrin were complementary to
the previous work by Gerothanassis and Momenteau,79 the 17O NMR signals from [17O2]-
myoglobin and [17O2]-hemoglobin were too broad to be accurately analyzed. To date, solid-state
17O NMR parameters in [17O2]-myoglobin and [17O2]-haemoglobin have remained unknown.
In 1992, Gerothanassis et al. investigated the electronic structure of the FeO2 moiety in
picket-fence porphyrin models with or without an axially hindered base, using IR and 17O NMR
spectroscopy.82 The authors reported a downfield shift in the 17O NMR signals of the FeO2
moiety with an axially hindered base, and suggested that this shift is due to an increase in π
character of the O – O bond, which weakens the Fe – O bond and thus lengthens the Fe – O bond
length.82 The authors concluded that 17O NMR can be used as a unique probe in studying
structural differences in hemoprotein models.
In 1996, Reynolds and Butler reported 17O NMR spectra of several peroxo complexes of
V, Mo, W and gauge their reactivities by 17O NMR, electronic and vibrational spectroscopy.83
The authors reported a range of chemical shifts between 363 – 770 ppm, where 17O NMR signals
were observed for V(η2-17O2) complexes between 444 – 660 ppm, Mo(η2-17O2) signals were
observed between 412 – 468 ppm, W(η2-17O2) signals were observed between 346 – 400 ppm
Ti(η2-17O2) signals were observed between 585 – 591 ppm.83 The 17O NMR signals, O – O
stretching frequencies and O – O bond length were then plotted as a function of LMCT energy
and highest electronic transition wavelength (λmax). The authors concluded that the most reactive
metal-peroxo complexes exhibit 17O NMR signals below 600 ppm, O – O stretching below 900
21
cm-1 and λmax below 400 nm, offering insight into the reactivity trends of metal-peroxo
complexes.83
In 2000, Kaupp et al. conducted a density function theory (DFT) computational study of
17O NMR tensors in four picket-fence porphyrin adducts.84 Isotropic chemical shifts and nuclear
quadrupolar coupling constants were calculated for each of the adducts. The computed tensors
provide evidence to the long debated detailed electronic structure of the FeO2 moiety, where the
Weiss model46 in which both the iron centre and complexed dioxygen are in a doublet state (S =
½), was ruled out. However, it is not completely clear which one of the two other models in
which both the iron centre and complexed dioxygen exist in a singlet state (S = 0) (Pauling
model) or triplet state (S = 1) (ozone model) should be preferred. Nonetheless, the authors
concluded that the 17O NMR tensors calculated for FeO2 models more closely resembles those
from the ozone model.84
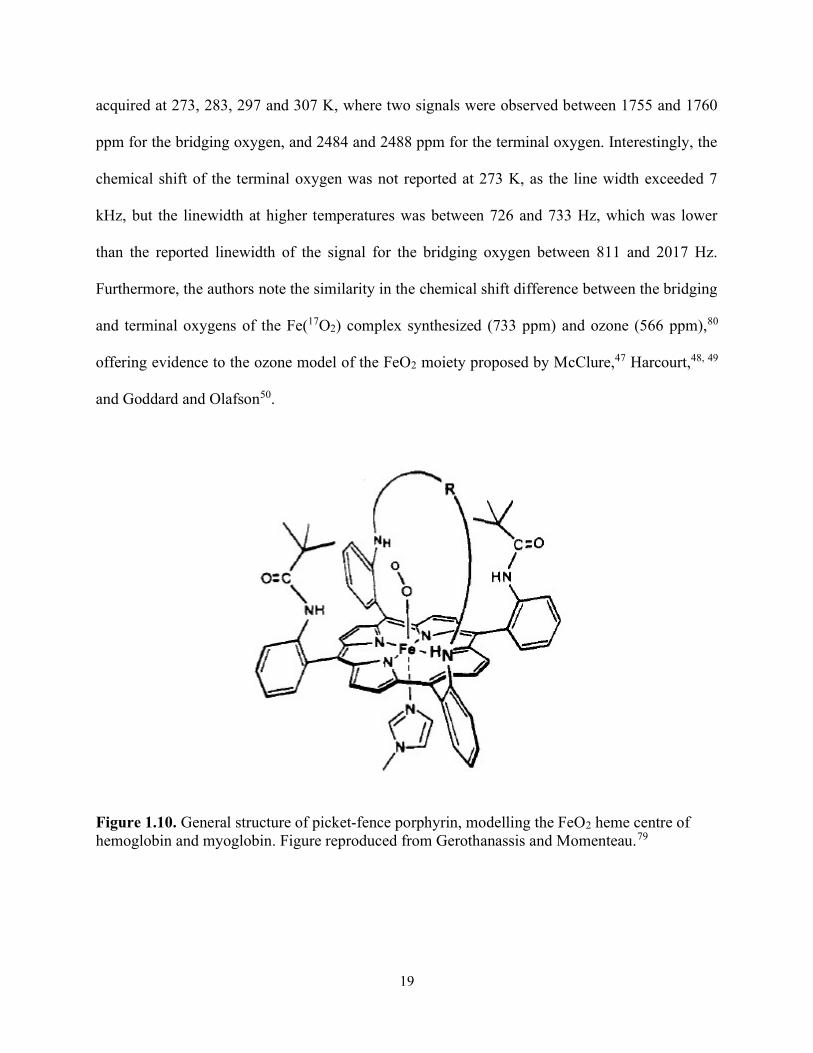
Most recently in 2018, Gupta et al. synthesized and investigated the 17O NMR tensors of
[VO(η2-17O2)(H2O)(C5H3N(COO)2)]∙NH4 (HS003) (Fig. 1.11) by 17O solid-state NMR
spectroscopy and DFT calculations.85 Solid-state spectra were acquired by quantum Carr-Purcell
Meiboom-Gill (QCPMG), 20 and 40 kHz Hahn-echo magic-angle spinning (MAS) experiments.
Chemical shift and nuclear quadrupolar tensors reported were in agreement with DFT
calculations. Furthermore, the authors indicated that the largest component of the chemical shift
tensors is along the V-O bond, therefore, the calculation of these tensors from 17O solid-state
NMR spectroscopy can serve as a sensitive probe for examining the nature of metal-peroxo
complexes in their application as biological oxidants.85
22
V
OH2
17ON
O
O17O
O
O
O
Figure 1.11. Structure of [VO(η2-17O2)(H2O)(C5H3N(COO)2)]- synthesized by Gupta et al..85
1.3 Thesis Objectives
As mentioned earlier, all 17O-labeled metal-dioxygen complexes reported in the literature
were synthesized with 17O-labeled O2(g) as the source of 17O. However, highly 17O-enriched
O2(g) is very expensive (ca. $5000 per Liter at the 70% 17O level). In comparison, 17O-labeled
H2O is relatively less costly (still expensive at $500 per gram at the 40% 17O level) and easy to
handle. In this thesis, we employed a novel synthesis for the 17O labelling of metal-dioxygen
complexes using water-electrolysis of H217O to produce 17O2(g). Furthermore, the success of the
syntheses was contingent on the construction of an appropriate water electrolysis device, taking
into consideration the cost of materials, ease of construction and rate of gas production. To
complement existing characterization techniques of metal-dioxygen complexes such as
vibrational spectroscopy and X-ray diffraction, 17O NMR spectroscopy was explored as a probe
for characterizing the nature of superoxo, peroxo and μ-peroxo ligands, in which new 17O NMR
data are reported.

23
1.4 Organization of Thesis
This chapter provides a background on the interaction of dioxygen in metal coordination
complexes and the potential for studies of these interactions by 17O NMR spectroscopy. We first
describe the electronic structure of molecular oxygen, followed by a summary of the scope of
research into metal-dioxygen complexes and their potential applications. The major breadth of
research focuses on cobalt(III)-dioxygen complexes with Schiff base or nitrogen containing
ligands, group 8 – 10 metal coordination complexes and biological oxygen carriers. A
background of the 17O NMR research into metal-dioxygen complexes is then provided, where we
propose a novel method of synthesizing these complexes by H217O electrolysis. In Chapter 2, the
development and design considerations of the water electrolysis device are discussed, followed
by the synthetic and spectroscopic methods of each metal-dioxygen complex studied in this
thesis. In Chapter 3, the characterization by various spectroscopic techniques such as vibrational
and UV-Vis spectroscopies, and 1D and 2D NMR experiments of metal-dioxygen complexes are
presented. We also report solution 17O NMR data for the metal-dioxygen complexes studied. We
also report preliminary results from a study of oxymyoglobin. In Chapter 4, a summary of the
results and potential future directions are presented.
24
2 Device development and synthesis
2.1 Design of water electrolysis apparatus
Typical methods for 17O labelling the dioxygen ligand in metal-dioxygen complexes have
employed prepared 17O2 gas or hydrogen peroxide H217O2. However, both 17O2(g) and H2
17O2 are
exceedingly expensive. In this thesis, we propose utilizing the electrolysis of 17O labelled water
(H217O) to generate 17O2(g) which is then used for synthesis of oxygen carrying coordination
complexes.
Electrolysis cells involve the transfer of ions through solution/solids and the transfer of
electrons from a solid phase (electrodes) to decompose or “split” molecules by passing a direct
current through electrodes.86, 87 Therefore, the electrolysis of water is the decomposition of water
by direct current into hydrogen and oxygen gases. This can be viewed as the following overall
reactions (Equation [2]) and half reactions (Equations [3] and [4]) in pure water:
H2O(l)⟶ H2(g) + 12 O2(g) [2]
red: 2H+(aq) + 2e-⟶ H2(g) [3]
ox: H2O(l)⟶ 12 O2(g)+ 2H+(aq)+2e- [4]
The electrolysis of water was first observed over 230 years ago by Deiman and Paets van
Troostwijk and has been of great interest since.88 Many are interested in water electrolysis to
utilize H2 as a green, sustainable energy source,89 and much effort has gone into improving the
efficiency of water electrolysis techniques and apparatus. In this work, we wish to utilize the
often-neglected gas in this technique, O2, to synthesize 17O2 labelled metal-dioxygen complexes.
25
2.1.1 Design considerations
When designing the water electrolysis apparatus to produce 17O2 gas, two major factors
were taken into consideration: the water electrolysis technique and size of the apparatus. Many
other factors like materials used, metal catalyst (electrode), electrode size and shape were also
considered. There are two widely used techniques for water electrolysis: alkaline water
electrolysis and, proton exchange membrane (PEM) water electrolysis. Other techniques such as
high-pressure, high-temperature, steam and supercritical water electrolysis were not considered
as the practical setups and addition of variables (i.e., heat, pressure, etc.) were too complicated.
An ideal apparatus for the purposes of this project must be simple, easy-to-use with a small
margin for error in the experimental setup, because the 17O-labeled water is very expensive.
Alkaline water electrolysis is a technique in which two metal electrodes are placed in a
basic (alkaline) electrolyte solution to produce molecular hydrogen and oxygen, as shown in Fig.
2.1. Typically, an electrolyte of NaOH or KOH is used in a 25 – 30% concentration by weight
(4.5 – 5.4 M) and the electrolysis apparatus is operated at relatively low temperatures between 30
– 80 ⁰C.90-92
26
Figure 2.1. Basic schematic of alkaline water electrolysis, where two metal electrodes (typically Ni) in circuit have a minimum applied potential difference of +1.23 V in a 4.5 - 5.4 M electrolyte solution (KOH) to produce molecular oxygen at the cathode and molecular hydrogen at the anode.
More specifically, four moles of hydroxide ions are oxidized to produce one mole of
molecular oxygen and two moles of liquid water at the anode, while two moles of liquid water
are reduced to one mole of molecular hydrogen and two moles of hydroxide ions at the cathode.
This is represented by the reduced half-reactions below (Equations [5] and [6]):
Anode: 2 OH-(aq)→ 12 O2(g)+ H2O(l) + 2e- [5]
Cathode: 2 H2O(l) + 2 e-→ H2(g)+ 2 OH-(aq) [6]
27
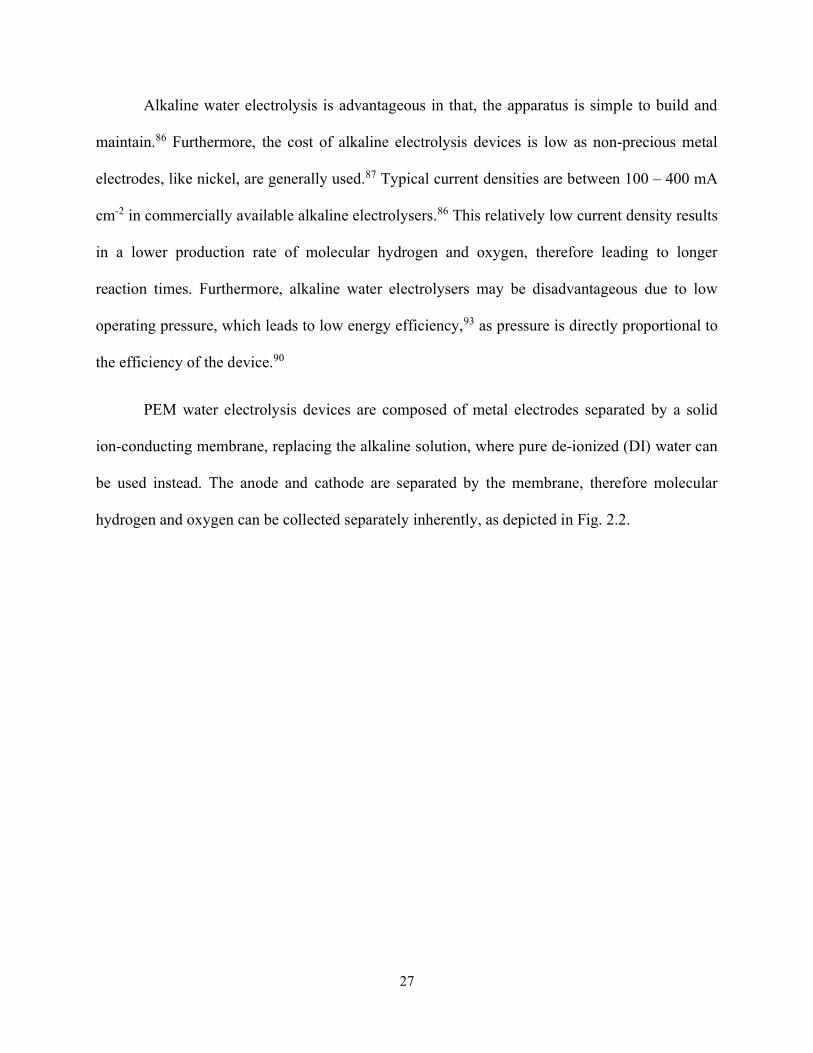
Alkaline water electrolysis is advantageous in that, the apparatus is simple to build and
maintain.86 Furthermore, the cost of alkaline electrolysis devices is low as non-precious metal
electrodes, like nickel, are generally used.87 Typical current densities are between 100 – 400 mA
cm-2 in commercially available alkaline electrolysers.86 This relatively low current density results
in a lower production rate of molecular hydrogen and oxygen, therefore leading to longer
reaction times. Furthermore, alkaline water electrolysers may be disadvantageous due to low
operating pressure, which leads to low energy efficiency,93 as pressure is directly proportional to
the efficiency of the device.90
PEM water electrolysis devices are composed of metal electrodes separated by a solid
ion-conducting membrane, replacing the alkaline solution, where pure de-ionized (DI) water can
be used instead. The anode and cathode are separated by the membrane, therefore molecular
hydrogen and oxygen can be collected separately inherently, as depicted in Fig. 2.2.
28
Figure 2.2. Basic schematic of PEM water electrolysis, where two metal electrodes (Pt) in circuit have a minimum applied potential difference of +1.23 V in pure water separated by an ion-conducting PEM membrane produce molecular oxygen at the anode. The H+ ions produced at the anode travel through the PEM membrane to produce molecular hydrogen at the cathode.
More specifically, DI water is inserted into the anode side of the device and protons (H+)
are pulled through the membrane when an electric field is applied to form molecular hydrogen.86
At the anode, two moles of water are reduced to produce 4 moles of H+ ions and one mole of
molecular oxygen. While four moles of H+ ions are oxidized to produce two moles of molecular
hydrogen. This is represented by the reduced half-reactions below (Equations [7] and [8]):
Anode: H2O(l) → 2 H+(aq)+ 12 O2(g) + 2e- [7]
Cathode: 2 H+ + 2 e- → H2(g) [8]
29
PEM water electrolysis is a technique that was developed to improve upon alkaline water
electrolysis,89, 94-96 offering several advantages. PEM electrolysis devices operate at a higher
current density than alkaline water electrolysis devices, > 2 A cm-2,86, 93, 97-99 therefore a PEM
electrolysis device for the purposes of this project would have much shorter reaction times.
Furthermore, PEM electrolysis operates at higher pressures, yielding a higher efficiency and
ultrapure molecular hydrogen and oxygen.97-100 But, PEM electrolysers are often more expensive
to build, operate and maintain because the use of precious noble metals as electrodes such as Pt,
Pd, Ir or Ru are required, and many of the solid ion-conducting polymers are made from
expensive perfluorinated polymers.87, 93, 98, 99 Lastly, there are also limited commercially
available PEM electrolysers available when comparing to the long established alkaline water
electrolysers.87, 93
Another factor that is of high importance for this project is the size of the water
electrolysis device. As stated in Chapter 1.2, the observation of 17O NMR signals requires the
enrichment/labelling of 17O isotopes by synthesis due to its exceedingly low natural abundance
(0.037%). Many syntheses to introduce a 17O label involve the use of 17O-enriched water, where
in this case, H217O was electrolyzed into H2 and 17O2. This low natural abundance results in a
high-cost of 17O-enriched water (~$500 USD/g, 35 – 40% enriched), thus it is not possible to use
large quantities of H217O without incurring an extremely high cost for the project. Therefore, it
was necessary to build a small water electrolysis device, capable of holding 3 – 5 mL (~3 – 5 g)
of the enriched water to keep project costs reasonable.
Despite the several advantages that PEM water electrolysis has over alkaline water
electrolysis, we decided to design an alkaline water electrolysis device for this project primarily
due to the simplicity of design and low building/maintenance cost. Furthermore, it was also
30
decided the electrolyte (KOH) concentration should be low relative to typical reported
concentrations (4.5 – 5.4 M) as to not significantly dilute the enrichment level of H217O.
Therefore, a 0.5 M KOH solution would be used for electrolysis in this project.
2.1.2 Design process
To test the concept of utilizing O2 from water electrolysis to synthesize metal-dioxygen
complexes, the first electrolysis device built was extremely simple and tested with 0.5 M KOH
solution – there was no attempt initially to separate H2 and O2 vessel, therefore both gases were
allowed to flow into the reaction chamber because it was assumed the metal-dioxygen complexes
studied in this project were inert to H2 (this assumption was later tested and confirmed). The
decision to build an alkaline water electrolysis device and requirement to keep the device small
posed some challenges. Since alkaline water electrolysis devices operate at low pressures,93 and
the size of electrode was limited due to the size constraints of the device, we initially
hypothesized the pressure from electrolysed H2 and O2 would not be high enough to exit and
flow into the reaction chamber, therefore a carrier gas, N2, was used to push H2 and O2 into the
reaction chamber, where O2 would react to form the desirable metal-dioxygen complexes.
The first testing device was built from a 3 mL glass vial with a custom rubber gasket fit
to the cap. The cap had four pinholes drilled into where two coiled copper wire electrodes and
inlet and outlet capillary tubes were inserted to run N2 as a carrier gas to push H2 and O2
produced from electrolysis into the reaction chamber. In the reaction chamber, O2 would react
with the metal-dioxygen complex in solution/suspension by bubbling and H2 and N2 would exit
through an outlet. (Fig. 2.3) The copper wires were then attached to two D batteries (3 V),
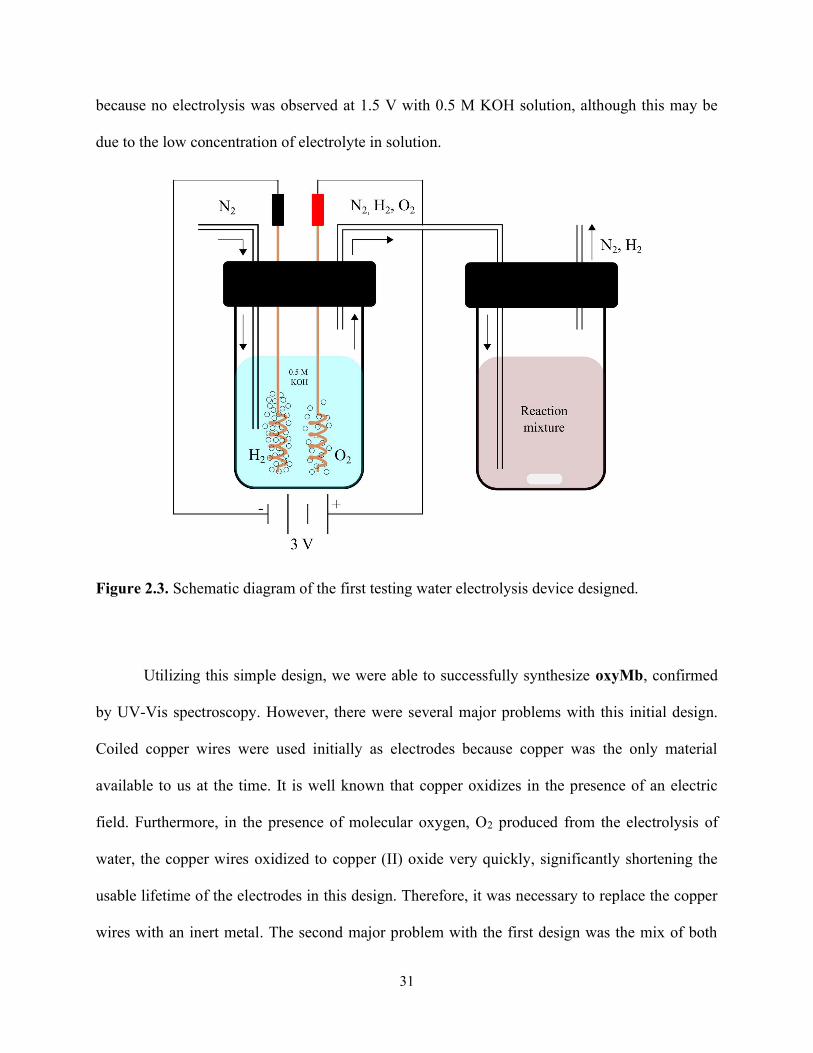
31
because no electrolysis was observed at 1.5 V with 0.5 M KOH solution, although this may be
due to the low concentration of electrolyte in solution.
Figure 2.3. Schematic diagram of the first testing water electrolysis device designed.
Utilizing this simple design, we were able to successfully synthesize oxyMb, confirmed
by UV-Vis spectroscopy. However, there were several major problems with this initial design.
Coiled copper wires were used initially as electrodes because copper was the only material
available to us at the time. It is well known that copper oxidizes in the presence of an electric
field. Furthermore, in the presence of molecular oxygen, O2 produced from the electrolysis of
water, the copper wires oxidized to copper (II) oxide very quickly, significantly shortening the
usable lifetime of the electrodes in this design. Therefore, it was necessary to replace the copper
wires with an inert metal. The second major problem with the first design was the mix of both
32
electrolysis products entering the reaction chamber. Although H2 and N2 were inert to the metal-
dioxygen complexes studied in this project, an ideal setup would introduce only O2 into the
reaction chamber, mitigating the impurities present in the system where the reaction is taking
place, although it was thought that at the time the pure O2 produced would not have a high
enough pressure to exit the electrolysis device and flow into the reaction chamber. Therefore, it
was necessary to improve the design to separate H2 and O2 while still using a carrier gas to push
O2 into the reaction chamber. The third major problem with the first design was the placement of
the electrodes. Since the copper wires were fastened to the cap with a fitted gasket, the electrodes
were not fixed and would touch at times when inserting the cap onto the vial to begin electrolysis
which cause the circuit to short. Therefore, it was necessary to improve the design to fix the
electrodes in place to prevent the wires from shorting during an experiment. In the first design,
further problems were observed, although the three problems discussed above were considered
when building the second water electrolysis device.
The second water electrolysis device (as shown in Fig. 2.4) implemented design
improvements to mitigate the problems listed above. The device was built from a 5 mL plastic
tube, where two coiled 0.33 mm platinum(0) wires were fastened and sealed to the bottom of the
tube with epoxy. The wires were covered with two small plastic tubes, fitted and sealed to a
removable rubber cap, to allow for the separation of H2 and O2 and to serve as outlets for the
produced gas. The outlet at the anode producing O2 was fastened with a capillary tube running to
the reaction chamber. To introduce the carrier gas, the inlet spliced and inserted into the
respective outlet tubes at the cathode and anode to have equal pressure carrying H2 and O2 out of
the electrolysis device. Once again, the electrodes were connected to two D batteries (3 V) to
initiate electrolysis.

33
Figure 2.4. Schematic diagram of the second water electrolysis device designed.
While the second electrolysis device used a noble metal, fixing the issue of electrode
lifetime, and was able to separate H2 and O2, there were still several practical issues with the
design. The first being the rate of O2 being produced was too low – reactions could take days to
finish (monitored by UV-Vis spectroscopy with samples of met- and oxyMb). This could be
improved by increasing the concentration of electrolyte, although as discussed above, it would be
undesirable to have too high a concentration of KOH when 17O labelling the studied metal-
dioxygen complexes. Therefore, another practical method to improve the rate of produced O2
34
would be to increase the surface area of the electrodes. Simply, the 0.33 mm Pt wires did not
have a large enough surface area to produce enough O2 to react with the transition metal-
complex starting materials in a reasonable amount of time. Therefore, it was necessary to find
electrodes with a large surface area while considering the size constraints of the device.
Furthermore, it was difficult to obtain an equal pressure of N2 carrier gas in each outlet, often the
pressure flowing into the outlet tube covering the cathode would be greater, which would lead to
the 0.5 M KOH solution flowing completely out of the tube covering the cathode. As stated
previously, an ideal setup would only introduce pure O2 into the reaction chamber, thus
removing the necessity of using a carrier gas. By using electrodes with a large surface enough
area, the rate of O2 produced can increase and therefore the pressure within the headspace of the
outlet tube can increase so the use of a carrier gas is not necessary. Lastly, with the designs of the
first and second electrolysis device, it was not possible to measure and/or store the O2 produced
from electrolysis – the O2 produced flowed directly into the reaction chamber. Since the cost of
H217O is high, an ideal setup would allow the user to store and measure the O2 being produced
from electrolysis, allowing for a more precise, economical setup. Furthermore, reactions that
required anhydrous setups such as the syntheses of [Pt(PPh3)2(η2-O2)] (3) and [Pt(PPh3)2(η2-O2)]
(4) would decompose when allowing the O2 produced from electrolysis to flow directly into the
reaction chamber, since the gas carried water. Therefore, having the ability to store O2 for drying
would be ideal. The remaining issues listed for the second electrolysis device design were
addressed in the final design of the electrolysis apparatus (section 2.1.3).
35
2.1.3 The final design
To allow for the collection, storage, measurement and drying of O2, the production and
collection of O2 were executed independently from the reaction to produce the metal-dioxygen
complexes. To this end, O2 was collected over water (as illustrated in Fig. 2.5) in an
appropriately sized flask and sealed with a rubber stopper to collect and store the necessary
amount of O2 required for a reaction. When performing reactions in aqueous media – [(en)2Co(μ-
O2)(μ-OH)Co(en)2]3+ (1a/b), [(NH3)5Co(μ-O2)Co(NH3)5]4+ (2) and oxymyoglobin (oxyMb),
starting materials described in 2.2.1, 2.2.2 were simply injected into the flask were O2 was
collected and shaken vigorously. When performing reactions in anhydrous media –
[Pt(PPh3)2(η2-O2)] (3) and [Pt(PPh3)2(η2-O2)] (4), the O2 flask was dried in a Drierite moisture
trap overnight, the headspace of the reaction flask was evacuated and pure, dry O2 was
introduced into the reaction flask containing necessary starting materials (Fig. 2.5) described in
2.2.3 and 2.2.4.
In the final design of the water electrolysis device, to address the O2 production issue, two
3 x 18 mm stainless steel bolts, placed 12.5 mm apart were fastened and sealed to the bottom of a
plastic 5 mL container. The threaded bolts allowed for a significantly larger surface area, while
the use of stainless steel is resistant to corrosion allowing for an adequate electrode lifetime. The
O2 production was large enough to remove the use of N2 as a carrier gas, where the rate was
calculated to be ~15 mL/hr (~6.1 x 10⁻⁴ mol O2/hr). The remainder of the design was similar with
the exception that the outlet at the anode ran through a tube running to an appropriately sized
flask to collect the produced O2 over water and an AC to DC converter (3 V) was used so that
electrolysis can run continuously (Fig. 2.5).
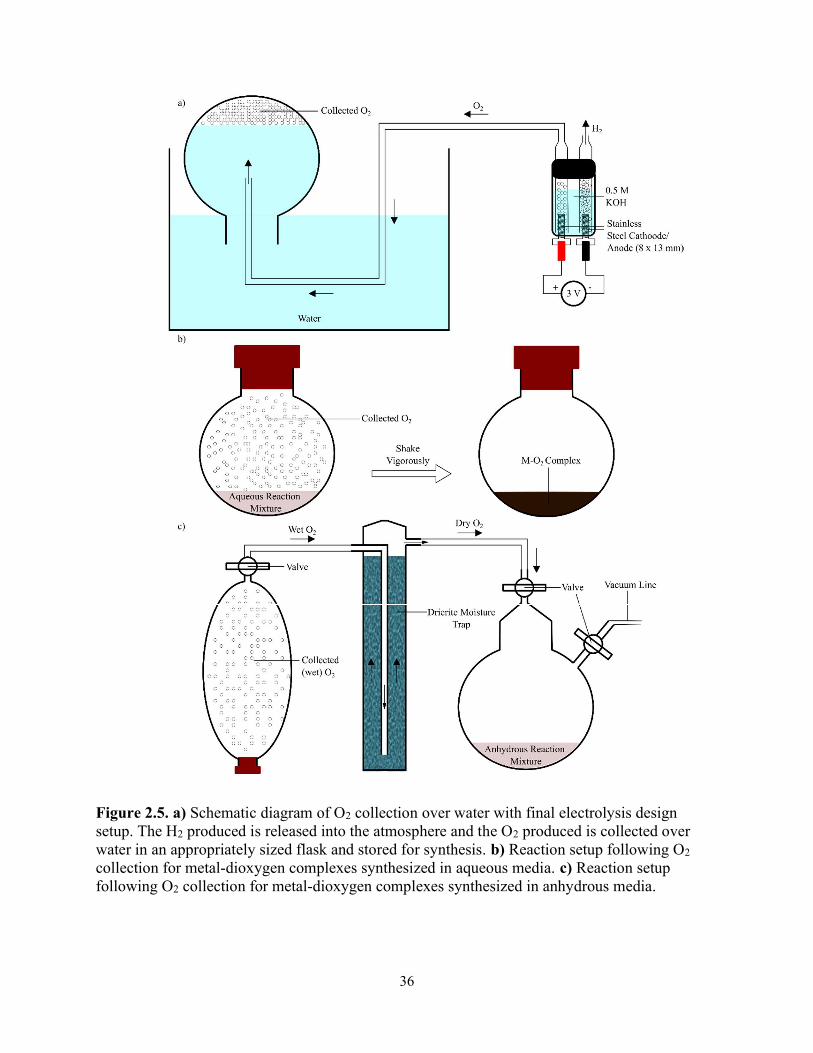
36
Figure 2.5. a) Schematic diagram of O2 collection over water with final electrolysis design setup. The H2 produced is released into the atmosphere and the O2 produced is collected over water in an appropriately sized flask and stored for synthesis. b) Reaction setup following O2 collection for metal-dioxygen complexes synthesized in aqueous media. c) Reaction setup following O2 collection for metal-dioxygen complexes synthesized in anhydrous media.

37
2.2 Syntheses of metal-dioxygen complexes
The nature and purity of the metal-dioxygen complexes studied were characterized by
vibrational spectroscopy (1 – 4), 1H NMR spectroscopy (1), 31P NMR spectroscopy (3,4) and
UV-Vis spectroscopy (oxyMb) as described in section 2.3, spectral analyses are presented in
Chapter 3.
2.2.1 Synthesis of μ-peroxo-μ-hydroxo-bis[bis(ethylenediamine)cobalt(III)] (1)
[(en)2Co(μ-O2)(μ-OH)Co(en)2]3+ (1a)
(1a) was synthesized using the previously reported literature methods.24, 101-103 A total of 200 mg
of Co(ClO4)∙6H2O (5.5 x 10⁻⁴ mol) were dissolved in 5 mL of DI water (0.11 M), to which 0.9
mL of ethylenediamine (en) (1.4 x 10⁻³ mol) was added under stirring. The solution was then
bubbled with a stream of air for 17 hours yielding a dark brown solution. After the reaction, the
solution was evaporated off with nitrogen and recrystallized from 5 M NaClO4(aq) and left at 4
⁰C between two and four days. Crystals were then washed with cold 5 M NaClO4(aq) under
vacuum on a fritted filter, yielding black, shiny crystals (42 % yield). *Note: perchlorate salts of
metal complexes with organic ligands are explosive, and therefore should not be heated
especially in the presence of organic solvents.
[(en)2Co(μ-17O2)(μ-OH)Co(en)2] 3+ (1b)
17O2(g) was collected over water in a 25 mL round-bottom flask (1.03 x 10⁻³ mol) by H217O
(39.3% enriched) electrolysis (0.5 M KOH) and sealed with a rubber septum stopper (as
described in Section 2.1). To the sealed flask, 5 mL of 0.11 M aqueous solution of Co(ClO4)∙6H-
38
2O (5.5 x 10⁻⁴ mol) and 0.90 mL of ethylenediamine (en) (1.4 x 10⁻³ mol) were added separately
with a syringe through the rubber septum. The mixed solution was then shaken vigorously for 20
minutes, yielding a dark brown solution. The sealed flask was then left overnight at 4 ⁰C to
equilibrate. The solution was then evaporated off with N2 and recrystallized from 5 M
NaClO4(aq) and left at 4 ⁰C for four days. Crystals were then collected under vacuum on a fritted
filter and washed with cold 5 M NaClO4(aq), yielding black, shiny crystals (35 % yield). *Note:
perchlorate salts of metal complexes with organic ligands are explosive, and therefore should not
be heated especially in the presence of organic solvents.
[(en)2Co(μ-O2)(μ-17OH)Co(en)2] 3+ (1c)
A total of 100 mg (4.2 x 10⁻⁴ mol) of 1a were dissolved in 7.5 mL of deuterated acetonitrile
under stirring. Then 0.10 mL of H217O (70.0% enriched) was added to the solution and stirred for
five days. The 17O enrichment was monitored by 17O NMR over four days. After five days, the
solvent was evaporated off by N2 and the solid residue was washed with absolute ethanol three
times. The solids were redissolved in 5 mL of deuterated acetonitrile, followed by evaporation of
the solvent and washing with absolute ethanol. This ensured that no residual 17O-labeled H2O
was left in the solid sample.
2.2.2 Synthesis of μ-peroxo-bis[pentamminecobalt(III)] (2)
[(NH3)5Co(μ-O2)Co(NH3)5]4+ (2a)
2a was synthesized following the previously reported literature methods.23, 104-107 A 1.7 M
aqueous solution of Co(SO4)∙7H2O (8.5 x 10⁻³ mol) was prepared and chilled in an ice-bath. To
the chilled solution, 11.5 mL of cold 15 M aqueous ammonia (0.49 mol) was added. The solution
39
was kept at 0 ⁰C and bubbled with a gentle stream of air for four hours, yielding black crystals.
The crystals were collected under vacuum on a fritted filter and washed with cold 7 M aqueous
ammonia, absolute ethanol, and anhydrous diethyl ether until dry. The mother liquor was saved
and stored at 4 ⁰C for four to five days, yielding more black crystals, which were also collected
and washed in the same manner as mentioned above (30 % yield).
[(NH3)5Co(μ-17O2)Co(NH3)5]4+ (2b)
2b was synthesized by a method adapted from Rohm and Nyman.108 17O2(g) was collected over
water in a 25 mL round-bottom flask (1.03 x 10⁻³ mol) by H217O (39.3% enriched) electrolysis
(0.5 M KOH) and sealed with a rubber septum stopper (as described in Section 2.1). To the
sealed flask, a cold 1.0 M aqueous solution of Co(SO4)∙7H2O (1.25 x 10⁻³ mol), 0.50 mL of cold
1.0 M ammonium sulfate (5.0 x 10⁻⁴ mol) and 1.25 mL of cold 15 M aqueous ammonia (1.9 x 10-
2 mol) were added and shaken vigorously for 10 minutes, yielding a dark brown solution. The
solution was left at 0 ⁰C overnight to crystallize, and the crystals were collected the following
day under vacuum on a fritted filter and washed twice with cold 7 M aqueous ammonia,
anhydrous diethyl ether and once with absolute ethanol, yielding black crystals (46 % yield).
2.2.3 Synthesis of bis(triphenylphosphine)oxygenoplatinum(II) (3)
[Pt(PPh3)2(η2-O2)] (3a)
3a was synthesized using methods similar to previous reported literature.31, 32, 34 100 mg of
Pt0(PPh3)4 (8.3 x 10⁻⁵ mol) was suspended in 10 mL of degassed, anhydrous diethyl ether in a
two-necked round bottom flask under N2. The headspace of the flask was evacuated and pure,
dry O2(g) was introduced into the flask collected from H2O electrolysis (0.5 M KOH, 3 V)
40
oxygen collection over water and dried on a Drierite filter overnight prior to the experiment (as
described in Section 2.1). The suspension was stirred for 45 minutes, yielding a slight colour
change to the solids (dark yellow/tan). The solvent was then evaporated off by N2 and the solids
were collected and washed with anhydrous diethyl ether (55 % yield).
[Pt(PPh3)2(η2-17O2)] (3b)
3b was synthesized exactly as 3a with the exception that 17O2(g) was collected over water by
H217O (39.3% enriched) electrolysis (0.5 M KOH, 3 V) (58 % yield).
2.2.4 Synthesis of bis(triphenylphosphine)oxygenopalladium(II) (4)
[Pd(PPh3)2(η2-O2)] (4a)
4a was synthesized using methods similar to previous reported literature.31, 32, 34 200 mg of
Pd0(PPh)4 (1.8 x 10⁻⁴ mol) was dissolved in 7 mL of degassed, anhydrous dichloromethane and 5
mL of degassed, anhydrous diethyl ether in a two-necked round bottom flask under N2. The
headspace of the flask was evacuated and pure, dry O2(g) was introduced into the flask collected
from H2O electrolysis (0.5 M KOH, 3 V) oxygen collection over water and dried on a Drierite
filter overnight prior to the experiment (described in 2.1). The reaction mixture was stirred for 20
minutes, yielding a green solution. The solvent was then evaporated off by N2 and the solids
were collected and washed with anhydrous diethyl ether (51 % yield).
[Pd(PPh3)2(η2-17O2)] (4b)
4b was synthesized exactly as 4a with the exception that 17O2(g) was collected over water by
H217O (39.3% enriched) electrolysis (0.5 M KOH, 3 V) (92 % yield).
41
2.2.5 Synthesis of oxymyoglobin
Preparation of oxymyoglobin (oxyMb) in aqueous solution. Met-myoglobin (metMb) from
equine skeletal muscle (Sigma-Aldrich) was dissolved in 0.05 M sodium phosphate buffer (pH
7.0) at 2 mg/mL. The aqueous solution of metMb was then reduced with a molar excess of
sodium dithionite, followed by bubbling air through the solution for 90 minutes.
Crystallization of oxymyoglobin: (oxyMb). Methods of preparing myoglobin crystals41, 44, 45, 81,
109, 110 were screened to explore crystal growth, quality, and size. A stock solution of
metmyoglobin (15 mg/mL) was prepared by dissolving myoglobin from equine skeletal muscle
(Sigma-Aldrich) in 0.05 M Tris-HCl buffer and 0.5 mM EDTA from pH 5.75, 6.5, 8.0 and 8.5
and saturated ammonium sulfate solutions of 50%, 65%, 75%, 85% and 100% at room
temperature. Best crystals grew from 75% saturated solution at pH 6.5 after one to two days.
MetMb crystals were then extracted in suspended in a 0.05 M Tris-HCl buffer (pH 8.5) with 75%
ammonium sulfate saturation to reduce autoxidation in storage. MetMb crystals were then
reduced with a molar excess of sodium dithionite. After bubbling oxygen/air for 90 minutes,
crystalline oxyMb was obtained.
2.3 Spectroscopic methods
2.3.1 Infrared spectroscopy
All IR spectra were acquired on a Bruker ALPHA FT-IR spectrometer, where 1 – 2 mg of solids
were dispersed into 10 mg of KBr and pressed into a pellet using a small hydraulic press.
42
2.3.2 Raman spectroscopy
All Raman spectra were acquired on a Avantes AvaSpec-ULS-TEC Raman spectrometer with a
785 nm output laser. The focal length of the laser was calibrated by pressing a small amount of
KNO3 on a glass slide on a height adjustable slide. Following sample calibration, 1 – 2 mg of
solid sample was pressed onto a glass slide and placed in the path of the laser with integration
times ranging from 30 – 60 seconds.
2.3.3 UV-Vis spectroscopy
All UV-Vis measurements were acquired on a nitrogen purged (5 minutes) JASCO CD
spectrometer with a 1 cm quartz crystal cuvette with a spectral window on 200 – 700 nm.
Solution state myoglobin measurements were acquired before reduction, after reduction with
sodium dithionite and after bubbling with air for four hours. Further UV-Vis absorbance
measurements to monitor to stability of oxymyoglobin were conducted daily for four days. UV-
Vis absorbance acquisition of oxymyoglobin crystals were conducted by extracting and
dissolving crystals in a 0.05 M sodium phosphate buffer (pH 7.0) or 0.05 M Tris-HCl buffer (pH
8.5)
2.3.4 Solution-state NMR spectroscopy
(1a): 1H and 13C NMR experiment samples were prepared by dissolving ~20 mg of 1a in CDCl3.
1H and 13C NMR spectra were acquired at 16.4 T on a Bruker NEO-700 NMR spectrometer with
a BBO solution probe at 298 K.
(1b): 17O Hahn-echo experiment samples were prepared by dissolving 10 – 20 mg of 1b in 0.4
mL of CD3CN. 17O Hahn-echo NMR spectra were acquired at 16.4 T on a Bruker NEO-700
NMR spectrometer with a BBO solution probe at 298, 323 and 342 K.
43
(2b): 17O Hahn-echo experiment samples were prepared by dissolving 10 – 20 mg of 2b in 0.4
mL of 7 M NH3(aq). 17O Hahn-echo NMR spectra were acquired at 16.4 T on a Bruker NEO-700
NMR spectrometer with a BBO solution probe at 298 K.
(3a) and (4a): 1H and 31P NMR experiment samples were prepared by dissolving ~20 mg of 3a
or 4b in 0.4 mL CDCl3. 1H and 31P NMR spectra were acquired at 11.4 T on a Bruker NEO-500
NMR spectrometer with a BBFO solution probe at 298 K.
(3b) and (4b): 17O Hahn-echo experiment samples were prepared by dissolving 10 – 20 mg of 3b
or 4b in 0.4 mL of CDCl3. 17O Hahn-echo NMR spectra were acquired at 16.4 T on a Bruker
NEO-700 NMR spectrometer with a BBO solution probe at 298 K.
44
3 Characterization of metal-dioxygen complexes
3.1 Characterization of μ-peroxo-μ-hydroxo-bis[bis(ethylenediamine)cobalt(III)] (1a/b/c)
As mentioned in Chapter 1, much of the characterization of these complexes relied on
vibrational spectroscopy – where the region of interest, O – O stretching frequency commonly
occurs ~800 cm-1 for peroxo-type dioxygen bonds as a weak to medium, broad peak. Upon
synthesis of 1a, an IR spectrum was first acquired (Fig. 3.1).
Previous studies have reported the O – O stretch for 1a roughly at 800 cm-1 and 889 cm-
1,24, 111 although we observed a weak peak at 815 cm-1, protruding from a broad peak with small
peaks around 775 and 726 cm-1. Furthermore, the peak observed at 3584 cm-1 can be ascribed to
an O – H stretch from water or the bridging OH in the synthesized complex. While the peaks at
3323 and 3268 cm-1 are representative of N – H stretching, the peaks at 2960 and 2900 cm-1 are
characteristic sp3 C – H stretches, and the sharp, medium intensity peak at 1579 cm-1 is
characteristic of an N – H bend from ethylenediamine ligands. Finally, the peaks observed at
1077 and 624 cm-1 are assigned to the stretches of the perchlorate counterion of 1a.112 It is
difficult to conclude whether the weak peak observed around 814 cm-1 is representative of the
peroxo O – O stretch in 1a and that the remaining peaks observed are representative of 1a and
are simply not the starting materials of CoClO4 ∙ 7H2O, water and ethylenediamine.
It is possible that the lack of a significant signal observed for the peroxo O – O stretch
may be due to the lack of dipole moment required to observe vibrations in the IR spectrum at the
O – O bond in 1a. Observing the structure of 1a (Fig. 3.1) we see the structure is relatively
symmetric and nearly identical across the O – O bond, which would not allow the dipole of the O
– O bond to couple with the field of incoming radiation, thus this bond would not absorb infrared
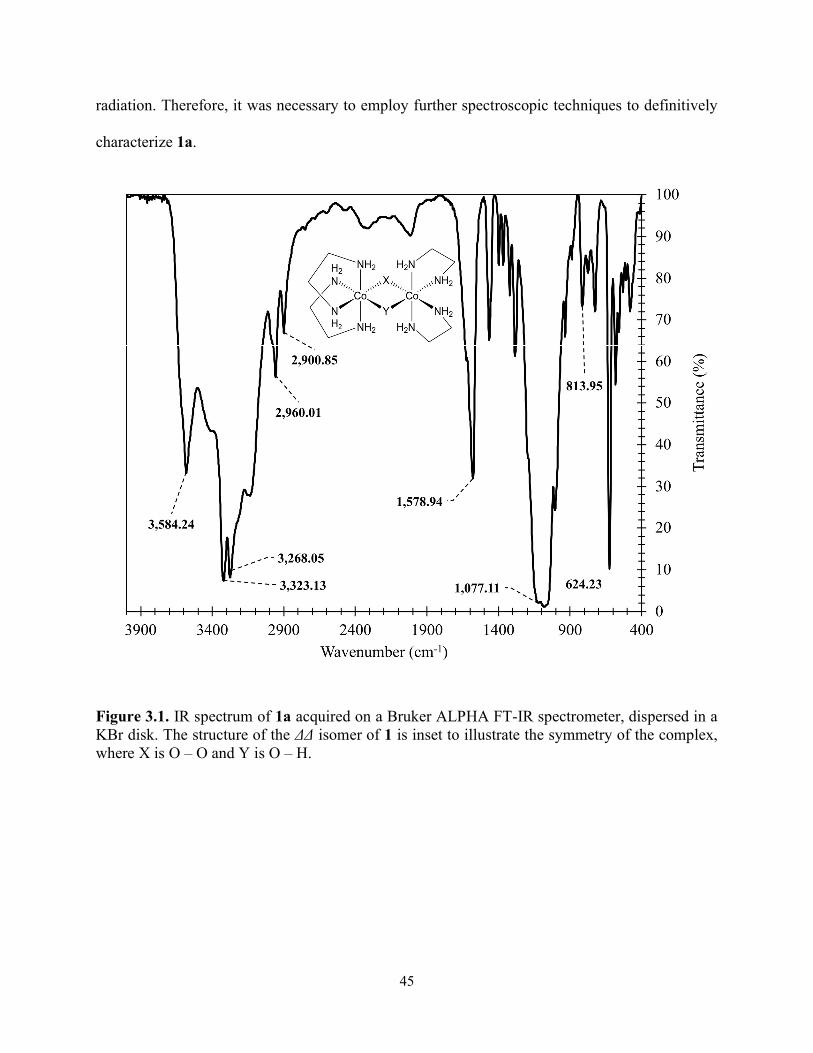
45
radiation. Therefore, it was necessary to employ further spectroscopic techniques to definitively
characterize 1a.
Figure 3.1. IR spectrum of 1a acquired on a Bruker ALPHA FT-IR spectrometer, dispersed in a KBr disk. The structure of the ΔΔ isomer of 1 is inset to illustrate the symmetry of the complex, where X is O – O and Y is O – H.
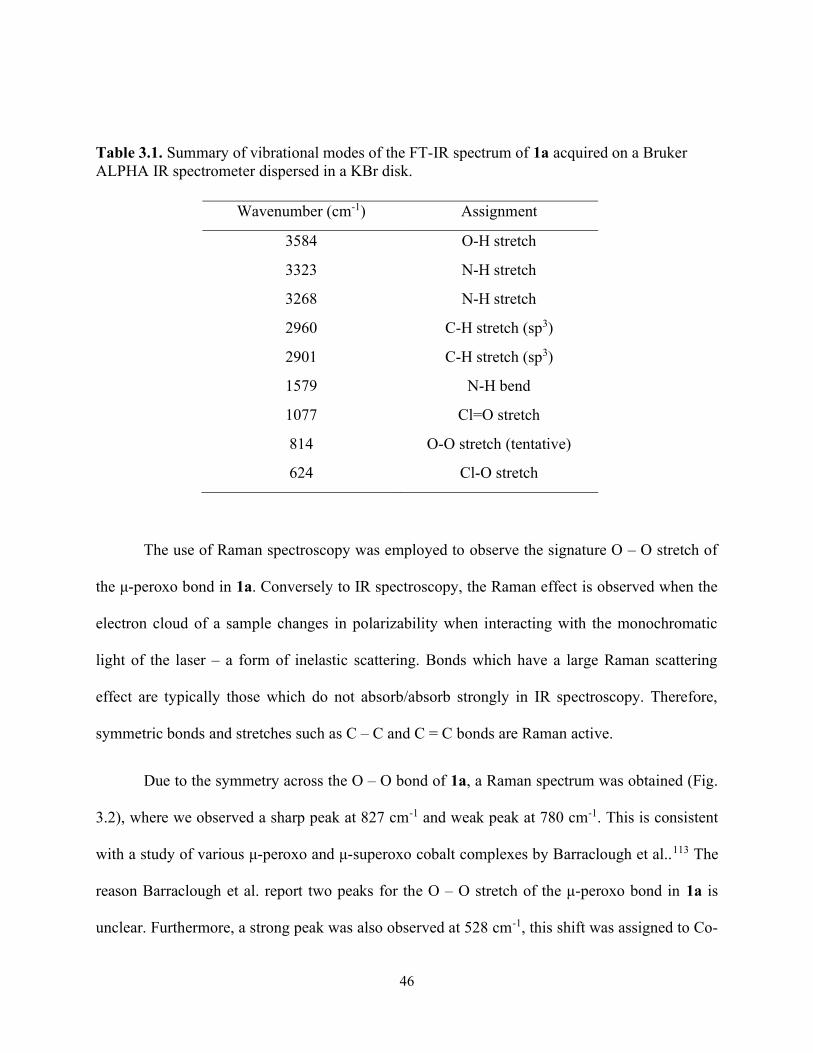
46
Table 3.1. Summary of vibrational modes of the FT-IR spectrum of 1a acquired on a Bruker ALPHA IR spectrometer dispersed in a KBr disk.
Wavenumber (cm-1) Assignment
3584 O-H stretch
3323 N-H stretch
3268 N-H stretch
2960 C-H stretch (sp3)
2901 C-H stretch (sp3)
1579 N-H bend
1077 Cl=O stretch
814 O-O stretch (tentative)
624 Cl-O stretch
The use of Raman spectroscopy was employed to observe the signature O – O stretch of
the μ-peroxo bond in 1a. Conversely to IR spectroscopy, the Raman effect is observed when the
electron cloud of a sample changes in polarizability when interacting with the monochromatic
light of the laser – a form of inelastic scattering. Bonds which have a large Raman scattering
effect are typically those which do not absorb/absorb strongly in IR spectroscopy. Therefore,
symmetric bonds and stretches such as C – C and C = C bonds are Raman active.
Due to the symmetry across the O – O bond of 1a, a Raman spectrum was obtained (Fig.
3.2), where we observed a sharp peak at 827 cm-1 and weak peak at 780 cm-1. This is consistent
with a study of various μ-peroxo and μ-superoxo cobalt complexes by Barraclough et al..113 The
reason Barraclough et al. report two peaks for the O – O stretch of the μ-peroxo bond in 1a is
unclear. Furthermore, a strong peak was also observed at 528 cm-1, this shift was assigned to Co-
47
O stretching. Interestingly, for other μ-peroxo bridged complexes, Barraclough et al. reported a
dependence on dispersant used (i.e. KBr, Na2SO4, Na2S2O6, etc.), speculating some interaction
between the complex and the dispersant environment.113 Although, in our study, Raman spectra
were acquired from the pure powder, the use of a dispersant like KBr or Na2SO4 rendered no
signals in the Raman spectrum. Conversely, Shankar and Baruah, synthesized a similar
[(en)2Co(μ-O2)(μ-OH)Co(en)2] complex and reported a single O – O stretch at 801 cm-1 when
dispersed in KBr.103 When comparing our observed Raman signal for 1a, it appears to fall well
within the typical reported O – O peroxo signals for cobalt(III)-dioxygen complexes in Raman
spectroscopy.113-116 Regardless, 1a was relatively insensitive to the monochromatic light from the
laser used in this study – when observing the Raman spectrum for 1a shown in Fig. 3.2, it is
evident the signal-to-noise ratio is poor. Similarly, Barraclough et al. observed very weak signals
which they assigned as the O – O stretches for the μ-peroxo bond in 1a.113 Practically, observing
any Raman signal for 1a was tedious – the signal is highly sensitive to the focal length of the
laser. Small deviations in solid sample height from the calibrating sample, potassium nitrate to
1a could lead to an unobservable signal. Attempts were made to improve the signal-to-noise ratio
by increasing two factors: (1) integration time, and (2) laser power. Optimal signal was observed
at 30 seconds with a laser power of 166 mW (550 mA). Increasing the integration time past 30 s
for 1a led to detector saturation, and no further signal improvement was observed. When
increasing the laser power past 166 mW, the sample was destroyed – at various increasing laser
power, vapour or smoke was observed and at times some sparks/light phenomenon was
observed, turning the sample black.
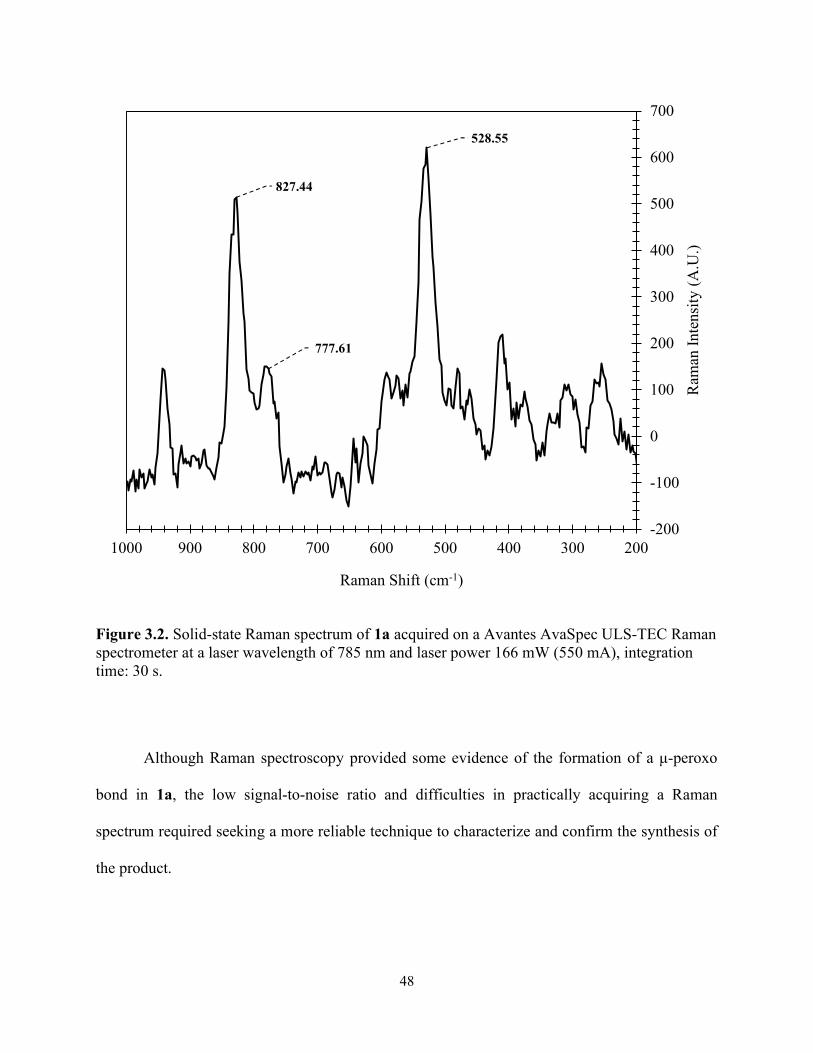
48
Figure 3.2. Solid-state Raman spectrum of 1a acquired on a Avantes AvaSpec ULS-TEC Raman spectrometer at a laser wavelength of 785 nm and laser power 166 mW (550 mA), integration time: 30 s.
Although Raman spectroscopy provided some evidence of the formation of a μ-peroxo
bond in 1a, the low signal-to-noise ratio and difficulties in practically acquiring a Raman
spectrum required seeking a more reliable technique to characterize and confirm the synthesis of
the product.
528.55
777.61
827.44
-200
-100
0
100
200
300
400
500
600
700
2003004005006007008009001000
Ram
an I
nten
sity
(A
.U.)
Raman Shift (cm-1)
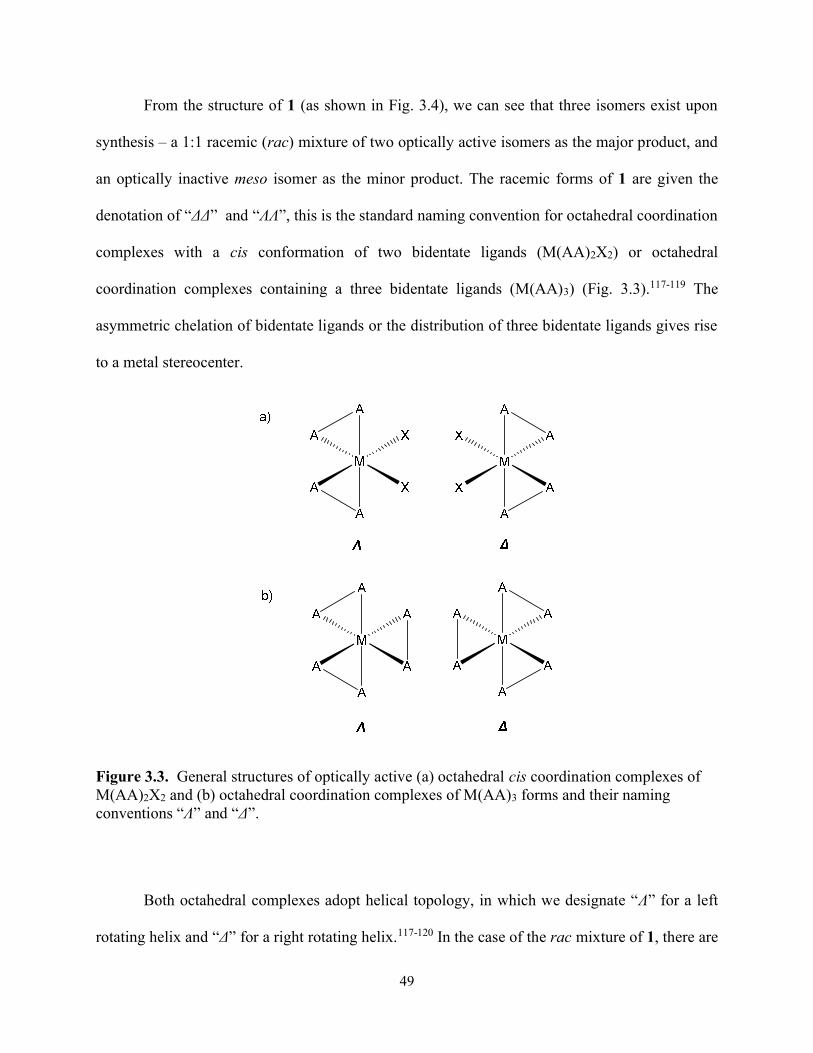
49
From the structure of 1 (as shown in Fig. 3.4), we can see that three isomers exist upon
synthesis – a 1:1 racemic (rac) mixture of two optically active isomers as the major product, and
an optically inactive meso isomer as the minor product. The racemic forms of 1 are given the
denotation of “ΔΔ” and “ΛΛ”, this is the standard naming convention for octahedral coordination
complexes with a cis conformation of two bidentate ligands (M(AA)2X2) or octahedral
coordination complexes containing a three bidentate ligands (M(AA)3) (Fig. 3.3).117-119 The
asymmetric chelation of bidentate ligands or the distribution of three bidentate ligands gives rise
to a metal stereocenter.
Figure 3.3. General structures of optically active (a) octahedral cis coordination complexes of M(AA)2X2 and (b) octahedral coordination complexes of M(AA)3 forms and their naming conventions “Λ” and “Δ”.
Both octahedral complexes adopt helical topology, in which we designate “Λ” for a left
rotating helix and “Δ” for a right rotating helix.117-120 In the case of the rac mixture of 1, there are
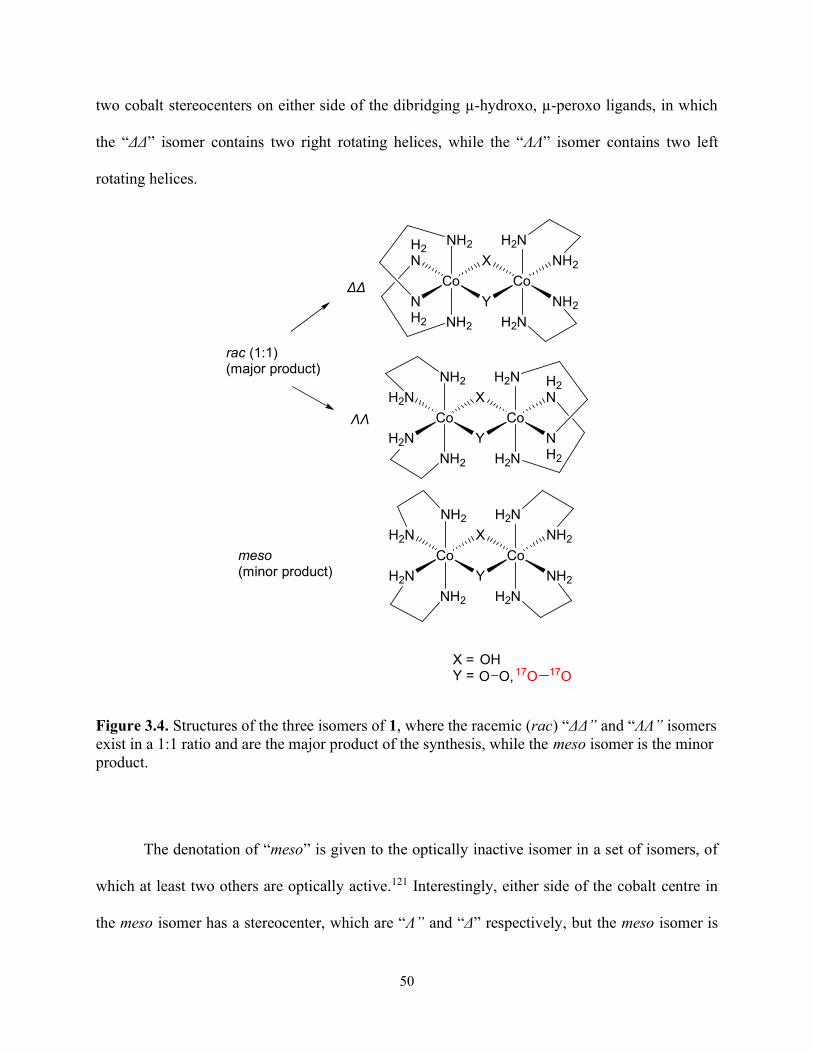
50
two cobalt stereocenters on either side of the dibridging µ-hydroxo, µ-peroxo ligands, in which
the “ΔΔ” isomer contains two right rotating helices, while the “ΛΛ” isomer contains two left
rotating helices.
Co
NH2
H2N X
NH2
YH2N
Co
H2N
H2N
NH2
NH2
Co
NH2
H2N X
NH2
YNH2
Co
H2N
H2N
NH2
NH2
H2N
H2N
NH2
NH2
Co
NH2
Y
H2N
XH2N
H2N
Co
rac (1:1)(major product)
meso(minor product)
ΔΔ
ΛΛ
X = Y =
OH17O 17OO O,
Figure 3.4. Structures of the three isomers of 1, where the racemic (rac) “ΔΔ” and “ΛΛ” isomers exist in a 1:1 ratio and are the major product of the synthesis, while the meso isomer is the minor product.
The denotation of “meso” is given to the optically inactive isomer in a set of isomers, of
which at least two others are optically active.121 Interestingly, either side of the cobalt centre in
the meso isomer has a stereocenter, which are “Λ” and “Δ” respectively, but the meso isomer is
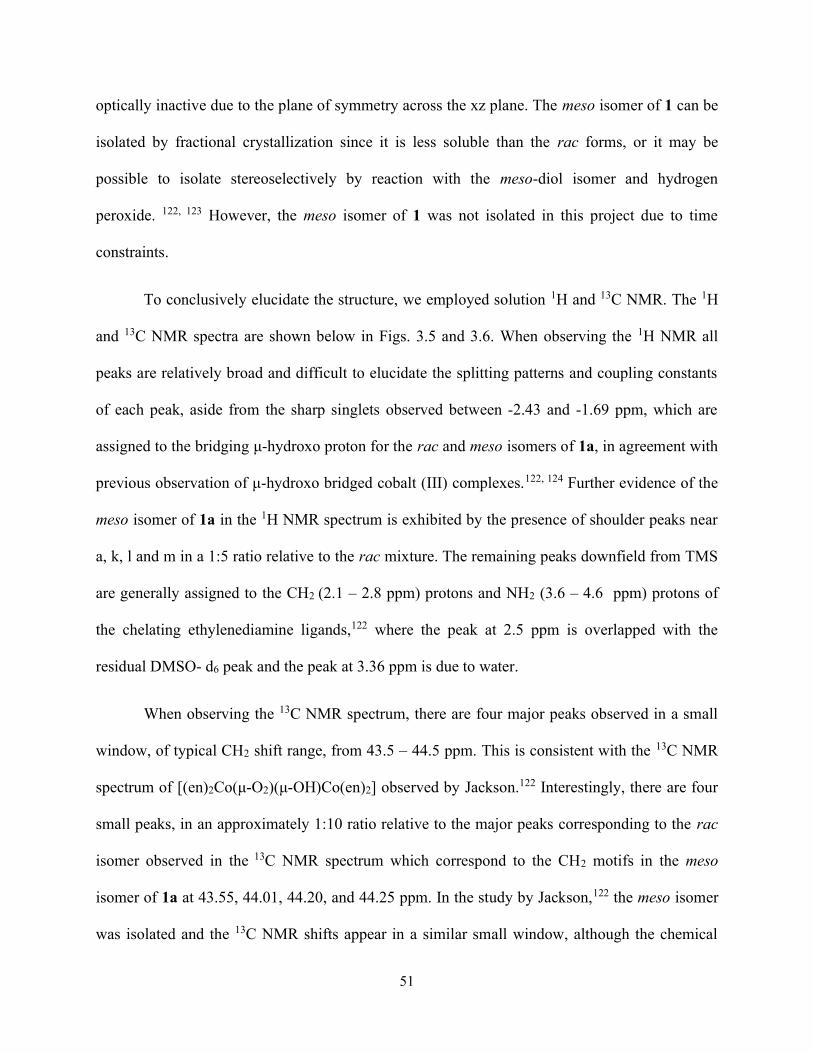
51
optically inactive due to the plane of symmetry across the xz plane. The meso isomer of 1 can be
isolated by fractional crystallization since it is less soluble than the rac forms, or it may be
possible to isolate stereoselectively by reaction with the meso-diol isomer and hydrogen
peroxide. 122, 123 However, the meso isomer of 1 was not isolated in this project due to time
constraints.
To conclusively elucidate the structure, we employed solution 1H and 13C NMR. The 1H
and 13C NMR spectra are shown below in Figs. 3.5 and 3.6. When observing the 1H NMR all
peaks are relatively broad and difficult to elucidate the splitting patterns and coupling constants
of each peak, aside from the sharp singlets observed between -2.43 and -1.69 ppm, which are
assigned to the bridging μ-hydroxo proton for the rac and meso isomers of 1a, in agreement with
previous observation of μ-hydroxo bridged cobalt (III) complexes.122, 124 Further evidence of the
meso isomer of 1a in the 1H NMR spectrum is exhibited by the presence of shoulder peaks near
a, k, l and m in a 1:5 ratio relative to the rac mixture. The remaining peaks downfield from TMS
are generally assigned to the CH2 (2.1 – 2.8 ppm) protons and NH2 (3.6 – 4.6 ppm) protons of
the chelating ethylenediamine ligands,122 where the peak at 2.5 ppm is overlapped with the
residual DMSO- d6 peak and the peak at 3.36 ppm is due to water.
When observing the 13C NMR spectrum, there are four major peaks observed in a small
window, of typical CH2 shift range, from 43.5 – 44.5 ppm. This is consistent with the 13C NMR
spectrum of [(en)2Co(μ-O2)(μ-OH)Co(en)2] observed by Jackson.122 Interestingly, there are four
small peaks, in an approximately 1:10 ratio relative to the major peaks corresponding to the rac
isomer observed in the 13C NMR spectrum which correspond to the CH2 motifs in the meso
isomer of 1a at 43.55, 44.01, 44.20, and 44.25 ppm. In the study by Jackson,122 the meso isomer
was isolated and the 13C NMR shifts appear in a similar small window, although the chemical
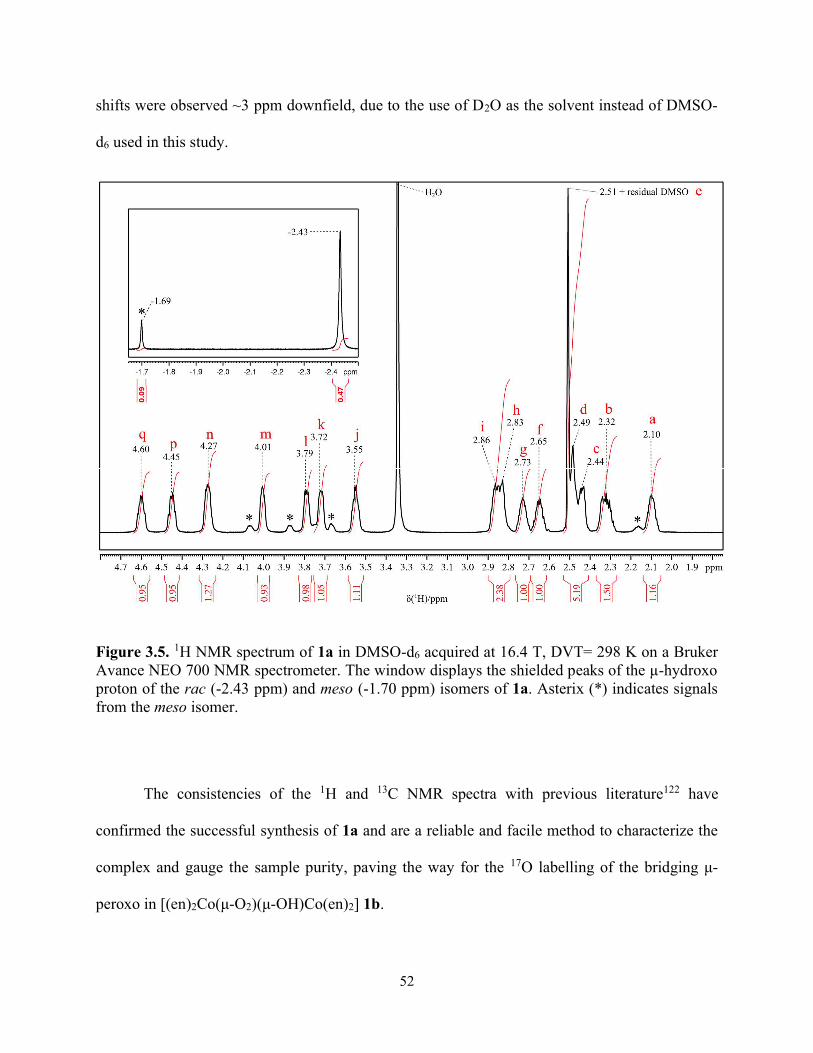
52
shifts were observed ~3 ppm downfield, due to the use of D2O as the solvent instead of DMSO-
d6 used in this study.
Figure 3.5. 1H NMR spectrum of 1a in DMSO-d6 acquired at 16.4 T, DVT= 298 K on a Bruker Avance NEO 700 NMR spectrometer. The window displays the shielded peaks of the µ-hydroxo proton of the rac (-2.43 ppm) and meso (-1.70 ppm) isomers of 1a. Asterix (*) indicates signals from the meso isomer.
The consistencies of the 1H and 13C NMR spectra with previous literature122 have
confirmed the successful synthesis of 1a and are a reliable and facile method to characterize the
complex and gauge the sample purity, paving the way for the 17O labelling of the bridging μ-
peroxo in [(en)2Co(μ-O2)(μ-OH)Co(en)2] 1b.
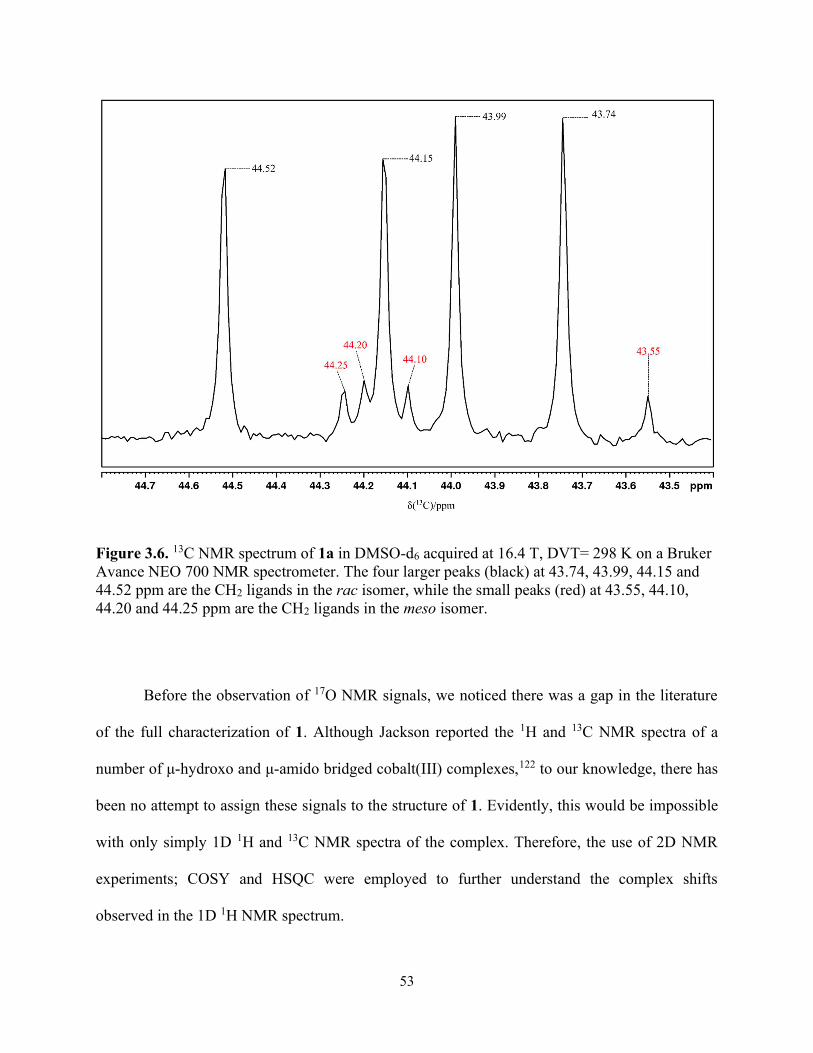
53
Figure 3.6. 13C NMR spectrum of 1a in DMSO-d6 acquired at 16.4 T, DVT= 298 K on a Bruker Avance NEO 700 NMR spectrometer. The four larger peaks (black) at 43.74, 43.99, 44.15 and 44.52 ppm are the CH2 ligands in the rac isomer, while the small peaks (red) at 43.55, 44.10, 44.20 and 44.25 ppm are the CH2 ligands in the meso isomer.
Before the observation of 17O NMR signals, we noticed there was a gap in the literature
of the full characterization of 1. Although Jackson reported the 1H and 13C NMR spectra of a
number of μ-hydroxo and μ-amido bridged cobalt(III) complexes,122 to our knowledge, there has
been no attempt to assign these signals to the structure of 1. Evidently, this would be impossible
with only simply 1D 1H and 13C NMR spectra of the complex. Therefore, the use of 2D NMR
experiments; COSY and HSQC were employed to further understand the complex shifts
observed in the 1D 1H NMR spectrum.
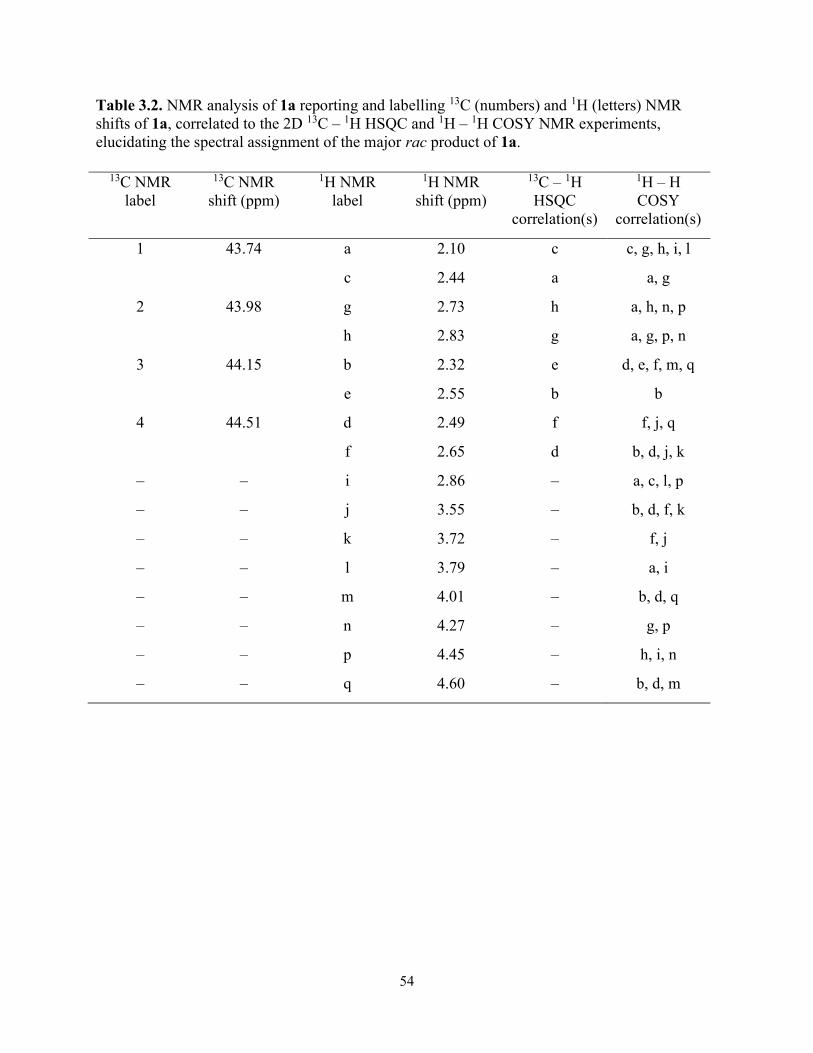
54
Table 3.2. NMR analysis of 1a reporting and labelling 13C (numbers) and 1H (letters) NMR shifts of 1a, correlated to the 2D 13C – 1H HSQC and 1H – 1H COSY NMR experiments, elucidating the spectral assignment of the major rac product of 1a.
13C NMR label
13C NMR shift (ppm)
1H NMR label
1H NMR shift (ppm)
13C – 1H HSQC
correlation(s)
1H – H COSY
correlation(s)
1
43.74
a 2.10 c c, g, h, i, l
c 2.44 a a, g
2 43.98
g 2.73 h a, h, n, p
h 2.83 g a, g, p, n
3
44.15
b 2.32 e d, e, f, m, q
e 2.55 b b
4
44.51
d 2.49 f f, j, q
f 2.65 d b, d, j, k
– – i 2.86 – a, c, l, p
– – j 3.55 – b, d, f, k
– – k 3.72 – f, j
– – l 3.79 – a, i
– – m 4.01 – b, d, q
– – n 4.27 – g, p
– – p 4.45 – h, i, n
– – q 4.60 – b, d, m

55
Figure 3.7. 1H – 13C heteronuclear correlation 2D HSQC NMR spectrum of 1a in DMSO-d6 acquired at 16.4 T, DVT = 298 K on a Bruker Avance NEO 700 NMR spectrometer. Dashed lines connect each 13C correlation their respective 1H NMR correlation.
From the analysis of the 2D HSQC NMR spectrum (Fig. 3.7), we were able to assign the
respective CH2 protons to their carbons (Table 3.2). After analysis of the 2D HSQC spectrum,
we were able to observe each signal 1H – 1H correlation and determine the ethyl and amino
neighbours of each ethylenediamine ligand (Table 3.2) by analysis of the 2D COSY NMR
spectrum shown in Fig. 3.8. As discussed previously, the resonance upfield from the water peak
56
at 3.36 ppm are generally assigned to the CH2 protons, while the peaks downfield from the water
peak are assigned to the NH2 protons. Although, we expected eight amine resonances, there are
only seven distinct amine resonance observed in the 1H NMR spectrum of 1a. In previous
literature,122 the peak observed around 2.86 ppm (h/i) in the 1H NMR was assigned to a CH2
proton from one of the ethylenediamine ligands. From our study, we observed from the 1H NMR
spectrum, that this peak integrated to ~2 H, with overlapping signals centred around 2.83 ppm
(h) and 2.86 ppm (i). Furthermore, we observed from the 2D COSY NMR spectrum, two
resonances correlating with the peak at 2.10 ppm (a). Therefore, we assigned the peaks at 2.83
ppm (h) and 2.86 ppm (i), as two overlapping resonances corresponding to a single CH2 proton
and single NH2 proton from ethylenediamine, respectively (as shown in Fig. 3.9). It should be
noted from the 1D and 2D NMR experiments performed for 1a, it is difficult to know the precise
structural positions of the resonances displayed in the 1H and 13C NMR spectra, and Fig. 3.9
illustrates the NH2-CH2-CH2-NH2 linkages of each discrete ethylenediamine ligand.

57
Figure 3.8. 1H – 1H homonuclear correlation 2D COSY NMR spectrum of 1a in DMSO-d6 acquired at 16.4 T, DVT = 298 K on a Bruker Avance NEO 700 NMR spectrometer. The dashed lines represent 1H – 1H correlations on respective ligands of 1a.
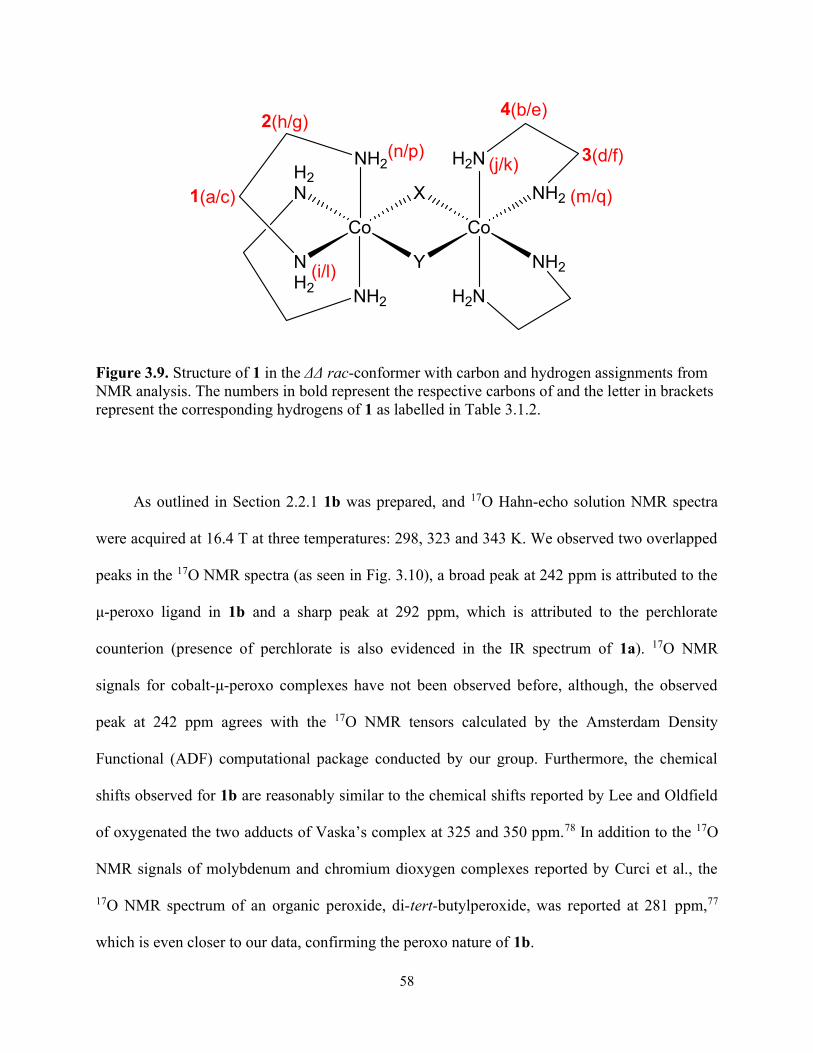
58
Co
NH2
H2N X
NH2
YNH2
Co
H2N
H2N
NH2
NH2
1(a/c)
2(h/g)
3(d/f)
4(b/e)
(i/l)
(j/k)
(m/q)
(n/p)
Figure 3.9. Structure of 1 in the ΔΔ rac-conformer with carbon and hydrogen assignments from NMR analysis. The numbers in bold represent the respective carbons of and the letter in brackets represent the corresponding hydrogens of 1 as labelled in Table 3.1.2.
As outlined in Section 2.2.1 1b was prepared, and 17O Hahn-echo solution NMR spectra
were acquired at 16.4 T at three temperatures: 298, 323 and 343 K. We observed two overlapped
peaks in the 17O NMR spectra (as seen in Fig. 3.10), a broad peak at 242 ppm is attributed to the
μ-peroxo ligand in 1b and a sharp peak at 292 ppm, which is attributed to the perchlorate
counterion (presence of perchlorate is also evidenced in the IR spectrum of 1a). 17O NMR
signals for cobalt-μ-peroxo complexes have not been observed before, although, the observed
peak at 242 ppm agrees with the 17O NMR tensors calculated by the Amsterdam Density
Functional (ADF) computational package conducted by our group. Furthermore, the chemical
shifts observed for 1b are reasonably similar to the chemical shifts reported by Lee and Oldfield
of oxygenated the two adducts of Vaska’s complex at 325 and 350 ppm.78 In addition to the 17O
NMR signals of molybdenum and chromium dioxygen complexes reported by Curci et al., the
17O NMR spectrum of an organic peroxide, di-tert-butylperoxide, was reported at 281 ppm,77
which is even closer to our data, confirming the peroxo nature of 1b.
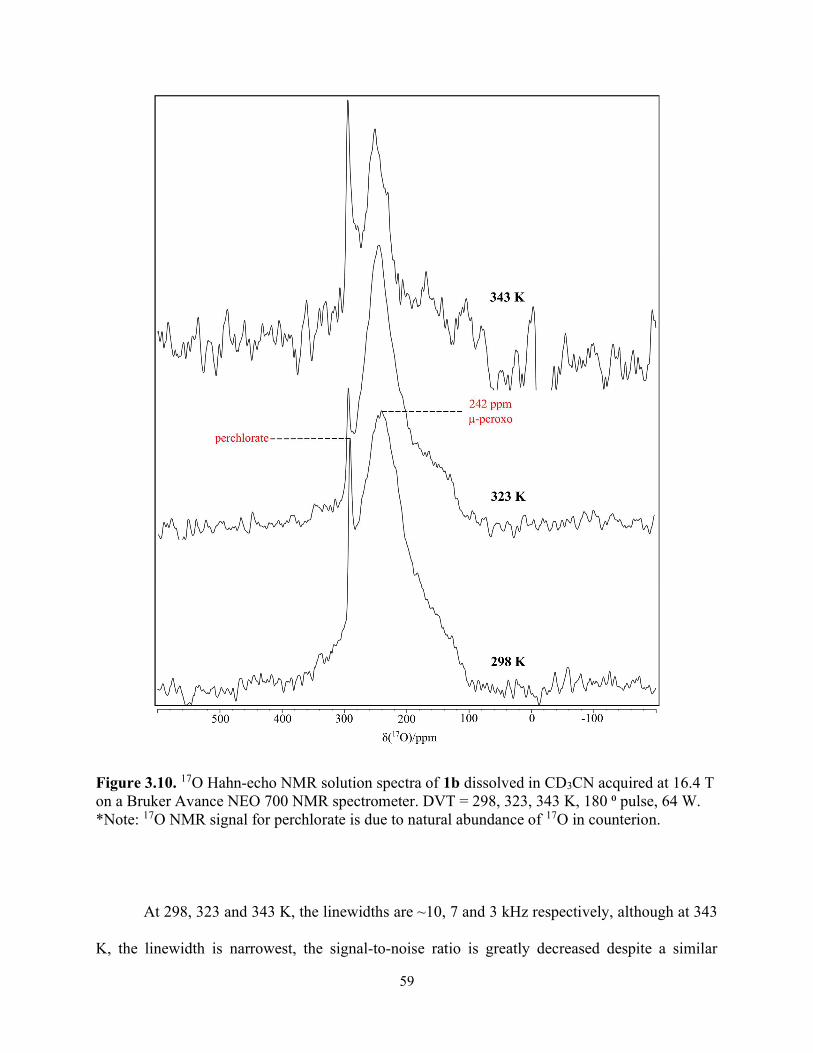
59
Figure 3.10. 17O Hahn-echo NMR solution spectra of 1b dissolved in CD3CN acquired at 16.4 T on a Bruker Avance NEO 700 NMR spectrometer. DVT = 298, 323, 343 K, 180 ⁰ pulse, 64 W. *Note: 17O NMR signal for perchlorate is due to natural abundance of 17O in counterion.
At 298, 323 and 343 K, the linewidths are ~10, 7 and 3 kHz respectively, although at 343
K, the linewidth is narrowest, the signal-to-noise ratio is greatly decreased despite a similar
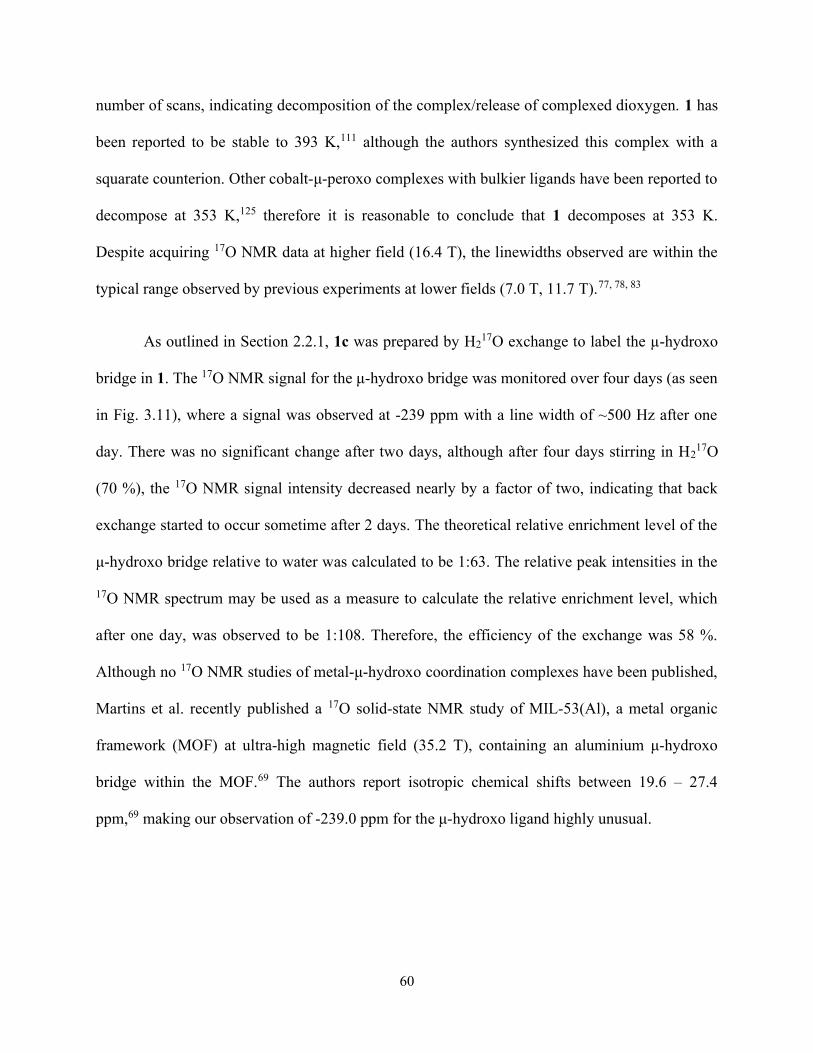
60
number of scans, indicating decomposition of the complex/release of complexed dioxygen. 1 has
been reported to be stable to 393 K,111 although the authors synthesized this complex with a
squarate counterion. Other cobalt-μ-peroxo complexes with bulkier ligands have been reported to
decompose at 353 K,125 therefore it is reasonable to conclude that 1 decomposes at 353 K.
Despite acquiring 17O NMR data at higher field (16.4 T), the linewidths observed are within the
typical range observed by previous experiments at lower fields (7.0 T, 11.7 T).77, 78, 83
As outlined in Section 2.2.1, 1c was prepared by H217O exchange to label the µ-hydroxo
bridge in 1. The 17O NMR signal for the μ-hydroxo bridge was monitored over four days (as seen
in Fig. 3.11), where a signal was observed at -239 ppm with a line width of ~500 Hz after one
day. There was no significant change after two days, although after four days stirring in H217O
(70 %), the 17O NMR signal intensity decreased nearly by a factor of two, indicating that back
exchange started to occur sometime after 2 days. The theoretical relative enrichment level of the
μ-hydroxo bridge relative to water was calculated to be 1:63. The relative peak intensities in the
17O NMR spectrum may be used as a measure to calculate the relative enrichment level, which
after one day, was observed to be 1:108. Therefore, the efficiency of the exchange was 58 %.
Although no 17O NMR studies of metal-μ-hydroxo coordination complexes have been published,
Martins et al. recently published a 17O solid-state NMR study of MIL-53(Al), a metal organic
framework (MOF) at ultra-high magnetic field (35.2 T), containing an aluminium μ-hydroxo
bridge within the MOF.69 The authors report isotropic chemical shifts between 19.6 – 27.4
ppm,69 making our observation of -239.0 ppm for the μ-hydroxo ligand highly unusual.
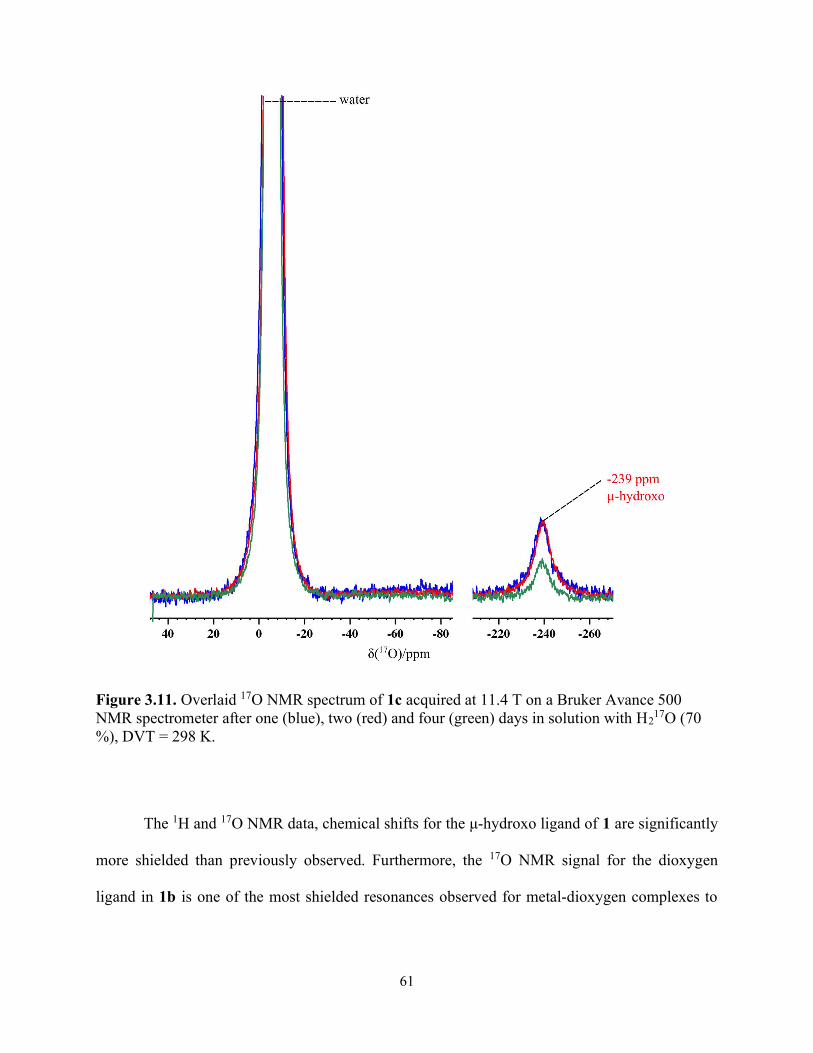
61
Figure 3.11. Overlaid 17O NMR spectrum of 1c acquired at 11.4 T on a Bruker Avance 500 NMR spectrometer after one (blue), two (red) and four (green) days in solution with H2
17O (70 %), DVT = 298 K.
The 1H and 17O NMR data, chemical shifts for the μ-hydroxo ligand of 1 are significantly
more shielded than previously observed. Furthermore, the 17O NMR signal for the dioxygen
ligand in 1b is one of the most shielded resonances observed for metal-dioxygen complexes to
62
date. Cobalt(III) appears to have significant shielding effects on its bridging ligands, although
further 17O NMR studies would need to be conducted to further explain this effect.
3.2 Characterization of μ-peroxo-bis-[pentamminecobalt(III)] (2a/b)
First synthesized by Werner in 1910, 2 (Fig. 3.12) has been subject to many studies due to
the relative ease of synthesis and has been well characterized by vibrational spectroscopy and x-
ray crystallography.104, 105, 126, 127 A sample of 2a was prepared to practice the synthesis and was
characterized by IR spectroscopy to view the characteristic O – O stretch.
Figure 3.12. Structure of 2 synthesized in this project, first isolated by Werner.21
The IR spectrum (as seen in Fig. 3.13) is generally consistent with literature,104, 127 we
observe a medium-intensity peak at 818 cm-1, which may be ascribed to the O – O stretch in 2a,
although typical O – O stretches are weak in intensity. It has been reported that the N – H
rocking mode appears around 800 cm-1, and similar cobalt-dioxygen complexes have reported N

63
– H rocking between 800 – 815 cm-1.104 It is likely that the O – O is too weak and overlapping
with the signal at 818 cm-1, due to the symmetry of 2a, therefore Raman spectroscopy was
employed in an attempt to observe the O – O stretch. The large, broad peak at 3286 cm-1 is
characteristic of N – H stretching, while the medium, sharp peaks at 1622 and 1283 cm-1 are
assigned to the N – H bend and wagging modes. Finally, the peaks at 1108 and 618 cm-1 are
characteristic of the sulfate counterion vibrational modes.128
Figure 3.13. IR spectrum of 2a acquired on a Bruker ALPHA FT-IR spectrometer, dispersed in a KBr disk.
3,286.41
1,621.78
1,283.15
1,107.71
818.03
618.11
0
10
20
30
40
50
60
70
80
90
100
400900140019002400290034003900
Tra
nsm
itta
nce
(%)
Wavenumber (cm-1)
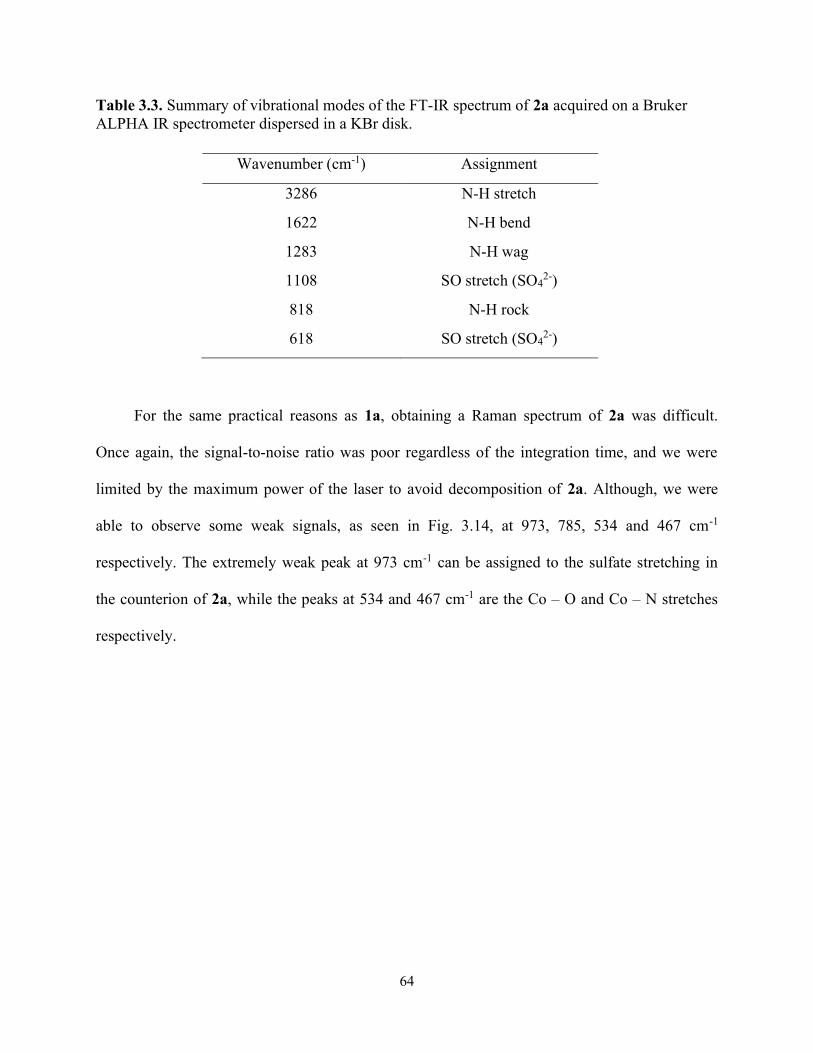
64
Table 3.3. Summary of vibrational modes of the FT-IR spectrum of 2a acquired on a Bruker ALPHA IR spectrometer dispersed in a KBr disk.
Wavenumber (cm-1) Assignment
3286 N-H stretch
1622 N-H bend
1283 N-H wag
1108 SO stretch (SO42-)
818 N-H rock
618 SO stretch (SO42-)
For the same practical reasons as 1a, obtaining a Raman spectrum of 2a was difficult.
Once again, the signal-to-noise ratio was poor regardless of the integration time, and we were
limited by the maximum power of the laser to avoid decomposition of 2a. Although, we were
able to observe some weak signals, as seen in Fig. 3.14, at 973, 785, 534 and 467 cm-1
respectively. The extremely weak peak at 973 cm-1 can be assigned to the sulfate stretching in
the counterion of 2a, while the peaks at 534 and 467 cm-1 are the Co – O and Co – N stretches
respectively.

65
Figure 3.14. Solid-state Raman spectrum of 2a acquired on a Avantes AvaSpec ULS-TEC Raman spectrometer at a laser wavelength of 7785 nm and power 170 mW (560 mA), integration time: 40 s.
The peak at 785 cm-1 is assigned to the O – O stretching of 2a. In comparison, Barraclough
et al. observed the O – O stretch for the pure solid sample of 2a at 808 cm-1.113 Furthermore, O –
O stretches of 2a adducts with different counterions have been reported between 786 – 815 cm-
1.113 Our experimentally observed value is reasonably similar to the reported stretches, and due to
the poor signal-to-noise ratio, falls within the reasonable margin of error. Although the quality of
the Raman spectrum for 2a is poor, we felt confident to synthesize 2b due to the combination of
467.024534.105
785.512
973.797
-300
-200
-100
0
100
200
300
400
500
200400600800100012001400
Ram
an I
nten
sity
(A
.U.)
Raman Shift (cm-1)
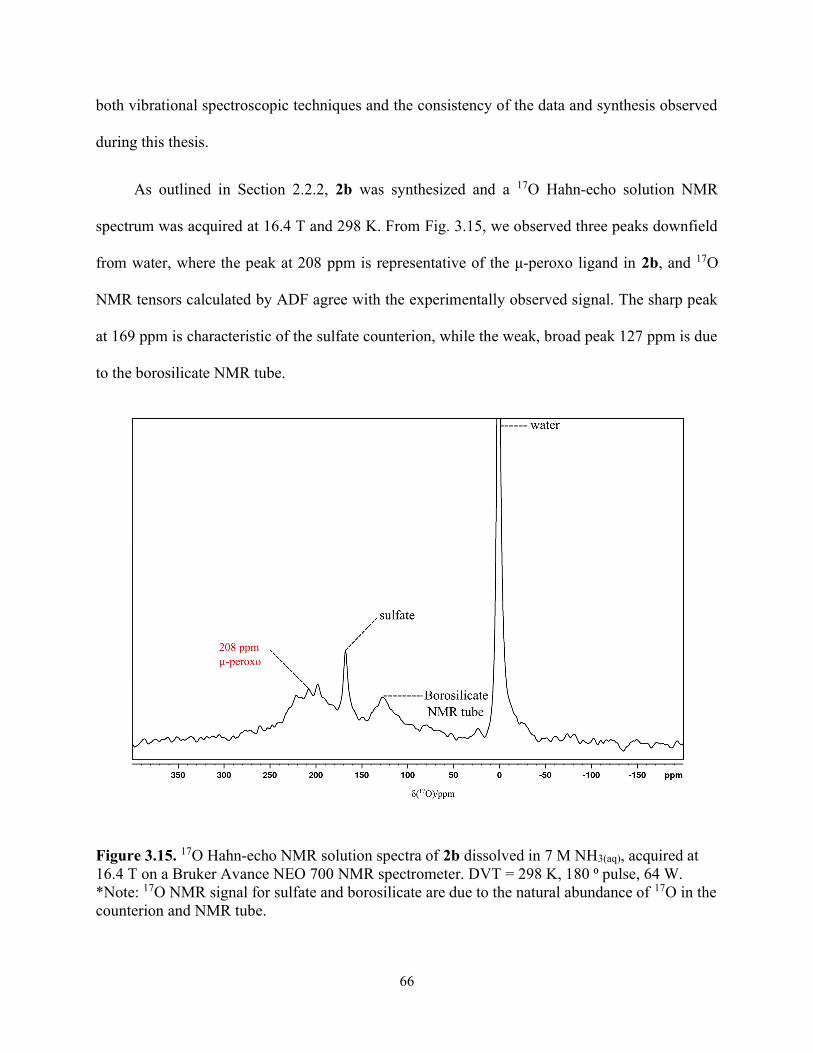
66
both vibrational spectroscopic techniques and the consistency of the data and synthesis observed
during this thesis.
As outlined in Section 2.2.2, 2b was synthesized and a 17O Hahn-echo solution NMR
spectrum was acquired at 16.4 T and 298 K. From Fig. 3.15, we observed three peaks downfield
from water, where the peak at 208 ppm is representative of the μ-peroxo ligand in 2b, and 17O
NMR tensors calculated by ADF agree with the experimentally observed signal. The sharp peak
at 169 ppm is characteristic of the sulfate counterion, while the weak, broad peak 127 ppm is due
to the borosilicate NMR tube.
Figure 3.15. 17O Hahn-echo NMR solution spectra of 2b dissolved in 7 M NH3(aq), acquired at 16.4 T on a Bruker Avance NEO 700 NMR spectrometer. DVT = 298 K, 180 ⁰ pulse, 64 W. *Note: 17O NMR signal for sulfate and borosilicate are due to the natural abundance of 17O in the counterion and NMR tube.
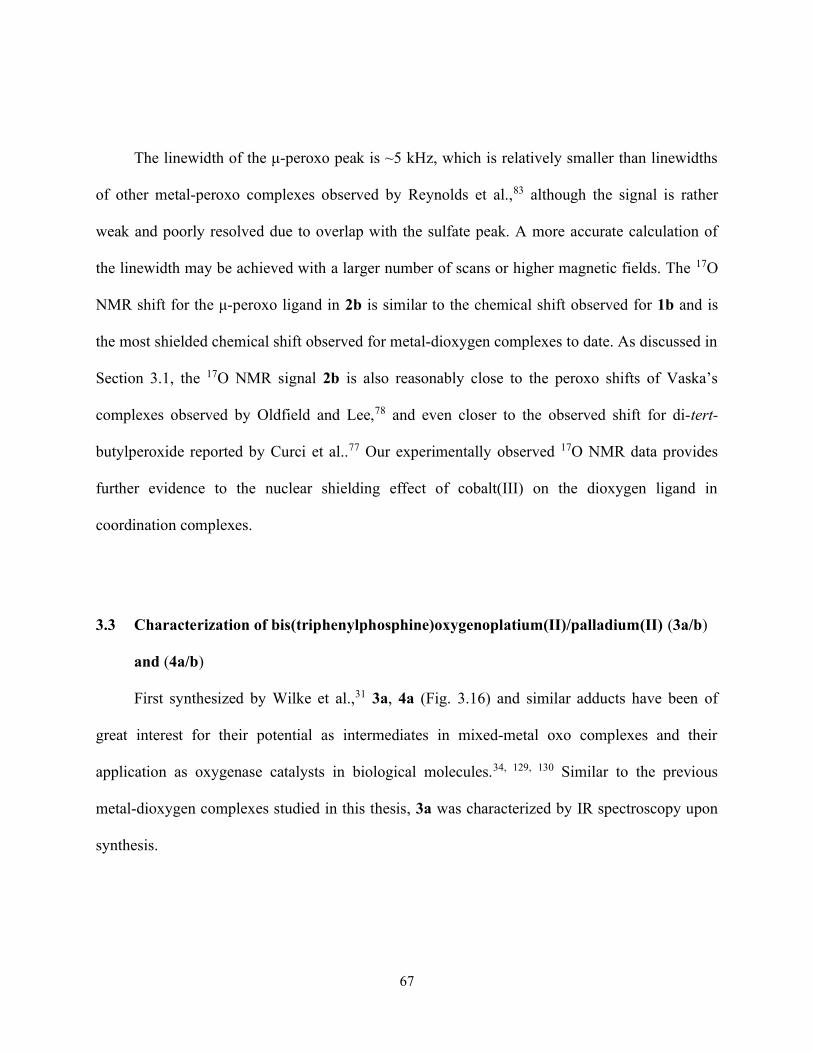
67
The linewidth of the μ-peroxo peak is ~5 kHz, which is relatively smaller than linewidths
of other metal-peroxo complexes observed by Reynolds et al.,83 although the signal is rather
weak and poorly resolved due to overlap with the sulfate peak. A more accurate calculation of
the linewidth may be achieved with a larger number of scans or higher magnetic fields. The 17O
NMR shift for the μ-peroxo ligand in 2b is similar to the chemical shift observed for 1b and is
the most shielded chemical shift observed for metal-dioxygen complexes to date. As discussed in
Section 3.1, the 17O NMR signal 2b is also reasonably close to the peroxo shifts of Vaska’s
complexes observed by Oldfield and Lee,78 and even closer to the observed shift for di-tert-
butylperoxide reported by Curci et al..77 Our experimentally observed 17O NMR data provides
further evidence to the nuclear shielding effect of cobalt(III) on the dioxygen ligand in
coordination complexes.
3.3 Characterization of bis(triphenylphosphine)oxygenoplatium(II)/palladium(II) (3a/b)
and (4a/b)
First synthesized by Wilke et al.,31 3a, 4a (Fig. 3.16) and similar adducts have been of
great interest for their potential as intermediates in mixed-metal oxo complexes and their
application as oxygenase catalysts in biological molecules.34, 129, 130 Similar to the previous
metal-dioxygen complexes studied in this thesis, 3a was characterized by IR spectroscopy upon
synthesis.
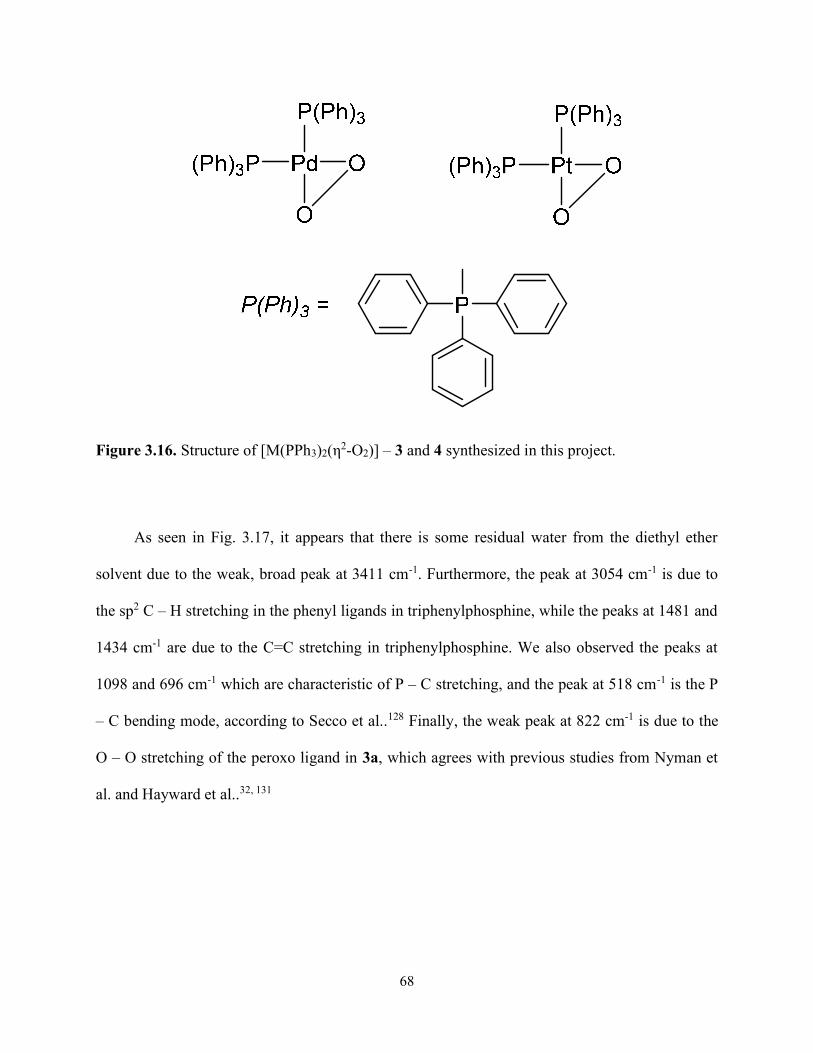
68
Figure 3.16. Structure of [M(PPh3)2(η2-O2)] – 3 and 4 synthesized in this project.
As seen in Fig. 3.17, it appears that there is some residual water from the diethyl ether
solvent due to the weak, broad peak at 3411 cm-1. Furthermore, the peak at 3054 cm-1 is due to
the sp2 C – H stretching in the phenyl ligands in triphenylphosphine, while the peaks at 1481 and
1434 cm-1 are due to the C=C stretching in triphenylphosphine. We also observed the peaks at
1098 and 696 cm-1 which are characteristic of P – C stretching, and the peak at 518 cm-1 is the P
– C bending mode, according to Secco et al..128 Finally, the weak peak at 822 cm-1 is due to the
O – O stretching of the peroxo ligand in 3a, which agrees with previous studies from Nyman et
al. and Hayward et al..32, 131
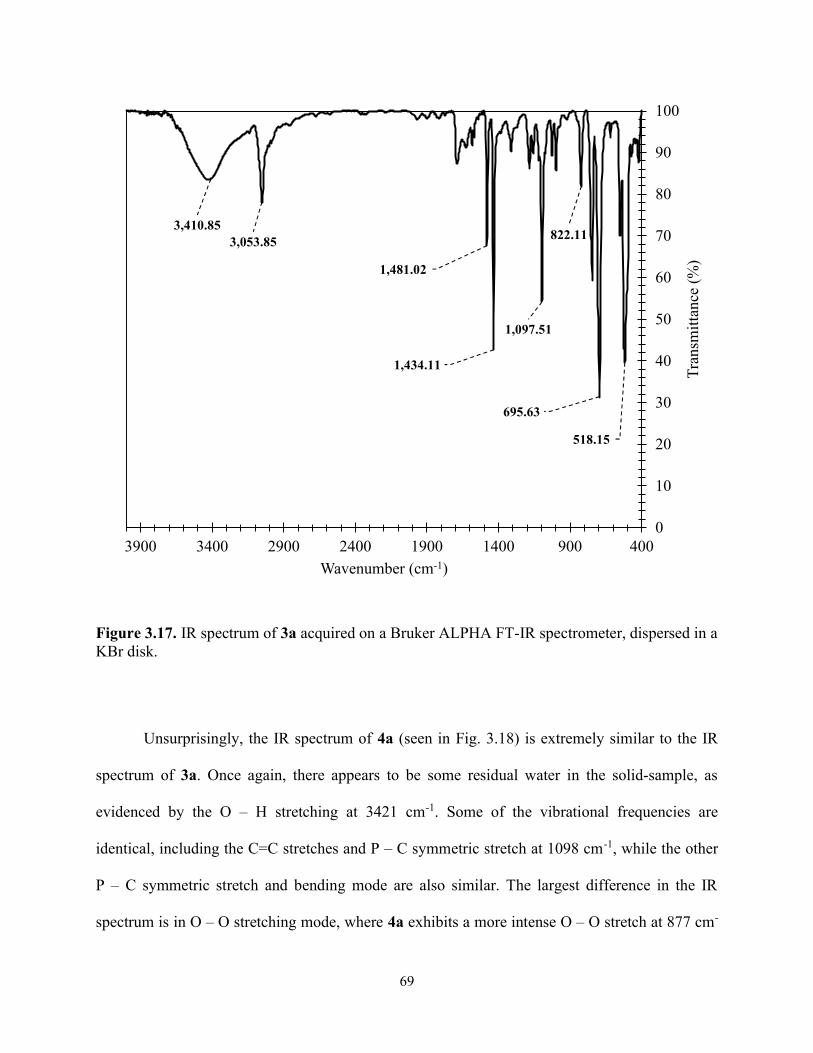
69
Figure 3.17. IR spectrum of 3a acquired on a Bruker ALPHA FT-IR spectrometer, dispersed in a KBr disk.
Unsurprisingly, the IR spectrum of 4a (seen in Fig. 3.18) is extremely similar to the IR
spectrum of 3a. Once again, there appears to be some residual water in the solid-sample, as
evidenced by the O – H stretching at 3421 cm-1. Some of the vibrational frequencies are
identical, including the C=C stretches and P – C symmetric stretch at 1098 cm-1, while the other
P – C symmetric stretch and bending mode are also similar. The largest difference in the IR
spectrum is in O – O stretching mode, where 4a exhibits a more intense O – O stretch at 877 cm-
3,410.853,053.85
1,481.02
1,434.11
1,097.51
822.11
695.63
518.15
0
10
20
30
40
50
60
70
80
90
100
400900140019002400290034003900
Tra
nsm
itta
nce
(%)
Wavenumber (cm-1)
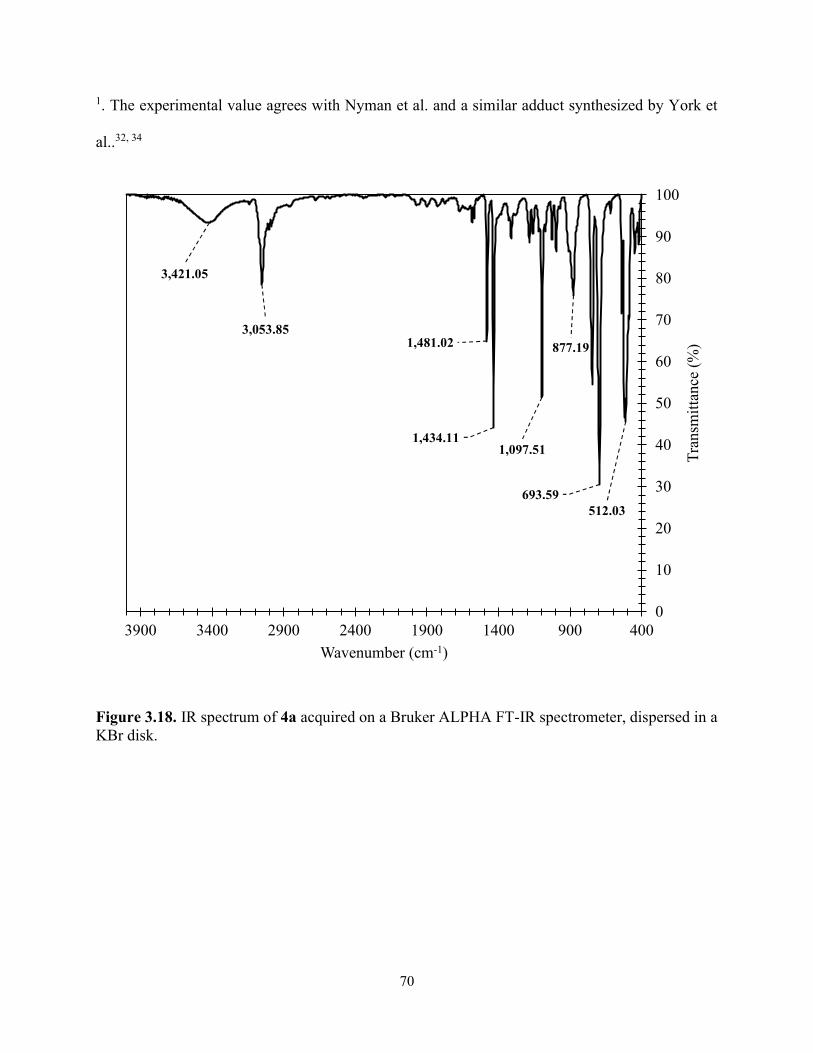
70
1. The experimental value agrees with Nyman et al. and a similar adduct synthesized by York et
al..32, 34
Figure 3.18. IR spectrum of 4a acquired on a Bruker ALPHA FT-IR spectrometer, dispersed in a KBr disk.
3,421.05
3,053.851,481.02
1,434.111,097.51
877.19
693.59512.03
0
10
20
30
40
50
60
70
80
90
100
400900140019002400290034003900
Tra
nsm
itta
nce
(%)
Wavenumber (cm-1)
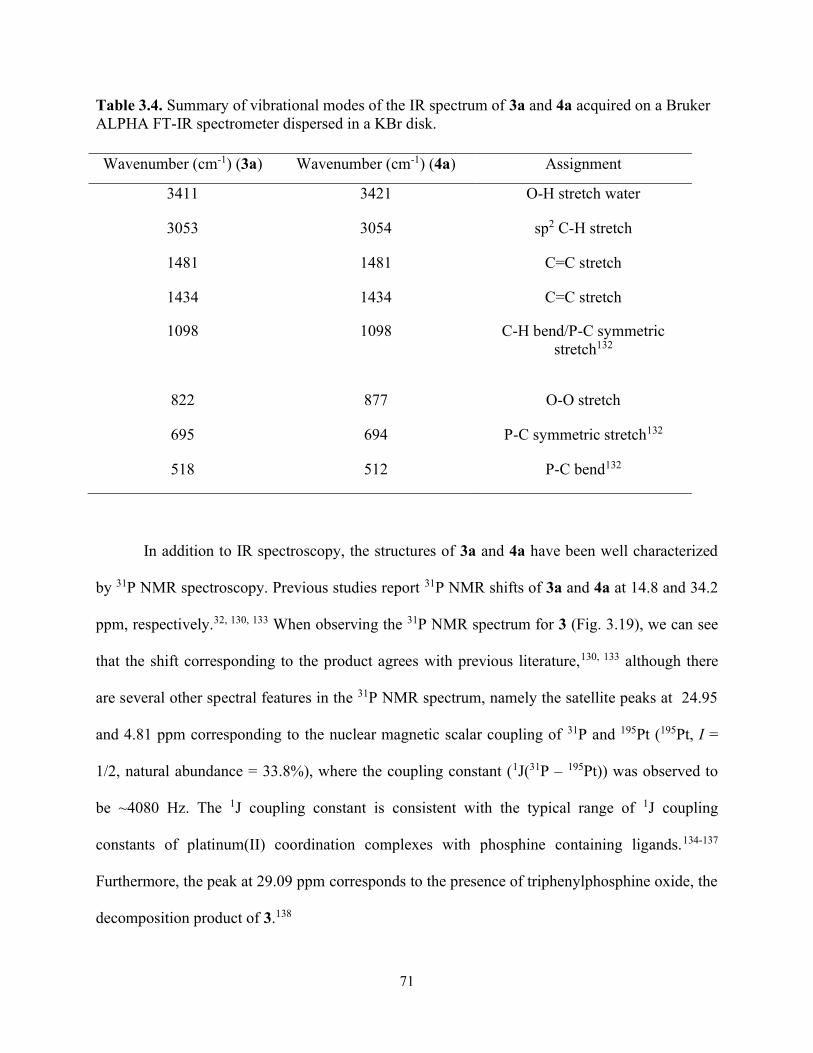
71
Table 3.4. Summary of vibrational modes of the IR spectrum of 3a and 4a acquired on a Bruker ALPHA FT-IR spectrometer dispersed in a KBr disk.
Wavenumber (cm-1) (3a) Wavenumber (cm-1) (4a) Assignment
3411 3421 O-H stretch water
3053 3054 sp2 C-H stretch
1481 1481 C=C stretch
1434 1434 C=C stretch
1098 1098 C-H bend/P-C symmetric stretch132
822 877 O-O stretch
695 694 P-C symmetric stretch132
518 512 P-C bend132
In addition to IR spectroscopy, the structures of 3a and 4a have been well characterized
by 31P NMR spectroscopy. Previous studies report 31P NMR shifts of 3a and 4a at 14.8 and 34.2
ppm, respectively.32, 130, 133 When observing the 31P NMR spectrum for 3 (Fig. 3.19), we can see
that the shift corresponding to the product agrees with previous literature,130, 133 although there
are several other spectral features in the 31P NMR spectrum, namely the satellite peaks at 24.95
and 4.81 ppm corresponding to the nuclear magnetic scalar coupling of 31P and 195Pt (195Pt, I =
1/2, natural abundance = 33.8%), where the coupling constant (1J(31P – 195Pt)) was observed to
be ~4080 Hz. The 1J coupling constant is consistent with the typical range of 1J coupling
constants of platinum(II) coordination complexes with phosphine containing ligands.134-137
Furthermore, the peak at 29.09 ppm corresponds to the presence of triphenylphosphine oxide, the
decomposition product of 3.138
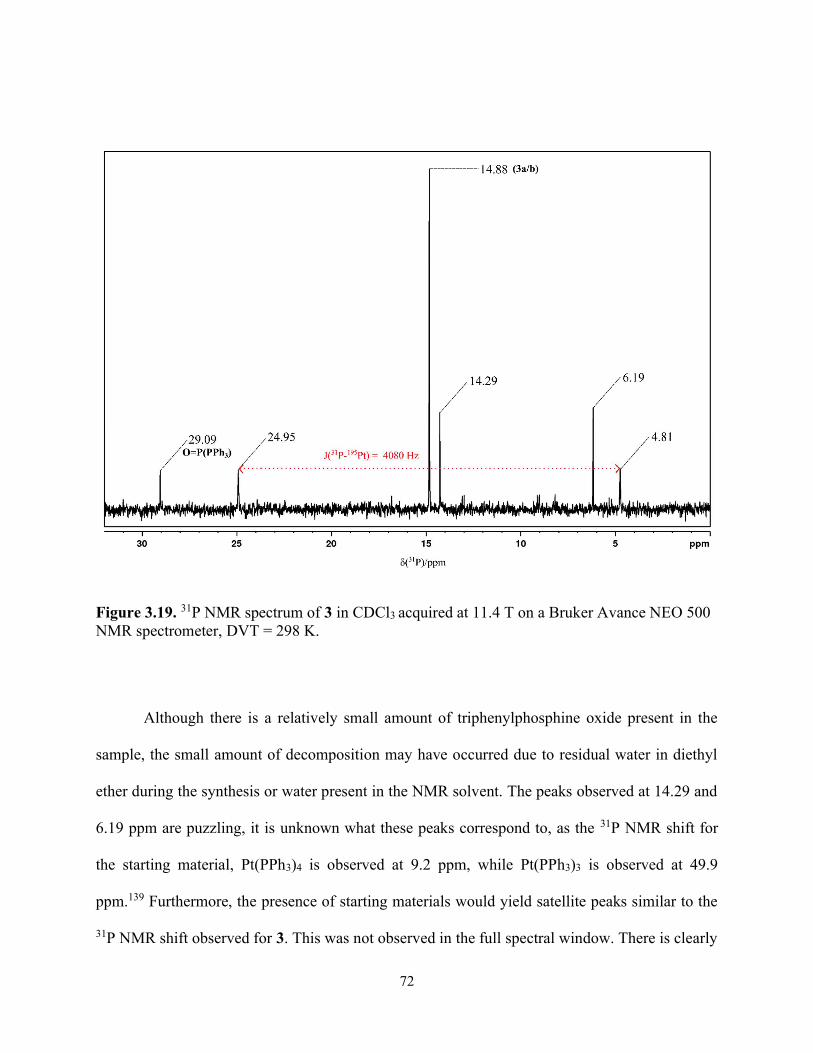
72
Figure 3.19. 31P NMR spectrum of 3 in CDCl3 acquired at 11.4 T on a Bruker Avance NEO 500 NMR spectrometer, DVT = 298 K.
Although there is a relatively small amount of triphenylphosphine oxide present in the
sample, the small amount of decomposition may have occurred due to residual water in diethyl
ether during the synthesis or water present in the NMR solvent. The peaks observed at 14.29 and
6.19 ppm are puzzling, it is unknown what these peaks correspond to, as the 31P NMR shift for
the starting material, Pt(PPh3)4 is observed at 9.2 ppm, while Pt(PPh3)3 is observed at 49.9
ppm.139 Furthermore, the presence of starting materials would yield satellite peaks similar to the
31P NMR shift observed for 3. This was not observed in the full spectral window. There is clearly
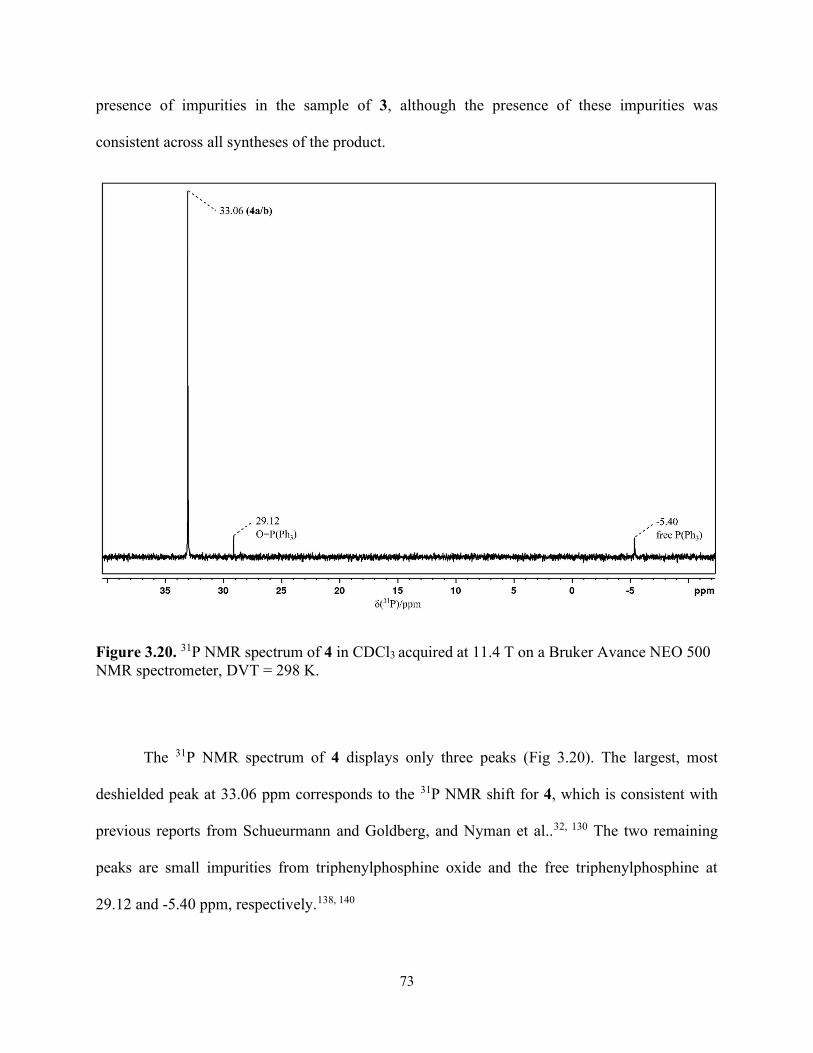
73
presence of impurities in the sample of 3, although the presence of these impurities was
consistent across all syntheses of the product.
Figure 3.20. 31P NMR spectrum of 4 in CDCl3 acquired at 11.4 T on a Bruker Avance NEO 500 NMR spectrometer, DVT = 298 K.
The 31P NMR spectrum of 4 displays only three peaks (Fig 3.20). The largest, most
deshielded peak at 33.06 ppm corresponds to the 31P NMR shift for 4, which is consistent with
previous reports from Schueurmann and Goldberg, and Nyman et al..32, 130 The two remaining
peaks are small impurities from triphenylphosphine oxide and the free triphenylphosphine at
29.12 and -5.40 ppm, respectively.138, 140
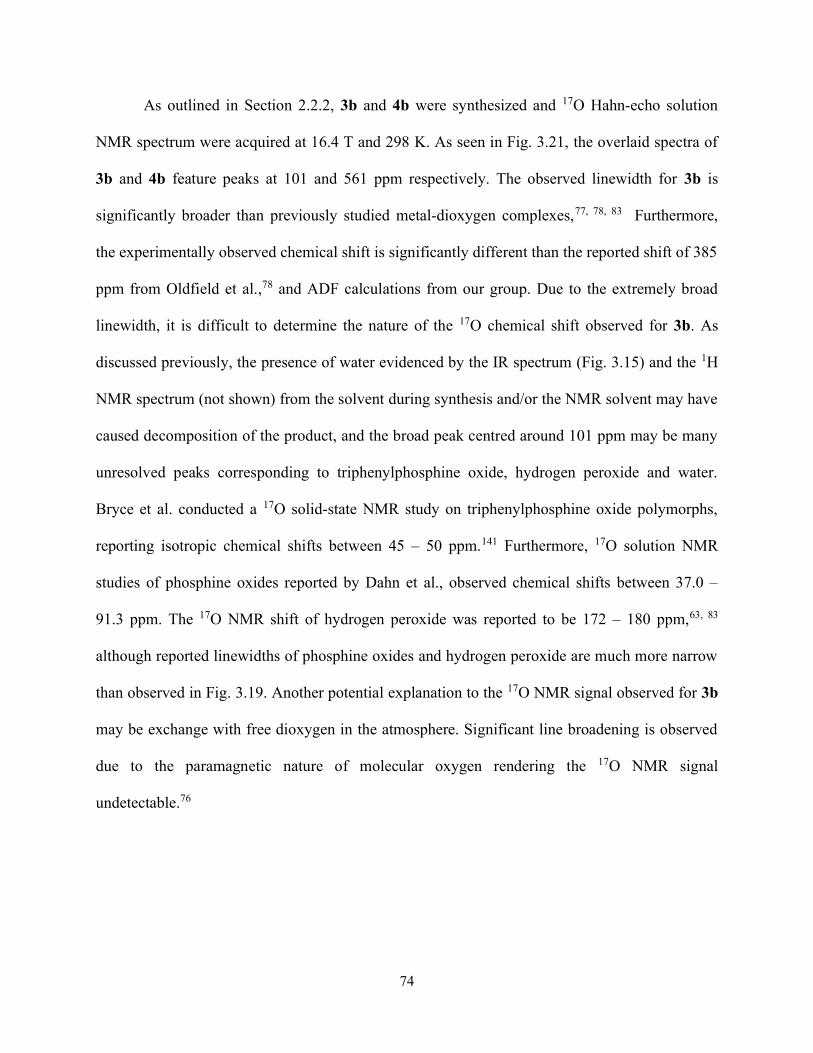
74
As outlined in Section 2.2.2, 3b and 4b were synthesized and 17O Hahn-echo solution
NMR spectrum were acquired at 16.4 T and 298 K. As seen in Fig. 3.21, the overlaid spectra of
3b and 4b feature peaks at 101 and 561 ppm respectively. The observed linewidth for 3b is
significantly broader than previously studied metal-dioxygen complexes,77, 78, 83 Furthermore,
the experimentally observed chemical shift is significantly different than the reported shift of 385
ppm from Oldfield et al.,78 and ADF calculations from our group. Due to the extremely broad
linewidth, it is difficult to determine the nature of the 17O chemical shift observed for 3b. As
discussed previously, the presence of water evidenced by the IR spectrum (Fig. 3.15) and the 1H
NMR spectrum (not shown) from the solvent during synthesis and/or the NMR solvent may have
caused decomposition of the product, and the broad peak centred around 101 ppm may be many
unresolved peaks corresponding to triphenylphosphine oxide, hydrogen peroxide and water.
Bryce et al. conducted a 17O solid-state NMR study on triphenylphosphine oxide polymorphs,
reporting isotropic chemical shifts between 45 – 50 ppm.141 Furthermore, 17O solution NMR
studies of phosphine oxides reported by Dahn et al., observed chemical shifts between 37.0 –
91.3 ppm. The 17O NMR shift of hydrogen peroxide was reported to be 172 – 180 ppm,63, 83
although reported linewidths of phosphine oxides and hydrogen peroxide are much more narrow
than observed in Fig. 3.19. Another potential explanation to the 17O NMR signal observed for 3b
may be exchange with free dioxygen in the atmosphere. Significant line broadening is observed
due to the paramagnetic nature of molecular oxygen rendering the 17O NMR signal
undetectable.76
75
Figure 3.21. 17O Hahn-echo NMR solution spectra of 3b (lb = 1000 Hz) and 4b (lb = 400 Hz) dissolved in CDCl3, acquired at 16.4 T on a Bruker Avance NEO 700 NMR spectrometer. DVT = 298 K, 180 ⁰ pulse, 64 W.
The observed chemical shift of 561 ppm and linewidth for 4b (~6.5 kHz), are comparable
to 17O NMR signals and linewidths observed for other metal-dioxygen complexes.77, 78, 83 Despite
the similarities in structure between 3b and 4b, their 17O NMR chemical shifts differ by nearly
200 ppm when compared to the shift reported by Oldfield et al..78 A more detailed discussion of
this comparison is addressed in Section 3.5.
76
3.4 Preliminary investigation and characterization of oxymyoglobin (oxyMb)
As discussed in Chapter 1, much of the interest in the synthesis and study of metal-
dioxygen complexes is motivated by furthering our understanding of biological molecules and
the processes which they undergo to sustain life on Earth. Many studies have focused on oxygen
carrying metalloproteins like myoglobin and hemoglobin. Myoglobin is a relatively small protein
with a molecular weight of ~17 kDa142 responsible for storing and transporting oxygen in muscle
tissue. Myoglobin contains two oxygen binding centres; two heme groups, which is composed of
an octahedral iron porphyrinogen that exists in the ferric (3+) oxidation state, called
metmyoglobin (metMb), or ferrous (2+) oxidation state, called deoxymyoglobin (deoxyMb) or
oxymyoglobin (oxyMb) (Fig. 3.22). The oxidation state of the heme groups in myoglobin is
important as oxygen binding and storage occurs only in the ferrous (2+) oxidation state.43 The
redox reactions of the iron centre in myoglobin occurs spontaneously in physiological
conditions143, but for the purposes of this experiment, metMb was reduced to deoxyMb using a
reducing agent (Equation [9]), sodium dithionite:
metMb(Fe3+)reducing agent
⎯⎯⎯⎯⎯⎯⎯⎯ deoxyMb(Fe2+)O2( )⎯⎯ oxyMb(Fe2+) [9]
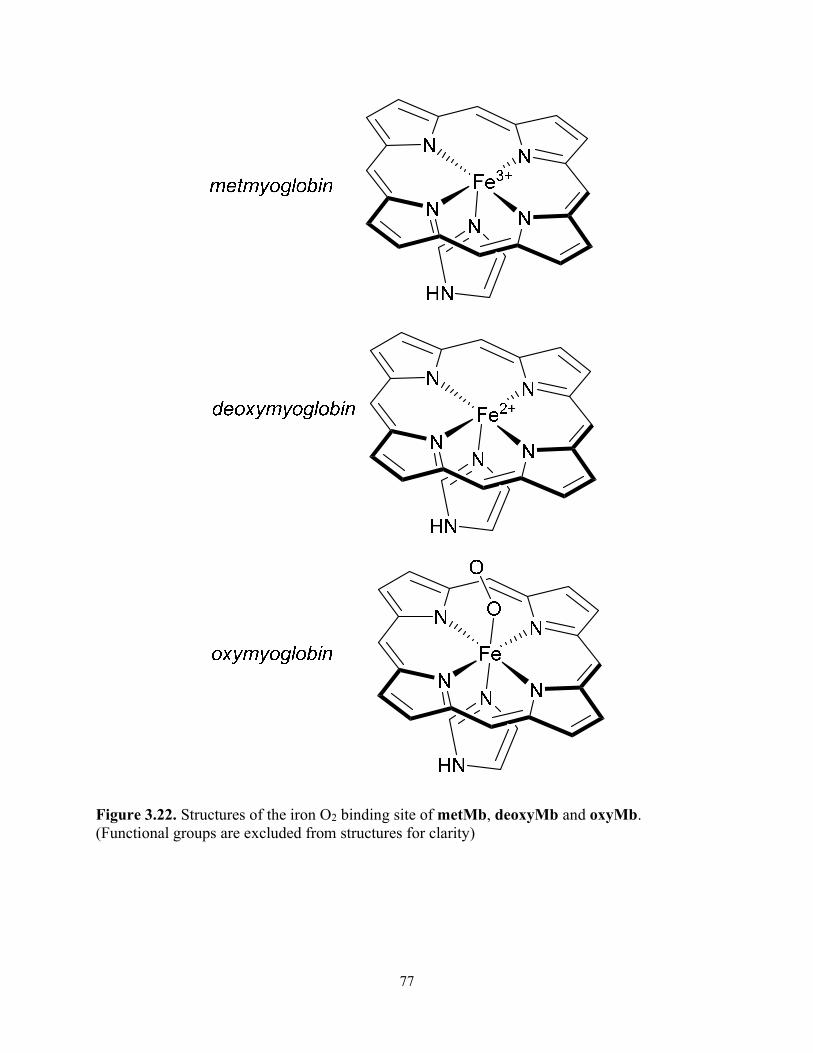
77
Figure 3.22. Structures of the iron O2 binding site of metMb, deoxyMb and oxyMb. (Functional groups are excluded from structures for clarity)
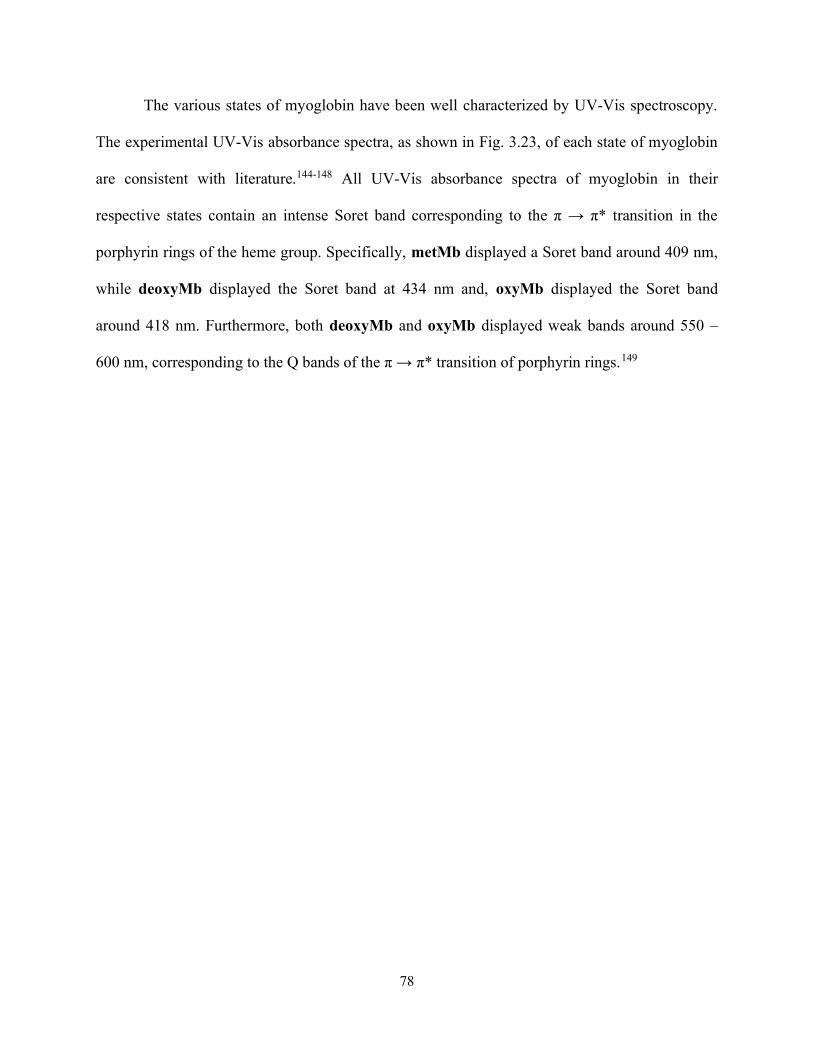
78
The various states of myoglobin have been well characterized by UV-Vis spectroscopy.
The experimental UV-Vis absorbance spectra, as shown in Fig. 3.23, of each state of myoglobin
are consistent with literature.144-148 All UV-Vis absorbance spectra of myoglobin in their
respective states contain an intense Soret band corresponding to the π → π* transition in the
porphyrin rings of the heme group. Specifically, metMb displayed a Soret band around 409 nm,
while deoxyMb displayed the Soret band at 434 nm and, oxyMb displayed the Soret band
around 418 nm. Furthermore, both deoxyMb and oxyMb displayed weak bands around 550 –
600 nm, corresponding to the Q bands of the π → π* transition of porphyrin rings.149
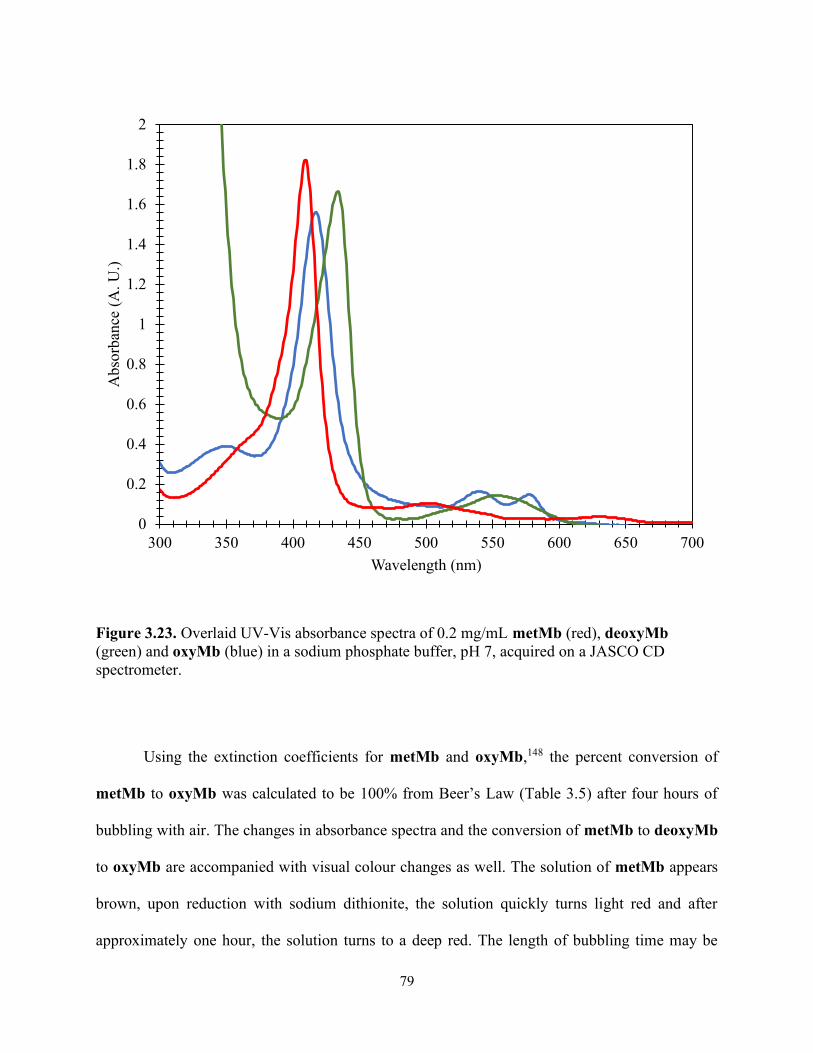
79
Figure 3.23. Overlaid UV-Vis absorbance spectra of 0.2 mg/mL metMb (red), deoxyMb (green) and oxyMb (blue) in a sodium phosphate buffer, pH 7, acquired on a JASCO CD spectrometer.
Using the extinction coefficients for metMb and oxyMb,148 the percent conversion of
metMb to oxyMb was calculated to be 100% from Beer’s Law (Table 3.5) after four hours of
bubbling with air. The changes in absorbance spectra and the conversion of metMb to deoxyMb
to oxyMb are accompanied with visual colour changes as well. The solution of metMb appears
brown, upon reduction with sodium dithionite, the solution quickly turns light red and after
approximately one hour, the solution turns to a deep red. The length of bubbling time may be
0
0.2
0.4
0.6
0.8
1
1.2
1.4
1.6
1.8
2
300 350 400 450 500 550 600 650 700
Abs
orba
nce
(A. U
.)
Wavelength (nm)
80
correlated to the concentration of oxygen in the air/system,147 although the solution was bubbled
in an open system, therefore it is likely that bubbling the solution for four hours was unnecessary
to convert all metmyoglobin to oxyMb.
Table 3.5. UV-Vis absorbance data of 0.2 mg/mL metMb and oxyMb in a sodium phosphate buffer at pH 7, acquired on JASCO CD spectrometer. Concentration of each solution was calculated using Beer's Law.
metMb (409 nm) oxyMb (418 nm)
Molar Extinction Coefficient (mM cm-1) 148 153 128
Absorbance 1.82 1.56
Concentration (mM) 0.012 0.012
Initially, the solution of oxymyoglobin was monitored for three days for autooxidation at
room temperature (298 K). The Soret band of oxyMb shift from 418 nm to 414 nm after day
two, and from 414 nm to 411 nm after day three, where it remained for the fourth day.
Furthermore, the Q-bands of oxyMb around 540 nm and 580 nm decreased in concentration over
the four days, corresponding to the autooxidation of oxyMb. Although, the concentration of
oxyMb decreased by more than half over one day with miniscule changes over the next three, it
is still evident in the spectra that some proportion of oxyMb still exists in solution but most, if
not all, of the sample has been oxidized. As mentioned in Section 1.1.3, the rate of autooxidation
is dependent on the nature of the protein itself; bovine, sperm whale, human and equine
myoglobin may all have very different autooxidation rates.41 Furthermore, autooxidation rate is
highly dependent on pH, where myoglobin is most stable against autooxidation at pH 8.5.42
Moreover, autooxidation rate is also dependent on temperature, where lower temperatures can
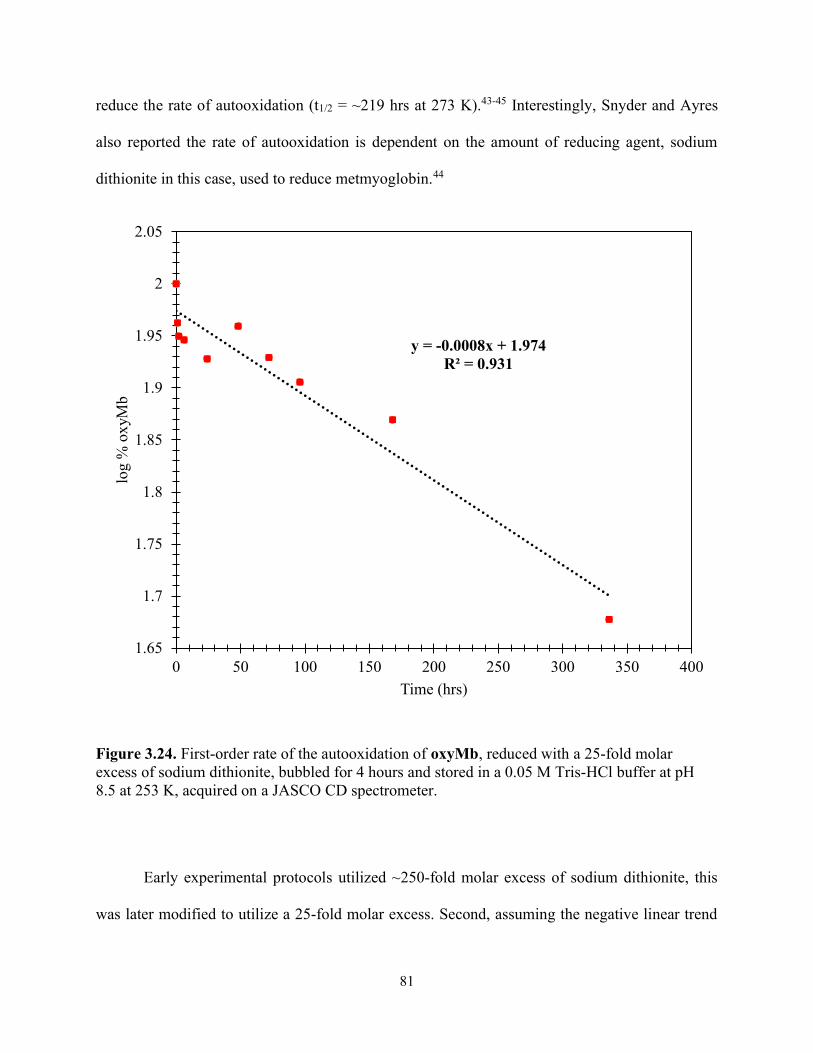
81
reduce the rate of autooxidation (t1/2 = ~219 hrs at 273 K).43-45 Interestingly, Snyder and Ayres
also reported the rate of autooxidation is dependent on the amount of reducing agent, sodium
dithionite in this case, used to reduce metmyoglobin.44
Figure 3.24. First-order rate of the autooxidation of oxyMb, reduced with a 25-fold molar excess of sodium dithionite, bubbled for 4 hours and stored in a 0.05 M Tris-HCl buffer at pH 8.5 at 253 K, acquired on a JASCO CD spectrometer.
Early experimental protocols utilized ~250-fold molar excess of sodium dithionite, this
was later modified to utilize a 25-fold molar excess. Second, assuming the negative linear trend
y = -0.0008x + 1.974R² = 0.931
1.65
1.7
1.75
1.8
1.85
1.9
1.95
2
2.05
0 50 100 150 200 250 300 350 400
log
% o
xyM
b
Time (hrs)

82
of logk and temperature44 continued below 273 K, we stored the sample at 253 K in a 0.05 M
Tris-HCl buffer at pH 8.5. By changing these two variables, we observed the rate of
autooxidation (k = (8.1 ± 0.8) x 10-4 hrs-1) (as seen in Fig. 3.24), where t1/2 = 850 hrs. This trend
is consistent with the literature,42-45 where the rate of autooxidation of myoglobin is significantly
reduced when reducing the amount of sodium dithionite used to reduce metmyoglobin and
storing oxymyoglobin at colder temperatures. Although from our experiments, we cannot
conclude the magnitude of the contributions from both reducing the amount of sodium dithionite
and reducing the storage temperature of oxymyoglobin on the rate of autooxidation. This
preliminary investigation of the stability and autooxidation kinetics of oxyMb have allowed us to
optimize the reaction conditions, storage, and handling of the product when we conduct our 17O
labelling of the FeO2 moiety in oxyMb utilizing the water electrolysis device constructed during
this project.
3.5 Summary of 17O NMR data
In this thesis, we have acquired new 17O NMR data for three metal-dioxygen complexes:
1b, 2b and 4b. As discussed previously, the 17O NMR chemical shifts observed for 1b and 2b are
the most shielded chemical shifts observed for metal-dioxygen complexes to date. Interestingly,
the chemical shifts of 1b and 2b are more like the 17O NMR chemical shifts of hydrogen
peroxide (δiso(17O) = 180 ppm) and lithium-peroxide (δiso(17O) = 227 ppm) reported by Curci et
al. and Lu et al.,62, 77 and Zhang et al.,63 respectively. A comparison of 17O NMR shifts of metal-
dioxygen complexes previously reported can be seen in Fig. 3.25.

83
Figure 3.25. Comparison of reported 17O NMR shifts of organic peroxides (green), µ-peroxo complexes (blue), η2-monoperoxo complexes (red circle), η2-diperoxo complexes (red triangle) and η1-superoxo complexes (black). The data points represented by black triangles are the bridging oxygen in η1-superoxo complexes, while the data points represented by black circles are the terminal oxygen in η1-superoxo complexes.
Reynolds et al, reports a trend in 17O NMR chemical shift, where metal-dioxygen
complexes with a η2-monoperoxo ligand generally have higher chemical shifts than adducts of
the same metal centre with a η2-diperoxo ligand.83 For example, in observing the vanadium-
peroxo complexes studied, complexes with η2-monoperoxo ligands have 17O NMR chemical
shifts reported between 532 – 660 ppm (although all complexes with the exception of one have

84
δ(17O) > 590 ppm), while complexes with η2-diperoxo ligands were reported at 444 and 450
ppm. This same trend was observed for molybdenum-dioxygen complexes.83
When observing the breadth 17O NMR data, a trend emerges when comparing the nature of
the dioxygen ligand. It appears that μ-peroxo ligands yield the most shielded 17O NMR shifts,
while 2-diperoxo ligands are also relatively shielded, followed by η2-monoperoxo ligands and,
1-superoxo ligands having significantly more deshielded 17O NMR signals than any peroxo-
type ligands (Fig. 3.25). Our observations of cobalt-μ-peroxo complexes have yielded signals
below 300 ppm for the first time. Further studies of non-cobalt metal-μ-peroxo complexes should
be conducted to confirm this statement.
Table 3.6. Summary of all 17O NMR chemical shifts and linewidths for metal-dioxygen complexes studied to date.
Species Solvent/buffer δ(17O2)/ ppm
Δν1/2 (Hz) Ref.
μ-peroxo
[(en)2Co(17O2)(OH)Co(en)2] 3+ (1b)
CD3CN 242 300-1000 This work
[(NH3)5Co(17O2)Co(NH3)5]4+ (2b) 7M NH3(aq) 208 5000 This work
2-peroxo
Pd(PPh3)217O2 (4b)
CDCl3 561 6500 This work
Pt(PPh3)217O2 CDCl3 385 9000 78
Ir(CO)Cl(17O2)(PPh3)2 CDCl3 325 10000 78
Ir(CO)I(17O2)(PPh3)2 CDCl3 350 10000 78
[VO(17O2)(H2O)(C5H3N(COO)2)]- 440 85
[VO(17O2)]+ 0.5 M HClO4 660 1200 83
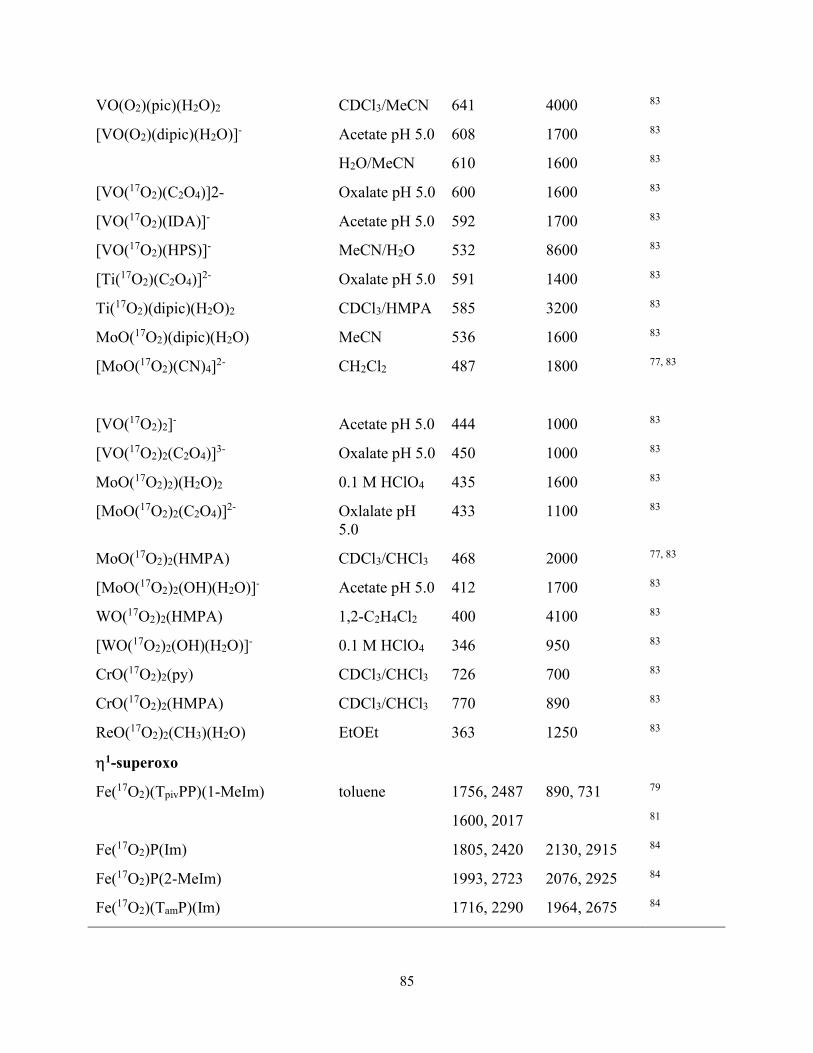
85
VO(O2)(pic)(H2O)2 CDCl3/MeCN 641 4000 83
[VO(O2)(dipic)(H2O)]- Acetate pH 5.0 608 1700 83
H2O/MeCN 610 1600 83
[VO(17O2)(C2O4)]2- Oxalate pH 5.0 600 1600 83
[VO(17O2)(IDA)]- Acetate pH 5.0 592 1700 83
[VO(17O2)(HPS)]- MeCN/H2O 532 8600 83
[Ti(17O2)(C2O4)]2- Oxalate pH 5.0 591 1400 83
Ti(17O2)(dipic)(H2O)2 CDCl3/HMPA 585 3200 83
MoO(17O2)(dipic)(H2O) MeCN 536 1600 83
[MoO(17O2)(CN)4]2- CH2Cl2 487 1800 77, 83
[VO(17O2)2]- Acetate pH 5.0 444 1000 83
[VO(17O2)2(C2O4)]3- Oxalate pH 5.0 450 1000 83
MoO(17O2)2)(H2O)2 0.1 M HClO4 435 1600 83
[MoO(17O2)2(C2O4)]2- Oxlalate pH 5.0
433 1100 83
MoO(17O2)2(HMPA) CDCl3/CHCl3 468 2000 77, 83
[MoO(17O2)2(OH)(H2O)]- Acetate pH 5.0 412 1700 83
WO(17O2)2(HMPA) 1,2-C2H4Cl2 400 4100 83
[WO(17O2)2(OH)(H2O)]- 0.1 M HClO4 346 950 83
CrO(17O2)2(py) CDCl3/CHCl3 726 700 83
CrO(17O2)2(HMPA) CDCl3/CHCl3 770 890 83
ReO(17O2)2(CH3)(H2O) EtOEt 363 1250 83
1-superoxo
Fe(17O2)(TpivPP)(1-MeIm) toluene 1756, 2487 890, 731 79
1600, 2017 81
Fe(17O2)P(Im) 1805, 2420 2130, 2915 84
Fe(17O2)P(2-MeIm) 1993, 2723 2076, 2925 84
Fe(17O2)(TamP)(Im) 1716, 2290 1964, 2675 84
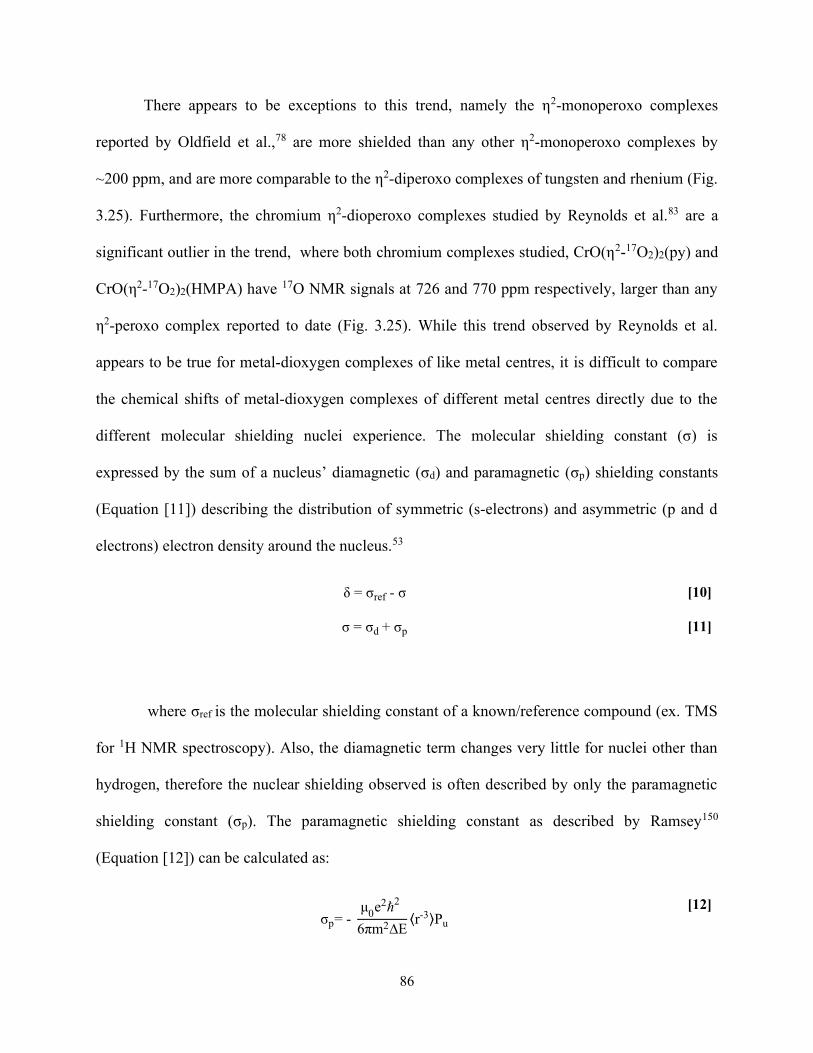
86
There appears to be exceptions to this trend, namely the η2-monoperoxo complexes
reported by Oldfield et al.,78 are more shielded than any other η2-monoperoxo complexes by
~200 ppm, and are more comparable to the η2-diperoxo complexes of tungsten and rhenium (Fig.
3.25). Furthermore, the chromium η2-dioperoxo complexes studied by Reynolds et al.83 are a
significant outlier in the trend, where both chromium complexes studied, CrO(η2-17O2)2(py) and
CrO(η2-17O2)2(HMPA) have 17O NMR signals at 726 and 770 ppm respectively, larger than any
η2-peroxo complex reported to date (Fig. 3.25). While this trend observed by Reynolds et al.
appears to be true for metal-dioxygen complexes of like metal centres, it is difficult to compare
the chemical shifts of metal-dioxygen complexes of different metal centres directly due to the
different molecular shielding nuclei experience. The molecular shielding constant (σ) is
expressed by the sum of a nucleus’ diamagnetic (σd) and paramagnetic (σp) shielding constants
(Equation [11]) describing the distribution of symmetric (s-electrons) and asymmetric (p and d
electrons) electron density around the nucleus.53
δ = σref - σ [10]
σ = σd + σp [11]
where σref is the molecular shielding constant of a known/reference compound (ex. TMS
for 1H NMR spectroscopy). Also, the diamagnetic term changes very little for nuclei other than
hydrogen, therefore the nuclear shielding observed is often described by only the paramagnetic
shielding constant (σp). The paramagnetic shielding constant as described by Ramsey150
(Equation [12]) can be calculated as:
σp= - μ0e2ℏ2
6πm2∆E⟨r-3⟩Pu
[12]
87
where <r-3> is the average inverse cube distance of the valence p electron from the nucleus, and
Pu is the p electron imbalance, in which the terms of Pu are related to charge densities and bond
order. Determining the paramagnetic shielding constant requires detailed computation and
knowledge of the excited state wavefunctions of the nucleus in question.53 Therefore, further
studies will have to be conducted to determine the effect of this term on the observed 17O NMR
shifts of metal-dioxygen complexes.
88
4 Conclusion and Future Works
In this thesis, we investigated a novel synthesis of 17O-labeled metal-dioxygen complexes.
In particular, a small alkaline water electrolysis device was constructed to hold 3 – 5 mL of
H217O, from which pure 17O2 gas was collected over water at a rate of 6.1 x 10⁻⁴ mol O2/hr. This
17O2 gas was then used in the synthesis of metal-dioxygen complexes for the purposes of 17O
NMR studies. Syntheses in aqueous media, as for 1b and 2b allowed for simple introduction of
reactants directly into the 17O2 storage vessel. For syntheses that require dry 17O2 gas as for 3b
and 4b, a Drierite moisture trap was employed to dry 17O2 prior to synthesis. The 17O-labeled
metal-dioxygen complexes were isolated and characterized by vibrational and NMR
spectroscopies. New 1H and 13C NMR data and a full assignment of the ethylene and amino
protons/carbons in the ethylenediamine ligands of 1 were reported. 17O labelling of the μ-peroxo
ligand in 1b and of the μ-hydroxo ligand in 1c was achieved using H217O-electrolysis and
exchange, respectively, and new 17O NMR data were reported for both ligands. The µ-hydroxo
ligand in 1c yielded highly shielded chemical shifts (δiso(17O) = -239 ppm, δiso(1H) = -2.43 ppm),
indicating a large shielding effect from the cobalt(III) metal centres. The μ-peroxo ligand in the
second metal-dioxygen complex, 2b, displayed a 17O NMR signal at 208 ppm, which is the most
shielded chemical shift observed to date for metal-dioxygen complexes.
Samples of M(PPh3)2(η2-O2) (M = Pt, Pd, O = 16O, 17O) 3 and 4 were characterized by IR,
31P and 17O NMR spectroscopies. We report 1J(31P – 195Pt) = 4080 Hz for 3 from the satellite
peaks of the 31P NMR chemical shift of 3 (14.88 ppm). Further 31P NMR experiments for 3
yielded mysterious impurity peaks at 14.29 and 6.19 ppm, with a small presence of
triphenylphosphine oxide (29.09 ppm). 17O NMR data recorded do not agree with previous
reports,78 which may be due to the presence of impurities and/or water in the sample.

89
Conversely, samples of 4 were pure and we report new 17O NMR data for this complex (4b)
(δiso(17O) = 561 ppm), consistent with the previously observed 17O NMR data for the 2-peroxo
type of metal-dioxygen complexes.
Lastly, we conducted a preliminary study on the synthesis and autooxidation of oxyMb, in
which we investigate the storage conditions for the metalloprotein. We determined that storage
of oxyMb is significantly improved at 253 K in a 0.05 M Tris-HCl buffer at pH 8.5 compared to
298 K in the solid-state, which is consistent with previous literature reports.42-45 For equine
skeletal muscle oxyMb, we report the autooxidation rate constant to be (8.1 ± 0.8) x 10-4 hrs-1,
corresponding to t1/2 = 850 hrs. From these studies, we conclude that oxyMb is stable enough to
be 17O labelled by the H217O-electrolysis procedure developed in this thesis and that 17O-labeled
oxyMb will be an important future 17O NMR study.
This thesis reports the first set of 17O NMR spectroscopic data for dinuclear metal-μ-peroxo
complexes. We observed that the μ-peroxo complexes exhibit more shielded 17O NMR signals
than the well-studied mononuclear 2-peroxo complexes. This observation should be explored by
extending the synthesis of 17O labelled dinuclear μ-peroxo complexes beyond cobalt(III).
Furthermore, the trends in these chemical shifts should be explored further by determination of
17O NMR tensors through theoretical and experimental studies. Furthermore, solid-state NMR
studies serve as a promising tool in probing the fine electronic structure of some metal-dioxygen
complexes, namely the hemoproteins that have been long debated since first characterized.36, 37,
46-48, 50, 81, 151
We recommend that building/purchasing a PEM electrolysis device would be advantageous
in the long-term, as many of the design difficulties discussed in Chapter 2 may have been
90
avoided or mitigated. Furthermore, the overall higher efficiency and shorter reaction times would
allow for a lower cost and more time to explore viable metal-dioxygen complexes in the long-
term. Nonetheless, H217O electrolysis is a viable option for the 17O labelling of metal-dioxygen
complexes to the conventional methods of using exceedingly expensive 17O2(g) or H217O2 and
may be applied to synthesize oxygen carriers to potentially further our understanding of the
catalytic properties and biochemical processes many of these complexes undergo.
91
References
1. Schmidt-Rohr, K., Oxygen Is the High-Energy Molecule Powering Complex Multicellular Life: Fundamental Corrections to Traditional Bioenergetics. ACS Omega 2020, 5 (5), 2221-2233. 2. Grant, M. C.; Geoghegan, L.; Arbyn, M.; Mohammed, Z.; McGuinness, L.; Clarke, E. L.; Wade, R. G., The prevalence of symptoms in 24,410 adults infected by the novel coronavirus (SARS-CoV-2; COVID-19): A systematic review and meta-analysis of 148 studies from 9 countries. PLoS One 2020, 15 (6), e0234765. 3. Xydakis, M. S.; Dehgani-Mobaraki, P.; Holbrook, E. H.; Geisthoff, U. W.; Bauer, C.; Hautefort, C.; Herman, P.; Manley, G. T.; Lyon, D. M.; Hopkins, C., Smell and taste dysfunction in patients with COVID-19. Infect. Dis. 2020, 20 (9), 1015-1016. 4. Alayash, A. I., The Impact of COVID-19 Infection on Oxygen Homeostasis: A Molecular Perspective. Front. Physiol. 2021, 12, 1-8. 5. Cavezzi, A.; Troiani, E.; Corrao, S., COVID-19: Hemoglobin, Iron, and Hypoxia beyond Inflammation. A Narrative Review. Clin. Pract. 2020, 10 (2), 24-30. 6. Majeed, A.; Shajar, M. A., Is hemoglobin the missing link in the pathogenesis of COVID-19? Anaesth., Pain Intensive Care 2020, 24 (1), 9-14. 7. Ehsani, S., COVID-19 and iron dysregulation: distant sequence similarity between hepcidin and the novel coronavirus spike glycoprotein. Biol. Direct 2020, 15 (1), 1-13. 8. Gubelmann, M. H.; Williams, A. F., The structure and reactivity of dioxygen complexes of the transition metals. In Transition Metal Complexes Structures and Spectra, Springer: Berlin, Heidelberg, 1983; Vol. 55, pp 1-65. 9. Vaska, L., Dioxygen-metal complexes: toward a unified view. Acc. Chem. Res. 1976, 9 (5), 175-183. 10. Herzberg, G., Molecular Spectra and Molecular Structure 2nd ed. Van Nostrand: New York, 1950. 11. Abrahams, S. C., The stereochemistry of sub-group VIB of the periodic table. Q. Rev. Chem. Soc. 1956, 10 (4), 407-436. 12. Jones, R. D.; Summerville, D. A.; Basolo, F., Synthetic oxygen carriers related to biological systems. Chem. Rev. 1979, 79 (2), 139-179. 13. Niederhoffer, E. C.; Timmons, J. H.; Martell, A. E., Thermodynamics of oxygen binding in natural and synthetic dioxygen complexes. Chem. Rev. 1984, 84 (2), 137-203. 14. Creighton, J. A.; Lippincott, E. R., Vibrational Frequency and Dissociation Energy of the Superoxide Ion. J. Chem. Phys. 1964, 40 (6), 1779-1780. 15. Halverson, F., Comments on potassium superoxide structure. Phys. Chem. Solids 1962, 23 (3), 207-214. 16. Evans, J. C., The peroxide-ion fundamental frequency. J. Chem. Soc. D. 1969, (12), 682-683. 17. Blunt, F. J.; Hendra, P. J.; Mackenzie, J. R., The laser Raman spectra of salts containing the anions O2– and O2
2–. J. Chem. Soc. D. 1969, (6), 278-279. 18. Basolo, F.; Hoffman, B. M.; Ibers, J. A., Synthetic oxygen carriers of biological interest. Acc. Chem. Res. 1975, 8 (11), 384-392. 19. Sykes, A. G.; Weil, J. A., The Formation, Structure, and Reactions of Binuclear Complexes of Cobalt. In Progress in Inorganic Chemistry, Edwards, J. O., Ed. 1970; pp 1-106. 20. Fremy, E., Untersuchungen über das Kobalt. Justus Liebigs Ann. Chem. 1852, 83 (3), 289-317. 21. Werner, A., Über mehrkernige Metallammoniake. Justus Liebigs Ann. Chem. 1910, 375 (1), 1-144. 22. Schiff, H., Mittheilungen aus dem Universitätslaboratorium in Pisa: Eine neue Reihe organischer Basen. Justus Liebigs Ann. Chem. 1864, 131 (1), 118-119. 23. Charles, R. G.; Barnartt, S., Reactions of decammino-μ-peroxo-dicobalt(III) sulphate with aqueous sulphuric acid. J. Inorg. Nucl. Chem. 1961, 22 (1), 69-76.
92
24. Foong, S. W.; Miller, J. D.; Oliver, F. D., Uptake of gaseous oxygen by aqueous solutions containing cobalt ions and diaminoethane. J. Chem. Soc. A 1969, 2847-2850. 25. Bosnich, B.; Boucher, H.; Marshall, C., Dissymmetric arsine complexes. Cobalt hydrides and cobalt dioxygen complexes. Inorg. Chem. 1976, 15 (3), 634-638. 26. Chen, D.; Martell, A. E.; Sun, Y., New synthetic cobalt Schiff base complexes as oxygen carriers. Inorg. Chem. 1989, 28 (13), 2647-2652. 27. Shahid, M.; Siddique, A.; Ansari, I. A.; Sama, F.; Chibber, S.; Khalid, M.; Siddiqi, Z. A.; Faizi, S. H., Syntheses, crystal structures, and genotoxic studies of cis-µ-1,2-peroxo dicobalt(III) complexes. J. Coord. Chem. 2015, 68 (5), 848-862. 28. Vaska, L.; DiLuzio, J. W., Carbonyl and hydroiodo-carbonyl complexes of iridium by reaction with alcohols. Hydroidodo complexes by reaction with acid. J. Am. Chem. Soc. 1961, 83 (12), 2784-2785. 29. Vaska, L., Oxygen-Carrying Properties of a Simple Synthetic System. Science 1963, 140 (3568), 809-810. 30. Valentine, J. S., Dioxygen ligand in mononuclear Group VIII transition metal complexes. Chem. Rev. 1973, 73 (3), 235-245. 31. Wilke, G.; Schott, H.; Heimbach, P., Oxygen Complexes of Zerovalent Nickel, Palladium, and Platinum. Angew. Chem. Int. Ed. 1967, 6 (1), 92-93. 32. Nyman, C. J.; Wymore, C. E.; Wilkinson, G., Reactions of tris(triphenylphosphine)platinum(0) and tetrakis(triphenylphosphine)palladium(0) with oxygen and carbon dioxide. J. Chem. Soc. A 1968, 561-563. 33. McGinnety, J. A.; Payne, N. C.; Ibers, J. A., Role of the metal atom in the reversible uptake of molecular oxygen. The structures of the molecular oxygen complexes formed by bis[bis(diphenylphosphino)ethane]iridium(I)hexafluorophosphate and its rhodium analog. J. Am. Chem. Soc. 1969, 91 (23), 6301-6310. 34. York, J. T.; Llobet, A.; Cramer, C. J.; Tolman, W. B., Heterobimetallic Dioxygen Activation: Synthesis and Reactivity of Mixed Cu−Pd and Cu−Pt Bis(μ-oxo) Complexes. J. Am. Chem. Soc. 2007, 129 (25), 7990-7999. 35. Jones, B. H.; Huber, C. J.; Massari, A. M., Solvation Dynamics of Vaska’s Complex by 2D-IR Spectroscopy. J. Phys. Chem. C 2011, 115 (50), 24813-24822. 36. Pauling, L.; Coryell, C. D., The Magnetic Properties and Structure of Hemoglobin, Oxyhemoglobin and Carbonmonoxyhemoglobin. Proc. Natl. Acad. Sci. U. S. A. 1936, 22 (4), 210-216. 37. Griffith, J. S.; Roughton, F. J. W., On the magnetic properties of some haemoglobin complexes. Proc. R. Soc. Lond. A 1956, 235 (1200), 23-36. 38. Phillips, S. E. V., Structure and refinement of oxymyoglobin at 1·6 Å resolution. J. Mol. Biol. 1980, 142 (4), 531-554. 39. Shaanan, B., Structure of human oxyhaemoglobin at 2·1 resolution. J. Mol. Biol. 1983, 171 (1), 31-59. 40. Brooks, J.; Keilin, D., The oxidation of haemoglobin to methaemoglobin by oxygen - II; The relation between the rate of oxidation and the partial pressure of oxygen. Proc. R. Soc. Lond. B 1935, 118 (811), 560-577. 41. Shikama, K., The Molecular Mechanism of Autoxidation for Myoglobin and Hemoglobin: A Venerable Puzzle. Chemical Reviews 1998, 98 (4), 1357-1374. 42. Shikama, K.; Yokota, K.-N.; Yamazaki, I., Preparation of Crystalline Oxymyoglobin from Horse Heart. J. Biol. Chem. 1964, 239 (12), 4151-4153. 43. Arcon, J. P.; Rosi, P.; Petruk, A. A.; Marti, M. A.; Estrin, D. A., Molecular mechanism of myoglobin autoxidation: insights from computer simulations. J. Phys. Chem. B 2015, 119 (5), 1802-13. 44. Snyder, H., E.; Ayres, J. C., The Autoxidation of Crystallized Beef Myoglobin. Food Sci. 1961, 26 (5), 469-474. 45. Satoh, Y.; Shikama, K., Autoxidation of oxymyoglobin. A nucleophilic displacement mechanism. J. Biol. Chem. 1981, 256 (20), 10272-10275.
93
46. Weiss, J. J., Nature of the Iron–Oxygen Bond in Oxyhæmoglobin. Nature 1964, 202 (4927), 83-84. 47. McClure, D. S., Electronic Structure of Transition-Metal Complex Ions. Rad. Res. Suppl. 1960, 2, 218-242. 48. Harcourt, R. D., Increased-valence formulae and the bonding of oxygen to haemoglobin. Int. J. Quantum Chem. 1971, 5 (5), 479-495. 49. Harcourt, R. D., Comment on a CASSCF study of the Fe-O2 bond in a dioxygen heme complex. Chem. Phys. Lett. 1990, 167 (4), 374-377. 50. Goddard, W. A.; Olafson, B. D., Ozone Model for Bonding of an O2 to Heme in Oxyhemoglobin. Proc. Natl. Acad. Sci. U. S. A. 1975, 72 (6), 2335-2339. 51. Kalemos, A.; Mavridis, A., Electronic structure and bonding of ozone. J. Chem. Phys. 2008, 129 (5), 1-8. 52. Li, J.; Noll, B. C.; Oliver, A. G.; Schulz, C. E.; Scheidt, W. R., Correlated Ligand Dynamics in Oxyiron Picket Fence Porphyrins: Structural and Mössbauer Investigations. J. Am. Chem. Soc. 2013, 135 (41), 15627-15641. 53. Harris, R. K., Nuclear Magnetic Resonance Spectroscopy: A Physiochemical View. Pitman: London, 1983. 54. Wu, G., 17O NMR studies of organic and biological molecules in aqueous solution and in the solid state. Prog. Nucl. Magn. Reson. Spectosc. 2019, 114-115, 135-191. 55. Wu, G., Solid-state 17O NMR studies of organic and biological molecules. Prog. Nucl. Magn. Reson. Spectosc. 2008, 52 (2-3), 118-169. 56. Palmer, J.; Wu, G., Recent developments in 17O NMR studies of organic and biological molecules in the solid state. Annu. Rep. NMR Spectrosc. 2021, 103, 1-46. 57. Wu, G., Solid-State 17O NMR studies of organic and biological molecules: Recent advances and future directions. Solid State Nucl. Magn. Reson. 2016, 73, 1-14. 58. Yamada, K., Chapter 3 - Recent Applications of Solid-State 17O NMR. Annu. Rep. NMR Spectrosc. 2010, 70, 115-158. 59. Wong, A.; Poli, F., Chapter Three - Solid-State 17O NMR Studies of Biomolecules. Annu. Rep. NMR Spectrosc. 2014, 83, 145-220. 60. Lemaı̂tre, V.; Smith, M. E.; Watts, A., A review of oxygen-17 solid-state NMR of organic materials—towards biological applications. Solid State Nucl. Magn. Reson. 2004, 26 (3), 215-235. 61. Wu, G., Recent developments in solid-state nuclear magnetic resonance of quadrupolar nuclei and applications to biological systems. Biochem. Cell Biol. 1998, 76 (2-3), 429-442. 62. Lu, J.; Kong, X.; Terskikh, V.; Wu, G., Solid-State 17O NMR of Oxygen–Nitrogen Singly Bonded Compounds: Hydroxylammonium Chloride and Sodium Trioxodinitrate (Angeli’s Salt). J. Phys. Chem. A 2015, 119 (29), 8133-8138. 63. Zhang, S.; Nava, M. J.; Chow, G. K.; Lopez, N.; Wu, G.; Britt, D. R.; Nocera, D. G.; Cummins, C. C., On the incompatibility of lithium–O2 battery technology with CO2. Chem. Sci. 2017, 8 (9), 6117-6122. 64. Kong, X.; Terskikh, V.; Toubaei, A.; Wu, G., A solid-state 17O NMR study of platinum-carboxylate complexes: carboplatin and oxaliplatin. Can. J. Chem. 2015, 93 (9), 945-953. 65. Kong, X.; Dai, Y.; Wu, G., Solid-state 17O NMR study of 2-acylbenzoic acids and warfarin. Solid State Nucl. Magn. Reson. 2017, 84, 59-64. 66. Wang, W. D.; Lucier, B. E. G.; Terskikh, V. V.; Wang, W.; Huang, Y., Wobbling and Hopping: Studying Dynamics of CO2 Adsorbed in Metal–Organic Frameworks via 17O Solid-State NMR. J. Phys. Chem. Lett. 2014, 5 (19), 3360-3365. 67. Bignami, G. P. M.; Davis, Z. H.; Dawson, D. M.; Morris, S. A.; Russell, S. E.; McKay, D.; Parke, R. E.; Iuga, D.; Morris, R. E.; Ashbrook, S. E., Cost-effective 17O enrichment and NMR spectroscopy of mixed-metal terephthalate metal–organic frameworks. Chem. Sci. 2018, 9, 850-859.
94
68. Martins, V.; Xu, J.; Wang, X.; Chen, K.; Hung, I.; Gan, Z.; Gervais, C.; Bonhomme, C.; Jiang, S.; Zheng, A.; Lucier, B. E. G.; Huang, Y., Higher Magnetic Fields, Finer MOF Structural Information: 17O Solid-State NMR at 35.2 T. J. Am. Chem. Soc. 2020, 142 (35), 14877-14889. 69. Martins, V.; Xu, J.; Hung, I.; Gan, Z.; Gervais, C.; Bonhomme, C.; Huang, Y., 17O solid‐state NMR at ultrahigh magnetic field of 35.2 T: Resolution of inequivalent oxygen sites in different phases of MOF MIL‐53(Al). Magn. Reson. Chem. 2021, 59, 940-951. 70. Kong, X.; Terskikh, V. V.; Khade, R. L.; Yang, L.; Rorick, A.; Zhang, Y.; He, P.; Huang, Y.; Wu, G., Solid-State 17O NMR Spectroscopy of Paramagnetic Coordination Compounds. Angew. Chem. Int. Ed. 2015, 54 (16), 4753-4757. 71. Zhu, J.; Kwan, I. C. M.; Wu, G., Quadrupole-Central-Transition 17O NMR Spectroscopy of Protein−Ligand Complexes in Solution. J. Am. Chem. Soc. 2009, 131 (40), 14206-14207. 72. Lin, B.; Hung, I.; Gan, Z.; Chien, P. H.; Spencer, H. L.; Smith, S. P.; Wu, G., 17O NMR Studies of Yeast Ubiquitin in Aqueous Solution and in the Solid State. ChemBioChem 2020, 21, 1-5. 73. Shen, J.; Terskikh, V.; Struppe, J.; Hassan, A.; Monette, M.; Hung, I.; Gan, Z.; Brinkmann, A.; Wu, G., Solid-State 17O NMR study of α-D-glucose: exploring new frontiers in isotopic labelling, sensitivity enhancement, and NMR crystallography. Chem. Sci. 2022, in press. , DOI: 10.1039/D1SC06060K. 74. Theodorou, V.; Skobridis, K.; Alivertis, D.; Gerothanassis, I. P., Synthetic methodologies in organic chemistry involving incorporation of [17O] and [18O] isotopes. J. Label Compd. Radiopharm. 2014, 57 (8), 481-508. 75. Lapidot, A.; Irving, C. S., Oxygen-17 nuclear magnetic resonance spectroscopy and iridium and rhodium molecular oxygen complexes. J. Chem. Soc., Dalton Trans. 1972, (5), 668-670. 76. Postel, M.; Brevard, C.; Arzoumanian, H.; Riess, J. G., Oxygen-17 NMR as a tool for studying oxygenated transition-metal derivatives: first direct oxygen-17 NMR observations of transition-metal-bonded peroxidic oxygen atoms. Evidence for the absence of oxo-peroxo oxygen exchange in molybdenum(VI) compounds. J. Am. Chem. Soc. 1983, 105 (15), 4922-4926. 77. Curci, R.; Fusco, G.; Sciacovelli, O.; Troisi, L., 17O NMR of organic peroxides: chromium(VI) and molybdenum(VI) oxide diperoxide as compared to simple organic peroxides. J. Mol. Catal. 1985, 32 (2), 251-257. 78. Lee, H. C.; Oldfield, E., High-Field Oxygen-17 Nuclear Magnetic Resonance Spectroscopic Observation of 17O2 in Vaska’s Compound (Ir(CO)X(O2)(PPh3)2; X = Cl, I) and in Pt(O2)(PPh3)2. J. Magn. Reson. 1986, 69, 368-370. 79. Momenteau, M.; Gerothanassis, I. P., 17O NMR Spectroscopy as a Tool for Studying Synthetic Oxygen Carriers Related to Biological Systems: Application to a Synthetic Single-Face Hindered Iron Porphyrin-Dioxygen Complex in Solution. J. Am. Chem. Soc. 1987, 109, 6944-6947. 80. Solomon, I. J.; Keith, J. N.; Kacmarek, A. J.; Raney, J. K., Additional studies concerning the existence of "O3F2". J. Am. Chem. Soc. 1968, 90 (20), 5408-5411. 81. Oldfield, E.; Lee, H. C.; Coretsopoulos, C.; Adebodun, F.; Park, K. D.; Yang, S.; Chung, J.; Phillips, B., Solid-state oxygen-17 nuclear magnetic resonance spectroscopic studies of [17O2] picket fence porphyrin, myoglobin, and hemoglobin. J. Am. Chem. Soc. 1991, 113 (23), 8680-8685. 82. Gerothanassis, I. P.; Loock, B.; Momenteau, M., Structural differences of the iron–dioxygen moiety of haemoprotein models with and without an axial hindered base as revealed by 17O NMR and FTIR spectroscopy in solution. J. Chem. Soc. Chem. Commun. 1992, (8), 598-600. 83. Reynolds, M. S.; Butler, A., Oxygen-17 NMR, Electronic, and Vibrational Spectroscopy of Transition Metal Peroxo Complexes: Correlation with Reactivity. Inorg. Chem. 1996, 35 (8), 2378-2383. 84. Kaupp, M.; Rovira, C.; Parrinello, M., Density Functional Study of 17O NMR Chemical Shift and Nuclear Quadrupole Coupling Tensors in Oxyheme Model Complexes. J. Phys. Chem. B 2000, 104 (21), 5200-5208. 85. Gupta, R.; Stringer, J.; Struppe, J.; Rehder, D.; Polenova, T., Direct detection and characterization of bioinorganic peroxo moieties in a vanadium complex by 17O solid-state NMR and density functional theory. Solid State Nucl. Magn. Reson. 2018, 91, 15-20.
95
86. Harrison, K.; Levene, J. I., Electrolysis of Water. In Solar Hydrogen Generation, Rajeshwar, K.; McConnell, R.; Licht, S., Eds. Springer New York: New York, NY, 2008; pp 41-63. 87. Scott, K., Introduction to Electrolysis, Electrolysers and Hydrogen Production. In Electrochemical Methods for Hydrogen Production, The Royal Society of Chemistry: 2020; pp 1-27. 88. de Levie, R., The electrolysis of water. J. Electroanal. Chem. 1999, 476 (1), 92-93. 89. Baykara, S. Z., Hydrogen: A brief overview on its sources, production and environmental impact. Int. J. Hydrogen Energy 2018, 43 (23), 10605-10614. 90. Zeng, K.; Zhang, D., Recent progress in alkaline water electrolysis for hydrogen production and applications. Prog. Energy Combust. Sci. 2010, 36 (3), 307-326. 91. Seetharaman, S.; Balaji, R.; Ramya, K.; Dhathathreyan, K. S.; Velan, M., Graphene oxide modified non-noble metal electrode for alkaline anion exchange membrane water electrolyzers. Int. J. Hydrogen Energy 2013, 38 (35), 14934-14942. 92. Vermeiren, P.; Adriansens, W.; Moreels, J. P.; Leysen, R., Evaluation of the Zirfon® separator for use in alkaline water electrolysis and Ni-H2 batteries. Int. J. Hydrogen Energy 1998, 23 (5), 321-324. 93. Shiva Kumar, S.; Himabindu, V., Hydrogen production by PEM water electrolysis – A review. Mat. Sci. Energy Technol. 2019, 2 (3), 442-454. 94. Grubb, W. T., Batteries with Solid Ion Exchange Electrolytes. J. Electrochem. Soc. 1959, 106 (4), 275-277. 95. Grubb, W. T.; Niedrach, L. W., Batteries with Solid Ion-Exchange Membrane Electrolytes. J. Electrochem. Soc. 1960, 107 (2), 131-135. 96. Khan, M. A.; Zhao, H.; Zou, W.; Chen, Z.; Cao, W.; Fang, J.; Xu, J.; Zhang, L.; Zhang, J., Recent Progresses in Electrocatalysts for Water Electrolysis. Electrochem. Energ. Rev. 2018, 1 (4), 483-530. 97. Ju, H.; Badwal, S.; Giddey, S., A comprehensive review of carbon and hydrocarbon assisted water electrolysis for hydrogen production. Appl. Energy 2018, 231, 502-533. 98. Grigoriev, S. A.; Porembsky, V. I.; Fateev, V. N., Pure hydrogen production by PEM electrolysis for hydrogen energy. Int. J. Hydrogen Energy 2006, 31 (2), 171-175. 99. Millet, P.; Ngameni, R.; Grigoriev, S. A.; Mbemba, N.; Brisset, F.; Ranjbari, A.; Etiévant, C., PEM water electrolyzers: From electrocatalysis to stack development. Int. J. Hydrogen Energy 2010, 35 (10), 5043-5052. 100. Grigoriev, S. A.; Millet, P.; Fateev, V. N., Evaluation of carbon-supported Pt and Pd nanoparticles for the hydrogen evolution reaction in PEM water electrolysers. J. Power Sources 2008, 177 (2), 281-285. 101. Thewalt, U.; Struckmeier, G., Kobalt-Komplexe mit O2-Brücken: Die Struktur der Kationen μ-Hydroxo-μ-peroxo-bis[bis(äthylendiamin) kobalt(III)]3+ und μ-Hydroxo-μ-superoxo-bis[bis (äthylendiamin)kobalt(III)]4+. Z. anorg. allg. Chem. 1976, 419 (2), 163-170. 102. Fallab, S.; Zehnder, M.; Thewalt, U., Reactions of oxygenated cobalt (II) complexes. XIII. Diastereoisomeric forms of μ-peroxo-μ-hydroxo-bis[bis(ethylenediamine) cobalt(III)]. Preparation, X-ray structure determination and reactivity. Helv. Chim. Acta 1980, 63 (6), 1491-1498. 103. Shankar, K.; Baruah, J. B., A stable peroxo- and hydroxido-bridged dinuclear cobalt(III) ethylenediammine 2,4-dinitrophenolate complex. Inorg. Chem. Comm. 2017, 84, 45-48. 104. Mori, M.; Weil, J. A.; Ishiguro, M., Formation of and interrelation between some µ-peroxo binuclear cobalt complexes. II. J. Am. Chem. Soc. 1968, 90 (3), 615-621. 105. Schaefer, W. P.; Marsh, R. E., The structure of decammine-μ-peroxodicobalt monosulfate tris(bisulfate). Acta Cryst. 1966, 21 (5), 735-743. 106. Christoph, G. G.; Marsh, R. E.; Schaefer, W. P., Crystal structure of µ-amido-µ-superoxo-bis[tetraamminecobalt(III)] tetranitrate, [(NH3)4Co(NH2)(O2)Co(NH3)4](NO3)4. Inorg. Chem. 1969, 8 (2), 291-297. 107. Gleu, K.; Rehm, K., Zur Konstitution der grünen Peroxo-Kobaltammine. Z. anorg. allg. Chem. 1938, 237 (1), 79-88.

96
108. Rohm, F. H.; Nyman, C. J., Some reactions of μ-peroxo-bis[pentaamminecobalt(III)] sulfate tetrahydrate and μ-peroxo-bis[pentaamminecobalt (III)] nitrate. J. Inorg. Nucl. Chem. 1970, 32 (1), 165-173. 109. Takano, T., Structure of myoglobin refined at 2·0 Å resolution. J. Mol. Biol. 1977, 110 (3), 537-568. 110. Kitahara, M.; Fudo, S.; Yoneda, T.; Nukaga, M.; Hoshino, T., Anisotropic Distribution of Ammonium Sulfate Ions in Protein Crystallization. Crystal Growth & Design 2019, 19 (11), 6004-6010. 111. Köferstein, R.; Robl, C., Synthesis, Crystal Structure, and Hydrogen Bonding of μ-Hydroxo-μ-peroxo-bis[bis(ethylenediamine)cobalt(III)] Squarate. Z. anorg. allg. Chem. 2016, 642 (7), 560-565. 112. Bishop, J. L.; Quinn, R.; Dyar, M. D., What Lurks in the Martian Rocks and Soil? Investigations of Sulfates, Phosphates, and Perchlorates. Spectral and thermal properties of perchlorate salts and implications for Mars. Am. Mineral. 2014, 99 (8-9), 1580-1592. 113. Barraclough, C. G.; Lawrance, G. A.; Lay, P. A., Characterization of binuclear .mu.-peroxo and .mu.-superoxo cobalt(III) amine complexes from Raman spectroscopy. Inorg. Chem. 1978, 17 (12), 3317-3322. 114. Torreggiani, A.; Taddei, P.; Fini, G., Characterization of dioxygenated cobalt(II)–carnosine complexes by Raman and IR spectroscopy. Biopolymers 2002, 67 (1), 70-81. 115. Freedman, T. B.; Yoshida, C. M.; Loehr, T. M., Resonance Raman spectra of µ-peroxo binuclear cobalt(III) complexes. J. Chem. Soc. Chem. Commun. 1974, (24), 1016-1017. 116. Takashi, S.; Masayasu, M., Raman and Infrared Spectra of μ-O2 Dicobalt(III) Complexes. Bull. Chem. Soc. Jpn 1978, 51 (5), 1374-1379. 117. Pierre, J.-L., Enantioselective creation of helical chirality in octahedral (OC-6) complexes. Recent advances. Coord. Chem. Rev. 1998, 178-180, 1183-1192. 118. Knof, U.; von Zelewsky, A., Predetermined Chirality at Metal Centers. Angew. Chem. Int. Ed. 1999, 38 (3), 302-322. 119. Knight, P. D.; Scott, P., Predetermination of chirality at octahedral centres with tetradentate ligands: prospects for enantioselective catalysis. Coord. Chem. Rev. 2003, 242 (1), 125-143. 120. Sato, H.; Yamagishi, A., Application of the ΔΛ isomerism of octahedral metal complexes as a chiral source in photochemistry. J. Photochem. Photobiol., C 2007, 8 (2), 67-84. 121. Ault, A., The Meaning of Meso. J. Chem. Ed. 2008, 85 (3), 441. 122. Jackson, W. G., Synthesis and Characterization of Simple Hydroxo- and Amido-Bridged Cobalt(III) Dinuclear Ions Missing from the Alfred Werner Collection. Aust. J. Chem. 2009, 62 (10), 1308-1317. 123. Springborg, J.; Zehnder, M., Synthesis and Crystal Structure of meso-Δ,Λ-μ-Peroxo-μ-hydroxobis[bis(ethylenediamine)rhodium(III)]trifluoromethane Sulfonate. Helv. Chim. Acta 1986, 69 (1), 199-209. 124. Angus, P. M.; Fairlie, D. P.; Gunasingam, R.; Zhu, T.; Jackson, W. G., A new dinuclear amine-cobalt(III) complex containing two bridging amide ions. Inorg. Chim. Acta 1993, 209 (2), 123-127. 125. Floriani, C.; Calderazzo, F., Oxygen adducts of Schiff's base complexes of cobalt prepared in solution. J. Chem. Soc. A 1969, (0), 946-953. 126. Schaefer, W. P., Structure of decaammine-.mu.-peroxo-dicobalt disulfate tetrahydrate. Inorg. Chem. 1968, 7 (4), 725-731. 127. Ikawa, S.-i.; Hasebe, K.; Kimura, M., Infrared spectra of the decaammine-μ-peroxo-dicobalt complex. Spectrochim. Acta, Part A 1974, 30 (1), 151-160. 128. Secco, E. A., Spectroscopic properties of SO4 (and OH) in different molecular and crystalline environments. I. Infrared spectra of Cu4(OH)6SO4, Cu4(OH)4OSO4, and Cu3(OH)4SO4. Can. J. Chem. 1988, 66 (2), 329-336. 129. Aboelella, N. W.; York, J. T.; Reynolds, A. M.; Fujita, K.; Kinsinger, C. R.; Cramer, C. J.; Riordan, C. G.; Tolman, W. B., Mixed metal bis(μ-oxo) complexes with [CuM(μ-O)2]n
+ (M = Ni(III) or Pd(II)) cores. Chem. Commun. 2004, (15), 1716-1717.
97
130. Scheuermann, M. L.; Goldberg, K. I., Reactions of Pd and Pt Complexes with Molecular Oxygen. Eur. J. Chem. 2014, 20 (45), 14556-14568. 131. Hayward, P. J.; Blake, D. M.; Wilkinson, G.; Nyman, C. J., Reactions of peroxobis(triphenylphosphine) platinum (II) and analogs with with carbon dioxide, carbon disulfide, and other unsaturated molecules. J. Am. Chem. Soc. 1970, 92 (20), 5873-5878. 132. Deacon, G. B.; Green, J. H. S., Vibrational spectra of ligands and complexes—II Infra-red spectra 3650–375 cm−1 of triphenyl-phosphine, triphenylphosphine oxide, and their complexes. Spectrochim. Acta, Part A 1968, 24 (7), 845-852. 133. Boron-Rettore, P.; Grove, D. M.; Venazi, L. M., Transition metal complexes with bidentate ligands spanning trans-positions. Part XIV. Some complexes of 2,11-bis(diphenylphosphinomethyl)benzo[c]phenanthrene with platinum (0) and their reactivities. Helv. Chim. Acta 1984, 67 (1), 65-72. 134. Pidcock, A.; Richards, R. E.; Venanzi, L. M., 195Pt–31P nuclear spin coupling constants and the nature of the trans-effect in platinum complexes. J. Chem. Soc. A 1966, (0), 1707-1710. 135. Kroto, H. W.; Klein, S. L.; Meidine, M. F.; Nixon, J. F.; Harris, R. K.; Packer, K. J.; Reams, P., η1- and η2-coordination in phosphaalkeneplatinum(0) complexes. High resolution solid state 31P NMR spectrum of mesityl(diphenylmethylene)phosphinebis(triphenylphosphine)platinum(0). J. Organomet. Chem. 1985, 280 (2), 281-287. 136. Koie, Y.; Shinoda, S.; Saito, Y., Molecular orbital studies of platinum-195-phosphorus-31 and platinum-195-platinum-195 coupling constants in mononuclear and dinuclear (phosphine)platinum complexes. Inorg. Chem. 1981, 20 (12), 4408-4413. 137. Grim, S. O.; Keiter, R. L.; McFarlane, W., A phosphorus-31 nuclear magnetic resonance study of tertiary phosphine complexes of platinum(II). Inorg. Chem. 1967, 6 (6), 1133-1137. 138. Albright, T. A.; Freeman, W. J.; Schweizer, E. E., Nuclear magnetic resonance studies. IV. Carbon and phosphorus nuclear magnetic resonance of phosphine oxides and related compounds. J. Org. Chem. 1975, 40 (23), 3437-3441. 139. Sen, A.; Halpern, J., Aspects of the low-temperature chemistry of tris(triphenylphosphine)platinum(0). Inorg. Chem. 1980, 19 (4), 1073-1075. 140. Arul Prakasam, B.; Ramalingam, K.; Saravanan, M.; Bocelli, G.; Cantoni, A., Effect of free and chelating phosphine coordination environments on the NiS2P2 chromophore: synthesis, NMR and other spectral studies. Crystal and molecular structures of (N,N-dipropyldithiocarbamato)di(triphenylphosphine)nickel(II) perchlorate and (N,N-dipropyldithiocarbamato)1,2-bis((diphenylphosphino)ethane)nickel(II) tetraphenylborate. Polyhedron 2004, 23 (1), 77-82. 141. Bryce, D. L.; Eichele, K.; Wasylishen, R. E., An 17O NMR and Quantum Chemical Study of Monoclinic and Orthorhombic Polymorphs of Triphenylphosphine Oxide. Inorg. Chem. 2003, 42 (17), 5085-5096. 142. Zaia, J.; Annan, R. S.; Biemann, K., The correct molecular weight of myoglobin, a common calibrant for mass spectrometry. Rapid Commun. Mass Spectrom. 1992, 6 (1), 32-36. 143. Sugawara, Y.; Shikama, K., Autoxidation of Native Oxymyoglobin. Thermodynamic Analysis of the pH Profile. Eur. J. Biochem. 1980, 110 (1), 241-246. 144. Sykes, P. A.; Shiue, H.-C.; Walker, J. R.; Bateman, R. C., Determination of Myoglobin Stability by Visible Spectroscopy. J. Chem. Ed. 1999, 76 (9), 1283-1284. 145. Bowen, W. J., The absorption spectra and extinction coefficients of myoglobin. J. Biol. Chem. 1949, 179, 235-245. 146. Atkin, A. J.; Lynam, J. M.; Moulton, B. E.; Sawle, P.; Motterlini, R.; Boyle, N. M.; Pryce, M. T.; Fairlamb, I. J. S., Modification of the deoxy-myoglobin/carbonmonoxy-myoglobin UV-vis assay for reliable determination of CO-release rates from organometallic carbonyl complexes. Dalton Transactions 2011, 40 (21), 5755.
98
147. Chung, K. E.; Lan, E. H.; Davidson, M. S.; Dunn, B. S.; Valentine, J. S.; Zink, J. I., Measurement of Dissolved Oxygen in Water Using Glass-Encapsulated Myoglobin. Anal. Chem. 1995, 67 (9), 1505-1509. 148. Totzeck, M.; Hendgen-Cotta, U. B.; Rammos, C.; Petrescu, A. M.; Meyer, C.; Balzer, J.; Kelm, M.; Rassaf, T., Assessment of the functional diversity of human myoglobin. Nitric Oxide 2012, 26 (4), 211-216. 149. Falk, J. E.; Smith, K. M., Porphyrins and metalloporphyrins : a new edition based on the original volume by J. E. Falk. Elsevier Scientific Pub. Co.: Amsterdam 1975. 150. Ramsey, N. F., Magnetic Shielding of Nuclei in Molecules. Phys. Rev. 1950, 78 (6), 699-703. 151. Pauling, L., Nature of the Iron–Oxygen Bond in Oxyhæmoglobin. Nature 1964, 203 (4941), 182-183.