Comprehension and use of UK nutrition signpost labelling schemes
158
Comprehension and use of UK nutrition signpost labelling schemes May 2009 Prepared for: Food Standards Agency Prepared by: Sally Malam Sue Clegg Sarah Kirwan Stephen McGinigal BMRB Social Research In association with: Monique Raats Richard Shepherd Julie Barnett Victoria Senior Charo Hodgkins Moira Dean The Food, Consumer Behaviour and Health Research Centre at the University of Surrey Telephone: 020 8433 4402 Email: [email protected] Part of BMRB Limited (British Market Research Bureau) BMRB/SM/45106792
-
Upload
independent -
Category
Documents
-
view
0 -
download
0
Transcript of Comprehension and use of UK nutrition signpost labelling schemes
Comprehension and use of UK nutrition signpost labelling schemes
May 2009
Prepared for:
Food Standards Agency
Prepared by:
Sally Malam
Sue Clegg
Sarah Kirwan
Stephen McGinigal
BMRB Social Research
In association with:
Monique Raats
Richard Shepherd
Julie Barnett
Victoria Senior
Charo Hodgkins
Moira Dean
The Food, Consumer Behaviour and Health Research Centre at the
University of Surrey
Telephone: 020 8433 4402 Email: [email protected]
Part of BMRB Limited (British Market Research Bureau) BMRB/SM/45106792

BMRB is ISO9001:2000 and ISO 20252 accredited.
BMRB is also a member of the London Remade environment scheme and is working with the Woodland Trust to
offset the paper used in the course of our business.
Printed on 100% recycled paper
Table of Contents
1 Executive Summary .......................................................................... 3
2 Background, aims and method ............................................................ 6
2.1 Background ................................................................................ 7
2.2 Aims and objectives ..................................................................... 8
2.3 Conceptual model of FOP label use ............................................... 11
2.4 Overview of data collection methods ............................................ 13
2.4.1 Qualitative work ...................................................................... 13
2.4.2 Quantitative work .................................................................... 17
2.5 Objective testing design ............................................................. 18
2.5.1 Label format and presentation .................................................... 19
2.5.2 Measures of objective understanding ............................................ 21
2.5.3 The final test design ................................................................. 23 2.5.4 Testing design: Impact of multiple signposting methods on comprehension
.......................................................................................... 25
2.5.5 Functional literacy ................................................................... 26
2.5.6 Approach to analysis for tests ..................................................... 27
2.6 Approach to analysis and interpretation ........................................ 29
2.6.1 Quantitative survey data ........................................................... 29
2.6.2 Qualitative data analysis and interpretation .................................... 29
2.7 Structure of report .................................................................... 30
3 The use of Front of Pack nutrition signpost labels in retail environments and
in the home ........................................................................................... 31
3.1 Research techniques and analysis ................................................ 32
3.2 Use of FOP labels ...................................................................... 32
3.3 How FOP labels were used .......................................................... 33
3.3.1 Using FOP labels in retail environments ......................................... 34
3.3.2 Using FOP labels in the home ...................................................... 35
3.4 Shopper-internal influences on FOP label use ................................. 36
3.4.1 Reasons given for use by FOP label users ....................................... 36
3.4.2 Products on which label users would not use FOP labels ..................... 39
3.4.3 Shopper-internal reasons for not using FOP labels ............................ 40
3.4.4 Influence of nutritional knowledge on FOP label use .......................... 41
3.4.5 Factors influencing purchasing decisions that can outweigh FOP labels ... 43
3.5 External influences on FOP label use ............................................ 44
3.6 Label specific influences on FOP label use ..................................... 47
4 Self reported use of, and attitudes towards labels ................................ 52
4.1 Awareness and use of FOP labels ................................................. 53
4.2 Perceived ease of label use ......................................................... 57
5 Comprehension of labels when evaluating levels of nutrients in a single
product ................................................................................................. 64
5.1 Evidence from the qualitative work .............................................. 65
5.2 The tests .................................................................................. 65

5.3 Effects of signposting elements on ability to evaluate level of nutrient 66 5.3.1 Further evidence for label choice based on shoppers with particular needs .
.......................................................................................... 70
5.4 Influence of demographics on ability to give correct answer at test 1 71
6 Comprehension of labels when evaluating overall healthiness of a single
product ................................................................................................. 74
6.1 The tests .................................................................................. 75
6.2 Effect of signposting elements on ability to evaluate overall healthiness
of product ........................................................................................ 76 6.2.1 Further evidence for label choice based on shoppers with particular needs .
.......................................................................................... 79
6.3 Impact of not including energy on the FOP label ............................ 81
6.4 Influence of demographics on ability to give correct answer at test 2 84
6.5 How the decision was made at test 2 (with and without energy) ....... 86
7 Comprehension of labels when comparing overall healthiness of two
products ................................................................................................ 88
7.1 Evidence from the qualitative work .............................................. 88
7.2 The tests .................................................................................. 89
7.3 Effect of signposting elements on ability to compare the healthiness of
two products ..................................................................................... 90
7.4 Influence of demographics on ability to give correct answer at test 3 93
7.5 How the decision was made at test 3 ............................................ 94
7.6 Overview of test 3 ..................................................................... 97
8 Overview of comprehension of FOP labels ........................................... 98
8.1 Influence of signposting on comprehension ................................... 99
8.2 Influence of sociodemographics on comprehension ........................ 101
9 Impact of changes to FOP label presentation ...................................... 106
9.1 The research design .................................................................. 107
9.2 Evidence from the qualitative research ........................................ 107
9.3 Use of non-signposting nutrient-specific colours ............................ 108
9.4 Circular presentation ................................................................. 112
10 The impact of comparing the healthiness of products with different
signposting methods .............................................................................. 117
10.1 Evidence from previous research ................................................ 118
10.2 The degree of any problems caused by different signposting methods ...
............................................................................................. 119
10.2.1 The tests ............................................................................ 119 10.2.2 Effect of presenting pairs of products with two different FOP label types
compared with using the same FOP label type for both products .................... 120
10.3 The nature of any problems caused by different signposting methods ...
............................................................................................. 122
10.3.1 The interview ....................................................................... 122
10.3.2 Easy comparisons .................................................................. 123
10.3.3 Hard comparisons.................................................................. 124

10.3.4 Other factors causing difficulties ................................................ 130
10.4 Discussion and conclusions ........................................................ 132
11 Conclusions ................................................................................... 136
11.1 Comprehension of FOP labels ..................................................... 137
11.1.1 Signposting methods that best enable shoppers to interpret FOP labels 137
11.1.2 Non-signposting elements of labels ............................................ 139
11.1.3 Sociodemographic differences in comprehension ......................... 141
11.1.4 Preference as the basis for choosing FOP label format ...................... 141
11.2 Label use ................................................................................ 142
11.2.1 Self reported and observed use of FOP labels ................................ 142
11.2.2 Uses of FOP labels ................................................................. 142
11.2.3 Factors influencing FOP label use ............................................... 143
11.3 Effects of the co-existence of different FOP label formats ............... 144
11.4 Overall conclusions ................................................................... 145
12 Appendix ...................................................................................... 146
12.1 References .............................................................................. 146
12.2 Examples of labels in the marketplace ......................................... 148
12.3 Examples of labels used in tests ................................................. 149
12.4 Details of significance testing ..................................................... 150
Copyright: Copyright for this report is vested in the Crown.
Index of Charts, Tables and Figures
Figure 2.1: Conceptual model of FOP Label use (adapted from Grunert and
Wills, 2007) ....................................................................................... 11
Figure 2.2: Overview of project .................................................................. 13
Figure 2.3: Label types used in comprehension tests ..................................... 21
Table 2.1: Final testing design: main stage .................................................. 24
Table 2.2: Final testing design: multiple label study ...................................... 26
Chart 4.1: Whether had previously seen/used/often used FOP labels – by lifestage
............................................................................................................. 54
Chart 4.2: Whether had previously seen/used FOP labels – by sex, social grade
and highest qualification ........................................................................... 55
Table 4.1. How often shoppers use FOP and BOP labels to find out how healthy a
product is ............................................................................................... 56
Chart 4.3: Label believed easiest to use ...................................................... 58
Chart 4.4: % believe labels 1 (text, TL and %GDA) and 10 (circular TL) easiest to
use – by age ........................................................................................... 60
Chart 4.5: % believe labels 1 (text, TL and %GDA) and 10 (circular TL) easiest to
use – by social grade, ethnicity and highest qualification ............................... 61
Table 4.2. Reasons for feeling label 1 and label 10 is easiest to understand ...... 62
Chart 5.1: % correct answers by label type and product category at test 1
(evaluation of the level of individual nutrients within a product) ...................... 67
Table 5.1. % correct by signposting element of label content at test 1 (evaluation
of the level of individual nutrients within a product) ...................................... 68
Table 5.2. Average time taken (in seconds) to complete tests by label type at test
1 (evaluation of the level of individual nutrients within a product) – for all
completing tests, and for all giving correct answer ........................................ 69
Chart 5.2: % correct answers by shoppers with particular needs – Test 1
(evaluation of the level of individual nutrients within a product) P1 (main meal
sized portion), labels 1,2,3,5,6 ................................................................... 70
Table 5.3. Outcome of logistic regression: factors influencing ability to give
correct answer at test 1 (evaluation of the level of individual nutrients within a
product) ................................................................................................. 71
Chart 5.3: % correct answers by age – Test 1 (evaluation of the level of
individual nutrients within a product) P1 (main meal sized portion), labels
1,2,3,5,6 ................................................................................................ 72
Table 5.4. % correct by whether previously used FOP labels - Test 1 (evaluation
of the level of individual nutrients within a product) P2 (smaller portion or snack)
............................................................................................................. 73
Chart 6.1: % correct answers by label type and product group at test 2
(evaluation of the overall healthiness of a product) ....................................... 76
Table 6.1. % correct by signposting element of label content at test 2 (evaluation
of the overall healthiness of a product) ....................................................... 78

Table 6.2. Average time taken to complete tests by label type at test 2
(evaluation of the overall healthiness of a product) – for all completing tests, and
for all giving correct answer ....................................................................... 79
Chart 6.2: % correct answers by shoppers with specific needs – Test 2
(evaluation of the overall healthiness of a product), P1 (main meal sized portion),
labels 1,2,5,6 .......................................................................................... 80
Chart 6.3: % correct answers by shoppers with particular needs – Test 2
(evaluation of the overall healthiness of a product) P2 (smaller portion or snack),
labels 1,2,4,5,6 ....................................................................................... 81
Chart 6.4: % correct answers – Test 2 (evaluation of the overall healthiness of a
product) with and without energy – P1 (main meal sized portion) ................... 82
Chart 6.5: % correct answers – Test 2 (evaluation of the overall healthiness of a
product) with and without energy – P2 (smaller portion or snack) ................... 83
Table 6.3. Average time taken to complete tests by label type at test 2
(evaluation of the overall healthiness of a product) with and without energy – for
all completing tests, and for all giving correct answer .................................... 83
Table 6.4. Outcome of logistic regression: factors influencing ability to give
correct answer at test 2 ............................................................................ 85
Table 6.5. How came to decision when completing test 2 (evaluation of the
overall healthiness of a product) ................................................................ 86
Table 6.6. Number of nutrients (not including energy) considered when answering
test 2 ..................................................................................................... 87
Chart 7.1: % correct answers by FOP label type and product category at test 3
(comparison of two products in terms of healthiness) .................................... 91
Table 7.1. Average time taken to complete tests by FOP label type at test 3
(comparison of two products in terms of healthiness) – for all completing tests,
and for all giving correct answer ................................................................. 93
Table 7.2. Outcome of logistic regression: factors influencing ability to give
correct answer at test 3 (comparison of two products in terms of healthiness) .. 94
Table 7.3. How came to decision when completing test 3 (comparison of two
products in terms of healthiness) compared with test 2 (evaluation of the overall
healthiness of a product) ........................................................................... 95
Table 7.4. Number of nutrients (not including energy) considered when answering
tests 2 (evaluation of the overall healthiness of a product) and 3 (comparison of
two products in terms of healthiness) ......................................................... 96
Table 7.5. Number of signposting types (text, TL, %GDA) considered when
answering tests 2 and 3 ............................................................................ 96
Table 8.1. % correct by signposting element of label content at test 1 (evaluation
of the level of individual nutrients within a product) and test 2 (evaluation of the
overall healthiness of a product) ................................................................ 99
Chart 8.1: % correct answers by label type and product group at test 1
(evaluation of level of individual nutrient within a product) and test 2 (evaluation
of the overall healthiness of a product), combining responses for P1/P2, and for
energy/no energy .................................................................................. 100

Table 8.2. Proportion giving correct answers at tests 1 and 2 by highest level of
education .............................................................................................. 102
Table 8.3. Proportion giving correct answers at tests one and two by age ....... 103
Table 8.4. Proportion giving correct answers at tests one and two by social
grade and ethnicity ................................................................................ 104
Chart 9.1: % correct answers: label 7 (%GDA) compared with label 9 (%GDA
with non-signposting colours) and label 1 (text, TL, %GDA) ......................... 109
Table 9.1. Average time taken to complete test 2 (evaluation of healthiness of
product) by label type: label 7 (%GDA) and label 9 (non-signposting coloured
%GDA) – for all completing tests, and for all giving correct answer ............... 110
Chart 9.2: % correct answers test 2, with energy, P1 (main meal sized portion):
label 7 (%GDA) compared with label 9 (%GDA with non-signposting colours) and
label 1 (text, TL, %GDA) – shoppers with particular needs. .......................... 111
Table 9.2. % correct answers for test 2 label 9 – Tesco and non-Tesco shoppers
........................................................................................................... 112
Chart 9.3: % correct answers label 4 (TL) compared with circular label 10 (TL)
and label 1 (text, TL, %GDA) ................................................................... 113
Table 9.3. Average time taken to complete test 3 (comparison of two products in
terms of healthiness) by label type: label 4 (TL) and label 10 (circular TL) – for all
completing tests, and for all giving correct answer ...................................... 114
Chart 9.4: % correct answers test 3, P2 (smaller portion or snack): label 4
compared with label 10 – shoppers with particular needs. ............................ 115
Table 10.1. % correct answers by FOP label type and product category at test
3 (comparison of two products in terms of healthiness) – matching FOP label
types compared with contrasting FOP label types ........................................ 121
Table 10.2. Average time taken to complete tests by label type at test 3
(comparison of two products in terms of healthiness) .................................. 122
Figure 10.1. Example of hard comparison .................................................. 125
Table 11.1: Contribution of signposting elements to comprehension (percentage
point increase in comprehension compared with labels where element is not
present) ............................................................................................... 138
Table 11.2: Contribution of signposting elements to comprehension
(percentage point increase in comprehension compared with label with no
signposting – only significant contributions shown) ..................................... 138

BMRB Report: Comprehension and use of UK nutrition signpost labelling schemes 1
Acknowledgements
The authors would like to thank the following key players for their vital role in this
research:
• All of the shoppers who took the time to participate in the research
• Monique Raats, Richard Shepherd, Julie Barnett, Victoria Senior, Charo
Hodgkins and Moira Dean of the Food, Consumer Behaviour and Health
Research Centre at the University of Surrey for their vital input to the
study design, scientific rationale and contribution to the final report.
• Other members of the research team at BMRB, particularly Claire Bassett,
Ed Johnson and Jo Knott for their work on the quantitative survey, and
Sinead Lawless and other members of the qualitative team for their
support in qualitative fieldwork and analysis.
• The Project Management Panel: Sue Duncan, Malcolm Rigg, Alizon Draper
and Ashley Adamson, for their strong direction and guidance
• Karen Powell at FSA for ensuring the project remained on track.
• Clifton Gay and Robin Clifford at FSA and Helen Lambert and Joel Williams
at BMRB for their advice on statistical matters
• Alison Tedstone, Jane Barrett and Joanna Disson at FSA for their input on
nutrition and social science issues.
• All stakeholders which formed ‘The Advisory Group’ who shared their
knowledge and experience with PMP during the study design.
• Claire Boville and Rosemary Hignett at FSA for their advice on nutritional
signposting policy and technical suport.
• The nutritionists and dieticians who took part in the survey to determine
the correct answers for the tests.
• The retailers (Sainsbury’s, Co-operative Group, Morrisons and Asda) who
allowed us to conduct research in their stores.

BMRB Report: Comprehension and use of UK nutrition signpost labelling schemes 2
Glossary
The following terms are used throughout the report:
BOP – Back of pack
CAPI – Computer Assisted Personal Interviewing
FOP – Front of pack
FOP labels – labels that signpost the level of key nutrients on the front of
food packaging
PMP – Project Management Panel
P1 – Main meal sized portion
P2 – Smaller portion or snack
Social grade - household-based proxy measure of social class based on the
normal occupation of the chief income earner in the household categorised
into:
• AB (professional, managerial and technical),
• C1 (skilled non-manual),
• C2 (skilled manual),
• D (partly skilled and unskilled)
• E (dependent on state and casual workers)
Text – Indicative text (signposting using words high, medium, low)
TL – Traffic Light colours (signposting using red, orange and green)
%GDA - % of Guideline Daily Amount

BMRB Report: Comprehension and use of UK nutrition signpost labelling schemes 3
1 Executive Summary
How front of pack (FOP) labels are understood and used by shoppers; Key messages from the research
This summary is aimed at the non-technical reader; more detailed summaries are
provided at the beginning of each chapter.
This is the most comprehensive and robust evaluation of FOP nutrition signpost
labelling published to date. It provides information on how FOP labels are used by
shoppers in a retail environment; the extent to which they are accurately
interpreted and the impact of the co-existence of the current range of FOP labels
on comprehension.
Overall aim
This aim of this research was to establish which FOP labelling scheme(s), or which
combination of elements of schemes, best facilitate the accurate interpretation of
key nutritional information by consumers such that they are enabled to make
informed choices about the foods they purchase.
The research addressed three key questions:
1. How well do individual signpost schemes (or elements of the schemes) enable consumers to correctly interpret levels of key nutrients?
2. How do consumers use FOP labels in real life contexts in the retail environment and at home?
3. How does the coexistence of a range of FOP label formats affect accurate interpretation of FOP labels?
Comprehension of FOP labels
• Levels of comprehension of different FOP labels are generally high (ranging from 58% to 71% when looking at labels on single products1), but two labels achieved the highest levels of comprehension overall:
o One is a label combining text (the words high, medium, low), traffic light colours and % Guideline Daily Amount (GDA) (70%). This is also one of the top two preferred labels.
o The other is a label combining text and traffic light colours (71%).
o Whilst these two labels do not differ in overall level of comprehension, the balance of evidence is that the label combining text, traffic light colours and %GDA is the single
1 Combined figures from two separate comprehension tests looking at single products
BMRB Report: Comprehension and use of UK nutrition signpost labelling schemes 4
strongest label overall: It is one of the best liked labels, and it enables shoppers to use information in their preferred format; furthermore the inclusion of %GDA helps shoppers to determine the level of individual nutrients.
• Some shoppers do use energy (calories) to decide how healthy a
product is but the inclusion of energy has no effect on comprehension.
• Older adults (over 65), people with lower levels of educational attainment and those from social classes C2, D and E are less likely to be able to accurately interpret FOP labels. The research also suggests that certain minority ethnic groups have difficulty interpreting them, (though because of the sample size, this finding is indicative rather than substantive).
• Expressed preference alone for particular labels is not a reliable
indication of ability to comprehend. The ‘wheel’ format of the traffic light label was one of the weakest in performance in the comprehension tests despite being one of the top two preferred labels.
Use of FOP labels
• Self-reported use of FOP labels is higher than would be concluded from observing what people actually do when they are shopping, suggesting a degree of ‘over claiming’.
• FOP labels are valued by those shoppers who use them, but they compete with a range of other factors when purchasing decisions are being made.
• Other factors influencing purchasing decisions include other information on the product pack, such as labels indicating the product is part of a ‘healthy’ range, that it is organic or the look of the product itself. Shoppers are also influenced by factors such as price; brand loyalty (‘I always buy product x ’), and whether the item is considered to be a ‘treat’ or a staple.
• Though some people said FOP labels were hard to see on product packaging (especially when FOP labels used pale colours), shoppers who notice them make conscious and usually considered decisions about whether to use FOP labels. Shoppers are most likely to use them when buying a product for the first time; when comparing between different products; when shopping for children; when they are trying to control intake of certain nutrients (e.g. fat or salt), usually in relation to a health issue, such as a heart condition, or when they are trying to lose weight. Though those who have an interest in healthy eating are generally more frequent users of FOP labels, they do not always use them if they are confident in their knowledge of what is healthy. Conversely, those who are not interested in healthy eating tend not to use them and some avoid them because they perceive FOP labelling as an unwelcome attempt to control their behaviour.
BMRB Report: Comprehension and use of UK nutrition signpost labelling schemes 5
• FOP labels are more likely to be used in the retail environment than in
the home. Effects of the coexistence of a range of FOP label formats • The coexistence of a range of FOP labels in the market place creates
considerable difficulty in comprehension for shoppers. In addition, some shoppers observe that comparing products with different label formats is too difficult, frustrating, annoying or just takes too long.
• Different use of colour on the different FOP labelling schemes causes
confusion for some shoppers in the retail environment. Some do not realise that the colour (red/green/amber) in the traffic light scheme has meaning. Conversely, some think that the colour used in %GDA schemes has actual meaning. They interpret the cool colours (blue or green) used on monochrome schemes and the nutrient specific %GDA scheme as indicating that the product is healthy (monochrome schemes) or that products are low in nutrients in cool colours (nutrient specific %GDA scheme).
Conclusions • The main conclusion from the research is that, although levels of
comprehension are generally high for all FOP labels, the coexistence of a range of FOP label formats in the marketplace causes difficulties for shoppers. This suggests that standardising to just one label format would enhance use and comprehension of FOP labels. Overall the balance of evidence from the research shows that the strongest FOP labels are those which combine text (high, medium, low), traffic light colours and %GDA information.
• Shoppers who use FOP labels value them, but FOP labels will always
compete with other factors when shoppers are making purchasing decisions; these decisions are likely to be perfectly considered and are probably not susceptible to influence. However, there is clear evidence that some groups are less likely than others to use and understand FOP labels and there may be scope for increasing both comprehension and use (for certain purchasing decisions), among at least some of these groups.
• The generally high levels of comprehension, even among those who do not currently use FOP labels, provides a good starting point from which to address barriers to FOP label use.
BMRB Report: Comprehension and use of UK nutrition signpost labelling schemes 6
2 Background, aims and method
Summary:
In 2008 the Food Standards Agency commissioned BMRB, in collaboration with
the Food, Consumer Behaviour and Health Research Centre at the University of
Surrey (FCBH), to undertake research to assess the comprehension and use of UK
front of pack nutrition signpost labelling schemes (FOP labels). The study was led
by an independent Project Management Panel (PMP): independent experts
responsible for assuring the integrity and robustness of the study.
This evaluation was intended to address three main questions:
1. How well do individual signpost schemes enable consumers to correctly
interpret levels of key nutrients? While the impact of, e.g. time constraints, on
comprehension were to be considered in this part of the research, it did not
involve testing comprehension in real life contexts.
2. How do consumers use FOP labels in the retail environment and at home? The
aim of this part of the research was to explore use in real life contexts.
3. How does the co-existence of a range of FOP label formats affect accurate
interpretation of FOP labels?
The research was carried out using an integrated programme of qualitative,
observational and quantitative work. Accompanied shops, in-store and in-home
shopping bag audits and a random probability survey of 2932 shoppers in the UK
were used to address the first two questions. An omnibus survey and depth
interviews were also used to address the third question.
The design to investigate the first research question was based on a review of
existing work, early qualitative findings, and input from relevant experts and
stakeholders and was peer-reviewed by relevant experts (BMRB & University of
Surrey, 2008). This design involved presenting three different comprehension
tests to shoppers to assess the impact of FOP labels on their ability to:
i. Evaluate the level of individual nutrients in a product,
ii. Evaluate the overall healthiness of a product, and
iii. Compare the healthiness of two products.
The research focused primarily on the three key content-related signposting
elements: Traffic Lights (TL), interpretive text and %GDA. As a secondary
concern, the impact on comprehension of the presence of energy (in the form of
calories) and of the type of product (meal sized portion or smaller portion) were
tested. The use of a circular presentation format (similar to that used by
Sainsbury’s) and the use of pastel (non-signposting) nutrient-specific colours
(similar to that used by Tesco) were also considered, in the form each currently
appears in the marketplace.

BMRB Report: Comprehension and use of UK nutrition signpost labelling schemes 7
2.1 Background
Front of pack (FOP) nutrition labelling aims to enable consumers to clearly see
the levels of certain nutrients in foods sold through retails outlets. FOP labelling is
widespread in the UK marketplace; there are a variety of FOP labelling schemes
in use, and these schemes use different formats to present the information they
convey.
FOP nutrition labelling forms a part of the UK Government’s wider programme of
activities to tackle a range of diet related public health issues. The Westminster
Government’s initial commitment to introduce at-a-glance FOP nutrition labelling
that can be readily understood and used by consumers to make healthier choices
was set out in the Choosing Health2 White paper 2004. The need for clear FOP
nutrition labelling to help enable consumers to make healthier choices is
supported by the Scottish Government in Healthy Weight, Active Living3, by Fit
Futures - Focus on Food, Activity and Young People4 in Northern Ireland and will
be supported in Wales by the Welsh Assembly Government's Quality Of Food For
All Action plan which is currently being developed.
In March 2006 the Food Standards Agency recommended businesses adopt a
voluntary FOP nutrition labelling approach which included use of traffic light
colours to help interpret nutrient levels5. Its recommendations focused on seven
categories6 of processed foods identified by consumers particularly difficult to
assess in terms of ‘healthiness’. At the same time the Agency made a
commitment to review the effectiveness of the three main FOP nutrition labelling
schemes used in the UK market7.
In July 2006 the Nutrition Strategy Steering Group8 (NSSG) agreed on research,
'to evaluate the impact of FOP signpost labelling schemes on purchasing
2http://www.dh.gov.uk/en/Publicationsandstatistics/Publications/PublicationsPolicyAndGuidance/DH_4
094550 3 Healthy Eating, Active Living: An action plan to improve diet, increase physical activity and tackle
obesity (2008-2011) www.scotland.gov.uk/Publications/2008/06/20155902 4 http://www.dhsspsni.gov.uk/fit-futures-implementation-plan.pdf 5 www.food.gov.uk/news/newsarchive/2006/mar/signpostnewsmarch 6 (1) Sandwiches, wraps, filled baguettes and similar products; (2) Prepared or ready meals, whether hot or cold - (for example pasta salad bowls, prepared salad meals such as chicken caesar salad and prepared dishes sold with and without accompaniments such as rice, noodles, vegetables, potato or similar); (3) Burgers, sausages; (4) Pies, pasties and quiches; (5) Breaded or coated or formed meat, meat alternative, poultry, fish and similar products including those in sauces (for example chicken nuggets, fish fingers, chicken kiev, fish in parsley sauce, meat balls, lamb grills); (6) Pizzas; (7) Breakfast cereals 7 These are monochrome schemes providing information on percentage of Guideline Daily Amount (GDA); traffic light colour coded schemes indicating nutrient level; and schemes which provide both a traffic light colour code and percentage of GDA. 8 The NSSG was a chief executive level group of stakeholders jointly chaired by the Public Health
Minister Caroline Flint and Dame Deirdre Hutton, Chair of the Food Standards Agency and was set up
to help deliver key Government nutrition objectives.

BMRB Report: Comprehension and use of UK nutrition signpost labelling schemes 8
behaviour and consumer knowledge' and that the research should be managed by
an independent group. Subsequently an independent Project Management Panel
(PMP)9 was set up, with expertise in nutritional and social sciences, including
market and social research. Their role was to provide independent oversight of
the evaluation to ensure its independence, integrity and robustness. The PMP was
chaired by Sue Duncan, former Head of the Government Social Research service
(GSR). The PMP was assisted by an advisory group, which included members with
commercial expertise and stakeholder representatives.
At the end of 2007, following a thorough research tendering exercise involving
open competition, PMP recommended that the Food Standards Agency
commission BMRB, in collaboration with the Food, Consumer Behaviour and
Health Research Centre at the University of Surrey (FCBH), to undertake the
research to assess the comprehension and use of UK front of pack nutrition
signpost labelling schemes. The research focused on a comparative analysis of
the impact of the three main FOP nutrition labelling approaches used in the UK,
(and the elements within them), on comprehension and on how FOP labelling
schemes are used.
In January 2008, the Westminster Government’s commitment to promoting the
adoption of healthier eating patterns was underlined by publication of Healthy
Weight, Healthy Lives: A Cross-Government Strategy for England10. Within this,
the Healthy Food Code of Good Practice commits to ‘a single, simple and effective
approach to Front of Pack food labelling used by the whole food industry, based
on the principles that will be recommended by the Food Standards Agency in light
of the research currently being undertaken’. This document reports the findings of
that research.
2.2 Aims and objectives
In 2008 the Food Standards Agency commissioned BMRB, in collaboration with
the Food, Consumer Behaviour and Health Research Centre at the University of
Surrey (FCBH), to undertake research to assess the comprehension and use of UK
FOP nutrition signpost labelling schemes.
The study was led by an independent Project Management Panel (PMP); a small
group of independent experts in nutritional and social sciences, including market
research. This panel was chaired by Sue Duncan, former Head of the Government
Social Research service (GSR). The PMP were responsible for assuring the
9 The PMP’s terms of reference can be found at
http://www.food.gov.uk/foodlabelling/signposting/signpostevaluation/pmpanel/signpostevalterms.
10 http://www.dh.gov.uk/en/Publichealth/Healthimprovement/Obesity/HealthyWeight/index.htm

BMRB Report: Comprehension and use of UK nutrition signpost labelling schemes 9
integrity and robustness of the study and monitoring the progress of the
research.
This evaluation addressed three main questions:
1. How well do individual signpost schemes enable consumers to correctly
interpret levels of key nutrients? While the impact of, e.g. time
constraints, on comprehension were to be considered in this part of the
research, it did not involve testing comprehension in real life contexts.
2. How do consumers use FOP labels in the retail environment and at
home? The aim of this part of the research was to explore use in real life
contexts.
3. How does the co-existence of a range of FOP label formats affect accurate interpretation of FOP labels?
The third question was not initially included in the research brief, but findings of
the research addressing the first two questions made it clear that this question
equally needed to be addressed.
When the study was commissioned, the three main types of FOP labelling scheme
under consideration for both questions were11:
1. %GDA schemes, providing information on amount of nutrient per portion of
product as a percentage of Guideline Daily Amount;
2. Traffic light (TL) colour coded schemes indicating nutrient level per 100g of
product. These can be found with accompanying ‘High, Medium and Low’
text.
3. Schemes which provide both a traffic light colour code (with or without text)
and %GDA.
All three schemes give the amount of nutrient in grams per portion of food.
The results of the research were used to: determine what scheme(s), or what
combination of elements of the different schemes, best facilitates the accurate
interpretation of key nutritional information by consumers such that they are
enabled to make informed decisions about the foods they consume; and to
determine how different schemes are actually used, and what elements of these
schemes are most influential, in making purchasing decisions.
More specifically the research objectives are given below, showing which were to
be explored qualitatively, and which to be measured quantitatively.
11 For examples see Appendix 12.2

BMRB Report: Comprehension and use of UK nutrition signpost labelling schemes 10
Objectives: Quant- itative
Qual- itative
Question 1: 1. To objectively assess the extent to which individuals are
able to correctly interpret the nutritional information given on FOP labels
2. To compare the comprehensibility of the main formats
3. To identify the characteristics of a successful scheme, that is, one that enables consumers to make informed choices in relation to fat, saturated fat, salt, sugars and calories (where provided)
4. To investigate the impact of various social factors (e.g. socio-economic status, educational attainment, gender, ethnicity) on ability to interpret the information presented
5. To investigate potential barriers to interpreting information provided by signposts in general, including any issues arising from the existence/use of more than one scheme, in the market place, and relating to each scheme individually
Question 2 1. To explore whether and how consumers use FOP labelling
when making purchasing decisions (i.e. at the time of purchase or at a later date during preparation or consumption)
2. To explore how consumers use the 3 different types of FOP labelling schemes in making purchasing decisions
3. To explore how consumers handle the existence of different label formats both in different retail outlets, and within individual retail outlets
4. To explore whether use of FOP signpost labels varies between product types. For instance, whether signposts are used differently depending on the place a particular product occupies within the overall diet
5. To explore shoppers’ perceptions of the influence of schemes in altering purchasing decisions
6. To explore whether signpost labels are used within the context of daily and weekly diet. Explore whether labels are used to balance an overall diet.
7. To explore the impact of household structure and composition and role of purchaser within the household, for example caring responsibilities and the presence of particular health issues within the household

BMRB Report: Comprehension and use of UK nutrition signpost labelling schemes 11
Objectives: Quant- itative
Qual- itative
Question 3 1. To determine the extent of any impact on comprehension
when comparing products with different FOP labels
2. To explore the nature of any issues arising from comparing products using different FOP labels
2.3 Conceptual model of FOP label use
The research is underpinned by a conceptual model of FOP label use based on
literature from social research, psychology and market research. The model of
label use in Figure 2.1 has been adapted from that proposed by Grunert and Wills
(2007). The adapted model presumes exposure of shoppers to FOP labels, and
focuses on the stages of behaviour that are likely to influence final successful use
of the labels. It also shows influences on shoppers at all stages of the model.
These influences were not divided into categories in the original model but have
been divided here into three broad categories discussed further below.
Figure 2.1: Conceptual model of FOP Label use (adapted from Grunert
and Wills, 2007)
Notice?
Preference Understanding
Usage
Subjective Objective
Subconscious Conscious
FOP Label-specific:e.g. Signposting
Format, etc
Shopper Internal:e.g. Demographics,Health knowledge
and attitudes,Health needs,Habits and preferences,Numeracy
Reason for purchaseetc
External:e.g. Packaging,
Advertising,Price etc
Subconscious/conscious
Actual/reported
Shoppers must first notice the labels in order to use them. They may register the
labels consciously or subconsciously. This will affect whether they report using the
labels in their decision making, since it could result in subconscious use of at least
some of the information on the label. This is discussed further below in relation to
actual and reported usage.
BMRB Report: Comprehension and use of UK nutrition signpost labelling schemes 12
The next stage covers both preference and understanding. The two are not
necessarily causatively linked. Shoppers may prefer a label because it is eye
catching, or even if they believe (subjectively, but not necessarily correctly) that
they understand it, but this does not necessarily lead to greater ability to
understand the preferred label. The only way to ensure accurate usage is to
achieve objective understanding (that is, to ensure understanding matches the
intent of the FOP label). This is the level of understanding measured in the
quantitative elements of the research (for results see Chapters 5-9). There is
further discussion and evidence of the lack of correspondence between preference
(in terms of perceived ease of use) and understanding in section 4.2. For
example, a circular TL label is the label seen as easiest to use by a third of
shoppers, but has one of the lowest levels of comprehension among shoppers in
the tests, with comprehension no higher among those who thought it easiest to
use.
FOP labels will only be used if they are noticed, understood (or shoppers believe
they understand them) and liked or preferred. Usage may also be conscious or
subconscious, both in terms of whether the labels are used at all, and which
elements of the label influence the shopper’s decision. If use of the label (or some
element of the label) is subconscious, this could result in under-reporting of use
of the label (or elements thereof). The reasons given for decisions when using
FOP labels with different signposting elements are discussed in Chapters 6-7 and
illustrate, for example, that whilst text clearly has a strong influence on the level
of objective understanding in the tests, it is rarely reported by shoppers as being
used when deciding on the answers to the tests.
This is one example of how post-hoc rationalisation may not reflect the true
influences on decision making. Post-hoc rationalisation is reflected dramatically in
the over-reporting of FOP label use amongst those who have noticed them.
Section 4.1 discusses in more detail how the high levels of use reported in the
quantitative work do not reflect the much lower levels of use observed in the
accompanied shops and bag audits (as described in section 3.2).
All stages of this model of FOP label use can be affected by a wide range of
influences. These can be broadly divided into influences that are internal and
external to the shopper (with this latter category divided into FOP label specific,
and other external influences). Internal influence include factors such as
demographics (age, sex etc), how much shoppers know about nutrition, their
attitudes towards healthy eating, their ingrained habits (leading to unconscious
decision making), their level of numeracy and literacy and so on. All of these will
influence whether shoppers notice the labels, which they prefer and find easy to
use, and whether the labels are a final factor in any purchasing decisions.
The external influences that are not FOP label specific include further information
on the packaging (health claims, other nutrition information, pictures etc) and

BMRB Report: Comprehension and use of UK nutrition signpost labelling schemes 13
elsewhere such as advertising, other information in the supermarket, and factors
such as cost.
External factors specific to the FOP label also come into play. Label form (e.g.
shape, use of colour etc) can play a strong role in whether labels are noticed or
liked, as can the inclusion of different types of signposting (see section 4.2 for
further discussion on the reasons given by shoppers for label preference).
Chapter 3 will use this model to underpin a discussion of whether, and how,
shoppers use FOP labels, and the influences that were observed to act as
incentives and barriers to use.
2.4 Overview of data collection methods
The research was carried out using an integrated programme of qualitative and
quantitative research. Further details of the qualitative methods used are
available in the Technical Annex and for the quantitative work the method was
described in full in the Scientific Rationale (BMRB & University of Surrey, 2008),
with further details of response and weighting in the Technical Annex. Figure 2.2
shows the different stages of the project, linked back to the objectives.
Figure 2.2: Overview of project
Stage Qualitative work: Research questions
1 and 2
Quantita-tive work: Research
question 1
Multiple signposting study:
Research question 3
Method Accom-panied shops
In-store bag audits
In-home bag audits
Survey Survey Depth interviews
Research objectives
1.2-1.5 2.1-2.5, 2.7
1.2-1.5 2.1-2.5, 2.7
1.2-1.5 2.1-2.7
1.1-1.4 3.1 3.2
Number of interviews
113 shops
56 audits
56 audits
Pilot – 25 interviews; Cognitive testing -100 interviews; Main survey - 2932 interviews
1602 interviews
50 depth interviews
2.4.1 Qualitative work
The qualitative work consisted of two main pieces of work: the first stage
exploring how labels are used in practice (which was also used to inform the
BMRB Report: Comprehension and use of UK nutrition signpost labelling schemes 14
design of the quantitative work), and a second stage focusing specifically on the
impact of the existence of multiple FOP labelling schemes on comprehension and
use.
Research questions 1 and 2: Use of labels in practice
There were three parts to this stage of the qualitative work:
a) accompanied shops
b) in-store shopping bag audits
c) in-home shopping bag audits
Shoppers for all three parts were recruited to quotas relating to main retailer
used, geographical location, ethnicity and life stage and ensuring a spread of
shoppers across socio economic groups, gender and levels of educational
achievement. For the accompanied shops and the in-store shopping bag audits
shoppers were not told at recruitment that the purpose of the research was to
explore the use of FOP labels, as doing so could have influenced the way they
responded to questions (for instance, if they felt it was socially desirable to use
FOP labels). At the end of the accompanied shops and in-store shopping bag
audits shoppers were told that the research was being done for the Food
Standards Agency and that the focus was on exploring the usage of FOP labels.
Shoppers were recruited for the in-home shopping bag audits as FOP label users;
they were shown an array of labels and asked whether they generally used them
whilst shopping or at home, and were told that the focus of the work was about
the FOP labels.
Stores were selected for the in-store work to cover the range of FOP label
variants. Shoppers were recruited in Sainsbury’s (TL), Co-operative Group (TL),
Morrisons (%GDA) and Asda (TL and %GDA). Tesco (%GDA) were approached
but could not commit to participating in the fieldwork within the required
timeframe. The planned Tesco-based interviews were replaced with interviews in
Morrisons which also uses %GDA labels to maintain appropriate coverage. Tesco
shoppers (and those who shopped in all other stores) were included in all other
elements of the research. The PMP concluded, therefore, that this would not
compromise the validity of the findings12.
All participants were the main shopper for their household (responsible for at
least half of the grocery shopping). Fieldwork took place between March and May
2008. Some difficulty was experienced in recruiting black shoppers during this
fieldwork phase, so a second fieldwork phase was carried out in November 2008
with black shoppers. The method used was the same for both sets of fieldwork.
12 See http://www.food.gov.uk/multimedia/pdfs/471863 for further details.

BMRB Report: Comprehension and use of UK nutrition signpost labelling schemes 15
Further details of these methods are given below, with more detail in the
Technical Annex (section 3.1).
a) Accompanied shops.
In the first phase of fieldwork, 100 accompanied shops were carried out, with a
later top up of 13 shops with black shoppers. Researchers accompanied shoppers
as they shopped in supermarkets, using a topic guide and observation protocol
(explaining what observations to record) to explore the decision making
processes used when buying, or considering buying, food items. There was
particular focus on how FOP labels were used in this context. Screening at
recruitment ensured that all of those included in the research intended to
purchase food items from selected categories carrying FOP labelling to ensure
that there would be some interaction with FOP labels whilst they were shopping
(e.g. breakfast cereals, ready meals: see Technical Annex section 3.4.9 for
details). Shoppers were asked to ‘think out loud’ whilst shopping, to talk the
researcher through the products they were looking at, why they were looking at
them and how they were making their purchasing decisions. Researchers probed
both to keep people ‘thinking aloud’ and to get more detail.
Towards the end of each accompanied shop shoppers were asked to undertake a
short task of choosing what they considered to be the healthiest product from a
range of foods: for example, shoppers might have been taken to a pizza section
and asked which pizza on offer was the healthiest. There were no right or wrong
answers in the task; the process was used to explore how people made such
choices.
There was a mixture of people doing main shops (intending to purchase at least 5
products with FOP labels) and ‘top up’ shops (intending to purchase at least 3
products with FOP labels)13. Fieldwork took place at different times of day, and on
all days of the week.
The accompanied shops gave an understanding of how people used FOP labels in
real life situations in retail environments. They allowed probing at the point of
decision making, and observation of behaviour in the retail environments.
b) In-store shopping bag audits.
In the first phase of fieldwork, 50 in-store shopping bag audits were carried out,
with a later top up of 6 audits with black shoppers. People were recruited whilst
they were queuing for the checkouts after completing their shopping. When they
had been through the checkouts researchers discussed the shoppers’ purchasing
13 For details of products selected see Technical Annex section 3.4.9

BMRB Report: Comprehension and use of UK nutrition signpost labelling schemes 16
decisions with them, again with a focus on the use of FOP labels. Only those who
had purchased at least 5 FOP products were interviewed.
The in-store shopping bag audits gave an understanding of how people used FOP
labels in retail environments. Although researchers were not present to probe
whilst decisions were being taken, this method ensured that there was no
observer effect on purchasing decisions, as purchasing was done without
shoppers knowing that they were going to be asked to participate in the research.
c) In-home shopping bag audits.
In the first phase of fieldwork, 50 in-home shopping bag audits were carried out,
with a later top up of 6 audits with black shoppers. All shoppers in the in-home
shopping bag element of the research were deliberately recruited as ‘label users’;
that is, they were sifted at recruitment to only include people who recognised,
and said they used, FOP labels. This was done to ensure that the work included
the views of people who were familiar with, and used FOP labels.
Shoppers were recruited based on their intentions for their next shopping trip, to
include only those who were intending to purchase a number of food items
carrying FOP labels (see Technical Annex section 3.4.9 for details of products
used at recruitment).
Researchers visited shortly after shoppers had undertaken a shopping trip, and
used the items bought as the basis of the interview. The interviews sought
information on two areas: why and how FOP labels were used in purchasing
decisions in retail environments; and whether and how the FOP labels were used
in meal planning or product usage, to give an understanding of how labels are
used in the home.
Research question 3: Multiple signposting study
The second element of the qualitative work focused specifically on the effect of
the coexistence of a range of FOP label formats on accurate interpretation of FOP
labels. This feeds primarily into research question 1, objective 5.
Fifty depth interviews were undertaken in January 2009 with people recruited to
quotas ensuring a spread across geographical areas, main retailer used, FOP label
users and non-label users, gender, lifestage, ethnicity and social and economic
groupings (See Technical Annex for more detail on the method).
During the interviews shoppers were presented with a series of pairs of different
types of labels (e.g. %GDA label and a TL label), and asked to decide which
represented a healthier product for two similar products. The interviews explored
how people deal with the information presented on the different label types in the
market place. The labels used were the same as those used in the quantitative

BMRB Report: Comprehension and use of UK nutrition signpost labelling schemes 17
study (one %GDA, one TL, and one with both %GDA and TL: see Section 2.5.4
for details), plus one further label: %GDA with non-signposting nutrient-specific
colour (similar to the label used by Tesco). This additional label was included to
allow exploration of the impact of comparing TL and monochrome labels with
those using non-signposting nutrient-specific colour.
2.4.2 Quantitative work
The quantitative work was designed to assess the efficacy of FOP labelling, by
measuring experimentally the impact that would be feasible in a natural setting,
but with measurement carried out under controlled rather than natural
conditions. This type of study provides information on the impact that could be
achieved, not on the impact that has been achieved. It should be clearly
differentiated from an effectiveness study which would measure the impact of
FOP labels under natural conditions (e.g. in store). An efficacy study was used as
this was the only way to isolate the impact of specific elements of FOP labels on
comprehension. An effectiveness study would not be able to differentiate the
impact of FOP labels from other packaging information, or from other external
information or personal assumptions and would not address the study
objectives.14
The quantitative work covered two main stages: The main survey designed to
test comprehension, and the multiple signposting method survey designed to
test the impact of comparing products using different combinations of signposting
method.
a) Research question 1: Main survey
The main element of the quantitative research was a representative UK survey of
those with the main responsibility for shopping in the household (defined as an
adult aged 16 responsible for at least half of the food shopping). This decision
was taken as main shoppers were likely to be the main users of FOP labels.
Shoppers were selected using random probability sampling, and interviews
conducted face to face in-home, using Computer Assisted Personal Interviewing
(CAPI) to allow labels to be shown on screen and to enable tests of objective
understanding to be completed alone, rather than interviewer administered. If a
shopper was unable to type for themselves, the interviewer entered the
responses for them15.
A total of 2932 interviews were conducted between 22nd September 2008 and
11th January 2009, with a response rate of 58%. Many of those refusing said that
14 For further information on efficacy and effectiveness studies, see de Zoysa et al, 1998. 15 See Scientific Rationale (BMRB & University of Surrey, 2008) Chapter 7 for reasons
behind decisions on method

BMRB Report: Comprehension and use of UK nutrition signpost labelling schemes 18
they were not interested in food labelling: shoppers seemed to be divided into
those who were really interested in this topic, and those who were completely
disengaged. Those who were not interested were not easily persuaded to spend
up to 30 minutes answering questions on the topic.
Amongst those completing the tests, 72% entered their own responses and 28%
asked the interviewer to enter the responses for them. This level was similar for
all four tests. The interview lasted around 30 minutes on average, including a
maximum of 20 minutes spent on the tests.
The method and questionnaire was tested in a small scale field pilot of 25
shoppers16, and a cognitive interviewing stage of around 100 shoppers (see
Malam et al, 2008 for full report of this stage). This latter stage used qualitative
techniques to ensure that the test questions selected for the main stage (and
other key questions) were designed to address the research questions.
b) Research question 3: Multiple signposting method survey
In addition, a further set of interviews was conducted to test the specific
hypothesis that it is more difficult to compare the healthiness of two products
when a different FOP label type is used on each product, compared with making
comparisons using the same type of label on both products. This also used an in-
home CAPI interview, but questions were placed on BMRB’s face to face omnibus
survey which uses a random location sampling approach (see Technical Annex
section 2.1). The omnibus survey is run each week, with different clients placing
questions onto a common questionnaire. Interviews were conducted with 1602
shoppers (using the same definition as the main survey) between the 13th and
19th November 2008. A maximum of 6 minutes was allowed for the tests within
this interview, with tests designed to be self completed (as in the main survey),
although 44% of shoppers asked the interviewer to enter the answers for them.
2.5 Objective testing design
The key challenge for the study was to produce data that were sufficiently robust
to have scientific credibility. This meant designing both the tools and a robust
data collection method to capture the information needed to address the research
questions. The following sources of evidence were used to design the quantitative
study17:
16 See Scientific Rationale (BMRB & University of Surrey, 2008) section 7.3.1 for details 17 See introduction to Scientific Rationale (BMRB & University of Surrey, 2008) for further
details on sources of evidence

BMRB Report: Comprehension and use of UK nutrition signpost labelling schemes 19
• Previous work in relevant fields (including nutrition, psychology, consumer
science etc,) from published papers, focused on recently published reviews
and the studies they covered;
• Discussion with relevant experts in the field;
• Initial analysis of the data from the accompanied shops, and shopping bag
audits;
• Discussion with the key actors in the project (including a steering group of
key externals stakeholders); and
• External peer-review.
Full details of the Scientific Rationale and final design are included in a separate
document (BMRB & University of Surrey, 2008)18. A brief summary of the final
design is given below to provide context for the results.
2.5.1 Label format and presentation
Three content-related elements were felt to be key to the research objectives,
and the evidence suggested that they are most likely to influence comprehension
of the nutritional information provided on FOP labels19. These were:
1. %GDA / no %GDA signposting
2. Traffic Light (TL) signposting / no TL signposting
3. Interpretive text (high, medium, low) / no interpretive text
(referred to as ‘text’ throughout the report)
A full-factorial design was used for these three elements. This meant testing
labels showing all eight possible combinations of the three elements (see Figure
2.3 later in this section for combinations and examples). This approach provides
the most systematic way of assessing the impact on comprehension of each of
these elements individually and in combination20.
Energy (also referred to as calories) was identified as a secondary priority
because the evidence suggested it may be used as a proxy to evaluate
healthiness of a product. Energy was only included as part of the full-factorial
18http://www.food.gov.uk/foodlabelling/signposting/signpostevaluation/pmpanel/evaluatio
n/quant/ 19 See Scientific Rationale (BMRB & University of Surrey, 2008) Chapter 2 for details 20 See introduction to Scientific Rationale (BMRB & University of Surrey, 2008) for
information on factorial designs

BMRB Report: Comprehension and use of UK nutrition signpost labelling schemes 20
design in tests that involve judging the healthiness of a product, otherwise it was
held constant and present21.
Two presentational elements were identified as having a potential impact on
comprehension. These were the use of a circular presentation format (e.g. the
Sainsbury’s Wheel of Health) and the use of non-signposting colour to
differentiate between nutrients (e.g. the Tesco pastel coloured %GDA label).
These were not included in the full factorial design because this would have
increased the number of labels for testing to 48, which would have been too
many to include within the constraints of interview length and sample size.
Instead it was decided to include just two further labels, approximating those
used by Sainsbury’s and Tesco. Comprehension of each was compared with one
of the eight labels in the full factorial design, differing from that label by only one
element (direction/colour) to allow evaluation of the impact of a circular
presentation and of non-signposting nutrient-specific colour in terms of the way
they currently appear in the marketplace22.
All other presentational elements were held constant (including the context in
which the label was presented). Labels included details of product name (e.g.
ready meal), weight in grams, number of portions above the generic FOP label
format showing nutritional information per portion. The final label design with
examples of each label type is shown in Figure 2.3.
21 See Scientific Rationale (BMRB & University of Surrey, 2008) Sections 2.2.5, 2.3.3 and
2.5.1 for details on energy 22 See Scientific Rationale (BMRB & University of Surrey, 2008) Section 2.4 for details of
these and other presentational elements

BMRB Report: Comprehension and use of UK nutrition signpost labelling schemes 21
Figure 2.3: Label types used in comprehension tests
Label Example Label Example Eight labels covering all combinations of TL, text and %GDA Label 1: TL, text, %GDA FAT
19%
13.2g
MED
SALT
33%
2g
MED
SATURATES
40%
8.0g
HIGH
CALORIES SUGARS
OF YOUR GUIDELINE DAILY AMOUNT
12%
10.8g360
LOW
Each serving contains …
18%
MED
READY MEAL. 400g. CONTAINS 1 SERVING
FAT
19%
13.2g
MED
SALT
33%
2g
MED
SATURATES
40%
8.0g
HIGH
CALORIES SUGARS
OF YOUR GUIDELINE DAILY AMOUNT
12%
10.8g360
LOW
Each serving contains …
18%
MED
READY MEAL. 400g. CONTAINS 1 SERVING
Label 5: Text, %GDA
19% 33%40% 12%
FAT
13.2g
SALT
2g
SATURATES
8.0g
SUGARS
10.8g
MED MEDHIGH LOW
OF YOUR GUIDELINE DAILY AMOUNT
Each serving contains …
CALORIES
360
18%
MED
READY MEAL. 400g. CONTAINS 1 SERVING
19% 33%40% 12%
FAT
13.2g
SALT
2g
SATURATES
8.0g
SUGARS
10.8g
MED MEDHIGH LOW
OF YOUR GUIDELINE DAILY AMOUNT
Each serving contains …
CALORIES
360
18%
MED
READY MEAL. 400g. CONTAINS 1 SERVING
Label 2: TL, text
FAT
13.2g
MED
SALT
2g
MED
SATURATES
8.0g
HIGH
SUGARS
10.8g
LOW
Each serving contains …
CALORIES
360
MED
READY MEAL. 400g. CONTAINS 1 SERVING
FAT
13.2g
MED
SALT
2g
MED
SATURATES
8.0g
HIGH
SUGARS
10.8g
LOW
Each serving contains …
CALORIES
360
MED
READY MEAL. 400g. CONTAINS 1 SERVING
Label 6: Text
Each serving contains …
FAT
13.2g
MED
SALT
2g
MED
SATURATES
8.0g
HIGH
SUGARS
10.8g
LOW
CALORIES
360
MED
READY MEAL. 400g. CONTAINS 1 SERVING
Each serving contains …
FAT
13.2g
MED
SALT
2g
MED
SATURATES
8.0g
HIGH
SUGARS
10.8g
LOW
CALORIES
360
MED
READY MEAL. 400g. CONTAINS 1 SERVING
Label 3: TL, %GDA
FAT
19%
13.2g
SALT
33%
2g
SATURATES
40%
8.0g
SUGARS
OF YOUR GUIDELINE DAILY AMOUNT
12%
10.8g
READY MEAL. 400g. CONTAINS 1 SERVING
Each serving contains …
CALORIES
360
18%
FAT
19%
13.2g
SALT
33%
2g
SATURATES
40%
8.0g
SUGARS
OF YOUR GUIDELINE DAILY AMOUNT
12%
10.8g
READY MEAL. 400g. CONTAINS 1 SERVING
Each serving contains …
CALORIES
360
18%
Label 7: %GDA
OF YOUR GUIDELINE DAILY AMOUNT
Each serving contains …
FAT
19%
13.2g
SALT
33%
2g
SATURATES
40%
8.0g
SUGARS
12%
10.8g
CALORIES
360
18%
READY MEAL. 400g. CONTAINS 1 SERVING
OF YOUR GUIDELINE DAILY AMOUNT
Each serving contains …
FAT
19%
13.2g
SALT
33%
2g
SATURATES
40%
8.0g
SUGARS
12%
10.8g
CALORIES
360
18%
READY MEAL. 400g. CONTAINS 1 SERVING
Label 4: TL
FAT
13.2g
SALT
2g
SATURATES
8.0g
SUGARS
10.8g
Each serving contains …
CALORIES
360
READY MEAL. 400g. CONTAINS 1 SERVING
FAT
13.2g
SALT
2g
SATURATES
8.0g
SUGARS
10.8g
Each serving contains …
CALORIES
360
READY MEAL. 400g. CONTAINS 1 SERVING
Label 8 None
Each serving contains …
FAT
13.2g
SALT
2g
SATURATES
8.0g
CALORIES SUGARS
10.8g360
READY MEAL. 400g. CONTAINS 1 SERVING
Each serving contains …
FAT
13.2g
SALT
2g
SATURATES
8.0g
CALORIES SUGARS
10.8g360
READY MEAL. 400g. CONTAINS 1 SERVING
Additional labels with presentational differences Label 9 %GDA, non-signposting colour
OF YOUR GUIDELINE DAILY AMOUNT
Each serving contains …
FAT
19%
13.2g
SALT
33%
2g
SATURATES
40%
8.0g
SUGARS
12%
10.8g
CALORIES
360
18%
READY MEAL. 400g. CONTAINS 1 SERVING
OF YOUR GUIDELINE DAILY AMOUNT
Each serving contains …
FAT
19%
13.2g
SALT
33%
2g
SATURATES
40%
8.0g
SUGARS
12%
10.8g
CALORIES
360
18%
OF YOUR GUIDELINE DAILY AMOUNT
Each serving contains …
FAT
19%
13.2g
SALT
33%
2g
SATURATES
40%
8.0g
SUGARS
12%
10.8g
CALORIES
360
18%
READY MEAL. 400g. CONTAINS 1 SERVING
Label 10 TL, Circular presentation
CALORIES360
FAT13.2g
SATURATES8.0g
SUGARS10.8g
SALT2g
Each serving contains …
READY MEAL. 400g. CONTAINS 1 SERVING
CALORIES360
FAT13.2g
SATURATES8.0g
SUGARS10.8g
SALT2g
Each serving contains …
READY MEAL. 400g. CONTAINS 1 SERVING
The selection of products had the potential to affect the way the different
signposting schemes enable shoppers to evaluate healthiness. Nutrients in
products that are consumed as small portions (snacks, breakfast cereals etc) are
low in terms of %GDA, yet can still appear as high in terms of TL colour, as this is
calculated per 100g. There would be less of an apparent discrepancy for products
consumed in larger portions (e.g. main meals). This led to the inclusion of two
product groups in the design (P1: food which represents a main meal sized
portion, and P2: food which represents a smaller portion or a snack). A range of
product categories were included for each of these two product groups: ready
meal, a sandwich and soup in the ‘main meal sized portion’ group (P1) and
breakfast cereals, yoghurt and crisps in the ‘smaller portion or snack’ group (P2).
Products were distributed randomly to ensure no bias was introduced.
2.5.2 Measures of objective understanding
Given the aims of the study to assess objectively how FOP labels enable shoppers
to make informed decisions, tests were needed to test objective (not perceived)
understanding, to test the different elements of the schemes, and (where

BMRB Report: Comprehension and use of UK nutrition signpost labelling schemes 22
possible) reflect the way FOP labels are used in reality, without placing an undue
burden on shoppers23.
Three test formats were included in the design, covering:
• Test 1 - Evaluation of the level of a single nutrient in a product (two
nutrients included per product)
• Test 2 - Evaluation of the healthiness of a single product
• Test 3 - Comparison of two products in terms of healthiness.
Based on existing evidence, and the evidence from the accompanied shops and
shopping bag audits, these were identified as being most likely to discriminate
between the different types of FOP signposting, and to reflect the most common
use of FOP labels24. The tests were tested cognitively (asking shoppers to “think
aloud” as they addressed each test question) and refined to ensure they truly test
the required aspect of comprehension. A full report on this testing stage is
available (Malam et al, 2008).
Each test had a pre-defined correct answer against which shoppers’ answers were
judged. In the absence of a clearly defined process for producing a totally
objective measure, FSA conducted a survey of 31 nutritionists and dieticians to
define the correct answer for selected products for each of the tasks. They were
presented only with the weight (in grams) of each nutrient for each product,
product weight (in grams) and number of portions, for 78 products. The product
examples were selected from products in the marketplace. Only products where
good agreement between experts was reached for the tests (70% or more) were
included in the survey. For test 1 (evaluation of the level of individual nutrients
within a product), 55 of the 78 products reached the required level of agreement,
for test 2 (evaluation of the healthiness of a single product) agreement was
reached over 57 products and for test 3 (comparison of two products in terms of
healthiness) agreement was reached for 27 pairs (FSA 2008). There was some
difficulty identifying sufficient pairs for test 3, and this is discussed further in
section 10.2. The final products for the research were selected from among these
examples to ensure (as far as possible) even coverage of the full range of
healthiness scores and level of nutrients within each nutrient and product
category.
Alongside accuracy of response, time taken to respond was also recorded during
the interview.
23 See Scientific Rationale (BMRB, 2008) Chapter 4 for details of tests considered 24 See Scientific Rationale (BMRB, 2008) Chapter 4 for evidence and decisions on tests
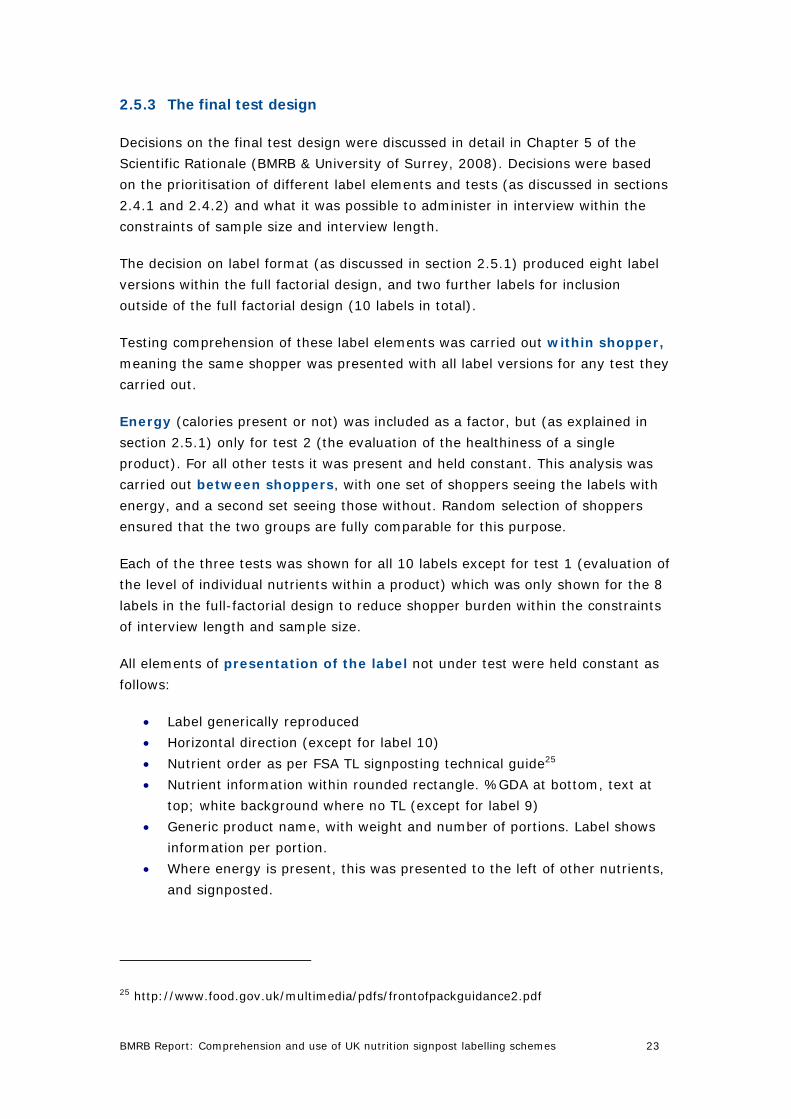
BMRB Report: Comprehension and use of UK nutrition signpost labelling schemes 23
2.5.3 The final test design
Decisions on the final test design were discussed in detail in Chapter 5 of the
Scientific Rationale (BMRB & University of Surrey, 2008). Decisions were based
on the prioritisation of different label elements and tests (as discussed in sections
2.4.1 and 2.4.2) and what it was possible to administer in interview within the
constraints of sample size and interview length.
The decision on label format (as discussed in section 2.5.1) produced eight label
versions within the full factorial design, and two further labels for inclusion
outside of the full factorial design (10 labels in total).
Testing comprehension of these label elements was carried out within shopper,
meaning the same shopper was presented with all label versions for any test they
carried out.
Energy (calories present or not) was included as a factor, but (as explained in
section 2.5.1) only for test 2 (the evaluation of the healthiness of a single
product). For all other tests it was present and held constant. This analysis was
carried out between shoppers, with one set of shoppers seeing the labels with
energy, and a second set seeing those without. Random selection of shoppers
ensured that the two groups are fully comparable for this purpose.
Each of the three tests was shown for all 10 labels except for test 1 (evaluation of
the level of individual nutrients within a product) which was only shown for the 8
labels in the full-factorial design to reduce shopper burden within the constraints
of interview length and sample size.
All elements of presentation of the label not under test were held constant as
follows:
• Label generically reproduced
• Horizontal direction (except for label 10)
• Nutrient order as per FSA TL signposting technical guide25
• Nutrient information within rounded rectangle. %GDA at bottom, text at
top; white background where no TL (except for label 9)
• Generic product name, with weight and number of portions. Label shows
information per portion.
• Where energy is present, this was presented to the left of other nutrients,
and signposted.
25 http://www.food.gov.uk/multimedia/pdfs/frontofpackguidance2.pdf

BMRB Report: Comprehension and use of UK nutrition signpost labelling schemes 24
Each test was presented for two products groups: P1 (main meal sized portion)
and P2 (smaller portion or snack). This analysis was also carried out within
shopper, with each shopper presented with each label for both P1 and P2
products.
The final design is shown in Table 2.1. The numbers in the grid refer to the
number of test presentations each shopper saw for each combination of label,
test and product category. Examples of the final labels were given in Figure 2.3.
Versions of labels 1 to 4, and labels 7, 9 and 10 were in use in the marketplace at
the time of the research. For example, labels similar to label 1 are used by Asda,
label 2 by Waitrose, label 3 by M&S, label 4 by the Co-operative Group, label 7 by
Morrisons, label 9 by Tesco and label 10 by Sainsbury’s. Labels 5, 6 and 8 were
purely hypothetical label types.
Table 2.1: Final testing design: main stage
Group of shoppers Group 1 Group 2 Group 3 Group 4
Test Test 1 Test 2 Test 2 Test 3
Total Product category P1 P2 P1 P2 E&
(P1) E&
(P2) P1 P2
TL
Text %GDA L1 2 2 1 1 1 1 1 1 10
no %GDA L2 2 2 1 1 1 1 1 1 10
no text %GDA L3 2 2 1 1 1 1 1 1 10
no %GDA L4 2 2 1 1 1 1 1 1 10
No TL
Text %GDA L5 2 2 1 1 1 1 1 1 10
no %GDA L6 2 2 1 1 1 1 1 1 10
no text %GDA L7 2 2 1 1 1 1 1 1 10
no %GDA L8 2 2 1 1 1 1 1 1 10
No TL no text %GDA L9* 1 1 1 1 1 1 6
TL no text no %GDA L10# 1 1 1 1 1 1 6
TOTAL 16 16 10 10 10 10 10 10 92 * - has non-signposting colour – label approximates to that used by Tesco # - has circular presentation – label approximates to that used by Sainsbury’s & - E indicates energy is NOT included on the label. Energy will be present on other labels.
The design gives a total of 92 test presentations. These were split into four
groups of tests, each going to a randomly selected quarter of shoppers
(addresses were allocated to a test group at the selection stage to avoid any later
interviewer bias). Each group saw the full range of labels once for each test, for
both P1 and P2. Within each group, the actual product shown with each label type
was rotated, and the order in which the tests are shown was randomised. This
was to avoid any effects from ordering or product selection. At test 1 (evaluation
of level of individual nutrients within a product), where possible, the same two
nutrients were asked about for P1 and P2 within each label type to maximise
comparability.
BMRB Report: Comprehension and use of UK nutrition signpost labelling schemes 25
Tests were administered using self completion on a laptop computer (with the
interviewer entering the response where a shopper did not feel able to do so for
themselves). All tests were timed individually by the programme, with a
maximum of 20 minutes spent on tests.
2.5.4 Testing design: Impact of multiple signposting methods on comprehension
This element of the research was not designed as a fully comprehensive test of
the impact of multiple signposting methods on comprehension, given budgetary
and timing constraints. It provides indicative rather than fully comprehensive
results.
The main study included three tests, covering two single product evaluations
(tests 1 and 2), and product comparisons (test 3). In single product evaluations
only one label is involved, by definition. Any quantitative exercise attempting to
quantify the impact of multiple label types must, therefore, use comparison tests.
The work to explore the impact of multiple label formats on comprehension used
Test 3 (comparison of two products in terms of healthiness) as used in the main
study. In the multiple signposting study, however, for each pair of products, a
different FOP label type was used for each product example, whereas in the main
study each pair used the same label type for both of the products. A subset of the
products used in the main stage was used for these tests. This allowed
comparison of the percentage of correct answers when using two different label
types, with the percentage of correct answers when using two matching label
types, in order to quantify the impact (if any) of trying to compare two different
label types. The answers were judged as correct against the results of the
nutritionists’ survey (FSA 2008) in the same way as in the main survey.
As explained above, this was not intended to be a comprehensive study, and only
three of the eight label types were included: label 1 (text, TL, %GDA), label 4 (TL
only) and label 7 (%GDA only). Only labels from the full factorial design were
considered, to avoid any influence of presentational changes. Only labels in use in
the marketplace were considered. The decision was taken that a %GDA only and
a TL only label should be included (as the main two signposting methods used in
the marketplace), plus one label containing text, TL and %GDA. This would allow
comparisons of labels with %GDA in common (label 1 and label 7), TL in common
(label 1 and label 4) and no signposting in common (label 4 and label 7). For
each pair of products, each pair of labels would be presented twice (e.g. label 1
with product A, label 4 with product B and vice versa) to avoid any product/label
type combination effects. This gave a total of 6 possible label pairings for each
pair of products.

BMRB Report: Comprehension and use of UK nutrition signpost labelling schemes 26
In order to produce a design in which all possible label and product combinations
would be presented (as in the main stage) three pairs of products were needed
from each of P1 (main meal sized portion) and P2 (smaller portion or snack). To
avoid biasing the results by limited product choice, this was doubled to six pairs
(compared with ten at the main stage). These products were chosen to cover
those with the lowest levels of correct response from partial data at the main
stage, in order to include the more difficult examples (although even the lowest
level was correct for over 70% of shoppers, and most were correct for 80% or
more). Comparison with the main stage data was conducted only with responses
about the same products. As at the main stage, energy was shown at the same
level for both products within a pair to ensure it could not be used to influence
the evaluation.
The final design for the multiple label work is shown in Table 2.2.
Table 2.2: Final testing design: multiple label study
Test 3 Test 3 Group 1 Group 2 Group 3 Group 4
Label pair
P1 P2 P1 P2 Label pair
P1 P2 P1 P2 Total
L1/L7 1 1 1 1 L7/L1 1 1 1 1 8 L4/L7 1 1 1 1 L7/L4 1 1 1 1 8 L1/L4 1 1 1 1 L4/L1 1 1 1 1 8 Total 3 3 3 3 3 3 3 3 24
This design gives a total of 24 test presentations. Shoppers were split into four
equal groups at random (allocated using the interviewing programme). Each
group saw all three pairs of labels once each for P1 and P2. Groups 1 and 3 were
shown the first set of six products (the label allocation was reversed within each
pair for group 3), and groups 2 and 4 the second set of six (with the label
allocation reversed for group 4). Within each group, as for the main stage testing,
all possible product/label combinations were rotated and the order in which tests
were shown was randomised to avoid any effects from ordering. Shoppers in each
group were shown a maximum of 6 test presentations.
Tests were administered using self completion on a laptop computer. All tests
were individually timed by the computer with a maximum of 6 minutes allowed
for the tests in total.
2.5.5 Functional literacy
Simple label-specific literacy tests were administered prior to testing to avoid
shopper embarrassment if they were unable to read the labels. Shoppers who
were unable to consistently identify and replay the simplest information from the
labels bypassed the tests and just answer the non-test questions. One in ten
BMRB Report: Comprehension and use of UK nutrition signpost labelling schemes 27
(9%) shoppers were unable to replay at least three out of four pieces of
information from the label shown (the threshold used for inclusion). Each shopper
was asked to replay number of calories, number of grams of one nutrient,
whether the product was high/medium/low in one nutrient, and %GDA for one
nutrient. A further 4% had difficulty reading the labels on screen. In total, 87%
of shoppers had sufficient functional literacy to be able to take part in
the tests.
In the additional omnibus based work, 83% of shoppers had sufficient functional
literacy to be able to take part in the tests.
2.5.6 Approach to analysis for tests
For each test in the main stage, for the eight labels included in the fully factorial
design, percentages of correct answers were considered for each of label types 1
to 8 to get an initial impression of which combination of text, TL and %GDA
appears to achieve the best levels of comprehension on that measure.
Logistic regression was then used to look at the effects of TL, %GDA, text and
product on comprehension (i.e. the ability to give correct answer).
Logistic regression is a multivariate technique which can be used to predict the
odds of the correct answer being given for labels with different combinations of
signposting elements. Odds are the ratio of the probability that the answer will be
correct to the probability that it will be incorrect. The technique is valuable
because it indicates whether each element of the label makes a significant
contribution to explaining the level of correctness having held all the other
elements under consideration constant.
The model was run by entering all possible elements under consideration at one
time, with the regression and then re-running after rejecting any that do not
make a significant contribution.
A more detailed explanation of logistic regression is given in Chapter 2 of the
Technical Appendix.
Any difference in time taken was considered, to provide further evidence.
Percentages of correct answers were also used to compare label 9 with label 7,
and label 10 with label 4, to establish any impact of using a circular rather than
horizontal direction of presentation, and of the use of non-signposting colour (but
only within the formats in which these are currently used in the marketplace).
In addition, the level of comprehension of specific groups of shoppers was used to
provide evidence of which label types best enable shoppers with specific needs to
understand nutritional information. This was a secondary measure to help decide

BMRB Report: Comprehension and use of UK nutrition signpost labelling schemes 28
between labels with a similar level of performance. The groups taken into account
were:
Demographic groups:
• Parents
• Shoppers self-defining as any group other than “white British” or “other
white”.
• Shoppers from the C2DE social grades (these are the lower social grades:
see Glossary)
• Shoppers aged 65+
Groups with specific shopping needs:
• Shoppers who are providing for someone with a medical condition or need
• Shoppers who are providing for someone who avoids one or more of the
nutrients included in FOP labels
Groups with lower numeracy/literacy/education:
• Shoppers with lower label-specific literacy (incorrect response at any of
the in-interview literacy tests – see section 2.5.5 for details. Since only
those correctly responding at three or four of the literacy questions
completed the tests, this divides shoppers into those who correctly
answered all four, and those who had one incorrect answer).
• Shoppers with lower label-specific numeracy (incorrect response at any of
the in-interview numeracy tests)
• Shoppers with a highest educational qualification of below GCSE grade C
or equivalent
Finally, percentages of correct answers and logistic regression were used to
establish which key demographic and behaviour variables have an impact on
comprehension of FOP labels at each test.
Differences in percentages in level of correctness at the tests were tested for
statistical significance using t-tests or chi-squared tests as appropriate (see
section 12.4 for further detail). Only observed differences that were statistically
significant (p<0.05) are reported as differences. If an apparent difference is
discussed that is not statistically significant, this will be explicitly stated in the
text. All differences that are reported can therefore be assumed to be statistically
significant unless otherwise stated.
Just because a difference is statistically significant does not mean this is a
substantial difference. Differences may be significant but small, and will be
described as such in the text. Whether a significant difference is small or
substantive, this does not give any indication of whether this difference is
meaningful.

BMRB Report: Comprehension and use of UK nutrition signpost labelling schemes 29
2.6 Approach to analysis and interpretation
2.6.1 Quantitative survey data
The approach to analysing the data from the tests was discussed in section 2.5.6.
Chapter 4 contains data on self reported use and attitudes. These are reported in
terms of percentages. Differences by subgroup (e.g. age, sex) were tested for
statistical significance using t-tests or chi-square tests as appropriate (see section
12.4 for detail). If an apparent difference is discussed that is not statistically
significant, this will be explicitly stated in the text. All differences that are
reported can therefore be assumed to be statistically significant unless otherwise
stated.
Section 2.2 of the Technical Appendix contains details of numbers of shoppers in
each of the major subgroups used for analysis, and section 2.3 shows the profile
of shoppers by key subgroups.
2.6.2 Qualitative data analysis and interpretation
Qualitative research (as used in the accompanied shops, bag audits and depth
interviews) allows individuals’ views and attitudes to be explored in detail. It is
important to note, however, that qualitative methods neither seek, nor allow,
data to be given on the numbers of people holding a particular view nor having a
particular set of experiences. The aim of qualitative research is to define and
describe the range of emergent issues and explore linkages, rather than to
measure their extent.
Material collected through qualitative methods is unstructured and unwieldy; the
primary aim of the analysis is to provide a means of exploring coherence and
structure within a large data set whilst retaining a hold on the original accounts
and observations from which it is derived. In this research the interviews were
digitally recorded, and verbatim transcriptions were made from the recordings;
researcher notes and debriefing sessions were also used in the analysis.
The method used to analyse the data gathered in this study was BMRB’s tried and
tested Matrix Mapping technique (see Technical Appendix section 3.3. for details).
The analysis summarises and synthesises the data according to a thematic
framework. All data are sifted according to the core themes of this framework and
the analyst maps the data and identifies features within it: defining concepts,
mapping the range and nature of phenomenon, creating typologies, finding
associations, and providing explanations. This produces data matrices which the
researcher can then interrogate in a structured way when conducting the final
analysis for reporting.
Piecing together the overall picture is not simply aggregating patterns, but it
involves a process of weighing up the salience and dynamics of issues, and

BMRB Report: Comprehension and use of UK nutrition signpost labelling schemes 30
searching for structures within the data that have explanatory power, rather than
simply seeking a multiplicity of evidence. Verbatim quotations are used to help
illustrate the most salient issues.
2.7 Structure of report
This chapter (Chapter 2) describes the background, aims of the study and
methods employed to answer the research questions. The remaining chapters
report the results of the research as follows:
• Chapter 3 reports on use of FOP labels in the retail environment and at
home. The discussion addresses research questions 1 and 2 and covers
the results of the first stage of the qualitative work.
• Chapter 4 describes self reported use and attitudes to FOP labels. The
discussion compares data from the main survey with the findings of the
qualitative work and the tests to provide further context for research
questions 1 and 2.
• Chapters 5-7 discuss the findings from the individual comprehension tests
and Chapter 8 reports the overall conclusions from the comprehension
tests. The impact of changes to FOP label presentation are considered in
Chapter 9. These chapters address research question 1, using data from
the main survey.
• Chapter 10 considers the impact on comprehension of comparing products
with different signposting methods. The discussion addresses research
question 3 using data from the omnibus survey and depth interviews.
• The conclusions of the study are presented in Chapter 11.

BMRB Report: Comprehension and use of UK nutrition signpost labelling schemes 31
3 The use of Front of Pack nutrition signpost labels in retail environments and in the home
The first stage of the qualitative work explored how people used FOP labels in
practice in both retail environments and in the home. Three different methods
were used: accompanied shops (including a short shopping task); in-store
shopping bag audits; and in-home shopping bag audits with FOP label users (see
section 2.4.1 for details). Findings from all three elements are reported in this
chapter.
Summary:
FOP label usage was not commonly observed amongst the shoppers taking part in
the accompanied shops and the in-store shopping bag audits, with other
influences often taking precedence in purchasing decisions. When FOP labels were
used, this tended to be because of medical conditions, weight loss, or being
generally health conscious (including buying food for children), with shoppers
using the labels to evaluate the healthiness of individual products, and (more
commonly) to compare the healthiness of two or more different products.
Shoppers were less likely to use FOP labels in the home than in a retail
environment. Even among FOP label users, there were products for which FOP
labels were rarely used, such as treats, staple foods, products used in small
amounts or as ingredients in cooking, foods seen as healthy and repeat
purchases.
There were three main influences on FOP label use: those which were internal to
the shopper, and external influences, covering some that are related to FOP
labels, and others external to both the shopper and the FOP label.
Internal factors, including attitudes to healthy eating led some shoppers to ignore
FOP labels, either because they believed they knew enough, or because they
were not interested. Some shoppers did not trust FOP labelling. Shopper levels of
nutritional knowledge influenced how well and to what extent FOP labels could be
used. Factors such as personal taste, familiarity and preferences tended to take
precedence over the information on FOP labels.
External factors such as other information present on the packaging, appearance
of the product, and cost could also take precedence over FOP label information,
and confusion over the way portion size information on the pack relates to the
information on FOP labels caused difficulties for some shoppers.
Finally, label-specific problems interpreting TL colours, non-signposting colours
and %GDA signposting influenced FOP label use. The inclusion of all three of TL,
%GDA and interpretive text seemed the best solution for many shoppers,
although some had difficulty interpreting any FOP label scheme.

BMRB Report: Comprehension and use of UK nutrition signpost labelling schemes 32
3.1 Research techniques and analysis
One of the two main questions for this study was how consumers use FOP labels
in the retail environment and at home. The qualitative work described in this
chapter directly addressed this question. There were three elements to this first
stage of the qualitative work: accompanied shops and in-store shopping bag
audits were used to explore shoppers’ use of labels in retail environments, and in-
home shopping bag audits with self identified FOP label users were used to
understand label usage in homes (see section 2.4.1 for further details). Findings
from these three elements are reported in this chapter.
The methods used in this element of the research were qualitative in nature. This
approach allowed individuals’ views and attitudes to be explored in detail. It is
important to note, however, that qualitative methods neither seek, nor allow,
data to be given on the numbers of shoppers holding a particular view nor having
a particular set of experiences. The aim of qualitative research is to define and
describe the range of emergent issues and explore linkages, rather than to
measure their extent.
Throughout this chapter quotations from shoppers taking part in accompanied
shops, in-store shopping bag audits and in-home shopping bag audits are used to
illustrate and illuminate the findings. The quotations are usually verbatim, but if
they have been edited, for example for clarity, care has been taken not to change
the shoppers’ meanings in any way. Any alterations are made clear by the use of
parentheses and ellipses.
3.2 Use of FOP labels
Shoppers were recruited for the accompanied shops, in-store shopping bag audits
and in-home shopping bag audits using quotas to ensure a spread of shoppers
were included26. The in-home shopping bag audits were undertaken solely with
shoppers who, during recruitment, identified themselves as FOP label users; this
was to enable detailed exploration of FOP label usage among shoppers who did
use them. For the accompanied shops and the in-store shopping bag audits
however, no quota was set for FOP label usage, and shoppers were unaware that
the research was about FOP labels until the end of the interviews, so that their
use of labels could be explored in a naturalistic way.
26 It should be noted that where differences between the various quota groups were found
these will be explained in the text; if no such differences are referred to it is because the
findings held across all of the quota groups.

BMRB Report: Comprehension and use of UK nutrition signpost labelling schemes 33
Generally shoppers taking part in the accompanied shops and in-store shopping
bag audits did not spontaneously mention using FOP labels in their purchasing
decisions. Towards the end of the interviews, if FOP labels had not been
mentioned already, shoppers were asked whether FOP labels had played any part
in their purchasing decisions; it was common for shoppers to say that they had
not noticed them until the researcher had pointed them out, and therefore had
not used them in making their purchasing decisions. A key finding of the
qualitative research is that FOP label usage was not commonly observed amongst
the shoppers taking part in the accompanied shops and the in-store shopping bag
audits, with other factors playing a greater role in purchasing decisions (such as
price, familiarity and the appearance of products).
This low level of observed use is in sharp contrast to the self-reported use
discussed in section 4.1. Six in ten shoppers (58%) reporting having used labels,
with 35% saying they used them often. Self reported behaviour is often found to
bear little resemblance to observed behaviour in research. As reported in Bell et
al (2007) purchasing behaviour tends to be automatic and learned, but people
post-rationalise when asked about what drove their decisions. The reasons given
are not necessarily the fundamental drivers of choice.
Both FOP label users and non-label users faced various difficulties in relation to
using FOP labels. The label users could usually articulate the problems they had
with the labels, but the non-label users were less likely to have thought about the
issues before they took part in the research. The findings from the non-label
users were collected by probing during the accompanied shops and the in-store
shopping bag audits, and during the ‘task’ in the accompanied shop; shoppers
who had not spontaneously mentioned the FOP labels as part of the decision
making process had the labels pointed out to them, and asked whether they had
seen them, and if so, whether they had used them. These difficulties in using FOP
labels had two potential effects for shoppers: giving up trying to use the labels
and making wrong decisions about how healthy products were.
To provide insight into the usage of FOP labels this chapter begins by discussing
how FOP labels were used (by those who use them) and then goes on to discuss
in detail the internal, external and label specific factors that influence FOP label
use.
3.3 How FOP labels were used
This section covers the two main environments in which FOP label use was
explored through the accompanied shops and bag audits: both in retail
environments and in the home.

BMRB Report: Comprehension and use of UK nutrition signpost labelling schemes 34
3.3.1 Using FOP labels in retail environments
In retail environments shoppers in the study used FOP labels in one of two ways:
either to compare the healthiness of products or to evaluate a single product.
Each is discussed below.
Using FOP labels to make healthiness comparisons between products
In the accompanied shops the most common way that shoppers used FOP labels
was to make comparisons between products. Most usually shoppers would
compare the healthiness of two products, or, more exceptionally, three or more
products.
“Well if there's two sort of similar products, I'll look and see, you
know, how they're labelled and what the content is on them and
try and go for the ones that have got the least amount of salt in
them, the lowest fat and, as I say, that won't be the main
overriding thing all the time”
Such comparisons were made for different reasons:
• When buying a product for the first time; shoppers would look at the
versions offered by different manufacturers to compare them against each
other.
• When a new product came on the market which was similar to something
they had bought before; comparisons between the new and the familiar
products would be made.
• When their usual purchase was not available; shoppers would then look for
a product which was similar to the one they would usually have bought. This
behaviour was observed during accompanied shops; people would look at
one or more products (depending on the range available) to try to find a
reasonable substitute for their usual purchase. As label users tended to have
a reason for using FOP labels, most often health related, they were able to
judge between substitute products on the nutrient of interest and be able to
recall the approximate nutrient level on their usual purchase.
• If considering buying a retailer’s ‘own brand’ rather than a branded product;
in these cases shoppers would check whether there was a compromise to be
made: to save money would they have to buy a less healthy product?
• When buying foods for children, for instance breakfast cereals; this was
usually to check which of the products contained less salt and/or sugar.

BMRB Report: Comprehension and use of UK nutrition signpost labelling schemes 35
• When taking into account health needs, such as salt levels, shoppers would
compare products to check which met their needs best.
In all of these cases shoppers were making comparisons to see the differences
between products, and usually to assess which of two or more products was
healthier. There were times when shoppers found these comparisons difficult to
make; the factors that influence this difficulty are discussed in sections 3.5 to
3.7.
Using FOP labels to make decisions about single products
More rarely shoppers would look at the FOP labels on single products, without
making a comparison with another product. There were two reasons for checking
the FOP labels on single products:
• To see if it fitted into their eating regime, such as looking to see whether a
product was high in a particular nutrient; for example, those on a low salt
diet would often check the salt content on an item before deciding whether
to buy it. This behaviour was most usually observed when making
purchasing decisions about convenience foods or highly processed foods.
• To check against packaging claims; for instance, if there was a packaging
flash which said the product was ‘Low Fat’, there were shoppers who would
check the fat levels on the FOP labels to see if they felt the claim was
justified.
3.3.2 Using FOP labels in the home
The in-home shopping bag audits were undertaken with people who said they
used FOP labels in retail environments or at home. The interviews explored how
and why FOP labels were used. People reported little use of FOP labels in their
homes, for instance to plan their daily or weekly meals, with only one person
saying that they checked FOP labels with a view to balancing their food intake in
this way27.
There were two key reasons given for using FOP labels in the home:
• To check how products fitted into a weight loss diet; for example, counting
calories, or working out points for slimming clubs. It was usual for these
shoppers to check BOP nutritional information as well as FOP labels, as they
could work out levels per 100g, rather than calculating on portion sizes.
27 In this instance the person checked TL labels and would not eat any product with red on
the FOP label during the week, with such products being saved for weekend ‘treats’.
BMRB Report: Comprehension and use of UK nutrition signpost labelling schemes 36
• To check the nutrient content, particularly salt, to ensure that they were not
exceeding a daily allowance set by their doctor
Generally FOP label users said that they used the FOP labels whilst shopping to
make sure that products fitted their requirements, and that at home they did not
need to check them again because they would not have bought anything which
was high in a nutrient they were trying to limit. The shoppers who did use FOP
labels in the home tended to be familiar with the different FOP labels in the
market place, having an understanding of TL and %GDA labels.
3.4 Shopper-internal influences on FOP label use
The model in Figure 3.1 gave examples of possible shopper-internal influences on
FOP label use, which could equally be reasons for shoppers not to use FOP labels
in retail environments or in the home. Whilst the use of FOP labels amongst
shoppers taking part in accompanied shops and in-store shopping bag audits was
found to be uncommon (enabling exploration of the reasons for this lack of use),
all of those who participated in the in-home bag audits were recruited as FOP
label users; this was to enable detailed exploration of FOP label usage among
shoppers who did use them. This section discusses shopper-internal influences on
FOP label use (or lack of use thereof). This covers the reasons for using FOP
labels recounted by shoppers28 in the study, details of products for which FOP
labels tended not to be used, reasons why some shoppers do not use FOP labels,
the influence of nutritional knowledge on the use of FOP labels, and factors which
can take priority over FOP labels in purchasing decisions.
3.4.1 Reasons given for use by FOP label users
The shoppers in the study who did use FOP labels always had a reason for doing
so. Three main categories of reason for using FOP labels were identified: medical
conditions; weight control; and being health conscious. Each of these is examined
below.
Medical conditions
Shoppers with medical conditions were more likely to check FOP labels than the
other label users. In these cases they were shopping for someone (themselves or
28 Shoppers recruited for accompanied shops and in-store shopping bag audits were not
often observed to be, nor reported themselves to be, FOP label users. This section reports
on findings from those who did use labels, mainly from the in-home shopping bag audits
(where people were recruited specifically because they did use FOP labels), but also
incorporates findings from those who did use FOP labels, or reported using them, in the in-
store work.

BMRB Report: Comprehension and use of UK nutrition signpost labelling schemes 37
someone else in their household) who had a medical condition which required the
monitoring of nutrients. Most usually shoppers checked one or two nutrients on
FOP labels: for example, those with diabetes were likely to check sugar content,
and those with heart disease would check salt and fat content.
The conditions mentioned by shoppers were:
• Diabetes
• Heart disease
• High blood pressure
• High cholesterol
• Coeliac disease
These shoppers were well informed about the levels of nutrients they should be
aiming for, usually because they had been given information by their doctor.
Weight control
Shoppers who were on a weight reduction diet most usually used the energy
information on the FOP labels, with some also looking at fat content.
There were instances of shoppers on weight loss programmes who also used the
Back of Pack (BOP) nutritional information to help them to work out ‘points’ for
their particular weight control system. BOP nutritional information was also
checked for carbohydrate content by dieters.
More rarely there were shoppers who were trying to gain weight, and used FOP
labels to help them choose products with, for instance, high calorie content.
However, in these cases shoppers also looked at BOP information to check for
additives and ingredients and to try to find the healthiest high calorie products.
Being health conscious
There were three subgroups amongst the health conscious: those who were
generally aware of healthy eating; those who were shopping for young children;
and those who had a family or personal history of medical conditions.
• There were shoppers who checked FOP labels because they were health
conscious and liked to eat healthily. These shoppers reported buying ready
meals and snacks such as crisps only as relatively rare treats. They were
usually well informed about what constituted healthy eating (understanding,
for example, the need to eat five portions of fruit and vegetables a day),
and were generally nutritionally aware, being the group most likely to
understand guideline daily amounts for nutrients and calories. This group of
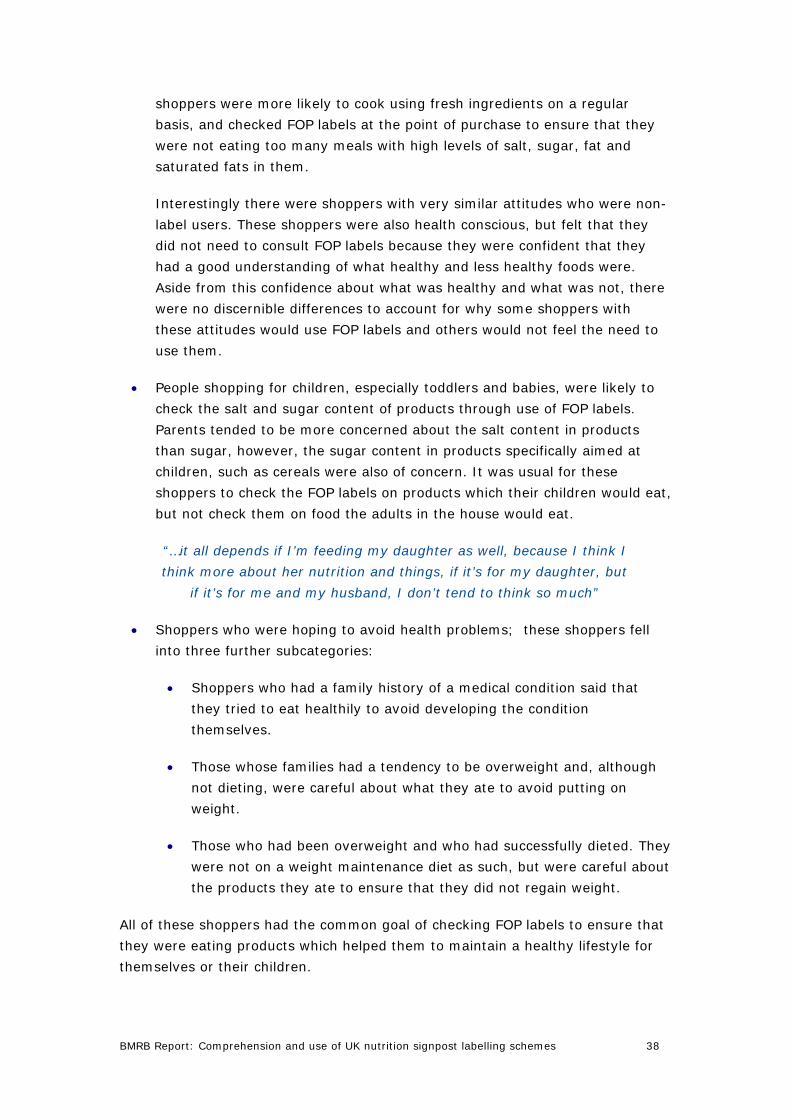
BMRB Report: Comprehension and use of UK nutrition signpost labelling schemes 38
shoppers were more likely to cook using fresh ingredients on a regular
basis, and checked FOP labels at the point of purchase to ensure that they
were not eating too many meals with high levels of salt, sugar, fat and
saturated fats in them.
Interestingly there were shoppers with very similar attitudes who were non-
label users. These shoppers were also health conscious, but felt that they
did not need to consult FOP labels because they were confident that they
had a good understanding of what healthy and less healthy foods were.
Aside from this confidence about what was healthy and what was not, there
were no discernible differences to account for why some shoppers with
these attitudes would use FOP labels and others would not feel the need to
use them.
• People shopping for children, especially toddlers and babies, were likely to
check the salt and sugar content of products through use of FOP labels.
Parents tended to be more concerned about the salt content in products
than sugar, however, the sugar content in products specifically aimed at
children, such as cereals were also of concern. It was usual for these
shoppers to check the FOP labels on products which their children would eat,
but not check them on food the adults in the house would eat.
“…it all depends if I’m feeding my daughter as well, because I think I
think more about her nutrition and things, if it’s for my daughter, but
if it’s for me and my husband, I don’t tend to think so much”
• Shoppers who were hoping to avoid health problems; these shoppers fell
into three further subcategories:
• Shoppers who had a family history of a medical condition said that
they tried to eat healthily to avoid developing the condition
themselves.
• Those whose families had a tendency to be overweight and, although
not dieting, were careful about what they ate to avoid putting on
weight.
• Those who had been overweight and who had successfully dieted. They
were not on a weight maintenance diet as such, but were careful about
the products they ate to ensure that they did not regain weight.
All of these shoppers had the common goal of checking FOP labels to ensure that
they were eating products which helped them to maintain a healthy lifestyle for
themselves or their children.

BMRB Report: Comprehension and use of UK nutrition signpost labelling schemes 39
3.4.2 Products on which label users would not use FOP labels
Amongst FOP label users there were often product types for which they would not
consider it necessary to check FOP labels. There were five broad product
categories on which FOP labels were reportedly not used: treats; staple foods;
products to be used in small amounts and/or as ingredients in cooking; healthy
foods; and habitual purchases. Shoppers in the study gave rational reasons for
not checking labels on these types of products, which are discussed below.
Treats
Shoppers reported that if something was to be a treat they did not want to check
the FOP label and be made to feel guilty about eating it.
“I think if something is a treat you should have it and enjoy it as
opposed to have it and feel guilty for it”.
Different shoppers considered different foods to be treats, for example, some
shoppers said that ready meals were occasional treats and therefore they would
not check the FOP label because it was a rare purchase for them. Products such
as chocolates and biscuits were also often cited as treats.
Staple foods
There were shoppers for whom foods such as bread were seen as staple foods,
who considered that it was not worth checking the FOP labels, as such foods had
to be bought and used whatever the FOP labels said.
Products used in small amounts or as ingredients in cooking
Products which were to be used in small amounts and/or in cooking meals from
scratch were less likely to have their FOP labels checked than other products.
Whilst butter, for example, would be seen to have a high fat content, it was
unlikely to be used in large amounts at any one time, so the FOP label
information was seen as less relevant than on other products.
Healthy foods
Some foods were considered to be inherently healthy, and shoppers saw no point
in checking the FOP labels on them, as they assumed that the labels would
merely confirm their beliefs. The foods in this category tended to be relatively
unprocessed foods such as couscous, oats and vegetables.
Habitual purchases
FOP label users reported that they tended to check FOP labels when first buying
products, but if or when the items became habitual buys they stopped checking

BMRB Report: Comprehension and use of UK nutrition signpost labelling schemes 40
the labels because they felt they knew and understood the nutrient levels in
products they bought regularly. Shoppers in the study reported that there were
some products which they bought regularly, often having done so for many years.
For some shoppers these products had also been bought by their parents, so they
had known them all of their lives. Shoppers saw no point in checking the FOP
labels on these habitual purchases because of their familiarity.
“It [soft drink] is ingrained in me now so I know I like it and
don’t think about it that much…”
Familiarity was not the only reason for not checking FOP labels on habitual
purchases: shoppers also said that they would not have time to check labels on
all items every time they shopped.
3.4.3 Shopper-internal reasons for not using FOP labels
Other issues that were found to prevent some shoppers from using FOP labels
include attitudes towards healthy eating (and beliefs about shoppers’ own diets),
cooking habits, attitudes towards the use of FOP labelling (e.g. seeing the labels
as the government telling shoppers what to eat), and occasionally, age.
Attitudes towards healthy eating and shoppers’ own diets
Interestingly, one of the main reasons for not using FOP labels was a belief for
some shoppers that they did not need to use them because they had a good
understanding of nutrition and healthy eating: these shoppers were similar in
attitude to the health conscious FOP label users. The difference between the two
groups appears to be a belief amongst the non-label users that their diet was
sensible and, therefore, they would not use very many products which carried
FOP labels29. This category of non-label users was more likely to use the BOP
information on ingredients and additives than any other packaging information
when making purchasing decisions, if they used anything at all.
“We don’t over eat, you know we don’t pig out and stuff like
that, and it’s just sensible eating, if you can eat sensibly then
you don’t have to look at those sort of things”.
29 Label users who were health conscious reported using fewer products such as ready
meals than non-label users in the study, with the exception of non-label users who did not
use the labels because they were very nutrition-aware, and who did not eat ready meals or
processed foods, and who felt able to judge the nutritional value of foodstuffs without
recourse to FOP labels.
BMRB Report: Comprehension and use of UK nutrition signpost labelling schemes 41
Cooking habits
Shoppers who cooked from scratch, rather than making heavy use of prepared
foods and ready meals, were also unlikely to use FOP labels, for similar reasons
to the group above. These people tended to use fresh products, which did not
carry FOP labels, and any products they bought which carried FOP labels were
likely to be used in relatively small amounts, as ingredients in cooking, therefore
the FOP labels were not used by them. Amongst the shoppers in the study, Asian
shoppers often cited these reasons for not using FOP labels.
Attitudes towards FOP labelling
There were shoppers who actively chose to ignore FOP labels. Most commonly
amongst this group the reason given was that they were not interested in them,
either because they thought that FOP labels were aimed at dieters, so were not of
interest to them, or because they felt that they should be able to buy and eat
what they liked without worrying about the nutritional content. However, there
were also shoppers who felt sceptical about what the labels were trying to
convey, thinking that the retailers and manufacturers would only put ‘favourable’
labels on products, and therefore the FOP labels were not to be trusted. For
others in this category there was a feeling that the government was trying to tell
them what to eat (which was unwelcome), and that they were being bombarded
with information which they did not want.
“They’re pumping you with the sort of propaganda on the TV,
look for this, look for that – there’s’ stacks of information and
you get fed up you know.”
Age
Fairly exceptionally, there were some older shoppers (over the age of 65) who
felt that at their time of life the information on FOP labels was meaningless. This
was because they felt they did not want to change their eating habits, and
therefore did not want to engage with the nutritional information presented on
FOP labels.
“Not at my age.. because I’m too old.”
3.4.4 Influence of nutritional knowledge on FOP label use
In addition, the level of understanding of nutrition played a key role in shoppers’
ability (and hence, willingness) to use FOP labels. The study relies on observed or
expressed difficulties with specific elements of nutrition relevant to FOP labels and
did not include an objective measure of nutritional knowledge.

BMRB Report: Comprehension and use of UK nutrition signpost labelling schemes 42
The ways in which FOP labels were used were related to what shoppers
understood about nutrition in general and the nutrients depicted on the FOP
labels in particular. Shoppers could not use what they did not understand, and
shoppers in the study made most use of the elements of the FOP labels which
they understood best. Label users usually had a good understanding of guidance
on maximum daily amounts on at least one of the FOP label nutrients. However,
for non-label users an issue across all label types was a lack of knowledge about
nutrient levels, making usage difficult because they were not sure what they were
comparing. The importance of the levels of nutrients required for a healthy diet
did not appear to be generally understood amongst shoppers in the study who
were not FOP label users.
Amongst both FOP label users and non-label users the most understood element
of FOP labels was energy (calories). This might be because shoppers had read or
heard about the recommended calorie intake for adults over a relatively long
period of time. In the task undertaken towards the end of the accompanied shop,
which asked shoppers to choose the ‘healthiest’ product from an array of similar
products, energy was usually where they started if they used the FOP label. This
one element was often used as a proxy for all the nutrients on the FOP labels,
with shoppers saying not only that they understood it, but also that by using it
they were only having to compare one element of the FOP labels. When shoppers
tried to compare more than one nutrient level they would often become confused,
being unable to judge whether, for example, it might be better to choose a
product with low salt but high fat levels; this happened both in trying to compare
signposting elements and the weight of nutrients in grams. Section 10.3 includes
discussion of further qualitative work undertaken where labels were presented to
shoppers for comparison with the energy levels held constant.
The quantitative work tested the influence of energy on the ability of shoppers to
evaluate the healthiness of a single product (see section 6.3). This found that
shoppers were just as able to make healthiness judgements when energy was not
included on the labels. It suggested that when energy was present in the form of
calories, some shoppers would report using them (either alone, or along with the
other nutrient information) to make their evaluation, but when they were absent
they would turn to other nutrients, particularly fat.
After energy the next most understood element of the FOP labels was salt. There
had been an advertising campaign to promote an understanding of the daily
maximum levels of salt people should not exceed; whilst shoppers in the study
did not explicitly say that they had seen the advertising campaign about salt,
there was a greater understanding about GDA recommendations for salt than any
of the other nutrients, which could be related to the publicity. Further, where
shoppers had medical reasons for monitoring their intake of salt, they had usually
been advised by their doctor about their daily limit. Salt was the second most
used element of the FOP labels.

BMRB Report: Comprehension and use of UK nutrition signpost labelling schemes 43
The least well understood element was saturated fats. There were shoppers
who tried to add fats and saturated fats together to get a combined total, and
shoppers who simply did not know what saturated fats were. Exceptionally there
were shoppers who mistakenly thought that saturated fats were ‘good fats’ which
absorbed other fats, so that it was desirable to have high levels of them to offset
the intake of other types of fats. As a consequence, saturated fats were also the
least used element of the FOP labels.
3.4.5 Factors influencing purchasing decisions that can outweigh FOP labels
There were several shopper-internal factors which were observed to be influential
in purchasing decisions including assumptions about taste, brand familiarity, and
family preferences. These were all observed in the accompanied shops, and were
reported to be important by shoppers in the study. During the accompanied
shops it was observed that these factors could outweigh information gained from
FOP labels, even for shoppers observed to be using FOP labels. The exceptions to
this were shoppers who had medical conditions requiring the limiting of certain
nutrients, those on weight loss diets and some of those shopping for small
children and babies. Each influencing factor is discussed below.
Taste assumptions
There were shoppers who knowingly bought products with higher levels of
nutrients such as fat, as they assumed that products with reduced levels would
not taste as good as those with higher levels.
“Because chips aren’t healthy… and if you do buy the lower fat,
lower whatever option, they are horrible, they are bland, they
are dry.”
Brand familiarity
Considerable loyalty was observed amongst shoppers, both for manufacturers’
brands and retailers’ own brands. There were shoppers for whom brand
familiarity overrode most of the other factors, including FOP labels, because they
trusted the brand.
‘The FOP would never be a deciding factor, the price and the
brand would always be more important.’
For these shoppers there was a particular trust in health claims on packaging,
and in sub-brands such as ‘Be Good To Yourself’, and they would not check
products against other brands.

BMRB Report: Comprehension and use of UK nutrition signpost labelling schemes 44
For these shoppers brand familiarity and brand loyalty was not just about
whether products were likely to be healthier, but they were believed to be better
value for money, and often better quality than other brands offering similar
products.
Preferred by family, particularly children
When shopping for other members of the family, particularly children, shoppers
said that they were more likely to purchase products which their families would
eat. This consideration was particularly observed in those on tight budgets, as
they could not afford to buy foods which might be wasted, and they were loath to
try new foods, or alternative products which might be healthier, because they
feared that the products would not be eaten. There were also some pressures put
on parents by their children to purchase foods which they had seen advertised, or
which children shopping with them saw on supermarket shelves.
3.5 External influences on FOP label use
There were also several shopper-external factors which were observed to be
influential in purchasing decisions including factors such as packaging health
claims, other packaging messages (or pictures), the appearance of the product,
the cost of the product, BOP information and portion size information. As for the
internal factors, these were all observed being used in the accompanied shops,
and were reported to be important to shoppers in the study. These external
factors could also outweigh information gained from FOP labels, even for
shoppers observed to be using FOP labels. For example, for those on a tight
budget, cost could be the deciding factor even when shoppers were comparing
products using the FOP labels. Other information on the packaging (e.g. health
claims) could result in the shopper not noticing the FOP label. As with the internal
factors, the exceptions to this were shoppers who had medical conditions
requiring the limiting of certain nutrients, those on weight loss diets and some of
those shopping for small children and babies. Each influencing factor is discussed
below.
Packaging health claims
Packaging claims such as ‘low in fat’, ‘low sugar’, and any indication that the
product was from a ‘healthy’ range were taken into consideration, and used to
make decisions about the healthiness of a product when making purchasing
decisions, whether comparing with another product or not.
Other packaging messages or pictures
Other information on the package, such as pictures of the product, pictures of
serving suggestions, or words such as ‘new’ or ‘improved’ were used by people to

BMRB Report: Comprehension and use of UK nutrition signpost labelling schemes 45
make evaluations about the product. The pictures of products and of serving
suggestions were very influential when making decisions to purchase.
The appearance of the product
When the product could be seen, such as when there were cut-aways on pizza
boxes, the appearance of the product helped shoppers in the study to make
purchasing decisions. In the task during the accompanied shops shoppers made a
decision on which product was the healthiest in this way, giving as reasons that
they could see whether, for example, a pizza had vegetables as a topping.
Cost
Cost was a highly influential deciding factor for shoppers on tight budgets. There
were shoppers who bought the cheapest products on offer, sometimes knowingly
trading off a healthier product for cost benefits. For these shoppers buying
‘healthier’ products was seen as a luxury.
“Well I mean although the sugar content in the [well known
brand] was a little bit lower, only by 1%, 10.5 I think it was,
but you know I’ve just got to weigh the pros and cons with
what I can afford”
Back of Pack information: detailed nutritional information and ingredient
list (including additives, artificial colours and flavours)
Some shoppers found the Back of Pack information more useful than the
information on the FOP label. There were shoppers on a weight loss diet who
found the information on amounts of nutrient per 100g of product most useful.
Some said they could use this to calculate Weight Watchers points for the
product.
Other shoppers were very concerned about additives and artificial colours and
flavours in their foods, sometimes because they, or someone they were shopping
for, had allergies, but often just because they did not like to eat foods which
contained them. For these shoppers ‘healthy’ products were those which did not
contain such additives.
“I mean my only concerns are these additives, chemicals, I
mean all these things, preservatives, you know, so we’re trying
to eat fresh, we don’t use many cans or things like that. So
basically that’s the main issue”.
FOP labels did not give these shoppers the information they needed, so they
habitually used the back of pack nutrition ingredient list and were very unlikely to
check the FOP labels. These shoppers tended to feel that they ate healthily,
BMRB Report: Comprehension and use of UK nutrition signpost labelling schemes 46
usually buying fresh products and products to be used as ingredients in cooking
from scratch, rather than processed foods such as ready meals.
Portion size information
The way portion sizes are displayed alongside FOP labels was a major difficulty
for some shoppers trying to use them, both when making comparisons between
products and trying to understand the nutritional values on a single item.
During the accompanied shops it was observed that shoppers who did use FOP
labels to help them to make choices could falter when trying to compare two
products if the portion sizes on similar products were different. For example, if
one product gave information on ‘half a pack’ and the other gave an amount for a
fixed portion size in grams, shoppers could become confused about how to work
out the level of nutrients in each. There were also shoppers who had difficulty
when looking at single products. For example, if a portion was deemed to be half
a pack, but they thought they would eat more than that, they could struggle with
working out the nutrient levels on, say, two thirds of a pack. During the ‘task’
element of the accompanied shops, where people were asked to pick the
‘healthiest’ from a range of products, those who used FOP labels to help them
make their decisions reported similar problems.
Shoppers noted that there were inconsistencies in how much of a product
constituted a portion – for example, amongst breakfast cereals30. Further, there
was a general feeling that portion sizes could be unrealistic, therefore, working
out what levels of nutrients they were taking in was beyond many shoppers.
“I think it’s their fault because they write unrealistic grams on
the packaging, for example, the cereal one….there’s 30g who
eats 30g cereal in the morning?....It’s double, realistically, we
eat double that amount.”
Related to this, shoppers found using FOP labels very difficult when they assumed
that a portion would be a whole product, for example, a bottle of soft drink or a
can of soup; there were cases where shoppers had assumed that the FOP
information was about the whole amount in the package, only to find that the
‘portion’ was for half of the package. This created two problems with usage: first,
shoppers had to work out how much of the nutrients they were taking in if they
consumed the whole product; and second, shoppers felt that they had been
30 Previous work undertaken for the Foods Standards Agency found similar issues in
relation to portion sizes (FSA 2007b).

BMRB Report: Comprehension and use of UK nutrition signpost labelling schemes 47
duped, as it seemed obvious to them that the whole product would be consumed
at once, therefore they called into question the reliability of the FOP labels,
becoming sceptical about them, and claiming that they would be less likely to use
them in the future.
3.6 Label specific influences on FOP label use
A lack of understanding what FOP labels meant, and confusion about the
signposting elements of the FOP labels seriously undermined some shoppers’
ability to use FOP labels, with shoppers reporting that, as a result they did not
refer to them when making purchasing decisions. There were shoppers who did
not understand what information the FOP labels were conveying. This was noted
with all FOP label types, and is discussed below in relation to the main label
types.
Traffic Light labels
For shoppers who were familiar with FOP labels, the TL labels were thought to be
particularly useful as a ‘quick guide’ to nutrient levels in products, as the colours
gave an instant indication of the healthiness of items even whilst they were on
the supermarket shelves. However, for shoppers who were less familiar with FOP
labels there could be a misunderstanding of the TL colours, with people thinking
that red, orange and green were used to make the FOP labels stand out on the
product packaging.
There were also some shoppers who reported thinking that the TL colours were
nutrient related; for example, that fats were always shown in red, as for nutrient-
specific coloured labels (e.g. Tesco pastel coloured %GDA label).
Whilst the Sainsbury’s Wheel of Health TL was familiar to shoppers in the study,
and found to be aesthetically pleasing, there were some shoppers who were
confused by it, believing it to be a pie chart with the wedge sizes indicating the
amount of nutrients in the product, and in some cases holding a belief that the
even size of the wedges indicated that the products were well balanced,
regardless of the TL colours.
“‘I assume that’s like a balanced meal from one serving.”
The circular TL label was the label that one in three shoppers believed would be
easiest to understand in the quantitative work (see section 4.2). One of the key
reasons for this was the mistaken belief that it was a pie chart with meaning
intended by the size of the wedges. There was no evidence, however, from the
quantitative work (see section 9.4) that the circular presentation led to any lower
levels of comprehension than the horizontal TL label.

BMRB Report: Comprehension and use of UK nutrition signpost labelling schemes 48
Amongst shoppers who did understand the TL colours there were those who could
not comprehend why, for example, 0.5g of salt would have an orange label whilst
2.4g of sugars would have a green label, because they had not understood that
each nutrient has a different maximum daily amount. This sort of
misunderstanding could lead to shoppers questioning the veracity of the FOP
labels.
%GDA labels
There were two main difficulties in using %GDA labels: the colours used on them
and the GDA percentages.
For shoppers in the study who had an understanding of, or familiarity with, the TL
colour scheme, the use of non-signposting colour on %GDA schemes (both
monochrome colours used for all nutrients and nutrient-specific colours) could be
confusing. There were shoppers who assumed that the %GDA colour schemes
were meaningful, in a similar way to the TL colour schemes, which created a
problem for people trying to make comparisons between the two label types.
“Tesco’s is very much the same as Asda’s… …the way I would
look at it is red, orange and green, the obvious way of doing it. I
wouldn’t look at what the blue and the purple is there.”
There were shoppers who thought that the ‘cooler’ colours such as blue and green
on the %GDA labels (both the monochrome and nutrient-specific colours)
indicated low levels of nutrients in products, as the green colour does in the TL
schemes.
When making comparisons between one product with a TL label and another
using a %GDA scheme this misunderstanding could lead to shoppers abandoning
trying to use the FOP schemes, and falling back on other factors such as
packaging health claims or the look of the product (see section 3.5). There were
also cases where shoppers assumed that the products with the %GDA labels were
a better choice, for instance, because they had a monochrome label showing pale
blue on all nutrients, which was interpreted as meaning that all nutrients were
present in low levels. In the in-home shopping bag audits there were shoppers
who reported trying to make comparisons between TL FOP labels and %GDA
labels with nutrient-specific colours thinking that they were making like for like
comparisons, assuming that the pastel colours used for specific nutrients showed
high, medium or low levels of nutrients, with ‘cooler’ colours such as green or
blue indicating low levels.
“The deeper shade [of pastel colours] indicates whether it is a
problem or not.”

BMRB Report: Comprehension and use of UK nutrition signpost labelling schemes 49
This also happened in the depth interviews, reported in section 10.3, when people
were asked to make decisions about which of a pair of labels represented a
healthier product.
A further problem with %GDA labels was the terminology used on them. There
was generally a poor understanding of what %GDA meant, but even amongst
shoppers who did understand the term there could be misunderstandings about
how the information could be used; it was not unusual for shoppers to think that
it indicated a percentage of nutrient in the product, rather than a percentage of
the guideline daily amount.
“Because you know it’ll be out of the whole 100%. You know,
you can add them up then and see sort of what’s there, you
know. You know 25% is a quarter, so you know, nearly a
quarter of this is salt, you know, it's the salt content within
your 23.7%”
Others thought they had to do mathematical calculations with the numbers, which
was a major problem for the usage of %GDA labels for shoppers who were
uncomfortable using numbers.
“I don’t understand what the 12% means – 12% of what, I
don’t have a clue”
This did not seem to relate particularly to level of education, but rather was about
whether shoppers felt that they could take a product off a shelf in a supermarket
and work out what the label meant, and time was often cited as a reason for not
doing so, with shoppers saying that they did not have the time, whilst shopping,
to work out what the %GDA meant.
“‘I don’t understand it all to be honest.. because I haven’t got a
clue. It’s all gobbledegook. I don’t have time when shopping
with two small kids to read... work out all of this”
There were shoppers who understood the concept of %GDA, and who used the
labels to help them to make purchasing decisions. These shoppers tended to be
well informed about nutrition, and to have a greater understanding than other
shoppers of the importance the different nutrient levels.
“I use them because, its generally for health purposes I like to
know what’s in them and what I’m eating, just to ensure that
we all have a sort of balanced diet.”
However, for others this understanding led to them questioning the %GDA levels
shown on products, as they understood that %GDAs were different for men,

BMRB Report: Comprehension and use of UK nutrition signpost labelling schemes 50
women and children; they felt that the %GDA information was too limited, and
might not relate to them.
“It (GDA) doesn’t really mean a lot to me because I know how
varied it (GDA) is, your daily amount, they’ve given you some
sort of average or generic amount that every person should
have and it varies from person to person”
Finally, the colours of the monochrome %GDA labels could make them difficult to
see on the packaging; it was not unusual for shoppers to comment that these
sorts of labels faded into the background, and were difficult to spot, which could
lead to them feeling that the information they contained could not be important,
or it would have been made to stand out on the packaging.
Labels with combinations of traffic light colours, text and %GDA
As mentioned above in relation to TL labels, there were shoppers who did not
understand that TL colours were meaningful, but with labels showing both text
and TL colours this problem was overcome, because the words High, Medium and
Low appeared as well as the colours. There were shoppers who realised during
accompanied shops, in-store shopping bag audits, and the later depth interviews,
what the TL colours meant, often through seeing the words and colours together.
There were spontaneous suggestions that the label with TL, text (High/Medium/
Low), and %GDA was the most sensible of all the labels, as it contained all of the
different types of information, which would mean that shoppers could use
whichever elements were easiest or most appealing to them.
“It is easy to interpret, tells you everything.”
There were a small number of shoppers who found that a label containing text, TL
and %GDA was no easier to understand than TL or %GDA, finding all FOP label
types confusing and difficult, and who appeared to be confused by the amount of
information on the FOP labels. However, the words High, Medium and Low were
likely to assist even these shoppers, as they required no interpretation, unlike the
colours on labels, the GDA percentages and even the amount of nutrients.
Difficulties comparing products using FOP labels
During the ‘task’ in the accompanied shop there were shoppers who were unable
to use the FOP labels to make comparisons. These were shoppers who had not
used the FOP labels during their own shopping, but had noticed the FOP labels
during the task. In trying to make use of the labels they could become frustrated
if they were unable to make a direct comparison; for example, even when
comparing two TL labels, if one product had a TL label with some elements in red
and some in green, but a comparator product had mainly orange labels, people

BMRB Report: Comprehension and use of UK nutrition signpost labelling schemes 51
had difficulty understanding how they could weigh one against another. For these
novice label users such difficulty could lead to them abandoning trying to use the
FOP labels and falling back on other information such as packaging health claims,
or what the product looked like. If they persisted with the FOP labels the amount
of energy (in calories) would be used to make a direct comparison.
Difficulties were particularly evident when shoppers were trying to compare two
or more products which carried different FOP label types, for example a TL and a
%GDA label, as shoppers were often unable to find commonalities for
comparison.
Lack of a common scheme
There were spontaneous suggestions that all retailers and manufacturers should
adopt the same FOP labelling scheme, making it easier for shoppers to use FOP
labels, and that failure to do so could be read as the retailers and manufacturers
not being open with their customers.
“….I can't see any other logical reason for the supermarkets not
to agree on a common labelling format, other than the fact that
they don't want to be totally open about what's in the
product….it just doesn't seem logical to me, at all, why they
can't come up with a common labelling policy which goes
across the board. Because the thing is that if there was a
common labelling policy across the board, then all the non-
supermarket labels could adopt that as well…”
Label size
One issue across all FOP label types was that shoppers found the labels small,
and therefore sometimes difficult to read, particularly for those who needed
reading glasses. These shoppers simply could not use the FOP labels if they could
not read them.
“No I couldn’t see that, not even with my glasses (laughing)….If
I put my reading glasses on I’d see it I think”
BMRB Report: Comprehension and use of UK nutrition signpost labelling schemes 52
4 Self reported use of, and attitudes towards labels
Some information on self-reported use of FOP labels was also collected on the
quantitative survey of 2932 shoppers. This was largely collected to provide
context for analysing the tests but it is of interest to look further at this data to
compare self-reported label usage and attitudes with the results of the
accompanied shops and bag audits (as reported in Chapter 3).
Summary:
Self-reported behaviours often bear little resemblance to observed behaviours in
research, so it is unsurprising that the level of self-reported use of FOP labels was
considerably higher (58% of shoppers) than observed use in the accompanied
shops and bag audits. This reflects a known tendency for shoppers to make
decisions automatically, but then be able to post-rationalise a reason for this
decision, which is not necessarily the true reason (Bell et al, 2007). Around a
third of shoppers reported using FOP labels very often (35%); this may be a
better indicator of use, although it is not possible to confirm this hypothesis.
Using this measure, use was lower for shoppers over the age of 65, and for the
lower social grades and those with lower educational qualifications.
Shopper belief in which label was easiest to understand was shown to be a poor
indicator of ability to understand labels, demonstrating that shopper preference
alone is not a reliable basis on which to design FOP labels. Two labels were clearly
reported as being seen to be the easiest to understand: label 1 for 44% of
shoppers (text, TL and %GDA) and label 10 for 32% of shoppers (the circular TL,
similar to the label used by Sainsbury’s) with no other label chosen by more than
5% of shoppers. Whilst label 1 was a strong performer in the comprehension
tests, label 10 was one of the weakest, showing the lack of a consistent
relationship between preference and performance.
Despite this preference, when presented with the label 10 (TL in a circular
format) in the tests, shoppers were consistently less likely to give the correct
response compared with tests using label 1 (text, TL, %GDA) (see Chapter 9).
Furthermore, shoppers who had said they thought label 10 was easiest to
understand were no more likely to give the right answer at tests using this label,
and neither were regular Sainsbury’s shoppers who would have been exposed to
a similar label.
The reasons given by shoppers in the survey for their choice reflected the findings
of the accompanied shops, bag audits and multiple label format depth interviews,
wherein the label containing text, TL and %GDA was generally well received as
containing all necessary information (with no evidence that this carried any
disadvantage), and the Sainsbury’s label was well recognised and liked, but could
be misinterpreted. In the survey a third of those choosing this label as easiest to
understand (32%), thought it was a pie chart (or looked like one) leading to a
potential for misunderstandings.
BMRB Report: Comprehension and use of UK nutrition signpost labelling schemes 53
4.1 Awareness and use of FOP labels
Self reported behaviour is often found to bear little resemblance to observed
behaviour in research. As reported in Bell et al (2007) purchasing behaviour
tends to be automatic and learned, but people post-rationalise when asked about
what drove their decisions. Decisions tend to be made reflexively, but self-
reported behaviours are based on reflection. The reasons given are not
necessarily the fundamental drivers of choice (Bell et al, 2007).
This is the basis of many apparent mismatches between self-reported behaviour
and more objectively recorded behaviours. For example, people over-report
socially desirable behaviours (or the frequency of these behaviours) such as
recycling, and under-report behaviours such as alcohol consumption. They are
not necessarily consciously mis-reporting these behaviours but, without careful
questioning, can have a mistaken belief about the frequency with which they do
certain things. Using FOP labels to make a purchasing decision may well be seen
as a socially desirable behaviour, demonstrating (as it does) a degree of health
literacy.
Asking shoppers in a survey if they use labels, therefore, is likely to result in
over-claiming compared with observed behaviour. Qualitative work can help to
overcome these problems, as skilful probing can help get beyond initial post-
rationalisation, and dig more deeply into decisions and behaviours, but
quantitative surveys (as reported in this chapter) do not give respondents time to
go beyond their initial thoughts. This was illustrated when attempting to recruit
shoppers who used FOP labels for the in-home bag audits. When asked a question
similar to the survey question, some shoppers said they used FOP labels, but
further probing into how they used the labels soon revealed that they did not
actually use them either when shopping, or in the home.
Asking how often shoppers use labels, and reporting figures only for the most
frequent users is likely to give a better indication, but even this may not reflect
true levels of use. The observational work reported in Chapter 3 suggested that
levels of use of labels were likely to be very low. Shoppers were not often
observed using the labels and direct prompting after a purchase choice did not
tend to reveal label use. Furthermore, a high level of difficulty in recruiting label
users for the in-home bag audits provided further evidence of low levels of use.
When interpreting the levels of use reported by shoppers, it is worth noting that
the use of FOP labels by all shoppers on every single food purchase is not to be
expected, and probably not necessary or desirable. Health is only one of many
factors influencing purchase decisions, and healthy decisions can be made even
when FOP labels are not used.

BMRB Report: Comprehension and use of UK nutrition signpost labelling schemes 54
In the survey shoppers were shown copies of the eight generic labels from the full
factorial design, plus the circular TL label, similar to that used by Sainsbury’s and
the non-signposting coloured %GDA label, similar to that used by Tesco and
asked if they had seen or used labels such as these and, if so, how often.
Eight in ten shoppers (81%) said they had previously noticed labels similar to
those shown to them during the survey, six in ten (58%) said they had used
them, and a third (35%) said that they used them often (Chart 4.1). This self
reported use seems higher than might have been expected from the accompanied
shops and bag audits. The figure closest to reality may be the number who say
they use labels often, but it is not possible to confirm this hypothesis without
further research. More generally this contrast with observed behaviour reinforces
the lack of reliability of self-reported measures.
Chart 4.1: Whether had previously seen/used/often used FOP labels – by
lifestage
Base: All shoppers
81%
91% 91%
86%82%
71%
57%
82%
31%
46%
60%56%
62%66%
71%
58%
14%
26%
37%35%
39%39%42%
35%
0%
10%
20%
30%
40%
50%
60%
70%
80%
90%
100%
All (2932) Under 35no kids(290)
Have kidsaged up to
8 (378)
Have kidsaged up to16 (517)
35-64single, nokids (424)
35-64couple, nokids (626)
65+ couple(313)
65+ single(384)
Seen labels Ever used labels Used labels often
There was a clear pattern in awareness and self-reported use by lifestage, with
higher awareness and use among younger shoppers, and those with children, and
much lower self-reported use among older shoppers. For awareness and self
reported use the significant differences were between those aged up to 35 (with
and without children), those aged 35-64, those aged 65+ in a couple, and those

BMRB Report: Comprehension and use of UK nutrition signpost labelling schemes 55
aged 65+ and single. The difference between single shoppers aged 65+ and
those in a couple is likely to be age related (shoppers aged 75+ were more likely
to be single and also less likely to have used labels (30%)). There was less
difference by age for those who used the labels often: These split into three key
groups in terms of significant differences: the under 65s, those aged 65+ in a
couple and those aged 65+ and single.
If it is assumed that the “use often” figure most accurately affects use, this
suggests that use is only lower for shoppers over the age of 65. However, the
other figures suggest that there is much greater awareness of food labelling
among younger shoppers, and this (together with other factors such as attitudes
towards healthy eating, perhaps) leads to much greater over-reporting when
asked if they use labels at all.
In terms of awareness there was no significant difference by sex, but women
were more likely to report having used labels, and using them more often than
men (Chart 4.2).
Chart 4.2: Whether had previously seen/used FOP labels – by sex, social
grade and highest qualification
Base: All shoppers
81%83%
79%
87%
78%
73%70%
86%86%
41%
65%
45%
51%
63%
70%
52%
62%58%
20%
39%
23%
30%
41%42%
30%
38%35%
0%
10%
20%
30%
40%
50%
60%
70%
80%
90%
100%
All (2932) Female(2154)
Male(778)
AB (693) C1 (817) C2 (597) DE (825) GCSE C+(1983)
GCSE D-(939)
Seen labels Ever used labels Used labels often
Whilst there was a significant gradient across all social grade groups for self-
reported use, ABC1 shoppers were more likely to report using labels often than

BMRB Report: Comprehension and use of UK nutrition signpost labelling schemes 56
C2 shoppers, with DE shoppers less likely again to report using them often. There
was a similar degree of difference by education for all three measures.
There was no difference in self reported use by ethnicity (between shoppers self-
defining as white and groups self-defining as an ethnicity other than white).
The accompanied shops and bag audits also suggested that shoppers with a
greater concern for healthy eating are more likely to use labels, although this
could also lead to lower use for some, as they believe they do not need to use the
labels given their understanding of healthy eating (see section 3.4.1). In the
quantitative work, most shoppers said healthy eating was important to them:
67% agreed strongly, with 92% agreeing at least slightly. Those who strongly
agreed were more likely to report using labels often (43%) than those who
agreed slightly (22%) and those who did not agree (4%).
There was a pattern of difference according to which supermarket shoppers used.
However, this difference can largely be explained by the age and social grade
profile of shoppers usually using each store. For example, only 55% of Somerfield
shoppers and 56% of Morrisons shoppers said they had used the labels, but over
half of these shoppers were in social grade C2DE and over three in ten were aged
65 or over. In contrast 71% of M&S shoppers had used the labels, but these
shoppers had the most affluent profile with 73% of customers in the ABC1 social
grades.31
To give a fuller picture of whether shoppers are label users, shoppers were asked
how often they used these kinds of FOP labels, and also how often they used the
information provided on the back of food packaging (BOP labels, of which they
were shown a number of examples). No questions were asked to explore which
elements of the information on BOP labels was used.
Table 4.1. How often shoppers use FOP and BOP labels to find out how
healthy a product is
Label type FOP labels BOP labels
Very often 18% 18% Fairly often 17% 19% Sometimes 15% 20% Not very often 6% 17% Rarely or not at all 42% 27% Don't Know 3% 0%
Base: All shoppers (2932)
31 Interviews were conducted with 657 Morrisons shoppers, 217 Somerfield shoppers and
289 M&S shoppers
BMRB Report: Comprehension and use of UK nutrition signpost labelling schemes 57
Whilst the number of shoppers using the two types of labels very or fairly often
was quite similar, there was a difference in the proportion who reported using
the labels more than rarely: in total 56% for FOP labels and 73% for BOP labels.
This higher level may be the result of greater familiarity with BOP labels, or the
wider range of information available. This measure is likely to be subject to over-
reporting for reasons discussed earlier in this chapter. Assuming that those
reporting using labels often are most likely to be genuine users, this suggests
there is no real difference in the level of use between FOP and BOP labels.
4.2 Perceived ease of label use
Shoppers were fairly evenly divided over whether they said they found it difficult
to tell if a food product is healthy from the label: 45% agreed that “I find it
difficult to know if a food product is healthy from the labelling”, and 39%
disagreed. Compared with frequency of use of labels, there was considerably less
variation by type of shopper. Agreement that using labels in this way was difficult
varied significantly by age (rising from 40% of 16-24s to 51% of those aged 65
or over) and by social grade (rising from 40% of ABC1s to 51% of C2DEs) and by
education (rising from 40% of those with A’ levels or above to 50% of those with
GCSEs or below). However, these differences were smaller than those seen for
self-reported use.
The cognitive testing work for this project (Malam et al, 2008) suggested that
shoppers’ beliefs about which specific FOP label is easiest to use do not
necessarily relate to their ability to understand the information on the label.
Shopper preference has been used in the past as part of the rationale for the use
of a particular label type, so it is vital to look at preference in the light of ability to
understand the labels to determine whether it is valid to base decisions on
preference. For this study, preference was gauged by asking which label shoppers
who were previously aware of FOP labels thought would be easiest to use (Chart
4.3).

BMRB Report: Comprehension and use of UK nutrition signpost labelling schemes 58
Chart 4.3: Label believed easiest to use
33%
5%
3%
1%
2%
4%
2%
4%
3%
42%
0% 50%Base: All previously aware of labels (2370)
8
%GDA with non-signposting colour9
Circular TL10
%GDA7
Text6
%GDAText5
TL4
%GDATL3
TextTL2
%GDATextTL1
8
%GDA with non-signposting colour9
Circular TL10
%GDA7
Text6
%GDAText5
TL4
%GDATL3
TextTL2
%GDATextTL1
When presented with the eight labels from the full factorial design, plus the
circular TL label and the non-signposting coloured %GDA label (see Figure 2.3 for
examples), there was a clear reported belief among shoppers who were aware of
FOP labels that two of the labels were easiest to use. Label 1 (text, TL, %GDA)
was chosen by 42% and label 10 (the circular TL label, similar to that used by
Sainsbury’s) was chosen by 33% (Chart 4.3). No other label was chosen by more
than 5%. Further analysis shows that there was no clear link between this
measure of preference and familiarity, and no consistent link between preference
and ability to understand the labels.
With the exception of Sainsbury’s users32, shoppers were no more likely to say
they found the type of label closest to that used by their supermarket easier to
understand compared with those who did not shop at that supermarket. Among
Sainsbury’s shoppers, 44% chose label 10, suggesting that familiarity has played
a role only for this label with its distinctive circular presentation.
Label 1 (text, TL, %GDA) was consistently among the best performing labels on
the tests (see Chapters 5-7). This does not, however, provide evidence that the
high level of belief that this label is easiest to understand is reflected in higher
32 815 Sainsbury shoppers were interviewed
BMRB Report: Comprehension and use of UK nutrition signpost labelling schemes 59
comprehension. If this were the case, then you would expect the levels believing
label 2 (TL and text) to be easy to use to be equally high, as this performed at a
similar level to label 1 on the tests.
Furthermore, when presented with label 10 (TL in a circular format) in the tests,
shoppers were consistently less likely to give the correct response compared with
tests using label 1 (text, TL, %GDA) (see section 9.4), despite the number of
shoppers preferring each of the two labels being fairly similar. Shoppers who had
said they thought label 10 was easiest to understand were no more likely to give
the right answer at tests using this label, and neither were regular Sainsbury’s
shoppers. This shows quite clearly that neither the belief that a label is easy to
understand, or familiarity are good indicators of ability to understand a label type.
The accompanied shops and bag audits found that familiarity with this label type
was high among both Sainsbury’s and other shoppers (both through advertising,
and because it stands out as different to most other labels in the marketplace).
This familiarity had not meant, however, greater ability to use the label, with
some shoppers not realising the TL colours had meaning (in the absence of text)
and others misinterpreting the format as a pie chart, believing the size of the
wedges to hold some meaning. This is fully reflected in the lack of correlation
between the strong belief that label 10 (TL circular) was the easiest to
understand, and the same label being one of the worst performing on the tests.
Label 1 (text, TL, %GDA) was most likely to be seen as easiest to use by younger
shoppers (Chart 4.4). Shoppers aged 25-34 were more likely than all other age
groups to choose this label, and shoppers aged 16-24 were more likely than
those aged 65+ to do so. For older shoppers, this belief did not shift to label 10
(the circular TL), but instead was spread more evenly across the other labels,
particularly label 5 (text and %GDA), which was seen as easiest to understand by
10% of those aged 75+. Labels 1 and 10, however, were still far more likely to be
selected as easiest to understand (compared with all other labels) even for the
oldest shoppers.

BMRB Report: Comprehension and use of UK nutrition signpost labelling schemes 60
Chart 4.4: % believe labels 1 (text, TL and %GDA) and 10 (circular TL)
easiest to use – by age
Base: All shoppers
42%
48%
56%
42%
38%
32%
26%
38%
30%31%30%
36%39%
28%
33%33%
0%
10%
20%
30%
40%
50%
60%
70%
80%
All (2932) 16-24(272)
25-34(494)
35-44(567)
45-54(514)
55-64(452)
65-74(388)
75+ (245)
Label 1 (text, TL and %GDA) Label 10 (circular TL)
Label 1 (text, TL, %GDA) was also more likely to be the label considered easiest
to use for ABC1 shoppers (compared with C2DEs), and shoppers with at least
GCSE grade C or above (or equivalent) (Chart 4.5). It is possible that the amount
of information on label 1 appears intimidating to older, less affluent and less
educated shoppers. There is also a difference by ethnicity, with white shoppers
more likely to feel label 1 is easiest to use.

BMRB Report: Comprehension and use of UK nutrition signpost labelling schemes 61
Chart 4.5: % believe labels 1 (text, TL and %GDA) and 10 (circular TL)
easiest to use – by social grade, ethnicity and highest
qualification
42%
48%
44%
36%
42%
35%33%
29%
44%
36%34%
39%
32%
27%
35%36%33%33%
0%
10%
20%
30%
40%
50%
60%
70%
80%
All (2932) AB (767) C1 (849) C2 (596) DE (721) White(2677)
Non-white(251)
GCSE C+(2075)
GCSE D-(849)
Label 1 (text, TL and %GDA) Label 10 (circular TL)
Base: All shoppers EthnicitySocial grade Education
To shed some more light on reasons for choosing a particular label, shoppers
were asked for their reasons. The reasons for choosing labels 1 (text, TL and
%GDA) and 10 (circular TL) are given in Table 4.2.
Shoppers had different reasons for choosing each of the two labels. The key
reasons for choosing label 1 (text, TL, %GDA) concerned the array of information
available (37%). This reflects findings from the qualitative work, which suggested
shoppers liked this label as it showed more information allowing people to choose
what to look at. Colour and colour coding were mentioned next most often: in
total 69% of those choosing label 1 mentioned colour or traffic lights with over a
third mentioning each. Around one in four (27% for each) mentioned each of
percentages (i.e. %GDA) and text signposting. In the multiple signposting
qualitative work (see section 10.3), following probing text was also mentioned
specifically as helping to interpret the information with least effort. In contrast,
however, when asked what information they had used to reach their decision at
tests 2 and 3 (see section 7.5) few shoppers cited text. It is possible that text is
currently associated with TL colours, as it is only used alongside TL in the
marketplace at the moment. These findings suggest that it is not mentioned in a
top of mind response, but is mentioned if further probing is used. The tests

BMRB Report: Comprehension and use of UK nutrition signpost labelling schemes 62
reported in Chapters 5 and 6 clearly demonstrated the influence of text on
comprehension but this appears to be at a subconscious level as few went on to
report having use text when completing test 2 (section 6.5).
Table 4.2. Reasons for feeling label 1 and label 10 is easiest to
understand
Label type Label 1
(text, TL, %GDA)
Label 10 (TL, circular)
944 778 Has the most / all the information (in one place) 37% 10% The colour(s) 36% 15% Colour coding / traffic lights 34% 8% Gives you percentages (per serving) 27% 4% Shows high / med / low rating 27% 1% Easy to read/see 8% 26% Pie chart style - 21% In a circle - 17% Can see the information at a glance / quickly 4% 14% Simple / clear / concise 6% 13% Can see proportions / how it is divided up 0% 12% Easy to understand 5% 12% It stands out / eye catching 7% 10% The lay out / well laid out 1% 7% Compact - 6%
Base: All choosing label as easiest to understand
Those choosing label 10 (circular TL) focused more on the presentational style,
with one in four (26%) saying it was easy to read, and others saying it could be
seen at a glance, it was clear, well laid out, eye catching or compact. A number of
the responses concerned the appeal of the circular presentation: 17% said being
a circle made it easier to understand. However, 21% referred to it explicitly as a
pie chart. It may be that shoppers are merely saying it looks like a pie chart, and
understand that it does not hold the same meaning as a pie chart, but the
accompanied shops and bag audits suggested that some shoppers assigned
meaning to the size of the wedges within the label: those who thought this label
was a pie chart tended to believe that the evenness of the wedges suggested that
products were in some way well balanced (see section 3.6). More explicitly, 12%
said you could see the proportions from the way it is divided up, again suggesting
it is being interpreted as a pie chart. In total 32% of those choosing label 10
mentioned pie charts, or the ability to divide it into proportions.
This information, together with patterns of preference, suggests that the largest
group of shoppers, particularly younger and more educated shoppers, believe a
BMRB Report: Comprehension and use of UK nutrition signpost labelling schemes 63
label with all three elements of signposting (text, TL and %GDA) most helpful.
For others, particularly older, less educated and less affluent shoppers, the visual
appeal of the circular presentation makes them believe the label is easier to
understand, but since one in three of those who think this label is easiest to
understand (32%) think it is a pie chart (or looks like a pie chart), there is clearly
some scope for misunderstanding the information on this label.
Taken together, the evidence from the accompanied shops and bag audits, and
the results of the comprehension tests compared with beliefs about which labels
are easiest to understand paints a very clear picture: preference, or belief that a
label is easiest to understand, is not a reliable basis on which to select a style for
FOP labels.
The reasons for believing labels are easiest to understand are illuminating: it is
clearly important to some shoppers that the label be visually appealing: simple,
clear and easy to read. For others, the inclusion of the information in a format
that is most useful to them is key. The label including TL, text and %GDA
provides all possible signposting methods, and there was no evidence from the
qualitative work that this led to misunderstandings compared with labels using
fewer methods of signposting nutrient level: those who were confused by the
label using all three methods tended to be confused by all types of signposting
label.
It is also possible that, for those shoppers who prefer the circular TL label, a
move away from a circular label format, or towards a label with %GDA and text
as well as TL could meet with resistance. However, there is no evidence that this
change would reduce their ability to understand the information on the labels: it
seems more likely to increase their ability to understand the labels give the
relative levels of comprehension on the tests (see Chapter 9). Nevertheless, this
could indicate a need for communication and reassurance for such shoppers.
BMRB Report: Comprehension and use of UK nutrition signpost labelling schemes 64
5 Comprehension of labels when evaluating levels of nutrients in a single product
The first of the tests identified as being likely to discriminate best between the
different types of FOP signposting schemes, and to reflect the most common uses
of FOP labels was evaluation of the level of individual nutrients within a
product (test 1). It should be remembered that the tests were administered in a
controlled interview situation to isolate the effects of the elements of the labels
under test, and not in a ‘real world’ situation where it would have been impossible
to unpick the extent of other influences on comprehension. The specific test was
identified as the best way to measure one of the main ways labels are used.
Chapter 4 of the Scientific Rationale gives more detail (BMRB & University of
Surrey, 2008).
Summary
Text was the single best predictor of success in terms of evaluating the level of
individual nutrients within a product, as was suggested by the qualitative
research on the effect of multiple signposting methods. The inclusion of text
increased the proportion of correct answers from 63% to 70% for P1 (main meal
sized portion) and from 65% to 68% for P2 (smaller portion or snack). There was
a further (albeit small) influence for both %GDA and TL, with neither one having
a larger effect. Six in ten shoppers were able to give the correct answer using
weight of nutrients (in grams) alone, which rose to seven in ten when all three
signposting methods were included.
Product group (P1 main meal sized portion/P2 smaller portion or snack) did not
influence shoppers’ ability to interpret FOP label information to evaluate nutrient
levels.
There were significantly more correct answers for P1 (main meal sized portion)
with label 1 (text, TL, %GDA) (73% correct) than for all other labels except for
labels 2 (TL, text) and 5 (text, %GDA). There was less differentiation by P2
(smaller portion or snack). Labels 3 (TL, %GDA) and 6 (text) were both less
successful than label 1 for P1, but were otherwise no lower in performance than
any other labels. The level of correctness for these two labels was, however, only
significantly better than for labels 7 (%GDA) and 8 (no signposting). This means
three labels performed best: 1 (text, TL, %GDA), 2 (TL, text), and 5 (text,
%GDA) with two others close behind: 3 (TL, %GDA) and 6 (text). Four of these
(all but label 3) include interpretive text signposting.
No sociodemographic factors helped differentiate between the most successful
labels, although shoppers aged 65+ and shoppers with lower label-specific
literacy (e.g. those unable to replay information from FOP labels) were generally
less able to give the correct answer using any label.
BMRB Report: Comprehension and use of UK nutrition signpost labelling schemes 65
When evaluating levels of nutrients in a single product text was most important in
driving comprehension, followed by TL and %GDA. Whilst Label 1 (text, TL,
%GDA) was the single strongest performer in a test situation, the difference from
other labels with text was not so great to make a case for this label over all
others from this test alone. However, the research into the coexistence of a range
of FOP label schemes suggested that standardising to just one label format would
enhance use and comprehension of FOP labels (see Chapter 10).
5.1 Evidence from the qualitative work
As discussed in Chapter 3, the accompanied shops and bag audits found that
some shoppers did use FOP labels to see whether a product was high in a
particular nutrient. For example, a shopper on a low salt diet may check salt
content; others used the FOP label to check other packaging claims (e.g., that the
product is “low in fat”). It was also evident that shoppers did not always have a
good understanding of what level of each nutrient was healthy or recommended.
Some tried to compare levels of salt with levels of sugar, for example, not
understanding that the recommended levels are different for the two nutrients.
%GDA for salt tended to be best understood, (which may possibly be related to
the recent advertising campaign), with saturated fats less well understood.
Shoppers tended to find it difficult to tell from the number of grams of nutrient
alone whether the amount was a little or a lot.
Evidence from the multiple label format depth interviews (section 10.3)
suggested that text would be the form of signposting requiring least effort from
the shopper, with TL and %GDA requiring some further interpretation. There was
also greater shopper difficulty using both TL and %GDA compared with text,
although the inclusion of text alongside TL could help to remove some of the
misunderstandings around TL colours.
5.2 The tests
Full details of the tests and how they were administered and assessed are given
in the Scientific Rationale (Chapters 4 and 5, BMRB & University of Surrey, 2008).
Shoppers were asked about two of the four nutrients included on FOP labels (fat,
saturated fat, salt and sugars) for each product. The question asked was: “using
the information on this label, how much (nutrient) do you think there is in one
serving of this product? Choose a number from 1 to 5 where 1 is a little and 5 is a
lot”. The five point response scale was designed so that neither %GDA nor TL
signposting would be favoured33. Each response was assessed for correctness
33 Since TL uses three points, and %GDA uses percentages, neither lend themselves more
easily to a five point scale.

BMRB Report: Comprehension and use of UK nutrition signpost labelling schemes 66
against the answer (two consecutive points on the five point scale34) pre-defined
by the survey of nutritionists and dieticians (FSA 2008). Each test was also timed.
A maximum time of 20 minutes was allowed for the tests. Almost all shoppers
completed their tests within this time.
Only the eight labels in the fully factorial design were used in this test (see Table
2.1). The test was presented for each label for both product groups: P1 (main
meal sized portion) and P2 (smaller portion or snack). This means that in total
each shopper was presented with up to 32 tests: two nutrients per product, for
each of two product groups (P1 and P2), for each of eight label types. All possible
label and product combinations were included in the tests. The product shown
with each label type was rotated, and the order in which the tests were shown
was randomised to avoid any effects from ordering or product selection. Where
possible, the same two nutrients were asked about for P1 and P2 within each
label type.
Each shopper was asked questions about two nutrients for each product example
and data analysis has assumed that independent information is provided by these
two separate questions. This effectively means that the level of correctness for
each label type (e.g. in Chart 5.1) is based on two scores for each respondent. It
should also be noted that the number of respondents cited in the charts and
tables reflect the number of shoppers, not the number of questions.
5.3 Effects of signposting elements on ability to evaluate level of nutrient
The three elements considered within the label design were:
• %GDA / no %GDA signposting
• Traffic Light (TL) signposting / no TL signposting
• Interpretive text (high, medium, low) / no interpretive text (referred
to as ‘text’ throughout the report)
These produced the eight label factorial design shown in Table 2.1 (see section
12.3 for examples of labels). All other elements of the labels were held constant,
and the random allocation of products and nutrients to the tests means any
variation (within main meal sized portion P1, or within smaller portion or snack
P2) can therefore be attributed to the individual and interaction effects of these
three elements.
The level of correctness for each label type gives a first measure of any effect
(Chart 5.1). The figures in red to the right of the percentages show (within P1
34 The two points selected were the two consecutive points with the highest % of correct
answers as given by the nutritionists.
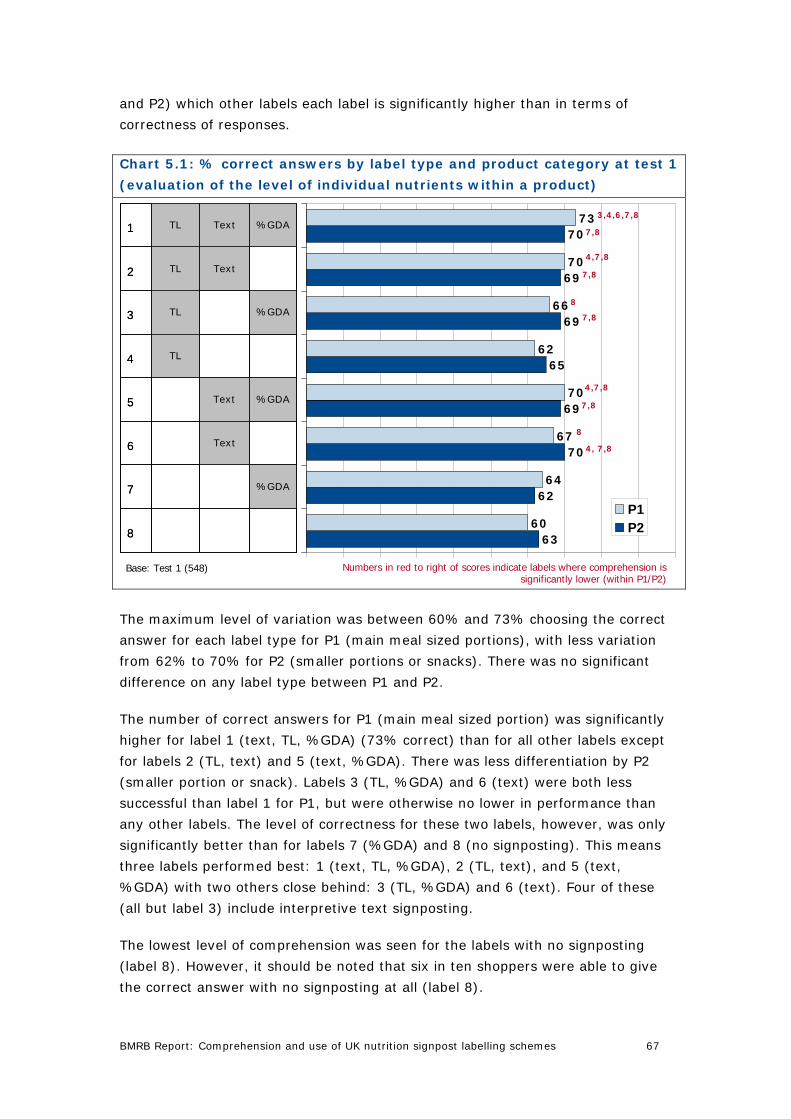
BMRB Report: Comprehension and use of UK nutrition signpost labelling schemes 67
and P2) which other labels each label is significantly higher than in terms of
correctness of responses.
Chart 5.1: % correct answers by label type and product category at test 1
(evaluation of the level of individual nutrients within a product)
63
62
70
69
65
69
69
70
60
64
67
70
62
66
70
73
P1P2
Base: Test 1 (548)
3,4,6,7,8
4,7,8
8
4,7,8
8
7,8
7,8
7,8
7,8
4, 7,8
Numbers in red to right of scores indicate labels where comprehension is significantly lower (within P1/P2)
8
%GDA7
Text6
%GDAText5
TL4
%GDATL3
TextTL2
%GDATextTL1
8
%GDA7
Text6
%GDAText5
TL4
%GDATL3
TextTL2
%GDATextTL1
The maximum level of variation was between 60% and 73% choosing the correct
answer for each label type for P1 (main meal sized portions), with less variation
from 62% to 70% for P2 (smaller portions or snacks). There was no significant
difference on any label type between P1 and P2.
The number of correct answers for P1 (main meal sized portion) was significantly
higher for label 1 (text, TL, %GDA) (73% correct) than for all other labels except
for labels 2 (TL, text) and 5 (text, %GDA). There was less differentiation by P2
(smaller portion or snack). Labels 3 (TL, %GDA) and 6 (text) were both less
successful than label 1 for P1, but were otherwise no lower in performance than
any other labels. The level of correctness for these two labels, however, was only
significantly better than for labels 7 (%GDA) and 8 (no signposting). This means
three labels performed best: 1 (text, TL, %GDA), 2 (TL, text), and 5 (text,
%GDA) with two others close behind: 3 (TL, %GDA) and 6 (text). Four of these
(all but label 3) include interpretive text signposting.
The lowest level of comprehension was seen for the labels with no signposting
(label 8). However, it should be noted that six in ten shoppers were able to give
the correct answer with no signposting at all (label 8).

BMRB Report: Comprehension and use of UK nutrition signpost labelling schemes 68
To help further assess the level of influence of the different label elements on
comprehension, logistic regression was used. The inclusion of the signposting
methods and product category alone did not produce a strong predictive model
for arriving at the correct answer. This is not surprising as many other factors
(e.g. education, age etc) are also likely to play a role. A fuller regression model is
described in section 5.4 which shows the influence of both signposting and key
demographics on ability to give the correct answer. This initial regression process
did, however, provide a useful indication of the relative influence of the three
label elements, and product category35. The regression found that product group
(P1 main meal sized portion/P2 smaller portion or snack) had no significant
influence on comprehension, and that %GDA36 and TL37 signposting had a
significant, albeit small influence. The element with the greatest influence was
text38. This confirms the data in Chart 5.1 which shows that each of the labels
with text (Labels 1, 2, 5 and 6) produce higher levels of comprehension than their
equivalent labels without text (e.g. label 1 higher than label 3 etc).
This is further illustrated in Table 5.1, which shows that the presence or absence
of text has the largest influence on ability to answer correctly: increasing from
63% without text, to 70% with text for P1 (main meal sized portion). TL and
%GDA have less influence, and for P2 (smaller portion or snack) there is less
influence for any of the signposting elements.
Table 5.1. % correct by signposting element of label content at test 1
(evaluation of the level of individual nutrients within a product)
P1 (main meal sized
portion) P2 (smaller portion or
snack) Label element absent present absent present
Text 63% 70% 65% 68% Traffic Light 65% 68% 66% 69% %GDA 65% 68% 67% 68%
Text present, plus: Traffic Light 68% 72% 69% 70% %GDA 68% 72% 70% 69% Traffic Light and %GDA
67% 73% 70% 70%
Base: All answering test 1 (548)
35 To interpret the findings below, the larger the Wald value, and the further the odds ratio
is away from 1, then the larger the influence the factor has on getting the correct
answer. 36 Wald 6.62, odds ratio Exp(b) 0.92; 37 Wald 8.82, odds ratio Exp(b) 0.91 38 Wald 66.85, odds ratio Exp(b) 0.77

BMRB Report: Comprehension and use of UK nutrition signpost labelling schemes 69
The lower half of Table 5.1 shows the influence of adding TLs and/or %GDA in
addition to text. For P2 (smaller portion or snack) there is no significant impact.
For P1 (main meal sized portions) it is clear that both TL and %GDA each add a
little but neither adds more than the other.
The time taken to complete the tests provides a second measure to help
differentiate. However, there was very little difference according to label type
(Table 5.2). The only significant difference was that the time taken to complete
the tests for label 5 (text and %GDA) was longer than for label 1 (text, TL,
%GDA) for P1, but this was still a difference of less than one second per test.
Looking at the times of those giving the correct answer does not reveal any
further differences.
Table 5.2. Average time taken (in seconds) to complete tests by label
type at test 1 (evaluation of the level of individual nutrients within a
product) – for all completing tests, and for all giving correct answer
Label type Time taken P1 (all)
Time taken P2 (all)
Time taken P1 (correct answers)
Time taken P2 (correct answers)
1. TL, Txt, %GDA 13.19 13.59 13.17 13.53 2. TL, Txt, No %GDA 13.86 13.74 13.21 13.84 3. TL, No Txt, %GDA 13.08 13.73 12.88 13.56 4. TL, No Txt, No %GDA 13.67 13.66 13.90 13.18 5. No TL, Txt %GDA 14.15 14.41 14.05 13.94 6. No TL, Txt, No %GDA 13.24 13.67 13.04 13.53 7. No TL, No Txt, %GDA 13.50 14.35 13.62 13.81 8. None 14.18 13.08 13.68 12.60 Base: All answering test 1 (548)
Whilst the time taken did not seem to vary (for the most part) between labels for
each test, it did vary between the tests (see Chapters 6 and 7 for details of tests
2 and 3). As might be expected, as it only requires shoppers to look at one
nutrient at a time, test 1 (evaluation of the level of individual nutrients within a
product) took less time to complete than the other tests (which involve
healthiness evaluations using multiple nutrients). This suggests that shoppers are
sensitive to the requirements of a particular task (e.g. judging healthiness), but
do not spend substantially longer whatever the type of FOP label presented.

BMRB Report: Comprehension and use of UK nutrition signpost labelling schemes 70
5.3.1 Further evidence for label choice based on shoppers with particular needs
Based on this initial investigation, the remainder of this chapter will focus on
labels 1, 2, 3, 5 and 639 as the labels most likely to enable shoppers to correctly
interpret nutritional information. Since all five label types produce fairly similar
levels of comprehension (although label 5 (text and %GDA) may take slightly
longer to use), consideration of shoppers with particular needs may help to
differentiate further. If there are some labels that particularly enable people with
greater needs to understand nutritional information this would be a strong
argument for using this type of label. The groups under consideration include
particular demographics, people with specific shopping needs, and shoppers with
lower label-specific literacy and numeracy skills (see section 2.5.6 for details).
Chart 5.2: % correct answers by shoppers with particular needs – Test 1
(evaluation of the level of individual nutrients within a
product) P1 (main meal sized portion), labels 1,2,3,5,6
Base: Test 1
0%
10%
20%
30%
40%
50%
60%
70%
80%
90%
100%
All (548) Parent(175)
Non white(42)
C2DE (255) 65+ (101) Medicalneed (142)
Avoid FOPnutrient(360)
Low labelliteracy
(94)
Low labelnumeracy
(69)
< GCSE C(125)
1. TL, Txt, %GDA 2. TL, Txt, No %GDA 3. TL, No Txt, %GDA 5. No TL, Txt, %GDA 6. No TL, Txt, No %GDA
39 Tables covering all labels for shoppers with particular needs are included in section 2.4
of the Technical Appendix

BMRB Report: Comprehension and use of UK nutrition signpost labelling schemes 71
Chart 5.2 shows that there was no significant variation between the five labels
in the level of correct answers for products in category P1 (main meal sized
portion). Smaller base sizes for sub-groups mean that even where there is
apparent variation, this is not usually large enough to be significant. However
there is a consistent pattern for most groups, whereby label 1 is most (or equal
most) likely to produce the correct answer and labels 3 (TL, %GDA) and 5 (Text,
%GDA) fairly consistently produce lower levels of success.
There was even less variation by P2 (smaller portion or snack) so these data are
not shown.
5.4 Influence of demographics on ability to give correct answer at test 1
Based on differences observed in the percentage of correct answers, logistic
regression was run again, adding demographic variables to the model (age,
parental status, sex, education, ethnicity, social grade, and label-specific
numeracy and literacy). An iterative process was then used to remove variables
that were not significant. The resulting model was not strongly predictive of
correctness40, but does provide an indication of the main influences on
comprehension at test 1 (evaluation of the level of individual nutrients within a
product) (Table 5.3).
Table 5.3. Outcome of logistic regression: factors influencing ability to
give correct answer at test 1 (evaluation of the level of individual
nutrients within a product)41
Factor Wald
Odds ratio Exp (b)
Reference category
Ethnicity (white/other ethnicity) 70.2 0.69 White Text (present/absent) 67.8 0.77 Present Age (16-34/35-64/65+) 50.9 0.81 / 0.70 16-34 Literacy (Passed all/failed one or more of questions) 40.0 0.76 Passed all Education (Above GCSE/GCSE or below) 10.8 0.90 Above GCSE %GDA (present/absent) 8.8 0.91 Present Traffic light (present/absent) 7.8 0.91 Present Numeracy (Passed both/failed one or both) 3.9 0.91 Passed both
40 Nagelkerke R2 = 0.22 41 To interpret this table, the larger the Wald value, and the further the odds ratio (Exp
(b)) is away from 1, then the larger the influence the factor has on getting the correct
answer. For example, controlling for all other factors, if text is changed from being present
(the reference category – this is automatically given an odds ratio of 1) to absent, this
reduces the odds of getting the correct answer by a factor of 0.77.

BMRB Report: Comprehension and use of UK nutrition signpost labelling schemes 72
This shows that the largest influences on ability to give the correct answer were
ethnicity, text, age and label-specific literacy (based on the tests in the survey).
There were smaller influences from education, the presences of %GDA and Traffic
Lights, and label-specific numeracy (again based on the tests in the survey).
Chart 5.2 (previous section) showed that, for all five of the most effective label
types, there were slightly lower levels of success amongst shoppers with lower
levels of label-specific literacy and numeracy, lower levels of education, and for
shoppers aged 65+. For shoppers self-defining as any ethnicity other than white
there appeared to be less difference for label 1 compared with lower scores for
the other labels, but the small base size means this difference by label type is not
large enough to be significant.
In terms of other demographics, there were no differences in level of correctness
between the five top label types by sex, or presence of children, and any
differences by life-stage appear to be related largely to age (Chart 5.3 shows the
results for P1 (main meal sized portions; the pattern for P2 (smaller portion or
snack) is less clear).
Chart 5.3: % correct answers by age – Test 1 (evaluation of the level of
individual nutrients within a product) P1 (main meal sized
portion), labels 1,2,3,5,6
Base: Test 1
0%
10%
20%
30%
40%
50%
60%
70%
80%
90%
100%
All (548) 16-34 (134) 35-44 (99) 45-54 (110) 55-64 (104) 65+ (101)
1. TL, Txt, %GDA 2. TL, Txt, No %GDA 3. TL, No Txt, %GDA 5. No TL, Txt, %GDA 6. No TL, Txt, No %GDA
In general terms the ability to judge the level of nutrients falls with age (there
are significant differences by age for labels 1, 3, 5 and 6), with the lowest levels

BMRB Report: Comprehension and use of UK nutrition signpost labelling schemes 73
for shoppers over the age of 45. For label 1 (text, TL, %GDA) there is more of an
age gradient compared with other labels: shoppers aged 16-34 were significantly
more likely to give the correct answer than those aged 55+, and shoppers aged
16-44 were significantly more likely to give the correct answer than those aged
65+. Within age group, however, the difference in comprehension between label
1 and labels 2, 3, 5 and 6 is not significant, even for those aged 16-34.
Previous use of FOP labels may also play a role in comprehension. There was no
difference for P1 (main meal sized portion), but for P2 (smaller portion or snack)
there was a more consistent difference. Those who said they had previously used
FOP labels were more likely to choose the correct answer than those who hadn’t,
particularly for labels 1 (text, TL and %GDA) and 7 (%GDA) (Table 5.4).
Table 5.4. % correct by whether previously used FOP labels - Test 1
(evaluation of the level of individual nutrients within a product) P2
(smaller portion or snack)
Label type All (1096) Used (642)
Not used (454)
1. TL, Txt, %GDA 70% 74% 64% 2. TL, Txt, No %GDA 69% 72% 66% 3. TL, No Txt, %GDA 69% 71% 66% 4. TL, No Txt, No %GDA 65% 65% 66% 5. No TL, Txt %GDA 69% 71% 65% 6. No TL, Txt, No %GDA 70% 73% 67% 7. No TL, No Txt, %GDA 62% 67% 56% 8. None 63% 64% 62%
Base: All answering test 1 (548)
It is possible to look at the test scores based on where shoppers usually do their
shopping. Only labels 1 to 4 and 7 are currently in use in the marketplace. Label
7 (%GDA) contains the same information as the FOP labels used by many
manufacturers, as well as many of the main supermarkets (Tesco, Netto, Lidl,
Somerfield and Morrisons). Seven in ten shoppers (71%) completing test 1
(evaluation of the level of individual nutrients within a product) said they usually
shopped at one of these supermarkets. These shoppers were more likely to give
the correct answer for label 7 for P2 (smaller portion or snack) (66%) than those
who usually shop elsewhere (54%). There was, however, no significant difference
for P1 (main meal sized portion) and no equivalent differences for labels 1 to 4. It
is worth noting, however, that these shoppers were still more likely to get the
correct answer with labels 1, 2, 5 and 6 (the variants including text) than they
were with label 7 (%GDA).

BMRB Report: Comprehension and use of UK nutrition signpost labelling schemes 74
6 Comprehension of labels when evaluating overall healthiness of a single product
The second of the tests identified as being likely to discriminate best between the
different types of FOP signposting schemes, and to reflect the most common uses
of FOP labels was evaluation of the overall healthiness of a single product
(test 2).
Summary
In evaluations of overall healthiness of a product, text was again the single best
predictor of success in terms of label comprehension. The presence of text
increased the proportion of correct answers from 59% to 68% for P1 (main meal
sized portion) and from 61% to 67% for P2 (smaller portion or snack). There was
some further small but significant influence for TL (correct answers rising to 70%
when both text and TL were included for both P1 and P2) but no significant
influence for %GDA on this measure. There was slightly more differentiation
between label types for test 2 than test 1, with 18 percentage points between the
weakest and the strongest label in terms of comprehension for P1 products.
Neither product group (P1 main meal sized portion/P2 smaller portion or snack),
nor the inclusion (or not) of energy on the FOP label influenced shoppers’ ability
to interpret FOP label information to evaluate product healthiness.
Shoppers were significantly more likely to give the correct answer using Label 1
(text, TL, %GDA) and label 2 (TL, text) than most other labels, particularly for P1
(main meal size portion), where only labels 5 (text, %GDA) and 6 (text) were not
significantly lower. Labels 5 and 6 were, however, only significantly better in
performance than label 7 (%GDA) and label 8 (no signposting). For P2 (smaller
portion or snack) comprehension of label 4 (TL) was not significantly different
from that for labels 1 and 2. This means that two labels were strongest: label 1
(text, TL, %GDA) and label 2 (TL, text), with three other labels close behind:
labels 5 (text, %GDA) and 6 (text) for both P1 and P2, and label 4 (TL) for P2
(smaller portion or snack). As at test 1, four of the strongest labels include
interpretive text signposting.
No sociodemographic factors helped differentiate between the strongest labels,
although shoppers aged 65+ and shoppers with lower label-specific
literacy/numeracy were generally less able to give the correct answer using any
label.
When evaluating overall healthiness, text is most important in driving
comprehension, with TL also having a small but significant influence. Whilst labels
1 (text, TL %GDA) and 2 (TL, text) are the strongest performers in a test
situation, the difference is not so great to make a case for these labels ahead of

BMRB Report: Comprehension and use of UK nutrition signpost labelling schemes 75
other labels with text from this test alone. However, the research into the
coexistence of a range of FOP label schemes suggested that standardising to just
one label format would enhance use and comprehension of FOP labels (see
Chapter 10).
6.1 The tests
The specific test was identified as the best way to measure one of the main ways
labels are used. Full details of the tests and how they were developed,
administered and assessed are given in the Scientific Rationale (Chapters 4 and
5, BMRB & University of Surrey, 2008). The question asked was: “using the
information on this label, how healthy do you think one serving of this food is?
Choose a number from 1 to 5 where 1 is very healthy and 5 is very unhealthy.”
Healthiness was additionally defined for shoppers as: “to be eating healthily the
Government advise that most people reduce the level of fat, saturated fat (also
known as saturates), salt and sugars in the foods they eat”. The five point
response scale was designed so that neither %GDA nor TL signposting would be
favoured42. Each response was assessed for correctness against the answer (two
consecutive points on the five point scale43) pre-defined by the survey of
nutritionists and dieticians (FSA 2008). Each test was also timed. A maximum
time of 20 minutes was allowed for the tests. Almost all shoppers completed their
tests within this time.
In this test the eight labels in the fully factorial design were included together
with the two additional labels (label 9, %GDA with non-signposting colours,
similar to the label used by Tesco, and label 10, a circular TL label, similar to that
used by Sainsbury’s) (see Table 2.1). The test was presented for each label for
both product categories: P1 (main meal sized portion) and P2 (smaller portion or
snack). This means that in total each shopper was presented with up to 20 tests.
All possible label and product combinations were included in the tests. The
product shown with each label type was rotated, and the order in which the tests
were shown was randomised to avoid any effects from ordering or product
selection.
Shoppers answering test 2 (evaluation of the overall healthiness of a product)
were split into two groups. The first group were shown labels including energy (in
the form of calories) and the second were shown the same labels without energy,
to test the hypothesis that energy affects the way FOP labels are understood.
42 Since TL uses three points, and %GDA uses percentages, neither lend themselves more
easily to a five point scale 43 The two points selected were the two consecutive points with the highest % of correct
answers as given by the nutritionists.

BMRB Report: Comprehension and use of UK nutrition signpost labelling schemes 76
Section 6.2 will focus on the eight labels in the fully factorial design shown with
energy. There will be a separate discussion of the impact on comprehension of
including or not including energy in Section 6.3. The impact on comprehension of
the presentational differences in labels 9 and 10 will be discussed in Chapter 9.
6.2 Effect of signposting elements on ability to evaluate overall healthiness of product
As for the other tests, the three elements considered within the label design
were:
• %GDA / no %GDA signposting
• Traffic Light (TL) signposting / no TL signposting
• Interpretive text (high, medium, low) / no interpretive text (referred to as
‘text’ throughout the report)
These produced the eight label factorial design shown in Table 2.1 (see section
12.3 for examples of labels). All other elements of the labels were held constant,
and the random allocation of products to the tests means any variation (within
product P1 (main meal sized portion), or within product P2 (smaller portion or
snack) can therefore be attributed to the individual and interaction effects of
these three elements. Level of correctness for each label type gives a first
measure of any effect (Chart 6.1).
Chart 6.1: % correct answers by label type and product group at test 2
(evaluation of the overall healthiness of a product)
56
58
64
65
65
64
69
71
58
53
67
65
62
62
71
69
P1P2
Base: Test 2 with energy (652)
8
%GDA7
Text6
%GDAText5
TL4
%GDATL3
TextTL2
%GDATextTL1
8
%GDA7
Text6
%GDAText5
TL4
%GDATL3
TextTL2
%GDATextTL13,4,7,8
3,7,8
3,4,7,8
7,8
7
8
7
7,8
7,8
7,8
7,8
7,8
Numbers in red to right of scores indicate labels where comprehension is significantly lower (within P1/P2)

BMRB Report: Comprehension and use of UK nutrition signpost labelling schemes 77
The figures in red to the right of the percentages show (within P1 and P2) which
other labels each label is significantly higher than in terms of correctness of
responses.
The maximum level of variation was between 53% and 71% choosing the correct
answer for each label type for P1 (main meal sized portion), with similar variation
from 56% to 71% for P2 (smaller portion or snack). There was no significant
difference on any label type between P1 and P2.
Label 1 (text, TL, %GDA) and label 2 (TL, text) were significantly higher in
performance than the greatest number of other labels, particularly for P1 (main
meal size portion) where only labels 5 (text, %GDA) and 6 (text) were not
significantly lower. Labels 5 and 6 were, however, only significantly better in
performance than label 7 (%GDA) and label 8 (no signposting). Labels 1 and 2
were significantly better than fewer other labels for P2 (smaller portion or snack);
label 1 (text, TL, %GDA) was better than label 3 (TL, %GDA) but no better than
label 4 (TL).
This means that two labels head the field: label 1 (text, TL, %GDA) and label 2
(TL, text), with three other labels worth further consideration: labels 5 (text,
%GDA) and 6 (text) for both P1 and P2, with the possible inclusion of label 4 (TL)
for P2 (smaller portion or snack). As at test 1, the four strongest labels include
interpretive text signposting.
As at test 1, the two poorest performing labels were label 7 (%GDA) and label 8
(no signposting). At test 2, however, for P1 (main meal sized portion) the lowest
level of comprehension was seen for the %GDA only label, although this was not
significantly below the level seen for label 8.
To help assess the level of influence of the different label elements on
comprehension, logistic regression was used. As for test 1 (evaluation of the level
of individual nutrients within a product), the inclusion of the signposting methods
and product category alone did not produce a strong predictive model for arriving
at the correct answer. This is not surprising as many other factors (e.g.
education, age etc) are also likely to play a role. A fuller regression model is
described in section 6.4 which shows the influence of both signposting and key
demographics on ability to give the correct answer. This initial regression process
did, however, provide a useful indication of the relative influence of the three
label elements, and of product category44. The regression found that product
group (P1 main meal sized portion /P2 smaller portion or snack) and %GDA had
no significant influence on comprehension, that TL45 signposting had a significant,
44 To interpret the findings, the larger the Wald value, and the further the odds ratio is away from 1,
then the larger the influence the factor has on getting the correct answer. 45 TL - Wald 29, odds ratio Exp(b) 0.90;

BMRB Report: Comprehension and use of UK nutrition signpost labelling schemes 78
albeit small influence, with a significant and slightly greater influence for text46.
This fits with the data in Chart 6.1 which showed labels with text producing
consistently higher levels of comprehension, with the highest levels for those with
both TL and text.
This is further illustrated in Table 6.1, which shows a similar level of increase for
text and TL for P2 (smaller portion or snack) and a slightly larger increase for text
for P1 (main meal sized portion). The bottom half of the table shows that TL has
an additional impact when text is already present (from 66% to 70% for P1, and
65% to 70% for P2). The addition of %GDA has no further significant impact on
comprehension.
Table 6.1. % correct by signposting element of label content at test 2
(evaluation of the overall healthiness of a product)
P1 (main meal sized
portion) P2 (smaller portion or
snack) Label element absent present absent present
Text 59% 68% 61% 67% Traffic Light 61% 66% 61% 67% %GDA 64% 62% 64% 64%
Text present, plus: Traffic Light 66% 70% 65% 70% %GDA 69% 67% 67% 68% Traffic Light and %GDA
67% 69% 65% 71%
Base: All answering test 2 with energy (652)
There was no significant difference in time taken to respond according to label
type (Table 6.2) and this does not provide any further ability to differentiate,
either for all shoppers answering the tests, or just those giving the correct
answer.
46 Text - Wald 70, odds ratio Exp(b) 0.71

BMRB Report: Comprehension and use of UK nutrition signpost labelling schemes 79
Table 6.2. Average time taken to complete tests by label type at test 2
(evaluation of the overall healthiness of a product) – for all completing
tests, and for all giving correct answer
Label type Time taken P1 (all)
Time taken P2 (all)
Time taken P1 (correct answers)
Time taken P2 (correct answers)
1. TL, Txt, %GDA 17.28 17.41 17.70 18.11 2. TL, Txt, No %GDA 16.67 15.77 16.05 15.20 3. TL, No Txt, %GDA 18.46 16.70 17.08 15.91 4. TL, No Txt, No %GDA 17.25 16.75 15.99 16.55 5. No TL, Txt, %GDA 17.58 16.94 17.71 17.26 6. No TL, Txt, No %GDA 17.48 16.81 17.57 17.54 7. No TL, No Txt, %GDA 16.72 16.59 15.79 16.66 8. None 16.52 17.15 15.60 16.91 Base: All answering test 2 with energy (652)
Whilst the time taken did not vary between labels for each test, it did vary
between the tests (see Chapters 5 and 7 for details of tests 1 and 3). Test 2
(evaluation of the overall healthiness of a product) took slightly longer to
complete than test 1 (evaluation of the level of individual nutrients within a
product), which is not surprising as it involves shoppers looking at all nutrients,
rather than just one, before evaluating healthiness. This was in turn less than the
time taken for test 3 (comparison of two products in terms of healthiness) which
required shoppers to compare two items across several nutrients. This suggests
that shoppers are sensitive to the requirements of a particular task (e.g. judging
healthiness), but do not spend substantially longer whatever the type of FOP
label.
6.2.1 Further evidence for label choice based on shoppers with particular needs
For P1 (main meal sized portion), labels 1,2,5 and 6 (the four labels with text)
were strong enough to consider further, but there was no significant difference in
overall performance between the four labels. Consideration of shoppers with
specific needs may help to differentiate further between these four label types47.
If there are some labels that help particular people with greater needs to
understand nutritional information this would be a strong argument for using this
type of label.
There were no significant differences between the labels amongst these key
groups for P1 (main meal sized portion) (Chart 6.2). Nevertheless, label 1 (text,
47 Tables covering all labels are included in section 2.4 of the Technical Appendix

BMRB Report: Comprehension and use of UK nutrition signpost labelling schemes 80
TL, %GDA) and label 2 (text and TL) are consistently the labels with the highest
(or equal highest) level of comprehension for most groups.
Chart 6.2: % correct answers by shoppers with specific needs – Test 2
(evaluation of the overall healthiness of a product), P1 (main
meal sized portion), labels 1,2,5,6
Base: Test 2 with energy
0%
10%
20%
30%
40%
50%
60%
70%
80%
90%
100%
ALL (652) Parent(217)
Non-white(43)
C2DE (310) 65+ (135) Medicalneed (178)
Avoid FOPnutrient(444)
Low labelliteracy
(85)
Low labelnumeracy
(87)
< GSCE C(139)
1. TL, Txt, %GDA 2. TL, Txt, No %GDA 5. No TL, Txt, %GDA 6. No TL, Txt, No %GDA
For P2 (smaller portion or snack), there were no significant differences between
any of the top five labels by key group (Chart 6.3). Label 1 (text, TL, %GDA)
was, however, consistently the label with the highest (or equal highest)
performance for each of these groups.
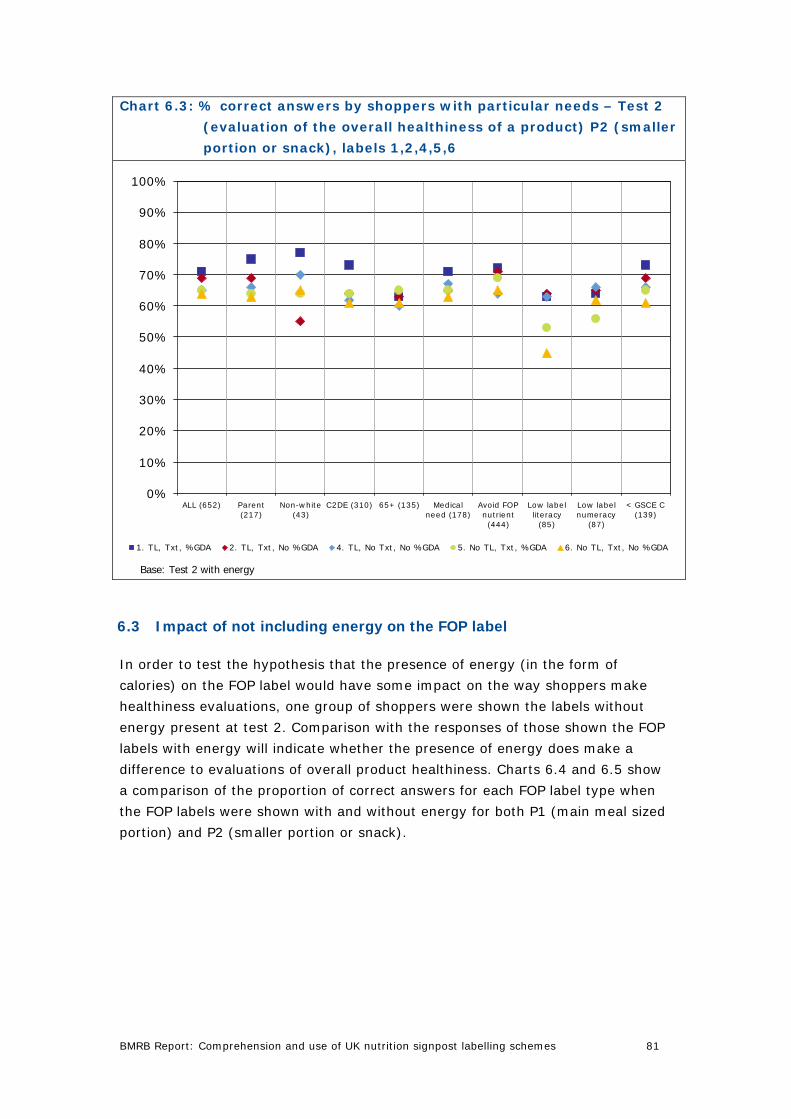
BMRB Report: Comprehension and use of UK nutrition signpost labelling schemes 81
Chart 6.3: % correct answers by shoppers with particular needs – Test 2
(evaluation of the overall healthiness of a product) P2 (smaller
portion or snack), labels 1,2,4,5,6
Base: Test 2 with energy
0%
10%
20%
30%
40%
50%
60%
70%
80%
90%
100%
ALL (652) Parent(217)
Non-white(43)
C2DE (310) 65+ (135) Medicalneed (178)
Avoid FOPnutrient(444)
Low labelliteracy
(85)
Low labelnumeracy
(87)
< GSCE C(139)
1. TL, Txt, %GDA 2. TL, Txt, No %GDA 4. TL, No Txt, No %GDA 5. No TL, Txt, %GDA 6. No TL, Txt, No %GDA
6.3 Impact of not including energy on the FOP label
In order to test the hypothesis that the presence of energy (in the form of
calories) on the FOP label would have some impact on the way shoppers make
healthiness evaluations, one group of shoppers were shown the labels without
energy present at test 2. Comparison with the responses of those shown the FOP
labels with energy will indicate whether the presence of energy does make a
difference to evaluations of overall product healthiness. Charts 6.4 and 6.5 show
a comparison of the proportion of correct answers for each FOP label type when
the FOP labels were shown with and without energy for both P1 (main meal sized
portion) and P2 (smaller portion or snack).
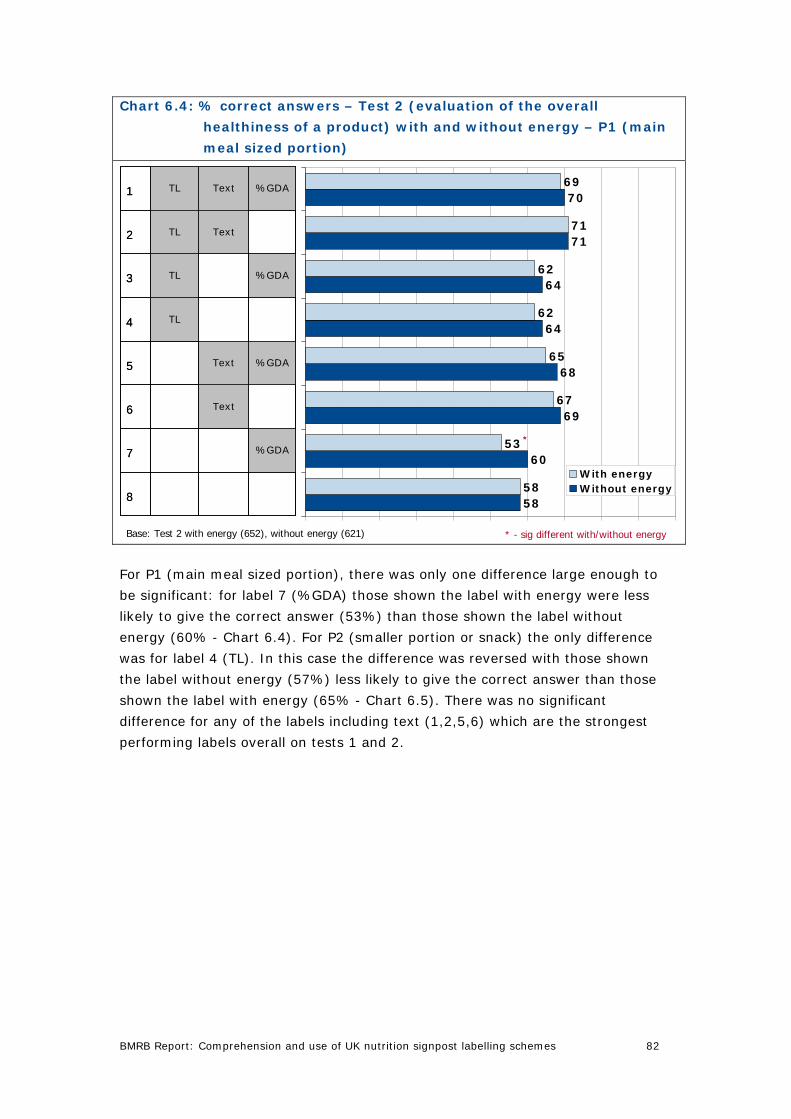
BMRB Report: Comprehension and use of UK nutrition signpost labelling schemes 82
Chart 6.4: % correct answers – Test 2 (evaluation of the overall
healthiness of a product) with and without energy – P1 (main
meal sized portion)
8
%GDA7
Text6
%GDAText5
TL4
%GDATL3
TextTL2
%GDATextTL1
8
%GDA7
Text6
%GDAText5
TL4
%GDATL3
TextTL2
%GDATextTL1
Base: Test 2 with energy (652), without energy (621)
*
* - sig different with/without energy
58
60
69
68
64
64
71
70
58
53
67
65
62
62
71
69
With energyWithout energy
For P1 (main meal sized portion), there was only one difference large enough to
be significant: for label 7 (%GDA) those shown the label with energy were less
likely to give the correct answer (53%) than those shown the label without
energy (60% - Chart 6.4). For P2 (smaller portion or snack) the only difference
was for label 4 (TL). In this case the difference was reversed with those shown
the label without energy (57%) less likely to give the correct answer than those
shown the label with energy (65% - Chart 6.5). There was no significant
difference for any of the labels including text (1,2,5,6) which are the strongest
performing labels overall on tests 1 and 2.

BMRB Report: Comprehension and use of UK nutrition signpost labelling schemes 83
Chart 6.5: % correct answers – Test 2 (evaluation of the overall
healthiness of a product) with and without energy – P2
(smaller portion or snack)
8
%GDA7
Text6
%GDAText5
TL4
%GDATL3
TextTL2
%GDATextTL1
8
%GDA7
Text6
%GDAText5
TL4
%GDATL3
TextTL2
%GDATextTL1
Base: Test 2 with energy (652), without energy (621)
*
* - sig different with/without energy
57
57
68
67
57
65
73
67
56
58
64
65
65
64
69
71
With energyWithout energy
Neither was there any significant difference in the time taken to reach a decision
(Table 6.3) with a time of around 15 to 18 seconds per test for all variations.
Table 6.3. Average time taken to complete tests by label type at test 2
(evaluation of the overall healthiness of a product) with and
without energy – for all completing tests, and for all giving
correct answer
Label type P1 with energy
(seconds)
P1 without energy
(seconds)
P2 with energy
(seconds)
P2 without energy
(seconds) All answering 1. TL, Txt, %GDA 17.28 16.62 17.41 16.37 2. TL, Txt, No %GDA 16.67 17.62 15.77 16.06 3. TL, No Txt, %GDA 18.46 16.07 16.70 18.08 4. TL, No Txt, No %GDA 17.25 15.82 16.75 16.03 5. No TL, Txt %GDA 17.58 17.62 16.94 17.09 6. No TL, Txt, No %GDA 17.48 16.95 16.81 16.04 7. No TL, No Txt, %GDA 16.72 16.29 16.59 16.35 8. None 16.52 16.50 17.15 15.96
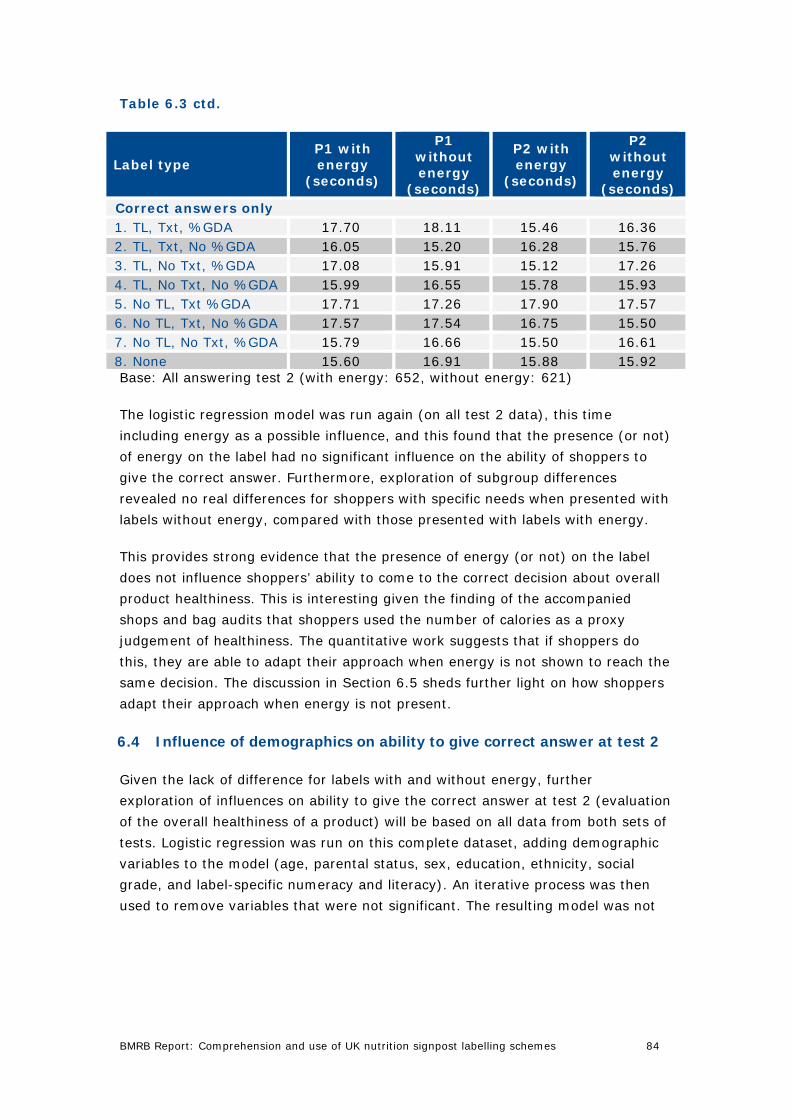
BMRB Report: Comprehension and use of UK nutrition signpost labelling schemes 84
Table 6.3 ctd.
Label type P1 with energy
(seconds)
P1 without energy
(seconds)
P2 with energy
(seconds)
P2 without energy
(seconds) Correct answers only 1. TL, Txt, %GDA 17.70 18.11 15.46 16.36 2. TL, Txt, No %GDA 16.05 15.20 16.28 15.76 3. TL, No Txt, %GDA 17.08 15.91 15.12 17.26 4. TL, No Txt, No %GDA 15.99 16.55 15.78 15.93 5. No TL, Txt %GDA 17.71 17.26 17.90 17.57 6. No TL, Txt, No %GDA 17.57 17.54 16.75 15.50 7. No TL, No Txt, %GDA 15.79 16.66 15.50 16.61 8. None 15.60 16.91 15.88 15.92 Base: All answering test 2 (with energy: 652, without energy: 621)
The logistic regression model was run again (on all test 2 data), this time
including energy as a possible influence, and this found that the presence (or not)
of energy on the label had no significant influence on the ability of shoppers to
give the correct answer. Furthermore, exploration of subgroup differences
revealed no real differences for shoppers with specific needs when presented with
labels without energy, compared with those presented with labels with energy.
This provides strong evidence that the presence of energy (or not) on the label
does not influence shoppers’ ability to come to the correct decision about overall
product healthiness. This is interesting given the finding of the accompanied
shops and bag audits that shoppers used the number of calories as a proxy
judgement of healthiness. The quantitative work suggests that if shoppers do
this, they are able to adapt their approach when energy is not shown to reach the
same decision. The discussion in Section 6.5 sheds further light on how shoppers
adapt their approach when energy is not present.
6.4 Influence of demographics on ability to give correct answer at test 2
Given the lack of difference for labels with and without energy, further
exploration of influences on ability to give the correct answer at test 2 (evaluation
of the overall healthiness of a product) will be based on all data from both sets of
tests. Logistic regression was run on this complete dataset, adding demographic
variables to the model (age, parental status, sex, education, ethnicity, social
grade, and label-specific numeracy and literacy). An iterative process was then
used to remove variables that were not significant. The resulting model was not
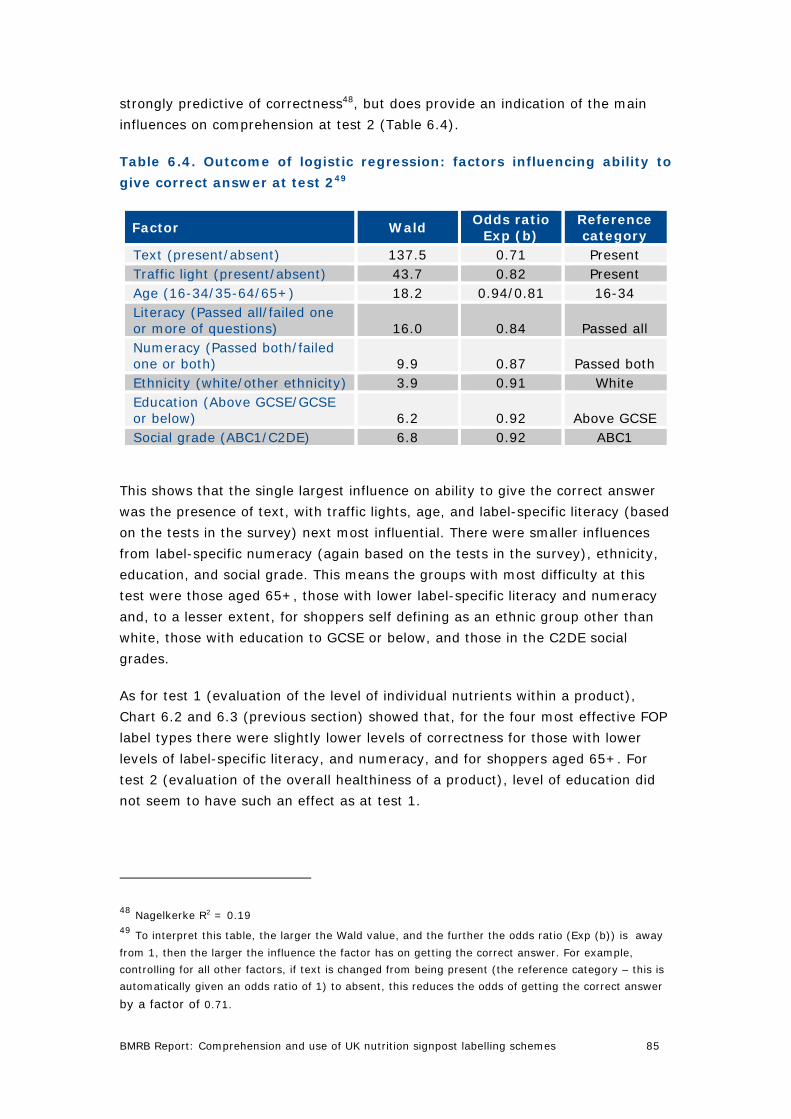
BMRB Report: Comprehension and use of UK nutrition signpost labelling schemes 85
strongly predictive of correctness48, but does provide an indication of the main
influences on comprehension at test 2 (Table 6.4).
Table 6.4. Outcome of logistic regression: factors influencing ability to
give correct answer at test 249
Factor Wald Odds ratio
Exp (b) Reference category
Text (present/absent) 137.5 0.71 Present Traffic light (present/absent) 43.7 0.82 Present Age (16-34/35-64/65+) 18.2 0.94/0.81 16-34 Literacy (Passed all/failed one or more of questions) 16.0 0.84 Passed all Numeracy (Passed both/failed one or both) 9.9 0.87 Passed both Ethnicity (white/other ethnicity) 3.9 0.91 White Education (Above GCSE/GCSE or below) 6.2 0.92 Above GCSE Social grade (ABC1/C2DE) 6.8 0.92 ABC1
This shows that the single largest influence on ability to give the correct answer
was the presence of text, with traffic lights, age, and label-specific literacy (based
on the tests in the survey) next most influential. There were smaller influences
from label-specific numeracy (again based on the tests in the survey), ethnicity,
education, and social grade. This means the groups with most difficulty at this
test were those aged 65+, those with lower label-specific literacy and numeracy
and, to a lesser extent, for shoppers self defining as an ethnic group other than
white, those with education to GCSE or below, and those in the C2DE social
grades.
As for test 1 (evaluation of the level of individual nutrients within a product),
Chart 6.2 and 6.3 (previous section) showed that, for the four most effective FOP
label types there were slightly lower levels of correctness for those with lower
levels of label-specific literacy, and numeracy, and for shoppers aged 65+. For
test 2 (evaluation of the overall healthiness of a product), level of education did
not seem to have such an effect as at test 1.
48 Nagelkerke R2 = 0.19 49 To interpret this table, the larger the Wald value, and the further the odds ratio (Exp (b)) is away
from 1, then the larger the influence the factor has on getting the correct answer. For example,
controlling for all other factors, if text is changed from being present (the reference category – this is
automatically given an odds ratio of 1) to absent, this reduces the odds of getting the correct answer
by a factor of 0.71.

BMRB Report: Comprehension and use of UK nutrition signpost labelling schemes 86
Unlike at test 1, there was no clear pattern in the level of correctness for different
FOP label types by whether shoppers had ever used labels, or according to which
supermarket they usually shopped in.
6.5 How the decision was made at test 2 (with and without energy)
To provide more insight into how shoppers used the FOP labels for this task, and
how this differed when energy was shown or not shown, after they had completed
all 20 tests shoppers were asked to explain how they had usually come to their
decision. Table 6.5 shows the answers given by more than 1% of shoppers at the
tests both with and without energy.
Shoppers completing test 2 (evaluation of the overall healthiness of a product)
were most likely to say they had looked at the content of one or more of the
nutrients on the label to make their decision. Excluding energy (usually referred
to as calories), shoppers were equally likely to mention looking at one of the
nutrients (56% when energy is present, 53% when it is not). When energy was
included, 60% of shoppers looked at one of the nutrients or the energy content.
Table 6.5. How came to decision when completing test 2 (evaluation of
the overall healthiness of a product)
Label with
energy %
Label without energy
% ANY NUTRIENT/ENERGY (calories)
60 53
ANY NUTRIENTS (not including energy)
56 53
ANY SIGNPOSTING 45 48 Salt content 39 36 Sugar content 32 31 Fat content 30 38 Percentages/RDA/GDA 29 34 Traffic lights/colours 26 26 Energy/calories 22 2 Saturated fat content 18 17 Text (High/medium/low rating) 8 9 Amount of nutrient 6 10 Comparing the contents 6 5 Figures (no detail) 5 6 Type of food 3 4 Common sense 3 2 Own health needs 2 1 Base: All answering test 2 (with energy: 652, without energy: 621)
Salt, sugar and fat were most likely to be mentioned (three to four in ten), with
saturated fat mentioned less often. In the test with energy shown, one in five
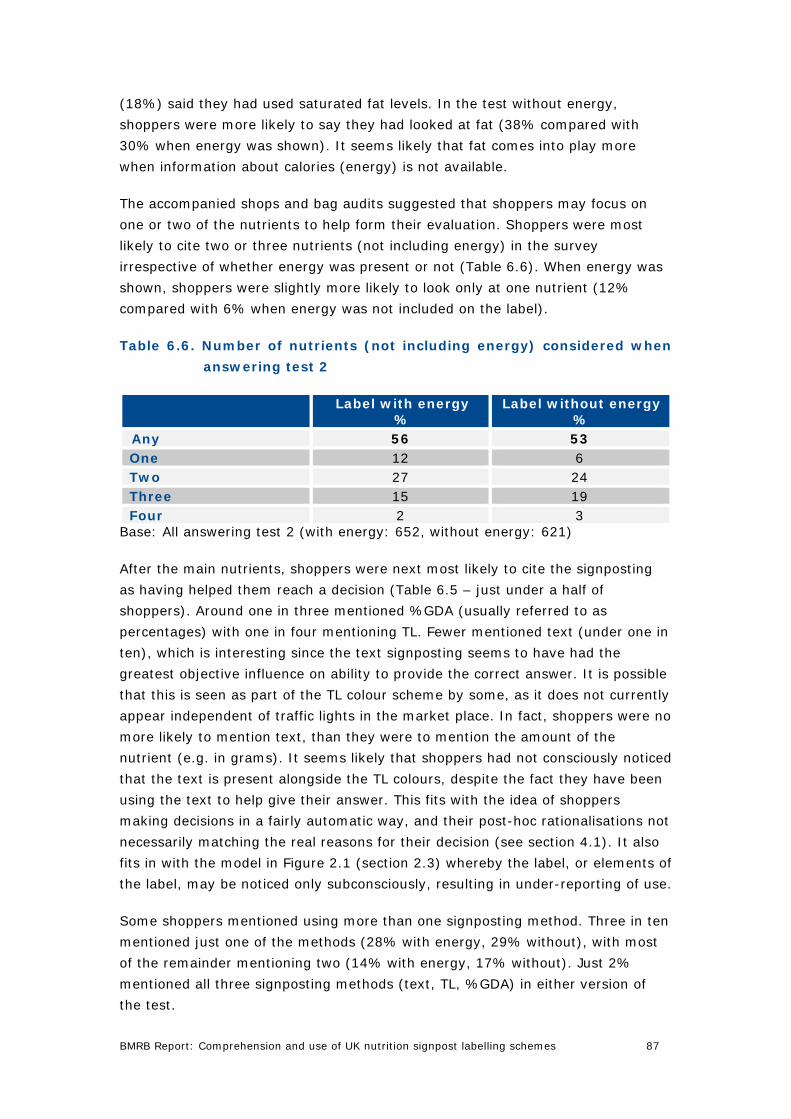
BMRB Report: Comprehension and use of UK nutrition signpost labelling schemes 87
(18%) said they had used saturated fat levels. In the test without energy,
shoppers were more likely to say they had looked at fat (38% compared with
30% when energy was shown). It seems likely that fat comes into play more
when information about calories (energy) is not available.
The accompanied shops and bag audits suggested that shoppers may focus on
one or two of the nutrients to help form their evaluation. Shoppers were most
likely to cite two or three nutrients (not including energy) in the survey
irrespective of whether energy was present or not (Table 6.6). When energy was
shown, shoppers were slightly more likely to look only at one nutrient (12%
compared with 6% when energy was not included on the label).
Table 6.6. Number of nutrients (not including energy) considered when
answering test 2
Label with energy
% Label without energy
% Any 56 53 One 12 6 Two 27 24 Three 15 19 Four 2 3
Base: All answering test 2 (with energy: 652, without energy: 621)
After the main nutrients, shoppers were next most likely to cite the signposting
as having helped them reach a decision (Table 6.5 – just under a half of
shoppers). Around one in three mentioned %GDA (usually referred to as
percentages) with one in four mentioning TL. Fewer mentioned text (under one in
ten), which is interesting since the text signposting seems to have had the
greatest objective influence on ability to provide the correct answer. It is possible
that this is seen as part of the TL colour scheme by some, as it does not currently
appear independent of traffic lights in the market place. In fact, shoppers were no
more likely to mention text, than they were to mention the amount of the
nutrient (e.g. in grams). It seems likely that shoppers had not consciously noticed
that the text is present alongside the TL colours, despite the fact they have been
using the text to help give their answer. This fits with the idea of shoppers
making decisions in a fairly automatic way, and their post-hoc rationalisations not
necessarily matching the real reasons for their decision (see section 4.1). It also
fits in with the model in Figure 2.1 (section 2.3) whereby the label, or elements of
the label, may be noticed only subconsciously, resulting in under-reporting of use.
Some shoppers mentioned using more than one signposting method. Three in ten
mentioned just one of the methods (28% with energy, 29% without), with most
of the remainder mentioning two (14% with energy, 17% without). Just 2%
mentioned all three signposting methods (text, TL, %GDA) in either version of
the test.

BMRB Report: Comprehension and use of UK nutrition signpost labelling schemes 88
7 Comprehension of labels when comparing overall healthiness of two products
The final test identified as being likely to discriminate best between the different
types of FOP signposting schemes, and to reflect the most common uses of FOP
labels was comparison of the overall healthiness of two products (test 3).
Summary
The two product comparison test did not discriminate between the label types.
The success rate among shoppers was around nine in ten (from 87% to 93%) on
the tests, with similarly high scores for all sectors of the population, and for all
label types. This is likely to be related to the choice of pairs of products. Only
pairs with an agreement level over the correct results in the nutritionist’s survey
(FSA 2008) of 70% or greater were included in the research, which resulted in
only pairs of products which were easy to compare being included.
This led to a working hypothesis that either a pair of products is simple to
compare, and this can be done using weight of nutrient (in grams), or the
comparison is complicated (e.g. one product is higher in fat, one higher in salt
requiring a value judgement as to which is the key nutrient) and can only be
decided on the basis of which nutrients are most important to the individual. Even
if the comparisons can be carried out without signposting this does not, however,
imply that shoppers would not use the signposting to help them make the
comparison, and this use of FOP labels was observed in the accompanied shops
and bag audits. In the survey shoppers reported having used signposting in the
tests, which also suggests that if signposting is there, shoppers will use it for
simple comparisons.
It is unclear whether signposting would help with more complex comparisons.
Further evidence on comparisons and the impact of signposting is included in
Chapter 9, where the impact on comprehension of comparing products using
different forms of signposting is considered.
When making comparisons, the research found that shoppers taking part in the
test were most likely to focus on two nutrients to make their judgment. This
reinforced the findings of the accompanied shops and bag audits.
7.1 Evidence from the qualitative work
When asked to look at the FOP labels and say whether they had considered them
in making their decision over which product was healthier, it was common for
shoppers to say that they had not noticed the FOP label and therefore had not
made use of it in making a decision. When they were used, shoppers had
difficulty making comparisons between products especially if comparing different

BMRB Report: Comprehension and use of UK nutrition signpost labelling schemes 89
FOP label types, or if the nutrient levels in the products were fairly similar.
Shoppers were, however, slightly more likely to use FOP labels to make
comparisons than they were to use them for single product evaluations.
When using FOP labels to make comparisons, shoppers reported using one or two
nutrients to assess the overall healthiness of each product, and some used
energy as a proxy measure.
7.2 The tests
The specific test was identified as the best way to measure one of the main ways
labels are used. Full details of the tests and how they were developed,
administered and assessed are given in the Scientific Rationale (Chapters 4 and
5, BMRB & University of Surrey, 2008). The question asked was: “Using the
information on these two labels, which of these two products do you think is
healthier?”. Healthiness was additionally defined for shoppers as: “to be eating
healthily the Government advise that most people reduce the level of fat,
saturated fat (also known as saturates), salt and sugars in the foods they eat”.
Shoppers chose from a three point response scale (product A, product B, or no
real difference between A and B). Each response was assessed for correctness
against the single answer pre-defined by the survey of nutritionists and dieticians
(FSA 2008). Each test was also timed. A maximum time of 20 minutes was
allowed for the tests. Almost all shoppers completed their tests within this time.
There was some difficulty identifying pairs of products over which the nutritionists
and dieticians could reach sufficient agreement (FSA 2008). Of the 44 pairs
presented, only 27 achieved at least 70% agreement.
In this test the eight labels in the fully factorial design were included, together
with the two additional labels (label 9, %GDA with non-signposting colouring for
each nutrient, similar to the label used by Tesco, and label 10, a circular TL label,
similar to that used by Sainsbury’s) (see Table 2.1). When a shopper was
presented with a pair of labels, the same label type was used for both labels (e.g.
both presented on label 1: see chapter 9 for comparisons using multiple label
formats).
The tests were presented for each label for both product categories: P1 (main
meal sized portion) and P2 (smaller portion or snack). This means that in total
each shopper was presented with up to 20 tests. All possible label and product
combinations were included in the tests. The product pair shown with each label
type was rotated, and the order in which the tests were shown was randomised
to avoid any effects from ordering or product selection. The number of calories
was held constant for each pair of labels (using the average for the pair) to
ensure that the decision was based on the four key nutrients. Each pair consisted
BMRB Report: Comprehension and use of UK nutrition signpost labelling schemes 90
of products from within the same type of P1 or P2 category (e.g. two ready
meals, two sandwiches etc).
This section will focus on the eight labels in the fully factorial design shown with
energy. The impact on comprehension of the presentational differences in labels 9
and 10 will be discussed in Chapter 8.
7.3 Effect of signposting elements on ability to compare the healthiness of two products
As at the other tests, the three elements considered within the label design were:
• %GDA / no %GDA signposting
• Traffic Light (TL) signposting / no TL signposting
• Interpretive text (high, medium, low) / no interpretive text (referred to as
‘text’ throughout the report)
These produced the eight label factorial design shown in Table 2.1 (see section
12.3 for examples of labels). All other elements of the labels were held constant,
and the random allocation of products to the tests means any variation (within
product P1 (main meal sized portion), or within product P2 (smaller portion or
snack)) can therefore be attributed to the individual and interaction effects of
these three elements.
Level of correctness for each label type gives a first measure of any effect (Chart
7.1).

BMRB Report: Comprehension and use of UK nutrition signpost labelling schemes 91
Chart 7.1: % correct answers by FOP label type and product category at
test 3 (comparison of two products in terms of healthiness)
93
92
91
91
92
93
92
93
90
89
92
90
88
90
87
89
P1P2
Base: Test 3 (607)
8
%GDA7
Text6
%GDAText5
TL4
%GDATL3
TextTL2
%GDATextTL1
8
%GDA7
Text6
%GDAText5
TL4
%GDATL3
TextTL2
%GDATextTL1
2
Numbers in red to right of scores indicate labels where comprehension is significantly lower (within P1/P2)
There was only one significant difference in level of correctness between any of
the eight label types included in the fully factorial model: label 6 (text - 92%)
scored more highly than label 2 (TL, text - 88%) for P1 (main meal sized
portion). There were no significant differences for P2 (smaller portion or snack).
As for the other tests, to help further assess the level of influence of the different
label elements on comprehension, logistic regression was used. The inclusion of
the signposting methods and product category alone did not produce a strong
predictive model for arriving at the correct answer. This is not surprising as many
other factors (e.g. education, age etc) are also likely to play a role. A fuller
regression model is described in section 7.4 which shows the influence of both
signposting and key demographics on ability to give the correct answer. This
initial regression process did, however, provide a useful indication of the relative
influence of the three label elements, and product category50.
It found that neither TL nor %GDA influenced comprehension. It did, however,
suggest that product category51 (P1/P2) has a small but significant influence. For
most label types the level of success was marginally lower for P1 (main meal
50 To interpret the findings, the larger the Wald value, and the further the odds ratio is
away from 1, then the larger the influence the factor has on getting the correct answer. 51 Wald 39, Odds ratio Exp(b) 0.65
BMRB Report: Comprehension and use of UK nutrition signpost labelling schemes 92
sized portion) compared with P2 (smaller portion or snack). However, this
difference is minimal and, even for P1, nine in ten shoppers could give the correct
answer for each label type. It also suggested the presence of text reduced the
level of correctness for this test by a small but significant amount52, but again the
level of difference is very small, and nine in ten shoppers could give the right
answer irrespective of label type (89% gave the correct answer when text was
present and when it was not present for P1 (main meal sized portion), and 92%
gave the correct answer for P2 (smaller portion or snack) when text was present
and when text was not present).
Irrespective of the product category, or the presence or absence of any type of
signposting, between 87% and 93% of shoppers gave the correct answer. This
means that whilst product category and text have a significant impact on
comprehension, the levels of comprehension are high for all label types and
product category and text each make such a small difference for this influence to
be meaningless in reality when comparing two products.
There was no significant variation in the level of correctness by label type for any
particular group of shoppers. Furthermore, the time taken did not help to
differentiate between the labels either, whether among all shoppers taking the
tests, or among those giving the correct answer only. (Table 7.1).
52 Wald 8.5, Odds ratio Exp(b) 1.39
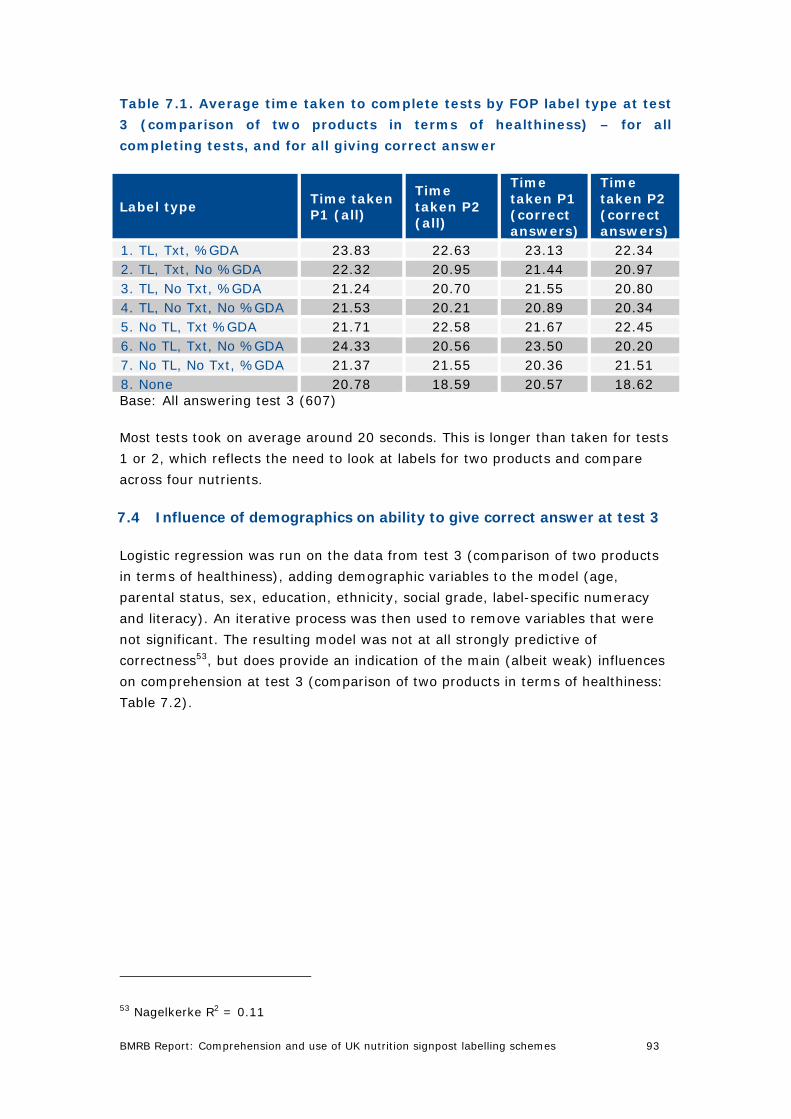
BMRB Report: Comprehension and use of UK nutrition signpost labelling schemes 93
Table 7.1. Average time taken to complete tests by FOP label type at test
3 (comparison of two products in terms of healthiness) – for all
completing tests, and for all giving correct answer
Label type Time taken P1 (all)
Time taken P2 (all)
Time taken P1 (correct answers)
Time taken P2 (correct answers)
1. TL, Txt, %GDA 23.83 22.63 23.13 22.34 2. TL, Txt, No %GDA 22.32 20.95 21.44 20.97 3. TL, No Txt, %GDA 21.24 20.70 21.55 20.80 4. TL, No Txt, No %GDA 21.53 20.21 20.89 20.34 5. No TL, Txt %GDA 21.71 22.58 21.67 22.45 6. No TL, Txt, No %GDA 24.33 20.56 23.50 20.20 7. No TL, No Txt, %GDA 21.37 21.55 20.36 21.51 8. None 20.78 18.59 20.57 18.62 Base: All answering test 3 (607)
Most tests took on average around 20 seconds. This is longer than taken for tests
1 or 2, which reflects the need to look at labels for two products and compare
across four nutrients.
7.4 Influence of demographics on ability to give correct answer at test 3
Logistic regression was run on the data from test 3 (comparison of two products
in terms of healthiness), adding demographic variables to the model (age,
parental status, sex, education, ethnicity, social grade, label-specific numeracy
and literacy). An iterative process was then used to remove variables that were
not significant. The resulting model was not at all strongly predictive of
correctness53, but does provide an indication of the main (albeit weak) influences
on comprehension at test 3 (comparison of two products in terms of healthiness:
Table 7.2).
53 Nagelkerke R2 = 0.11

BMRB Report: Comprehension and use of UK nutrition signpost labelling schemes 94
Table 7.2. Outcome of logistic regression: factors influencing ability to
give correct answer at test 3 (comparison of two products in terms of
healthiness)54
Factor Wald
Odds ratio Exp (b)
Reference category
Product (P2/P1) 40.2 0.65 P2 Numeracy (Passed both/failed one or both) 36.3 0.59 Passed both Age (16-34/35-64/65+) 10.1 0.78/0.76 16-34 Literacy (Passed all/failed one or more of questions) 9.4 0.76 Passed all Text (absent/present) 8.6 1.22 Present Sex (male/female) 5.3 0.84 Male
This shows that the largest influence on ability to give the correct answer was
product (P1/P2) and numeracy (based on the tests in the survey). Age, label-
specific literacy (based on the tests in the survey), the presence of text, and sex
all had a small influence. This means the groups with the greatest difficulty in
giving the correct answer were those aged 65+, those with lower levels of label-
specific numeracy and literacy, and women. Unlike in the other tests, the
presence of text appears to have reduced shoppers’ ability to give the correct
answer. However, all of the key subgroups still achieved a very high level of
correct answers across all label types, and there was no difference between
outcomes for labels with and without text.
As explained in section 7.3, the influence of any of these factors is very small,
and the level of correct answers is high for all label types, product categories and
types of shoppers, meaning that these factors have no meaningful influence in
reality when comparing two products.
7.5 How the decision was made at test 3
To provide more insight into how shoppers used the labels for this task, after they
had completed all 20 tests they were asked to explain how they had usually come
to their decision. Table 7.3 shows the answers given by more than 1% of
shoppers at the tests.
54 To interpret this table, the larger the Wald value, and the further the odds ratio (Exp
(b)) is away from 1, then the larger the influence the factor has on getting the correct
answer. For example, controlling for all other factors, if product is changed from P2 (the
reference category – this is automatically given an odds ratio of 1) to P1, this reduces the
odds of getting the correct answer by a factor of 0.65.

BMRB Report: Comprehension and use of UK nutrition signpost labelling schemes 95
Shoppers seemed to use broadly the same information when comparing products
in terms of healthiness (test 3) as they used to evaluate the healthiness of a
single product (test 2). Six in ten (58%) used information on the nutrients, and
again this was most likely to be salt, fat and sugar. Saturated fat was, however,
more likely to be mentioned in the context of comparisons. This may be because
shoppers are more likely to compare all four nutrients to see which is higher or
lower for each product, whereas they are less able to use this information in an
evaluation of the healthiness of a single product.
Table 7.3. How came to decision when completing test 3 (comparison of
two products in terms of healthiness) compared with test 2
(evaluation of the overall healthiness of a product)
Test 2 label with
energy %
Test 2 label
without energy
%
Test 3 %
ANY NUTRIENT/ENERGY 60 53 59 ANY NUTRIENT (not including energy)
56 53 58
ANY SIGNPOSTING 45 48 40 Salt content 39 36 36 Fat content 30 38 36 Sugar content 32 31 32 Saturated fat content 18 17 27 Traffic lights/colours 26 26 26 Percentages/RDA/GDA 29 34 21 Figures (no detail) 5 6 11 Amount of nutrient 6 10 9 Comparing the contents 6 6 8 Calories 22 2 6 Which was highest/lowest 1 1 5 Text (High/medium/low rating) 8 9 4 Common sense 3 2 1 Own health needs 2 1 1 Base: All answering test 2 (652) / test 3 (607)
Some shoppers (6%) claimed to use the information on energy even though the
number of calories was held constant between each pair. Effectively, shoppers
had one less piece of information to use in test 3 (comparison of two products in
terms of healthiness) when compared with test 2 (evaluation of the overall
healthiness of a product) with energy. As shown in Table 7.4 they were just as
likely to use two or three of these four.

BMRB Report: Comprehension and use of UK nutrition signpost labelling schemes 96
Table 7.4. Number of nutrients (not including energy) considered when
answering tests 2 (evaluation of the overall healthiness of a product)
and 3 (comparison of two products in terms of healthiness)
Test 2 with
energy %
Test 2 without energy
%
Test 3 %
One 12 6 10 Two 27 24 27 Three 15 19 19 Four 2 3 3 Base: All answering test 2 (652) / test 3 (607)
Shoppers were slightly less likely to mention having used the signposting when
making comparisons (40%) compared with making single product evaluations
(45% when energy shown, 48% on test 2 without energy) (Table 7.5). This may
appear to contradict the finding of the accompanied shops and bag audits found
that shoppers were more likely to have used FOP labels for comparisons than for
single product evaluations. However, the information from the qualitative work
concerned whether (or not) shoppers used FOP labels. The quantitative work was
asking shoppers to report what elements of the labels they used when they were
forced to use FOP labels in a test situation.
In both comparison and single product evaluations, shoppers were most likely to
use just one form of signposting, although a small proportion did use two (14%
for test 2 with energy, 9% for test 3).
Table 7.5. Number of signposting types (text, TL, %GDA) considered
when answering tests 2 and 3
Test 2 with energy
% Test 3
% ANY 45 40 One 28 29 Two 14 9 Three 2 1
Base: All answering test 2 (652) / test 3 (607)
Shoppers were just as likely to mention using TL to make comparisons as they
were for single product evaluations (26% for both – see Table 7.3). They were
less likely to mention %GDA (21%) or text (4%) when making comparisons. This
may offer some evidence that when making simple product comparisons TL could
be helpful, but that %GDA does not offer the same level of advantage over the
amounts of nutrient. Text may be conflated with TL for shoppers (as it does not
appear independently of TL in the marketplace at present), and this may (in part)
explain the lower level of mentions (4%). However, it is not possible to draw any
firm conclusions on this from the quantitative work, particularly since these

BMRB Report: Comprehension and use of UK nutrition signpost labelling schemes 97
questions deal with post-hoc rationalisation, which may not reflect the true
reasons for shoppers’ decisions (see section 4.1 for discussion).
7.6 Overview of test 3
The two product comparison test did not discriminate between the label types.
The success rate among shoppers was around nine in ten (from 87% to 93%) on
the tests, with similarly high scores for all sectors of the population, and for all
label types. This is likely to be related to the choice of pairs of products. Only
pairs with an agreement level over the correct results in the nutritionist’s survey
(FSA 2008) of 70% or greater were included in the research, which resulted in
only pairs of products which were easy to compare being included.
This led to a working hypothesis that either a pair of products is simple to
compare, and this can be done using weight of nutrient, or the comparison is
complicated (e.g. one product is higher in fat, one higher in salt requiring a value
judgement as to which is the key nutrient) and can only be decided on the basis
of which nutrients are most important to the individual). Even if the comparisons
can be carried out without signposting this does not, however, imply that
shoppers would not use the signposting to help them make the comparison, and
this use of FOP labels was observed in the accompanied shops and bag audits. In
the survey shoppers reported having used signposting in the tests, which also
suggests that if signposting is there, shoppers will use it for simple comparisons.
It is unclear whether signposting would help with more complex comparisons.
Further evidence on comparisons and the impact of signposting is included in
Chapter 9, where the impact of multiple label types on comprehension is
considered.

BMRB Report: Comprehension and use of UK nutrition signpost labelling schemes 98
8 Overview of comprehension of FOP labels
This section pulls together the information discussed in Chapters 5 to 7 to help
determine which signposting methods best aid comprehension, and to further
explore the impact of sociodemographic factors on comprehension when using
FOP labels.
Summary
The evidence from tests 1 (evaluating level of nutrients in a product) and 2
(evaluating overall healthiness of a product) were used to draw conclusions, since
test 3 did not differentiate between the labels. There was no difference by P1
(main meal sized product) or P2 (smaller portion or snack) at either test, and no
difference by presence or absence of energy (in the form of calories) at test 2.
The quantitative comprehension work demonstrated that both for evaluating the
level of nutrients and evaluating healthiness of a single product text has the
greatest influence on comprehension and TL has some influence on both tasks,
and that %GDA has some (albeit small) influence on judging the level of
nutrients, but none on evaluating overall healthiness. The four labels
incorporating text (labels 1, 2, 5 and 6) were the strongest performers on both
tests but there was no significant difference in performance between them. Labels
1 (text, TL, %GDA) and 2 (TL, text) were marginally stronger than labels 5 (text,
%GDA) and 6 (text) at both tests (being significantly stronger than a larger
number of other labels). The difference was not so great to make a case for these
labels ahead of other labels with text from the tests alone. However, the research
into the coexistence of a range of FOP label schemes suggested that
standardising to just one label format would enhance use and comprehension of
FOP labels (see Chapter 10).
Whilst certain sectors of the population generally had more difficulty giving the
correct answer on tests, sociodemographic factors did not help differentiate
between the best performing labels: those who had difficulty had a similar level of
difficulty with most label types (as seen in Chapters 5-6). Certain labels can,
however, help to reduce the difference in levels of comprehension between
specific sectors of the population.
Shoppers with a highest qualification of GCSE or below (or equivalent) generally
had more difficulty than shoppers with a higher qualification whatever signposting
method was used. Shoppers aged 65+ had more difficulty than younger
shoppers on all label types, but the difference in comprehension was smaller for
labels not including %GDA.
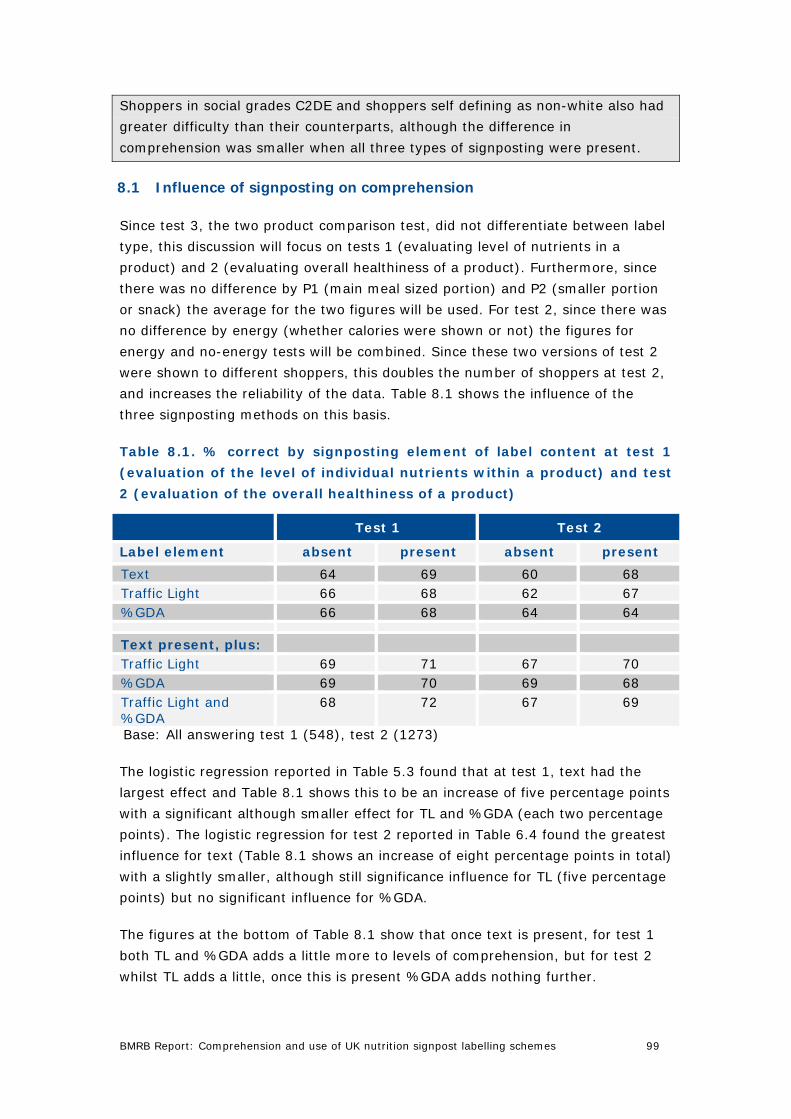
BMRB Report: Comprehension and use of UK nutrition signpost labelling schemes 99
Shoppers in social grades C2DE and shoppers self defining as non-white also had
greater difficulty than their counterparts, although the difference in
comprehension was smaller when all three types of signposting were present.
8.1 Influence of signposting on comprehension
Since test 3, the two product comparison test, did not differentiate between label
type, this discussion will focus on tests 1 (evaluating level of nutrients in a
product) and 2 (evaluating overall healthiness of a product). Furthermore, since
there was no difference by P1 (main meal sized portion) and P2 (smaller portion
or snack) the average for the two figures will be used. For test 2, since there was
no difference by energy (whether calories were shown or not) the figures for
energy and no-energy tests will be combined. Since these two versions of test 2
were shown to different shoppers, this doubles the number of shoppers at test 2,
and increases the reliability of the data. Table 8.1 shows the influence of the
three signposting methods on this basis.
Table 8.1. % correct by signposting element of label content at test 1
(evaluation of the level of individual nutrients within a product) and test
2 (evaluation of the overall healthiness of a product)
Test 1 Test 2
Label element absent present absent present
Text 64 69 60 68 Traffic Light 66 68 62 67 %GDA 66 68 64 64
Text present, plus: Traffic Light 69 71 67 70 %GDA 69 70 69 68 Traffic Light and %GDA
68 72 67 69
Base: All answering test 1 (548), test 2 (1273)
The logistic regression reported in Table 5.3 found that at test 1, text had the
largest effect and Table 8.1 shows this to be an increase of five percentage points
with a significant although smaller effect for TL and %GDA (each two percentage
points). The logistic regression for test 2 reported in Table 6.4 found the greatest
influence for text (Table 8.1 shows an increase of eight percentage points in total)
with a slightly smaller, although still significance influence for TL (five percentage
points) but no significant influence for %GDA.
The figures at the bottom of Table 8.1 show that once text is present, for test 1
both TL and %GDA adds a little more to levels of comprehension, but for test 2
whilst TL adds a little, once this is present %GDA adds nothing further.
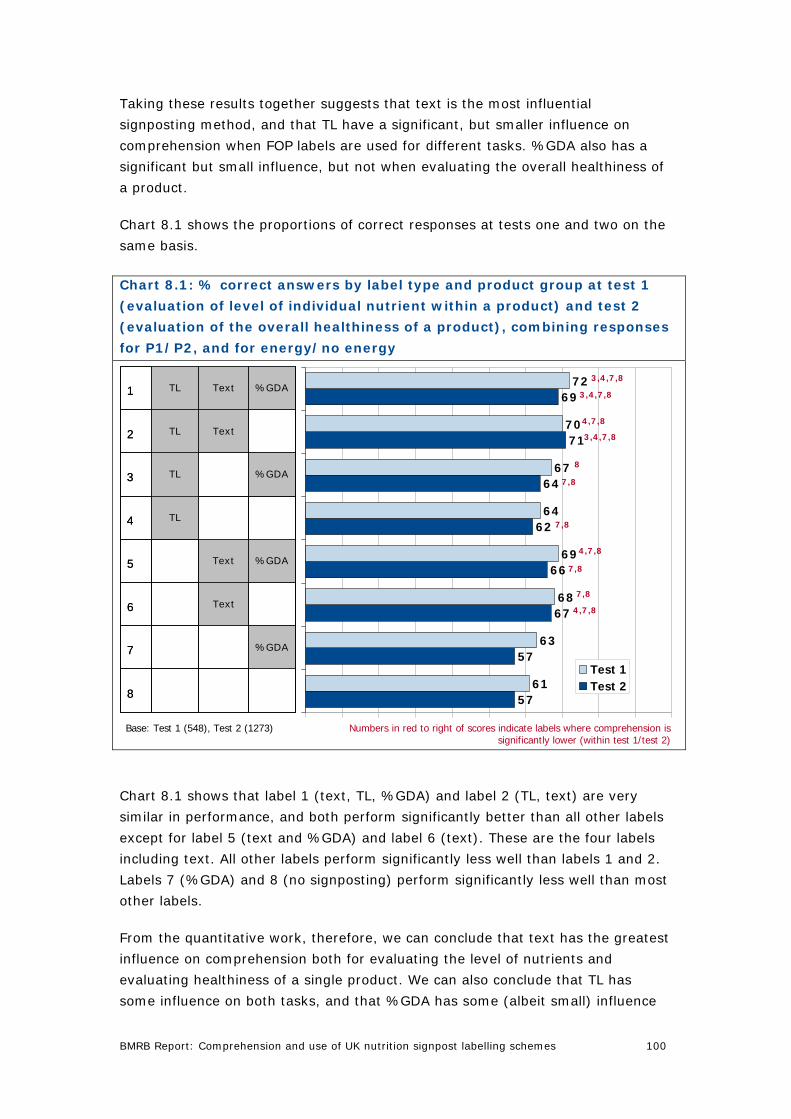
BMRB Report: Comprehension and use of UK nutrition signpost labelling schemes 100
Taking these results together suggests that text is the most influential
signposting method, and that TL have a significant, but smaller influence on
comprehension when FOP labels are used for different tasks. %GDA also has a
significant but small influence, but not when evaluating the overall healthiness of
a product.
Chart 8.1 shows the proportions of correct responses at tests one and two on the
same basis.
Chart 8.1: % correct answers by label type and product group at test 1
(evaluation of level of individual nutrient within a product) and test 2
(evaluation of the overall healthiness of a product), combining responses
for P1/P2, and for energy/no energy
57
57
67
66
62
64
71
69
61
63
68
69
64
67
70
72
Test 1Test 2
Base: Test 1 (548), Test 2 (1273)
3,4,7,8
4,7,8
8
4,7,8
7,8
Numbers in red to right of scores indicate labels where comprehension is significantly lower (within test 1/test 2)
3,4,7,8
3,4,7,8
7,8
7,8
7,8
4,7,8
8
%GDA7
Text6
%GDAText5
TL4
%GDATL3
TextTL2
%GDATextTL1
8
%GDA7
Text6
%GDAText5
TL4
%GDATL3
TextTL2
%GDATextTL1
Chart 8.1 shows that label 1 (text, TL, %GDA) and label 2 (TL, text) are very
similar in performance, and both perform significantly better than all other labels
except for label 5 (text and %GDA) and label 6 (text). These are the four labels
including text. All other labels perform significantly less well than labels 1 and 2.
Labels 7 (%GDA) and 8 (no signposting) perform significantly less well than most
other labels.
From the quantitative work, therefore, we can conclude that text has the greatest
influence on comprehension both for evaluating the level of nutrients and
evaluating healthiness of a single product. We can also conclude that TL has
some influence on both tasks, and that %GDA has some (albeit small) influence

BMRB Report: Comprehension and use of UK nutrition signpost labelling schemes 101
on judging the level of nutrients. Labels 1 and 2 are marginally stronger than
labels 5 and 6, since they alone perform significantly better than label 3.
However, the evidence from the quantitative comprehension work alone does not
provide a compelling case for a single label in the marketplace, since there is no
significant difference in performance between the four labels. Nevertheless, work
to assess the effect of multiple signposting schemes did indicate that the
existence of more than one scheme could be a barrier to effective FOP label use
(see Chapter 10).
8.2 Influence of sociodemographics on comprehension
The discussion in Chapters 5 and 6 found that whilst certain sectors of the
population generally had more difficulty giving the correct answer on tests,
sociodemographic factors did not help differentiate between the best performing
labels: those who had difficulty had a similar level of difficulty with most label
types. This section of the report will focus on whether any particular labels widen
or narrow the comprehension gap for specific sectors of the population. If there is
no significant difference in comprehension between two labels, but one label type
reduces the gap in comprehension between specific groups of shoppers (e.g.
between younger and older shoppers, or between more and less educated
shoppers) then this could be used as evidence that this label is more effective
overall.
The logistic regression (see Tables 5.3 and 6.4) found that label-specific literacy
and numeracy had an impact on ability to give the correct answer at both tests 1
(evaluating level of nutrients in a product) and 2 (evaluating overall healthiness
of a product)55. These are not measures that can be easily applied to the
population without nationwide testing, but level of education was also found to
have a significant influence at both tests 1 and 2, and could be used as a proxy.
The logistic regression also found that age and ethnicity had a significant
influence for both tests, and that social grade had a significant influence at test 2
only.
The tables in this section break down comprehension on tests 1 and 2 for all eight
labels. As in section 8.1, both sets of results combine the answers for P1 (main
meal sized portion) and P2 (smaller portion or snack) and the results for test 2
combine those with and without energy.
55 Label-specific literacy was the ability to extract and replay information from the labels,
and label-specific numeracy was the ability to work out amount per portion for multi-
portion products, and convert percentages to fractions (e.g. 20% equates to a maximum
of five a day).

BMRB Report: Comprehension and use of UK nutrition signpost labelling schemes 102
Table 8.2. Proportion giving correct answers at tests 1 and 2 by highest
level of education
Education
All Higher A level + GCSE C+ GCSE D-
Test 1 Unweighted base 548 185 115 108 138 Label: 1. TL, text, %GDA 72% 76% 73% 68% 67% 2. TL, text, 70% 72% 70% 69% 67% 3. TL, %GDA 67% 70% 69% 61% 66% 4. TL 64% 67% 63% 64% 59% 5. Text %GDA 69% 71% 71% 69% 66% 6. Text 68% 70% 69% 66% 68% 7. %GDA 63% 64% 65% 63% 59% 8. None 61% 62% 65% 57% 61% Test 2 Unweighted base 441 228 285 316 441 Label: 1. TL, text, %GDA 69% 73% 70% 65% 66% 2. TL, text, 71% 74% 70% 70% 68% 3. TL, %GDA 64% 65% 68% 62% 59% 4. TL 62% 63% 62% 60% 63% 5. Text %GDA 66% 68% 70% 64% 61% 6. Text 67% 71% 68% 61% 65% 7. %GDA 57% 59% 57% 59% 51% 8. None 57% 58% 63% 55% 51%
Base: All answering tests one and two
The logistic regression found that education had a significant impact on
comprehension at tests 1 and 2 (particularly those with GCSE or equivalent
compared with those with higher qualifications). Table 8.2 illustrates the general
pattern of comprehension increasing with level of education. There is a similar
pattern for most labels on both tests, with comprehension lowest for those with
GCSE or equivalent, particularly those with grades D or below. On test 2, label 4
(TL) does not show a difference by educational level, whilst all other labels do: it
is lower in comprehension for all educational groups compared with labels 1 and
2. These differences suggest that the use of signposting will increase the level of
comprehension even among those with lower levels of education, but that
whatever signposting method is used, the least educated group will have more
difficulty interpreting the information on FOP labels than more educated
shoppers.
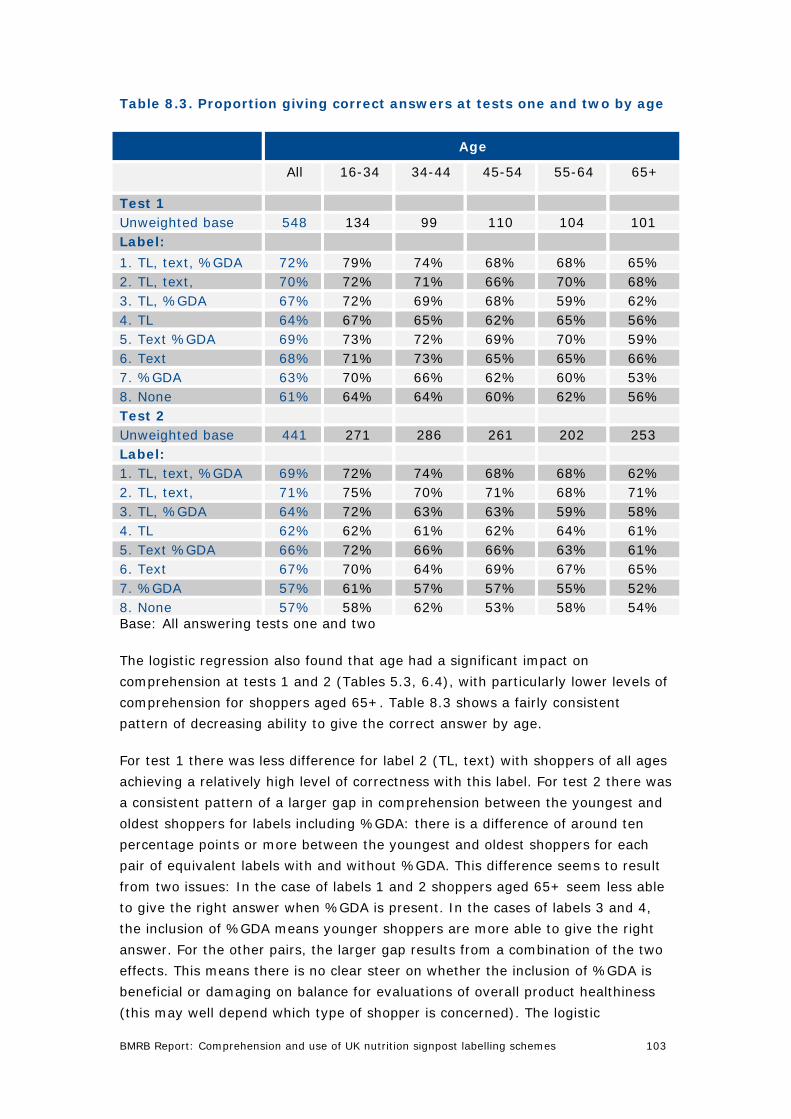
BMRB Report: Comprehension and use of UK nutrition signpost labelling schemes 103
Table 8.3. Proportion giving correct answers at tests one and two by age
Age
All 16-34 34-44 45-54 55-64 65+
Test 1 Unweighted base 548 134 99 110 104 101 Label:
1. TL, text, %GDA 72% 79% 74% 68% 68% 65% 2. TL, text, 70% 72% 71% 66% 70% 68% 3. TL, %GDA 67% 72% 69% 68% 59% 62% 4. TL 64% 67% 65% 62% 65% 56% 5. Text %GDA 69% 73% 72% 69% 70% 59% 6. Text 68% 71% 73% 65% 65% 66% 7. %GDA 63% 70% 66% 62% 60% 53% 8. None 61% 64% 64% 60% 62% 56% Test 2 Unweighted base 441 271 286 261 202 253 Label: 1. TL, text, %GDA 69% 72% 74% 68% 68% 62% 2. TL, text, 71% 75% 70% 71% 68% 71% 3. TL, %GDA 64% 72% 63% 63% 59% 58% 4. TL 62% 62% 61% 62% 64% 61% 5. Text %GDA 66% 72% 66% 66% 63% 61% 6. Text 67% 70% 64% 69% 67% 65% 7. %GDA 57% 61% 57% 57% 55% 52% 8. None 57% 58% 62% 53% 58% 54% Base: All answering tests one and two
The logistic regression also found that age had a significant impact on
comprehension at tests 1 and 2 (Tables 5.3, 6.4), with particularly lower levels of
comprehension for shoppers aged 65+. Table 8.3 shows a fairly consistent
pattern of decreasing ability to give the correct answer by age.
For test 1 there was less difference for label 2 (TL, text) with shoppers of all ages
achieving a relatively high level of correctness with this label. For test 2 there was
a consistent pattern of a larger gap in comprehension between the youngest and
oldest shoppers for labels including %GDA: there is a difference of around ten
percentage points or more between the youngest and oldest shoppers for each
pair of equivalent labels with and without %GDA. This difference seems to result
from two issues: In the case of labels 1 and 2 shoppers aged 65+ seem less able
to give the right answer when %GDA is present. In the cases of labels 3 and 4,
the inclusion of %GDA means younger shoppers are more able to give the right
answer. For the other pairs, the larger gap results from a combination of the two
effects. This means there is no clear steer on whether the inclusion of %GDA is
beneficial or damaging on balance for evaluations of overall product healthiness
(this may well depend which type of shopper is concerned). The logistic

BMRB Report: Comprehension and use of UK nutrition signpost labelling schemes 104
regression (Table 6.4) found that %GDA had no overall impact on
comprehension. However, the inclusion of %GDA does widen the gap between
younger and older shoppers.
The logistic regression found that ethnicity had a significant impact on
comprehension at tests 1 and 2 (Tables 5.3, 6.4), and social grade had a small
but significant impact at test 2 (but not at test 1: figures given in italics in Table
8.4). There were lower levels of comprehension for C2DE shoppers and shoppers
self-defining as any ethnicity other than white.
Table 8.4. Proportion giving correct answers at tests one and two by
social grade and ethnicity
Social grade Ethnicity
All ABC1 C2DE White Other Test 1 Unweighted base 548 293 255 503 43 Label: 1. TL, text, %GDA 72% 73% 70% 72% 68% 2. TL, text, 70% 71% 69% 70% 64% 3. TL, %GDA 67% 67% 67% 68% 55% 4. TL 64% 66% 60% 64% 59% 5. Text %GDA 69% 70% 68% 70% 58% 6. Text 68% 69% 68% 69% 65% 7. %GDA 63% 64% 62% 64% 54% 8. None 61% 60% 63% 62% 54% Test 2 Unweighted base 441 692 581 1196 76 Label: 1. TL, text, %GDA 69% 70% 69% 69% 71% 2. TL, text, 71% 75% 66% 72% 59% 3. TL, %GDA 64% 65% 63% 64% 56% 4. TL 62% 63% 60% 62% 63% 5. Text %GDA 66% 69% 62% 66% 66% 6. Text 67% 70% 62% 68% 61% 7. %GDA 57% 59% 54% 57% 54% 8. None 57% 57% 57% 57% 52%
Base: All answering tests one and two
Table 8.4 shows that for test 2 there was no difference by social grade for label 1
(text, TL, %GDA) but that for other labels including text (labels 2, 5 and 6) there
was a difference. For other labels the levels of comprehension were lower for both
ABC1s and C2DEs. This provides evidence of the value of including all three forms
of signposting. Since label 1 (text, TL, %GDA) did not perform significantly better
than label 2 (TL, text) among C2DE shoppers, the use of either of these two
labels would equally advantage this group of shoppers, but the use of label 1
would reduce the gap between ABC1s and C2DEs.
BMRB Report: Comprehension and use of UK nutrition signpost labelling schemes 105
For test 1, shoppers self-defining as any ethnicity other than white were
consistently less able to give the correct answer for all labels other than label 6
(text). Since these shoppers were not significantly less likely than white shoppers
to give the right answer for labels 1 and 2 (other variants including text) than
they were for label 6, they would not be disadvantaged by the use of these
labels. At test 2 shoppers self-defining as an ethnicity other than white were less
likely to give the correct answer for labels 2 and 3, but there was no difference by
ethnicity for label 1 (or other labels). Taking tests 1 and 2 together, label 1
seems to offer the greatest advantage for shoppers irrespective of ethnicity in
terms of reducing the gap.
It should be borne in mind, however, that the number of shoppers self-defining
as an ethnicity other than white is low, so no firm conclusions can be drawn from
these data. Furthermore, no one label performed better than all others for
shoppers self-defining as some ethnicity other than white, although the small
number of these respondents means this finding is indicative rather than
definitive. The accompanied shops and bag audits56 also found that black
shoppers were similar to white shoppers in label use, and that Asian shoppers
were most different in terms of use, so this difference between white and other
shoppers may mask a difference for Asian shoppers.
56 Ethnicity was self-defined by respondents’ selecting categories from a list

BMRB Report: Comprehension and use of UK nutrition signpost labelling schemes 106
9 Impact of changes to FOP label presentation
In addition to the signposting elements discussed in Chapters 5 to 8, two
presentational elements were identified in the accompanied shops and bag audits
and previous work carried out by FSA (FSA, 2007a) as having a potential impact
on comprehension. These are the use of a circular presentation format (similar
to the Sainsbury’s Wheel of Health) and the use of non-signposting colour to
differentiate between nutrients (similar to the Tesco pastel coloured %GDA label).
Both have a well established position in the marketplace. To this end, in addition
to the eight labels covered in Chapters 5 to 7, two further labels were included in
the tests: label 9 (%GDA with non-signposting nutrient specific colour) and label
10 (TL with circular presentation). Tests using all ten labels were presented to the
same groups of shoppers (see Table 2.3 for the full design including these two
labels, and section 12.3 for examples of the labels).
Summary
There was no evidence that the presentational changes explored had any impact
on comprehension in the way they are currently used in the marketplace. The use
of non-signposting nutrient-specific colour on a %GDA label (label 9) did not
consistently improve or reduce comprehension compared with the %GDA label
with no colour. Similarly, the use of a circular presentation on a TL label (label
10) did not influence comprehension compared with a horizontal TL label.
However, comprehension was significantly higher using label 1 (text, TL, %GDA)
than for both label 9 (%GDA with nutrient-specific colour) and label 10 (circular
TL).
Label 9, the non-signposting nutrient-specific coloured %GDA label enabled
shoppers to better interpret the information in some of the tests but not others,
compared with a %GDA label with a white background for each nutrient (label 7)
which differed only in the use of colour. However, the information and signposting
on label 1 (text, TL, %GDA) was still significantly more effective in helping
shoppers to interpret the labels and give the right answer (e.g. 69% for label 1,
59% for label 9 when evaluating healthiness of main meal sized portions, and
71% label 1, 59% for label 9 when evaluating healthiness of smaller portion or
snacks).
The accompanied shops and bag audits found a potential for confusion with the
%GDA label using non-signposting nutrient-specific colours, with the colours
mistakenly assigned a meaning similar to TL colours. The quantitative testing did
not, however, find that this led to any lower levels of comprehension for non-
signposting coloured %GDA labels compared with monochrome %GDA labels.
The circular presentation (label 10) did not influence label comprehension for TL
labelling, with no difference in the level of correct answers between this label and

BMRB Report: Comprehension and use of UK nutrition signpost labelling schemes 107
the TL label which differed only in having a horizontal presentation (label 4).
Label 1 (text, TL, %GDA) was again more effective in helping shoppers give the
right answer than either TL label (e.g. 69% using label 1 compared with 60%
correct using label 10 when evaluating healthiness of main meal sized portions
and 71% using label 1 compared with 66% using label 10 when evaluating
healthiness of smaller portion or snacks). Despite being perceived as the easiest
label to understand by one in three shoppers (section 4.2), label 10, the circular
TL, was actually one of the weakest in performance. Furthermore, those who
thought the label easiest to understand were no more likely to give the right
answer with label 10 than other shoppers, demonstrating that preference is not a
reliable predictor of ability to comprehend a particular label type.
The accompanied shops and bag audits, and the reasons given for selecting label
10 as easiest to understand revealed that some shoppers thought it was a pie
chart (or looked like one), with a potential for misinterpretation. This was not
reflected, however, in the quantitative comprehension testing, with no difference
in comprehension between the circular presentation and horizontal presentation
of the TL label.
9.1 The research design
Whilst the fully factorial design covered only the signposting elements of text, TL
and %GDA, two further labels were included in tests 2 and 3 to test out the
impact of specific changes to presentation. These two additional labels can each
be compared with one of the eight labels in the full factorial design, differing from
that label by only one element (direction/colour). Label 9 (%GDA with non-
signposting nutrient specific colour) can be compared with label 7 (%GDA), and
label 10 (TL with circular presentation) can be compared with label 4 (TL).
Comparing comprehension on these FOP labels allows evaluation of the impact of
a circular presentation and of non-signposting colour, in terms of the way they
currently appear in the marketplace. They are not part of the fully factorial
design, and so it is not possible to look at interactions of direction or of non-
signposting colour with %GDA, TL or text.
These comparisons were made for test 2 (evaluation of the overall healthiness of
a product) and test 3, (comparison of two products in terms of healthiness) but
not for test 1 (evaluation of the level of individual nutrients within a product) to
avoid over-burdening shoppers. Since test 3 had not differentiated between labels
1 to 8 (see Chapter 7), it was unlikely that it would differentiate by these
presentational differences.
9.2 Evidence from the qualitative research
The accompanied shops and bag audits found that shoppers (even non-
Sainsbury’s shoppers) tended to be familiar with the circular presentation (as

BMRB Report: Comprehension and use of UK nutrition signpost labelling schemes 108
used by Sainsbury’s), but there were shoppers who were familiar with the
scheme who did not understand that the colours were traffic light colours (some
people thought they were just eye catching), and the fact that the circle is split
into wedges led some shoppers to think it was a pie chart. This expectation also
led to confusion, as some shoppers thought that the wedges, being of equal size,
meant that the product was balanced, regardless of the other information on the
label.
The use of non-signposting colours (either a single colour in the background of all
nutrients, or nutrient specific colours) caused confusion because shoppers who
were familiar with the TL colours commonly thought that the non-signposting
colours were a means of signposting the level of nutrient, and tried to interpret
them as TL colours. This led to people thinking that levels of nutrients were low,
especially the nutrients represented with ‘cool’ colours such as pale greens and
pale blue.
9.3 Use of non-signposting nutrient-specific colours
Label 9 (%GDA with non-signposting colours) is equivalent to label 7 (%GDA
only). It differed only by using a different (non-signposting) pastel shade for each
nutrient. Chart 9.1 shows that there was little difference in comprehension
between label 7 (%GDA only) and label 9 (%GDA with non-signposting colour).

BMRB Report: Comprehension and use of UK nutrition signpost labelling schemes 109
Chart 9.1: % correct answers: label 7 (%GDA) compared with label 9
(%GDA with non-signposting colours) and label 1 (text, TL,
%GDA)
92
89
64
64
59
59
92
89
57
60
58
53
93
89
67
70
71
69
Label 1 (text, TL and %GDA)
Label 7 (%GDA)
Label 9 ( %GDA non-signposting colour)
Test 2:
Test 3:
P2
P1
Without energy, P2
Without energy, P1
With energy, P2
With energy, P1
Test 2:
Test 3:
P2
P1
Without energy, P2
Without energy, P1
With energy, P2
With energy, P1
Base: Test 2 with energy (652) / without energy (621) / test 3 (607)
7,9
7,9
7,9
7
7
7
Numbers in red to right of scores indicate labels where comprehension is significantly lower (within energy/no energy and P1/P2)
There were significant but small differences for test 2 (evaluation of the overall
healthiness of a product) with energy for P1 (main meal sized portion) and for
test 2 without energy for P2 (smaller portion or snack). There was no difference
at test 3 (comparison of two products in terms of healthiness) but this is not
surprising as test 3 did not tend to differentiate between any labels (see Chapter
7 for detail).
It is worth noting that, whilst label 9 (%GDA with non-signposting colours) may
outperform its monochrome equivalent label 7 (%GDA) on some tests,
significantly more shoppers gave the correct answer using label 1 than using label
9 (%GDA with non-signposting colours) at test 2 (evaluation of the overall
healthiness of a product), with energy for P1 (main meal sized portion) and P2
(smaller portion or snack), and without energy for P1 (main meal sized portion).
There were significant (albeit small) differences in the time taken to produce an
answer by label type, with shoppers taking slightly longer to interpret label 9 (
%GDA with non-signposting colours) (Table 9.1). The same difference is present
for those giving the correct answers at the tests.
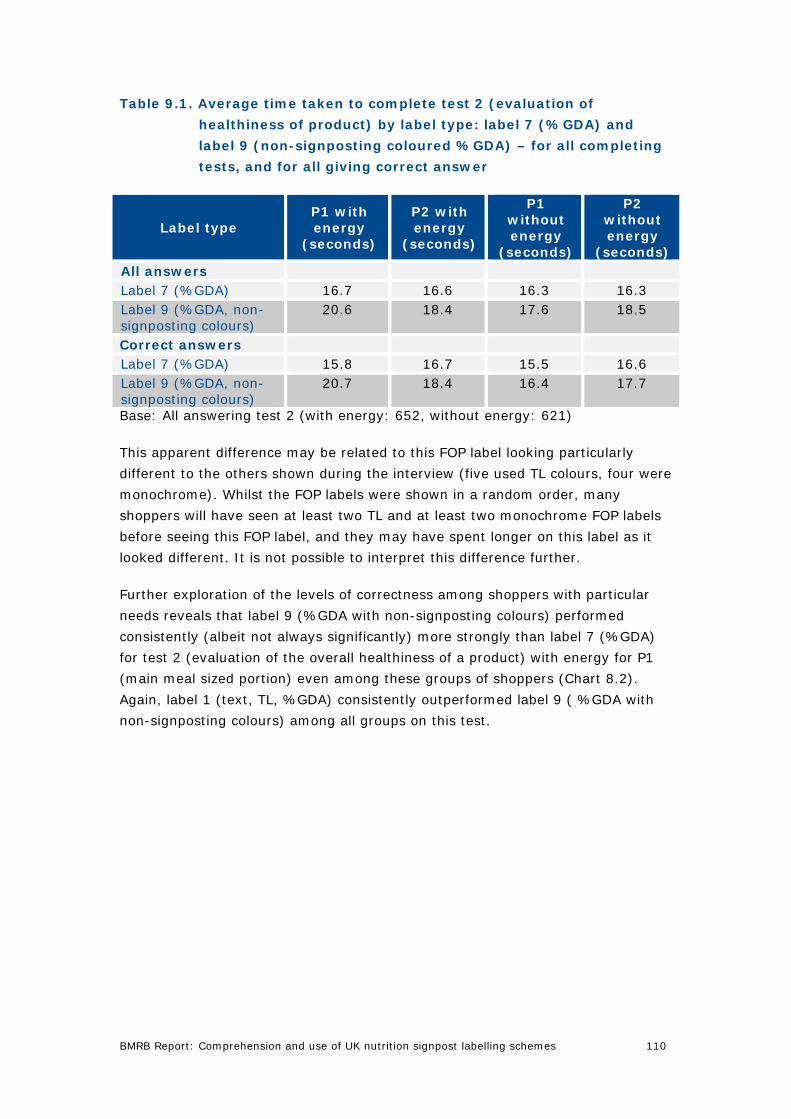
BMRB Report: Comprehension and use of UK nutrition signpost labelling schemes 110
Table 9.1. Average time taken to complete test 2 (evaluation of
healthiness of product) by label type: label 7 (%GDA) and
label 9 (non-signposting coloured %GDA) – for all completing
tests, and for all giving correct answer
Label type P1 with energy
(seconds)
P2 with energy
(seconds)
P1 without energy
(seconds)
P2 without energy
(seconds) All answers Label 7 (%GDA) 16.7 16.6 16.3 16.3 Label 9 (%GDA, non-signposting colours)
20.6 18.4 17.6 18.5
Correct answers Label 7 (%GDA) 15.8 16.7 15.5 16.6 Label 9 (%GDA, non- signposting colours)
20.7 18.4 16.4 17.7
Base: All answering test 2 (with energy: 652, without energy: 621)
This apparent difference may be related to this FOP label looking particularly
different to the others shown during the interview (five used TL colours, four were
monochrome). Whilst the FOP labels were shown in a random order, many
shoppers will have seen at least two TL and at least two monochrome FOP labels
before seeing this FOP label, and they may have spent longer on this label as it
looked different. It is not possible to interpret this difference further.
Further exploration of the levels of correctness among shoppers with particular
needs reveals that label 9 (%GDA with non-signposting colours) performed
consistently (albeit not always significantly) more strongly than label 7 (%GDA)
for test 2 (evaluation of the overall healthiness of a product) with energy for P1
(main meal sized portion) even among these groups of shoppers (Chart 8.2).
Again, label 1 (text, TL, %GDA) consistently outperformed label 9 ( %GDA with
non-signposting colours) among all groups on this test.
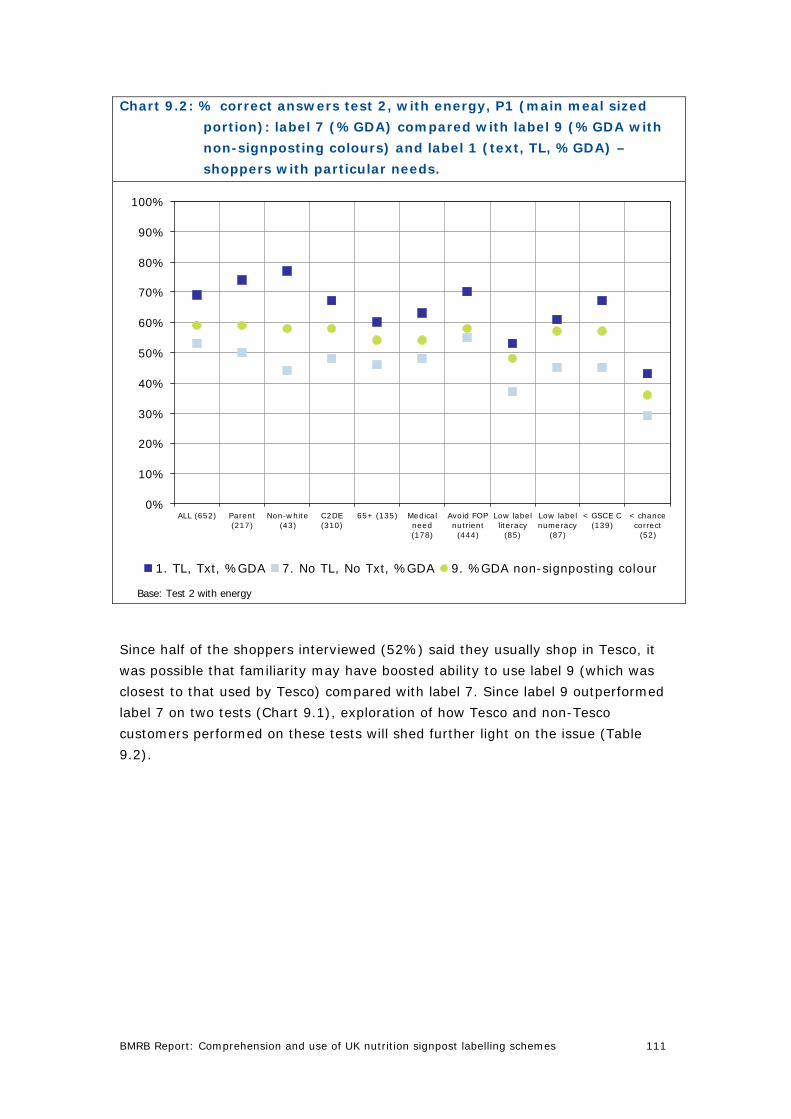
BMRB Report: Comprehension and use of UK nutrition signpost labelling schemes 111
Chart 9.2: % correct answers test 2, with energy, P1 (main meal sized
portion): label 7 (%GDA) compared with label 9 (%GDA with
non-signposting colours) and label 1 (text, TL, %GDA) –
shoppers with particular needs.
0%
10%
20%
30%
40%
50%
60%
70%
80%
90%
100%
ALL (652) Parent(217)
Non-white(43)
C2DE(310)
65+ (135) Medicalneed(178)
Avoid FOPnutrient(444)
Low labelliteracy
(85)
Low labelnumeracy
(87)
< GSCE C(139)
< chancecorrect
(52)
1. TL, Txt, %GDA 7. No TL, No Txt, %GDA 9. %GDA non-signposting colour
Base: Test 2 with energy
Since half of the shoppers interviewed (52%) said they usually shop in Tesco, it
was possible that familiarity may have boosted ability to use label 9 (which was
closest to that used by Tesco) compared with label 7. Since label 9 outperformed
label 7 on two tests (Chart 9.1), exploration of how Tesco and non-Tesco
customers performed on these tests will shed further light on the issue (Table
9.2).

BMRB Report: Comprehension and use of UK nutrition signpost labelling schemes 112
Table 9.2. % correct answers for test 2 label 9 – Tesco and non-Tesco
shoppers
Test Tesco
shoppers Non-Tesco shoppers
Tesco shoppers
Non-Tesco shoppers
Label 9 (%GDA, non- signposting colour)
Label 7 (%GDA)
Test 2 with energy 337 315 337 315 P1 (main meal sized portion)
58% 60% 54% 51%
Test 2 without energy
331 290 331 290
P2 (smaller portion or snack)
62% 66% 52% 63%*
Base: All answering test 2 * significantly higher than Tesco shoppers on same label at same test
There were no significant differences between Tesco and non-Tesco shoppers on
either test for label 9. The only significant difference was for test 2 without
energy for P2 (smaller portion or snack) where non-Tesco shoppers were more
likely to give the right answer on label 7 (%GDA) than Tesco shoppers. This
means familiarity through being a Tesco customer cannot explain the difference
between labels 7 and 9 at Test 2 with energy for P1 (main meal sized portion).
For Test 2 without energy for P2 (smaller portion or snack), the difference
appears to be that Tesco customers are less able to understand label 7 (%GDA)
without nutrient-specific colours.
The accompanied shops and bag audits uncovered some confusion through using
non-signposting colours on FOP labels, with shoppers familiar with TLs
misinterpreting the non-signposting colours as having meaning. There was no
evidence that this worsened comprehension in the quantitative work since
comprehension using label 9 (%GDA with non-signposting colours) was not found
to be worse than comprehension using label 7 (%GDA, no colours). This research
addressed the use of non-signposting colours with %GDA labels, and each test
showed one FOP label type only: it did not address any issues arising from
looking at a TL label alongside a non-signposting nutrient specific coloured label.
This is explored further in Chapter 10.
9.4 Circular presentation
Label 10 (circular TL) is equivalent to label 4 (TL). It differs only by using a
circular rather than a horizontal presentation. Chart 9.3 shows that there was no
significant difference between label 4 and the circular label 10 for test 2
(evaluation of the overall healthiness of a product), but that shoppers were
slightly less likely to get the correct answer on test 3 (comparison of two products
in terms of healthiness) for P2 (smaller portion or snack) using label 10 (circular
TL).

BMRB Report: Comprehension and use of UK nutrition signpost labelling schemes 113
Again, it should be noted that significantly more shoppers gave the right answer
using label 1 (text, TL, %GDA) compared with the circular TL label (label 10) at
test 2 (evaluation of the overall healthiness of a product), although for P2, with
energy the difference was small and only significant at the 95% level.
Chart 9.3: % correct answers label 4 (TL) compared with circular label 10
(TL) and label 1 (text, TL, %GDA)
87
89
62
63
66
60
92
88
57
64
65
62
93
89
67
70
71
69
Label 1 (text, TL and %GDA)Label 4 (TL)Label 10 (circular TL)
Test 2:
Test 3:
P2
P1
Without energy, P2
Without energy, P1
With energy, P2
With energy, P1
Test 2:
Test 3:
P2
P1
Without energy, P2
Without energy, P1
With energy, P2
With energy, P1
10
Base: Test 2 with energy (652) / without energy (621) / test 3 (607)
4,10
4,10
4,10
4,10
10
Numbers in red to right of scores indicate labels where comprehension is significantly lower (within energy/no energy and P1/P2)
There were no significant differences in the time taken for test 2 (evaluation of
the overall healthiness of a product). There were significant, but slight differences
in the time taken to produce an answer by label type for test 3 (comparison of
two products in terms of healthiness) (Table 9.3). These differences were similar
for all shoppers taking the tests, and for those giving the correct answer.
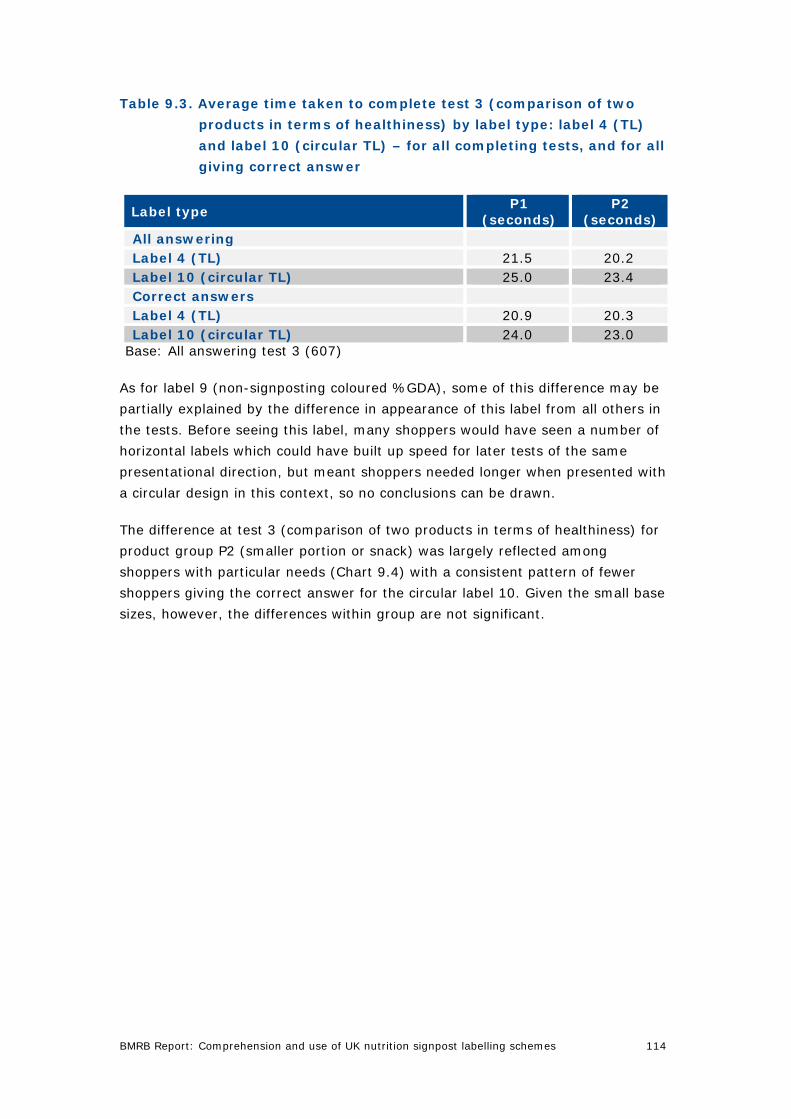
BMRB Report: Comprehension and use of UK nutrition signpost labelling schemes 114
Table 9.3. Average time taken to complete test 3 (comparison of two
products in terms of healthiness) by label type: label 4 (TL)
and label 10 (circular TL) – for all completing tests, and for all
giving correct answer
Label type P1
(seconds) P2
(seconds) All answering Label 4 (TL) 21.5 20.2 Label 10 (circular TL) 25.0 23.4 Correct answers Label 4 (TL) 20.9 20.3 Label 10 (circular TL) 24.0 23.0
Base: All answering test 3 (607)
As for label 9 (non-signposting coloured %GDA), some of this difference may be
partially explained by the difference in appearance of this label from all others in
the tests. Before seeing this label, many shoppers would have seen a number of
horizontal labels which could have built up speed for later tests of the same
presentational direction, but meant shoppers needed longer when presented with
a circular design in this context, so no conclusions can be drawn.
The difference at test 3 (comparison of two products in terms of healthiness) for
product group P2 (smaller portion or snack) was largely reflected among
shoppers with particular needs (Chart 9.4) with a consistent pattern of fewer
shoppers giving the correct answer for the circular label 10. Given the small base
sizes, however, the differences within group are not significant.

BMRB Report: Comprehension and use of UK nutrition signpost labelling schemes 115
Chart 9.4: % correct answers test 3, P2 (smaller portion or snack): label 4
compared with label 10 – shoppers with particular needs.
Base: Test 2 with energy
0%
10%
20%
30%
40%
50%
60%
70%
80%
90%
100%
All (607) Parent(209)
Non white(34)
C2DE (254) Medicalneed (129)
Avoid FOPnutrient(399)
Low labelliteracy
(90)
Low labelnumeracy
(90)
< GCSE C(166)
1. TL, Txt, %GDA 4. TL, No Txt, No %GDA 10. Circular TL
Regular Sainsbury’s shoppers (30% of shoppers) were not significantly more
likely to give the right answer at test 2 (evaluation of the overall healthiness of a
product) or test 3 (comparison of two products in terms of healthiness) when
presented with the circular label 10, than those who did not shop at Sainsbury’s.
Label 10 performed relatively weakly compared with labels including text, such as
label 1 (text, TL, %GDA). As explained in Section 4.2, label 10 was one of the two
labels most likely to be seen as easy to understand (33% of shoppers selected
label 10, 42% selected label 1). Furthermore, those shoppers who thought label
10 was easiest to understand were no more likely than other shoppers to give the
correct answer using label 10. The relatively low level of accurate response using
label 10 compared with other labels (even among those who thought it would be
easiest to understand) shows that perceived ease is not a good indicator of ability
to use a label to make healthiness evaluations. This was discussed in more detail
in section 4.2.
Furthermore, the accompanied shops and bag audits found a degree of
misunderstanding caused by the circular TL format. It was misinterpreted as a pie
chart by some shoppers which could lead to inaccurate interpretation of the
nutritional information included on the label (e.g. seeing all nutrients as equally
balance since all segments of the ‘pie’ are equally sized). As described in section

BMRB Report: Comprehension and use of UK nutrition signpost labelling schemes 116
4.2, for a third of those selecting label 10 as easiest to understand, the reason
was a mistaken belief that the format helped them understand the proportions of
the nutrients or that it was (or looked like) a pie chart. There was, however, no
evidence from the quantitative testing work that the circular format made it
harder to evaluate product healthiness using a TL label, as there was no
significant difference in the level of correctness compared with label 4 (TL) from
which it differed only in having a circular presentation. There was some evidence
that the circular format made it harder to compare two products for healthiness
for P2 (smaller portion or snack) but even using the circular label 87% of
shoppers could give the correct answer.

BMRB Report: Comprehension and use of UK nutrition signpost labelling schemes 117
10 The impact of comparing the healthiness of products with different signposting methods
The final part of the study explored the impact that multiple signposting methods
on FOP labels in the marketplace had on shoppers’ ability to correctly evaluate
the healthiness of products. This included both qualitative and quantitative
components. The quantitative element attempted to quantify any problems
caused by the presence of different signposting methods when comparing two
products in terms of overall healthiness. The qualitative work explored the nature
of any such problems. This element of the study was not intended to cover all
signposting types comprehensively, but to give an indication of possible issues for
the main FOP labels in the marketplace. More details are given in Chapter 2.
Summary
This part of the study used both quantitative and qualitative methods and
provided further evidence that if one product is obviously healthier than another
(the same or lower on all nutrients) then shoppers can make a comparison using
the gram weight of nutrients alone, with the FOP signposting present having no
impact.
Shoppers had greater problems with hard comparisons where, for example, one
product was higher in one or two nutrients, and the second product higher in the
remaining nutrients. The qualitative work found that trying to make comparisons
for a pair with no signposting in common exacerbates this difficulty in two main
ways:
1. Signposting consistency wrongly assumed: The belief that the use of non-
signposting colour on %GDA labels signposts the level of nutrient in the same
way as TL labels led some shoppers to make incorrect comparisons, through
believing that some non-signposting colours indicated a low levels of a nutrient,
irrespective of the actual amount in grams.
2. Consistency obscured by signposting: The presence of different types of
signposting on each of the pair of labels meant some shoppers did not realise that
the weight of the nutrient in grams was present on both labels and could help
them to make a comparison. Some shoppers fell back on any information they
recognised, in some cases choosing the label with the signposting they felt they
understood rather than attempting any genuine comparison.
In both of these situations, some shoppers said the time spent trying to make the
comparisons would be too long, and they would not be willing to spend the time
needed whilst actually shopping.
BMRB Report: Comprehension and use of UK nutrition signpost labelling schemes 118
The qualitative work found that the use of the label containing TL, text and %GDA
could help shoppers to overcome some of these problems, providing consistency
of signposting and allowing shoppers to use whichever signposting method they
were most comfortable with. The inclusion of text enabled some shoppers to
make the link between the traffic light colours and their intended meaning. It also
allowed an ‘at a glance’ evaluation to be made, not requiring any further
interpretation to judge the level of a nutrient, even for shoppers unfamiliar with
signposting, unlike %GDA and TL without text.
Confidence also has a role to play; shoppers who approached the qualitative tasks
with confidence (whether merited or not) appeared to be more willing to engage
with the FOP labels; more hesitant shoppers may be unwilling to engage with FOP
labels, and to expend the effort they think will be involved in using them.
10.1 Evidence from previous research
Prior to this project, work on food labelling was largely concerned with the level of
understanding of individual label types. Neither of the major recent review papers
(Cowburn & Stockley, 2005, and Grunert & Wills, 2007) refer to any research on
the impact of multiple label formats in the marketplace. Findings from the
accompanied shops and bag audits (Clegg & Lawless, 2008) and the cognitive
testing (Malam et al, 2008) suggested that the presence of different label types in
the marketplace could cause problems and that there was a need for further work
(both qualitative and quantitative) to explore the different dimensions of any
problems, their sources and effects, and to quantify the degree of any problems
there can be when comparing products with different FOP label types.
Mitchell, Walsh & Yamin (2005) propose a conceptual model of consumer
confusion which the accompanied shops and bag audits indicated could be applied
to the impact of multiple FOP label types as follows:
• Similarity: if FOP labels look broadly similar but contain different
signposting information, this could cause inaccurate comparison through
misinterpretation of one or other of the FOP labels. The qualitative work and
cognitive testing suggested misallocated meaning to some FOP label types
(e.g. the presence of a monochrome colour interpreted as having a traffic
light meaning - Clegg & Lawless 2008, Malam et al 2008).
• Information overload: the presence of multiple FOP label types could
result in too much information and an inability to deal with it. This type of
problem is likely to result in the choice being abandoned entirely. This was
illustrated by the finding in the cognitive testing (Malam et al, 2008) that
some shoppers were unable to compare two products with different FOP
labels, declaring it was just too difficult.

BMRB Report: Comprehension and use of UK nutrition signpost labelling schemes 119
• Ambiguous/unclear information: trying to compare two different FOP
label types could make two products appear not to be comparable at all.
Some people may look for further information to try to inform the decision
and decide which information to trust. For example, in the cognitive testing
(Malam et al, 2008) when comparing two products with different FOP label
types, some shoppers selected the product with the FOP label type with
which they were most familiar, irrespective of the content of the product.
The results of the Nutritionists’ survey to establish the correct answers for the
tests used in this research (FSA 2008) and the results for test 3 (comparison of
two products in terms of healthiness, using the same label type for each of the
products) in the main survey (see Chapter 7) led to the hypothesis that either a
pair of products are simple to compare, and this can be done using the amounts
of nutrients, or the comparison is complicated (e.g. one product is higher in fat,
one higher in salt) requiring a value judgement as to which nutrient is key. This
chapter provides further evidence in support of this hypothesis through looking at
comparisons using different FOP label formats for each product.
10.2 The degree of any problems caused by different signposting methods
The quantitative element of this piece of work attempted to quantify any
problems caused by the presence of different signposting methods on FOP labels
in comparing two products in terms of healthiness. This was not a fully
comprehensive review of all signposting methods (see section 2.5.4 for more
details) but was intended to give an indication of the degree of any problems
experienced for the main labels in the marketplace.
10.2.1 The tests
The test used in this work was test 3 (comparison of two products in terms of
healthiness) as described in Chapter 7. The question asked was: “Using the
information on these two labels, which of these two products do you think is
healthier?”. Healthiness was additionally defined for shoppers as: “to be eating
healthily the Government advise that most people reduce the level of fat,
saturated fat (also known as saturates), salt and sugars in the foods they eat”.
Shoppers chose from a three point response scale (product A, product B, or no
real difference between A and B). Each response was assessed for correctness
against the single answer pre-defined by the survey of nutritionists and dieticians
(FSA 2008). Each test was also timed. A maximum time of 6 minutes was allowed
for the tests. Almost all shoppers completed their tests within this time.
In this part of the study a different FOP label type was used for each of the
products within each pair whereas, in the main study, each pair used the same
FOP label type for both of the products. When this stage of research was set up,
the main survey (as reported in Chapters 5-9) was underway. In order to choose
BMRB Report: Comprehension and use of UK nutrition signpost labelling schemes 120
product pairs to use in the research, the data collected thus far was examined,
and pairs with the lowest levels of correct response chosen. However, even these
pairs had a correct response level of at least 70%. As explained in Chapter 7, the
difficulty in finding pairs with sufficient agreement between nutritionists over the
correct answer had led to only “easy comparisons” being included in test 3. This
resulted in test 3 failing to discriminate between label types when each pair used
the same signposting method. This stage was intended to find out if that was still
the case when a mismatched pair of FOP labels was used.
Since only some of the pairs used at the main stage were used in this stage of
the research, comparison with the main stage data was conducted only with
responses about the same pairs, and figures do not, therefore, match those given
in Chapter 7 which covered the full range of products.
This was not intended to be a comprehensive study of all FOP label types, and
only three of the eight label types were included: label 1 (text, TL, %GDA), label
4 (TL only) and label 7 (%GDA only) (see section 12.3 for examples of these
labels). These FOP labels were chosen to cover the main labels in the marketplace
and to allow comparisons of three pairs of FOP labels: those with %GDA in
common (label 1 and label 7), TL in common (label 1 and label 4) and no
signposting in common (label 4 and label 7).
The tests were presented for each pair of FOP labels for both product categories:
P1 (main meal sized portion) and P2 (smaller portion or snack). This means that,
in total, each shopper was presented with six tests.
Shoppers were split into four equal groups at random to allow all possible
combinations of product and FOP label pairs. Each pair of FOP labels was
presented twice (e.g. label 1 with product A, label 4 with product B and vice
versa) to avoid any product/label type combination effects (but not to the same
shopper). As for the main stage testing, all possible product/label combinations
were rotated and the order in which tests were shown was randomised to avoid
any effects from ordering.
10.2.2 Effect of presenting pairs of products with two different FOP label types compared with using the same FOP label type for both products
As had been the case in the main study, when presented with the pairs of FOP
labels, the vast majority of shoppers could give the correct answer irrespective of
the combination of FOP label types shown (Table 10.1).

BMRB Report: Comprehension and use of UK nutrition signpost labelling schemes 121
Table 10.1. % correct answers by FOP label type and product category
at test 3 (comparison of two products in terms of healthiness)
– matching FOP label types compared with contrasting FOP
label types
Label type57 Mixed pair Label 1
only Label 4
only Label 7
only P1 (main meal sized portion)
Label 1 and label 7 84 87 NA 88 Label 1 and label 4 84 87 87 NA Label 4 and label 7 85 NA 87 88 P2 (smaller portion or snack)
Label 1 and label 7 88 92 NA 89 Label 1 and label 4 87 92* 90 NA Label 4 and label 7 86 NA 90 89 Base: All answering test 3 (350-375)/ test 3 omnibus (1273) * Significantly higher than mixed pair within P2
Comparing the success rates for the mixed label pairs, with the rates for pairs
using single label types reveals no difference, with the exception of label 1 (text,
TL, %GDA) and label 4 (TL) for P2 (smaller portion or snack), where 87% chose
the correct answer for the mixed pair, and 92% chose the correct answer when
label 1 only (text, TL, %GDA) was used. However, this is only significant at the
95% level, and the extremely high level of correct answers even with the mixed
pair, and the lack of any other differences means this research has provided little
substantive quantitative evidence of difficulties in comprehension when
comparing pairs of products using different FOP label types.
Furthermore there was no evidence of any further confusion when shoppers were
faced with a pair of labels with no signposting in common (labels 4 and 7)
compared with labels with TL in common (labels 1 and 4) or with %GDA in
common (labels 1 and 7).
Consideration of the time taken suggests that the same amount of time or less
was spent on comparing two different label types compared with a pair of
products using only one label type, so again provides no evidence of additional
confusion (Table 10.2). Since nearly all shoppers gave a correct answer, there is
no significant difference between all answers, and those for shoppers giving a
correct response, so timings for all answers are given.
57 Label 1 – text, TL and %GDA; Label 4 – TL; Label 7 - %GDA

BMRB Report: Comprehension and use of UK nutrition signpost labelling schemes 122
Table 10.2. Average time taken to complete tests by label type at test 3
(comparison of two products in terms of healthiness)
Label type Mixed pair Label 1
only Label 4
only Label 7
only P1 (main meal portion)
Label 1 and label 7 20.37 25.15 NA 21.34 Label 1 and label 4 20.17 25.15 21.61 NA Label 4 and label 7 19.72 NA 21.61 21.34 P2 (smaller portion or snack)
Label 1 and label 7 19.53 23.90 NA 22.36 Label 1 and label 4 20.25 23.90 20.64 NA Label 4 and label 7 19.53 NA 20.64 22.36 Base: All answering test 3 (350-375)/ test 3 omnibus (1273)
The results of test 3 reported in Chapter 7 resulted in a working hypothesis that
either a pair of products is simple to compare (‘easy comparison’), and this can
be done irrespective of signposting, or the comparison is complicated (‘hard
comparison’; e.g. one product is higher in fat, one higher in salt requiring a value
judgement as to which is key) and cannot be made at all, or can only be decided
on the basis of which nutrient an individual considers most important to them).
The results of this stage of the research provide further evidence that easy
comparisons can be made irrespective of signposting: even when a pair of
mismatched labels is shown, this does not significantly reduce the number of
correct answers.
Neither test 3, nor this stage of the research provide any evidence of whether
signposting would have any impact on ‘hard comparisons’, or whether shoppers
would be unable to provide an answer irrespective of the signposting, as
suggested by the accompanied shops and bag audits, since no such pairs were
included in the research (in the absence of pairs with a defined correct answer).
The quantitative work alone is not, therefore, sufficient to conclude that the
presence of multiple label formats does not cause any problems. Hard
comparisons were included in the qualitative element of this part of the research,
in order to explore the impact of signposting on such comparisons. This is
discussed in section 10.3 below.
10.3 The nature of any problems caused by different signposting methods
10.3.1 The interview
The qualitative work was designed to explore whether there were difficulties for
shoppers in using the different signposting methods on FOP labels in the market
place to make product comparisons and, if so, to uncover what the sources of
difficulty were, and what their effects were. Fifty depth interviews were carried

BMRB Report: Comprehension and use of UK nutrition signpost labelling schemes 123
out, during which shoppers were presented with pairs of FOP labels and were
asked to decide which of the pair represented a healthier product. This was used
as the starting point to discuss any problems caused by the use of multiple
signposting methods on FOP labels in making product comparisons. It also
facilitated further discussion about any problems with each type of signposting.
The FOP labels used were identical in format to the ones used in the quantitative
work described above but it was decided that, for this work, it was necessary to
use not only pairs where there had been sufficient agreement over the correct
answer in the nutritionist survey (FSA 2008) (in this work called ‘easy
comparisons’), but also pairs where there had not been sufficient agreement
(‘hard comparisons’); it was felt that the easy comparisons did not present
enough of a challenge to probe on how shoppers were making the decision on
which of the pair was healthier, whereas the hard comparisons would give the
opportunity to ask shoppers about what strategies they were using to make a
decision. As there was no pre-defined correct answer to the hard comparisons,
shoppers were not expected to reach any particular answer, but were instead
probed about how they would reach an answer.
The pairs represented TL (label 4), monochrome %GDA (label 7), %GDA with
non-signposting colour (label 9) and text, TL and %GDA (label 1) labels . These
were the same three labels as used in the quantitative study into multiple label
formats, with the addition of one further label: %GDA with non-signposting colour
(label 9). This latter label was included to enable further exploration of the use of
non-signposting colour which had been identified as a problem when attempting
comparisons with TL labels (see section 3.6). Like with like comparisons were not
made: each pair used a different label type for each product. A rotation system
was used so that as even a spread as possible of label pair presentations was
achieved (see the Technical Annex section 3.4.10 for more information).
10.3.2 Easy comparisons
Shoppers were able to make decisions on which product was healthier on some
pairs simply by glancing at the FOP labels. When asked how they were making
the decision they were able to articulate clearly that the nutrient levels (weight in
grams) were higher in one of the FOP labels, therefore they had chosen the other
label as the healthier one. Amongst the pairs with sufficient agreement over the
correct answer in the nutritionist survey, no pairings of labels were more difficult
to work with than others, and no individual labels proved to be easier or harder to
understand amongst the easy comparisons. This backs up the hypothesis that
easy comparisons can be made using the level of nutrient (in grams) alone, and
signposting does not come into play.
In the accompanied shops and bag audits, some shoppers found it hard to see
any common information when comparing products with different FOP label
BMRB Report: Comprehension and use of UK nutrition signpost labelling schemes 124
schemes. When looking at the easy comparisons in the depth interviews, this did
not seem to be a problem. This suggests that this difficulty largely comes into
play with hard comparisons.
10.3.3 Hard comparisons
The hard comparisons presented shoppers with two problems. First, on these
labels there was no obvious correct answer: some nutrients were higher on the
first label, others higher on the second. This required shoppers to develop a
strategy to make the decision. This first problem was then compounded by
difficulties comparing two FOP label with different types of signposting,
particularly attempting to compare a label with TL colour but no %GDA, with a
label with %GDA but no TL colour.
Difficulties with hard comparisons
It is not surprising that shoppers would find the hard comparisons difficult: these
pairs were rejected for the main survey as sufficient agreement on which product
was healthier was not reached by nutritionists and dieticians (based purely on the
gram weight of nutrients: FSA 2008). This reflected a degree of individual choice
over which nutrients were more important to the individual even among
professionals. However, the problems went beyond this basic difficulty: when
researchers probed on what shoppers were looking at, and what they were using
to help them make their decision, it was clear that the confusion caused by the
different signposting methods, (see discussion below), generally exacerbated any
problems they were having weighing up the balance of nutrients. Unless shoppers
had recognised that each of the different FOP label types could be compared on
some level, even if only on the gram amounts, their difficulties with the different
formats interfered further with their decision making process.
Even if the confusion about the format types had been overcome, shoppers then
struggled to decide whether certain nutrients were better or worse than others –
for example, when looking at these two FOP labels:
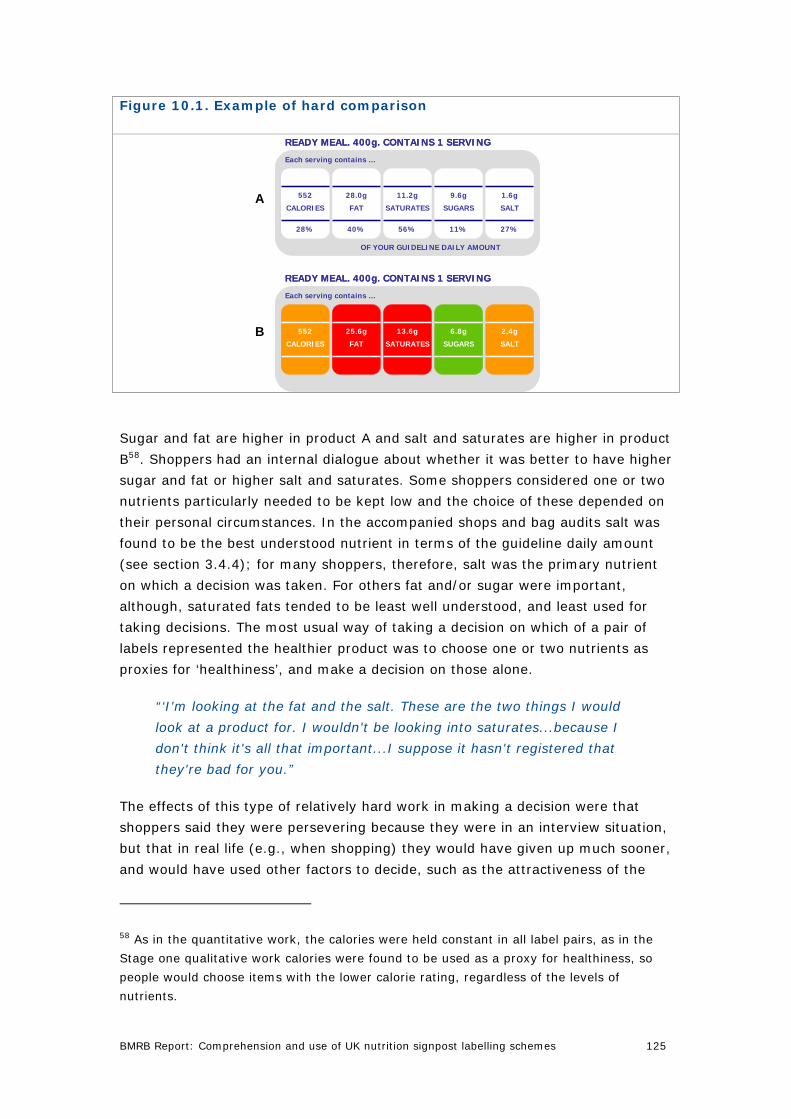
BMRB Report: Comprehension and use of UK nutrition signpost labelling schemes 125
Figure 10.1. Example of hard comparison
FAT
25.6g
SALT
2.4g
SATURATES
13.6g
CALORIES SUGARS
6.8g552
Each serving contains …
READY MEAL. 400g. CONTAINS 1 SERVING
FAT
25.6g
SALT
2.4g
SATURATES
13.6g
CALORIES SUGARS
6.8g552
Each serving contains …
READY MEAL. 400g. CONTAINS 1 SERVING
40% 27%56% 11%
FAT
28.0g
SALT
1.6g
SATURATES
11.2g
SUGARS
9.6g
OF YOUR GUIDELINE DAILY AMOUNT
Each serving contains …
CALORIES
552
28%
READY MEAL. 400g. CONTAINS 1 SERVING
40% 27%56% 11%
FAT
28.0g
SALT
1.6g
SATURATES
11.2g
SUGARS
9.6g
OF YOUR GUIDELINE DAILY AMOUNT
Each serving contains …
CALORIES
552
28%
READY MEAL. 400g. CONTAINS 1 SERVING
A
B
Sugar and fat are higher in product A and salt and saturates are higher in product
B58. Shoppers had an internal dialogue about whether it was better to have higher
sugar and fat or higher salt and saturates. Some shoppers considered one or two
nutrients particularly needed to be kept low and the choice of these depended on
their personal circumstances. In the accompanied shops and bag audits salt was
found to be the best understood nutrient in terms of the guideline daily amount
(see section 3.4.4); for many shoppers, therefore, salt was the primary nutrient
on which a decision was taken. For others fat and/or sugar were important,
although, saturated fats tended to be least well understood, and least used for
taking decisions. The most usual way of taking a decision on which of a pair of
labels represented the healthier product was to choose one or two nutrients as
proxies for ‘healthiness’, and make a decision on those alone.
“‘I'm looking at the fat and the salt. These are the two things I would
look at a product for. I wouldn't be looking into saturates...because I
don't think it's all that important...I suppose it hasn't registered that
they're bad for you.”
The effects of this type of relatively hard work in making a decision were that
shoppers said they were persevering because they were in an interview situation,
but that in real life (e.g., when shopping) they would have given up much sooner,
and would have used other factors to decide, such as the attractiveness of the
58 As in the quantitative work, the calories were held constant in all label pairs, as in the
Stage one qualitative work calories were found to be used as a proxy for healthiness, so
people would choose items with the lower calorie rating, regardless of the levels of
nutrients.

BMRB Report: Comprehension and use of UK nutrition signpost labelling schemes 126
packaging or other labelling information, packaging health claims, nutrition
claims, brand information or product familiarity. There were some shoppers who
abandoned trying to make a decision in the tasks, and who said that in real life
situations they would feel that the task was far too onerous.
“I would get annoyed… because it should be easy.”
Some shoppers gave up trying to make a decision based on the nutrient levels
and decided that they would choose a label with TL colours, because they felt that
they understood what they meant. Often they realised that they might be making
the wrong decision in terms of healthiness, but they felt that they would at least
understand what was in the product if they were buying it in a real life situation.
“At least I know what I’m eating. I know I’m on high fat, and I’m on
high saturates [on TL label]… but on this one [Monochrome %GDA
label] I don’t know what I’m eating, I don’t know what’s high or what’s
low.”
Difficulties with signposting types
There is some common information on all of the FOP labels to enable comparisons
across label types: at the most basic level comparisons can be made on the gram
amounts of nutrients which are present on all FOP label types. The level of
signposting in common does, however, vary depending on the types of FOP labels
used for the pair. As was found in the accompanied shops and bag audits,
shoppers experienced difficulties in comparing different FOP label types, and this
work allowed further exploration of these problems. Many of the difficulties with
signposting expressed by shoppers in the depth interviews in this element of the
research were similar to those observed in the accompanied shops and bag
audits59 (see section 3.6).
• Labels with common signposting methods
There were some pairs of labels which were similar enough that the differences
between them did not present any difficulties. Notably the label containing text,
TL and %GDA did not present problems for shoppers in making comparisons with
either TL or %GDA labels because they could read data from this label which they
could then compare directly with common information on the other label types:
the TL colours allowed direct comparisons with TL labels on colour alone, whilst
the GDA percentages allowed similar direct comparisons with the %GDA labels.
59 See Figure 2.1 for details of full programme of research

BMRB Report: Comprehension and use of UK nutrition signpost labelling schemes 127
Being able to compare GDA percentages in %GDA labels and text, TL and %GDA
labels was seen by some shoppers to be an advantage, because the %GDA
allowed them to understand whether the differences in the levels of nutrients
were big enough to matter or not. However, it was more usual that shoppers did
not understand %GDAs, so looked to other elements of the labels to make
comparisons. One common misunderstanding was that %GDA represented the
proportion of the product. In the example below the shopper believed that half of
the meal represented by the label consisted of salt:
“Because 45% [salt on %GDA label] ... that’s, like, nearly half of the
whole meal!”
• Comparisons including text/TL
FOP labels containing text do not require shoppers to make an interpretation of
their meaning, in contrast to TL colours or %GDA, so can be the easiest form of
signposting for shoppers to use. Furthermore, the words High, Medium and Low
allowed some shoppers to understand the TL colours better, with some realising
part way through the interviews that red labels were always marked ‘High’,
orange labels ‘Medium’ and green labels ‘Low’. Until that point they had been
using the gram weight alongside the TLs to work through the hard comparisons;
for example, if the text read High, they would look at the gram weight, and would
then look at the gram weight of the comparator FOP label to see how it
compared. Shoppers who realised as the interview progressed that the text labels
and the colours were related began to take a different decision route, using the
colours more. The text labels appeared to have the effect of educating them in
how to use TL colours in these cases.
“What I have to say is that people might not… suss the traffic light
system, so therefore, the fact you’re talking about Low, High and
Medium [text labels], that’s a very good thing.”
Of the different signposting methods, only the text labels alone did not cause
shoppers difficulty in understanding.
“I do like the High and Medium [text labels]… because for people like
me that want to go on a quick easy shop, that you want it basically
told to you, rather than you trying to work something else out.”
“I don’t understand this kind of scheme at all [non-signposting colour
%GDA]… whereas Low, Low, Low, Medium, that’s a lot better, I can
understand that.”
There were shoppers who were uncomfortable working with numerical
information in any form (gram weights or %GDA), and who relied on the TL
colours and the text labels (High, Medium and Low) when they were present. On
BMRB Report: Comprehension and use of UK nutrition signpost labelling schemes 128
labels where these were not present this type of shopper found difficulty in
working with the information available to them.
• Comparisons including %GDA
The accompanied shops and bag audits had provided evidence that generally
shoppers had less understanding of %GDA than of other FOP label types (see
section 3.6) and that was also found to be the case in the depth interviews in this
element of the research. Amongst those who did understand %GDA there was a
feeling that they needed interpreting because they were aware that there were
different %GDAs for men, women and children. Most difficulties arose when
making comparisons between TL and %GDA labels. When shoppers were
unfamiliar with any type of FOP labelling scheme they were unsure where to
start. In these cases the gram weights were usually used for comparisons, but
the %GDA could then confuse shoppers, as they did not know what the
percentage referred to.
It was not unusual for shoppers to think that they needed to do some sort of
calculation to be able to make the comparison.
“If you add up the percentages… it doesn’t look like you are having to
go over half the amount in grams that you are actually eating”’
Further complications arose because shoppers did not understand how something
represented by a non-zero gram weight could be shown to be 0% of %GDA.
“I can’t grasp that one.”
Even when shoppers were unsure what %GDA meant, when %GDA was included
on both of the labels for a pair, it was not unusual for shoppers to still be able to
choose the healthier product, because they would compare the % figures and
choose the lower percentage as healthier. The shoppers who had a good
understanding of nutritional matters tended to be able to use the %GDA schemes
more easily than other shoppers. Further, there were shoppers who felt that the
%GDA was more meaningful than just having information about the gram
weights of nutrients, saying that the simple weights did not have any context.
• Comparisons of TL and non-signposting colour
The colours on %GDA labels caused confusion when making comparisons with TL
colours. Some shoppers thought that the colours on %GDA labels (both
monochrome background colours and nutrient-specific colours) were meaningful,
in the way that TL colours are meaningful (as identified in the accompanied shops
and bag audits (see section 3.6)); these were usually shoppers who were familiar
with, and often understood, the TL colour scheme.

BMRB Report: Comprehension and use of UK nutrition signpost labelling schemes 129
“I’m confused with this one, as I said, red is for danger, but that’s a
cooler colour [non-signposting coloured %GDA label], but yet it’s got
68%... in here [TL label] there is only 56%.”
“I could actually try and compare with the colours… but in here [non-
signposting coloured %GDA label] the colour codings are different. So
it’s like, I don’t know how to compare those.”
In cases where shoppers were trying to make comparisons between the colours
this could lead to them a choice based on a misunderstanding. For example on
the nutrient-specific coloured %GDA label, fat and saturates are both presented
in shades of pale green, which led to some shoppers thinking that there were low
levels of these nutrients represented on the labels, regardless of the other
information about the %GDA and the gram nutrients.
There were particular problems with shoppers thinking that the nutrient-specific
coloured %GDA labels were in fact TL type labels; when they realised the
nutrient-specific coloured %GDA labels were not TL labels, some shoppers felt
that the scheme was intended to make them view the colours in the same way as
TL labels, which they thought was trying to hide something.
“Yeah, they’re confusing because ... from when I was young, you
saw red and you know it’s a danger sign, now while some of them
are using red and some of them are not using red, then you've got
the bland, the blue, green, lighter colours ... why are they using
that? Does that mean that we shouldn't be looking at the warning
signs? … Now they’ve all got different labels and so thinking about it
now, I would probably say this is warning me that this is quite high,
looking at the red, but are they trying to mask something in the
other two products?”
This could lead to shoppers choosing the TL labels simply because they felt that
they understood them, rather than because the product they represented was
healthier.
“I’d probably just pick the… probably the colour one I would have gone
for [TL label]… it stands out more, it draws your attention to look at it
more, rather than just having a plain background.”
Making comparisons between these two types of labels usually took shoppers
longer than making comparisons between other types of labels, as they would
discuss the colours in some detail.
Less commonly shoppers thought that the monochrome %GDA colours (often
pale blue in the marketplace) were meaningful. In the accompanied shops and

BMRB Report: Comprehension and use of UK nutrition signpost labelling schemes 130
bag audits this occurred because shoppers assumed that the pale colour often
used for monochrome %GDA labels meant that the nutrient levels were low. In
this comparison work the monochrome %GDA labels were white with blue text60
and this misunderstanding happened less than in the observational work.
However, there were shoppers who assumed that these monochrome labels were
from ‘own brand’ cheap products, and thus there were assumptions that they
would be representing products which were less healthy than the comparator
label.
“It looks like it’s got something to hide.”
Confusion over gram weights
It should also be noted that it was not unusual for shoppers to misread gram
weights, for instance reading 0.5 as 5, and there were shoppers who had
difficulty in knowing whether, for example, 0.05 was more or less than 0.5; for
these shoppers making the comparisons on gram weights might have seemed
easy, because they often did not know they were making mistakes, but their
evaluations could be wrong.
10.3.4 Other factors causing difficulties
A number of other factors caused shoppers difficulties, including varying levels of
confidence, and the willingness to spend the time making hard comparisons.
Lack of confidence
Shoppers’ level of confidence was an important factor in terms of their
engagement with FOP labels. People approached the tasks in the interview in
different ways, with some shoppers thinking that the system was complicated
before they started trying to make comparisons, and who anticipated that the
task would be difficult. For those with more confidence in their abilities to
complete the tasks at hand, the comparisons were less daunting, although
ultimately no less difficult. The level of confidence appeared to be more about
people’s personalities than any demographic factors, with some people appearing
to just suppose that they would be able to do the tasks with ease, whilst others
held the opposite view. Increased familiarity with the FOP label schemes could
enhance shoppers’ confidence, and therefore their willingness to engage with the
labels.
60 Monochrome labels in the marketplace use a range of background colours. The
observational work found that these could cause confusion so a white background was
used in the test labels to prevent this being a factor in comprehension. Furthermore, it
ensured the test labels did not resemble any particular manufacturer’s FOP label format.

BMRB Report: Comprehension and use of UK nutrition signpost labelling schemes 131
Willingness to take the time needed
For shoppers who were erroneously trying to make comparisons between
different signposting methods there was often a ‘pause’ whilst they stopped trying
to make the comparison and tried to work out what the differences between the
labels were. This pause is of interest because it is the point where shoppers
reported that they would be likely to give up trying in a real life situation,
abandoning the comparison and falling back on other factors (e.g. other
information on packaging: see sections 3.5 and 3.6 for details of other factors
used in decisions). It was not unusual for shoppers to comment that they would
not have spent nearly as much time in making a comparison in real life, and that
they would have become frustrated by the effort required.
“To put it literally, it gives me a headache, and I just put it down.
Perhaps I’d just go for something I’m used to… that’s what I’d do.”
Even shoppers who had no problems in manipulating FOP information and making
comparisons during the research sometimes pointed out that they would not
normally shop like this as it was time consuming and involved significant effort.
As such, FOP labels which give a quick overview such as text, or TL colours and
supporting text were particularly popular.
Frustration
When shoppers had had difficulties making healthiness comparisons, it was not
unusual for them to feel frustrated. Feeling confused and having difficulties
caused some shoppers to question why the labels were different, and why there
was not a consistent labelling scheme across all retailers and manufacturers.
“It’s like speaking different languages. I’m trying to compare French
with German with English – why don’t we just have everything in
English, and then there’s a direct comparison? But where we’ve got
different details, it’s pretty confusing.”
“I think it would be a lot easier if they were all just the same, ‘cos I
don’t know why they’d need to be different – and you would maybe
think ”why has that got that on, and that one got that on – why are
they them colours, and they are their colours” – if they all had [label
with %GDA and TL], that would be really straightforward, you know
what the colours are, you got the grams there if you want them, and
the percentages, you can compare between.”

BMRB Report: Comprehension and use of UK nutrition signpost labelling schemes 132
10.4 Discussion and conclusions
The work exploring potential problems caused by multiple FOP label types in the
marketplace focused on the task of comparing two products as the best way of
shedding light on this issue. This approach has provided information on two
related issues:
1. Can people choose the healthier of two products, whatever signposting
information they are given?
2. Do different types of signposting help or exacerbate any difficulties in
comparing the products, and how?
These two issues are discussed below.
1. Choosing the healthier of two products
This part of the study (both quantitative and qualitative) provided further
evidence to back up the hypothesis that if one product is obviously healthier (the
same or lower on all nutrients) then shoppers can choose the healthier product
using the gram weight of nutrients alone, with signposting not obviously
facilitating this task, and no differentiation between the different types of FOP
label. Some shoppers have difficulty interpreting weights of less than one gram
(e.g. 0.5 vs. 0.05 grams of salt) but at this low level signposting is unlikely to
differentiate in any case. This does not mean, however, that shoppers do not find
signposting helpful in making comparisons, and the results of tests 1 and 2
(chapters 5 and 6) found that signposting did help shoppers interpret the
nutritional information on single product evaluations. The accompanied shops and
bag audits found that where FOP labels were used, this was most likely to be to
make comparisons between products. Whilst shoppers can reach the same
decision when making easy comparisons without signposting, if it is present they
may still use it and find it helpful.
Shoppers (and nutritionists: FSA 2008) have greater problems with hard
comparisons; for example, where one product is higher in one or two nutrients,
and the second product higher in the remaining nutrients. In order to make this
comparison, shoppers need to be able to decide which nutrients should take
priority. This can only be based on personal needs and priorities. Shoppers who
can understand gram weight of nutrients, and who are confident with FOP
signposting types can (in some cases) make a decision in these circumstances.
This decision can, however, take quite some time and, in reality, shoppers are
likely to abandon the attempt to make the comparison and come up with another
way of making a purchasing decision.

BMRB Report: Comprehension and use of UK nutrition signpost labelling schemes 133
2. Impact of different signposting methods on making hard comparisons
The qualitative work discussed in section 10.3 found that the use of different
methods of signposting exacerbates the difficulty in making hard comparisons
when there is no common signposting method used. The problems uncovered
broadly fit into two categories, similar to the categories suggested by Walsh and
Yamin (2005).
1. Signposting consistency wrongly assumed: The apparent similarity
between the TL labels, and the %GDA labels using non-signposting
nutrient-specific colours led some shoppers in the depth interviews to
believe that the pastel colours were being used to signpost the level of
nutrient. This meant the use of pale green on a %GDA label (e.g., for fat)
was interpreted as meaning a low level of fat, even though the %GDA was
high. Compared with a product with a TL label where fat is coloured amber
or red, then the %GDA labelled product could be erroneously judged
healthier in terms of fat because of this misunderstanding. Similarly the
use of a pale monochrome colour on all nutrients can be interpreted as
meaning that product is low in all nutrients, and therefore any nutrients
coloured amber or red on a TL label will be judged higher. These kinds of
misunderstanding can easily lead to an incorrect decision. Other shoppers
said the time spent trying to make this comparison would be too long in a
real life situation, and the comparison may be abandoned entirely.
2. Consistency obscured by signposting: When trying to compare a
%GDA label with a TL label, some shoppers were unable to see past the
two different types of signposting to realise that the gram weight was
present on both and could help them to make a comparison. Those less
familiar with signposting were often unsure where to start. For some, the
time taken to realise that they could compare gram weights of nutrients
meant the task took too long, and they said the comparison would have
been abandoned in a real life situation. Others fell back on any information
they recognised, in some cases choosing the label with the signposting
they felt they understood, rather than attempting any genuine
comparison.
In both cases, without considerable perseverance on the part of the shopper
(unlikely, given the time shoppers are likely to have, or want to spend on the
decision), the most likely outcome is either an erroneous or abandoned decision.
This is not to say, however, that signposting is not helpful to shoppers. The
findings of the accompanied shops and bag audits, and of the depth interviews all
suggest that shoppers do find signposting useful. Furthermore, the results of the
quantitative work described in Chapters 5-6 showed that signposting (particularly
BMRB Report: Comprehension and use of UK nutrition signpost labelling schemes 134
text, but also TL and %GDA to a lesser extent) had some influence on ability to
evaluate the level of nutrients and the overall healthiness in single products.
Furthermore, whilst signposting may not help many shoppers make comparisons
between two products, the use of consistent signposting does not hinder their
efforts, and shoppers were observed using signposting to make comparisons in
the accompanied shops and bag audits. It was the use of labels with no
signposting in common that caused shoppers difficulties in the depth interviews.
The use of standardised approach to signposting on FOP labels would overcome
this difficulty.
Use of the label containing text, TL and %GDA
The depth interviews in this stage of the research suggested that the use of a
label including TL, text and %GDA may best help shoppers to overcome some of
their problems (although not the fundamental issue of whether or not they have
the tools to make any complex comparison) for a number of reasons:
• The inclusion of text helped shoppers understand the meaning of TL
signposting, and allowed an ‘at a glance evaluation’ to be made without a
need for further interpretation. There was no evidence of text being
misunderstood. This reinforces the influence of text on comprehension in
the tests described in Chapters 5-7.
• Different shoppers found it easier to use different signposting methods and
the use of a label carrying all types ensures they have access to their
preferred mode; Those uncomfortable with numbers could use TL or text,
and those who were comfortable with %GDA (fewer shoppers) could use
the additional information it brings. This was also a finding of the
accompanied shops and bag audits
• There was no evidence that the inclusion of all three types of signposting
caused any problems identifying the relevant information. Those who had
difficulty with the label showing all three types of signposting had similar
problems with all types of FOP label in the accompanied shops, bag audits
and depth interviews.
• Shoppers found it easier to make comparisons when there was signposting
information in common on both labels (the use of this combination of
signposting ensures commonality with other labels);
Familiarity and confidence
In order for shoppers to engage with FOP labels at all, particularly in complex
comparisons, a degree of confidence is needed. Those who were more confident
in their ability to understand the labels found the tasks less daunting, even

BMRB Report: Comprehension and use of UK nutrition signpost labelling schemes 135
though they may be no more likely to be able to reach the right answer compared
with other shoppers. Increased familiarity could potentially increase this
confidence level (although there was no evidence from the tests that those more
familiar with labels would be more able to understand the information they
carried – e.g. Chapter 9). Without this confidence, shoppers may be unwilling to
engage with labels, or to expend the effort they think will be involved in using
them.
BMRB Report: Comprehension and use of UK nutrition signpost labelling schemes 136
11 Conclusions
This aim of this research was to establish which FOP labelling scheme(s), or which
combination of elements of schemes, best facilitate the accurate interpretation of
key nutritional information by consumers such that they are enabled to make
informed choices about the foods they purchase.
The research addressed three key questions:
1. How well do individual signpost schemes enable consumers to correctly
interpret levels of key nutrients? While the impact of, e.g. time
constraints, on comprehension were to be considered in this part of the
research, it did not involve testing comprehension in real life contexts.
2. How do consumers use FOP labels in the retail environment and at home?
The aim of this part of the research was to explore use in real life
contexts.
3. Does the coexistence of a range of FOP label formats affect accurate
interpretation of FOP labels?
These were addressed using an integrated programme of qualitative,
observational and quantitative work, including accompanied shops, in-store and
in-home shopping bag audits (research question 2) and a random probability
survey of 2932 shoppers in the UK (research question 1). Finally, an Omnibus
survey was used to assess comprehension when comparing between different
FOP label formats and depth interviews were conducted to explore the effect of
different label formats on use (research question 3). This mix of methods allowed
robust statistical comparisons from the quantitative work, and in depth
exploration of behaviours and attitudes from the qualitative and observational
work.
This is the first time objective understanding of the different signposting methods
has been comprehensively and robustly examined, so this research provides
important new insights into the ability of shoppers to effectively use FOP labels.
This chapter uses the evidence from the full programme of research to draw
conclusions on which signposting elements and FOP label formats best enabled
consumers to correctly interpret FOP labels, and the implications of the presence
of a variety of signposting formats in the marketplace. The conclusions are
presented around the three main research questions; the comprehension of FOP
labels (which draws primarily on the evidence presented in Chapters 5-9, with
supporting information from chapters 3, 4 and 10) the use of FOP labels (which
draws on the evidence presented in Chapters 3 and 4, and the effects of the
coexistence of a range different FOP label formats on interpretation (which draws
on the evidence presented in Chapters 3 and 10).

BMRB Report: Comprehension and use of UK nutrition signpost labelling schemes 137
11.1 Comprehension of FOP labels
This section of the conclusions chapter includes a discussion of the signposting
elements that best enable shoppers to interpret the information on FOP labels,
and a brief look at non-signposting elements of FOP labels. This is followed by a
short look at sociodemographic difference in comprehension and new insights into
the reliability of using preference as a basis for choosing label formats. It is
important to remember that the tests of objective understanding were carried out
in an interview rather than a real life situation. Findings from the accompanied
shops, bag audits and depth interviews will be used to provide further evidence of
which FOP labels best aid comprehension for shoppers.
11.1.1 Signposting methods that best enable shoppers to interpret FOP labels
This research provides, for the first time, robust quantitative data that measure
the relative influence of the three elements within the main signposting methods
currently used on FOP labels:
• Text: interpretive text (high/medium/low) indicating the level of nutrient
per 100g
• %GDA: information on the amount of nutrient per portion as a percentage
of guideline daily amount
• Traffic Lights (TL): colour coded schemes indicating the level of nutrient
per 100g
Previous work (discussed in the Scientific Rationale, Chapter 2: BMRB 2008) did
not enable any firm conclusions to be reached on which form of signposting best
enabled shoppers to interpret nutritional information. Review of the previous work
comparing TL and %GDA labels did not provide conclusive evidence on which
worked best, and none of the work on text signposting (generally regarded as
aiding interpretation of numerical information) had looked at this in the context of
TL or %GDA signposting.
The tests focused on three tasks, demonstrated to be the most likely uses of FOP
labels based on the literature, and observed and reported behaviour amongst
shoppers in the accompanied shops and bag audits:
1. Evaluating the level of individual nutrients in a product,
2. Evaluating the overall healthiness of a product, and
3. Comparing the healthiness of two products.
The third of these tasks (comparisons) did not enable any differentiation between
the different types of signposting, instead contributing more to understanding the
difficulties inherent in comparing two products.

BMRB Report: Comprehension and use of UK nutrition signpost labelling schemes 138
The two tests evaluating single products (both level of individual nutrients and
overall healthiness) did give a clearer indication of the influence of signposting on
comprehension. Analysis showed that text contributed most to comprehension
beyond the gram weight in nutrients for both tests. The inclusion of TL
signposting also significantly increased the level of shopper understanding for
both, although to a slightly lesser extent. %GDA made a significant, albeit small
contribution to shoppers’ ability to evaluate the level of nutrients in a single
product, but not to overall evaluations of healthiness. All of these contributions
were, however, fairly small (Table 11.1). For example, the greatest influence was
for text on overall healthiness evaluations: labels with text increased
comprehension by eight percentage points over those without text.
Table 11.1: Contribution of signposting elements to comprehension
(percentage point increase in comprehension compared with
labels where element is not present)
Individual nutrient
evaluation Overall healthiness
evaluation
Text 5pp 8pp Traffic Light 3pp 5pp %GDA 2pp 0pp
The inclusion of signposting does, however, have a significant and larger effect
over labels just showing the weight of nutrients in grams (Table 11.2).
Table 11.2: Contribution of signposting elements to comprehension
(percentage point increase in comprehension compared
with label with no signposting – only significant
contributions shown)
Individual nutrient
evaluation Overall healthiness
evaluation
TL & %GDA 6pp 7pp
Text 7pp 10pp
Text & %GDA 8pp 9pp
Text & TL 9pp 14pp*
Text, TL and %GDA 11pp* 12pp*
* significantly greater comprehension than TL & %GDA label
When there was no signposting present, 61% of shoppers could give the correct
level of individual nutrients, and 57% could evaluate the overall healthiness of a
product. All of the combinations of signposting shown in Table 11.2 significantly
increased this level of comprehension. Whilst there was no significant difference

BMRB Report: Comprehension and use of UK nutrition signpost labelling schemes 139
in level of comprehension between the four labels including text, the two labels
including text and TL were significantly more likely to enable shoppers to give the
correct answer than the largest number of other labels tested (including the label
with TL & %GDA).
In the accompanied shops, bag audits and depth interviews, shoppers were
confused by the presence of both TL colours and non-signposting colours on
different FOP labels. This suggests that unless colours are used consistently,
shoppers will continue to have problems understanding FOP labels. Since the
quantitative testing found that TL signposting improved comprehension, and the
labels with TL and text were significantly better than the label with %GDA and
text, this suggests that the consistent use of TL signposting would advantage
shoppers whilst avoiding confusion between TL and non-signposting colours.
Based on these findings, therefore, two labels outperformed the rest: i)
Text & TL, and ii) Text, %GDA & TL.
The research on the effects of the co-existence of a range of FOP labels in the
market place found that the presence of multiple FOP label types caused
difficulties for shoppers (see Chapter 10), which suggests that standardising to
just one label format, would help to encourage the effective use of FOP labels.
The two strongest performing labels were very close in performance on the tests,
although %GDA had a small influence on comprehension on judging the level of
individual nutrients on a product, which favours its inclusion.
There was no evidence from the research that the use of all three methods of
signposting on one label created additional difficulties or increased the danger of
misinterpretation for shoppers: in the accompanied shops, bag audits and depth
interviews shoppers who found it difficult to use this label tended to find all FOP
labels difficult to use. Other shoppers seemed to be able to extract the
information in the form they wanted to use: %GDA information for shoppers who
understand and like to use it (usually shoppers with a good understanding of
nutrition issues); TL colours for shoppers who like to have information quickly and
easily; and text for shoppers who were not confident in interpreting other label
elements, such as the colour schemes, the gram weights of nutrients or the
%GDA levels, all of which were too difficult for some to understand.
The balance of evidence therefore favours the inclusion of %GDA, which
suggests the label that would most useful to shoppers in terms of
accurate interpretation would include text, TL and %GDA.
11.1.2 Non-signposting elements of labels
The research also examined the impact of the inclusion of energy (in the form of
calories) on FOP labels. The accompanied shops and bag audits found that some

BMRB Report: Comprehension and use of UK nutrition signpost labelling schemes 140
shoppers used energy as a proxy to judge healthiness when it was present on the
labels. However, the tests found that there was no difference in the level of
correctness in evaluating product healthiness whether energy was present or not
on the labels. Shoppers are able to use information on other nutrients when
energy is not shown to come to the same decision, but observations suggest
some shoppers are comfortable using energy, and this would usually be their first
choice. The evidence suggests that some shoppers do use energy
(calories) to evaluate product healthiness but that the inclusion of
energy had no effect, either positive or negative, on comprehension.
The accompanied shops and bag audits found a potential for confusion with the
non-signposting coloured %GDA label (both monochrome and nutrient-specific),
with the colours mistakenly assigned a meaning similar to TL colours. The
quantitative testing did not, however, find that this led to any lower levels of
comprehension for non-signposting nutrient-specific %GDA labels compared with
monochrome %GDA labels.
The accompanied shops and bag audits, and the quantitative work revealed that
some shoppers thought the circular TL label was a pie chart (or looked like one),
with clear potential for misinterpretation. This was not reflected, however, in the
quantitative testing, with no difference in comprehension between the circular
presentation and horizontal presentation of the TL label.
These presentational differences were tested in the way they appear in the
marketplace (circular TL, %GDA with non-signposting nutrient specific colour).
Both of these labels performed relatively weakly compared with the horizontal
label combining text, TL and %GDA. This difference was, however, related to the
signposting element used, and not to the presentational differences, as there
were similar differences between the label combining text, TL and %GDA and
both the horizontal %GDA and circular TL labels.
Whilst the observational work identified disadvantages of the use of non-
signposting colour, and of the use of a circular presentation, these
presentational changes did not result in lower levels of comprehension in
the quantitative testing.
One further design element raised in the accompanied shops and bag audits was
the size of FOP labels: they were often regarded as too small for shoppers to read
easily. Furthermore, labels using a pale coloured background were also found
difficult to see by some shoppers, for whom they faded into the packaging.
Presentational elements which make the FOP label difficult to see or read
could be a barrier to use.

BMRB Report: Comprehension and use of UK nutrition signpost labelling schemes 141
11.1.3 Sociodemographic differences in comprehension
The quantitative testing revealed that whilst sociodemographic factors did not
generally result in a differential ability to correctly interpret different signposting
methods, there were certain sectors of the population who were less able to give
the correct answer at all tests, suggesting they had more difficulty understanding
all types of signposting and the information on FOP labels.
Less educated shoppers with a highest qualification of GCSE or below (or
equivalent) generally had more difficulty whatever signposting method was used.
Shoppers aged 65+ had more difficulty, and encountered most difficulty with
%GDA when making overall healthiness judgments. Shoppers in social grades
C2DE and shoppers self defining as non-white also had greater difficulty with
all methods of signposting. For both of these latter groups, however, the inclusion
of all three types of signposting on a label largely overcame this difference. This
suggests that there may be greater barriers to using FOP labels of any type
for these sectors of the population.
The generally high levels of comprehension, even among those who do
not currently use FOP labels, provides a good starting point from which
to address barriers to FOP label use.
11.1.4 Preference as the basis for choosing FOP label format
Shopper belief in which label was easiest to understand was shown to be a poor
indicator of ability to understand labels, demonstrating that shopper preference
alone is not a reliable basis on which to design FOP labels.
Of the labels included in the study (see section 12.3 for examples) two labels
were clearly judged by shoppers to be the easiest to understand: the label with
text, TL and %GDA for 44% of shoppers and the circular TL label (similar to the
label used by Sainsbury’s) for 32% of shoppers with no other label chosen by
more than 5% of shoppers.
If there were no difference in the level of comprehension between the two
preferred types of label, then it would be fair to use preference as one way to
differentiate between the two. Whilst there was a similar level of preference for
these two labels, the label with text, TL and %GDA was consistently one of the
best performing on the tests, whilst the circular TL label was one of the weakest.
Furthermore, shoppers who had said they thought the circular TL label was
easiest to understand were no more likely to give the right answer on tests using
this label, and neither were regular Sainsbury’s shoppers, who would have been
exposed to a similar label.
Despite being perceived as one of the easiest labels to understand, the circular TL
format was actually one of the weakest in performance, demonstrating that

BMRB Report: Comprehension and use of UK nutrition signpost labelling schemes 142
shopper preference is not a reliable basis on which to design FOP labels. The
circular traffic light was well liked despite not being well understood. This could
indicate a need for communication and reassurance for such shoppers
should a single format of FOP label other than the circular TL be
introduced.
The reasons given by shoppers for believing their choice of the label would be
easiest to understand reflected the findings of the accompanied shops, bag audits
and depth interviews. The label containing text, TL and %GDA was generally well
received as containing all necessary information (with no evidence that the
inclusion of more information carried any disadvantage), and the circular label
(similar to that used by Sainsbury’s) was well recognised and liked for its visual
appeal, but could be misunderstood, with a third of those choosing this label as
easiest to understand saying this was because they thought it was a pie chart, or
that it looked like one.
11.2 Label use
This section considers what conclusions can be drawn from the way shoppers
were observed to use FOP labels (compared with their self reported use), and
factors that influenced their use, with a particular focus on potential barriers to
using FOP labels that may need to be removed to increase successful use of FOP
labels.
11.2.1 Self reported and observed use of FOP labels
Self-reported use of FOP labels (58%) was higher than would be concluded from
observing what people actually do when they are shopping, suggesting a degree
of ‘over claiming’. In reality, other influences tended to take precedence over FOP
labels in purchasing decisions.
This reflects a known tendency for shoppers to make decisions automatically, but
then be able to post-rationalise a reason for this decision, which is not necessarily
the true reason (Bell et al, 2007). Socially desirable behaviours are particularly
often over reported, and the use of FOP labels could be seen as socially desirable
by shoppers as it demonstrates a degree of health literacy, and an interest in
healthy eating.
11.2.2 Uses of FOP labels
Prior to this research, little work had been conducted on how labels are used in
everyday life. The observational elements of the research therefore provide new
insights into how FOP labels are currently used.
Labels were more likely to be used in the retail environment than in the
home. Comparisons of products were more common than single product

BMRB Report: Comprehension and use of UK nutrition signpost labelling schemes 143
evaluations when shopping. Comparisons were carried out when considering
buying new products, when considering changing a usual purchase, or when
taking into account particular health needs (e.g. when shopping for children). FOP
labels were used by some shoppers to help plan a weight loss diet, or to manage
particular dietary needs (e.g. low salt). Even when used for these reasons, use in
the home was unusual and the FOP label was usually checked on purchase in the
store, rather than at home.
11.2.3 Factors influencing FOP label use
Previous work (e.g. Grunert and Wills, 2007) suggested that label use is
influenced by a number of factors, including those external to the shopper: both
label specific difficulties in understanding the signposting methods, and other
external factors such as other information on the packaging. They also include
factors internal to the shopper (e.g. demographics, attitudes etc). The
accompanied shops and bag audits, and the quantitative work provided evidence
of the barriers these factors could present to use of FOP labels, and ability to
objectively understand these labels.
External factors
Shoppers in the accompanied shops and bag audits often gave
precedence to other information on the packaging, such as health claims,
pictures, and detailed back of pack information on ingredients, additives etc. This
information could result in the shopper not even noticing the FOP label; this may
reflect concerns expressed by shoppers that FOP labels were seen as too small to
read easily. Even if the FOP label was noticed, other packaging
information, or factors such as price could be seen as more important
and the FOP label information ignored. Furthermore, the way the
information was presented in relation to portion size was a barrier to
comprehension for some shoppers.
Internal factors
A number of factors internal to shoppers could potentially act as barriers to
successful FOP label use. Difficulties with comprehension for specific
sociodemographic groups were discussed in section 11.1.3 and these too
could act as barriers to successful use.
• Perceived uses for FOP labels
Those shoppers observed in the accompanied shops and bag audits used FOP
labels for a variety of reasons, such as medical conditions, weight control, or
being generally health conscious (including those shopping for children). The
research showed that even shoppers who used labels might not see the need to
BMRB Report: Comprehension and use of UK nutrition signpost labelling schemes 144
use them on some products, such as those regarded as treats, products used as
basic ingredients in cooking, food seen as healthy, or food they buy habitually.
Other shoppers (not users of FOP labels) believed (for a number of reasons) that
FOP labels were not for them. This could be because the shopper felt too old to
change their habits, or that they believed they already ate healthily and knew
enough about what to buy.
Some shoppers made decisions based on more deep seated attitudes, such as
brand familiarity, products they know their family would like, and assumptions
about healthy products being less tasty.
• Attitudinal barriers to use
Some shoppers in all elements of the qualitative work expressed a
fundamental distrust of food labelling, and its aims. Some did not welcome
being told what they should and should not eat, whilst others thought that the
information on FOP labels might be manipulated by manufacturers and retailers,
only showing ‘favourable’ information. Persuading these shoppers otherwise
could be difficult, and pose a potential barrier to widening FOP label use.
• Nutritional knowledge
A lack of understanding about nutrition generally and of the nutrients included on
the FOP labels was also seen to act as a barrier to successful use in all elements
of the qualitative study. Even amongst label users there were varying levels of
understanding of the different nutrients: usually people understood one or two
nutrients which they were looking out for (often salt and fat). For the shoppers at
all stages of the qualitative study, salt was the best understood nutrient in terms
of guideline daily amounts, with saturated fats poorly understood. Some
shoppers’ lack of understanding of nutrition, healthy eating and FOP
nutrients (i.e. health literacy) are a barrier to successful interpretation
and use of FOP labels, and this would need to be addressed before FOP
could help inform food choice in these individuals.
11.3 Effects of the coexistence of a range of FOP label formats
There is evidence from the accompanied shops, bag audits and depth interviews
that the presence of different types of FOP signposting in the marketplace can
lead to difficulties for shoppers. When comparing labels using different types of
signposting, there were two main difficulties for shoppers trying to compare
products in the depth interviews:
1. Signposting consistency wrongly assumed: The belief that the use of
non-signposting colour (monochrome or nutrient specific) on %GDA labels
indicates the level of nutrient in the same way as TL colours led some
BMRB Report: Comprehension and use of UK nutrition signpost labelling schemes 145
shoppers to make incorrect comparisons, through believing that ‘cool’ non-
signposting colours (such as blue or green) indicated a low level of a
nutrient, irrespective of the actual amount in grams.
2. Consistency obscured by signposting: The presence of a different type
of signposting on each of the pair of labels meant some shoppers did not
realise that there was any common information present on both labels (at
least the weight of the nutrient in grams) that could help them to make a
comparison. Some shoppers fell back on any information they recognised,
in some cases choosing the label with the signposting they thought they
understood rather than attempting any genuine comparison.
In both of these situations shoppers said that the time taken to make the
comparison would be too long in a real life situation (e.g., in store) and that they
would abandon the attempt.
The coexistence of a range of FOP labels in the market place creates
considerable difficulty in comprehension for shoppers. This suggests
that standardising to just one label format would enhance use and
comprehension of FOP labels.
11.4 Overall conclusions
The main conclusion from the research is that, although levels of
comprehension are generally high for all FOP labels, the coexistence of a
range of FOP label formats in the marketplace causes difficulties for
shoppers. This suggests, that standardising to just one label format,
would enhance use and comprehension of FOP labels. Overall the balance
of evidence from the research shows that the strongest FOP labels are
those which combine text (high, medium, low), traffic light colours and
%GDA information.
Shoppers who use FOP labels value them, but FOP labels will always
compete with other factors when shoppers are making purchasing
decisions; these decisions are likely to be perfectly considered and are
probably not susceptible to influence. However, there is clear evidence
that some groups are less likely than others to use and understand FOP
labels and there may be scope for increasing both comprehension and
use (for certain purchasing decisions), among at least some of these
groups. The generally high levels of comprehension, even among those
who do not currently use FOP labels, provides a good starting point from
which to address barriers to FOP label use.

BMRB Report: Comprehension and use of UK nutrition signpost labelling schemes 146
12 Appendix
Further methodological and background details are included in a separate
Technical Annex to this report61.
12.1 References
Bell S, Burdon S, Gregory J, Watts J (2007) Valuing the visceral: the increasing
importance of the rapid-affective response in assessing customer behaviour.
International Journal of Market Research, 49, No 3
BMRB Social Research & University of Surrey (2008) Comprehension and use of
UK nutrition signpost labelling schemes: Scientific Rationale and Design. London:
Food Standards Agency*
Clegg S, Lawless S (2008) Comprehension and use of UK nutrition signpost
labelling schemes: Initial insights from the qualitative phase. London: Food
Standards Agency*
Cowburn G, Stockley L (2005) Consumer understanding and use of nutrition
labelling: a systematic review. Public Health Nutrition, 8, 21-28.
Food Standards Agency (2007a) Front of pack signpost labelling: exploratory
research. Gerrards Cross: Navigator.
Food Standards Agency (2007b) Investigation of consumer understanding of
sugars labelling on front of pack nutritional signposts, with specific reference to
breakfast cereals. London: COI
Food Standards Agency (2008) Independent signpost evaluation study. Defining
the correct answers: Professional nutritionists and dietitians assessment of the
relative healthiness of foods used within the main survey for the independent
signpost evaluation study. London: Project Management Panel for the
independent signpost evaluation study*
Grunert KG, Wills JM (2007) A review of European research on consumer
response to nutrition information on food labels. Journal of Public Health, 15(5),
385-399.
61 INSERT LINK TO TECHNICAL APPENDIX WHEN AVAILABLE
* these documents can be downloaded using the following link:
http://www.food.gov.uk/foodlabelling/signposting/signpostevaluation/pmpanel/evaluation/
quant/

BMRB Report: Comprehension and use of UK nutrition signpost labelling schemes 147
Leathwood PD, Richardson DP, Strater, P, Todd, PM, van Trijp, HCM (2007)
Consumer understanding of nutrition and health claims: sources of evidence.
British Journal of Nutrition, 98, 474-484
Malam S, Clegg S, Kirwan S, Lawless S, McGinigal S, Bassett C (2008)
Comprehension and use of UK nutrition signpost labelling schemes: Cognitive
Testing Report. London: Food Standards Agency*
Mitchell VW, Walsh G, Yamin M (2005) Towards a conceptual model of consumer
confusion. Advances in Consumer Research, 32, 143-150
de Zoysa L, Habicht JP, Pelto G, Martines J (1998) Research steps in the
development and evaluation of public health interventions. Bulletin of the World
Health Organisation, 76, 127-133
Details of further references used in designing this study were included in the
Scientific Rationale document (BMRB & University of Surrey, 2008)
* these documents can be downloaded using the following link:
http://www.food.gov.uk/foodlabelling/signposting/signpostevaluation/pmpanel/evaluation/
quant/

BMRB Report: Comprehension and use of UK nutrition signpost labelling schemes 148
12.2 Examples of labels in the marketplace
%GDA
CaloriesCalories256256
SugarSugar3.1g3.1g
FatFat4.8g4.8g
SaturatesSaturates1.4g1.4g
SaltSalt1.1g1.1g
13%13% 4%4% 7%7% 7%7% 19%19%
Traffic lights
Combined TL and %GDA

BMRB Report: Comprehension and use of UK nutrition signpost labelling schemes 149
12.3 Examples of labels used in tests
1 FAT
19%
13.2g
MED
SALT
33%
2g
MED
SATURATES
40%
8.0g
HIGH
CALORIES SUGARS
OF YOUR GUIDELINE DAILY AMOUNT
12%
10.8g360
LOW
Each serving contains …
18%
MED
READY MEAL. 400g. CONTAINS 1 SERVING
FAT
19%
13.2g
MED
SALT
33%
2g
MED
SATURATES
40%
8.0g
HIGH
CALORIES SUGARS
OF YOUR GUIDELINE DAILY AMOUNT
12%
10.8g360
LOW
Each serving contains …
18%
MED
READY MEAL. 400g. CONTAINS 1 SERVING
2 FAT
13.2g
MED
SALT
2g
MED
SATURATES
8.0g
HIGH
SUGARS
10.8g
LOW
Each serving contains …
CALORIES
360
MED
READY MEAL. 400g. CONTAINS 1 SERVING
FAT
13.2g
MED
SALT
2g
MED
SATURATES
8.0g
HIGH
SUGARS
10.8g
LOW
Each serving contains …
CALORIES
360
MED
READY MEAL. 400g. CONTAINS 1 SERVING
3 FAT
19%
13.2g
SALT
33%
2g
SATURATES
40%
8.0g
SUGARS
OF YOUR GUIDELINE DAILY AMOUNT
12%
10.8g
READY MEAL. 400g. CONTAINS 1 SERVING
Each serving contains …
CALORIES
360
18%
FAT
19%
13.2g
SALT
33%
2g
SATURATES
40%
8.0g
SUGARS
OF YOUR GUIDELINE DAILY AMOUNT
12%
10.8g
READY MEAL. 400g. CONTAINS 1 SERVING
Each serving contains …
CALORIES
360
18%
4 FAT
13.2g
SALT
2g
SATURATES
8.0g
SUGARS
10.8g
Each serving contains …
CALORIES
360
READY MEAL. 400g. CONTAINS 1 SERVING
FAT
13.2g
SALT
2g
SATURATES
8.0g
SUGARS
10.8g
Each serving contains …
CALORIES
360
READY MEAL. 400g. CONTAINS 1 SERVING
5
19% 33%40% 12%
FAT
13.2g
SALT
2g
SATURATES
8.0g
SUGARS
10.8g
MED MEDHIGH LOW
OF YOUR GUIDELINE DAILY AMOUNT
Each serving contains …
CALORIES
360
18%
MED
READY MEAL. 400g. CONTAINS 1 SERVING
19% 33%40% 12%
FAT
13.2g
SALT
2g
SATURATES
8.0g
SUGARS
10.8g
MED MEDHIGH LOW
OF YOUR GUIDELINE DAILY AMOUNT
Each serving contains …
CALORIES
360
18%
MED
READY MEAL. 400g. CONTAINS 1 SERVING
6
Each serving contains …
FAT
13.2g
MED
SALT
2g
MED
SATURATES
8.0g
HIGH
SUGARS
10.8g
LOW
CALORIES
360
MED
READY MEAL. 400g. CONTAINS 1 SERVING
Each serving contains …
FAT
13.2g
MED
SALT
2g
MED
SATURATES
8.0g
HIGH
SUGARS
10.8g
LOW
CALORIES
360
MED
READY MEAL. 400g. CONTAINS 1 SERVING
7
OF YOUR GUIDELINE DAILY AMOUNT
Each serving contains …
FAT
19%
13.2g
SALT
33%
2g
SATURATES
40%
8.0g
SUGARS
12%
10.8g
CALORIES
360
18%
READY MEAL. 400g. CONTAINS 1 SERVING
OF YOUR GUIDELINE DAILY AMOUNT
Each serving contains …
FAT
19%
13.2g
SALT
33%
2g
SATURATES
40%
8.0g
SUGARS
12%
10.8g
CALORIES
360
18%
READY MEAL. 400g. CONTAINS 1 SERVING
8
Each serving contains …
FAT
13.2g
SALT
2g
SATURATES
8.0g
CALORIES SUGARS
10.8g360
READY MEAL. 400g. CONTAINS 1 SERVING
Each serving contains …
FAT
13.2g
SALT
2g
SATURATES
8.0g
CALORIES SUGARS
10.8g360
READY MEAL. 400g. CONTAINS 1 SERVING
9
OF YOUR GUIDELINE DAILY AMOUNT
Each serving contains …
FAT
19%
13.2g
SALT
33%
2g
SATURATES
40%
8.0g
SUGARS
12%
10.8g
CALORIES
360
18%
READY MEAL. 400g. CONTAINS 1 SERVING
OF YOUR GUIDELINE DAILY AMOUNT
Each serving contains …
FAT
19%
13.2g
SALT
33%
2g
SATURATES
40%
8.0g
SUGARS
12%
10.8g
CALORIES
360
18%
OF YOUR GUIDELINE DAILY AMOUNT
Each serving contains …
FAT
19%
13.2g
SALT
33%
2g
SATURATES
40%
8.0g
SUGARS
12%
10.8g
CALORIES
360
18%
READY MEAL. 400g. CONTAINS 1 SERVING
10
CALORIES360
FAT13.2g
SATURATES8.0g
SUGARS10.8g
SALT2g
Each serving contains …
READY MEAL. 400g. CONTAINS 1 SERVING
CALORIES360
FAT13.2g
SATURATES8.0g
SUGARS10.8g
SALT2g
Each serving contains …
READY MEAL. 400g. CONTAINS 1 SERVING
BMRB Report: Comprehension and use of UK nutrition signpost labelling schemes 150
12.4 Details of significance testing
The test data:
Differences in percentages in level of correctness at the tests were tested for
statistical significance using t-tests or chi-squared tests as appropriate (see
section 12.4 for further detail). , incorporating an estimated design effect of 1.35
(see Technical Annex section 2.1). Chi-squared tests were used for testing
differences in level of correctness between subgroups with more than two
categories (e.g. age in bands of 10 years). Whilst chi-squared tests should be
used for all categorical variables, t-tests were instead used for subgroups with
only two categories (e.g. sex) as this allowed the design effect to be incorporated
into the test.
Non-test questions
Chapter 4 contains data on self reported use and attitudes. This are reported in
terms of percentages. Differences by subgroup (e.g. age, sex) were tested for
statistical significance in one of two ways:
i. Whilst chi-square tests should be used for all categorical variables, these
do not allow a design effect to be taken into account. Therefore, where a
subgroup only contains two categories (e.g. sex) differences in
percentages were tested for statistical significance using t-tests,
incorporating the estimated design effect of 1.35 (see Technical Annex
section 2.1). Only observed differences that were statistically significant
(p<0.05) are reported as differences. If an apparent difference is
discussed that is not statistically significant, this will be explicitly stated in
the text. All other differences that are reported can be assumed to be
significant.
ii. Where there are three or more subgroups (e.g. age in bands of ten years)
chi-squared tests are instead used. Only observed differences that were
statistically significant using these tests are reported. As noted above this
test can not incorporate the design effect. To confirm such differences, t-
tests incorporating the design effect were also used to check that the
difference between the highest and lowest subgroup was significant.