A novel profile based model for virtual representation of quasi-symmetric plant organs
12
Computers and Electronics in Agriculture 75 (2011) 113–124 Contents lists available at ScienceDirect Computers and Electronics in Agriculture journal homepage: www.elsevier.com/locate/compag Original paper A novel profile based model for virtual representation of quasi-symmetric plant organs H.K. Mebatsion a,∗ , F. Boudon c , C. Godin c , C. Pradal c , M. Génard b , C. Goz-Bac d , N. Bertin b a Biosystems Engineering, University of Manitoba, 75 Chancellors Circle, R3T 5V6, MB, Canada b UR 1115, Plantes et Systèmes de culture Horticoles, INRA, Domaine St Paul, Site Agroparc, 84914 Avignon Cedex 9, France c UMR DAP, Virtual Plants, CIRAD INRIA, TA40/02, Cirad, Avenue Agropolis, 34398 Montpellier Cedex 5, France d UMR5587 Bio-nano NMRI Group, University of Montpellier 2, Montpellier, France article info Article history: Received 30 April 2010 Received in revised form 4 October 2010 Accepted 7 October 2010 Keywords: Organ modeling Fourier descriptors Multiscale modeling Virtual fruits abstract A novel modeling procedure for semi-symmetrical plant organs using longitudinal and transverse organ profiles was developed to simplify and improve virtual organ representation. Fruits were used as model organs. The fruits were divided into halves to capture the fruit profile. Using a regular photo camera (Nikon-Coolpix 4500), and an in-house image acquisition setup, the half fruit images were captured. In-house Matlab (The Mathworks, Natick, MA) based program was used to determine the boundaries of the digitized images. Based on the boundary points, and using Fourier series approximation, the image boundaries were defined mathematically. Fourier series approximation defines boundary shapes using the sum of sine and cosine terms. Based on the Fourier descriptors, which are coefficients of the Fourier series approximation, fruit contours were extracted. Surface construction algorithms based on smoothed contour boundaries were developed. Because of non-axis symmetricity of most fruits, and the presence of surface perturbations, for example, carpels in tomato fruits, models based on only longitudinal cross sections were not satisfactory. A complete fruit model was finally developed by combining the longitu- dinal cross section of half fruits and the transverse cross section of whole fruits. To our knowledge, this is the first realistic geometrical fruit model that captures the fruit shape complexities. Such a model may be useful to analyze the genetic and environmental controls of fruit morphological and biochemical prop- erties. Our modeling approach has limitation in producing geometric models for unusual curved shape plant organs such as banana, cucumbers, cassava and Jerusalem artichoke that are not quasi-symmetrical along the longitudinal axis. © 2010 Elsevier B.V. All rights reserved. 1. Introduction Shape of biological organs is one of the most important factors that affect transport phenomena (Saudreau et al., 2007; Nguyen et al., 2007), transportation, and mechanical vibration that occur during harvesting, handling and processing (Jancsók et al., 2001). However, the large genetic diversity of size and shapes, for instance in tomato fruit (Tanksley, 2004), is poorly understood although it is a main asset for the diversification of production and mar- ket segmentation. Multiscale modeling of processes is a new scheme for estimating material properties or system behavior of the macroscale using microscale model information based homog- enization procedures (Moulton et al., 1998). For accurate multiscale simulations, a microscale model that captures the arrangement of ∗ Corresponding author. Tel.: +1 204 747 7966; fax: +1 204 474 7512. E-mail addresses: hk [email protected], [email protected] (H.K. Mebatsion). cells and intercellular spaces of different tissues and a macroscale model that details organ surface profiles have to be resolved (Mebatsion et al., 2006a, 2006b, 2008). Transport and process modeling (Saudreau et al., 2007; Khanali et al., 2007) and investigation of the resonance frequencies and dynamic behavior of fruits such as apples (Chen and De Baerdemaeker, 1993), peaches (Verstreken and De Baerdemaeker, 1994), melons (Chen et al., 1996) and tomatoes (Langenakens et al., 1997) have often been modeled by taking biological organs as sim- plified spherical geometries. However, the sphericity assumption does not always hold and many important process details can be lost as a result. Hence, the construction of geometric models that yield realistic shapes is crucial in understanding the physical and transport properties associated with the biological organs. Most macroscale biological geometric organ models such as fruits have usually been based on the reconstruction of scanned images in the form of 3D points on the surface of photographs, video recordings, computed tomography (CT) or nuclear magnetic reso- nance (NMR) images (Moustakides et al., 2000; Jancsók et al., 2001; 0168-1699/$ – see front matter © 2010 Elsevier B.V. All rights reserved. doi:10.1016/j.compag.2010.10.006
Transcript of A novel profile based model for virtual representation of quasi-symmetric plant organs
O
Ap
Ha
b
c
d
a
ARRA
KOFMV
1
tedHiikstes
h
0d
Computers and Electronics in Agriculture 75 (2011) 113–124
Contents lists available at ScienceDirect
Computers and Electronics in Agriculture
journa l homepage: www.e lsev ier .com/ locate /compag
riginal paper
novel profile based model for virtual representation of quasi-symmetriclant organs
.K. Mebatsiona,∗, F. Boudonc, C. Godinc, C. Pradal c, M. Génardb, C. Goz-Bacd, N. Bertinb
Biosystems Engineering, University of Manitoba, 75 Chancellors Circle, R3T 5V6, MB, CanadaUR 1115, Plantes et Systèmes de culture Horticoles, INRA, Domaine St Paul, Site Agroparc, 84914 Avignon Cedex 9, FranceUMR DAP, Virtual Plants, CIRAD INRIA, TA40/02, Cirad, Avenue Agropolis, 34398 Montpellier Cedex 5, FranceUMR5587 Bio-nano NMRI Group, University of Montpellier 2, Montpellier, France
r t i c l e i n f o
rticle history:eceived 30 April 2010eceived in revised form 4 October 2010ccepted 7 October 2010
eywords:rgan modelingourier descriptorsultiscale modeling
irtual fruits
a b s t r a c t
A novel modeling procedure for semi-symmetrical plant organs using longitudinal and transverse organprofiles was developed to simplify and improve virtual organ representation. Fruits were used as modelorgans. The fruits were divided into halves to capture the fruit profile. Using a regular photo camera(Nikon-Coolpix 4500), and an in-house image acquisition setup, the half fruit images were captured.In-house Matlab (The Mathworks, Natick, MA) based program was used to determine the boundaries ofthe digitized images. Based on the boundary points, and using Fourier series approximation, the imageboundaries were defined mathematically. Fourier series approximation defines boundary shapes usingthe sum of sine and cosine terms. Based on the Fourier descriptors, which are coefficients of the Fourierseries approximation, fruit contours were extracted. Surface construction algorithms based on smoothedcontour boundaries were developed. Because of non-axis symmetricity of most fruits, and the presenceof surface perturbations, for example, carpels in tomato fruits, models based on only longitudinal cross
sections were not satisfactory. A complete fruit model was finally developed by combining the longitu-dinal cross section of half fruits and the transverse cross section of whole fruits. To our knowledge, this isthe first realistic geometrical fruit model that captures the fruit shape complexities. Such a model may beuseful to analyze the genetic and environmental controls of fruit morphological and biochemical prop-erties. Our modeling approach has limitation in producing geometric models for unusual curved shapeplant organs such as banana, cucumbers, cassava and Jerusalem artichoke that are not quasi-symmetricalis.
along the longitudinal ax. Introduction
Shape of biological organs is one of the most important factorshat affect transport phenomena (Saudreau et al., 2007; Nguyent al., 2007), transportation, and mechanical vibration that occururing harvesting, handling and processing (Jancsók et al., 2001).owever, the large genetic diversity of size and shapes, for instance
n tomato fruit (Tanksley, 2004), is poorly understood althought is a main asset for the diversification of production and mar-et segmentation. Multiscale modeling of processes is a new
cheme for estimating material properties or system behavior ofhe macroscale using microscale model information based homog-nization procedures (Moulton et al., 1998). For accurate multiscaleimulations, a microscale model that captures the arrangement of∗ Corresponding author. Tel.: +1 204 747 7966; fax: +1 204 474 7512.E-mail addresses: hk [email protected],
[email protected] (H.K. Mebatsion).
168-1699/$ – see front matter © 2010 Elsevier B.V. All rights reserved.oi:10.1016/j.compag.2010.10.006
© 2010 Elsevier B.V. All rights reserved.
cells and intercellular spaces of different tissues and a macroscalemodel that details organ surface profiles have to be resolved(Mebatsion et al., 2006a, 2006b, 2008).
Transport and process modeling (Saudreau et al., 2007; Khanaliet al., 2007) and investigation of the resonance frequenciesand dynamic behavior of fruits such as apples (Chen and DeBaerdemaeker, 1993), peaches (Verstreken and De Baerdemaeker,1994), melons (Chen et al., 1996) and tomatoes (Langenakens et al.,1997) have often been modeled by taking biological organs as sim-plified spherical geometries. However, the sphericity assumptiondoes not always hold and many important process details can belost as a result. Hence, the construction of geometric models thatyield realistic shapes is crucial in understanding the physical andtransport properties associated with the biological organs.
Most macroscale biological geometric organ models such asfruits have usually been based on the reconstruction of scannedimages in the form of 3D points on the surface of photographs, videorecordings, computed tomography (CT) or nuclear magnetic reso-nance (NMR) images (Moustakides et al., 2000; Jancsók et al., 2001;
1 lectro
Bisd3m(2dtdtpcki(
mtewwmrrAdscttbtmaiat1ttiadc
ompttuftcinptsm
bKs
14 H.K. Mebatsion et al. / Computers and E
enko et al., 2001). In a typical photographic experiment, the objects placed on a rotating surface to get 2D snapshots differing bymall angles. The 3D coordinates of the corresponding the longitu-inal cross section is determined using digitization procedures. TheD points are then converted into mathematically expressed geo-etrical models using the non-uniform rational B-splines (NURBS)
Barron et al., 1994; Dimas and Briassoulis, 1999; Moustakides et al.,000). Jancsók et al. (2001) forwarded an organ modeling proce-ure using contours of the photographic images at different angleso reconstruct the 3D geometrical model using shape functionsefining radial distance as a function of rotational angle. However,he procedures are entailed with serious drawbacks: (i) it cannotroduce acceptable geometrical model for fruit tissues which haveoncave regions in their macrostructure (e.g., apple, tomato, pump-ins); (ii) the procedure involves a set of steps that needs humanntervention such as model beautification (Benko et al., 2001); andiii) the procedures are lengthy and can’t be automated.
On the other hand, there have been some efforts exerted toodel solid geometries by introducing a kind of free form deforma-
ion (FFD) algorithm (Barr, 1984; Sederberg and Parry, 1986; Hsut al., 1992). Deformations allow the user to treat a solid as if itere constructed from a special type of topological putty or clayhich can be transformed repeatedly. Barr’s global and local defor-ation belongs to the class in which deformations such as scaling,
otating, tapering, twisting, bending or the combination of them areepresented as the matrix function of location of the space points.nother kind of deformation method was space deformation intro-uced by Borrel and Bechmann (1991). The deformation of object isimply specified by the displacements of arbitrary selected pointsalled constraints. The size and the boundary of a bounding box cen-ered around each constrained point allow control of the extent ofhe deformation. Depending on this extent, the whole object cane included (global deformation) or only a limited area aroundhe constraint point (local deformation). A large range of defor-
ation shapes such as arbitrary shaped bumps can be designed. Inll of these deformations, deformation is controlled by reposition-ng control points which unfortunately may become cumbersomes the displaying of the lattice (control points connected in a grid)ends to cluster and obscure the object being created (Hsu et al.,992) and even worse, some lattice points may be hidden withinhe object (Gain and Dodgson, 1999; Hsu et al., 1992). Parametershat designers can utilize differ according to surface representation,.e. users should remember the kind of parameters they have used tolter shapes of objects. Moreover, deforming effects of parametersiffer from each other and it is difficult to predict what deformationan be obtained after several parameter changes.
Recently, Ling et al. (2007) proposed a mathematical techniquef defining shapes using ellipsoid parametric equations. Any geo-etrical shape was defined as the summation of the ellipsoid
arametric function and a set of perturbation functions that capturehe surface irregularities such as concave basipetal or convex dis-al ends and longitudinal profiles such as carpels in tomato fruits,sing power and sine functions, respectively. For example, an appleruit was defined by three radii and two perturbation functionshat capture the basipetal and the distal concave shapes. The shapeoefficients were determined experimentally. Though simple tomplement and produce virtual geometric models, the determi-ation of shape coefficients that characterize concave and carpelrofiles of the actual geometry is not straightforward. Moreover,he shape profiles using mathematical expressions tend to produceymmetrical geometric parts such as symmetrical carpels, which
ight not be the case in reality.An image-based realistic geometric modeling of fruits (apple)ased on reconstruction of slices of fruits was presented byafashan et al. (2006). The procedure involved process steps fromlicing the fruits to image acquisition and finally to the extraction
nics in Agriculture 75 (2011) 113–124
of data for the final 3D shape. The core principle behind the model-ing technique is that the geometric details are increased by takingnumerous fruit slices. Though the resulting geometries are real-istic 3D fruit geometries with a union of virtual fruit slices, themethod is time consuming, labor intensive, highly destructive, withthe necessity of dividing a fruit up to 16 slices, and is only applica-ble to plant organs of high water content. Lower water plant organsmight break when subdivided.
The aim of this research paper, therefore, is to present a newless destructive organ geometric modeling technique that producesrealistic geometric models based on organ transverse cross sectionand half organ longitudinal profiles. The half organ images give usprofile details showing both concave and convex regions of organs;and the transverse cross section captures profile details of thesurface perturbations. Convex organ geometries can be modeledcompletely non-destructively – two longitudinal cross sectionsdefine vertical shape profiles and the transverse cross section cap-tures surface perturbations. In this respect, the procedures weproposed can easily be automated to generate virtual plant organmodels.
2. Materials and methods
2.1. Sample preparation, image acquisition and boundarydetection
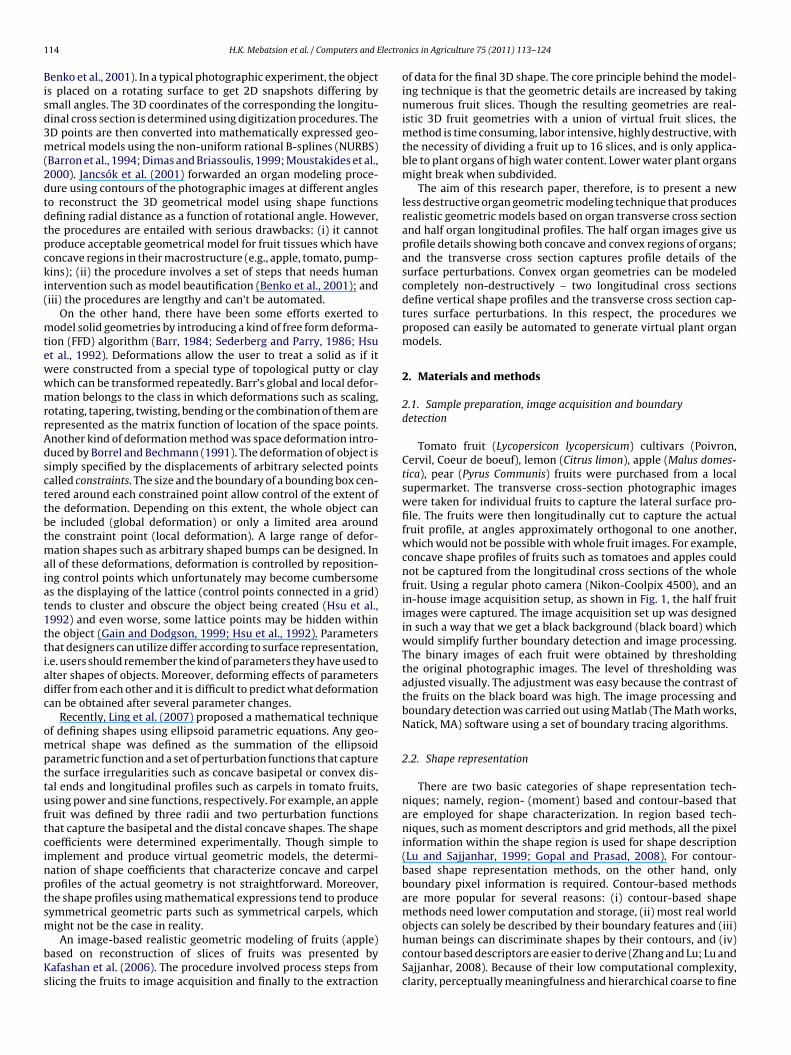
Tomato fruit (Lycopersicon lycopersicum) cultivars (Poivron,Cervil, Coeur de boeuf), lemon (Citrus limon), apple (Malus domes-tica), pear (Pyrus Communis) fruits were purchased from a localsupermarket. The transverse cross-section photographic imageswere taken for individual fruits to capture the lateral surface pro-file. The fruits were then longitudinally cut to capture the actualfruit profile, at angles approximately orthogonal to one another,which would not be possible with whole fruit images. For example,concave shape profiles of fruits such as tomatoes and apples couldnot be captured from the longitudinal cross sections of the wholefruit. Using a regular photo camera (Nikon-Coolpix 4500), and anin-house image acquisition setup, as shown in Fig. 1, the half fruitimages were captured. The image acquisition set up was designedin such a way that we get a black background (black board) whichwould simplify further boundary detection and image processing.The binary images of each fruit were obtained by thresholdingthe original photographic images. The level of thresholding wasadjusted visually. The adjustment was easy because the contrast ofthe fruits on the black board was high. The image processing andboundary detection was carried out using Matlab (The Math works,Natick, MA) software using a set of boundary tracing algorithms.
2.2. Shape representation
There are two basic categories of shape representation tech-niques; namely, region- (moment) based and contour-based thatare employed for shape characterization. In region based tech-niques, such as moment descriptors and grid methods, all the pixelinformation within the shape region is used for shape description(Lu and Sajjanhar, 1999; Gopal and Prasad, 2008). For contour-based shape representation methods, on the other hand, onlyboundary pixel information is required. Contour-based methodsare more popular for several reasons: (i) contour-based shapemethods need lower computation and storage, (ii) most real world
objects can solely be described by their boundary features and (iii)human beings can discriminate shapes by their contours, and (iv)contour based descriptors are easier to derive (Zhang and Lu; Lu andSajjanhar, 2008). Because of their low computational complexity,clarity, perceptually meaningfulness and hierarchical coarse to fine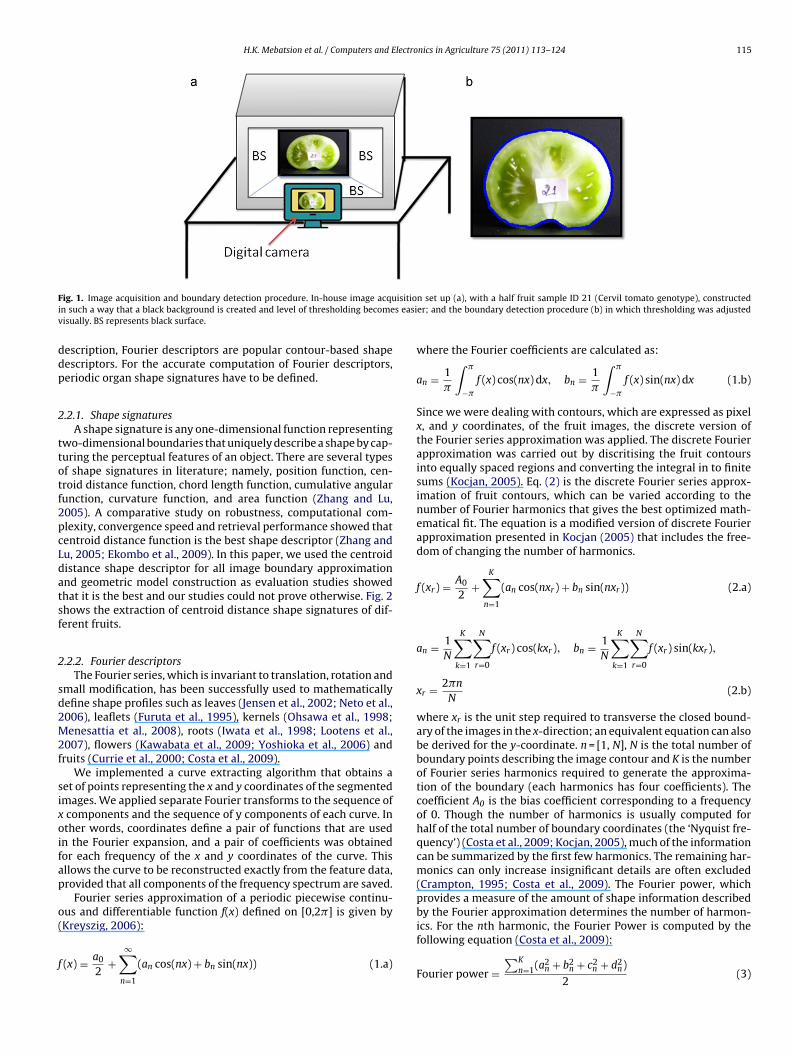
H.K. Mebatsion et al. / Computers and Electronics in Agriculture 75 (2011) 113–124 115
F isitioi s easiv
ddp
2
ttotf2pcLdatsf
2
sd2M2f
sixoifap
o(
f
ig. 1. Image acquisition and boundary detection procedure. In-house image acqun such a way that a black background is created and level of thresholding becomeisually. BS represents black surface.
escription, Fourier descriptors are popular contour-based shapeescriptors. For the accurate computation of Fourier descriptors,eriodic organ shape signatures have to be defined.
.2.1. Shape signaturesA shape signature is any one-dimensional function representing
wo-dimensional boundaries that uniquely describe a shape by cap-uring the perceptual features of an object. There are several typesf shape signatures in literature; namely, position function, cen-roid distance function, chord length function, cumulative angularunction, curvature function, and area function (Zhang and Lu,005). A comparative study on robustness, computational com-lexity, convergence speed and retrieval performance showed thatentroid distance function is the best shape descriptor (Zhang andu, 2005; Ekombo et al., 2009). In this paper, we used the centroidistance shape descriptor for all image boundary approximationnd geometric model construction as evaluation studies showedhat it is the best and our studies could not prove otherwise. Fig. 2hows the extraction of centroid distance shape signatures of dif-erent fruits.
.2.2. Fourier descriptorsThe Fourier series, which is invariant to translation, rotation and
mall modification, has been successfully used to mathematicallyefine shape profiles such as leaves (Jensen et al., 2002; Neto et al.,006), leaflets (Furuta et al., 1995), kernels (Ohsawa et al., 1998;enesattia et al., 2008), roots (Iwata et al., 1998; Lootens et al.,
007), flowers (Kawabata et al., 2009; Yoshioka et al., 2006) andruits (Currie et al., 2000; Costa et al., 2009).
We implemented a curve extracting algorithm that obtains aet of points representing the x and y coordinates of the segmentedmages. We applied separate Fourier transforms to the sequence ofcomponents and the sequence of y components of each curve. Inther words, coordinates define a pair of functions that are usedn the Fourier expansion, and a pair of coefficients was obtainedor each frequency of the x and y coordinates of the curve. Thisllows the curve to be reconstructed exactly from the feature data,rovided that all components of the frequency spectrum are saved.
Fourier series approximation of a periodic piecewise continu-us and differentiable function f(x) defined on [0,2�] is given by
Kreyszig, 2006):(x) = a0
2+
∞∑n=1
(an cos(nx) + bn sin(nx)) (1.a)
n set up (a), with a half fruit sample ID 21 (Cervil tomato genotype), constructeder; and the boundary detection procedure (b) in which thresholding was adjusted
where the Fourier coefficients are calculated as:
an = 1�
∫ �
−�
f (x) cos(nx) dx, bn = 1�
∫ �
−�
f (x) sin(nx) dx (1.b)
Since we were dealing with contours, which are expressed as pixelx, and y coordinates, of the fruit images, the discrete version ofthe Fourier series approximation was applied. The discrete Fourierapproximation was carried out by discritising the fruit contoursinto equally spaced regions and converting the integral in to finitesums (Kocjan, 2005). Eq. (2) is the discrete Fourier series approx-imation of fruit contours, which can be varied according to thenumber of Fourier harmonics that gives the best optimized math-ematical fit. The equation is a modified version of discrete Fourierapproximation presented in Kocjan (2005) that includes the free-dom of changing the number of harmonics.
f (xr) = A0
2+
K∑n=1
(an cos(nxr) + bn sin(nxr)) (2.a)
an = 1N
K∑k=1
N∑r=0
f (xr) cos(kxr), bn = 1N
K∑k=1
N∑r=0
f (xr) sin(kxr),
xr = 2�n
N(2.b)
where xr is the unit step required to transverse the closed bound-ary of the images in the x-direction; an equivalent equation can alsobe derived for the y-coordinate. n = [1, N], N is the total number ofboundary points describing the image contour and K is the numberof Fourier series harmonics required to generate the approxima-tion of the boundary (each harmonics has four coefficients). Thecoefficient A0 is the bias coefficient corresponding to a frequencyof 0. Though the number of harmonics is usually computed forhalf of the total number of boundary coordinates (the ‘Nyquist fre-quency’) (Costa et al., 2009; Kocjan, 2005), much of the informationcan be summarized by the first few harmonics. The remaining har-monics can only increase insignificant details are often excluded(Crampton, 1995; Costa et al., 2009). The Fourier power, whichprovides a measure of the amount of shape information describedby the Fourier approximation determines the number of harmon-
ics. For the nth harmonic, the Fourier Power is computed by thefollowing equation (Costa et al., 2009):Fourier power =∑K
n=1(a2n + b2
n + c2n + d2
n)
2(3)

116 H.K. Mebatsion et al. / Computers and Electronics in Agriculture 75 (2011) 113–124
F n(c) ad gnatu
Tapp
2
2
msao
f
wD
A
ig. 2. The centroid distance shape signatures of Granny smith apple (a) and lemoetermined based on the contour of the fruit (Mebatsion et al., 2006a). The shape si
he Fourier harmonics was truncated at the value K, at which theverage cumulative power was 99.99% or more of the total averageower, calculated with Kmax, equal to half the number of boundaryoints and an, bn, cn, dn are Fourier coefficients.
.3. Surface reconstruction
.3.1. Geometric construction via surface revolutionThe geometric models constructed via surface revolution are
odeled by revolving two-dimensional profiles about an axis inpace. Therefore, surface revolution R can be generated by rotatingplane curve, f about its coplanar axis o. Let the half profile of anrgan be given by:
� � �
(t) = x(t) · i + y(t) · j + z(t) · k t ∈ [t0, t1] (4.a)here the condition of co-planarity is valid with constants A, B, C,:
· x(t) · �i + B · y(t) · �j + C · z(t) · �k + D = 0 (4.b)
re shown in (b) and (d), respectively. The centroids of the fruit half contours werere is then defined as the radial distance as a function of clockwise angular measure.
and the axis of revolution by its vector o = (ox, oy, oz), and one pointon O(Ox, Oy, Oz). Simplifications can be made by assuming the axisof revolution to coincide with one coordinate axis, say z-axis, andits coplanar profile lies on one coordinate plane (Oyz plane). Hence,the half profile can have the form:
f (t) = y(t) · �j + z(t) · �k t ∈ [t0, t1]x(t) = 0
(4.c)
and the axis o, of its vector (0, 0, 1) through the coordinate origin.The surface of revolution generated by revolving the half profile(4.c) about the axis is given by:
R(t, �) = y(t) cos(�) · �i + y(t) · sin(�) · �j + z(t)
· �k t = [t , t ], � = [0, 2�] (5)
0 1In other words, a certain point on the half contour F(0, y(tF), z(tF))rotates about the axis o into a point FR(y(tF) cos(�F), y(tF) sin(�F),z(tF)). The surface construction procedure based on half profile of
H.K. Mebatsion et al. / Computers and Electronics in Agriculture 75 (2011) 113–124 117
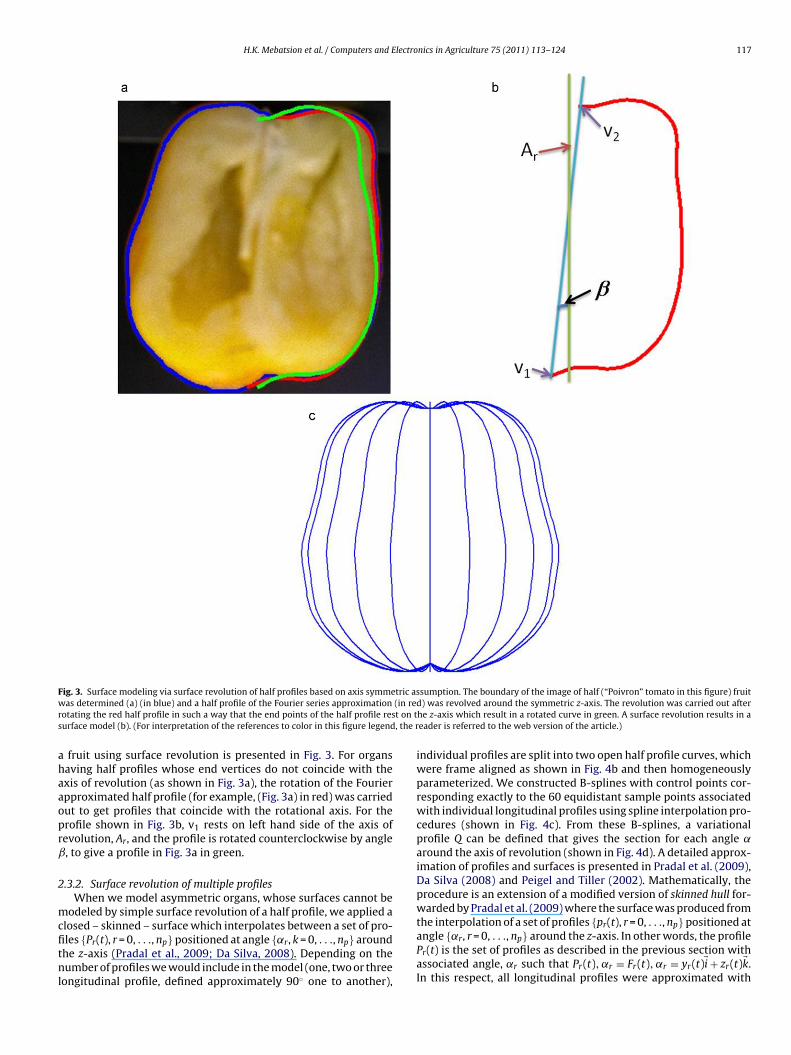
F tric asw (in rer t on ts , the r
ahaaoprˇ
2
mcfitnl
ig. 3. Surface modeling via surface revolution of half profiles based on axis symmeas determined (a) (in blue) and a half profile of the Fourier series approximation
otating the red half profile in such a way that the end points of the half profile resurface model (b). (For interpretation of the references to color in this figure legend
fruit using surface revolution is presented in Fig. 3. For organsaving half profiles whose end vertices do not coincide with thexis of revolution (as shown in Fig. 3a), the rotation of the Fourierpproximated half profile (for example, (Fig. 3a) in red) was carriedut to get profiles that coincide with the rotational axis. For therofile shown in Fig. 3b, v1 rests on left hand side of the axis ofevolution, Ar, and the profile is rotated counterclockwise by angle, to give a profile in Fig. 3a in green.
.3.2. Surface revolution of multiple profilesWhen we model asymmetric organs, whose surfaces cannot be
odeled by simple surface revolution of a half profile, we applied a
losed – skinned – surface which interpolates between a set of pro-les {Pr(t), r = 0, . . ., np}positioned at angle {˛r, k = 0, . . ., np} aroundhe z-axis (Pradal et al., 2009; Da Silva, 2008). Depending on theumber of profiles we would include in the model (one, two or threeongitudinal profile, defined approximately 90◦ one to another),
sumption. The boundary of the image of half (“Poivron” tomato in this figure) fruitd) was revolved around the symmetric z-axis. The revolution was carried out afterhe z-axis which result in a rotated curve in green. A surface revolution results in aeader is referred to the web version of the article.)
individual profiles are split into two open half profile curves, whichwere frame aligned as shown in Fig. 4b and then homogeneouslyparameterized. We constructed B-splines with control points cor-responding exactly to the 60 equidistant sample points associatedwith individual longitudinal profiles using spline interpolation pro-cedures (shown in Fig. 4c). From these B-splines, a variationalprofile Q can be defined that gives the section for each angle ˛around the axis of revolution (shown in Fig. 4d). A detailed approx-imation of profiles and surfaces is presented in Pradal et al. (2009),Da Silva (2008) and Peigel and Tiller (2002). Mathematically, theprocedure is an extension of a modified version of skinned hull for-warded by Pradal et al. (2009) where the surface was produced from
the interpolation of a set of profiles {pr(t), r = 0, . . ., np}positioned atangle {˛r, r = 0, . . ., np} around the z-axis. In other words, the profilePr(t) is the set of profiles as described in the previous section withassociated angle, ˛r such that Pr(t), ˛r = Fr(t), ˛r = yr(t)�i + zr(t)�k.In this respect, all longitudinal profiles were approximated with
118 H.K. Mebatsion et al. / Computers and Electronics in Agriculture 75 (2011) 113–124
Fig. 4. surface organ modeling based on the two half profiles of half a fruit (“Poivron” tomato). The boundary of the half fruit was defined (a). The two half profiles of thef e profib olatei to the
afiahrdCa2
Q
wac
ruit were then frame aligned (b). The red half profile represents the left side of thy using spline-interpolation of the two half profiles (red and green) (c). The interp
nterpretation of the references to color in this figure legend, the reader is referred
Fourier series of K number of harmonics. The Fourier series pro-les were split into two open profile curves which were then frameligned. We used two orthogonal profiles and as a result end upaving four open half profile curves (adding the half profile at 0adians to produce closed surface, we have five half profiles). Weefined a variational profile Q of the half profile curves by usingubic spline interpolation which gives sections for each angle ˛round the rotation axis. It can be defined as (Peigel and Tiller,002):
(t, ˛) =nc∑
i=0
Ni(t)Qi(˛) (6)
here the Ni(t) are cubic B-splines basis functions and the Qi(˛)re the variational form of the control points, Pc. Hence, Qi(˛) areomputed using global interpolation method on the control points,
le (and the green represents that of the right (b). Sub-profiles are then generatedd curves are then rotated to the desired angle, ˛, to yield a surface profile (d). (Forweb version of the article.)
at ˛ with t ∈ [0, np]. Qi(˛) are defined as:
Qi(˛) =np∑j=0
Nj(˛)Rij (7)
where the control points Rij are computed by solving interpolationconstraints that result from a system of linear equations. The organsurface is then obtained by rotating Qi(t, ˛) by ˛ about the z-axis,and can be defined as
S(t, ˛) = (Qy(t, ˛) cos(˛), Qy(t, ˛) sin(˛), Qz) (8)
A better model organ can be achieved using two longitudinal pro-files, and apply the same procedures of spline-interpolation and
revolution of variation al profiles.2.3.3. Surface modeling using multiple viewsThe geometric construction methods detailed in Sections 2.3.1
and 2.3.2 might not be sufficient for the complete representation

H.K. Mebatsion et al. / Computers and Electronics in Agriculture 75 (2011) 113–124 119
Fig. 5. The geometric modeling procedure based on multi-view profiles. The surface model was developed based on two profiles of an organ (a). The transverse cross sectionof the fruit (“Poivron” tomato) was captured, and digitized to define the boundary of maximum profile (from the top) of the organ (b). The Fourier series approximation wasdetermined (c) (in green). The transverse cross section of the surface profile in (a) is presented in(c) in red. Then, the actual transverse cross section profile ((c) in green) wass compw ere isn the ret
oivafivtportsaop
wiped along the surface profile of (a) to make surface adjustments and produce ahereas interpolated sub-profiles are represented in blue. The basic assumption ho sudden surface bumps and concave surface irregularities. (For interpretation ofhe article.)
f biological organs because of the non-symmetricity and shaperregularities associated with them. As a result, additional trans-erse cross section of the organ is required. In this respect, andvanced modeling procedure was implemented by combining ave-profile (skin surface) modeling scheme with additional trans-erse cross section adjustment by putting the horizontal profile ofhe model in a kind of tension or compression to match the toprofile of the actual plant organ. In other words, the side profilef a five-profile model was adjusted by constant multiple of theatio of radial distances of key points on the surface of the actualransverse cross section ((Fig. 5c) in green) to that of the hypothe-ized transverse cross section ((Fig. 5c) in red) projected at a definedngle, ˛. The procedure can mathematically be expressed basedn Eqs. (6) and (7). There are two critical steps in applying this
rocedure:(i) Determining the hypothetical transverse cross section in fiveprofile model.
lete organ model surface (d). The red profiles in (a) and (d) are input sub-profiles,that the transverse cross section profile of the organ remains similar and there areferences to color in this figure legend, the reader is referred to the web version of
(ii) Calculating the streaming factor, SF, to account for the trans-verse cross section.
The profile of the hypothetical transverse cross section is definedas a profile with the largest cross-section. The cross-section of thehorizontal profiles can be defined by Eq. (9), with di(˛) are radialdistances of control points from the rotational axis.
VT (i) =nc∑
i=1
di(˛) (9)
The hypothetical transverse cross section, HTV, is then a hori-zontal profile where Eq. (9) is maximized.
HTV = max(VT ) (10)
The actual transverse cross section of the organ is determinedvia the image acquisition procedure followed by boundary detec-tion (Fig. 5b) and then Fourier approximation (as a profile shown in

120 H.K. Mebatsion et al. / Computers and Electronics in Agriculture 75 (2011) 113–124
Fig. 6. The centroid distance signature and the Fourier series approximation. The boundary of the fruit image (“Cour de boeuf” tomato in this case) was detected usingb the Fc rdinatd (b) int this fi
(e
S
wa
pf
S
wectvtp
2
avrttdfml
3
ofst
oundary detection methods presented in Section 2.1 as shown in (a) in red andentroid of the contour was calculated (Mebatsion et al., 2006a). The boundary cooetermined by calculating radial distances as a function of angular displacement (he shape signature as shown in (b). (For interpretation of the references to color in
Fig. 5c) in green). The streaming factor, SF, which corrects for theffect of the transverse cross section is then calculated as:
F (˛) = d(HTV )(˛)D(˛)
(11)
here D(˛) are the radial distances of the control points on thectual transverse cross section of the organ from the rotational axis.
Finally, the surface of the organ is determined by the variationalrofile Qi(˛) as detailed in Section 2.3.2 and including the streamingactor SF(˛) with the surface as:
(t, ˛) = (Qy(t, ˛)SF (˛) cos(˛), Qy(t, ˛)SF (˛) sin(˛), Qz) (12)
The approach is comparable with the Extuded hull method,hich was originally forwarded by Birnbaum and cited in Pradal
t al. (2009), but with additional degree of freedom to capture shapeomplexities by increasing the lateral shape details. In Extruded hull,he model organs were constructed based on the horizontal and theertical profiles by sweeping the horizontal profiles inside the ver-ical profile (Birnbaum cited in Pradal et al., 2009). Fig. 5 shows therocedure of our new organ scheme.
.3.4. Volume and surface area estimationTo compare the accuracy of the geometric modeling schemes,
number of different virtual fruit models were generated. Theolume and the surface area of randomly generated fruit and theespective model geometries were calculated using numericalechniques. The numerical procedure is based on the triangula-ion followed by surface area and volume calculations based onivergence theorem. The Matlab version of the procedure can beound on the Matworks web site at: http://www.mathworks.co.kr/
atlabcentral/fileexchange/26982-volume-of-a-surface-triangu-ation.
. Results and discussion
The shape of the organs was defined using shape signatures tobtain mathematically defined profiles that are smooth and easyor the use in the modeling scheme. Centroid distance functionignature was used as it was the best in robustness, computa-ional complexity, convergence speed and retrieval performance
ourier approximation of N = 13 in green. Based on the boundary information, thees were then translated to the centroid of the contour. The shape signature is thenred). Finally, the Fourier series approximation of different harmonics was fitted togure legend, the reader is referred to the web version of the article.)
(Zhang and Lu, 2005; Ekombo et al., 2009). The use of the geo-metric center as a point reference was not a serious issue as thebiological organs we modeled were not distorted. Other shape sig-natures, which do not use the centroid as a reference point, werealso investigated. For example, the chord length function is verysensitive to noise, and there may be a drastic burst in the signatureof even smoothed shape boundaries (Zhang and Lu, 2005). More-over, the chord length function is not suitable for shape retrievalbecause of its computational cost for feature extraction and shaperetrieval. The non-reference point representation can also causeproblems when shape is traced in different directions, which mayproduce different signatures for mirrored shapes (Zhang and Lu,2005, 2002). The boundary based signature which uses chain codedprofiles (Iwata et al., 1998; Lootens et al., 2007; Furuta et al., 1995)can produce comparable results with centroid distance signature bysolving the reference point problem. Nevertheless, it has limitationsin accurately splitting organ profiles for effective frame alignment,spline interpolation and finally defining the variational profile usedin surface modeling.
The Fourier approximation procedures used in many biologicalapplication to define shape profiles has been implemented to get asmoothed profile for the geometric organ modeling. We varied thenumber of harmonics of the Fourier series approximation (as canbe seen in Fig. 6) and chose the appropriate harmonics based on thevalue of Fourier power. For most of geometric shapes investigated,10–13 Fourier coefficients described the shapes satisfactorily. Thisvalue is not far from the critical dimension threshold (equal to 10)for effective organization of feature indices into efficient data struc-ture (Weber et al., 1998). Fig. 6 shows the procedure of determiningshape profiles using Fourier series approximation. As shown inthe figure, the Fourier approximation improves as we increase thenumber of Fourier harmonics until an optimum harmonics value.The Fourier power value defined in Eq. (3) has been used as a quanti-tative measure as to how best the different harmonic Fourier seriesfit the centroid distance signature of the organs. The Fourier power
value of the different number harmonics was calculated to be 99.95,99.99 and 100% for Fourier harmonics, K = 5, 8 and 13 respectively.The number of inputs for the geometrical organ modeling variesaccording to the shape of the organ and the complexities we wouldlike to include in the model. For organs which are axis symmetric,

H.K. Mebatsion et al. / Computers and Electronics in Agriculture 75 (2011) 113–124 121
F on difo uit (th( uit (c)s trudedt with a
sfiimfpmaptGtgvbafitrteh
sgfEc
ig. 7. The geometric models of a tomato (“poivron” genotype) constructed basedf half fruit (a); model constructed from a complete longitudinal profile of a half frfive-profile model, which is equivalent to skin surface (Pradal et al., 2009)) of the frection profile (three-profile model plus transverse cross section, equivalent to exransverse cross section profile of the fruit through five-profile model (skin surface
uch as most apple varieties, some tomato cultivars (Cherry typesor example) and peaches, half profiles are the only geometricalnputs necessary to construct the fruits surface model. Organs hav-ng some asymmetry can be well described using the three-profile
odel, with one profile inputs. For asymmetric organs, without sur-ace perturbations, including an additional transverse cross sectionrofile in the modeling scheme is not necessary and the five-profileodel, with two orthogonal profile inputs, can produce accept-
ble geometrical models. For organs with asymmetric surfaces anderturbations, such as “poivron” tomato genotype and pumpkin,he inclusion of additional transverse cross section is mandatory.enerally, for a particular organ, the increase in the information of
he fruit profile increases the accuracy of the geometric model anduarantees that the geometric models produced are acceptable forirtual computer simulations. The geometric models constructedased on different number of input profiles for a particular organre presented in Fig. 7. By increasing the number of half fruit pro-les and including the transverse cross section, the complexity ofhe geometric model was increased as shown in Fig. 7a–d. In thisespect, our approach excels the Extruded hull, as more details ofhe vertical profile is included in our model capturing organ details,specially concave top and bottom parts of organs, that cannot beandled by the Extruded hull.
The comparison of the surface area of different modelingchemes shown in Fig. 7 was evaluated by taking 300 virtually
enerated fruits. The random generation of virtual fruits were per-ormed to increase the shape variability of the experimenting fruits.xperimenting with 300 real fruits is much more expensive, timeonsuming, and sometimes the human perception might be fooledferent number of inputs and assumptions. Model constructed based on half profileree-profile model) (b); model constructed from two half fruit longitudinal profiles. The model geometry constructed by one longitudinal profile and transverse cross
hull (Pradal et al., 2009)) (d). The model geometry constructed by sweeping thetransverse cross section) (e).
to differentiate small differences. The probability of generating vir-tual lobed tomatoes, star fruits or tapered fruits is very high in thegeneration of random fruits which take three hypothetical radii,coefficients that are responsible for the side view (for examplecarpels in tomatoes), and coefficients that are responsible for thebasipetal and distal ends of the fruits (Ling et al., 2007). Fig. 8 showsexamples of the possible virtual fruits used in the experiment.
Fig. 9 shows the frequency distribution of the percentage errorof the specific model with that of the virtual fruit. The virtual fruitsgenerated were axis-symmetric and the errors generated mightget worse for modeling schemes that do not take fruit geometricdetails. In this respect the, the results presented here prove that ournew modeling scheme, skin surfaces with transverse cross section,stands the best. Similar trends were observed with the frequencydistribution of volume errors.
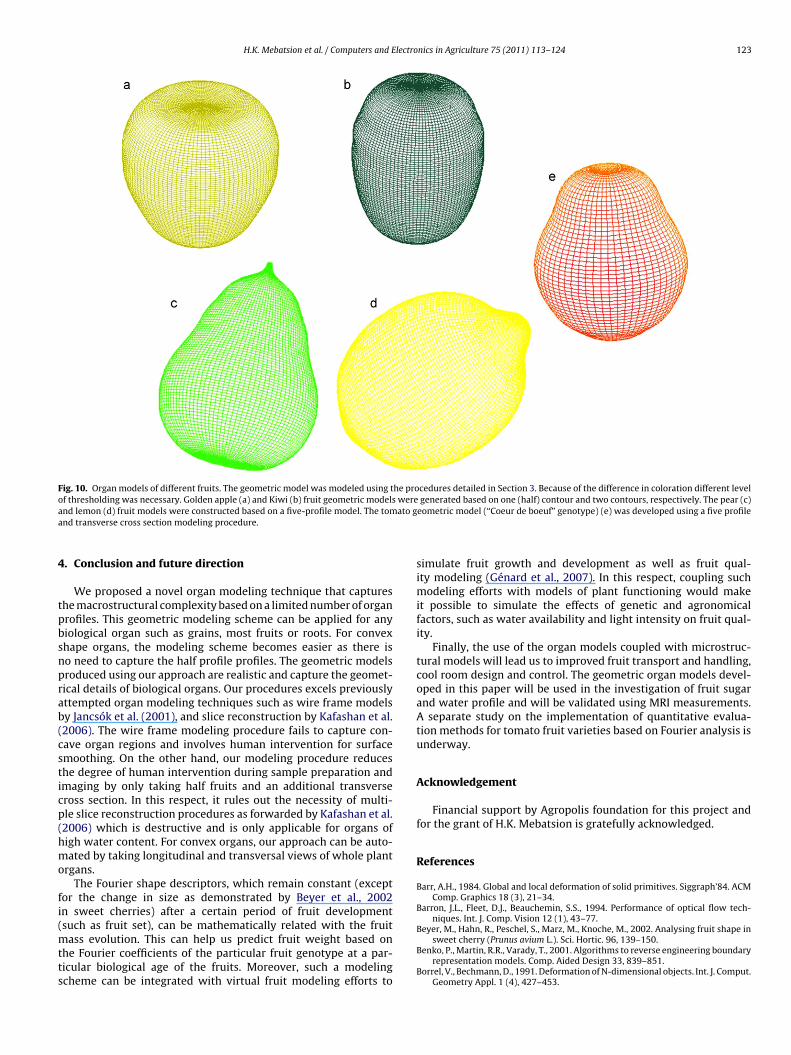
Fig. 10 shows different varieties of fruits modeled using theprocedures presented in this paper. The number of input param-eters is a function of the complexity of the shape of the organitself. Axis symmetric fruits such as apple (Fig. 10a), kiwi (Fig. 10b)were modeled based on half profile profiles of the longitudinalcross section of the fruit. On the other hand, non-axis sym-metric organs and yet with not much surface irregularities likepeach, pear (Fig. 10c), and lemon (Fig. 10d), were modeled usingfive-profile (two half profile) models. For more irregular andnon-axis symmetric organs such as “Poivron” (a tomato geno-
type) (Fig. 7e), and “Coeur de boeuf” (another tomato genotype)(Fig. 10e)), both the longitudinal cross sections and the transversecross section were required for accurate description of the organgeometry.
122 H.K. Mebatsion et al. / Computers and Electronics in Agriculture 75 (2011) 113–124
Fig. 8. Random generation of virtual fruits. (a) virtual tomato with 9 carpels, equal radii (Rx , Ry , Rz), coefficients to account for the distal and basipetal ends; (b) virtual tomatowith equal radii, coefficients to account for the distal and basipetal ends; (c) virtual tomato with 3 carpels, a different Rz value and coefficients to account for the distal andbasipetal ends; (d) virtual tomato with 6 carpels, a different Ry value and coefficients to account for the distal and basipetal ends.
Fig. 9. Comparison of the accuracy of different modeling schemes. The percentage of the data falling under 5% level for the extruded hull, skin surfaces and skin surfaces withthe transverse cross section is about 90%, 84% and 95%, respectively. The other two approaches are more or less similar to each other with errors sometimes reaching up to48%.
H.K. Mebatsion et al. / Computers and Electronics in Agriculture 75 (2011) 113–124 123
Fig. 10. Organ models of different fruits. The geometric model was modeled using the procedures detailed in Section 3. Because of the difference in coloration different levelo werea ato ga
4
tpbsnprab(csticp(hmo
fi(mtts
f thresholding was necessary. Golden apple (a) and Kiwi (b) fruit geometric modelsnd lemon (d) fruit models were constructed based on a five-profile model. The tomnd transverse cross section modeling procedure.
. Conclusion and future direction
We proposed a novel organ modeling technique that captureshe macrostructural complexity based on a limited number of organrofiles. This geometric modeling scheme can be applied for anyiological organ such as grains, most fruits or roots. For convexhape organs, the modeling scheme becomes easier as there iso need to capture the half profile profiles. The geometric modelsroduced using our approach are realistic and capture the geomet-ical details of biological organs. Our procedures excels previouslyttempted organ modeling techniques such as wire frame modelsy Jancsók et al. (2001), and slice reconstruction by Kafashan et al.2006). The wire frame modeling procedure fails to capture con-ave organ regions and involves human intervention for surfacemoothing. On the other hand, our modeling procedure reduceshe degree of human intervention during sample preparation andmaging by only taking half fruits and an additional transverseross section. In this respect, it rules out the necessity of multi-le slice reconstruction procedures as forwarded by Kafashan et al.2006) which is destructive and is only applicable for organs ofigh water content. For convex organs, our approach can be auto-ated by taking longitudinal and transversal views of whole plant
rgans.The Fourier shape descriptors, which remain constant (except
or the change in size as demonstrated by Beyer et al., 2002n sweet cherries) after a certain period of fruit development
such as fruit set), can be mathematically related with the fruitass evolution. This can help us predict fruit weight based onhe Fourier coefficients of the particular fruit genotype at a par-icular biological age of the fruits. Moreover, such a modelingcheme can be integrated with virtual fruit modeling efforts to
generated based on one (half) contour and two contours, respectively. The pear (c)eometric model (“Coeur de boeuf” genotype) (e) was developed using a five profile
simulate fruit growth and development as well as fruit qual-ity modeling (Génard et al., 2007). In this respect, coupling suchmodeling efforts with models of plant functioning would makeit possible to simulate the effects of genetic and agronomicalfactors, such as water availability and light intensity on fruit qual-ity.
Finally, the use of the organ models coupled with microstruc-tural models will lead us to improved fruit transport and handling,cool room design and control. The geometric organ models devel-oped in this paper will be used in the investigation of fruit sugarand water profile and will be validated using MRI measurements.A separate study on the implementation of quantitative evalua-tion methods for tomato fruit varieties based on Fourier analysis isunderway.
Acknowledgement
Financial support by Agropolis foundation for this project andfor the grant of H.K. Mebatsion is gratefully acknowledged.
References
Barr, A.H., 1984. Global and local deformation of solid primitives. Siggraph’84. ACMComp. Graphics 18 (3), 21–34.
Barron, J.L., Fleet, D.J., Beauchemin, S.S., 1994. Performance of optical flow tech-niques. Int. J. Comp. Vision 12 (1), 43–77.
Beyer, M., Hahn, R., Peschel, S., Marz, M., Knoche, M., 2002. Analysing fruit shape insweet cherry (Prunus avium L.). Sci. Hortic. 96, 139–150.
Benko, P., Martin, R.R., Varady, T., 2001. Algorithms to reverse engineering boundaryrepresentation models. Comp. Aided Design 33, 839–851.
Borrel, V., Bechmann, D., 1991. Deformation of N-dimensional objects. Int. J. Comput.Geometry Appl. 1 (4), 427–453.
1 lectro
C
C
C
C
C
D
D
E
F
G
G
G
H
I
J
J
K
K
K
K
KL
24 H.K. Mebatsion et al. / Computers and E
hen, H., De Baerdemaeker, J., 1993. Finite-element-based modal analysis of fruitfirmness. Trans. ASAE 36, 1827–1833.
hen, H., De Baerdemaeker, J., Bellon, V., 1996. Finite element study of the melon fornondestructive sensing of firmness. Trans. ASAE 39, 1057–1065.
osta, C., Manesatti, P., Pagila, G., Pallottino, F., Aguzzi, J., Rimatori, V., Russo, G., Recu-pero, S., Recupero, G.R., 2009. Quantitative evaluation of Toroco sweet orangefruit shape using optoelectronic elliptic Fourier based analysis. Postharvest Biol.Technol. 54, 38–45.
rampton, J.s., 1995. Elliptic Fourier shape analysis of fossil bivalves: some practicalconsiderations. Lethaia 28, 179–186.
urrie, A.J., Ganeshanandam, S., Noiton, D.A., Garrick, D., Shelbourne, C.J.A., Oraguzie,N.N., 2000. Quantitative evaluation of apple (Malus domestica Borkh.) fruit shapeby principal component analysis of Fourier descriptors. Euphytica 111, 219–227.
a Silva, D., 2008. Caractérisation de la nature multi-échelles de plantes par desoutils de géométrie fractal, application à la modélisation de l’interception de lalumière. PhD thesis, Université Montpellier 2.
imas, E., Briassoulis, D., 1999. 3D geometric modelling based on NURBS: a review.Adv. Eng. Softw. Arch. 30 (9–11), 741–751.
kombo, P.L.E., Ennahnahi, N., Oumsis, M., Meknassi, M., 2009. Application of affineinvariant Fourier descriptor to shape based image retrieval. Int. J. Comp. Sci.Network Security 9 (7), 240–247.
uruta, N., Ninomiya, S., Takahashi, N., Ohmori, H., Uka, Y., 1995. Quantitative eval-uation of soybean (Glycine max L. Merr.) leaflet shape by principal componentscores based on elliptic Fourier descriptor. Breed. Sci. 45, 315–320.
ain, J.E., Dodgson, N., 1999. Adaptive refinement and decimation under free formdeformation. In: Eurographics UK ’99.
énard, M., Bertin, N., Borel, C., Bussières, P., Gautier, H., Habib, H., Léchaudel, M.,Lecomte, A., Lescourret, F., Lobit, P., Quilot, B., 2007. Towards a virtual fruitfocusing on quality: modeling features and potential uses. J. Exp. Bot. 58, 917–928.
opal, T.V., Prasad, V.K., 2008. A novel approach to shape based image retrieval inte-grating adapted Fourier descriptors and freeman code. Int. J. Comp. Sci. NetworkSecurity 8, 293–302.
su, W.M., Hughes, J.F., Kaufman, H., 1992. Direct manipulation of free form defor-mations. Comp. Graphics 26 (2), 177–184.
wata, H., Niikura, S., Matsuura, S., Takano, Y., Ukai, Y., 1998. Evaluation of variationof root shape of Japanese radish (Raphanus sativus L.) based on image analysisusing elliptic Fourier descriptors. Euphytica 102, 143–149.
ancsók, P.T., Clijmans, L., Nicolaï, B.M., Baerdemaeker, J.D., 2001. Investigation ofthe effect of shape on acoustic response of ‘Conference’ pears by finite elementmodelling. Postharvest Biol. Technol. 23, 1–12.
ensen, R.J., Ciofani, K.M., Miramontes, L.C., 2002. Lines, outlines, and landmarks:morphometric analyses of leaves of Acer rubrum, Acer saccharinum (Aceraceae)and their hybrid. Taxon 51 (3), 475–492.
afashan, J., Tijskens, B., Moshou, D., Mouazen, De Baerdemamaeker, J., Ramon, H.,2006. Image processing to create a realistic 3D model of apple based on slices.In: 2006 ASAE Annual Meeting @2006, Paper number 066003.
awabata, S., Yokoo, M., Nii, K., 2009. Quantitative analysis of corolla shapes andpetal contours in single-flower cultivars of lisianthus. Sci. Hortic. 121, 206–212.
hanali, M., Ghasemi Varnamkhasti, M., Tabatabaeefar, A., Mobli, H., 2007. Massand volume modelling of tangerine (Citrus reticulate) fruit with some physicalattributes. Int. Agrophys. 21, 329–334.
ocjan, K., 2005. Partial shape matching using convex hull and Fourier descriptors.Ann. UMCS Informatics AI 3, 35–43.
reyszig, E., 2006. Advanced Engineering Mathematics. John Wiley & Sons, Inc.angenakens, J., Vandewalle, X., De Baerdemaeker, J., 1997. Influence of global shape
and internal structure of tomatoes on the resonant frequency. J. Agric. Eng. Res.66, 41–49.
nics in Agriculture 75 (2011) 113–124
Ling, L., Hongzhen, X., Wenlin, S., Gelin, L., 2007. Research on visualization of fruitsbased on deformation. N. Z. J. Agric. Res. 50, 593–600.
Lootens, P., Van Waes, J., Carlier, L., 2007. Description of the morphology of roots ofChicorium intybus L. partim by means of image analysis: comparison of ellipticFourier descriptors and classical parameters. Comp. Electron. Agric. 58, 164–173.
Lu, G., Sajjanhar, A., 1999. Region based shape presentation and similarity measuresuitable for content based image retrieval. Multimedia Syst. 7, 165–174.
Mebatsion, H.K., Verboven, P., Ho, Q.T., Mendoza, F., Verlinden, B.E., Nguyen, T.A.,Nicolaï, B.M., 2006b. Modeling fruit microstructure using novel ellipse tessella-tion algorithm. CMES – Comp. Modell. Eng. Sci. 14, 1–14.
Mebatsion, H.K., Verboven, P., Jancsók, P.T., Ho, Q.T., Verlinden, B., Nicolaï, B.M., 2008.Modeling 3-D fruit tissue microstructure using a novel ellipsoid tessellationalgorithm. CMES – Comp. Modell. Eng. Sci. 29 (3), 137–149.
Mebatsion, H.K., Verboven, P., Verlinden, B.E., Ho, Q.T., Nguyen, T.A., Nicolaï, B.M.,2006a. Microscale modelling of fruit tissue using Voronoi tessellations. Comp.Electron. Agric. 52, 36–48.
Menesattia, P., Costa, C., Paglia, G., Pallottino, F., D’Andrea, S., Rimatori, V., Aguzzi, J.,2008. Shape-based methodology for multivariate discrimination among Italianhazelnut cultivars. Biosyst. Eng. 100, 417–424.
Moulton, J.D., Dendy, J.E., Hyman, J.M., 1998. The black box multigrid numericalhomogenization algorithm. J. Comput. Phys. 141, 1–29.
Moustakides, G., Briassoulis, D., Psarakis, E., Dimas, E., 2000. 3D image acquisitionand NURBS based geometry modelling of natural objects. Adv. Eng. Software 31(12), 955–969.
Neto, J.C., Meyer, G.E., Jones, D., Samal, D.A.K., 2006. Plant species identification usingElliptic Fourier leaf shape analysis. Comp. Electron. Agric. 50, 121–134.
Nguyen, T.A., Verboven, P., Schenk, A., Nicolaı, B.M., 2007. Prediction of water lossfrom pears (Pyrus communis cv. Conference) during controlled atmosphere stor-age as affected by relative humidity. J. Food Eng. 83, 149–155.
Ohsawa, R., Tsutsumi, T., Uehara, H., Namai, H., Ninomiya, S., 1998. Quantitative eval-uation of common buckwheat (Fagopyrum esculentum Moench) kernel shape byelliptic Fourier descriptor. Euphytica 101 (2), 175–183.
Peigel, L., Tiller, W., 2002. Surface skinning revisited. Visual Comp. 18, 273–283.
Pradal, C., Boudon, F., Nouguier, C., Chopard, J., Godin, C., 2009. PlantGL: a python-based geometric library for 3D plant modeling at different scales. Graph. Models71, 1–21.
Saudreau, M., Sinoquet, H., Santin, O., Marquier, A., Adam, B., Longuenesse, J., Guil-ioni, L., Chelle, M., 2007. A 3D model for simulating the spatial and temporaldistribution of temperature within ellipsoidal fruit. Agric. Forest Meteorol. 147,1–15.
Sederberg, T.W., Parry, S.R., 1986. Free-form deformation of solid geometric models.Proceedings of SIGGRAPH ’86. Comp. Graphics 20, 151–159.
Tanksley, S.D., 2004. The genetic, developmental, and molecular bases of fruit sizeand shape variation in tomato. Plant Cell 16, S181–S189.
Verstreken, E., De Baerdemaeker, J., 1994. Evolution of maturity of peaches: non-destructive firmness measurement from the acoustic impulse response. Int.Agrophysics 8, 469–473.
Weber, R., Schek, H.J., Blott, S., 1998. A quantitative analysis and performance studyfor similarity-search methods in high-dimensional spaces. In: Proceedings ofthe 24th VLDB Conference, New York, USA, pp. 194–205.
Yoshioka, Y., Iwata, H., Hase, N., Matsuura, S., Ohsawa, R., Ninomiya, S., 2006. Geneticcombining ability of petal shape in garden pansy (Viola × wittrockiana Gams)
based on image analysis. Euphytica 151, 311–319.Zhang, D., Lu, G., 2002. A comparative study of Fourier descriptors for shape repre-sentation and retrieval. In: The 5th Asian Conference on Computer Vision, 23–25January 2002, Melbourne, Australia.
Zhang, D., Lu, G., 2005. Study and evaluation of different Fourier methods for imageretrieval. Image Vision Comput. 23 (2005), 33–49.