Localization of lipids in freeze-dried mouse brain sections by imaging TOF-SIMS
Upload
independentCategory
view
6download
0
A Novel Preprocessing Method Using Hilbert HuangTransform for MALDI-TOF and SELDI-TOF MassSpectrometry DataLi-Ching Wu1,2*, Hsin-Hao Chen1, Jorng-Tzong Horng1,3,4, Chen Lin1, Norden E. Huang1,5, Yu-Che
Cheng6, Kuang-Fu Cheng7,8
1 Graduate Institute of System Biology and Bioinformatics, National Central University, Jhongli, Taiwan, 2 Research Center for Biotechnology and Biomedical Engineering,
National Central University, Jhongli, Taiwan, 3 Department of Computer Science and Information Engineering, National Central University, Jhongli, Taiwan, 4 Department
of Bioinformatics, Asia University, Wu-feng, Taiwan, 5 Research Center for Adaptive Data Analysis, National Central University, Jhongli, Taiwan, 6 Proteomics Laboratory,
Cathay Medical Research Institute, Cathay General Hospital, Xizhi, Taiwan, 7 Graduate Institute of Statistics, National Central University, Jhongli, Taiwan, 8 Graduate
Institute of Statistics, China Medical University, Taichung, Taiwan
Abstract
Motivation: Mass spectrometry is a high throughput, fast, and accurate method of protein analysis. Using the peaksdetected in spectra, we can compare a normal group with a disease group. However, the spectrum is complicated by scaleshifting and is also full of noise. Such shifting makes the spectra non-stationary and need to align before comparison.Consequently, the preprocessing of the mass data plays an important role during the analysis process. Noises in massspectrometry data come in lots of different aspects and frequencies. A powerful data preprocessing method is needed forremoving large amount of noises in mass spectrometry data.
Results: Hilbert-Huang Transformation is a non-stationary transformation used in signal processing. We provide a novelalgorithm for preprocessing that can deal with MALDI and SELDI spectra. We use the Hilbert-Huang Transformation todecompose the spectrum and filter-out the very high frequencies and very low frequencies signal. We think the noise inmass spectrometry comes from many sources and some of the noises can be removed by analysis of signal frequencedomain. Since the protein in the spectrum is expected to be a unique peak, its frequence domain should be in the middlepart of frequence domain and will not be removed. The results show that HHT, when used for preprocessing, is generallybetter than other preprocessing methods. The approach not only is able to detect peaks successfully, but HHT has theadvantage of denoising spectra efficiently, especially when the data is complex. The drawback of HHT is that this approachtakes much longer for the processing than the wavlet and traditional methods. However, the processing time is stillmanageable and is worth the wait to obtain high quality data.
Citation: Wu L-C, Chen H-H, Horng J-T, Lin C, Huang NE, et al. (2010) A Novel Preprocessing Method Using Hilbert Huang Transform for MALDI-TOF and SELDI-TOF Mass Spectrometry Data. PLoS ONE 5(8): e12493. doi:10.1371/journal.pone.0012493
Editor: William C. S. Cho, Queen Elizabeth Hospital, Hong Kong
Received November 26, 2009; Accepted August 5, 2010; Published August 31, 2010
Copyright: � 2010 Wu et al. This is an open-access article distributed under the terms of the Creative Commons Attribution License, which permits unrestricteduse, distribution, and reproduction in any medium, provided the original author and source are credited.
Funding: This project is supported by the Cathay General Hospital (www.cgh.org.tw) and National Central University (www.ncu.edu.tw) Collabaration Projectnumber 97CGH-NCU-A1 and National Science Council Project number 98-2627-M-008-003. The funders had no role in study design, data collection and analysis,decision to publish, or preparation of the manuscript.
Competing Interests: The authors have declared that no competing interests exist.
* E-mail: [email protected]
Introduction
Mass spectrometry is currently used to explore protein profiles
expressed under different physiological and pathophysiological
conditions [1]. Moreover, recent progress has opened up new
avenues for tumor-associated biomarker discovery [2]. A mass
spectrum of a sample is a profile representing the distribution of
components by mass-to-charge ratio. Spectra of tissues or fluids,
like serum, are studied for possible profile changes that further
disease diagnosis. Matrix assisted laser desorption ionization
(MALDI) and surface-enhanced laser desorption ionization
(SELDI) time of flight (TOF) are the two commonly techniques
used to generate profiles from experimental samples. The chief
feature of mass spectra is the peaks detected in terms of their
intensity values and time of flight values. Further peak identi-
fication can be done if tandem mass spectrometry is available [3].
Since each spectrum contains ten thousands of time of flight
points with various intensities, noise in the spectra is unavoidable.
Therefore, it is important to develop a suitable algorithm for
data preprocessing that improves performance when analyzing
spectra.
Recently, various data preprocessing methods have been used
and these usually comprise several steps. First, baseline
subtraction is often used to rescale the plots with the aims of
removing systematic artifacts produced by small clusters of matrix
material [4]. Next, denoising attempts to remove noise signals
that are added to the true spectra from the matrix material and
by sample contaminants (chemical noise) together with noise
caused by the physical characteristics of the machine (electrical
noise) [5,6]. Furthermore, alignment is a required for combining
unusual groups of data together. The same peak may be present,
but with small gaps between the different biological samples due
PLoS ONE | www.plosone.org 1 August 2010 | Volume 5 | Issue 8 | e12493

to unavoidable inaccuracy in the spectrum. Peak detection is still
necessary across every method and is a key feature of preprocess-
ing the data. It is necessary to detect each peak by relying on their
peak intensity and time of flight. Finally, normalization helps us
to have a uniform format for the analysis of the data and this
corrects any systematic variation between the different spectra
[7].
There are many studies that have described preprocessing of
mass spectrum data [6,8,9,10,11,12,13] and have explored their
approach’s influence on the raw data. In the study of Meuleman,
Engwegen et al. [14], they compared various different algorithms
that can be used for normalization. In another, Beyer, Walter et al.
[15] compared the performance of the package ‘‘Ciphergen Express
Software 3.0’’, which is produced by Ciphergen against the ‘‘R
package PROcess’’. Recently, Cruz-Marcelo, Guerra et al. [7]
compared a number of widely used algorithms, namely ‘‘Pro-
teinChip� Soft-ware 3.1’’ (Ciphergen Biosystems), ‘‘Biomarker’’
Wizard (Ciphergen Biosystems), ‘‘PROcess’’, which was written by
Xiaochun Li as the ‘‘BioConductor’’ package, ‘‘Cromwell’’ written
using Matlab scripts, ‘‘SpecAlign’’ developed by Wong, Cagney et
al. [11], and ‘‘MassSpecWavelet’’ developed by Du, Kibbe et al.
[12] as a ‘‘BioConductor’’ package. Nevertheless, although many
preprocessing methods have been put forward, the preprocessing
algorithm can still be improved.
In the past, the scientists have tried to compute a formula for
noise that consists of chemical and machine noise using a statistical
method and then constructing a model based on this. However,
the chemical noise is generally due to true peaks, namely organic
acids, which are part of the matrix used in mass spectrometry. The
matrix has two purposes: ionization and protection. It provides
hydrogen ions to the peptides or proteins, which are then allowed
to undergo ionization and flight in the machine. In addition, the
matrix protects the peptide or protein during the laser flash.
Matrix noise usually appears in the low mass-to-charge ratio
regions (,1000DA). Nonetheless, we need to understand that
peaks in the low mass-to-charge ratio region are not only due to
chemical noise but also contain true signal peaks. If we mixed the
chemical noise with the machine noise as part of preprocessing, we
might conclude that the noise strongly affecting the low mass-to-
charge ratio region is due to the abundance of organic acids in this
region. However, if we take into account the difference between
chemical and machine noise when we analyze the spectra, we
ought to be able to separate chemical noise from machine noise;
this is because the peaks in the low mass-to-charge ratio regions
are due to the organic acids and thus distinct from machine noise.
The machine noise may come from variety of different sources
includes air dust, electric detection limitation, electric white noise,
and even earth magnetic field. These noises may not have fixed
frequences since the m/z value have measurement shifting
problem.
In the present study we present a novel preprocessing
method using Hilbert Huang transformation (HHT) that is used
to decompose a non-linear and non-stationary model. By using
HHT, the data can be decomposed into different trends which
separate some noises from signals. The main advantage of
HHT is non-stationary. It does not make strong assumption
that the signal respond to the axis to be stationary distributed.
Since the m/z axis exist shifting problem, the HHT can
Figure 1. Components decomposed using HHT. HHT decomposes the spectrum into sixteen components. From bottom to top, we call them asC1, C2, and so on. Summation of all components can is the original spectrum.doi:10.1371/journal.pone.0012493.g001
Using HHT on Mass Spectrometry
PLoS ONE | www.plosone.org 2 August 2010 | Volume 5 | Issue 8 | e12493

eliminate more non-stationary noises than stationary method
such as wavelet. The disadvantage is the calculation time will
much longer then stationary method. We then compare our
algorithm with three familiar preprocessing methods and with
another algorithm that has been suggested by Cruz-Marcelo,
Guerra et al. [7].
Figure 2. Before and after HHT preprocessing. (a) The average of fifty ovarian cancer datasets. There are greater amounts of noise in the lowregion than in the high region. The scale is approximately ten to the ninth power. (b) The same figure after using the Hilbert Huang transformationformula and the various modifications carried out after preprocessing. When comparing with (a), it can be seen that the chief peaks and the profileare maintained.doi:10.1371/journal.pone.0012493.g002
Using HHT on Mass Spectrometry
PLoS ONE | www.plosone.org 3 August 2010 | Volume 5 | Issue 8 | e12493

Materials and Methods
Hilbert Huang transformationHHT [16] is an adaptive data analysis method for non-linear
and non-stationary processes. We use HHT to define the trends in
a spectrum. In the past, we have defined the trend that represents
the baseline and the noise as a straight line, which is then fitted to
the spectrum; then we removed the straight line to yield a zero-
mean residue. However, such trends are not suitable for non-linear
data and the real-world. Noise exists non-linearly and is non-
stationary. In reality, the line is non-linear and non-stationary
when we try to rescale spectra.
The main feature of the HHT is the empirical mode
decomposition (EMD) method with which any complicated data
can be decomposed into a finite and often a small number of
components called intrinsic mode functions (IMF). We define the
IMF if the intrinsic mode of oscillation satisfies two conditions:
firstly that the number of the extrema and the number of the zero-
crossings must either equal or differ at most by one in the whole
dataset and, secondly, the mean value of the envelope defined by
the local minima is zero at any point. The IMFs by the EMD
method are chiefly obtained by an approach called the sifting
process. Actually, the number of IMFs is closed to log2N where N
denotes the total number of data points. The sum of all IMFs is
equal to the original data.
We chose one of the ovarian cancer datasets from the National
Cancer Institute published by Kwon, Vannucci et al. [6] to
undergo the HHT process. Sixteen IMF components were
identified while applying sifting process to our data. As is shown
in the Figure 1, the later components, namely the ones from the
fourteenth IMF to the sixteenth IMF, can be removed for the
purpose of rescaling; we also removed the components from first
IMF to sixth IMF for the purpose of denoising. Thus a significant
part of the chemical noise can be separated from the main
spectrum by removing the first components.
Subsequent ModificationsIn addition to using the HHT for de-noising, the baseline needs
to be adjusted. Here we apply SpecAlign software for baseline
estimation, which is available at PHYSCHEM.OX.AC.UK/
,JWONG/SPECALIGN [11]. For removing the baseline, the
software has two user-defined options: window size of the baseline
and subtraction of the baseline. We set the window size as 20, and
then we remove the baseline. After baseline subtraction, we
rescaled the spectrum to positive. We moved the whole spectrum
to be positive by changing the intensity values. However, we did
not change other parameters. Our method, which we have called
HHTMass, consists of using the Hilbert Huang transformation for
denoising followed by modification of the spectrum by baseline
subtraction and rescaling. The spectrum before and after the
HHT preprocessing are shown in Figure 2(a) and 2(b) (spectrum
source shown in data source section).
Peak detectionWe apply three methods, namely MassSpecWavelet [12],
SpecAlign [11], and PROcess [9] for peak detection. The major
feature of MassSpecWavelet is that the package does not contain any
preprocessing method. According to Cruz-Marcelo, Guerra
et al. [7], MassSpecWavelet has the best performance in terms of
peak detection. PROcess is a BioConductor package by Li [9], which
has high quality of peak quantification. SpecAlign, written by Wong
[11], is a well known spectrum analysis software package; it has the
useful property of containing many user defined options that increase
choice. The preprocessing methodology linked to MassSpec-Wavelet
Figure 3. Sample pancreatic cancer data. Original data of pancreatic cancer provided by Ge and Wong (2008). In this dataset, there is more noisewhere the peaks exist.doi:10.1371/journal.pone.0012493.g003
Using HHT on Mass Spectrometry
PLoS ONE | www.plosone.org 4 August 2010 | Volume 5 | Issue 8 | e12493

Using HHT on Mass Spectrometry
PLoS ONE | www.plosone.org 5 August 2010 | Volume 5 | Issue 8 | e12493

was designated as HHTMass1, that linked to SpecAlign as
HHTMass2, and that linked to PROcess as HHTMass3.
Data sourceTwo different samples are used in this study. Ovarian cancer data
is acquired from the authors of [6] in National Cancer Institute.
Serum samples from women diagnosed with ovarian cancer and
women hospitalized for other conditions were collected at the Mayo
Clinic from 1980 to 1989. The dataset was analyzed by SELDI-
TOF MS using the CM10 chip type [17]. The ProteinChip
Biomarker System was used for protein expression profiling.
The spectrum has two properties, m over z and intensity. The
dataset consists of fifty samples after 1986. The m over z ranges
are between 58Da and 101453Da. The intensity ranges are
between 23.27E7 and 2.14E9. Based on the results of Cruz-
Marcelo, Guerra et al. et al. [7] and Kwon, Vannucci et al. [6], in
this study we examined the m over z range from 2000Da to
15000Da. Each sample has 21552 points.
Figure 4. Different peaks detected by different peak selection method. (a) The ovarian cancer dataset preprocessed by HHTMass1. Thechosen area is from 4000DA to 6000DA. The figure is the original spectrum and the circled points are the peaks detected by HHTMass1. HHTMass1detected 32 peaks in this region. (b) The ovarian cancer dataset preprocessed by HHTMass2. The chosen area is from 4000DA to 6000DA. The figure isthe original spectrum and the circled points are the peaks detected by HHTMass2. HHTMass1 detected 17 peaks in this region. (c) The ovarian cancerdataset preprocessed by HHTMass3. The chosen area is from 4000DA to 6000DA. The figure is the original spectrum and the circled points are thepeaks detected by HHTMass3. The largest peak in the region between 5000DA and 6000DA was not detected by HHTMass3. HHTMass3 detected 18peaks in this region.doi:10.1371/journal.pone.0012493.g004
Figure 5. Spectrum data after using HHT preprocessing. The data after using Hilbert Huang transformation without modification. The highfrequency noises are removed.doi:10.1371/journal.pone.0012493.g005
Table 1. The amount of the peaks detected in our three algorithms.
Algorithm Total region Region A Region B Region C Region D Region E Region F Region G
HHTMass1 218 35 32 27 21 44 38 21
HHTMass2 80 18 17 6 11 8 9 3
HHTMass3 108 21 18 19 13 14 13 10
The table shows the results of different preprocessing methods. Region A represents the m over z value between 2000DA and 4000DA. Similarly, B, C, D, E, F, and Grepresent the region of 4000DA to 6000DA, 6000DA to 8000DA, 8000DA to 10000DA, 10000DA to 12000DA, 12000DA to 14000DA, and 14000DA to 15000DA, whereasthe total region means the area between 2000DA and 15000DA.doi:10.1371/journal.pone.0012493.t001
Using HHT on Mass Spectrometry
PLoS ONE | www.plosone.org 6 August 2010 | Volume 5 | Issue 8 | e12493

Using HHT on Mass Spectrometry
PLoS ONE | www.plosone.org 7 August 2010 | Volume 5 | Issue 8 | e12493

As we see the Figure 2(a), the spectrum is full of noise,
especially in low m over z value region. Several different
denoising methods have been developed to handle this type of
data [6,13,18,19]. In general, these approaches use a simulated
model for comparing the performance of preprocessing methods.
However, the above preprocessing methods seem to be pre-
justified in their model. The real distribution of noise is more
irregular in real experiments because we cannot understand
completely how electrical and chemical noise is generated in a
spectrum. Therefore, in this study we compared our approach
with the other methods using real data rather than simulated
data. It is well-known that Morris, et al. [20] proposed a model
using Gaussian white noise and that Cruz-Marcelo, Guerra et al.
[7] proposed the ARMA model. However, there is no evidence to
show which model fits real data. The preprocessing methods
proposed up to now fit their data and their model. For example,
we requested a pancreatic cancer dataset from [21] and
compared it to the ovarian cancer data. In the Figure 3, the
pancreatic cancer spectrum has high amounts of noise in the
regions where peaks exist, which is different from [6], where the
noise is greater in the low region. Therefore, approaches to
constructing the model cannot be uniform. In this context then it
is clear that real data is the best target when carrying out
comparisons.
In fact, while processing the mass spectrum data, we substituted
the scale of time of flight for the scale of m/z values. The
transform was carried out according to the formula (1).
m=z
U~sign t{t0ð Þ:a: t{t0ð Þ2:b ð1Þ
Here t denotes the time of flight, U = 25000, a = 3.36E8,
b = 0.00235, and t0 = 3.7071E-7. A single spectrum has 21
551data points in our experiments [6]. After the above pre-
processing step, we should be able to compare the spectra and
distinguish biomarkers that identify the differences between
healthy and diseased individuals.
Methods of comparisonPreviously, scientists have compared performance mainly in
terms of peak detection and peak quantification. Peak detection
means that we compare the number of detected prevalent peaks
between the different preprocessing methods. Peak quantification
means the differences in m over z values and the differences in
intensity between the detected prevalent peaks and original
spectrum are compared. Using the three methods in the present
study, the number of detected peaks is quite different. As can be
seen in Figure 4(a) and Figure 4(b), HHTMass1 detects the
most peaks and HHTMass2 detects the least peaks; furthermore,
Figure 4(c) shows that HHTMass3 failed to detect the biggest
peak in the B (4000DA,6000DA) region. Therefore, it is clear
that the number of the peaks detected is not the only reference
material that we need to consider when assessing the performance
of preprocessing methods and these are explored below.
In this context, we would expect that the profile of the
preprocessed spectrum should be similar to that of the original,
especially the intensity of the obvious peaks. However, part of
preprocessing aims at decreasing the large scale of the spectrum.
The scale of the ovarian dataset is very large and is full of
complex signals. With such a large scale, noise exists to a very
significant extent across the spectrum. The best approach to this
problem is to maintain the exterior of the profile; therefore we
decreased the scale by about 50% in proportion to the original.
Figure 2(a) represents the original data and Figure 2(b)represents the data after using Hilbert Huang transformation
formula and other modifications during preprocessing. When the
two figures are compared, it can be seen that the chief peaks and
the exterior profile of the spectrum are maintained. Nevertheless,
the approach has attempted to remove the signaling errors due
to machine and chemical noise. Although we have tried to
maintain the exterior profile of the spectrum, we still need to
determine whether the peaks present in the preprocessed
spectrum are noise or true signals. Finally, when correcting
spectra and for visual calibrating purposes, it is better if the
baseline of the spectrum is moved to the origin point of the
coordinates. Therefore, the final goals of a preprocessing method
include retaining the spectrum profile, removing noise, and
adjusting the baseline.
Using a comparison of peak numbers is only one way of
assessing the performance of a preprocessing method. In this study
we not only calculated the number of detected peaks but also
assessed the real location of the peaks in the spectrum. When the
dataset has a large scale, which is the case with the present dataset,
peak quantification as an assessment method needs to be replaced
because once we have rescaled the spectrum but maintained the
spectrum profile then the relative intensity of the peaks becomes
meaningless. Therefore, in this analysis, we used visual comparison
as the means of assessing performance rather than peak
quantification. In this context, the visual comparison involves
comparing the distance between the peaks and appearance of the
peaks as detected before and after preprocessing.
Figure 6. Different peaks detected by different peak selection method on full spectrum us HHTMass. (a) The ovarian cancer datasetpreprocessed by HHTMass1. The detected peaks cover most raised peaks. HHTMass1 detected 218 peaks in the whole region. (b) The ovarian cancerdataset preprocessed by HHTMass2. HHTMass2 tends to detect the more obvious peaks. This algorithm detected 80 peaks across the whole region.(c) The ovarian cancer dataset preprocessed by HHTMass3. HHTMass3 misses the third largest peak close to 6000DA. HHTMass3 detected 108 peaksin the whole region.doi:10.1371/journal.pone.0012493.g006
Table 2. The amount of the peaks detected in severalpopular algorithms.
Region
Algorithm All A B C D E F G
PRO1 145 46 24 19 18 16 16 6
PRO2 114 40 23 8 12 13 14 4
HHTMass3 (HHT+PRO) 108 21 18 19 13 14 13 10
MSW 188 51 39 25 24 22 20 7
HHTMass1(HHT+MSW) 218 35 32 27 21 44 38 21
PROMSW 198 54 37 33 25 23 18 8
SpecAlign 186 67 43 21 18 16 14 7
HHTMass2(HHT+Specalign) 80 18 17 6 11 8 9 3
PRO1 and PRO2 mean different way to estimate the baseline in PROcess. MSWis the abbreviation of MassSpecWavelet. PROMSW is the combinationpreprocessing method of PROcess for peak quantification andMassSpecWavelet for peak detection. HHTMass1, HHTMass2, HHTMass3 onlyreplace the preprocess method and use the original peak selection methodrespectively.doi:10.1371/journal.pone.0012493.t002
Using HHT on Mass Spectrometry
PLoS ONE | www.plosone.org 8 August 2010 | Volume 5 | Issue 8 | e12493
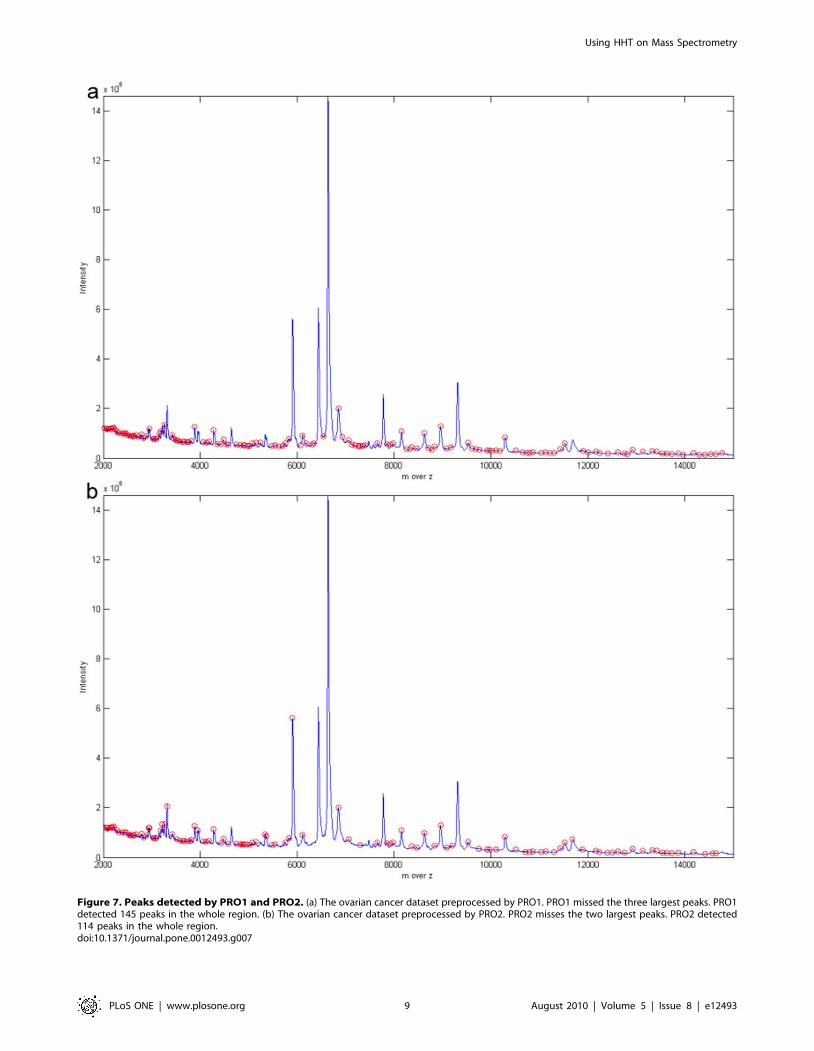
Figure 7. Peaks detected by PRO1 and PRO2. (a) The ovarian cancer dataset preprocessed by PRO1. PRO1 missed the three largest peaks. PRO1detected 145 peaks in the whole region. (b) The ovarian cancer dataset preprocessed by PRO2. PRO2 misses the two largest peaks. PRO2 detected114 peaks in the whole region.doi:10.1371/journal.pone.0012493.g007
Using HHT on Mass Spectrometry
PLoS ONE | www.plosone.org 9 August 2010 | Volume 5 | Issue 8 | e12493

Using HHT on Mass Spectrometry
PLoS ONE | www.plosone.org 10 August 2010 | Volume 5 | Issue 8 | e12493

Cruz-Marcelo, Guerra et al. [7] suggested several methods of
dealing with a spectrum and these included MassSpecWavelet [12]
for peak detection and PROcess [9] for peak quantification. Cruz-
Marcelo, Guerra et al. [7] suggested that a combined method
involving both MassSpecWavelet and PROcess could be used. In
addition to the above, we also used the commonly available tool
SpecAlign. [11]. Thus, in this analysis, we compare our
preprocessing method with those mentioned above and these are
abbreviated to SpecA-lign SA, MassSpecWavelet MSW and
PROcess PRO as shown in the Result sections.
Results
We computed the average of fifty original ovarian cancer
spectrums and then identified with symbols where the various
methods detected peaks using the average raw data. This allows
performance to be more obviously compared. Our preprocessing
method was then utilized and the best peak detection system
identified; then we compare the results of five well known
preprocessing methods with our preprocessing approach.
Results after Hilbert Huang transformation andmodification
We used HHT to preprocess the ovarian cancer data. The raw
data is obviously full of noise, especially in the low region. HHT
decomposed each spectrum into sixteen components. We called
these components Ci for i [1,2,…,16] (Figure 1). Figure 1
indicates that the components from C1 to C7 contain mostly noise,
while components from C14 to C16 are associated with the trend
of the spectrum. When these components are removed (Figure 5)
then the wave pattern become much smoother. After HHT, the
spectrum is made up of both positive and negative parts. Based on
the results of the modification shown in Figure 2(b), we subtract
the baseline from spectra and rescale the spectrum to be positive.
Results of a comparison between our methodsAfter HHT and the follow up modifications, we used
MassSpecWavelet, SpecAlign, and PROcess for peak detection.
It should be note that these algorithms were not used for
preprocessing, which was only carried out by HHTMass. We
marked an area on the original spectrum and separate this into
seven regions for convenience. As shown in Table 1, HHTMass1
detected the most number of peaks, namely 218. In contrast,
HHTMass2 detected the least number of peaks. Nevertheless,
although HHTMass2 (Figure 6(b)) detected the least number of
peaks, those detected covered all of the obvious peaks in the
original spectrum. This differed from HHTMass3, which missed
several significant peaks (Figure 6(c)). Based on the above results,
we chose HHTMass1 and HHTMass2 as our approaches to
spectrum analysis and rejected HHTMass3.
Results of comparison between our method and othermethods
According to Cruz-Marcelo, Guerra et al. [7], the algorithms
PROcess [9] and MassSpecWavelet [12] gave the best perfor-
mance in terms of peak quantification and peak detection. The
authors then suggest a combination of PROcess for peak quan-
tification and MassSpecWavelet for peak detection. In addition,
SpecAlign [11] is a well-known software package used to handle
mass spectrum data. Therefore, we compared our algorithms,
HHTMass1 and HHTMass2, with PROcess, MassSpecWavelet,
SpecAlign, and a combination of PROcess and MassSpecWavelet
[7]. The combination of PROcess and MassSpecWavelet is
abbreviated to PROMSW in this study.
PROcess used two methods to estimate the baseline. One uses
local interpolation and the other uses local regression. Based on
Cruz-Marcelo, Guerra et al. [7], the former was designated PRO1
and the latter PRO2. Table 2 shows that HHTMass1 is able to
detect the most peaks and HHTMass2 detects the least peaks.
When Figure 7(a) and Figure 7(b) are examined, PRO1 and
PRO2 miss the two most obvious peaks whereas the other
algorithms detect these peaks. MSW (Figure 8(a)) and
PROMSW Figure 8(b)) seem to cover most of the obvious
peaks on visual assessment. However, as we amplify the spectra,
some marked peaks are counted twice with MSW and PROMSW.
SpecAlign (Figure 8(c)) performs well in terms of visual
assessment; however, as can be seen from Table 2, SpecAlign
detects more peaks than the other approaches in the range
between 2000Da and 6000Da. If the associated documents
produced by BIO-RAID Laboratories for the Proteinchip matrices
(ProteinChipH) are examined, there are three common Pro-
teinchip matrices that are used in SELDI technology, namely:
N Alpha-cyano-4-hydroxycinnamic acid (CHCA), which enables
efficient laser desorption and ionization of small proteins
(,30 kDa).
N Sinapinic acid (SPA), which enables efficient laser desorption
and ionization of larger proteins (10–150 kDa).
N EAM-1, a proprietary formulation, that enables efficient laser
desorption and ionization of glycosylated proteins and proteins
in the 15–50 kDa range
As suggested by the manufacturer’s documents, low regions
such as 2000Da to 6000Da are usually ignored due to the large
amount of noise and the restrictions caused by the Proteinchip
matrices and samples. Therefore, when looked at from either the
statistical point of view [6], or the biological point of view, the
Figure 8. Peaks detected by other methods. (a) The ovarian cancer dataset preprocessed by MassSpecWavelet. MassSpecWavelet producedsome redundancies when detecting peaks. For example, the biggest peak is detected twice. MassSpecWavelet detected 188 peaks. (b) The ovariancancer dataset preprocessed by PROMSW. PROMSW produced some redundancies when detecting the peaks and the result is similar to Figure 8(a).(c) The ovarian cancer dataset preprocessed by SpecAlign. The peaks detected by SpecAlign are concentrated in the region between 2000DA and6000DA. SpecAlign detected 186 peaks in the whole region.doi:10.1371/journal.pone.0012493.g008
Table 3. CPU time of different approach (in seconds).
Algorithm Sample No. HHT MASCAP (wavelet)
Plasma P_1 4084.7777 8.724561
Plasma P_2 3949.6833 8.996664
Plasma P_3 3908.3151 8.151383
Plasma P_4 4049.2662 7.785374
Plasma P_5 3939.0311 8.117013
Average 3986.2147 8.4094196
doi:10.1371/journal.pone.0012493.t003
Using HHT on Mass Spectrometry
PLoS ONE | www.plosone.org 11 August 2010 | Volume 5 | Issue 8 | e12493

peaks located in the this low region are less significant. As shown in
Table 2, SepcAlign has a disadvantage when preprocessing such
data and HHTMass is able to conquer this problem. HHTMass1
detects fewer peaks between 2000Da and 6000Da but detects
more peaks between 10 kDa and 15kDa. Overall, HHTMass2 is
more uniform when examining the low and high regions. This
Figure 9. The spectrum of background. The organic acid used in the experiment is CHCA, which has a molecular weight of less than 1000 Da.doi:10.1371/journal.pone.0012493.g009
Figure 10. The spectrum of VrD1. VrD1 is a small protein with a molecular weight of about 5119 Da.doi:10.1371/journal.pone.0012493.g010
Using HHT on Mass Spectrometry
PLoS ONE | www.plosone.org 12 August 2010 | Volume 5 | Issue 8 | e12493

Using HHT on Mass Spectrometry
PLoS ONE | www.plosone.org 13 August 2010 | Volume 5 | Issue 8 | e12493

may result to the non-stationary feature if HHT which remove
different amount of noises in high and low m/z region.
Analysis execution timeThe major drawback of non-stationary analysis processes as
described here is that they takes a longer time for the processing a
set of data. For comparison, the experiments using the different
methods were carried out on an Intel Pentium 4 personal
computer running at 3.0 Gz with 1.5 gigabytes of memory; the
computer used Windows XP (c) SP3 and MATLAB(c) R2006a.
The dataset used in this test was the MASCAP plasma sample
numbers P1,P5 [22], available at http://www.unich.it/proteo-
mica/bioinf. Each sample contains mass data from about 500DA
to 22200DA. Table 3 shows the different times needed for the
different approaches, such as wavelet method (MASCAP) and
HHT. It is clear that HHT is about 5006 slower than wavelet
methods such as MASCAP. Using HHT, the user will have to wait
more than 1 hour before the analysis is finished but a linear
method like MASCAP takes less than 9 seconds. Processing time is
an issue that is being addressed at the moment, but it is unlikely
that any changes instituted will result in HHT being as fast as the
linear methods. Although the longer processing time is a
drawback, biologists using mass spectrometry for diagnosis are
more interested in accuracy and the processing time at present is
not extraordinary (such as days). Methods such as using GPU to
accelerated the computation in [23] can easily be reduced (also by
improving the computer in terms of CPU, memory and operating
system), but a better result is still a better result whether it takes
1 hour or 10 minutes.
Validation using experimental dataThe quality of the peaks ins more important than the number
of peaks, but we did not know which peak is correct in the current
data. To show that known protein can be detect in our method,
we proceed with biology experimental data validation (which did
not done in many method discussed in related works). We
acquired experimental data from Cathay General Hospital. The
dataset consists of two main parts. The first sample contains only
water and the molecular weight of water is approximate 18Da,
which is closed to zero. The second sample contains the protein,
VrD1, which has a molecular weight of about 5119 Da. In both
experiments, we use the same organic acid CHCA, which has a
molecular weight of less than 1000 Da. Figure 9 shows the
spectrum obtain from the water sample and this is distributed
almost completely across a region that is less than 1000 Da.
Figure 10 shows the spectrum of VrD1, which has several peaks
that are larger than 1000 Da. However, some noise exists in
Figure 9 because the molecular weight of CHCA is less than
1000 Da. Moreover, if we consider VrD1 with the double charge,
then this would create a significant peak located on (5119+1)/
Figure 11. Peak detection on VrD1 data. (a) Peak detection of VrD1 by MassSpecWavelet. The circled purple points are the peaks detected byMassSpecWavelet. (b) Peak detection of VrD1 by SpecAlign. The circled purple points are the peaks detected by SpecAlign. (c) Peak detection of VrD1by HHTMass2. The circled purple points are the peaks detected by HHTMass2.doi:10.1371/journal.pone.0012493.g011
Figure 12. HHTMass on the VrD1 data. HHTMass2 detected the most significant peaks of VrD1, namely the ones at 5119 Da and 2560 Da.doi:10.1371/journal.pone.0012493.g012
Using HHT on Mass Spectrometry
PLoS ONE | www.plosone.org 14 August 2010 | Volume 5 | Issue 8 | e12493

2 Da. The major peaks larger than 1000 Da therefore should be
at approximate 5119 Da and 2560 Da and the rest of the peaks
can be considered to be noise in the VrD1 spectrum. If we use the
region of the VrD1 spectrum larger than 1000 Da, MassSpec-
Wavelet detects 340 peaks as shown in Figure 11(a) and
SpecAlign detects 355 peaks as shown in Figure 11(b).However, HHTMass2 detects only 22 peaks as shown in
Figure 11(c). Using this dataset, the most significant peaks are
closed to 5119 Da and 2560 Da. HHTMass2 detects the correct
significant peaks as shown in Figure 12. However, while
MassSpecWavelet and SpecAlign are also able to detect the
correct significant peaks, these events are masked because these
approaches also detect many more of the redundant peaks, which
confuse the results.
Discussion
The mass spectrometry data exist shifting problem which make
the m/z scale not stationary. In this study we describe a novel
preprocessing method that is better adapted to mass spectrometry
data. We use the Hilbert Huang transformation to remove noise
from the data by decomposing the spectrum into sixteen
components. It should be noted that the total number of
components is not always the same. Then by removing the
components, we are able to pinpoint the significant information
that is the real data. Finally, we estimate the baseline of the
spectrum and remove the baseline.
Two peak detection methods, HHTMass1 and HHTMass2, are
proposed here. When these are compared, HHTMass1 detects the
most of the peaks. Although the number of peaks detected by
PROMSW is close to that of HHTMass1, the peaks detected by
PROMSW show too much redundancy. HHTMass2 detects the
least peaks but these peaks are the most significant peaks. Although
the results from SpecAlign are similar to HHTMass2, this program
detects too many peaks in the low region of the spectrum, which is
generally regarded as a region full of noise. Based on these
comparisons, we conclude that using the Hilbert Huang transfor-
mation as a preprocessing step and carrying out the relevant
modifications to the spectrum is able to improve peak detection
performance. The two preprocessing methods, HHTMass1 and
HHTMass2, have different advantages and therefore the choice of
peak detection method can be split into two distinct policies. Firstly,
HHTMass1 is suitable for constructing a model that is able to
distinguish a disease group from control group. Secondly,
HHTMass2 is suitable for picking out significant biomarkers. In
terms of the experimental validation, the use of HHTMass2
decreases redundancy and noise when we used a known protein as a
marker, which helped us to separate the important peaks in the
spectrum from the noise. In contrast, MassSpecWavelet and
SpecAlign tended to detect all peaks present in the sample whether
the peaks are significant or not. Our preprocessing approach fits
both MALDI and SELDI spectra and using our approach, even if
the noise varies between different diseases or between different
machines, HHTMass2 is able to ignore these effects.
The preprocessing method used is quite important when
analyzing mass spectrometry data because these datasets suffer
from unknown amounts of interference from chemical and electrical
noise. In addition, in many cases the scale of the spectrum tends to
be over large. This increases the difficulty that biologists encounter
when analyzing these dataset and constructing a statistical model.
The use of a preprocessing method is able to help distinguish the
control group from the disease group more easily and increases the
accuracy of identifying the correct biomarker.
Author Contributions
Conceived and designed the experiments: LCW. Performed the experi-
ments: HHC. Analyzed the data: HHC CL. Contributed reagents/
materials/analysis tools: JTH CL NEH YCC KFC. Wrote the paper:
LCW HHC.
References
1. Cho WC (2007) Proteomics technologies and challenges. Genomics Proteomics
Bioinformatics 5: 77–85.
2. Cho WC, Cheng CH (2007) Oncoproteomics: current trends and futureperspectives. Expert Rev Proteomics 4: 401–410.
3. Salmi J, Nyman TA, Nevalainen OS, Aittokallio T (2009) Filtering strategies forimproving protein identification in high-throughput MS/MS studies. Proteomics
9: 848–860.4. Shin H, Markey MK (2006) A machine learning perspective on the development
of clinical decision support systems utilizing mass spectra of blood samples.
J Biomed Inform 39: 227–248.5. Hilario M, Kalousis A, Pellegrini C, Muller M (2006) Processing and
classification of protein mass spectra. Mass Spectrom Rev 25: 409–449.6. Kwon D, Vannucci M, Song JJ, Jeong J, Pfeiffer RM (2008) A novel wavelet-
based thresholding method for the pre-processing of mass spectrometry data that
accounts for heterogeneous noise. Proteomics 8: 3019–3029.7. Cruz-Marcelo A, Guerra R, Vannucci M, Li Y, Lau CC, et al. (2008)
Comparison of algorithms for pre-processing of SELDI-TOF mass spectrometrydata. Bioinformatics 24: 2129–2136.
8. Fung ET, Enderwick C (2002) ProteinChip clinical proteomics: computational
challenges and solutions. Biotechniques Suppl: 34–38, 40–31.9. LiXea (2005) Seldi-tof mass spectrometry protein data. In: In Gentleman Rea,
editor (2005) Bioinformatics and Computational Biology Solutions Using R andBioconductor. New York: Springer. pp 99–109.
10. Malyarenko DI, Cooke WE, Adam BL, Malik G, Chen H, et al. (2005)Enhancement of sensitivity and resolution of surface-enhanced laser desorption/
ionization time-of-flight mass spectrometric records for serum peptides using
time-series analysis techniques. Clin Chem 51: 65–74.11. Wong JW, Cagney G, Cartwright HM (2005) SpecAlign–processing and
alignment of mass spectra datasets. Bioinformatics 21: 2088–2090.12. Du P, Kibbe WA, Lin SM (2006) Improved peak detection in mass spectrum by
incorporating continuous wavelet transform-based pattern matching. Bioinfor-
matics 22: 2059–2065.13. Randolph TW, Yasui Y (2006) Multiscale processing of mass spectrometry data.
Biometrics 62: 589–597.
14. Meuleman W, Engwegen JY, Gast MC, Beijnen JH, Reinders MJ, et al. (2008)
Comparison of normalisation methods for surface-enhanced laser desorption
and ionisation (SELDI) time-of-flight (TOF) mass spectrometry data. BMC
Bioinformatics 9: 88.
15. Beyer S, Walter Y, Hellmann J, Kramer PJ, Kopp-Schneider A, et al. (2006)
Comparison of software tools to improve the detection of carcinogen induced
changes in the rat liver proteome by analyzing SELDI-TOF-MS spectra.
J Proteome Res 5: 254–261.
16. Wu ZH, Huang NE, Long SR, Peng CK (2007) On the trend, detrending, and
variability of nonlinear and nonstationary time series. Proceedings of the
National Academy of Sciences of the United States of America 104:
14889–14894.
17. DiMagno EP, Corle D, O’Brien JF, Masnyk IJ, Go VL, et al. (1989) Effect of
long-term freezer storage, thawing, and refreezing on selected constituents of
serum. Mayo Clin Proc 64: 1226–1234.
18. Qu Y, Adam BL, Thornquist M, Potter JD, Thompson ML, et al. (2003) Data
reduction using a discrete wavelet transform in discriminant analysis of very high
dimensionality data. Biometrics 59: 143–151.
19. Coombes KR, Morris JS, Hu J, Edmonson SR, Baggerly KA (2005) Serum
proteomics profiling–a young technology begins to mature. Nat Biotechnol 23:
291–292.
20. Morris JS, Coombes KR, Koomen J, Baggerly KA, Kobayashi R (2005) Feature
extraction and quantification for mass spectrometry in biomedical applications
using the mean spectrum. Bioinformatics 21: 1764–1775.
21. Ge G, Wong GW (2008) Classification of premalignant pancreatic cancer mass-
spectrometry data using decision tree ensembles. BMC Bioinformatics 9: 275.
22. Mantini D, Petrucci F, Pieragostino D, Del Boccio P, Sacchetta P, et al. (2010) A
computational platform for MALDI-TOF mass spectrometry data: application
to serum and plasma samples. J Proteomics 73: 562–570.
23. Hussong R, Gregorius B, Tholey A, Hildebrandt A (2009) Highly accelerated
feature detection in proteomics data sets using modern graphics processing units.
Bioinformatics 25: 1937–1943.
Using HHT on Mass Spectrometry
PLoS ONE | www.plosone.org 15 August 2010 | Volume 5 | Issue 8 | e12493
Copyright © 2022 FDOKUMEN