A novel method to assess coronary artery bifurcations by OCT: cut-plane analysis for side-branch...
13
..................................................................................................................................................................................... ..................................................................................................................................................................................... A novel method to assess coronary artery bifurcations by OCT: cut-plane analysis for side-branch ostial assessment from a main-vessel pullback Antonios Karanasos 1 , Shengxian Tu 2 , Nienke S. van Ditzhuijzen 1 , Jurgen M.R. Ligthart 1 , Karen Witberg 1 , Nicolas Van Mieghem 1 , Robert-Jan van Geuns 1 , Peter de Jaegere 1 , Felix Zijlstra 1 , Johan H.C. Reiber 2 , and Evelyn Regar 1 * 1 Department of Interventional Cardiology, Thoraxcentre, BA-585, Erasmus University Medical Centre, Gravendijkwal 230, 3015 CE Rotterdam, The Netherlands; and 2 Division of Image Processing, Department of Radiology, Leiden University Medical Centre, Leiden, The Netherlands Received 25 April 2014; accepted after revision 10 August 2014 Aims In coronary bifurcations assessment, evaluation of side-branch (SB) ostia by an optical coherence tomography (OCT) pullback performed in the main branch (MB) could speed up lesion evaluation and minimize contrast volume. Dedicated software that reconstructs the cross-sections perpendicular to the SB centreline could improve this assessment. We aimed to validate a new method for assessing the SB ostium from an OCT pullback performed in the MB. Methods and results Thirty-one sets of frequency-domain OCT pullbacks from 28 patients, both from the MB and the SB of a coronary artery bifurcation were analysed. Measurements of the SB ostium from the SB pullback were used as a reference. Measurements of the SB ostium from the MB pullback were then performed in a laboratory setting by (i) conventional analysis and (ii) cut-plane analysis, and the measurement error for each analysis was estimated. Correlations of SB ostium measure- ments acquired from the MB pullback in comparison with reference measurements acquired from the SB pullback were higher with cut-plane analysis compared with conventional analysis, albeit not reaching statistical significance (area: r cut-plane ¼ 0.927 vs. r conventional ¼ 0.870, P ¼ 0.256; mean diameter: r cut-plane ¼ 0.918 vs. r conventional ¼ 0.788, P ¼ 0.056; minimum diameter: r cut-plane ¼ 0.841 vs. r conventional ¼ 0.812, P ¼ 0.734; maximum diameter: r cut-plane ¼ 0.770 vs. r conventional ¼ 0.635, P ¼ 0.316). Cut-plane analysis was associated with lower absolute error than conventional analysis (area: 0.56 + 0.45, vs. 1.50 + 1.31 mm 2 , P , 0.001; mean diameter: 0.18 + 0.14 vs. 0.44 + 0.30 mm, P , 0.001). Conclusion Measurements of SB ostium performed in a laboratory setting by cut-plane analysis of an OCT pullback of the main branch have high correlation with reference measurements performed in a SB OCT pullback and lower error compared with conventional analysis. ----------------------------------------------------------------------------------------------------------------------------------------------------------- Keywords optical coherence tomography † coronary artery interventions † intravascular imaging † intravascular ultrasound † percutaneous coronary intervention † coronary stents Introduction Bifurcation lesions are associated with increased events following percutaneous coronary intervention (PCI). Factors contributing to this adverse outcome include limitations of angiography in assessment of side-branch (SB) disease severity 1 and the lack of established angio- graphic predictors of SB patency and lumen compromise. Intravascular imaging has provided new understanding of mechan- isms associated with SB compromise following bifurcation PCI. 2 – 5 Optical coherence tomography (OCT) is an intravascular imaging modality that can potentially be used for bifurcation PCI guidance. 6,7 For the accurate characterization of bifurcation lesions, two OCT pullbacks are typically required: one from the main branch (MB) and a second separate OCT pullback from the SB. In clinical practice, * Corresponding author. Tel: +31 10 7035232; fax: +31 10 7035046, Email: [email protected] Published on behalf of the European Society of Cardiology. All rights reserved. & The Author 2014. For permissions please email: [email protected]. European Heart Journal – Cardiovascular Imaging doi:10.1093/ehjci/jeu176 European Heart Journal - Cardiovascular Imaging Advance Access published September 16, 2014 by guest on November 24, 2014 Downloaded from
-
Upload
independent -
Category
Documents
-
view
4 -
download
0
Transcript of A novel method to assess coronary artery bifurcations by OCT: cut-plane analysis for side-branch...

. . . . . . . . . . . . . . . . . . . . . . . . . . . . . . . . . . . . . . . . . . . . . . . . . . . . . . . . . . . . . . . . . . . . . . . . . . . . . . . . . . . . . . . . . . . . . . . . . . . . . . . . . . . . . . . . . . . . . . . . . . . . . . . . . . . . . . . . . . . . . . . . . . . . . . . . . . . . . . . . . . . . . . . . . . . . . . . . . . . . .
. . . . . . . . . . . . . . . . . . . . . . . . . . . . . . . . . . . . . . . . . . . . . . . . . . . . . . . . . . . . . . . . . . . . . . . . . . . . . . . . . . . . . . . . . . . . . . . . . . . . . . . . . . . . . . . . . . . . . . . . . . . . . . . . . . . . . . . . . . . . . . . . . . . . . . . . . . . . . . . . . . . . . . . . . . . . . . . . . . . . .
A novel method to assess coronary arterybifurcations by OCT: cut-plane analysis forside-branch ostial assessment from amain-vessel pullbackAntonios Karanasos1, Shengxian Tu2, Nienke S. van Ditzhuijzen1, Jurgen M.R. Ligthart1,Karen Witberg1, Nicolas Van Mieghem1, Robert-Jan van Geuns1, Peter de Jaegere1,Felix Zijlstra1, Johan H.C. Reiber2, and Evelyn Regar1*
1Department of Interventional Cardiology, Thoraxcentre, BA-585, Erasmus University Medical Centre, Gravendijkwal 230, 3015 CE Rotterdam, The Netherlands; and2Division of Image Processing, Department of Radiology, Leiden University Medical Centre, Leiden, The Netherlands
Received 25 April 2014; accepted after revision 10 August 2014
Aims In coronary bifurcations assessment, evaluation of side-branch (SB) ostia by an optical coherence tomography (OCT)pullback performed in the main branch (MB) could speed up lesion evaluation and minimize contrast volume. Dedicatedsoftware that reconstructs the cross-sections perpendicular to the SB centreline could improve this assessment.We aimed to validate a new method for assessing the SB ostium from an OCT pullback performed in the MB.
Methodsand results
Thirty-one sets of frequency-domain OCT pullbacks from 28 patients, both from the MB and the SB of a coronary arterybifurcation were analysed. Measurements of the SB ostium from the SB pullback were used as a reference. Measurementsof the SB ostium from the MB pullback were then performed in a laboratory setting by (i) conventional analysis and(ii) cut-plane analysis, and the measurement error for each analysis was estimated. Correlations of SB ostium measure-ments acquired from the MB pullback in comparison with reference measurements acquired from the SB pullback werehigher with cut-plane analysis compared with conventional analysis, albeit not reaching statistical significance (area:rcut-plane¼ 0.927 vs. rconventional¼ 0.870, P ¼ 0.256; mean diameter: rcut-plane ¼ 0.918 vs. rconventional ¼ 0.788, P ¼ 0.056;minimum diameter: rcut-plane¼ 0.841 vs. rconventional ¼ 0.812, P ¼ 0.734; maximum diameter: rcut-plane ¼ 0.770 vs.rconventional ¼ 0.635, P ¼ 0.316). Cut-plane analysis was associated with lower absolute error than conventional analysis(area: 0.56+0.45, vs. 1.50+1.31 mm2, P , 0.001; mean diameter: 0.18+0.14 vs. 0.44+0.30 mm, P , 0.001).
Conclusion Measurements of SB ostium performed in a laboratory settingby cut-plane analysis of anOCT pullbackof the main branchhave high correlation with reference measurements performed in a SB OCT pullback and lower error compared withconventional analysis.
- - - - - - - - - - - - - - - - - - - - - - - - - - - - - - - - - - - - - - - - - - - - - - - - - - - - - - - - - - - - - - - - - - - - - - - - - - - - - - - - - - - - - - - - - - - - - - - - - - - - - - - - - - - - - - - - - - - - - - - - - - - - - - - - - - - - - - - - - - - - - - - - - - - - - - - - - - -Keywords optical coherence tomography † coronary artery interventions † intravascular imaging † intravascular ultrasound †
percutaneous coronary intervention † coronary stents
IntroductionBifurcation lesions are associated with increased events followingpercutaneous coronary intervention (PCI). Factors contributing tothis adverse outcome include limitations of angiography in assessmentof side-branch (SB) disease severity1 and the lack of established angio-graphic predictors of SB patency and lumen compromise.
Intravascular imaging has provided new understanding of mechan-isms associated with SB compromise following bifurcation PCI.2– 5
Optical coherence tomography (OCT) is an intravascular imagingmodality that can potentially be used for bifurcation PCI guidance.6,7
For the accurate characterization of bifurcation lesions, two OCTpullbacks are typically required: one from the main branch (MB)and a second separate OCT pullback from the SB. In clinical practice,
* Corresponding author. Tel: +31 10 7035232; fax: +31 10 7035046, Email: [email protected]
Published on behalf of the European Society of Cardiology. All rights reserved. & The Author 2014. For permissions please email: [email protected].
European Heart Journal – Cardiovascular Imagingdoi:10.1093/ehjci/jeu176
European Heart Journal - Cardiovascular Imaging Advance Access published September 16, 2014by guest on N
ovember 24, 2014
Dow
nloaded from
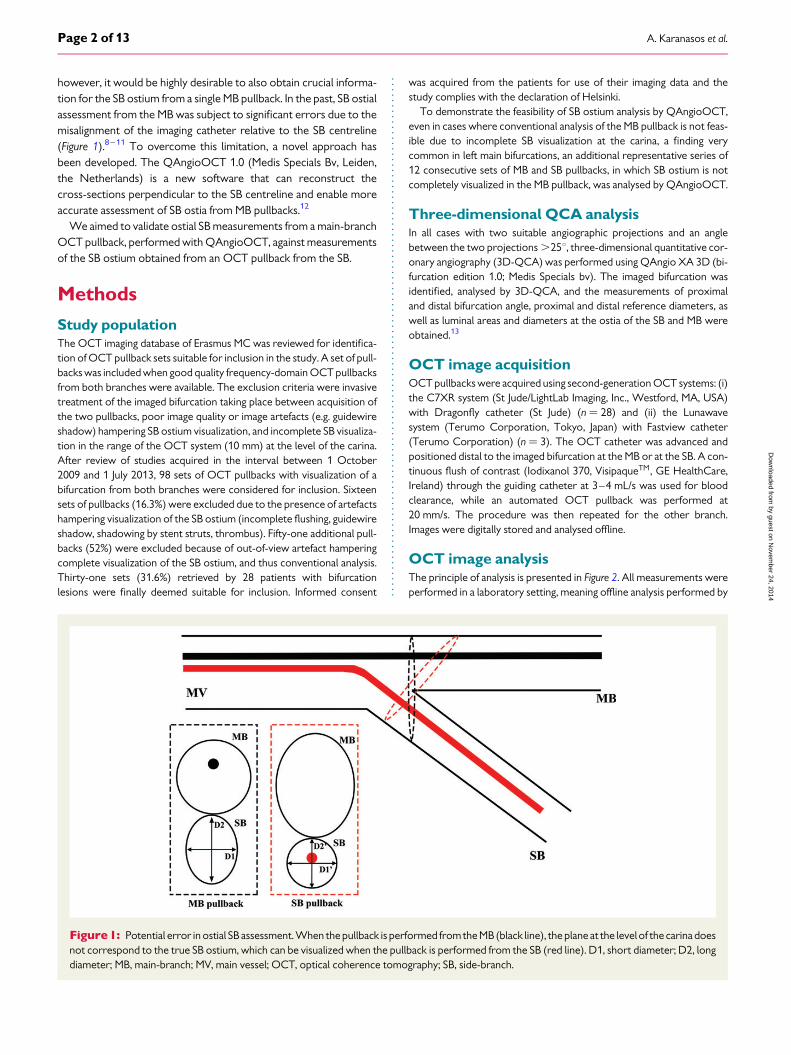
however, it would be highly desirable to also obtain crucial informa-tion for the SB ostium from a single MB pullback. In the past, SB ostialassessment from the MB was subject to significant errors due to themisalignment of the imaging catheter relative to the SB centreline(Figure 1).8 –11 To overcome this limitation, a novel approach hasbeen developed. The QAngioOCT 1.0 (Medis Specials Bv, Leiden,the Netherlands) is a new software that can reconstruct thecross-sections perpendicular to the SB centreline and enable moreaccurate assessment of SB ostia from MB pullbacks.12
We aimed to validate ostial SB measurements from a main-branchOCT pullback, performed with QAngioOCT, against measurementsof the SB ostium obtained from an OCT pullback from the SB.
Methods
Study populationThe OCT imaging database of Erasmus MC was reviewed for identifica-tion of OCT pullback sets suitable for inclusion in the study. A set of pull-backs was included when good quality frequency-domain OCT pullbacksfrom both branches were available. The exclusion criteria were invasivetreatment of the imaged bifurcation taking place between acquisition ofthe two pullbacks, poor image quality or image artefacts (e.g. guidewireshadow) hampering SB ostium visualization, and incomplete SB visualiza-tion in the range of the OCT system (10 mm) at the level of the carina.After review of studies acquired in the interval between 1 October2009 and 1 July 2013, 98 sets of OCT pullbacks with visualization of abifurcation from both branches were considered for inclusion. Sixteensets of pullbacks (16.3%) were excluded due to the presence of artefactshampering visualization of the SB ostium (incomplete flushing, guidewireshadow, shadowing by stent struts, thrombus). Fifty-one additional pull-backs (52%) were excluded because of out-of-view artefact hamperingcomplete visualization of the SB ostium, and thus conventional analysis.Thirty-one sets (31.6%) retrieved by 28 patients with bifurcationlesions were finally deemed suitable for inclusion. Informed consent
was acquired from the patients for use of their imaging data and thestudy complies with the declaration of Helsinki.
To demonstrate the feasibility of SB ostium analysis by QAngioOCT,even in cases where conventional analysis of the MB pullback is not feas-ible due to incomplete SB visualization at the carina, a finding verycommon in left main bifurcations, an additional representative series of12 consecutive sets of MB and SB pullbacks, in which SB ostium is notcompletely visualized in the MB pullback, was analysed by QAngioOCT.
Three-dimensional QCA analysisIn all cases with two suitable angiographic projections and an anglebetween the two projections .258, three-dimensional quantitative cor-onary angiography (3D-QCA) was performed using QAngio XA 3D (bi-furcation edition 1.0; Medis Specials bv). The imaged bifurcation wasidentified, analysed by 3D-QCA, and the measurements of proximaland distal bifurcation angle, proximal and distal reference diameters, aswell as luminal areas and diameters at the ostia of the SB and MB wereobtained.13
OCT image acquisitionOCT pullbacks were acquired using second-generation OCT systems: (i)the C7XR system (St Jude/LightLab Imaging, Inc., Westford, MA, USA)with Dragonfly catheter (St Jude) (n ¼ 28) and (ii) the Lunawavesystem (Terumo Corporation, Tokyo, Japan) with Fastview catheter(Terumo Corporation) (n ¼ 3). The OCT catheter was advanced andpositioned distal to the imaged bifurcation at the MB or at the SB. A con-tinuous flush of contrast (Iodixanol 370, VisipaqueTM, GE HealthCare,Ireland) through the guiding catheter at 3–4 mL/s was used for bloodclearance, while an automated OCT pullback was performed at20 mm/s. The procedure was then repeated for the other branch.Images were digitally stored and analysed offline.
OCT image analysisThe principle of analysis is presented in Figure 2. All measurements wereperformed in a laboratory setting, meaning offline analysis performed by
Figure1: Potential error in ostial SB assessment. When the pullback is performed fromthe MB (black line), the plane at the level of the carina doesnot correspond to the true SB ostium, which can be visualized when the pullback is performed from the SB (red line). D1, short diameter; D2, longdiameter; MB, main-branch; MV, main vessel; OCT, optical coherence tomography; SB, side-branch.
A. Karanasos et al.Page 2 of 13
by guest on Novem
ber 24, 2014D
ownloaded from

Figure 2: Study diagram. Two OCT studies corresponding to the same bifurcation were available: one with pullback from the SB (red dashed line)and theotherwithpullback fromtheMB(blackdashed line).Conventional SBostiummeasurements wereperformed from theSBpullback.Measure-ments of the SB ostium from the MB pullback were performed by (1) conventional analysis and (2) cut-plane analysis. The measurement error foreachanalysiswas then estimated using the SBpullback as a reference.Note the lumen shape similarity between the actual SB ostium and the cut-planereconstruction of the SB ostium from the MB. Abbreviations as in Figure 1.
Side-branch evaluation by main-vessel OCT Page 3 of 13
by guest on Novem
ber 24, 2014D
ownloaded from
an experienced observer (A.K.). Measurements were performed (i) byconventional analysis of the SB pullback; (ii) by conventional analysis ofthe MB pullback; and (iii) by cut-plane analysis of the MB pullback. Con-ventional analysis measurements from the SB pullback were used as a ref-erence. Measurements included SB diameter and area, which weredefined as the diameter and area, respectively, of the SB ostium. TheSB ostium for the purposes of the analysis was defined as the firstframe with carina visualization. SB diameter measurements includedthe minimum, maximum, and mean lumen diameters.
SB pullback: conventional analysisThe SB ostium was identified and diameter and area measurementswere performed using the St Jude/Lightlab offline software for C7XRpullbacks and the QCU-CMS software (Medis Specials bv) for Lunawavepullbacks.
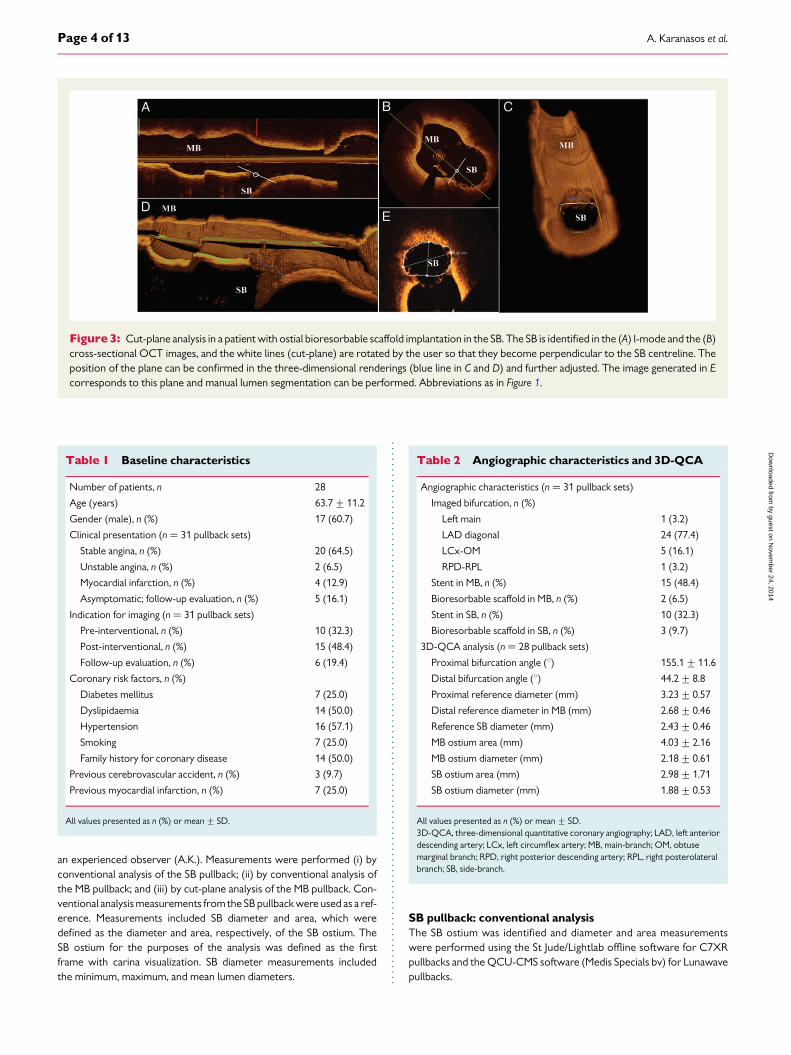
Figure 3: Cut-plane analysis in a patient with ostial bioresorbable scaffold implantation in the SB. The SB is identified in the (A) l-mode and the (B)cross-sectional OCT images, and the white lines (cut-plane) are rotated by the user so that they become perpendicular to the SB centreline. Theposition of the plane can be confirmed in the three-dimensional renderings (blue line in C and D) and further adjusted. The image generated in Ecorresponds to this plane and manual lumen segmentation can be performed. Abbreviations as in Figure 1.
Table 1 Baseline characteristics
Number of patients, n 28
Age (years) 63.7+11.2
Gender (male), n (%) 17 (60.7)
Clinical presentation (n ¼ 31 pullback sets)
Stable angina, n (%) 20 (64.5)
Unstable angina, n (%) 2 (6.5)
Myocardial infarction, n (%) 4 (12.9)
Asymptomatic; follow-up evaluation, n (%) 5 (16.1)
Indication for imaging (n ¼ 31 pullback sets)
Pre-interventional, n (%) 10 (32.3)
Post-interventional, n (%) 15 (48.4)
Follow-up evaluation, n (%) 6 (19.4)
Coronary risk factors, n (%)
Diabetes mellitus 7 (25.0)
Dyslipidaemia 14 (50.0)
Hypertension 16 (57.1)
Smoking 7 (25.0)
Family history for coronary disease 14 (50.0)
Previous cerebrovascular accident, n (%) 3 (9.7)
Previous myocardial infarction, n (%) 7 (25.0)
All values presented as n (%) or mean+ SD.
Table 2 Angiographic characteristics and 3D-QCA
Angiographic characteristics (n ¼ 31 pullback sets)
Imaged bifurcation, n (%)
Left main 1 (3.2)
LAD diagonal 24 (77.4)
LCx-OM 5 (16.1)
RPD-RPL 1 (3.2)
Stent in MB, n (%) 15 (48.4)
Bioresorbable scaffold in MB, n (%) 2 (6.5)
Stent in SB, n (%) 10 (32.3)
Bioresorbable scaffold in SB, n (%) 3 (9.7)
3D-QCA analysis (n ¼ 28 pullback sets)
Proximal bifurcation angle (8) 155.1+11.6
Distal bifurcation angle (8) 44.2+8.8
Proximal reference diameter (mm) 3.23+0.57
Distal reference diameter in MB (mm) 2.68+0.46
Reference SB diameter (mm) 2.43+0.46
MB ostium area (mm) 4.03+2.16
MB ostium diameter (mm) 2.18+0.61
SB ostium area (mm) 2.98+1.71
SB ostium diameter (mm) 1.88+0.53
All values presented as n (%) or mean+ SD.3D-QCA, three-dimensional quantitative coronary angiography; LAD, left anteriordescending artery; LCx, left circumflex artery; MB, main-branch; OM, obtusemarginal branch; RPD, right posterior descending artery; RPL, right posterolateralbranch; SB, side-branch.
A. Karanasos et al.Page 4 of 13
by guest on Novem
ber 24, 2014D
ownloaded from
MB pullback: conventional analysisThe SB ostium was identified in the MB pullback. Diameter and area mea-surements were performed in the SB ostium using the St Jude/Lightlaboffline software for C7XR pullbacks and the QCU-CMS for Lunawavepullbacks.
MB pullback: cut-plane analysisThe MB pullbacks were saved as DICOM files and imported in theQAngioOCT software. The imaged SB was identified and analysedby the ‘cut-plane’ analysis module in the software. Image data on thecut-plane were reconstructed and visualized in 3D. The position andorientation of the cut-plane can be easily manipulated by using the cross-sectional and longitudinal images so that the cut-plane is adjusted tocapture the true vessel morphology perpendicular to the SB centreline.Quantification can be then directly performed from the cut-plane image.An example is presented in Figure 3.
Variability assessmentAll QAngioOCT measurements were assessed for intra-observer andinter-observer variability. Intra-observer variability was assessed by re-analysis of all studies by the same observer after 2 weeks. Inter-observervariability was assessed by reanalysis of all studies by a second independ-ent observer (N.v.D.).
Statistical analysisAll analyses were performed using the SPSS 20.0 (IBM, Chicago, IL, USA).The Pearson correlation coefficient was used to assess correlations ofmeasurements acquired from the SB with measurements acquired bythe MB with conventional or cut-plane analysis, and the significanceof the difference of the derived correlation coefficients was assessedby the z-test, following Fisher’s r-to-z transformation. The measurementerror for each method compared with reference measurements wasassessed by Bland–Altman plots. Differences in the absolute measure-ment error were assessed with the paired t-test. Intra-class correlationcoefficients (ICCs) for absolute agreement and Bland–Altman statisticswere used to assess intra- and inter-observer variability. A univariatelogistic regression analysis was performed to identify variables independ-ently associated with measurement error of the SB area. All variableswith a P-value of ,0.15 in the univariate analysis were examined withmulti-adjusted linear regression analysis with backward elimination,after excluding variables with high collinearity. A P-value of ,0.05 indi-cated statistical significance.
Results
Baseline and angiographic resultsBaseline characteristics are summarized in Table 1. Angiographiccharacteristics and 3D-QCA are described in Table 2. Three patientshad two separate sets of OCT examinations: in two cases they wereperformed pre- and post-stent implantation and in the other case thefirst set was performed after stent implantation and the second forfollow-up evaluation. 3D-QCA was performed in 28/31 cases,where twoangiographic views with .258difference in theprojectionangle were available. The mean proximal reference diameter was3.23+0.57 mm, mean reference diameter in distal MB was 2.68+0.46 mm, mean reference SB diameter was 2.43+ 0.46 mm, meanproximal bifurcation angle was 155.18+11.68, and mean distal bifur-cation angle was 44.28+ 8.88.
....
....
....
....
....
....
....
....
....
....
....
....
....
....
....
....
....
....
....
....
....
....
....
....
....
....
....
....
....
....
....
....
....
....
....
....
....
....
....
....
....
....
....
....
....
....
....
....
....
....
....
..
....
....
....
....
....
....
....
....
....
....
....
....
....
....
....
....
....
....
....
....
....
....
....
....
....
....
....
....
....
....
....
....
....
....
....
....
....
....
....
....
....
....
....
....
....
....
....
....
....
....
....
....
....
....
....
....
....
....
....
.
Tab
le3
Opt
ical
cohe
renc
eto
mo
grap
hym
easu
rem
ents
and
corr
espo
ndin
ger
rors
SB
pullb
ack:
conv
enti
ona
lan
alys
isM
Bpu
llbac
k:co
nven
tio
nala
naly
sis
MB
pullb
ack:
cut-
plan
ean
alys
is
Ref
eren
cem
easu
rem
ent
(mea
n+++++
SD
)M
easu
rem
ent
(mea
n+++++
SD
)E
rro
r(9
5%lim
its
ofa
gree
men
t)P
ears
on
corr
elat
ion
coef
fici
ent
(95%
CI)
Mea
sure
men
t(m
ean+++++
SD
)E
rro
r(9
5%lim
its
ofa
gree
men
t)P
ears
on
corr
elat
ion
coef
fici
ent
(95%
CI)
SBos
tium
lum
enar
ea(m
m2)
3.51
+1.
704.
43+
3.06
0.92
(22.
66to
4.49
)0.
870
(0.7
45to
0.93
6)3.
57+
1.92
0.06
(21.
37to
1.50
)0.
927
(0.8
53to
0.96
4)
SBos
tium
mea
ndi
amet
er(m
m)
2.06
+0.
562.
20+
0.82
0.14
(20.
89to
1.17
)0.
788
(0.6
02to
0.89
3)2.
05+
0.58
20.
01(2
0.47
to0.
46)
0.91
8(0
.835
to0.
960)
SBos
tium
min
imum
diam
eter
(mm
)1.
72+
0.57
1.80
+0.
800.
08(2
0.88
to1.
03)
0.81
2(0
.643
to0.
906)
1.64
+0.
622
0.08
(20.
76to
0.60
)0.
841
(0.6
90to
0.92
2)
SBos
tium
max
imum
diam
eter
(mm
)2.
53+
0.61
2.71
+0.
850.
19(2
1.14
to1.
51)
0.63
5(0
.362
to0.
808)
2.48
+0.
610.
00(2
0.80
to0.
81)
0.77
0(0
.567
to0.
885)
CI,
confi
denc
ein
terv
als;
MB,
mai
n-br
anch
;SB,
side
-bra
nch.
Side-branch evaluation by main-vessel OCT Page 5 of 13
by guest on Novem
ber 24, 2014D
ownloaded from

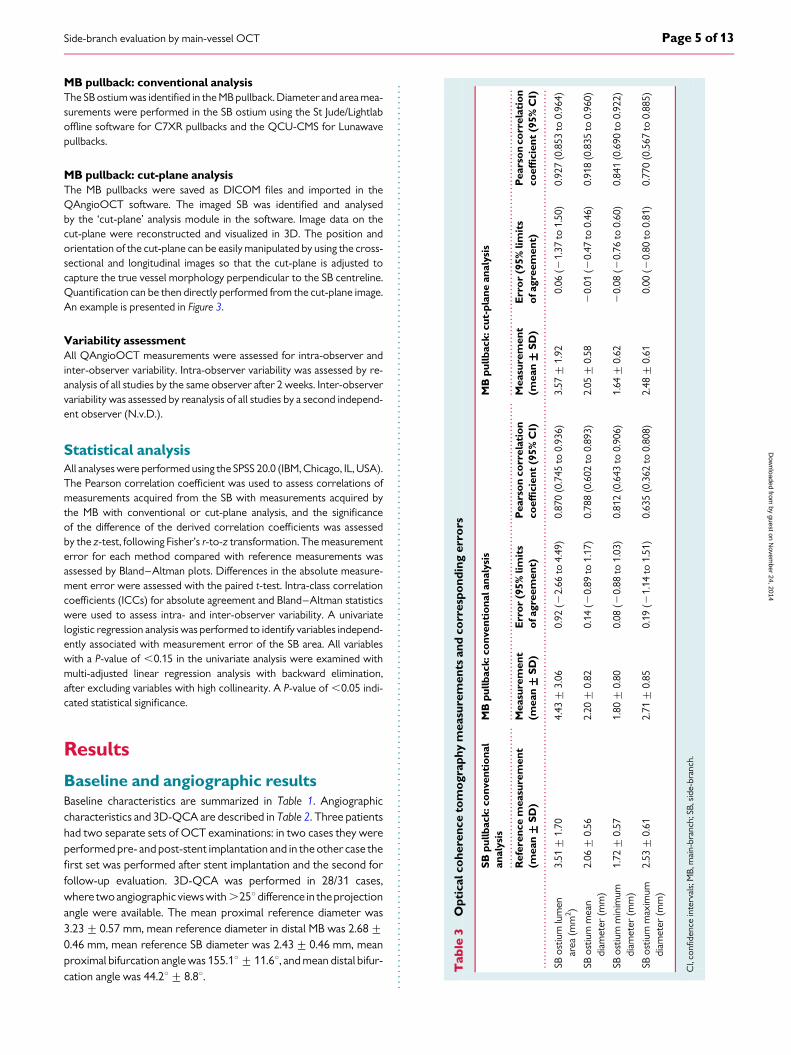
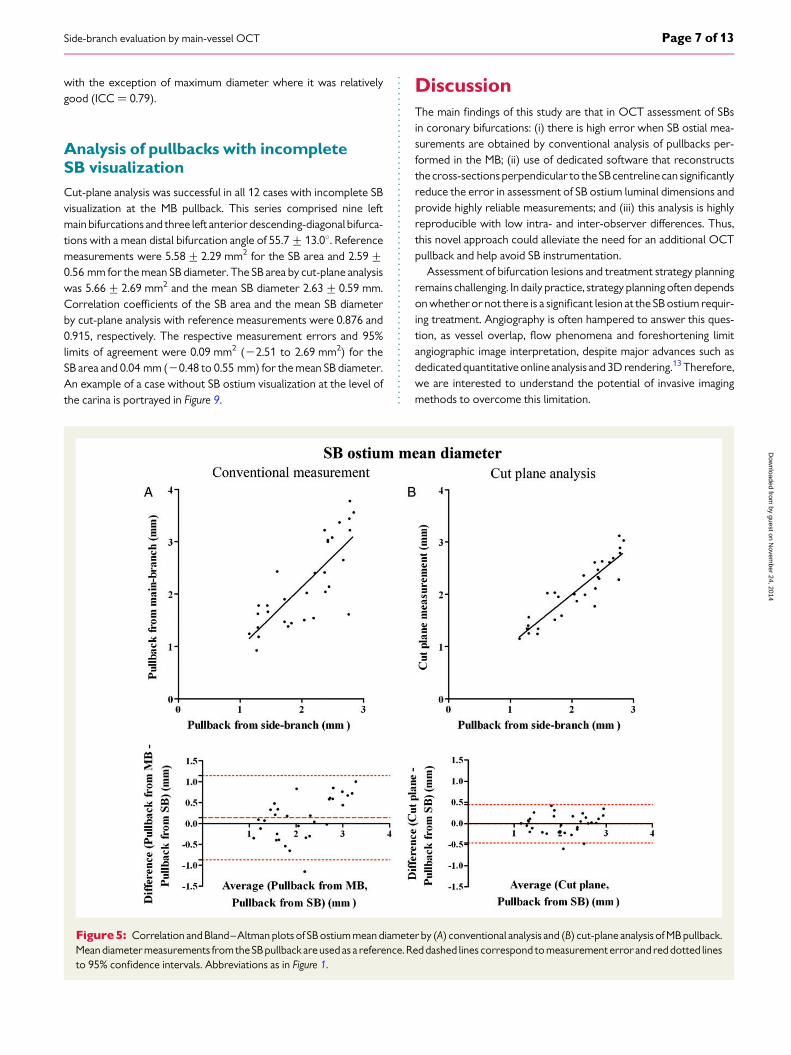
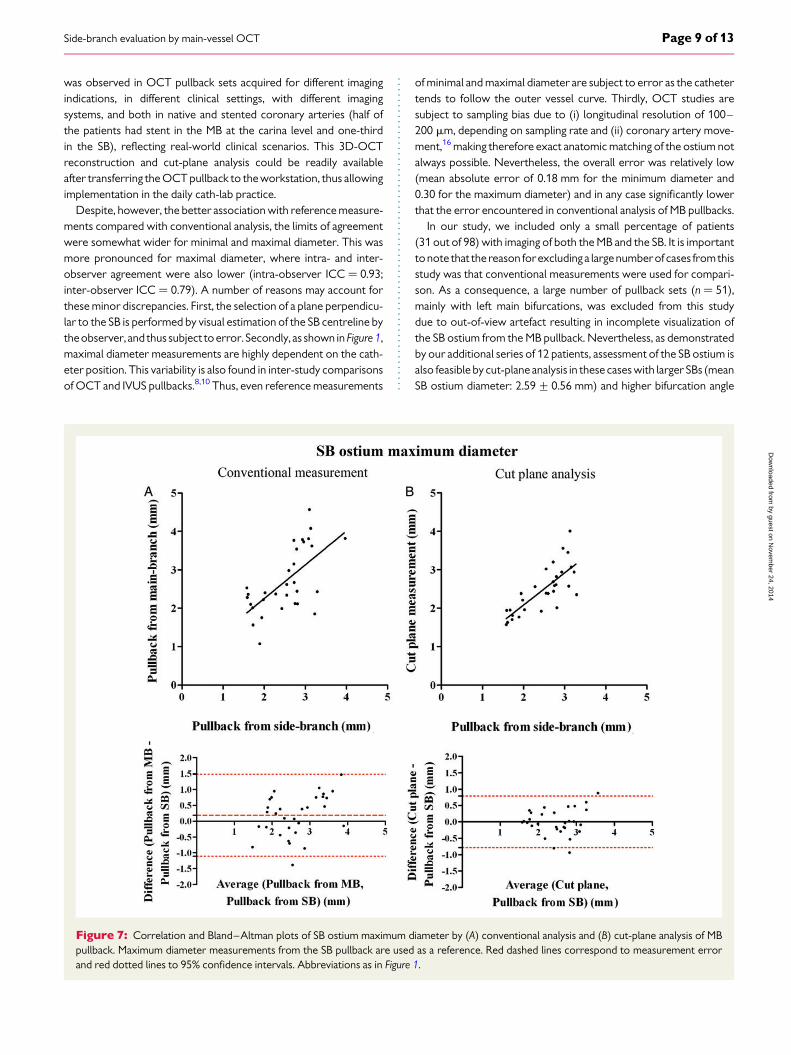
OCT analysisOCT measurements are presented in Table 3, together with themeasurement errors and correlation coefficients. Correlations ofarea and diameters of the SB ostium, acquired from the MB pullbackin comparison with those acquired from the SB pullback, were higherwith cut-plane analysis than with conventional analysis, albeit notreaching significance (area: rcut-plane ¼ 0.927 vs. rconventional ¼ 0.870,P ¼ 0.256; mean diameter: rcut-plane ¼ 0.918 vs. rconventional ¼ 0.788,P ¼ 0.056; minimum diameter: rcut-plane ¼ 0.841 vs. rconventional ¼
0.812, P ¼ 0.734; maximum diameter: rcut-plane ¼ 0.770 vs.rconventional ¼ 0.635, P ¼ 0.316).
As seen in the Bland–Altman plots, conventional measurements ofSB ostium area, mean diameter, minimum diameter, and maximumdiameter from the MB pullback were associated with significant error(Figures 3–7). Cut-plane analysis was associated with higher reliability,which can be appreciated by the lower mean error and the narrowerlimits of agreement (Figures 3–7). The absolute value of the error in
SB ostium measurements was reduced from 1.50+1.31 to 0.56+0.45 mm2 for area (P , 0.001), from 0.44+0.30 to 0.18+0.14 mmfor mean diameter (P , 0.001), from 0.39+0.29 to 0.22+0.27 mmfor minimum diameter (P ¼ 0.007), and from 0.59+0.37 to 0.30+0.26 mm for maximum diameter (P , 0.001), when cut-plane analysiswas used instead of conventional analysis (Figure 8).
In conventional analysis from the MB pullback, the measurementerror of the SB area was independently associated with the distal ref-erence diameter in SB and the presence of SB stent. However, the percent measurement error (measurement error/SB ostium area in SBpullback × 100) was associated only with the distal bifurcationangle (Tables 4 and 5).
Variability analysisIntra- and inter-observer agreement is presented in Table 6. Intra-observer agreement was very high for all measurements (all ICCs .
0.90). Inter-observer agreement was also very high (ICCs . 0.90),
Figure 4: Correlation and Bland–Altman plots of SB ostium area by (A) conventional analysis and (B) cut-plane analysis of MB pullback. Areameasurements from the SB pullback are used as a reference. Red dashed lines correspond to measurement error and red dotted lines to 95% con-fidence intervals. Abbreviations as in Figure 1.
A. Karanasos et al.Page 6 of 13
by guest on Novem
ber 24, 2014D
ownloaded from
with the exception of maximum diameter where it was relativelygood (ICC ¼ 0.79).
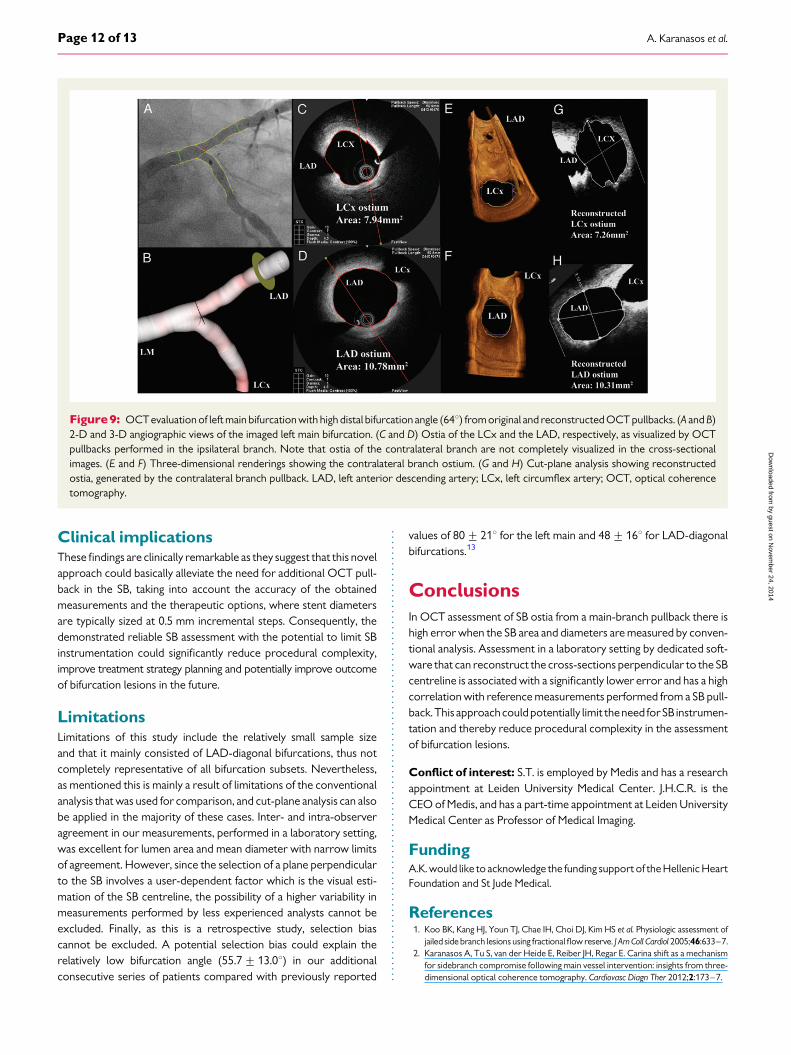
Analysis of pullbacks with incompleteSB visualizationCut-plane analysis was successful in all 12 cases with incomplete SBvisualization at the MB pullback. This series comprised nine leftmain bifurcations and three left anterior descending-diagonal bifurca-tions with a mean distal bifurcation angle of 55.7+ 13.08. Referencemeasurements were 5.58+2.29 mm2 for the SB area and 2.59+0.56 mm for the mean SB diameter. The SB area by cut-plane analysiswas 5.66+ 2.69 mm2 and the mean SB diameter 2.63+0.59 mm.Correlation coefficients of the SB area and the mean SB diameterby cut-plane analysis with reference measurements were 0.876 and0.915, respectively. The respective measurement errors and 95%limits of agreement were 0.09 mm2 (22.51 to 2.69 mm2) for theSB area and 0.04 mm (20.48 to 0.55 mm) for the mean SB diameter.An example of a case without SB ostium visualization at the level ofthe carina is portrayed in Figure 9.
DiscussionThe main findings of this study are that in OCT assessment of SBsin coronary bifurcations: (i) there is high error when SB ostial mea-surements are obtained by conventional analysis of pullbacks per-formed in the MB; (ii) use of dedicated software that reconstructsthe cross-sections perpendicular to the SBcentreline can significantlyreduce the error in assessment of SB ostium luminal dimensions andprovide highly reliable measurements; and (iii) this analysis is highlyreproducible with low intra- and inter-observer differences. Thus,this novel approach could alleviate the need for an additional OCTpullback and help avoid SB instrumentation.
Assessment of bifurcation lesions and treatment strategy planningremains challenging. In daily practice, strategy planning often dependson whether or not there is a significant lesion at the SB ostium requir-ing treatment. Angiography is often hampered to answer this ques-tion, as vessel overlap, flow phenomena and foreshortening limitangiographic image interpretation, despite major advances such asdedicated quantitative online analysis and 3D rendering.13 Therefore,we are interested to understand the potential of invasive imagingmethods to overcome this limitation.
Figure 5: Correlation and Bland–Altman plots of SB ostium mean diameter by (A) conventional analysis and (B) cut-plane analysis of MB pullback.Mean diameter measurements fromthe SB pullback areused as a reference. Reddashed lines correspond to measurement error and red dotted linesto 95% confidence intervals. Abbreviations as in Figure 1.
Side-branch evaluation by main-vessel OCT Page 7 of 13
by guest on Novem
ber 24, 2014D
ownloaded from

Previous intravascular ultrasound (IVUS) studies have studiedthe accuracy of SB evaluation from a main-branch pullback,showing that lumen and plaque measurements are subject to signifi-cant error depending on the relative position of the IVUS catheter.9
Similarly, in OCT studies of non-bifurcated segments, errors in luminalmeasurements are common, especially for the maximum diameter,due to misalignment of the imaging catheter with the lumen centre-line.8,11 Likewise, in our study, SB ostial measurements obtained byconventional analysis of a MB pullback were subject to significanterror. This error was markedly high with wide limits of agreement,with an absolute value of 1.50+ 1.31 mm2 for area and 0.44+0.30 mm for mean diameter. Importantly, in 50% of cases, the abso-lute error in SB ostium diameter measurement was .0.4 mm(Figure 8B). This could have important implications in the therapeuticapproach, as such a difference could lead to suboptimal sizing whenSB treatment is required. Moreover, while the main determinant ofSB area measurement error was the SB reference diameter—withlarger SBs associated with higher measurement errors—when theper cent SB area measurement error was assessed, the distal bifurca-tion angle was the only variable with a significant association.
Therefore, assessment of the SB ostium area from the MB pullbackusing conventional analysis should be avoided in cases with highdistal bifurcation angle, as the error can be particularly high. Thisfinding is in accordance with ex vivo and in vitro IVUS studiesshowing significant variability in measurements, depending on theangle of incidence of the ultrasound beam.14,15 Furthermore, in con-ventional assessment there was a mean overestimation of the SB areaby 0.92 mm2 and of the mean diameter by 0.14 mm. A possible ex-planation for this overestimation lies in the non-coaxial position ofthe catheter relative to the SB, at least in not severely diseased or ex-tremely angulated vessels, as illustrated in Figure 1.
In our study, dedicated analysis was associated with a lower meas-urement error, and demonstrated high agreement with referencemeasurements. In contrast to conventional assessment there wasno significant overestimation, as the mean error was 0.06 mm2 forarea and 20.01 mm for the mean diameter, with relatively narrowlimits of agreement. In almost all cases, the absolute error was,2.00 mm2 for area and 0.5 mm for diameter (Figure 8A and B), indi-cating that cut-plane assessment can provide a good estimate for SBostial dimensions. Notably, this finding seems rather robust, as this
Figure 6: Correlation and Bland–Altman plots of SB ostium minimum diameter by (A) conventional analysis and (B) cut-plane analysis of MB pull-back. Minimum diameter measurements from the SB pullback are used as a reference. Red dashed lines correspond to measurement error and reddotted lines to 95% confidence intervals. Abbreviations as in Figure 1.
A. Karanasos et al.Page 8 of 13
by guest on Novem
ber 24, 2014D
ownloaded from
was observed in OCT pullback sets acquired for different imagingindications, in different clinical settings, with different imagingsystems, and both in native and stented coronary arteries (half ofthe patients had stent in the MB at the carina level and one-thirdin the SB), reflecting real-world clinical scenarios. This 3D-OCTreconstruction and cut-plane analysis could be readily availableafter transferring the OCT pullback to the workstation, thus allowingimplementation in the daily cath-lab practice.
Despite, however, the better association with reference measure-ments compared with conventional analysis, the limits of agreementwere somewhat wider for minimal and maximal diameter. This wasmore pronounced for maximal diameter, where intra- and inter-observer agreement were also lower (intra-observer ICC ¼ 0.93;inter-observer ICC ¼ 0.79). A number of reasons may account forthese minor discrepancies. First, the selection of a plane perpendicu-lar to the SB is performed by visual estimation of the SB centreline bytheobserver, and thus subject toerror. Secondly, as shown in Figure1,maximal diameter measurements are highly dependent on the cath-eter position. This variability is also found in inter-study comparisonsof OCT and IVUS pullbacks.8,10 Thus, even reference measurements
of minimal and maximal diameter are subject to error as the cathetertends to follow the outer vessel curve. Thirdly, OCT studies aresubject to sampling bias due to (i) longitudinal resolution of 100–200 mm, depending on sampling rate and (ii) coronary artery move-ment,16 making therefore exact anatomic matching of the ostium notalways possible. Nevertheless, the overall error was relatively low(mean absolute error of 0.18 mm for the minimum diameter and0.30 for the maximum diameter) and in any case significantly lowerthat the error encountered in conventional analysis of MB pullbacks.
In our study, we included only a small percentage of patients(31 out of 98) with imaging of both the MB and the SB. It is importanttonote that the reason forexcluding a largenumberof cases fromthisstudy was that conventional measurements were used for compari-son. As a consequence, a large number of pullback sets (n ¼ 51),mainly with left main bifurcations, was excluded from this studydue to out-of-view artefact resulting in incomplete visualization ofthe SB ostium from the MB pullback. Nevertheless, as demonstratedby our additional series of 12 patients, assessment of the SB ostium isalso feasible by cut-plane analysis in these cases with larger SBs (meanSB ostium diameter: 2.59+0.56 mm) and higher bifurcation angle
Figure 7: Correlation and Bland–Altman plots of SB ostium maximum diameter by (A) conventional analysis and (B) cut-plane analysis of MBpullback. Maximum diameter measurements from the SB pullback are used as a reference. Red dashed lines correspond to measurement errorand red dotted lines to 95% confidence intervals. Abbreviations as in Figure 1.
Side-branch evaluation by main-vessel OCT Page 9 of 13
by guest on Novem
ber 24, 2014D
ownloaded from

(mean: 55.7+ 13.08), with a relatively low measurement errorcompared with reference measurements. Therefore, cut-planeanalysis can be potentially used for the evaluation of a higher
percentage of pullbacks that comprise 84% of cases in this series,whereas conventional analysis can only be performed in a muchlower percentage.
Figure 8: Box plots of absolute values of measurement error in (A) area, (B) mean diameter, (C) minimum diameter, and (D) maximum diameterfor conventional vs. cut-plane analysis. The top and bottom of boxes correspond to first and third quartiles respectively, with the line representingthe median. Abbreviations as in Figure 1.
. . . . . . . . . . . . . . . . . . . . . . . . . . . . . . . . . . . . . . . . . . . . . . . . . . . . . . . . . . . . . . . . . . . . . . . . . . . . . . . . . . . . . . . . . . . . . . . . . . . . . . . . . . . . . . .
. . . . . . . . . . . . . . . . . . . . . . . . . . . . . . . . . . . . . . . . . . . . . . . . . . . . . . . . . . . . . . . . . . . . . . . . . . . . . . . . . . . . . . . . . . . . . . . . . . . . . . . .
. . . . . . . . . . . . . . . . . . . . . . . . . . . . . . . . . . . . . . . . . . . . . . . . . . . . . . . . . . . . . . . . . . . . . . . . . . . . . . . . . . . . . . . . . . . . . . . . . . . . . . . . . . . . . . . . . . . . . . . . . . . . . . . . . . . . . . . . . . . . . . . . . . . . . . . . . . . . . . . . . . . . . . . . . . . . . . .
Table 4 Unadjusted and multi-adjusted predictors of absolute measurement error in SB ostial area measurements froma MB pullback
Measurement error in SB area
Unadjusted analysis Multi-adjusted analysis
b 95% CI P value b 95% CI P value
Proximal bifurcation angle (8) 20.035 20.095 to 0.026 0.247
Distal bifurcation angle (8) 0.072 20.005 to 0.148 0.065 Eliminated 0.103
Proximal reference diameter (3D-QCA) (mm) 1.230 0.395 to 2.064 0.006 Eliminated 0.731
Distal reference diameter in MB (3D-QCA) (mm) 0.947 20.205 to 2.099 0.103 Eliminated 0.847
Reference SB diameter (3D-QCA) (mm) 1.969 0.634 to 3.303 0.005 1.593 0.407 to 3.033 0.012
MB stent 20.022 21.126 to 1.082 0.968
SB stent 1.153 0.250 to 2.056 0.014 0.772 20.105 to 1.648 0.082
Variables entered and included in the final model are indicated in bold.3D-QCA, three-dimensional quantitative coronary angiography; CI, confidence intervals; MB, main-branch; SB, side-branch.
A. Karanasos et al.Page 10 of 13
by guest on Novem
ber 24, 2014D
ownloaded from

. . . . . . . . . . . . . . . . . . . . . . . . . . . . . . . . . . . . . . . . . . . . . . . . . . . . . . . . . . . . . . . . . . . . . . . . . . . . . . . . . . . . . . . . . . . . . . . . . . . . . . . . . . . . . . . . . . . . . . . . . . . . . . . . . . . . . . . . . . . . . . . . . . . . . . . . . . . . . . . . . . . .
. . . . . . . . . . . . . . . . . . . . . . . . . . . . . . . . . . . . . . . . . . . . . . . . . . . . . . . . . . . . . . . . . . . . . . . . . . . . . . . . . . . . . . . . . . . . . . . . . . . . . . . . . . . . . . . . . . . . . . . . . . . . . . . . . . . . . . . . . . . . . . . . .
. . . . . . . . . . . . . . . . . . . . . . . . . . . . . . . . . . . . . . . . . . . . . . . . . . . . . . . . . . . . . . . . . . . . . . . . . . . . . . . . . . . . . . . . . . . . . . . . . . . . . . . . . . . . . . . . . . . . . . . . . . . . . . . . . . . . . . . . . . . . . . . . . . . . . . . . . . . . . . . . . . . . . . . . . . . . . . . . . . . . . . . . . . . . . . . . . . . . . . . . . . . . . . . . . . . . . . . . . . . . . . . . . . . . . . . . . . . . .
Table 5 Unadjusted and multi-adjusted predictors of per cent measurement error in SB ostial area measurements from a MB pullback
Per cent measurement error in SB area
Unadjusted analysis Multi-adjusted analysis
b 95% CI P value b 95% CI P value
Proximal bifurcation angle (8) 20.715 22.180 to 0.750 0.325
Distal bifurcation angle (8) 2.175 0.412 to 3.938 0.018 2.175 0.412 to 3.938 0.018
Proximal reference diameter (3D-QCA)(mm) 0.940 20.596 to 2.476 0.220
Distal reference diameter in MB (3D-QCA)(mm) 8.208 229.651 to 46.106 0.659
Reference SB diameter (3D-QCA)(mm) 22.797 213.375 to 58.969 0.207
MB stent 22.458 230.635 to 25.718 0.860
SB stent 15.262 29.700 to 40.224 0.221
Variables entered and included in the final model are indicated in bold.3D-QCA, three-dimensional quantitative coronary angiography; CI, confidence intervals; MB, main-branch; SB, side-branch.
. . . . . . . . . . . . . . . . . . . . . . . . . . . . . . . . . . . . . . . . . . . . . . . . . . . . . . . . . . . . . . . . . . . . . . . . . . . . . . . . . . . . . . . . . . . . . . . . . . . . . . . . . . . . . . . . . . . . . . . . . . . . . . . . . . . . . . . . . . . . . . . . . . . . . . . . . . . . . . . . . . . . . . . . . . . . . . . . . . . . . . . . . . . . . . . . . . . . . . . . . . . . . . . . . . . . . . . . . . . . . . . . . . . . . . . . . . . . .
Table 6 Intra- and inter-observer variability
Observer1—Measurement 1
Observer1—Measurement 2
Difference (Measurement1—Measurement 2)
ICC (95% CI) Observer 2 Difference (Observer1—Observer 2)
ICC (95% CI)
SB ostium lumenarea (mm2)
3.57+1.92 3.53+1.91 0.04 (20.92 to 1.00) 0.97 (0.94 to 0.98) 3.38+1.83 0.18 (21.08 to 1.45) 0.94 (0.88 to 0.97)
SB ostium meandiameter (mm)
2.05+0.58 2.04+0.58 0.01 (20.25 to 0.27) 0.98 (0.95 to 0.99) 2.00+0.57 0.05 (20.32 to 0.42) 0.95 (0.89 to 0.97)
SB ostium minimumdiameter (mm)
1.64+0.62 1.65+0.58 0.00 (20.27 to 0.33) 0.97 (0.94 to 0.99) 1.60+0.59 0.08 (20.42 to 0.58) 0.91 (0.81 to 0.96)
SB ostium maximumdiameter (mm)
2.48+0.61 2.51+0.58 0.00 (20.47 to 0.47) 0.93 (0.85 to 0.97) 2.47+0.62 0.04 (20.76 to 0.84) 0.79 (0.61 to 0.90)
Values are presented as mean+ SD, or mean (95% limits of agreement).CI, confidence intervals; ICC, intra-class correlation coefficient; SB, side-branch.
Side-branchevaluation
bym
ain-vesselOC
TP
age11
of13
by guest on November 24, 2014 Downloaded from
Clinical implicationsThese findings are clinically remarkable as they suggest that this novelapproach could basically alleviate the need for additional OCT pull-back in the SB, taking into account the accuracy of the obtainedmeasurements and the therapeutic options, where stent diametersare typically sized at 0.5 mm incremental steps. Consequently, thedemonstrated reliable SB assessment with the potential to limit SBinstrumentation could significantly reduce procedural complexity,improve treatment strategy planning and potentially improve outcomeof bifurcation lesions in the future.
LimitationsLimitations of this study include the relatively small sample sizeand that it mainly consisted of LAD-diagonal bifurcations, thus notcompletely representative of all bifurcation subsets. Nevertheless,as mentioned this is mainly a result of limitations of the conventionalanalysis that was used for comparison, and cut-plane analysis can alsobe applied in the majority of these cases. Inter- and intra-observeragreement in our measurements, performed in a laboratory setting,was excellent for lumen area and mean diameter with narrow limitsof agreement. However, since the selection of a plane perpendicularto the SB involves a user-dependent factor which is the visual esti-mation of the SB centreline, the possibility of a higher variability inmeasurements performed by less experienced analysts cannot beexcluded. Finally, as this is a retrospective study, selection biascannot be excluded. A potential selection bias could explain therelatively low bifurcation angle (55.7+13.08) in our additionalconsecutive series of patients compared with previously reported
values of 80+218 for the left main and 48+168 for LAD-diagonalbifurcations.13
ConclusionsIn OCT assessment of SB ostia from a main-branch pullback there ishigh error when the SB area and diameters are measured by conven-tional analysis. Assessment in a laboratory setting by dedicated soft-ware that can reconstruct the cross-sections perpendicular to the SBcentreline is associated with a significantly lower error and has a highcorrelation with reference measurements performed from a SB pull-back.This approachcouldpotentially limit theneed for SB instrumen-tation and thereby reduce procedural complexity in the assessmentof bifurcation lesions.
Conflict of interest: S.T. is employed by Medis and has a researchappointment at Leiden University Medical Center. J.H.C.R. is theCEO of Medis, and has a part-time appointment at Leiden UniversityMedical Center as Professor of Medical Imaging.
FundingA.K. would like to acknowledge the funding support of the Hellenic HeartFoundation and St Jude Medical.
References1. Koo BK, Kang HJ, Youn TJ, Chae IH, Choi DJ, Kim HS et al. Physiologic assessment of
jailed side branch lesions using fractional flow reserve. J Am Coll Cardiol 2005;46:633–7.2. Karanasos A, Tu S, van der Heide E, Reiber JH, Regar E. Carina shift as a mechanism
for sidebranch compromise following main vessel intervention: insights from three-dimensional optical coherence tomography. Cardiovasc Diagn Ther 2012;2:173–7.
Figure9: OCTevaluation of left main bifurcation with high distal bifurcation angle (648) from original and reconstructed OCT pullbacks. (A and B)2-D and 3-D angiographic views of the imaged left main bifurcation. (C and D) Ostia of the LCx and the LAD, respectively, as visualized by OCTpullbacks performed in the ipsilateral branch. Note that ostia of the contralateral branch are not completely visualized in the cross-sectionalimages. (E and F) Three-dimensional renderings showing the contralateral branch ostium. (G and H) Cut-plane analysis showing reconstructedostia, generated by the contralateral branch pullback. LAD, left anterior descending artery; LCx, left circumflex artery; OCT, optical coherencetomography.
A. Karanasos et al.Page 12 of 13
by guest on Novem
ber 24, 2014D
ownloaded from
3. Farooq V, Serruys PW, Heo JH, Gogas BD, Okamura T, Gomez-Lara J et al. Newinsights into the coronaryartery bifurcationhypothesis-generatingconcepts utilizing3-dimensional optical frequency domain imaging. JACC Cardiovasc Interv 2011;4:921–31.
4. Koo BK, Waseda K, Kang HJ, Kim HS, Nam CW, Hur SH et al. Anatomic and func-tional evaluation of bifurcation lesions undergoing percutaneous coronary interven-tion. Circ Cardiovasc Interv 2010;3:113–9.
5. Suarez de Lezo J, Medina A, Martin P, Novoa J, Pan M, Caballero E et al. Predictors ofostial side branch damage during provisional stenting of coronary bifurcation lesionsnot involving the side branch origin: an ultrasonographic study. EuroIntervention 2012;7:1147–54.
6. Di Mario C, Iakovou I, van der Giessen WJ, Foin N, Adrianssens T, Tyczynski P et al.Optical coherence tomography for guidance in bifurcation lesion treatment. EuroIn-tervention 2010;6(Suppl. J):J99–J106.
7. Karanasos A, Tu S, van der Linden M, van Weenen S, Ligthart J, Regar E. Online3-dimensional rendering of optical coherence tomography images for the assess-ment of bifurcation intervention. Can J Cardiol 2012;28:759e1–3.
8. Sawada T, Shite J, Negi N, Shinke T, Tanino Y, Ogasawara D et al. Factors that influ-ence measurements and accurate evaluation of stent apposition by optical coher-ence tomography. Assessment using a phantom model. Circ J 2009;73:1841–7.
9. Oviedo C, Maehara A, Mintz GS, Tsujita K, Kubo T, Doi H et al. Is accurate intravas-cular ultrasound evaluation of the left circumflex ostium from a left anterior des-cending to left main pullback possible? Am J Cardiol 2010;105:948–54.
10. Suter Y, Schoenenberger AW, Toggweiler S, Jamshidi P, Resink T, Erne P. Intravascu-lar ultrasound-based left main coronary artery assessment: comparison betweenpullback from left anterior descending and circumflex arteries. J Invasive Cardiol2009;21:457–60.
11. Tu S, Xu L, Ligthart J, Xu B, Witberg K, Sun Z et al. In vivo comparison of arteriallumen dimensions assessed by co-registered three-dimensional (3D) quantitativecoronary angiography, intravascular ultrasound and optical coherence tomography.Int J Cardiovasc Imaging 2012;28:1315–27.
12. Tu S, Holm NR, Christiansen EH, Reiber JH. First presentation of 3-dimensional re-construction and centerline-guided assessment of coronary bifurcation by fusion ofX-ray angiography and optical coherence tomography. JACC Cardiovasc Interv 2012;5:884–5.
13. Tu S, Jing J, Holm NR, Onsea K, Zhang T, Adriaenssens T et al. In vivo assessment ofbifurcation optimal viewing angles and bifurcation angles by three-dimensional (3D)quantitative coronary angiography. Int J Cardiovasc Imaging 2012;28:1617–25.
14. Di Mario C, Madretsma S, Linker D, The SH, Bom N, Serruys PW et al. The angle ofincidence of the ultrasonic beam: a critical factor for the image quality in intravascularultrasonography. Am Heart J 1993;125(2 Pt 1):442–8.
15. Chae JS, Brisken AF, Maurer G, Siegel RJ. Geometric accuracy of intravascular ultra-sound imaging. J Am Soc Echocardiogr 1992;5:577–87.
16. Wang T, Wieser W, Springeling G, Beurskens R, Lancee CT, Pfeiffer T et al. Intravas-cular optical coherence tomography imaging at 3200 frames per second. Opt Lett2013;38:1715–7.
Side-branch evaluation by main-vessel OCT Page 13 of 13
by guest on Novem
ber 24, 2014D
ownloaded from