A Novel Approach to the Study of Bread Porous Structure: Phase-contrast X-Ray Microtomography
6
E38 JOURNAL OF FOOD SCIENCE—Vol. 69, Nr. 1, 2004 Published on Web 1/23/2004 © 2004 Institute of Food Technologists Further reproduction without permission is prohibited Food Engineering and Physical Properties JFS: Food Engineering and Physical Properties A Novel Approach to the Study of Bread Porous Structure: Phase- contrast X-Ray Microtomography P.M. FALCONE, A. BAIANO, F. ZANINI, L. MANCINI, G. TROMBA, F. MONTANARI, AND M.A. DEL NOBILE ABSTRACT: The evaluation of bread quality can be carried out by performing a nondestructive investigation of its microstructure, which in turn can be performed by adapting image analysis techniques that enables one to obtain rapid, objective, and quantitative information. A suitable and reliable experimental methodology to inves- tigate the porous structure of bread by means of the numerical image processing, and without any sample preparation, has been presented in this work. Different types of breads having varying degrees of porosity were studied by X-ray computerized phase-sensitive microtomography for the acquisition of digital high-resolution im- ages. After acquisition, suitable numeric algorithms were applied to slice reconstruction. Finally, 3D images were rendered and analyzed. Keywords: bread, imaging techniques, microstructure, X-ray computerized microtomography Introduction A s reported in the literature, foods having similar chemical com- position may exhibit different mechanical behavior (Aguilera and Stanley 1999) and sensorial properties (Scanlon and Zghal 2001), depending on their physical structure. In particular, it is well known that bread sensorial quality is related to crumb mechanical properties (Aguilera and Stanley 1999). Bread can be considered as a spongy solid formed by a dispersed gas phase (air) occupying a high volume fraction (>0.8) in a continuous solid matrix with cell wall thickness of 20 to 200 m (Chabot and others 1979; Gan and others 1995) and with the number of open cells greater than the closed ones (Hug Iten and others 1999). The mechanical properties of bread can be related to its microstructure. Although mechanical models are available for composite and cellular materials, their application to bread samples require an accurate quantification of the microstructural features of bread crumbs in terms of cell wall thickness, cell shape, void fraction, crumb brightness, and fine- ness. To this purpose, the application of imaging techniques can be considered a useful tool to evaluate bread microstructure and its relationships with the mechanical properties of bread. In fact, mi- crostructure images can be converted into numerical data for a quantitative analysis. Despite the undoubted advantages, there are some problems that have to be taken into account when imaging techniques are used on food materials. First, almost all of the imaging techniques require a sample preparation that can produce artifacts. This as- pect has to be considered to avoid wrong conclusions in a micro- structure investigation. Furthermore, some imaging techniques are more expensive because they require sophisticated equipments and, thus, can only be applied on foods having a high commercial value. The most important and convenient imaging techniques applied to food structure analysis are light microscopy, in which the illumination source is represented by photons focused by glass lenses, and electron microscopy, in which the illumination source is constituted of electrons focused by magnetic lenses. These tech- niques require a complex sample preparation, which can consist of chemical fixation, cryo-fixation, dehydration, degreasing, and so forth. Then, the formation of artifacts because of sample prepara- tion must be considered in the successive image analysis. Further- more, most of these preparations are destructive and, after obser- vation, samples cannot be further analyzed. Among image analysis techniques, there is X-ray computerized microtomography (X-MCT), which does not require a special sam- ple preparation. X-MCT is the high spatial resolution version of the computed axial tomography routinely used for medical diagnosis (Baruchel and others 2000). This technique allows one to obtain a 3D representation of the inside structure of a sample from a set of projection measurements recorded from a certain number of points of view. In the common case of X-ray absorption tomography, the inner structure of the object under study is represented by the linear attenuation coefficient, which can be assumed to be propor- tional to the mass density. The main advantage of X-MCT is the possibility to provide, in a nondestructive way, images of the internal structure of a material. The visualization of the final result can be realized by 3D rendering, by 2D slices, or projections following ar- bitrary directions. The main limitation of this technique is the poor intrinsic contrast of low-density materials or porous structures such as bread. The high intensity and high transverse coherence of radiation delivered from 3rd-generation synchrotron light sources, like the synchrotron radiation for medical physics (SYRMEP) beamline of the Elettra Laboratory in Trieste, Italy, represent a unique opportu- nity to investigate novel X-ray imaging approaches. These tech- niques are based on observing the phase shifts produced by the object on the incoming wave. In the energy range of 10 to 25 keV, the phase shift is up to 1000 times more sensitive to variation of the structure and composition of soft materials when compared with MS 20030434 Submitted 8/1/03, Revised 9/14/03, Accepted 11/10/03. Authors Falcone, Baiano, and Del Nobile are with Dept. di Scienze degli Alimenti, Facoltà di Agraria, Univ. di Foggia, Via Napoli 25 – 71100 Foggia, Italy. Authors Zanini, Mancini, Tromba, and Montanari are with Sincrotrone Trieste S.C.p.A. – S.S. 14 km 163.500 in area Science Park –I-34012 Basovizza (TS), Italy. Direct inquiries to author Del Nobile (E-mail: ma.delnobile@ unifg.it).
-
Upload
independent -
Category
Documents
-
view
3 -
download
0
Transcript of A Novel Approach to the Study of Bread Porous Structure: Phase-contrast X-Ray Microtomography

E38 JOURNAL OF FOOD SCIENCE—Vol. 69, Nr. 1, 2004Published on Web 1/23/2004
© 2004 Institute of Food TechnologistsFurther reproduction without permission is prohibited
Food Engineering and Physical Properties
JFS: Food Engineering and Physical Properties
A Novel Approach to the Study ofBread Porous Structure: Phase-contrast X-Ray MicrotomographyP.M. FALCONE, A. BAIANO, F. ZANINI, L. MANCINI, G. TROMBA, F. MONTANARI, AND M.A. DEL NOBILE
ABSTRACT: The evaluation of bread quality can be carried out by performing a nondestructive investigation of itsmicrostructure, which in turn can be performed by adapting image analysis techniques that enables one toobtain rapid, objective, and quantitative information. A suitable and reliable experimental methodology to inves-tigate the porous structure of bread by means of the numerical image processing, and without any samplepreparation, has been presented in this work. Different types of breads having varying degrees of porosity werestudied by X-ray computerized phase-sensitive microtomography for the acquisition of digital high-resolution im-ages. After acquisition, suitable numeric algorithms were applied to slice reconstruction. Finally, 3D images wererendered and analyzed.
Keywords: bread, imaging techniques, microstructure, X-ray computerized microtomography
Introduction
As reported in the literature, foods having similar chemical com-position may exhibit different mechanical behavior (Aguilera
and Stanley 1999) and sensorial properties (Scanlon and Zghal2001), depending on their physical structure. In particular, it is wellknown that bread sensorial quality is related to crumb mechanicalproperties (Aguilera and Stanley 1999). Bread can be considered asa spongy solid formed by a dispersed gas phase (air) occupying ahigh volume fraction (>0.8) in a continuous solid matrix with cellwall thickness of 20 to 200 �m (Chabot and others 1979; Gan andothers 1995) and with the number of open cells greater than theclosed ones (Hug Iten and others 1999). The mechanical propertiesof bread can be related to its microstructure. Although mechanicalmodels are available for composite and cellular materials, theirapplication to bread samples require an accurate quantification ofthe microstructural features of bread crumbs in terms of cell wallthickness, cell shape, void fraction, crumb brightness, and fine-ness. To this purpose, the application of imaging techniques can beconsidered a useful tool to evaluate bread microstructure and itsrelationships with the mechanical properties of bread. In fact, mi-crostructure images can be converted into numerical data for aquantitative analysis.
Despite the undoubted advantages, there are some problemsthat have to be taken into account when imaging techniques areused on food materials. First, almost all of the imaging techniquesrequire a sample preparation that can produce artifacts. This as-pect has to be considered to avoid wrong conclusions in a micro-structure investigation. Furthermore, some imaging techniques aremore expensive because they require sophisticated equipmentsand, thus, can only be applied on foods having a high commercial
value. The most important and convenient imaging techniquesapplied to food structure analysis are light microscopy, in which theillumination source is represented by photons focused by glasslenses, and electron microscopy, in which the illumination source isconstituted of electrons focused by magnetic lenses. These tech-niques require a complex sample preparation, which can consist ofchemical fixation, cryo-fixation, dehydration, degreasing, and soforth. Then, the formation of artifacts because of sample prepara-tion must be considered in the successive image analysis. Further-more, most of these preparations are destructive and, after obser-vation, samples cannot be further analyzed.
Among image analysis techniques, there is X-ray computerizedmicrotomography (X-MCT), which does not require a special sam-ple preparation. X-MCT is the high spatial resolution version of thecomputed axial tomography routinely used for medical diagnosis(Baruchel and others 2000). This technique allows one to obtain a3D representation of the inside structure of a sample from a set ofprojection measurements recorded from a certain number ofpoints of view. In the common case of X-ray absorption tomography,the inner structure of the object under study is represented by thelinear attenuation coefficient, which can be assumed to be propor-tional to the mass density. The main advantage of X-MCT is thepossibility to provide, in a nondestructive way, images of the internalstructure of a material. The visualization of the final result can berealized by 3D rendering, by 2D slices, or projections following ar-bitrary directions. The main limitation of this technique is the poorintrinsic contrast of low-density materials or porous structures suchas bread.
The high intensity and high transverse coherence of radiationdelivered from 3rd-generation synchrotron light sources, like thesynchrotron radiation for medical physics (SYRMEP) beamline ofthe Elettra Laboratory in Trieste, Italy, represent a unique opportu-nity to investigate novel X-ray imaging approaches. These tech-niques are based on observing the phase shifts produced by theobject on the incoming wave. In the energy range of 10 to 25 keV,the phase shift is up to 1000 times more sensitive to variation of thestructure and composition of soft materials when compared with
MS 20030434 Submitted 8/1/03, Revised 9/14/03, Accepted 11/10/03. AuthorsFalcone, Baiano, and Del Nobile are with Dept. di Scienze degli Alimenti,Facoltà di Agraria, Univ. di Foggia, Via Napoli 25 – 71100 Foggia, Italy.Authors Zanini, Mancini, Tromba, and Montanari are with SincrotroneTrieste S.C.p.A. – S.S. 14 km 163.500 in area Science Park –I-34012 Basovizza(TS), Italy. Direct inquiries to author Del Nobile (E-mail: [email protected]).

Vol. 69, Nr. 1, 2004—JOURNAL OF FOOD SCIENCE E39URLs and E-mail addresses are active links at www.ift.org
Food
Engin
eerin
g and
Phys
ical P
rope
rties
X-ray microtomography and bread structure . . .
absorption. Therefore it is possible to reveal phase effects even ifthe absorption is negligible.
The main characteristics of synchrotron radiation are the contin-uous spectrum, extending from infrared to hard X-rays, the highspatial coherence, and the intensity of photons emitted in a smallsolid angle. This makes it possible to work with short exposure times,allows for tuning of the photon energy as a function of the samplecharacteristics, and, in some cases, makes it possible to apply dig-ital subtraction techniques. Phase-sensitive imaging techniques,using highly coherent, hard X-rays from 3rd-generation synchro-tron sources, have the additional advantage of allowing the imagingof samples with very low absorption contrast, such as light-elementcomposites, biological systems, and food samples (Snigirev andothers 1995; Cloetens and others 1996, 1999). It has been demon-strated that the fine interference structure of phase-images is verysensitive to density variations and the internal structure of thesample. High-resolution phase-sensitive X-MCT gives phase con-trast in regions of a highly localized change in the refractive indexof the sample, such as its borders or interfaces between the samplematrix and inclusions. The tomogram that is produced is an out-lined image of those domains, whereas the conventional imageshows a strongly limited absorption contrast leading to lower sig-nal/noise ratio (Snigirev and others 1995).
The aim of this work is to point out a nondestructive technique,based on X-MCT, which is suitable to investigate the porous struc-ture of bread by means of numerical image processing and withoutany sample preparation.
Materials and Methods
Four kinds of bread, macroscopically differing in shape, dimension, and distribution of cells, were purchased at the local mar-
ket.
Sample preparationCrumb samples (25-mm height, 25-mm width, and 12-mm thick-
ness) were cut from bread slices and mounted in plexiglass con-tainers, which are transparent to the incident X-rays. The containerswere sealed by Parafilms (Pechiney Plastic Packaging, Menasha,Wis., U.S.A.) to avoid water evaporation.
X-ray microtomographyThe X-MCT investigations were carried out using the SYRMEP
beamline (Arfelli and others 1995) of the Elettra Laboratory in Tri-este, Italy. The samples, mounted on a rotation stage, were illumi-nated by monochromatic radiation (E = 12 KeV). The distance be-tween the sample and the detector was 200 mm. For eachtomographic set, depending on the sample size, 720 or 1440 projec-tions of the sample were acquired for equally spaced rotation an-gles and measurement times of 1 s over a total rotation of 180 de-grees. These parameters were previously optimized for phasecontrast and resolution by imaging several samples under differ-ent conditions.
The detector used was a cooled charge-coupled device (CCD)camera coupled to a Gadolinium Oxysulphide scintillator (Photo-nic Science Ltd, Boulder, Colo., U.S.A.) placed on a straight fiber-optic coupler. High dynamic range and low noise is achievedthrough 16-bit digitization and deep cooling, whereas the 2048 ×2048 pixels CCD is characterized by a pixel size of 14 �m (field ofview: 28 mm × 28 mm). The illuminated volumes of bread samplesranged from 520 mm3 to 600 mm3. Sub-volumes were reconstructedas a function of sample density.
The tomographic projections have been elaborated using a setof routines (Montanari 2003). These routines allow the reconstruc-
tion of single slices; data can then be saved in several formats andsubsequently loaded by other applications for visualization andanalysis. The computer code is written in the interactive data lan-guage (IDL). The 2D reconstruction is performed using a filteredback projection algorithm (Herma 1980), for each projection an in-
Figure 1—(a) Slice of white pan bread, (b) slice of Frenchloaf bread, (c) slice of a classic loaf of bread, (d) slice ofApulia bread
E40 JOURNAL OF FOOD SCIENCE—Vol. 69, Nr. 1, 2004 URLs and E-mail addresses are active links at www.ift.org
Food Engineering and Physical Properties
X-ray microtomography and bread structure . . .
tensity map is recorded in the xy detector plane; then each inten-sity map is back-projected along the normal to the projection itself.Projections are submitted to filtering procedures to eliminate noiseand artifacts and, finally, the intensities are added for all the pro-jections. Then, the reconstructed slices can be visualized as stacksof 2D images, or 3D views of the sample can be obtained by volumerendering procedures. Rendering process was performed using theImageJ software (version 1.29, Natl. Inst. of Health, Bethseda, Md.,U.S.A. ImageJ software is in the public domain and is available fromhttp://rsb.info.nih.gov/ij or ftp://rsbweb.nih.gov/pub/image-j).
In our experimental conditions, the proposed imaging tech-
nique made it possible to extract qualitative and quantitative infor-mation on the bread microstructure with a sensitivity of 14 �m.
Quantitative analysis was carried out by means of a software de-veloped in our laboratory and written in the C language. All gray-scale images were processed applying a median filter to delete iso-lated pixels and were successively segmented to distinguish the solidphase from the air phase based on the threshold level. The followingstructure indexes were calculated after image preprocessing:
1. Cell wall thickness (�m) determined on the cubic sub-vol-umes (100 × 100 × 100 pixel) randomly extracted from the consid-ered whole volume.
Figure 2—(a) Reconstructed X-ray microtomography (XRM) image of a 2D slice of a white pan bread sample, (b) recon-structed XRM image of a 2D slice of a French loaf bread sample, (c) reconstructed XRM image of a 2D slice of aclassic loaf of bread, (d) reconstructed XRM image of a 2D slice of a Apulia bread sample
Vol. 69, Nr. 1, 2004—JOURNAL OF FOOD SCIENCE E41URLs and E-mail addresses are active links at www.ift.org
Food
Engin
eerin
g and
Phys
ical P
rope
rties
X-ray microtomography and bread structure . . .
2. Crumb porosity, expressed as the mean value of the cell–totalarea ratio on each slice of the considered volume. Cell detection inbinary images was based on an algorithm that considers cells to beany connected region of pixels with gray-level values lower than aspecified threshold. In the present study, isolated single pixels werenot considered to be valid cells and a gaussian filter was used toremove them.
3. Fractal dimension, the approximate estimation of the irreg-ularity and statistical self-similarity of the microstructure over amultiple scale, is extrapolated by the box-counting method (Biswasand others 1998). This method consists of an estimation of the pe-rimeter of an object using rulers of different lengths. As the size ofthe measuring unit decreases, the estimated perimeter increas-es. These data plotted as log of perimeter against log of measur-ing unit are linearly codependent. This is known as the Richard-son plot, and the fractal dimension is the slope of the regressionline.
Results and Discussion
Figure 1a through 1d show pictures of the 4 types of bread usedin this investigation. As can be inferred from these figures, the
investigated breads are characterized by different porous struc-tures. This choice was made to illustrate the flexibility of the pro-posed approach, which can be applied regardless of the bread’sporous structure.
Figure 2a through 2d show the reconstructed 2D images of thecross sections of the bread samples. The digital information densi-ty is equal to 714.48 pixel per cm.
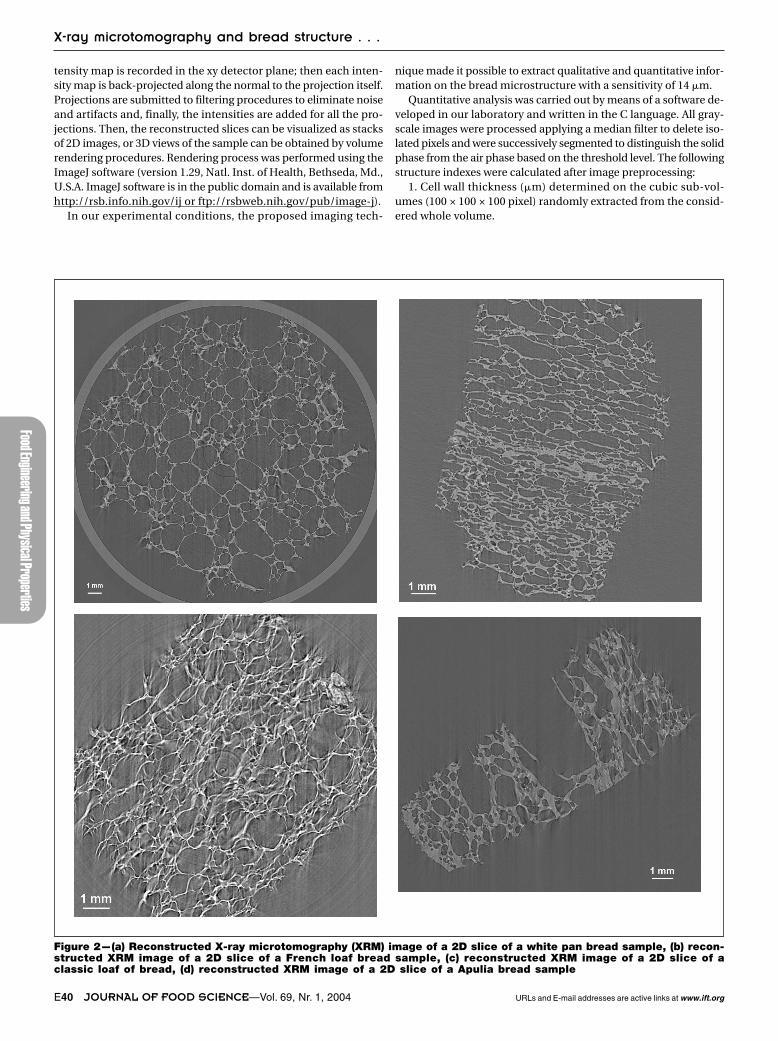
Figure 3a through 3d report 3D views of the investigated breadsamples. Three-dimensional images of “white pan bread” and“Apulia” bread samples were rendered with 35 slices, whereasthose referred to as “French loaf bread” and the “classic loaf ofbread” were rendered with 18 slices only. Moreover, 3D images ofwhite pan bread and Apulia bread (showing the greatest differencein porous structure) were also rendered with 481 and 281 slices,
Figure 3—(a) XRM3D image of a whitepan bread sample,rendered with 3514-mm slices; (b)XRM 3D image of aFrench loaf breadsample, renderedwith 18 14-mmslices; (c) XRM 3Dimage of a classicloaf of bread,rendered with 1814-mm slices; (d)XRM 3D image ofthe Apulia breadsample, renderedwith 35 14-mmslices
E42 JOURNAL OF FOOD SCIENCE—Vol. 69, Nr. 1, 2004 URLs and E-mail addresses are active links at www.ift.org
Food Engineering and Physical Properties
X-ray microtomography and bread structure . . .
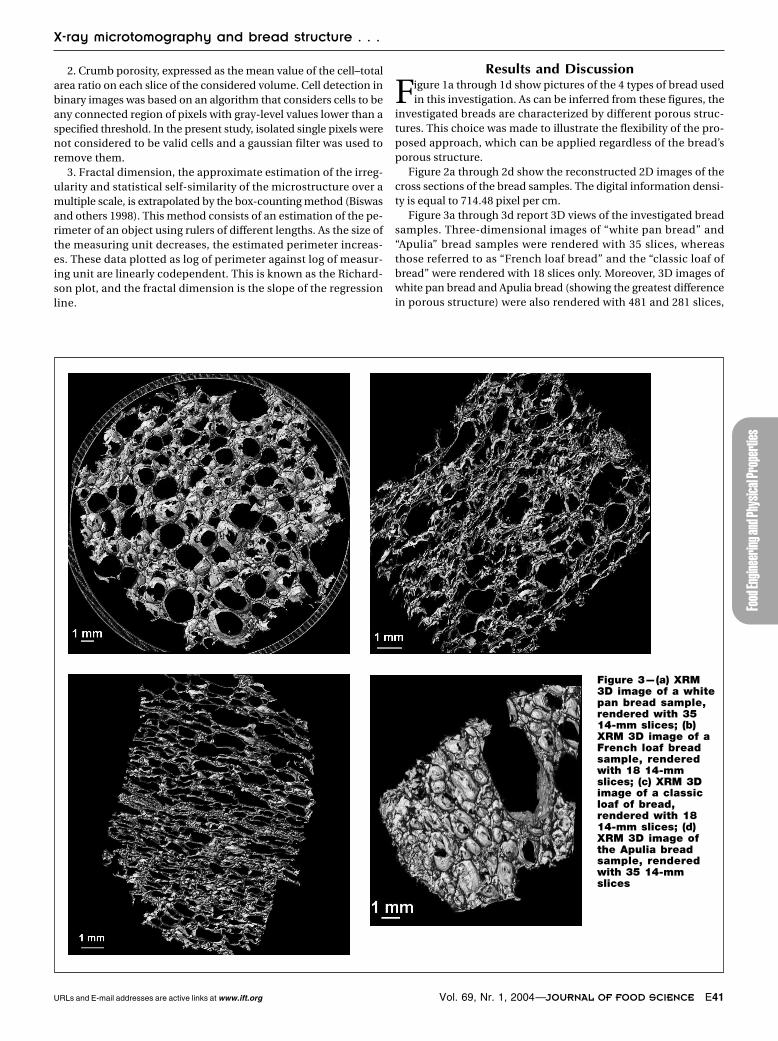
respectively (Figure 4a and 4b). The reasons for this choice werebased on the different densities of the investigated samples. Infact, samples having higher density can be better visualized if ren-dered with a smaller number of slices. However, the number of slic-es used in the rendering process affects the type of obtainableinformation. A rendering performed with a low number of slicessupplies more visual information about cell wall thickness and con-nectivity and spatial distribution of the crumb cells (Figure 3a and3d), whereas a rendering performed with a large number of slicesprovides details on crumb fineness (open compared with closedcells) and cell shape (Figure 3b, 3c, 4a, and 4b). It is worth notingthat the back projection algorithm was effectively applied to math-ematically reconstruct the map of the crumb bread X-ray absorp-tion profile. The microtomographic images by themselves consti-tute quantitative data on microstructure because the intensity ofeach image voxel is directly related to the nature and quantity of thematerial contained in that volume.
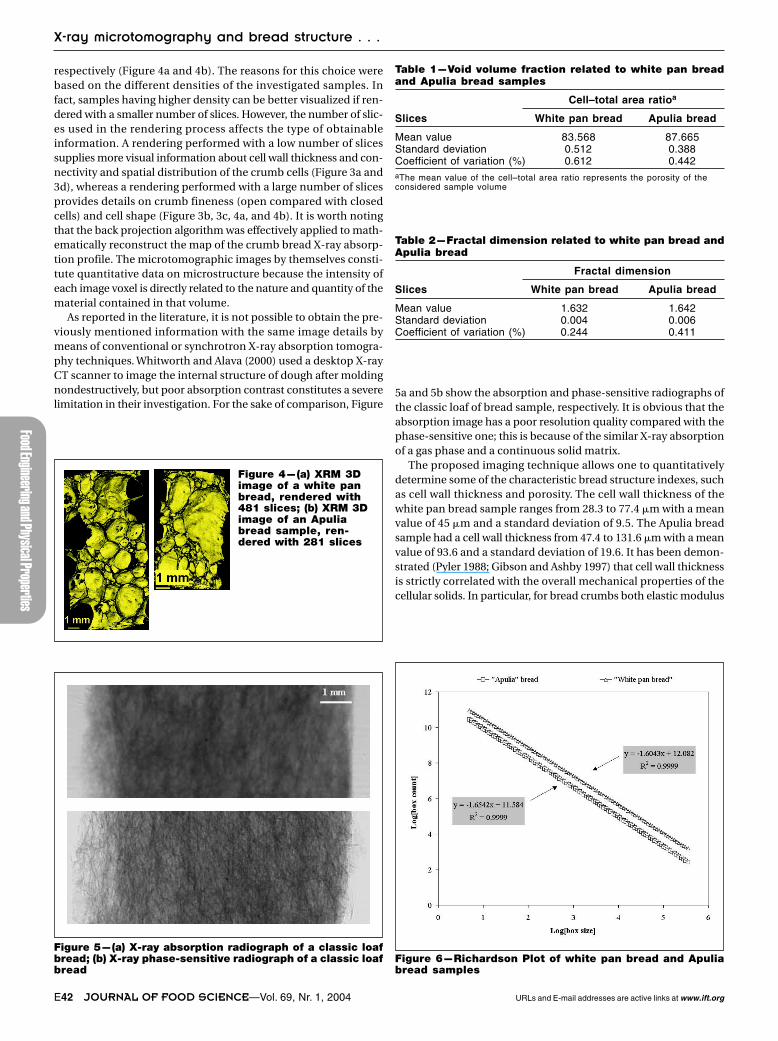
As reported in the literature, it is not possible to obtain the pre-viously mentioned information with the same image details bymeans of conventional or synchrotron X-ray absorption tomogra-phy techniques. Whitworth and Alava (2000) used a desktop X-rayCT scanner to image the internal structure of dough after moldingnondestructively, but poor absorption contrast constitutes a severelimitation in their investigation. For the sake of comparison, Figure
5a and 5b show the absorption and phase-sensitive radiographs ofthe classic loaf of bread sample, respectively. It is obvious that theabsorption image has a poor resolution quality compared with thephase-sensitive one; this is because of the similar X-ray absorptionof a gas phase and a continuous solid matrix.
The proposed imaging technique allows one to quantitativelydetermine some of the characteristic bread structure indexes, suchas cell wall thickness and porosity. The cell wall thickness of thewhite pan bread sample ranges from 28.3 to 77.4 �m with a meanvalue of 45 �m and a standard deviation of 9.5. The Apulia breadsample had a cell wall thickness from 47.4 to 131.6 �m with a meanvalue of 93.6 and a standard deviation of 19.6. It has been demon-strated (Pyler 1988; Gibson and Ashby 1997) that cell wall thicknessis strictly correlated with the overall mechanical properties of thecellular solids. In particular, for bread crumbs both elastic modulus
Figure 4—(a) XRM 3Dimage of a white panbread, rendered with481 slices; (b) XRM 3Dimage of an Apuliabread sample, ren-dered with 281 slices
Figure 6—Richardson Plot of white pan bread and Apuliabread samples
Figure 5—(a) X-ray absorption radiograph of a classic loafbread; (b) X-ray phase-sensitive radiograph of a classic loafbread
Table 1—Void volume fraction related to white pan breadand Apulia bread samples
Cell–total area ratioa
Slices White pan bread Apulia bread
Mean value 83.568 87.665Standard deviation 0.512 0.388Coefficient of variation (%) 0.612 0.442aThe mean value of the cell–total area ratio represents the porosity of theconsidered sample volume
Table 2—Fractal dimension related to white pan bread andApulia bread
Fractal dimension
Slices White pan bread Apulia bread
Mean value 1.632 1.642Standard deviation 0.004 0.006Coefficient of variation (%) 0.244 0.411
Vol. 69, Nr. 1, 2004—JOURNAL OF FOOD SCIENCE E43URLs and E-mail addresses are active links at www.ift.org
Food
Engin
eerin
g and
Phys
ical P
rope
rties
X-ray microtomography and bread structure . . .
and fracture stress increase with the cell wall thickness (Zghal andothers 2001). Furthermore, Scanlon and Zghal (2001) found thatthe weight of bread crumb is proportional to cell wall thickness.
Table 1 reports the statistical parameters referred to as cell–totalarea ratio for both the white pan bread and Apulia bread samples.This parameter is strictly correlated to porosity because it corre-sponds to the proportion of crumb area computed as cells. Table 2summarizes the statistical data regarding fractal dimension calcu-lated on all consecutive slices of the 2 bread samples, showing thegreat difference in macrostructure of the white pan bread andApulia bread. The irregularity of the porous structure is proportion-al to the fractal dimension. The statistical difference between thefractal dimension of the white pan bread and Apulia bread sam-ples is consistent with the visual difference observed in the corre-sponding microtomographic images (Figure 2a and 2d). The rela-tionship between the box size (expressed as pixels) and the boxcount is shown in the Richardson Plot (Figure 6). For each sample,the linearity of the data demonstrates a statistical self-similarity: thebread crumb appearance is quite scale invariant.
With reference to the analyzed samples, the variation in porosityresults were less important than those related to cell wall thicknessand fractal dimension. These data suggest that it is not sufficientto correlate bread quality to porosity only.
Conclusions
X-MCT results proved to be an effective nondestructive tech-nique for determining the inner bread structure. The high-res-
olution feature of the reconstructed images allowed us to rendersample volume with a high density of numerical data. The amountand quality of digital information enabled an accurate quantitativeanalysis of the bread microstructure. The rendered images can beelaborated by applying procedures like filters, false colors, and seg-mentation tools to extract quantitative information. The obtained
quantitative information can be advantageously used to validateany mathematical model that is able to describe the relationshipsamong physical structure and bread quality.
ReferencesAguilera JM, Stanley DW. 1999. Microstructural principles of food processing
and engineering. 2nd ed. Gathersburg, Md.: Aspen Publishing. 432 p.Arfelli M, Bravin A, Barbiellini G, Cantatore G, Castelli E, Di Michiel M, Poropat
P, Rosei R, Sessa M, Vacchi A, Dalla Palma L, Longo R, Bernstorff S, Savoia A,Tromba G. 1995. Digital mammography with syncroton radiation. Rev Sci In-str 66:1325–8.
Baruchel J, Buffiére JY, Maire E, Merle P, Peix G. 2000. X-Ray tomography inmaterial science. Paris: Hermes Science Publications. 204 p.
Biswas M, Ghose T, Guha S, Biswas P. 1998. Fractal dimension estimation fortexture images: a parallel approach. Pattern Recog Lett 19:309–13.
Chabot J, Hood LF, Liboff M. 1979. Effect of scanning electron microscopy prep-aration methods on the ultrastructure of white bread. Cereal Chem 56:462–4.
Cloetens P, Barratt R, Baruchel J, Guigay JP, Schlenker M. 1996. Phase objects insynchrotron radiation hard X-ray imaging. J Phys D Appl Phys 29:133–46.
Cloetens P, Ludwig W, Baruchel J, Guigay JP, Pernot Rejmànkovà P, Salomé Patey-ron M, Schlenker M, Buffière JY, Maire E, Peix G. 1999. Hard x-ray phase imag-ing: Simple propagation of a coherent synchrotron radiation beam. J Phys DAppl Phys 32:A145–51.
Gan Z, Ellis PR, Schofield JD. 1995. Mini review: gas cell stabilisation and gasretention in wheat bread dough. J Cereal Sci 21:215–30.
Gibbson LJ, Ashby MF. 1997. Cellular solid: structure and properties. 2nd ed. NewYork: Cambridge Univ. Press. 510 p.
Herman GT. 1980. Image reconstruction from projections. New York: AcademicPress. 316 p.
Hug Iten S, Handschin S, Conde Petit B, Escher F. 1999. Changes in starch microstruc-ture on backing and staling of wheat bread. Lebensm Wiss Technol 32:255–60.
Montanari F. 2003. SYRMEP TOMO PROJECT tutorial. Internet report, Trieste.Pyler EJ. 1988. Baking science and technology. Vol. II. Merriam, Kans: Sosland
Publishing. p 850–910.Scanlon MG, Zghal MC. 2001. Bread properties and crumb structure. Food Res Int
34:841–64.Snigirev A, Snigireva I, Kohn V, Kuznetsov S, Schelokov I. 1995. On the possibil-
ities of X-ray phase-contrast microimaging by coherent high-energy syn-chrotron radiation. Rev Sci Instr 66:5486–92.
Whitworth MB, Alava JM. 2000. The development of bubble structure in breaddoughs. Proceedings of the 48th American Assn. of Cereal Chemists AnnualMeeting; 5-9 Nov.; Kansas City, Mo.
Zghal MC, Scanlon MG, Sapirstein HD. 2001. Cellular structure of bread crumband its influence on mechanical properties. J Cereal Sci 36(2):167-76.


![Hamilton Beach Artisan Bread Maker [29888] - Use & Care](https://static.fdokumen.com/doc/165x107/6324aafb051fac18490ce4cf/hamilton-beach-artisan-bread-maker-29888-use-care.jpg)