A novel approach for enhancing the signal-to-noise ratio and detecting automatically event-related...
13
A novel approach for enhancing the signal-to-noise ratio and detecting automatically event-related potentials (ERPs) in single trials L. Hu a,b,c , A. Mouraux d , Y. Hu c , G.D. Iannetti a,b, ⁎ a Department of Neuroscience, Physiology and Pharmacology, University College London, UK b Department of Physiology, Anatomy and Genetics, University of Oxford, UK c Department of Orthopaedics and Traumatology, The University of Hong Kong, Hong Kong, China d Unité READ, Université catholique de Louvain, Brussels, Belgium abstract article info Article history: Received 15 September 2009 Revised 25 November 2009 Accepted 1 December 2009 Available online 11 December 2009 Keywords: Laser-evoked potentials (LEPs) N1 wave Single-trial analysis Independent component analysis (ICA) Wavelet filtering Multiple linear regression Event-related potentials (ERPs) Brief radiant laser pulses can be used to activate cutaneous Aδ and C nociceptors selectively and elicit a number of transient brain responses in the ongoing EEG (N1, N2 and P2 waves of laser-evoked brain potentials, LEPs). Despite its physiological and clinical relevance, the early-latency N1 wave of LEPs is often difficult to measure reliably, because of its small signal-to-noise ratio (SNR), thus producing unavoidable biases in the interpretation of the results. Here, we aimed to develop a method to enhance the SNR of the N1 wave and measure its peak latency and amplitude in both average and single-trial waveforms. We obtained four main findings. First, we suggest that the N1 wave can be better detected using a central-frontal montage (Cc-Fz), as compared to the recommended temporal–frontal montage (Tc-Fz). Second, we show that the N1 wave is optimally detected when the neural activities underlying the N2 wave, which interfere with the scalp expression of the N1 wave, are preliminary isolated and removed using independent component analysis (ICA). Third, we show that after these N2-related activities are removed, the SNR of the N1 wave can be further enhanced using a novel approach based on wavelet filtering. Fourth, we provide quantitative evidence that a multiple linear regression approach can be applied to these filtered waveforms to obtain an automatic, reliable and unbiased estimate of the peak latency and amplitude of the N1 wave, both in average and single-trial waveforms. © 2009 Elsevier Inc. All rights reserved. Introduction The magnitude of event-related EEG responses is often several factors smaller than the magnitude of the background ongoing EEG. Therefore, the identification and characterization of the EEG responses elicited by sensory events (event-related potentials, ERPs) rely on signal processing methods for enhancing their SNR. The most widely used approach is the across-trial averaging in the time domain (Dawson, 1951, 1954). The obtained waveform expresses the average scalp potential as a function of time relative to the onset of the sensory event. The basic assumption underlying this procedure is that ERPs are stationary (i.e., their latency and morphology are invariant across trials) and will therefore be unaffected by the averaging procedure, while the ongoing electrical brain activity behaves as noise unrelated to the event, and will therefore be largely cancelled out by the averaging procedure, thus enhancing the SNR of ERPs (Mouraux and Iannetti, 2008). The cost of this across-trial averaging procedure is that all the information concerning across-trial variability of ERP latency and amplitude is lost. However, this variability may reflect important factors such as differences in stimulus parameters (duration, in- tensity, and location) (Iannetti et al., 2005b, 2006; Mayhew et al., 2006), and, most importantly, fluctuations in vigilance, expectation, attentional focus, or task strategy (Haig et al., 1995). Hence, the ability to obtain a reliable single-trial estimate of ERP latency and amplitude would allow exploring the single-trial dynamics between these ERP measures, behavioural variables (e.g. intensity of percep- tion, reaction time) (Iannetti et al., 2005b) and also measurements of brain activity obtained using different neuroimaging modalities (e.g. fMRI) (Mayhew et al., 2010). Therefore, methods that explore ERP dynamics at the level of single-trials can provide new insights into the functional significance of the different processes underlying these brain responses (for a review see Mouraux and Iannetti, 2008). Brief radiant heat pulses, generated by infrared laser stimulators, excite selectively Aδ- and C-fibre free nerve endings located in the superficial layers of the skin (Bromm and Treede, 1984). Such stimuli elicit a number of brain responses that can be detected in the human EEG both in the time domain (laser-evoked potentials, LEPs; Carmon et al., 1976) and in the time–frequency domain (Mouraux et al., 2003). LEPs are related to the activation of type-II A-mechano-heat nociceptors (Treede et al., 1998) and spinothalamic neurons located in the anterolateral quadrant of the spinal cord (Treede et al., 2003). NeuroImage 50 (2010) 99–111 ⁎ Corresponding author. Department of Neuroscience, Physiology and Pharmacology, Medical Sciences Building, Gower Street, London, WC1E 6BT, UK. Fax: +44 20 7679 7928. E-mail address: [email protected] (G.D. Iannetti). 1053-8119/$ – see front matter © 2009 Elsevier Inc. All rights reserved. doi:10.1016/j.neuroimage.2009.12.010 Contents lists available at ScienceDirect NeuroImage journal homepage: www.elsevier.com/locate/ynimg
Transcript of A novel approach for enhancing the signal-to-noise ratio and detecting automatically event-related...

NeuroImage 50 (2010) 99–111
Contents lists available at ScienceDirect
NeuroImage
j ourna l homepage: www.e lsev ie r.com/ locate /yn img
A novel approach for enhancing the signal-to-noise ratio and detecting automaticallyevent-related potentials (ERPs) in single trials
L. Hu a,b,c, A. Mouraux d, Y. Hu c, G.D. Iannetti a,b,⁎a Department of Neuroscience, Physiology and Pharmacology, University College London, UKb Department of Physiology, Anatomy and Genetics, University of Oxford, UKc Department of Orthopaedics and Traumatology, The University of Hong Kong, Hong Kong, Chinad Unité READ, Université catholique de Louvain, Brussels, Belgium
⁎ Corresponding author. Department of Neuroscience,Medical Sciences Building, Gower Street, London, WC1E 6
E-mail address: [email protected] (G.D. Iannetti).
1053-8119/$ – see front matter © 2009 Elsevier Inc. Adoi:10.1016/j.neuroimage.2009.12.010
a b s t r a c t
a r t i c l e i n f oArticle history:Received 15 September 2009Revised 25 November 2009Accepted 1 December 2009Available online 11 December 2009
Keywords:Laser-evoked potentials (LEPs)N1 waveSingle-trial analysisIndependent component analysis (ICA)Wavelet filteringMultiple linear regressionEvent-related potentials (ERPs)
Brief radiant laser pulses can be used to activate cutaneous Aδ and C nociceptors selectively and elicit anumber of transient brain responses in the ongoing EEG (N1, N2 and P2 waves of laser-evoked brainpotentials, LEPs). Despite its physiological and clinical relevance, the early-latency N1 wave of LEPs is oftendifficult to measure reliably, because of its small signal-to-noise ratio (SNR), thus producing unavoidablebiases in the interpretation of the results. Here, we aimed to develop a method to enhance the SNR of the N1wave and measure its peak latency and amplitude in both average and single-trial waveforms. We obtainedfour main findings. First, we suggest that the N1 wave can be better detected using a central-frontal montage(Cc-Fz), as compared to the recommended temporal–frontal montage (Tc-Fz). Second, we show that the N1wave is optimally detected when the neural activities underlying the N2 wave, which interfere with the scalpexpression of the N1 wave, are preliminary isolated and removed using independent component analysis(ICA). Third, we show that after these N2-related activities are removed, the SNR of the N1 wave can befurther enhanced using a novel approach based on wavelet filtering. Fourth, we provide quantitativeevidence that a multiple linear regression approach can be applied to these filtered waveforms to obtain anautomatic, reliable and unbiased estimate of the peak latency and amplitude of the N1 wave, both in averageand single-trial waveforms.
© 2009 Elsevier Inc. All rights reserved.
Introduction
The magnitude of event-related EEG responses is often severalfactors smaller than the magnitude of the background ongoing EEG.Therefore, the identification and characterization of the EEGresponses elicited by sensory events (event-related potentials, ERPs)rely on signal processing methods for enhancing their SNR. The mostwidely used approach is the across-trial averaging in the time domain(Dawson, 1951, 1954). The obtained waveform expresses the averagescalp potential as a function of time relative to the onset of the sensoryevent. The basic assumption underlying this procedure is that ERPsare stationary (i.e., their latency and morphology are invariant acrosstrials) and will therefore be unaffected by the averaging procedure,while the ongoing electrical brain activity behaves as noise unrelatedto the event, and will therefore be largely cancelled out by theaveraging procedure, thus enhancing the SNR of ERPs (Mouraux andIannetti, 2008).
The cost of this across-trial averaging procedure is that all theinformation concerning across-trial variability of ERP latency and
Physiology and Pharmacology,BT, UK. Fax: +44 20 7679 7928.
ll rights reserved.
amplitude is lost. However, this variability may reflect importantfactors such as differences in stimulus parameters (duration, in-tensity, and location) (Iannetti et al., 2005b, 2006; Mayhew et al.,2006), and, most importantly, fluctuations in vigilance, expectation,attentional focus, or task strategy (Haig et al., 1995). Hence, theability to obtain a reliable single-trial estimate of ERP latency andamplitude would allow exploring the single-trial dynamics betweenthese ERP measures, behavioural variables (e.g. intensity of percep-tion, reaction time) (Iannetti et al., 2005b) and also measurements ofbrain activity obtained using different neuroimaging modalities (e.g.fMRI) (Mayhew et al., 2010). Therefore, methods that explore ERPdynamics at the level of single-trials can provide new insights into thefunctional significance of the different processes underlying thesebrain responses (for a review see Mouraux and Iannetti, 2008).
Brief radiant heat pulses, generated by infrared laser stimulators,excite selectively Aδ- and C-fibre free nerve endings located in thesuperficial layers of the skin (Bromm and Treede, 1984). Such stimulielicit a number of brain responses that can be detected in the humanEEG both in the time domain (laser-evoked potentials, LEPs; Carmonet al., 1976) and in the time–frequency domain (Mouraux et al., 2003).LEPs are related to the activation of type-II A-mechano-heatnociceptors (Treede et al., 1998) and spinothalamic neurons locatedin the anterolateral quadrant of the spinal cord (Treede et al., 2003).
100 L. Hu et al. / NeuroImage 50 (2010) 99–111
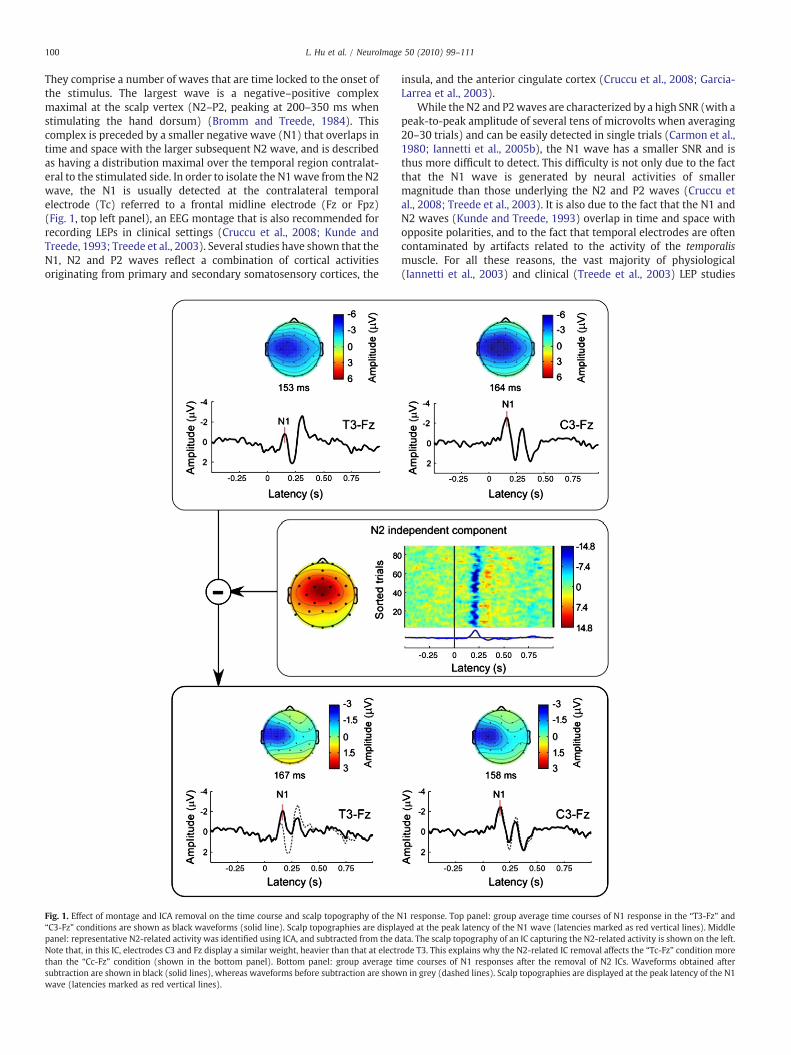
They comprise a number of waves that are time locked to the onset ofthe stimulus. The largest wave is a negative–positive complexmaximal at the scalp vertex (N2–P2, peaking at 200–350 ms whenstimulating the hand dorsum) (Bromm and Treede, 1984). Thiscomplex is preceded by a smaller negative wave (N1) that overlaps intime and space with the larger subsequent N2 wave, and is describedas having a distribution maximal over the temporal region contralat-eral to the stimulated side. In order to isolate the N1wave from the N2wave, the N1 is usually detected at the contralateral temporalelectrode (Tc) referred to a frontal midline electrode (Fz or Fpz)(Fig. 1, top left panel), an EEG montage that is also recommended forrecording LEPs in clinical settings (Cruccu et al., 2008; Kunde andTreede, 1993; Treede et al., 2003). Several studies have shown that theN1, N2 and P2 waves reflect a combination of cortical activitiesoriginating from primary and secondary somatosensory cortices, the
Fig. 1. Effect of montage and ICA removal on the time course and scalp topography of the N“C3-Fz” conditions are shown as black waveforms (solid line). Scalp topographies are displapanel: representative N2-related activity was identified using ICA, and subtracted from the dNote that, in this IC, electrodes C3 and Fz display a similar weight, heavier than that at electrthan the “Cc-Fz” condition (shown in the bottom panel). Bottom panel: group average tsubtraction are shown in black (solid lines), whereas waveforms before subtraction are showwave (latencies marked as red vertical lines).
insula, and the anterior cingulate cortex (Cruccu et al., 2008; Garcia-Larrea et al., 2003).
While the N2 and P2waves are characterized by a high SNR (with apeak-to-peak amplitude of several tens of microvolts when averaging20–30 trials) and can be easily detected in single trials (Carmon et al.,1980; Iannetti et al., 2005b), the N1 wave has a smaller SNR and isthus more difficult to detect. This difficulty is not only due to the factthat the N1 wave is generated by neural activities of smallermagnitude than those underlying the N2 and P2 waves (Cruccu etal., 2008; Treede et al., 2003). It is also due to the fact that the N1 andN2 waves (Kunde and Treede, 1993) overlap in time and space withopposite polarities, and to the fact that temporal electrodes are oftencontaminated by artifacts related to the activity of the temporalismuscle. For all these reasons, the vast majority of physiological(Iannetti et al., 2003) and clinical (Treede et al., 2003) LEP studies
1 response. Top panel: group average time courses of N1 response in the “T3-Fz” andyed at the peak latency of the N1 wave (latencies marked as red vertical lines). Middleata. The scalp topography of an IC capturing the N2-related activity is shown on the left.ode T3. This explains why the N2-related IC removal affects the “Tc-Fz” condition moreime courses of N1 responses after the removal of N2 ICs. Waveforms obtained aftern in grey (dashed lines). Scalp topographies are displayed at the peak latency of the N1

101L. Hu et al. / NeuroImage 50 (2010) 99–111
conducted in the past 30 years have relied uniquely on measures ofthe N2 and P2 waves to investigate the nociceptive system. In recentyears, a growing number of studies have started to exploreexperimental modulations of the latency and amplitude of the N1wave, and to characterize its functional significance (Ellrich et al.,2007; Iannetti et al., 2008; Lee et al., 2009; Legrain et al., 2002;Mouraux and Iannetti, 2009; Schmahl et al., 2004). Indeed, there isexperimental evidence indicating that the N1 wave represents anearly stage of sensory processing more directly related to theascending nociceptive input (Lee et al., 2009), while the later N2and P2 waves appear to reflect neural activities largely unspecific forthe sensory modality of the eliciting stimulus (Mouraux and Iannetti,2009). For all these reasons, a more systematical examination of N1has been recommended to enhance the sensitivity of LEPs in clinicalapplications (Cruccu et al., 2008; Treede et al., 2003).
Hence, a technique to assess reliably themagnitude of the N1wavehas been long awaited by the scientific community, and its availabilitywould represent a significant improvement for a more completeutilization of LEPs to explore the nociceptive system. Here we describea novel method that combines independent component analysis (ICA)with wavelet filtering and multiple linear regression to obtainautomatic and unbiased measures of latency and amplitude of ERPs,both in averaged and single-trial responses. When applied to LEPs, weshow that this method provides a reliable estimate of the latency andamplitude of the N1 peak at single-trial level.
Methods
Subjects
EEG data were collected from eleven healthy volunteers (eightfemales and threemales) aged from23 to42years (30±5,mean±SD).All participants gave written informed consent, and the local ethicscommittee approved the procedures.
Nociceptive stimulation and experimental paradigm
Noxious radiant-heat stimuli were generated by an infraredneodymium yttrium aluminium perovskite (Nd:YAP) laser with awavelength of 1.34 μm (Electronical Engineering, Italy). These laserpulses activate directly nociceptive terminals in the most superficialskin layers (Baumgartner et al., 2005; Iannetti et al., 2006). Laserpulses were directed to the dorsum of the right hand and a He-Nelaser pointed to the area to be stimulated. The laser pulse wastransmitted via an optic fibre and focused by lenses to a spot diameterof approximately 8 mm (50 mm2) at the target site. The duration ofthe laser pulses was 4 ms and its energy 3.5 J. With these parameterslaser pulses elicit a clear pinprick sensation, related to the activation ofAδ skin nociceptors (Iannetti et al., 2006). After each stimulus, thelaser beam target was shifted by approximately 20 mm in a randomdirection, to avoid nociceptor fatigue and sensitization. The laserbeam was controlled by a computer that used two servo-motors(HS-422; Hitec RCD, USA; angular speed, 60°/160 ms) to orient italong two perpendicular axes (Lee et al., 2009).
EEG recording
EEG data were collected in a single recording session, comprisingthree blocks of stimulation. In each block, 30 trials were presentedwith an inter-trial interval (ITI) ranging between 15 and 18 s.Participants were seated in a comfortable chair and wore protectivegoggles. They were asked to focus their attention on the stimuli,relax their muscles and keep their eyes open and gaze slightlydownward. Acoustic isolation was ensured using earplugs andheadphones. Both the laser beam and the controlling motors werecompletely screened from the view of the participants. The EEG was
recorded using 30 Ag-AgCl electrodes placed on the scalp accordingto the International 10-20 system, using the nose as extracephalicreference. To monitor ocular movements and eye blinks, electro-oculographic (EOG) signals were simultaneously recorded fromtwo surface electrodes, one placed over the lower eyelid, theother placed 1 cm lateral to the outer corner of the orbit. Theelectrocardiogram was recorded using two electrodes placed on thedorsal aspect of the left and right forearms. Signals were amplifiedand digitized using a sampling rate of 1,024 Hz and a precision of 12bits, giving a resolution of 0.195 μV digit−1 (System Plus; Micromed,Italy).
EEG data preprocessing
EEG data were imported and processed using EEGLAB (Delormeand Makeig, 2004), an open source toolbox running under theMATLAB environment. Continuous EEG data were band-pass filteredbetween 1 and 30 Hz. EEG epochs were extracted using a windowanalysis time of 1500 ms (500 ms pre-stimulus and 1000 ms post-stimulus) and baseline corrected using the pre-stimulus time interval.In order to test the possible bias in the automated single-trial N1detection method, the same number of trials of resting EEG (3500 msto 5000 ms post-stimulus) were extracted from the dataset of eachsubject.
Trials contaminated by eye-blinks and movements were correctedusing an ICA algorithm (Delorme and Makeig, 2004; Jung et al., 2001;Makeig et al., 1997). EEG epochs were then visually inspected andtrials contaminated by artifacts due to gross movements wereremoved. In all datasets, individual eye movements, showing a largeEOG channel contribution and a frontal scalp distribution, were clearlyseen in the removed independent components.
After these pre-processing steps, 987 epochs remained for theautomated N1 detection. Similarly, 987 epochs of resting EEG werekept for testing the possible detection bias.
EEG data analysis: standard averaging for N1 detection
For each subject, average waveforms were computed, time-lockedto the onset of the stimulus. Single-subject average waveforms weresubsequently averaged to obtain group-level average waveforms.For each waveform, the latency and the baseline-to-peak amplitude ofN1 were measured in two conditions: at the temporal electrodecontralateral to the stimulated side, rereferenced to Fz (T3-Fz), i.e. therecommended montage to detect N1 (Treede et al., 2003), and at thecentral electrode contralateral to the stimulated side, rereferenced toFz (C3-Fz). N1 was defined as the negative deflection preceding theN2 wave, which appears, in this montage, as a positive deflection.Unique and obvious negative deflections preceding the N2 wavewere classified as a clear N1 response, while the N1 response wasdefined as absent if the N1 amplitude was positive or if a uniquenegative deflection preceding the N2 wave could not be identified.Group-level scalp topographies at the latency of the N1 wave werecomputed by spline interpolation
For each subject, epoched EEG data were decomposed using ICA(runica routine; Delorme and Makeig, 2004), a technique usedsuccessfully by a growing number of investigators to perform blindsource separation of scalp EEG (Makeig et al., 1997, 2004). Whenapplied to multi-channel recordings, ICA unmixes the signalsrecorded on the scalp into a single linear combination of independentcomponents (ICs), each having a maximally independent time courseand a fixed scalp distribution. In each subject, we searched for ICsreflecting the N2 activity.
ICs were classified as being “N2-related” when they satisfied thefollowing three criteria: (1) Being stimulus-related, i.e. reflectingneural activity elicited by the laser stimulus. To ascertain this, the timecourse of the power of each IC (μV2) was expressed as the standard

102 L. Hu et al. / NeuroImage 50 (2010) 99–111
deviation from the mean (Z scores) of the pre-stimulus interval(−500 to 0 ms). In each IC, the Z scores were then averaged withinthe 0 to +500 ms post-stimulus interval. Only if the resulting averageZ score was larger than 5, the IC was classified as stimulus-related (thesame approach used in Mouraux and Iannetti, 2009). (2) Having thelatency of the first peak comprised between 175 and 275 ms. (3)Having a scalp topography centrally-distributed and maximal at thevertex (Fig. 1, middle panel).
These ICs were subsequently removed, thus generating a new setof EEG data devoid of the N2-related activity represented in thesecomponents.
New average waveforms were computed from this new dataset,using the procedures described previously. Such as for the originalEEG data, the baseline-to-peak amplitude of the N1 wave wasmeasured at the temporal electrode contralateral to the stimulatedside, rereferenced to Fz (T3-Fz, N2-IC removed), and at the centralelectrode contralateral to the stimulated side, also rereferenced to Fz(C3-Fz, N2-IC removed). Also for these additional two conditionsgroup-level scalp topographies at the latency of the N1 wave werecomputed.
The latency and amplitude of the N1 wave obtained in each ofthese four conditions “T3-Fz”, “C3-Fz”, “T3-Fz, N2-IC removed” and“C3-Fz, N2-IC removed” were compared using a two-way, repeatedmeasures analysis of variance (ANOVA), using “montage” and “N2-ICremoval” as experimental factors. When significant, post hoc pairedt tests were used to perform pairwise comparisons. All statisticalanalyses were carried out using SPSS 16.0 (SPSS Inc., Chicago, IL).
EEG data analysis: single-trial analysis of N1
The method for estimating the latency and amplitude of the N1wave in single trials, summarized in Fig. 2, consists of two consecutivesteps: wavelet filtering and multiple linear regression. This methodhas been developed into user-friendly software running under theMatlab environment, which can be freely downloaded from http://iannettilab.webnode.com.
Wavelet filtering
Single-trial N1 waveforms from the “C3-Fz, N2-IC removed”condition were wavelet-filtered to reduce the background noise aswell as part of the N2-P2 response, and increase the SNR of the N1response. Wavelet filtering was performed in the following threesteps (detailed below). First, single-trial N1 waveforms were decom-posed into a time–frequency representation using a continuouswavelet transform (CWT). Second, specific areas on the time–frequency plane corresponding to the N1 response (group average)were identified and used to generate the wavelet filtering model.Third, time-domain N1 waveforms were reconstructed using aninverse continuous wavelet transform (ICWT).
(a) Continuous wavelet transform (CWT)Unlike the windowed Fourier transform, the continuous wavelet
transform (CWT) is able to construct a time–frequency representationof EEG or ERP signals that offers an optimal compromise for time andfrequency resolution by adapting the window width as a function ofestimated frequency (Iannetti et al., 2008; Mouraux et al., 2003;Mouraux and Iannetti, 2008). The time–frequency representationobtained by CWT provides a relatively low temporal resolution but a
Fig. 2. Flowchart describing the procedure developed to enhance the SNR of the N1 wave oftrials (bottom panel). Top panel: a time–frequency representation is obtained from group avegenerated by thresholding this time–frequency representation (2). This filter is applied (3Filtered single-trial LEP responses are then reconstructed in the time-domain using an inver(5) and averaged (6) LEP responses with enhanced SNR. Bottom panel: a multiple linear runbiased estimate of the peak latency and amplitude of N1 waves. A regressor and its temwaveform (7). This basis set is then regressed (8) against the corresponding time window o
high frequency resolution at low frequencies, and a relatively hightemporal resolution but a low-frequency resolution at high frequen-cies, and is thus well suited to explore transient modulations of theEEG spectrum within a wide frequency spectrum (Iannetti et al.,2008).
The CWT has a linear distribution and is defined as (Tognola et al.,1998):
WT τ; fð Þ =Z
t
x tð Þ �ffiffiffiffiffiffiffiffiffiffif = f0
q� ψT f = f0 � t − τð Þð Þdt ð1Þ
ψ tð Þ = 1ffiffiffiffiffiffiffiπfb
p e2iπfoxe− x2
fb ð2Þ
where τ and f are the time and frequency index, respectively, and x(t)is the original signal in time (t) domain; ψ(t) is the mother waveletfunction with central frequency f0. The mother wavelet ψ(t) usedin this study is a complex Morlet wavelet (Eq. (2)). Bandwidthparameters fb and f0 were set to 0.05 and 6, respectively, and display agood time–frequency resolution with explored frequencies rangingfrom 1 to 30 Hz in steps of 0.3 Hz. The squared magnitude of WT(τ, f)is called the scalogram or power spectrum.
(b) Wavelet filtering modelIn order to apply time–frequency filtering to enhance the SNR of
the N1 response at the level of single trials, a weighted, binary time–frequency template (Wf) was generated, identifying the distributionof EEG changes induced by the laser stimulus contained in the grand-averaged time–frequencymatrix. This templatewas then used to filterout the contribution of non-stimulus-related background activity, aswell as the contribution of part of the N2-P2 response, and therebyenhance the SNR of the N1 response.
For each estimated frequency, the magnitude of the powerspectrum was baseline-corrected by subtracting the average powerof the signal enclosed in the time-interval ranging between−250 and0ms (Iannetti et al., 2008; Pfurtscheller and Lopes da Silva, 1999). Theobtained time–frequency matrix was then thresholded with theobjective of keeping wavelet coefficients with high energy andeliminating wavelet coefficients with low energy. The empiricalcumulative distribution function (CDF) of normalized power spec-trum was calculated by the Kaplan–Meier estimate (Lawless, 2003),and the filtering model was obtained by creating a matrix whosetime–frequency pixels were set to 1 when the CDF of thecorresponding wavelet coefficient was greater than the threshold,and set to 0 when the CDF of the corresponding wavelet coefficientwas smaller than the threshold, defined as 0.85×(max(CDF)−min(CDF))+min(CDF). As shown in Fig. 2 (step 3), the selected thresholdwas set just before the inflection point, with the objective of keepingthe greater part of the N1 response while removing as much noise aspossible.
For each single trial EEG epoch, time–frequency filtering wasachieved by Eq. (3).
FWTi τ; fð Þ = Wf �WTi τ; fð Þ ð3Þ
where WTi is the time frequency representation of trial i obtained byCWT, and FWTi is the filtered time frequency representation which iscalculated by multiplying WTi with the previously computed filteringmatrix Wf.
LEPs (top panel), and to measure automatically its peak latency and amplitude in singlerage waveform, using a continuous wavelet transform (CWT) (1), and a wavelet filter is) to the time–frequency representation obtained from single-trial LEP responses (4).se CWT (ICWT) (5), and finally averaged (6). This procedure generates both single-trialegression is applied to these single-trial LEPs with enhanced SNR to obtain a fast andporal derivative (0 to 0.25 s post-stimulus) are obtained from the across-trial averagef each single LEP trial, thus yielding (9) a latency and amplitude value for each N1 peak.

103L. Hu et al. / NeuroImage 50 (2010) 99–111

104 L. Hu et al. / NeuroImage 50 (2010) 99–111
(c) Inverse continuous wavelet transform (ICWT)The time–frequency filtered signal yi(t) was reconstructed into the
time domain by applying the inverse continuous wavelet transform(ICWT) to the filtered time–frequency distribution FWTi (τ, f) withthe following expression (Tognola et al., 1998).
yi tð Þ = Cψ
Zτ
Z
f
FWTi τ; fð Þ �ffiffiffiffiffiffiffiffiffiffif = f0
q� ψ f = f0 t − τð Þð Þ � f = f0ð Þ2dτ � df ð4Þ
where Cψ is a coefficient that depends on the Fourier transform ofψ(t).
The SNR was estimated by dividing the N1 peak amplitude(absolute value) by the standard deviation of the LEP waveform inthe pre-stimulus interval (−500 to 0 ms), an approach proposed bysome investigators (e.g. Debener et al., 2007; Spencer, 2005). SNRvalues before and after wavelet filtering were assessed using non-parametric Wilcoxon test, due to the non-normal distribution of theSNR values.
Multiple linear regression
In order to estimate N1 latency and amplitude in an accurate andunbiased fashion, a linear regression method similar to the one weoriginallydescribed inMayhewet al. (2006)was applied to thewaveletfiltered data, within the 0–250 ms post-stimulus time-interval.
The linear regression model can be written as:
Y =X2i=1
βiXi + e ð5Þ
where Y is a m×n matrix containingm single-trials EEG epochs and nsamples of each epoch (from 0ms to the first zero crossing point afterthe N1 peak). Xi are the regressors derived from the averagewaveform. βi are coefficients that weight the fit of Xi to the data Y. ɛis the residual error of the fitted model.
For each subject, a regressor and its temporal derivative wereobtained from the across-trial average waveform measured afterwavelet filtering. The inclusion of the temporal derivative allowsmodeling the temporal variability of the response and provides anestimate of single-trial N1 wave latency. This basis set was thenregressed against each single EEG epoch. The coefficients βi of eachtrial were calculated by multiple linear regression, and thecorresponding fit of the N1 response was obtained by multiplyingthe two regressors (derived from the average waveform, see Eq. 5) bythe regression coefficients.
Based on the fitted waveform, latency and amplitude of the N1response in each single trialwas estimatedbyfinding themost negativepeak if β1N0 (positive fit), or the most positive peak if β1b0 (negativefit) within an 80-ms time window centered on the latency of the N1response in the average waveform of each subject. Finally, single-triallatencies were calculated from the latencies of the correspondingamplitude peaks.
For each subject, single-trial N1 latencies and amplitudes obtainedfrom the multiple linear regression method were averaged acrosstrials and compared to the N1 latencies and amplitudes estimatedmanually from the averaged waveforms. Correlation coefficients andtheir significance were calculated and compared for N1 latency andamplitude separately.
Detection bias
In the described method, wavelet filtering is used to enhance theSNR of the N1 wave, and multiple linear regression is used to providean accurate estimate of the latency and amplitude of the N1 wave atthe level of single trials. To examine whether our method introducesany bias in the analysis, the same procedure was applied to the resting
EEG epochs obtained from all subjects. The obtained amplitude valueswere compared against zero using a one sample t test.
Results
Efficacy of different approaches for N1 detection in across-trial averages
Using the recommended montage (Kunde and Treede, 1993;Treede et al., 2003) (T3-Fz condition) the N1 wave was present in 5out of 11 subjects (Fig. 3, left panel), with a latency of 165±24ms andan amplitude of −2.6±3.4 μV (mean±SD). In the grand averagewaveform, its scalp distribution extended bilaterally towards tempo-ral regions, with a clear maximum contralateral to the stimulatedhand (Fig. 1, top left panel; Fig. 4).
In contrast, in the “C3-Fz” condition the N1wave was present in all11 subjects (Fig. 3, right panel), with a latency of 167±25 ms and asignificantly larger amplitude of −4.3±2.8 μV (pb0.001, two tailedpaired t test). Similarly to the “T3-Fz” condition, in the grand averagewaveform its scalp distribution extended bilaterally towards temporalregions, with a clear maximum contralateral to the stimulated hand(Fig. 1, top right panel; Fig. 4).
The isolated number of ICs classified as “N2-related”, ranged,across subjects, from 1 to 2 (1.4±0.5). These N2-related ICsaccounted for 25.5±12.8% of the variance of the entire LEP response.The peak amplitudes of the N2 wave was significantly reduced(−55.2±20.6%; pb0.0001, two-tailed paired t test) after thesubtraction of N2-related ICs. For each subject, the number of N2-related ICs, the signal variance they explain and the N2-wave latencyand amplitude before and after the removal of N2-related ICs aresummarized in Table 1.
After the N2-related activity isolated with ICA was removed, in the“T3-Fz, N2-IC removed” condition the N1 wave was identified in 7 outof 11 subjects, with a latency of 174±29 ms and an amplitude of−3.3±3.1 μV. In the grand average waveform, its scalp distributionwas restricted to the hemisphere contralateral to the stimulated hand,with a maximum at C3 (Fig. 1, bottom left panel; Figs. 4, 5).
In the “C3-Fz, N2-IC removed” condition the N1 wave was stillpresent in all 11 subjects, with a latency of 166±26 ms and anamplitude of −4.2±2.4 μV. Similarly to the “T3-Fz, N2-IC removed”condition, in the grand average waveform its scalp distribution wasrestricted to the hemisphere contralateral to the stimulated hand,with a maximum at C3 (Fig. 1, bottom right panel; Fig. 4).
There was no significant main effect of the factors “montage” or“N2-IC removal” on the N1 latency (p=0.577 and p=0.145,respectively), but there was an interaction between these two factors(p=0.006). Post hoc comparisons revealed that the N1 latencymeasured after the removal of the N2-related activity was signifi-cantly longer, but only when considering the Tc-Fz montage(p=0.014, two tailed paired t test) (Fig. 4).
There was a significant main effect of the factor “montage” on theN1 amplitude (p=0.024), no main effect of the factor “N2-ICremoval” (p=0.682), and a significant interaction between thesetwo factors (p=0.018). Post hoc comparisons revealed that the N1amplitude measured at T3-Fz was significantly smaller than the N1amplitude measured at C3-Fz, but only when the N2-related activitywas not removed (pb0.001, two tailed paired t test) (Fig. 4).
Single-trial analysis of N1 peak: wavelet filtering
In order to obtain a single-trial estimate of the N1 peak, the SNR ofsingle-trial LEPs was increased by using a time–frequency filter basedon the continuous wavelet transform (CWT). The left panel of Fig. 6shows the time–frequency representation of the grand averaged N1waveform used to derive the filter model. This representation ischaracterized by a phase-locked signal increasemaximal between 100and 350 ms (in time), and between 5 and 10 Hz (in frequency). This

Fig. 3. Identification of N1 response in single subjects. Single-subject average ERP waveforms obtained using the Tc-Fz montage (left panel) and the Cc-Fz montage (right panel).Group averages are displayed in the bottom row. Not how, using the Tc-Fz montage, a clear N1 can be detect in 5 out of 11 subjects, while using the Cc-Fz montage a clear N1 can bedetected in all subjects.
105L. Hu et al. / NeuroImage 50 (2010) 99–111

Fig. 4. Comparison of N1 latencies and amplitudes across the four explored conditions.Left panel: N1 latencies averaged across all subjects. Error bars represent varianceacross subjects, expressed as SD. Note how the N1 latency measured after the removalof the N2-related activity was significantly longer, but only when considering the Tc-Fzmontage (p=0.014, two tailed paired t test). Right panel: N1 amplitudes averagedacross all subjects. Error bars represent variance across subjects, expressed as SD. Notehow the N1 amplitude measured at T3-Fz was significantly smaller than the N1amplitude measured at C3-Fz, but only when the N2-related activity was not removed(pb0.001, two tailed paired t test).
Fig. 5. Effect of the removal of the N2-related activities on the N1waveform. Across-trialaverage waveforms from one representative subject. Waveforms are displayed usingthe Tc-Fz montage. The green line represents the original, unsubtracted signal. The blueline represents the waveform obtained after removal of one N2-related IC. The blackline represents the waveform obtained after removal of all (two, in this case)N2-related ICs. Note how, by removing the N2-related ICs, the N1 peak becomesevident. An enlargement of the N1 peak is shown in the inset.
106 L. Hu et al. / NeuroImage 50 (2010) 99–111
representation, thresholded at 0.85, was used to generate the filtermodel that was subsequently applied to every single-trial LEP. Theright panel of Fig. 6 shows how this CWT filter reduces minimally theamplitude of the response but increases remarkably its SNR (Table 2).
The bidimensional plots of single trial EEG responses in the leftpanel of Fig. 7 show the effect of the CWT filter on single-trial LEPwaveforms and on single-trial resting EEG. While in the LEP wave-forms the wavelet filtering significantly enhances the SNR of thephase-locked N1 wave (from 6.7±3.4 to 16.4±9.5, p=0.003,Wilcoxon test) (Table 2), in the resting EEG the wavelet filteringonly reduces the noise. Single-subject SNRs of the N1 wave before andafter wavelet filtering are displayed in Table 2. Single-subject N1latencies before N2-removal, after N2-IC removal and after waveletfiltering are summarized in Table 3.
Comparison between standard-average and single-trial N1 values
Fig. 8 shows the correlations between the N1 latencies andamplitudes obtained from the multiple linear regression method andthe N1 latencies and amplitudes estimated manually from theaveraged waveforms.
The average of single-trial estimates of both N1 latency and N1amplitude values showed a strong correlation with the correspondingvalues measured in standard averaged waveforms (N1 latency:R=0.9980, pb0.0001; N1 amplitude: R=0.9947, pb0.0001). TheN1 latency values were almost identical (single trials: 167±25 ms;
Table 1Number of and variance explained by N2-related ICs identified in each subject, as well as N
Subject Number of N2-related ICs Variance explained (%) Before
N2 late
#1 1 10.8 190#2 2 22.2 188#3 1 17.4 230#4 2 21.2 233#5 1 19.1 236#6 1 40.0 274#7 2 49.2 236#8 1 24.9 224#9 2 43.5 179#10 1 9.2 224#11 1 25.8 198Mean (±SD) 1.4±0.5 25.5±12.8 219±
standard average: 166±24 ms; p=0.135, two tailed t test) (Fig. 8,left panel). In contrast, the N1 amplitude values were significantlygreater in the single-trial estimates than in the standard averagedwaveforms (single trials: −4.3±2.7 μV; standard average: −3.6±2.2 μV; +20% absolute increase, pb0.001, two tailed t test) (Fig. 8,right panel).
Detection bias
To test if the method used to estimate single-trial N1 amplitudeintroduced any detection bias, the same method was applied to anequal number of resting EEG epochs obtained from all subjects. Thesingle-trial estimate of response amplitude from resting EEG epochsyielded a mean (±SD) amplitude value of 0.05±5.1 μV. Theseamplitude values were not significantly different from zero (p=0.76,one sample t test). A comparison of the single-trial estimates obtainedin the LEP waveforms vs. the resting EEG epochs in a representativesubject is shown in the right panel of Fig. 7. This result confirms thatthe describedmethod provides an unbiased estimate of single-trial N1LEP amplitude.
Discussion
In this study we obtained four main findings. First, we suggest thatthe N1 wave of the LEP can be better detected using a central-frontal(C3-Fz) montage, compared to the recommended temporal–frontal(T3-Fz) montage. Second, we show that the N1 wave is optimally
2-wave latency and amplitude before and after the removal of N2-related ICs.
N2-IC removal After N2-IC removal
ncy (ms) N2 amplitude (μV) N2 latency (ms) N2 amplitude (μV)
−38.3 205 −22.3−17.3 202 −3.3−28.3 246 −16.1−18.2 274 −5.3−13.2 300 −5.3−9.1 285 −1.9
−13.9 203 −5.3−19.9 209 −14.8−10.4 176 −8.3−8.3 186 −4.0
−14.6 215 −4.128 −17.4±9.0 227±42 −8.2±6.5

Fig. 6. Wavelet filtering and its effect on the N1 response. Left panel: time–frequency representation of the average laser-evoked response at C3-Fz after the removal of theN2-related ICs (“C3-Fz, N2-IC removed” condition). x-axis: latency (s); y-axis: frequency (Hz). For each frequency, the magnitude of power spectrumwas normalized by subtractingthe average amplitude from the foreperiod between −0.25 and 0 s. Middle panel: threshold estimation and wavelet filtering effect. x-axis: threshold; y-axis: ratio between filteredand unfiltered N1 peak amplitude. The reduction of the N1 peak amplitude is expressed as a function of the applied threshold. Note how the amplitude of the filtered N1 peak isreduced by applying a higher threshold. A threshold of 0.85 (red line) was chosen as the best compromise between preserving the N1 response and increasing its SNR. Right panel:effect of the wavelet filtering on the N1 waveforms. x-axis: latency (s); y-axis: amplitude (μV). Note how the SNR of the filtered N1 waveform (solid line) is significantly increasedcompared to the original unfiltered waveform (dashed line) (from 6.7±3.4 to 16.4±9.5, p=0.003, Wilcoxon test; see also Table 2).
107L. Hu et al. / NeuroImage 50 (2010) 99–111
detected when the neural activities underlying the N2 wave, whichinterfere with the scalp expression of the N1 wave, are isolated andremoved in a preliminary step using ICA. Third, we show that after theN2-related activities are removed, the SNR of the N1 LEP response canbe effectively enhanced using a novel approach based on waveletfiltering. Fourth, we provide quantitative evidence that a multiplelinear regression approach can be applied to these LEP waveformswith higher SNR to obtain an automatic, reliable and unbiasedestimate of the peak latency and amplitude of the N1 wave, both inaverage and single-trial waveforms.
N1 recording montage
The scalp distribution of LEPs around the peak latency of the N1wave displays a maximal positivity in the frontal midline region(Kunde and Treede, 1993; Treede et al., 2003). Therefore, Fz has beensuggested as being the best choice for a reference electrode to detectthe N1 negative peak in a bipolar montage, and a waveform displayedusing the contralateral temporal electrode Tc versus Fz is currentlyrecommended to detect the N1 response (Cruccu et al., 2008; Treedeet al., 2003). On the other hand, there is evidence that the amplitudeof the N1 is similar in the Tc-Fz and in the Cc-Fz montages. Forinstance, Legrain et al. (2002) found similar N1 amplitudes attemporal (T3/T4) and central (C3/C4) electrodes, and even higherN1 amplitudes at C4 when considering left hand stimulation (seeupper panel of Fig. 8 in their publication). Also, the topography of theN1wave (see Fig. 1 of their publication) shows a clear N1maximumatcentral, and not temporal electrodes. In a very recent study, Legrain
Table 2SNR of the N1 wave before and after wavelet filtering.
Subject Before wavelet filtering After wavelet filtering
#1 12.4 38.1#2 4.3 15.2#3 6.4 10.3#4 6.5 17#5 2.3 9.4#6 10 24.2#7 11.3 26.1#8 2.8 13.9#9 7.2 8.3#10 4.1 7.4#11 6.2 11Mean (±SD) 6.7±3.4 16.4±9.5
et al. (2009) observed that “N1c was not different between righttemporo-parietal (T4 and TP8) and centro-parietal (C4 and CP4)electrodes.” So far, exploring experimental modulations of the N1wave has been limited because of the difficulty to identify a clear N1response in single subjects or patients when using this recommendedmontage. For example, in the present study, a clear N1 response wasidentified in only 5 out of 11 subjects (Fig. 3, left panel). Several reasonscould explain the difficulty to detect a clear N1 wave using the Tc-Fzmontage. First, when thismontage is used, the scalp expression of theN1wave is suppressed by the overlapping N2 wave, which has an oppositepolarity. Second, the Tc electrode is particularly sensitive to artifactsrelated to the activity of the temporalis muscle. Both of these factorscontribute to reduce the SNR of the N1wave when the Tc-Fz montage isused. Importantly, the scalp distribution of LEPs at or around the peaklatency of theN1wave displays amaximal negativity either between thecontralateral temporal (Tc) and central (Cc) electrodes (e.g. Tarkka andTreede, 1993) or centred over the central (Cc) electrode (Fig. 1, toppanel). For this reason, and because electrode Cc is less affected byactivity of the temporalis muscle, we compared the N1 response in therecommended Tc-Fz montage with the N1 response in the Cc-Fzmontage. By performing this comparison, we found that in the Cc-Fzmontage, there is much less interference between the scalp expressionsof the N2 and N1 waves. Indeed, when the N2-related activity wasisolated using ICA (Fig. 1, middle panel; see also Fig. 9 in Mouraux andIannetti, 2008), its amplitudewas similar atCc andFz electrodes. Thus, itsscalp expression is largely cancelled out using the Cc-Fz bipolarmontage.
Consequently, in the Cc-Fz montage we were able to detect a clearN1 response in all 11 subjects, as opposed to only 5 out of 11 subjectswhen using the Tc-Fz montage (Fig. 1; Fig. 3). Furthermore, its peakamplitude was significantly larger in the Cc-Fz montage than in theTc-Fz montage (Fig. 1, top panel; Fig. 4).
Spatial–temporal filtering to remove the interference between N1 andN2 waves
The overlap in time and space between the N1 and N2 waves(Kunde and Treede, 1993; Treede et al., 1988) may influence the N1amplitude greatly, and, when using the Tc-Fz montage, may even leadto a positive absolute amplitude value for the N1 negative deflectionrelative to baseline (Fig. 5). In order to reduce the interference due tothe overlap between the N1 and the N2 waves, we used ICA to isolateand remove N2-related neural activities contributing to the EEG signal(Fig. 1, middle and bottom panels). ICA is a blind source separationtechnique that works as a spatial filter and is capable to exploit the

Fig. 7. Unbiased automatic detection of single-trial N1 amplitudes. Left panel: comparison of the effect of wavelet filtering on stimulus-evoked EEG trials (obtained from the “C3-Fz, N2-IC removed” condition, top row) and resting EEG trials(obtained from the same montage, bottom row). Ninety single-trials from one subject are represented using bidimensional plots. Horizontal lines in the plot represent single-trial responses, with signal amplitude colour-coded at each timepoint. Responses are sorted vertically in order of occurrence, from bottom (first trial) to top (last trial). The waveform below each plot is the average of all responses. Negativity is plotted upward. The dashed line marks the latency of the N1peak in the filtered waveform. Middle panel: scalp topography of the average of stimulus-evoked EEG trials (top) and resting EEG trials (bottom), at the peak latency of the N1 wave in the filtered waveform. Note how the topography ofstimulus-evoked trials is characterized by a contralateral negative peak, maximum around the C3 electrode (red circle). Right panel: single-trial amplitudes (same data shown in the left and middle panel) estimated in stimulus-evoked EEGtrials (in red) and resting EEG trials (in blue), usingmultiple linear regression. The average N1 peak amplitude is−6.0±5.6 μV in the stimulus-evoked trials and−0.05±0.6 μV in the resting EEG trials. Note how the amplitude values obtainedfrom the resting EEG trials are not significantly different from zero (p=0.4239, one sample t test).
108L.H
uet
al./NeuroIm
age50
(2010)99
–111

Table 3Effect of N2-IC removal and wavelet filtering on the N1 latency (ms).
Subject Before N2-ICremoval
After N2-ICremoval
After waveletFiltering
#1 154 140 142#2 125 123 130#3 167 166 166#4 199 194 201#5 166 166 173#6 200 199 194#7 201 200 196#8 168 168 162#9 136 136 140#10 153 155 157#11 172 174 170Mean (±SD) 167±25 166±26 166±24
109L. Hu et al. / NeuroImage 50 (2010) 99–111
spatial information contained in multichannel EEG recordings toseparate sensory ERPs into distinct ICs, each having a fixed scalpdistribution and amaximally-independent time course (Makeig et al. ,1997, 2004; Mouraux and Iannetti, 2008). ICA has been demonstratedto be effective in isolating stimulus-related and ongoing componentsin single-trial EEG signals (Debener et al., 2006; Jung et al., 2001; Tanget al., 2005), and has been also applied to the separation of LEPs intophysiologically-distinct neural components (Mouraux and Iannetti,2008, 2009).
After the removal of N2-related activities, the grand-averagewaveform obtained using the recommended Tc-Fz montage wasremarkably different (Fig. 1, bottom left panel; Fig. 5). The peakamplitude of the N1 wave was significantly increased (by ∼26%),while the subsequent N2 wave, which appears as a positive deflectionin this montage, virtually disappeared. In addition, removing N2-related activities significantly increased the average peak latency ofthe N1 wave (from 165±26 ms to 174±30 ms, p=0.014, two tailedpaired t test) (Fig. 4), thus showing how the N2-related activitiesexert a stronger interfering effect at latencies closer to the peak of theN2 wave. Importantly, removing N2-related activities did notsignificantly modify the N1 wave displayed using the Cc-Fz montage(see Fig. 1, bottom right panel), and both the latency and theamplitude of the N1 peak were almost identical before and after theremoval of N2-related activities (Fig. 4). This observation is due to thefact that in the Cc-Fz montage the N2-related activities are alreadylargely cancelled out. After the removal of N2-related activities, the
Fig. 8. Correlations between the average N1 latencies and amplitudes obtained from the mulfrom the averaged waveforms. Significant correlations were observed when examining bpb0.0001; right panel). Each point represents the values from one subject. Vertical errordashed lines represent the identity lines, and red solid lines represent the best linear fit. Not(p=0.135, two-tailed t test), while the N1 amplitude values were significantly greater in theincrease; pb0.001, two-tailed t test).
scalp distribution of LEPs around the peak latency of the N1 wavewere markedly more lateralized, displaying a negative maximumbetween Tc and Cc electrodes, slightly greater at Cc (bottom panel ofFig. 1). This scalp expression is compatible with the hypothesizedlocation of its cortical generators (Garcia-Larrea et al., 2003), i.e. theoperculo-insular region and, possibly, the primary somatosensorycortex contralateral to the stimulated side. Furthermore, this locationconfirms that to obtain a reliable estimate of the N1 wave, the Cc-Fzmontage is better suited than the Tc-Fz montage.
In previous studies, ICA has been applied successfully to separatelarge-amplitude components of the LEP response (Mouraux andIannetti, 2008, 2009), but its application to isolate small-amplitudecomponents like the N1 wave has never been described so far. In thepresent study, ICA was not able to isolate N1-related activitiesconsistently in all subjects, probably because of their low SNR. For thisreason we chose to enhance the SNR of the N1 wave indirectly, byremoving N2-related activities that interfere with the scalp expres-sion of the N1 neural components.
Time–frequency filtering to enhance the SNR of the N1 wave
Severalmethods have been proposed to enhance the SNR of single-trial ERP responses to sensory stimuli, both in the time domain (Doyle,1975; Nishida et al., 1993; Rossi et al., 2007) and in the time–frequency domain (Jongsma et al., 2006; Mouraux and Plaghki, 2004;Quian Quiroga and Garcia, 2003; Quian Quiroga, 2000; Wang et al.,2007). Nishida et al. (1993) used a method based on the combinationof three band-pass filters and Rossi et al. (2007) applied anautoregressive filter with exogenous input to enhance the SNR ofsingle-trial somatosensory ERP waveforms. Some studies (QuianQuiroga, 2000; Quian Quiroga and Garcia, 2003; Jongsma et al., 2006)adopted a discrete wavelet transform (DWT) to retain only waveletcoefficients correlating with the ERP signal, and thereby generate adenoised average ERP waveform. Using a method similar to the onedeveloped in Mouraux and Plaghki (2004), we applied a time–frequency filter based on the continuous wavelet transform to theICA-filtered EEG data (summarized in Fig. 2, top panel). The filter wasgenerated by thresholding the group average time–frequencyrepresentation of the LEP in order to achieve the highest SNR. Indeed,as the N1 wave is smaller than the N2 and P2 waves, the N1 wave alsohas smaller weight on the time–frequency plane. Thus, in somesubjects, the N1 wave may not be clearly represented in the time–
tiple linear regression method and the N1 latencies and amplitudes estimated manuallyoth N1 latencies (R=0.9980, pb0.0001; left panel) and N1 amplitudes (R=0.9947,bars represent, for each subject, the variance across trials (expressed as SEM). Blacke how the N1 latency values obtained from the two measurements are almost identicalsingle-trial estimates than in the standard averaged waveforms (with an average+20%

110 L. Hu et al. / NeuroImage 50 (2010) 99–111
frequency domain. For these reasons, we believe that generating thewavelet filter using the group average waveform would yield morerobust results. Compared to filtering in the time domain, filtering inthe time–frequency domain filters the signal both as a function of timeand frequency (i.e. frequency bands are weighted differently as afunction of time). Thus, this approach is optimal to explore the timevarying frequency spectra of event-related brain responses.
Accordingly, we show that such a wavelet filtering procedure(Fig. 2, top panel) can be successfully applied to enhance the SNR ofthe N1 wave of LEPs (Fig. 7). It is important to highlight that thisprocedure does not generate spurious N1 waves when applied to theresting EEG signal (Fig. 7). This lack of detection bias is due to the factthat, in each single EEG epoch, the wavelet filter maximizes the signalcorresponding to the time–frequency representation of the event-related response regardless of its phase (i.e. regardless of its positiveor negative polarity).
DWT-based denoising approaches have been widely used inbiomedical signal processing (Quian Quiroga, 2000; Quian Quirogaand Garcia, 2003; Jongsma et al., 2006). However, DWT only operatesat specific scales and transitions (generally, at dyadic scales andtransitions). In contrast, CWT (Mouraux and Iannetti, 2008; Tognolaet al., 1998) can be performed at every possible scale/frequency andtransition (generally, at uniform frequency grids and every possibletime points). Thus, CWT can analyze the ERP signal in a more refinedscale, at the expense of high computational complexity.
N1 peak in single-trial LEPs: automatic measurement
We have recently described a method using a multiple linearregression approach to obtain single-trial estimates of the latency andamplitude of event-related potentials, and showed that this methodeffectively estimates the peak latency and amplitude of the N2 and P2waves of LEPs (Mayhew et al., 2006).
Here, we show that after removing the N2-related neural activitiesfrom the single trial LEP waveforms using a spatio-temporal filterbased on ICA (Fig. 1), and after enhancing the SNR of the N1 waveusing a time–frequency filter based on the continuous wavelettransform (Fig. 6), a multiple linear regression approach similar tothe one we already developed (Mayhew et al., 2006) can be used toobtain a fast and unbiased estimate of the peak latency and amplitudeof the N1 wave at the level of single trials. This procedure issummarized in the bottom panel of Fig. 2. Briefly, for each subject, aregressor and its temporal derivative are obtained from the across-trial average waveform. This basis set is then regressed against eachsingle EEG epoch, thus providing a quantitative measure of peaklatency and amplitude of the N1 wave present in each single LEPepoch. Including the temporal derivative, a procedure commonly usedto analyze functional MRI data (Friston et al., 1998) presents theadvantage of modeling the temporal variability of the responses andprovides an estimate of single-trial peak latency of the N1 wave.Importantly, this method allows modeling the amplitude of eachsingle trial regardless of its phase (i.e. regardless of its positive ornegative polarity). Therefore, if a sufficient number of trials areconsidered, the contribution of non-event-related peaks in the signalwill cancel out and tend towards zero. For this reason, when weapplied the multiple linear regression to the resting EEG data, theaverage amplitude of the single-trial estimates of the N1 peak wasnegligible (0.05 μV; not significantly different from zero, p=0.76)(Fig. 7, right panel).
Across subjects, the average of single-trial estimates of N1 latencyand amplitude correlated remarkably well with the correspondingvalues measured using the waveforms averaged across trials (Fig. 8).While the average of estimated single-trial N1 latencies was almostidentical to those measured in the averaged waveforms, the averageof estimated single-trial N1 amplitudes was significantly larger in thesingle-trial estimate than in the average waveforms (Fig. 8). This
difference is likely to be due to the across-trial latency jitter, whichresults in averaging N1 waves with slightly different phases, thusdistorting its shape and reducing its amplitude in the averagewaveform. Importantly, the increase in peak amplitude obtained bymeasuring the response in single trials was much smaller for the N1wave (+20%) than for the N2 and P2 waves (approximately +65%and +30%, respectively) (Mayhew et al., 2006). This finding indicatesthat the latency jitter of the N1 wave is significantly smaller than thelatency jitter of the N2 and P2 waves of LEPs. Considering that the N1wave is more transient than the N2 and P2 waves (i.e. the N1 hashigher frequency content than the N2 and P2), across-trial averagingwould distort it more than N2 and P2 waves. Hence, if the latencyjitter affecting the N1, N2 and P2 waves was similar, the gain inamplitude resulting from measuring the N1 wave in single trialsshould be greater than the gain in amplitude resulting frommeasuring the N2 and P2 waves in single trials. Therefore, the factthat the opposite was observed indicates that the N1 wave is affectedby less latency jitter than the later N2 and P2 waves. Accordingly, theacross-trial variability (expressed as SD) of the peak latency of the N1wave (which is a direct measure of response jitter) is 17.8 ms, whilethat for the N2 and P2 waves are 63.5 and 87.2 ms, respectively(Mayhew et al., 2006). This is consistent with the notion that earlier-latency, more exogenous responses (like the N1wave, Lee et al., 2009)have a smaller latency jitter than longer latency, more endogenousresponses (like the N2 and P2 waves of the LEPs, Mouraux andIannetti, 2009).
Advantages of the proposed method
The problem of how to treat ERP waveforms in which expectedpeaks cannot be identified visually is important, and has yet to besatisfactorily addressed. This issue is especially relevant in studiesexamining an experimental modulation of ERPs leading to a strongresponse attenuation, or in conditions in which their SNR isparticularly low (e.g. in patient studies or in simultaneous recordingof EEG during fMRI, Iannetti et al., 2005a). Average waveformswithout an apparent ERP response are usually either discarded fromsubsequent analyses, or arbitrarily assigned a response magnitudecorresponding to zero. Discarding these average waveforms, besidesconstituting a loss of physiologically-relevant information, biasesthe results towards an underestimate of the effect of theexperimental modulation or of the deficit caused by the underlyingdisease. Conversely, arbitrarily assigning zero amplitude values tothese undetectable responses will inevitably introduce a bias in theopposite direction, i.e. it will overestimate the effect of theexperimental modulation or of the deficit caused by the underlyingdisease.
The automated method of estimating ERP latency and amplitudedescribed in the present study successfully addresses this problem,because it always assigns a latency and amplitude value to each singletrial or average waveform. Importantly, when the stimulus does notelicit any ERP response, the across-trial average of the single-trialestimates of amplitude will tend towards zero. Nevertheless, even inthe presence of a barely-detectable response, the across-trial averageof the single-trial estimates of amplitude will be different from zero,thus providing a reliable estimate of the amount of stimulus-evokedresponse in the recorded trials.
Another advantage of the method described in the present study isthat the obtained estimate is entirely independent of the subjectiveinterpretation of the researcher. Consequently, whereas the resultsfrom a manual analysis of N1 amplitude would vary if performed bydifferent researcher or by the same researcher in different days, theestimates obtained with an automated analysis are reproducible andcomparable across experiments and laboratories.
Finally, we show that our approach allows obtaining an accurateestimate of the latency and amplitude of the N1 wave of LEPs, both in

111L. Hu et al. / NeuroImage 50 (2010) 99–111
average waveforms and single trials. We believe that the automatedapproach to single-trial measurement of the N1 wave of LEPs opensnew possibilities to explore the nociceptive system both in basicand clinical research, considering that the use of N1 has beenrecommended to enhance the clinical sensitivity of LEPs (Cruccu etal., 2008), and that its physiological role has been recently partlyclarified (e.g. Iannetti et al., 2008; Lee et al., 2009; Legrain et al., 2002;Mouraux and Iannetti, 2009).
Acknowledgments
The authors are grateful to Dr ZG Zhang and members of theGAMFI Centre for their insightful comments. LH is supported by theLee Wing Tat Medical Research Fund. AM is supported by the BelgianNational Fund for Scientific Research (FNRS). GDI is UniversityResearch Fellow of The Royal Society, and acknowledges the supportof the BBSRC.
References
Baumgartner, U., Cruccu, G., Iannetti, G.D., Treede, R.D., 2005. Laser guns and hot plates.Pain 116, 1–3.
Bromm, B., Treede, R.D., 1984. Nerve fibre discharges, cerebral potentials and sensationsinduced by CO2 laser stimulation. Hum. Neurobiol. 3, 33–40.
Carmon, A., Mor, J., Goldberg, J., 1976. Evoked cerebral responses to noxious thermalstimuli in humans. Exp. Brain Res. 25, 103–107.
Carmon, A., Friedman, Y., Coger, R., Kenton, B., 1980. Single trial analysis of evokedpotentials to noxious thermal stimulation in man. Pain 8, 21–32.
Cruccu, G., Aminoff, M.J., Curio, G., Guerit, J.M., Kakigi, R., Mauguiere, F., Rossini, P.M.,Treede, R.D., Garcia-Larrea, L., 2008. Recommendations for the clinical use ofsomatosensory-evoked potentials. Clin. Neurophysiol. 119, 1705–1719.
Dawson, G.D., 1951. A summation technique for detecting small signals in a largeirregular background. J. Physiol. 115, 2p–3p.
Dawson, G.D., 1954. A summation technique for the detection of small evokedpotentials. Electroencephalogr. Clin. Neurophysiol. 6, 65–84.
Debener, S., Ullsperger, M., Siegel, M., Engel, A.K., 2006. Single-trial EEG-fMRI revealsthe dynamics of cognitive function. Trends Cogn. Sci. 10, 558–563.
Debener, S., Strobel, A., Sorger, B., Peters, J., Kranczioch, C., Engel, A.K., Goebel, R., 2007.Improved quality of auditory event-related potentials recorded simultaneouslywith 3-T fMRI: removal of the ballistocardiogram artefact. NeuroImage 34,587–597.
Delorme, A., Makeig, S., 2004. EEGLAB: an open source toolbox for analysis of single-trial EEG dynamics including independent component analysis. J. Neurosci.Methods 134, 9–21.
Doyle, D.J., 1975. Some comments on the use of Wiener filtering for the estimation ofevoked potentials. Electroencephalogr. Clin. Neurophysiol. 38, 533–534.
Ellrich, J., Jung, K., Ristic, D., Yekta, S.S., 2007. Laser-evoked cortical potentials in clusterheadache. Cephalalgia 27, 510–518.
Friston, K.J., Fletcher, P., Josephs, O., Holmes, A., Rugg, M.D., Turner, R., 1998. Event-related fMRI: characterizing differential responses. NeuroImage 7, 30–40.
Garcia-Larrea, L., Frot, M., Valeriani, M., 2003. Brain generators of laser-evokedpotentials: from dipoles to functional significance. Neurophysiol. Clin. 33, 279–292.
Haig, A.R., Gordon, E., Rogers, G., Anderson, J., 1995. Classification of single-trial ERPsub-types: application of globally optimal vector quantization using simulatedannealing. Electroencephalogr. Clin. Neurophysiol. 94, 288–297.
Iannetti, G.D., Truini, A., Romaniello, A., Galeotti, F., Rizzo, C., Manfredi, M., Cruccu, G.,2003. Evidence of a specific spinal pathway for the sense of warmth in humans.J. Neurophysiol. 89, 562–570.
Iannetti, G.D., Niazy, R.K., Wise, R.G., Jezzard, P., Brooks, J.C., Zambreanu, L., Vennart, W.,Matthews, P.M., Tracey, I., 2005a. Simultaneous recording of laser-evoked brainpotentials and continuous, high-field functional magnetic resonance imaging inhumans. NeuroImage 28, 708–719.
Iannetti, G.D., Zambreanu, L., Cruccu, G., Tracey, I., 2005b. Operculoinsular cortexencodes pain intensity at the earliest stages of cortical processing as indicated byamplitude of laser-evoked potentials in humans. Neuroscience 131, 199–208.
Iannetti, G.D., Zambreanu, L., Tracey, I., 2006. Similar nociceptive afferents mediatepsychophysical and electrophysiological responses to heat stimulation of glabrousand hairy skin in humans. J. Physiol. 577, 235–248.
Iannetti, G.D., Hughes, N.P., Lee, M.C., Mouraux, A., 2008. Determinants of laser-evokedEEG responses: pain perception or stimulus saliency? J. Neurophysiol. 100,815–828.
Jongsma, M.L.A., Eichele, T., Van Rijn, C.M., Coenen, A.M.L., Hugdahl, K., Nordby, H.,Quiroga, R.Q., 2006. Tracking pattern learning with single-trial event-relatedpotentials. Clin. Neurophysiol. 117, 1957–1973.
Jung, T.P., Makeig, S., Westerfield, M., Townsend, J., Courchesne, E., Sejnowski, T.J., 2001.Analysis and visualization of single-trial event-related potentials. Hum. BrainMapp. 14, 166–185.
Kunde, V., Treede, R.D., 1993. Topography of middle-latency somatosensory evokedpotentials following painful laser stimuli and non-painful electrical stimuli.Electroencephalogr. Clin. Neurophysiol. 88, 280–289.
Lawless, J.F., 2003. Statistical models and methods for lifetime data, 2nd ed. Wiley,Hoboken, N.J.
Lee, M.C., Mouraux, A., Iannetti, G.D., 2009. Characterizing the cortical activity throughwhich pain emerges from nociception. J. Neurosci. 29, 7909–7916.
Legrain, V., Guerit, J.M., Bruyer, R., Plaghki, L., 2002. Attentional modulation of thenociceptive processing into the human brain: selective spatial attention, probabil-ity of stimulus occurrence, and target detection effects on laser evoked potentials.Pain 99, 21–39.
Legrain, V., Perchet, C., Garcia-Larrea, L., 2009. Involuntary orienting of attention tonociceptive events: neural and behavioral signatures. J. Neurophysiol. 102,2423–2434.
Makeig, S., Jung, T.P., Bell, A.J., Ghahremani, D., Sejnowski, T.J., 1997. Blind separation ofauditory event-related brain responses into independent components. Proc. Natl.Acad. Sci. U. S. A. 94, 10979–10984.
Makeig, S., Debener, S., Onton, J., Delorme, A., 2004. Mining event-related braindynamics. Trends Cogn. Sci. 8, 204–210.
Mayhew, S.D., Iannetti, G.D., Woolrich, M.W., Wise, R.G., 2006. Automated single-trialmeasurement of amplitude and latency of laser-evoked potentials (LEPs) usingmultiple linear regression. Clin. Neurophysiol. 117, 1331–1344.
Mayhew, S.D., Dirckx, S.G., Niazy, R.K., Iannetti, G.D., Wise, R.G., 2010. EEG signatures ofauditory activity correlate with simultaneously recorded fMRI responses inhumans. NeuroImage 49, 849–864.
Mouraux, A., Iannetti, G.D., 2008. Across-trial averaging of event-related EEG responsesand beyond. Magn. Reson. Imaging 26, 1041–1054.
Mouraux, A., Iannetti, G.D., 2009. Nociceptive laser-evoked brain potentials do notreflect nociceptive-specific neural activity. J. Neurophysiol. 101, 3258–3269.
Mouraux, A., Plaghki, L., 2004. Single-trial detection of human brain responses evokedby laser activation of Adelta-nociceptors using the wavelet transform of EEGepochs. Neurosci. Lett. 361, 241–244.
Mouraux, A., Guerit, J.M., Plaghki, L., 2003. Non-phase locked electroencephalogram(EEG) responses to CO2 laser skin stimulations may reflect central interactionsbetween A partial differential- and C-fibre afferent volleys. Clin. Neurophysiol. 114,710–722.
Nishida, S., Nakamura, M., Shibasaki, H., 1993. Method for single-trial recording ofsomatosensory evoked potentials. J. Biomed. Eng. 15, 257–262.
Pfurtscheller, G., Lopes da Silva, F.H., 1999. Event-related EEG/MEG synchronizationand desynchronization: basic principles. Clin. Neurophysiol. 110, 1842–1857.
Quian Quiroga, R., Garcia, H., 2003. Single-trial event-related potentials with waveletdenoising. Clin. Neurophysiol. 114, 376–390.
Quian Quiroga, R., 2000. Obtaining single stimulus evoked potentials with waveletdenoising. Phys. D-Nonlinear Phenom. 145, 278–292.
Rossi, L., Bianchi, A.M., Merzagora, A., Gaggiani, A., Cerutti, S., Bracchi, F., 2007. Singletrial somatosensory evoked potential extraction with ARX filtering for a combinedspinal cord intraoperative neuromonitoring technique. Biomed. Eng. Online 6, 2.
Schmahl, C., Greffrath, W., Baumgartner, U., Schlereth, T., Magerl, W., Philipsen, A., Lieb,K., Bohus, M., Treede, R.D., 2004. Differential nociceptive deficits in patients withborderline personality disorder and self-injurious behavior: laser-evoked poten-tials, spatial discrimination of noxious stimuli, and pain ratings. Pain 110, 470–479.
Spencer, K.M., 2005. Averaging, detection, and classification of single-trial ERPs. In:Handy, T.C. (Ed.), Event-related potentials : a methods handbook. MIT Press,Cambridge, Mass., pp. 209–227.
Tang, A.C., Sutherland, M.T., McKinney, C.J., 2005. Validation of SOBI components fromhigh-density EEG. NeuroImage 25, 539–553.
Tarkka, I.M., Treede, R.D., 1993. Equivalent electrical source analysis of pain-relatedsomatosensory evoked potentials elicited by a CO2 laser. J. Clin. Neurophysiol. 10,513–519.
Tognola, G., Grandori, F., Ravazzani, P., 1998. Wavelet analysis of click-evokedotoacoustic emissions. IEEE Trans. Biomed. Eng. 45, 686–697.
Treede, R.D., Kief, S., Holzer, T., Bromm, B., 1988. Late somatosensory evoked cerebralpotentials in response to cutaneous heat stimuli. Electroencephalogr. Clin.Neurophysiol. 70, 429–441.
Treede, R.D., Lorenz, J., Baumgartner, U., 2003. Clinical usefulness of laser-evokedpotentials. Neurophysiol. Clin. 33, 303–314.
Treede, R.D., Meyer, R.A., Campbell, J.N., 1998. Myelinated mechanically insensitiveafferents from monkey hairy skin: heat-response properties. J. Neurophysiol. 80,1082–1093.
Wang, Z., Maier, A., Leopold, D.A., Logothetis, N.K., Liang, H., 2007. Single-trial evokedpotential estimation using wavelets. Comput. Biol. Med. 37, 463–473.