Auditory Event Related Potentials (ERPs) in audiovisual speech perception
31
Auditory Event Related Potentials (ERPs) in audiovisual speech perception Michael Pilling MRC Institute of Hearing Research, Science Road, Nottingham, NG7 2RB. United Kingdom Email: [email protected] Published in Journal of Speech, Language & Hearing Research, (2009), 52, 1073-1081. Abstract Purpose: It has recently been reported (e.g. Wassenhove et al., 2005) that audiovisual (AV) presented speech is associated with an N1/P2 auditory ERP response that is lower in peak amplitude compared to the responses associated with auditory only (AO) speech. This effect is replicated. Further comparisons are made between ERP responses to AV speech in which the visual and auditory components were in or out of synchrony, to test whether the effect is associated with the operation of integration mechanisms, as has been claimed, or occurs because of other factors such as attention.
-
Upload
oxfordbrookes -
Category
Documents
-
view
3 -
download
0
Transcript of Auditory Event Related Potentials (ERPs) in audiovisual speech perception

Auditory Event Related Potentials (ERPs) in audiovisualspeech perception
Michael Pilling
MRC Institute of Hearing Research, Science Road, Nottingham, NG7 2RB. United Kingdom
Email: [email protected]
Published in Journal of Speech, Language & Hearing Research, (2009), 52,
1073-1081.
Abstract
Purpose: It has recently been reported (e.g. Wassenhove et
al., 2005) that audiovisual (AV) presented speech is associated
with an N1/P2 auditory ERP response that is lower in peak
amplitude compared to the responses associated with auditory only
(AO) speech. This effect is replicated. Further comparisons are
made between ERP responses to AV speech in which the visual and
auditory components were in or out of synchrony, to test whether
the effect is associated with the operation of integration
mechanisms, as has been claimed, or occurs because of other
factors such as attention.

Method: ERPs were recorded from participants presented with
recordings of unimodal or AV speech syllables in a detection task.
Results: Comparisons were made between AO and AV speech, and
between synchronous and asynchronous AV speech. Synchronous AV
speech produced an N1/P2 with lower peak amplitudes than with AO
speech, unaccounted for by linear superposition of visually-evoked
responses onto auditory-evoked responses. Asynchronous AV speech
produced no amplitude reduction.
Conclusion: The dependence of N1/P2 amplitude reduction on AV
synchrony is consistent with the effect resulting from the
operation of integration mechanisms and validates it as an
electrophysiological marker of AV integration.
Keywords: speech, ERP, audiovisual integration
Apart from by ear, speech information can also be obtained by
the eye, from the visibly perceptible movements of the face that
accompany speech production. When such visual speech as well as
auditory speech information is present, the brain tends to integrate
the two sources into a single unified percept (see Summerfield,
1987). The unity of visual and auditory speech is revealed in a
number of behavioral markers of integration. Possibly the most

notorious of these is the McGurk illusion (McGurk & MacDonald,
1975). In the McGurk illusion, an auditory CV syllable (e.g. /ba/)
is presented concurrently with phonetically incongruous visual
speech (e.g. a face articulating /ga/); observers typically report
hearing a fusion of the two signals (e.g. /da/), illustrating the
unity of auditory and visual speech perception. Other markers of
the audiovisual integration of speech include the audiovisual (AV)
speech-detection advantage (Bernstein et al. 2004); auditory
speech-in-noise is easier to detect when presentation is AV than
when auditory only (AO). AV presented speech is also usually found
to be more intelligible than AO speech; such effects are
particularly apparent with the auditory speech presented in noise
(Erber, 1975), this advantage for AV speech intelligibility is
greater than would be expected on the basis of the information
from the auditory and visual modalities being processed
independently (see Grant & Walden, 1996).
What these above effects demonstrate is that our perception
of auditory speech operates from a representation that is an
integration of information derived from both the auditory and
visual modalities. However there is some debate about the
processing stage at which this integration process occurs (see

Schwartz et al., 1998). Some models, so-called early integration
models, place the integration of speech fairly early in the
processing stream before phonetic categorization has occurred
(e.g. Braida’s ‘pre-labeling model’; Braida, 1991). Other models
have placed AV integration at a relatively late stage, after the
information in each modality has been independently evaluated
(e.g. Massaro, 1987, 1998).
Some behavioral evidence has been found to support early-
integration models of AV speech perception. For instance, visual
speech has been shown to influence the perception of voicing in an
auditory speech stimulus (Green, 1998), consistent with visual
speech interacting with auditory speech prior to phonetic
categorization. Recently more direct evidence for early
interactions in AV speech has been suggested by studies looking at
auditory event-releted potentials (AERPs) Two studies (Besle et
al., 2004; Wassenhove et al., 2005) found that the N1/P2 complex
of the AERP associated with AV speech presentation was lower in
amplitude compared against the responses evoked by AO speech
presentation. Such a finding is important because it suggests that
visual speech information may be interacting with auditory speech
processing at an early (pre-categorical) processing stage. The

N1/P2 wave is associated with the processing of the physical
attributes of an auditory stimulus prior to its categorization
(Näätänen & Winkler, 1999). It occurs within a time window of 100-
200 ms after the onset of an auditory stimulus and is typically
maximal around the scalp vertex. It is assumed to have multiple
neural generators located in the dorsal surface and superior
temporal plane of both temporal lobes (Scherg & Von Cramon, 1986;
Näätänen & Picton, 1987).
Importantly Besle et al. (2004) and Wassenhove et al. (2005)
found that lower amplitudes associated with AV presentation were
not simply a result of the linear superposition of visual and
auditory activity: N1/P2 amplitudes associated with AV speech were
lower even when compared against the aggregate of the unimodal
responses for auditory and visual speech. This demonstrated that
it was the underlying AERP waveform itself that was being
modulated by the AV presentation of the speech. The effect of AV
speech presentation on AERP amplitudes is consistent with visual
speech producing a ‘deactivation’ (Wassenhove et al.) or
‘depression’ (Besle et al.) in the auditory cortex. The finding
draws some parallels with ERP studies of binaural auditory
integration. Similar amplitude reductions have been shown in the

N1/P2 (along with earlier latency components) response to sounds
presented binaurally compared against aggregate monaural ERP
responses (e.g. McPherson & Starr, 1993), suggesting that reduced
amplitudes may be a general aspect of integration processes in the
auditory modality.
AV speech thus seems to be reliably associated with N1/P2
amplitude reductions compared with AO speech. However further
validation is needed before the effect can be accepted as an
electrophysiological correlate of an AV integration process as
opposed to the result of some other factor.
An alternative explanation of the effect is that it reflects
general top-down inhibition of the auditory cortex occurring in
the AV condition but not in the AO condition because of the two
conditions’ differing task demands. Shulman et al (1997) found
that auditory cortex activity was significantly reduced (as
measured by Positron Emission Tomography) when participants where
actively engaged with a visual stimulus compared to when passively
viewing the same visual stimulus. It is possible that the presence
of the talking face in the AV condition induces such top-down
inhibition in the auditory cortex as a consequence of participants
actively processing the visual stimulus, It is further possible

that this top-down inhibition is absent with a static fixation
cross or static face because, in this case, active processing does
not occur. If such top-down inhibition was being induced it might
well result in reduced AERP amplitudes. However, the conditions
under which Shulman et al. found these modulations are quite
different to those in which AV speech is presented. In Shulman et
al.’s task the auditory modality was task-irrelevant: the only
auditory stimulation came from ambient background noise rather
than from a relevant auditory stimulus as in AV speech.
A more plausible alternative explanation of the amplitude
reduction effect in AV speech is that it is related to shifts in
attention across modalities between the AO and AV conditions. It
is possible that with AV stimulus presentation attention is
shifted further towards the visual modality and away from the
auditory modality, leading to lower responses in the auditory
cortex. Indeed, the N1/P2 response is known to be modulated by
attentional shifts: reduced attention to the auditory modality has
been shown to result in smaller amplitudes in this response
(Hanson & Hillyard, 1980). Wassenhove et al. (2005) rejected such
an explanation because with AV speech instructing participants to
attend just to the visual modality did not result in any

additional amplitude reduction in the auditory responses. However,
this may just mean that on top of the ‘automatic’ shifts to the
visual information in AV speech presentation, further attentional
shifts towards the visual modality have no further effect on
AERPs. It does not necessarily rule out attention being
responsible. Besle et al. (2004) also rejected an attentional
explanation of the amplitude reduction effect. They argued that in
their study the attentional demands were balanced across the AO
and AV conditions because in both conditions the task they gave (a
speeded auditory detection task) only required attention to the
auditory modality. However, this may still not fully balance
attention across the AO and AV conditions. Participants may still
have been actively attending to the onset of the facial movements
in the AV condition which provides a salient and task-relevant
alerting cue for the onset of the auditory speech signal. This
would mean that attention was still different to the AO condition
because in the AO condition no such visual cue was present.
Thus further evidence is needed to test if the amplitude
reduction in the N1/P2 is in fact associated with integration
mechanisms, rather than some other process. The experiments
presented here try to provide such evidence by observing the

effect of synchrony between the visual and auditory streams with
AV speech on the N1/P2 amplitude reduction effect. It has been
demonstrated that AV speech integration mechanisms operate only
within a a particular temporal window, outside of which the
effects of visual speech on auditory speech perception are largely
absent. This temporal window is usually found to be asymmetric: A
discrepancy of ~100 ms from the recorded position of auditory
speech is usually perceptible when auditory speech leads from its
recorded position with visual speech, while a discrepancy greater
than ~250 ms is needed when auditory speech lags from its recorded
position with visual speech (Dixon & Spitz, 1980). Outside this
temporal window the earlier described behavioral effects of
integration tend to be either absent or greatly weakened,
suggesting that the auditory and visual speech signals are no
longer producing a unified percept (e.g. McGurk effect: Munhall et
al., 1996; AV speech- in-noise advantage: Grant & Greenberg,
2003).
If the amplitude reduction effect is a consequence of
integration mechanisms then the effect should be significantly
weakened, or even abolished, for AV speech in which the auditory
component is outside the temporal window of perceived synchrony

with the visual signal. If, however, the amplitude reduction
effect is a consequence of a process other than integration (e.g.
attention) then manipulations of asynchrony should have little
consequences for the AERPs: N1/P2 amplitude reduction should
remain even with perceptibly asynchronous AV speech because any
attention diverted towards the visual component of speech should
be equal in the synchronous and asynchronous AV conditions. The
experiments reported in this paper test this possibility.
A task was given in which participants detected infrequent
phoneme syllables (targets) presented in a stream of standard
syllables. Experiment A compared recorded ERPs to these standard
syllables in unimodal auditory (AO), unimodal visual (VO) and
synchronous AV conditions (AV). Experiment B recorded ERP
responses to these syllables in synchronous AV (AV), asynchronous
AV (AVasynch) and AO conditions.
Method
Twelve participants were used in Experiments A and twelve
different participants in Experiment B, (age range 18 to 30). All
had normal hearing (assessed by pure-tone audiogram), normal or
corrected-to-normal visual acuity (assessed by Snellen chart).
Stimuli consisted of high quality audiovisual recordings of a male

talker articulating the CV syllables /pa/ and /ta/ from an initial
neutral expression. Four examples of each syllable were used for
the experiments. Recordings were normalized and calibrated to be
approximately 60 dB SPL. Video recordings were edited to start
from just before the initial visible articulation to the end of
the articulation and converted into a sequence of still bitmap
images (160 × 210 mm) presented on a 15” LCD screen. The screen
was viewed at a distance of approx. 400 mm. The first frame of
each recording was presented for 1000 ms as a still frame. After
1000 ms the first moving frame (the visible beginning of the
articulation) and subsequent moving frames were presented at a
rate of 25 frames-per-second. Corresponding digitized audio files
were presented binaurally via Sennheiser headphones. In the AV
condition the video frames of the talker were presented in
synchrony with the auditory stimulus as they were naturally
recorded. The duration between the onset of the first moving frame
and the onset of the auditory speech was different for the four
exemplars of /ta/ (range 210-296 ms) and /pa/ (range 239-401 ms)
due to natural variations in the articulation of the talker. In
the AVasynch condition the auditory stimulus was presented 200 ms
ahead of its recorded position. This asynchrony was noted by all

participants as being clearly perceptible. In this condition the
duration between the first moving frame of the video and the onset
of the auditory speech varied between a range of 10-96 ms for
/ta/, and 39-201 for /pa/ for the different exemplars of the
tokens. In the AO condition the moving frames of the talker were
replaced with a static fixation cross present for the same
duration. In the VO condition the moving frames of the talker were
presented silently. A 34 electrode EEG cap arranged using the
10/20 system was used with the ground at AFz and Cz used for
online referencing. EEG was recorded at an analogue-to-digital
conversion rate of 1000 Hz (subsequently downsampled to 500 Hz to
speed analysis). The target syllable (/pa/) was presented 40 times
randomly in a sequence of 180 standards (/ta/) per block. Figure 1
shows a schematic diagram of a single AV standard trial. A
3500~4000 ms inter-trial interval was given in which a blank
screen was presented. Participants were instructed to listen to
the speech while looking at the screen and to press a response key
each time a target was presented. In Experiment A blocks were
presented in the AO, VO and AV conditions. In Experiment B blocks
were presented in AO, AV and AVasynch conditions. Two blocks of
each condition were presented in a randomized order.

***Figure 1 about here***
Analysis and Results
Offline processing of EEGs was performed using Brain Vision
Analyzer (V 1.05). Recordings were manually screened for artifacts
and a Butterworth filter (1 - 30 Hz) applied. Data was then re-
referenced using all 34 channels and channel Cz reconstructed.
Ocular correction was applied using FP1 as the EOG channel using
the procedure developed by Gratton et al. (1983). Response
averaging was done only for the standards to avoid contamination
of the AERPs from oddball and response related activity. The onset
of the auditory stimulus marked the start of each epoch for
averaging purposes (for the VO condition the epoch was marked at a
point were the auditory stimulus would have onset had one been
presented). The N1/P2 was evoked in every condition except VO and
was largest around the central electrode cites (FC1, FC2, Cz, C3,
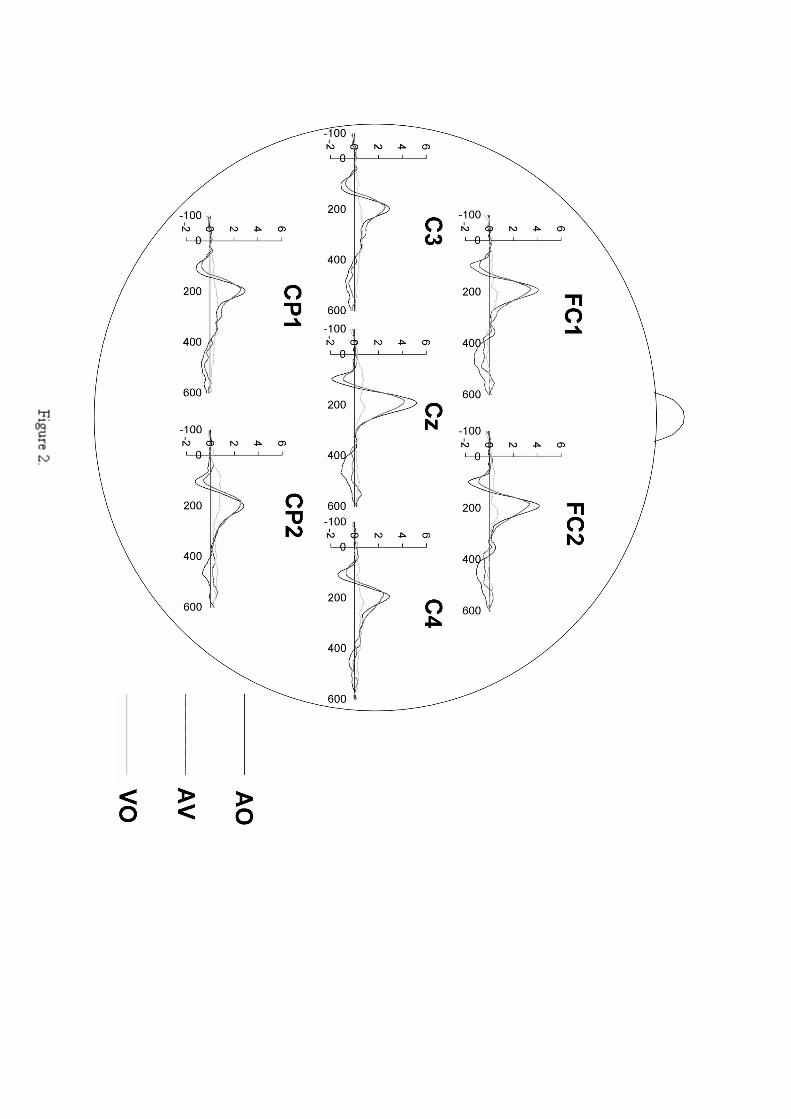
C4, CP1, CP2).1 Grand average responses on these electrode sites
are shown in Figure 2 for Experiment A and Figure 3 for Experiment
B.
1 No reliable P50 wave was observed in the grand average or in the individualwaveforms. P50 responses are typically small in amplitude and more variable than laterauditory components. Its absence in this study may be due to one of several factors,such as the large inter-trial intervals or due to attention being partly directedtowards the visual modality (even the AO condition participants were instructed tolook at the fixation cross present during each trial).

***Figures 2 and 3 about here***
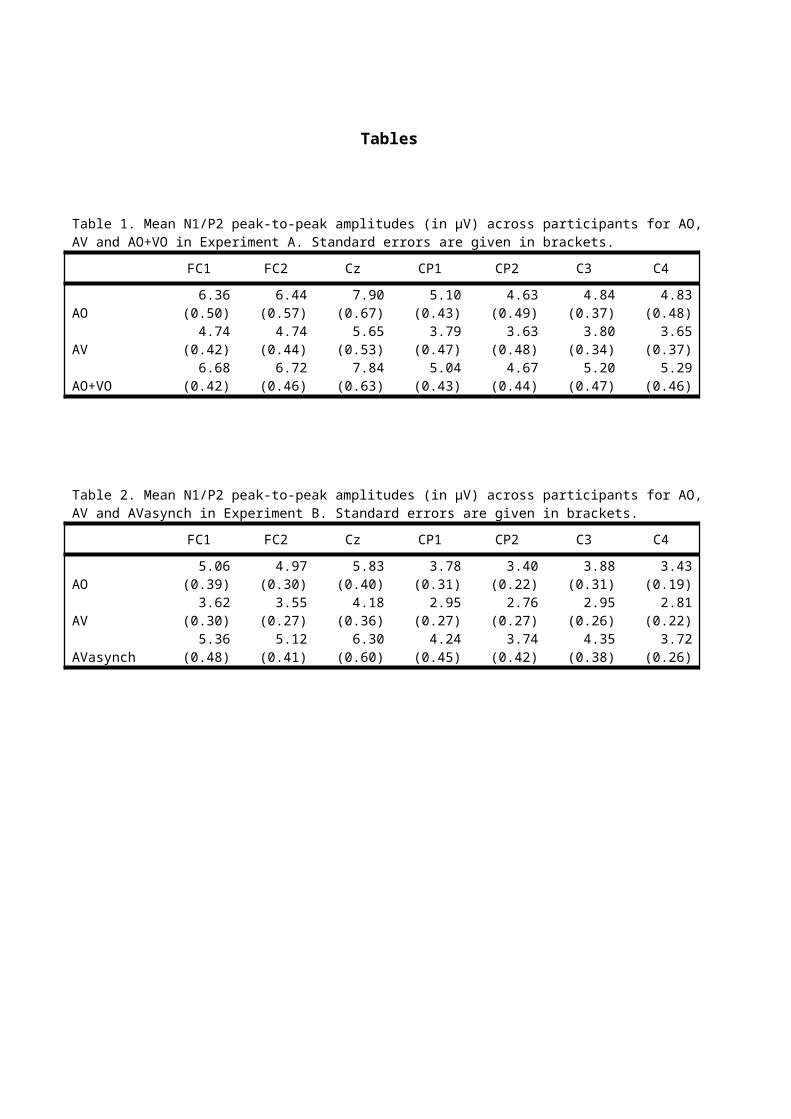
Peak-to-peak measures of the N1/P2 were computed for the 7
central electrodes for the averaged responses. The N1 peak was
specified as the largest negative local maximum between 60-140 ms
and the P2 peak as the largest positive local maximum between 130-
300 ms after onset. The peak-to-peak was also calculated on the
computed sum of the unimodal responses (AO+VO) to verify whether
differences between the AO and AV conditions were genuine
interactivity rather than linear superposition. Averaged peak-to-
peak measures for the different conditions are given in Table 1
for Experiment A and Table 2 for Experiment B.
***Tables 1 and 2 about here***
Measures on the central electrodes were subjected to two-way
ANOVAs with Condition (AO vs. AV; AO vs. AO+AV) and Electrode
(seven levels) as repeated measures factors. Comparison between AO
and AV showed that response amplitudes were significantly lower in
the AV condition, F(1, 11) = 49.49, MSE = 1.77, p < .0001. Peak
amplitudes were also significantly lower when AV speech was
compared with the sum of the unimodal responses (AO+VO), F(1, 11)
= 80.84, MSE = 1.39, p < .0001.2 This shows that the reduction in 2 There was also a small peak latency effect: Latencies of the N1 and P2 peaksoccurred earlier in the AV condition compared against the AO condition on some of thecentral electrodes, an effect also reported by Wassenhove et al. (2005). However thelatency effect found here was statistically small where it occurred and the effect not

N1/P2 peak amplitudes in the AV condition relative to the AO
condition was not explained by linear superposition. This same
amplitude reduction between the AV and AO conditions was
replicated in Experiment B (F(1, 11) = 49.05, MSE = 0.99, p
< .0001), demonstrating its reliability. In both Experiments the
difference between the AO and AV conditions was found to be
maximal at Cz. Critically, in the AVasynch condition amplitude
reduction was not found for any electrode. In fact peak amplitudes
were overall slightly larger than they were in the AO condition,
though the effect was not significant (F(1, 11) = 2.88, MSE =
1.84, p > .05).
Discussion
When AV speech was presented the resulting N1/P2 wave was
significantly smaller in its peak amplitude than when auditory
speech was presented (Experiment A). Furthermore the responses to
AV speech were also significantly lower in amplitude when compared
against the sum of unimodal responses, demonstrating that the
effect associated with AV speech was not just linear
superposition. This result corroborates the findings of Besle et
al. (2004) and Wassenhove et al. (2005) in demonstrating a reliably significant across Experiments A and B for the two peaks with AV speech. As aresult the paper confines the discussion to the more robust amplitude reduction effect

nonlinear effect on the amplitudes of AERPs. Furthermore, this
amplitude reduction effect was dependent on AV synchrony
(Experiment B). The responses to asynchronous AV speech exhibited
no such effect. Thus, like the behavioral markers of AV
integration, such as the McGurk illusion (Munhall et al. 1996),
the electrophysiological amplitude reduction effect is also
sensitive to synchrony between the auditory and visual modalities.
Therefore, these results are consistent with the notion that
the amplitude reduction effect is associated with the operation of
integration mechanisms. The results therefore provide further
support for early integration models of AV speech in showing that
at least some aspects of the integration of auditory and visual
information occur at an early, pre-categorical stage.
The results are inconsistent with a top-down inhibition
(Shulman et al., 1997) account of the amplitude reduction effect,
in which the effect occurs as a consequence of active processing
of the visual stimulus. The moving face was present in both the
synchronous and asynchronous AV conditions so if active processing
of the visual stimulus is the relevant factor then this should
have occurred in both the synchronous and asynchronous AV
conditions. However, the amplitude reduction effect occurred only

in the synchronous condition. The results are also inconsistent
with an attentional account in which attention is partly diverted
away from the auditory modality by the onset of the moving face in
AV conditions. Although the auditory speech was shifted from its
natural recorded position, this shifted position was always later
than the first moving frame of the visual stimulus, meaning that
the visual stimulus still provided an effective alerting cue to
the onset of the auditory speech even in the asynchronous AV
condition. Nevertheless, no amplitude reduction was observed in
this condition relative to the AO condition.
What do these results tell us about the neural mechanisms of
integration? Besle et al. (2004), on the basis of source analysis,
suggested that the modulation of AERPs occurs at least partly in
the supratemporal auditory cortex. They further suggested that the
superior temporal sulcus (STS), a multisensory region receiving
feedforward input from both the auditory and visual corteces, and
a site that several imaging studies have implicated as a likely
site of AV speech integration (e.g. Sekiyama et al., 2003), could
be the source of the inhibitory effects in the auditory cortex via
inhibitory reentrant pathways. The results presented in this
paper, together with findings from a study by Macaluso et al.

(2004) are consistent with this interpretation. Macaluso et al.
found that the STS exhibits a greater haemodynamic response to
synchronous than perceptibly asynchronous AV speech. It is
possible that this greater activity in the STS with synchronous AV
speech is reflected in greater inhibition of the auditory cortical
regions, resulting in a smaller N1/P2; with asynchronous AV speech
the lower STS activity may mean that this structure no longer
inhibits the auditory cortex. More direct support for this
physiological model of the integration effect could be made if
recordings from haemodynamic and ERP imaging techniques were
combined in the same experiment, allowing direct comparison
between activity in the STS region and N1/P2 modulation, and finer
temporal synchrony-asynchrony manipulations of AV speech were
made. If STS activity and ERP amplitudes were found to have
similar tolerances of asynchrony it would provide further support
of the involvement of this structure in producing the inhibitory
effect in the auditory cortex.
Although this study demonstrates the importance of the
temporal synchrony of the visual stimulus with auditory speech, it
does not tell us what the critical features of the visual stimulus
are. Two possible candidates are the pictorial content of the

facial features and the dynamic characteristics of the visual
signal (Vitkovitch & Barber, 1994; 1996; Rosenblum, & Saldaña,
1996). If the dynamic characteristics of the face are the more
important factor, video frame rate will be a more important factor
in the modulation of AERPs than the pictorial information within
the frames. Further research is needed to determine the critical
aspects of the visual stimulus in AV speech presentation that lead
to modulation of AERPs.
A related and unresolved question concerns the aspects of AV
integration processes that are being reflected in the modulations
of the AERPs? Wassenhove et al. (2005) argued that the amplitude
reduction reflects an aspect of processing relating to the merging
of syllabic information between the visual and auditory speech
signals in the auditory cortex by a depression mechanism. They
argued that when AV speech is presented information about place-
of-articulation can be obtained from the visual signal, making
redundant the processing of certain speech formant frequencies in
the auditory signal. Similarly, Besle et al. (2004) proposed that
the amplitude reduction reflects the facilitation of syllable
feature analysis in the auditory cortex in the form of suppressive
modulation. However, another possibility is that the modulations

are reflecting the more basic structural spatiotemporal
correspondence of the auditory and visual events (see Spence,
2007). Indeed consistent with this, Stekelenburg & Vroomen (2007)
have recently shown that similar amplitude reductions in AERPs can
be found in the perception of ecologically-valid non-speech AV
events such as hand-claps.
In conclusion the sensitivity of the reduction in N1/P2
amplitude associated with AV speech is a genuine
electrophysiological marker of AV integration mechanisms. Further
work will determine the precise aspects of the visual stimulus
that are needed for N1/P2 amplitude reduction to occur.
References
Bernstein, L. E., Takayanagi, S., & Auer, E. T., Jr. (2004).
Auditory speech detection in noise enhanced by lipreading.
Speech Communication, 44, 5-18.
Besle, J., Fort, A., Delpuech, C., & Giard, M. H. (2004). Bimodal
speech: early suppressive visual effects in the human
auditory cortex. European Journal of Neuroscience, 20, 2225–
2234.

Braida, L. D. (1991). Crossmodal integration in the identification
of consonant segments. Quarterly Journal of Experimental
Psychology:. A, 43 , 647–677.
Dixon, N. F., & Spitz, L. (1980). The detection of auditory visual
desynchrony. Perception, 9, 719-721.
Erber, N. P. (1975). Auditory-visual perception of speech. Journal
of Speech and Hearing Disorders, 40, 481-492.
Giarda, M. H., & Peronnet, F. (1999). Auditory-visual integration
during multimodal object recognition in humans: A behavioral
and electrophysiological Study. Journal of Cognitive
Neuroscience, 11, 473-490.
Grant, K. W., & Walden, P. F. (1996). Evaluating the articulation
index for auditory-visual consonant recognition. Journal of
the Acoustical Society of America, 100, 2415-2424.
Grant, K. W., and Greenberg, S. (2001). Speech intelligibility
derived from asynchronous processing of auditory-visual
information. AVSP-2001 Proceedings, Scheelsminde, Denmark.
Gratton, G., Coles, M. G. H., & Donchin, E. (1983). A new method
for off-line removal of ocular artifacts.
Electroencephalography and Clinical Neurophysiology, 55, 468-
484.
Green, K. P. (1998). The use of auditory and visual information
during phonetic processing: inplications for theories of
speech perception. In R. Campbell, B. Dodd, & D. Burnham,
(Eds.), Hearing by Eye II: Advances in the psychology of
speechreading and auditory-visual speech. (pp. 85-108).
Hove, England. Psychology Press.
Hansen, J., & Hillyard, S. J. (1980) Endogenous brain potentials
associated with selective auditory attention,
Electroencephalography and Clinical Neurophysiology, 49, 277–
290.
Macaluso, E., Dolan, R. C., Spence, D., & Driver J. (2004).
Spatial and temporal factors during processing of audiovisual
speech: a PET study. Neuroimage, 21, 725-732.
Massaro, D. M. (1987). Speech perception by ear and eye: A
paradigm for psychological inquiry. Hillside, NJ. Lawrence
Erlbaum Associates.
Massaro, D. M. (1998). Perceiving talking faces: From speech
perception to behavioral principle. Cambridge, MA. MIT Press.
McGurk, H., & MacDonald, J. (1976). Hearing lips and seeing
voices. Nature, 264, 746-48.

McPherson, D. L., & Starr, A. (1989). Binaural interaction in auditory
evoked potentials: brainstem, middle- and long-latency
components. Hearing Research, 66, 91-98.
Munhall, K.G., Gribble, P., Sacco, L., & Ward, M. (1996). Temporal
constraints on the McGurk effect. Perception and
Psychophysics, 58, 351-362.
Näätänen R., & Winkler, I. (1999). The concept of auditory
stimulus representation in cognitive neuroscience.
Psychological Bulletin, 6, 826–859.
Näätänen, R., & Picton, T. (1987). The N1 wave of the human
electric and magnetic response to sound: a review and an
analysis of the component structure. Psychophysiology, 24,
375-426.
Rosenblum, L. D., & Saldaña, H. M. (1996). An audiovisual test of
kinematic primitives for visual speech perception. Journal of
Experimental Psychology: Human Perception and Performance.
22, 318-331.
Scherg, M., & Von Cramon, D. (1986) Evoked dipole source
potentials of the human auditory cortex.
Electroencephalography and Clinical Neurology, 65, 344–360.

Schwartz, J.L., Robert-Ribes, J., and Escudier, P. (1998). Ten
years after Summerfield: a taxonomy of models for audio-
visual fusion in speech perception. In R. Campbell, B. Dodd,
& D. Burnham, (Eds.), Hearing by Eye II: Advances in the
psychology of speechreading and auditory-visual speech. (pp.
85-108). Hove, England. Psychology Press.
Sekiyama, K., Kannoc, I., Miurac, S., & Sugit, Y. (2003).
Auditory-visual speech perception examined by fMRI and PET.
Neuroscience Research, 47, 277-287.
Shulman, G. L., Corbetta, M., Buckner, R. L., Raichle, M. E.,
Fiezi, J. A., Miezini, F. M., & Petersen, S. E. (1997). Top-
down modulation of early sensory cortex. Cerebral Cortex. 7,
193-206.
Spence, C. (2007). Audiovisual multisensory integration. Acoustic
Science and Technology, 28, 61-70.
Stekelenburg, J. J., & Vroomen, J. (2007). Neural correlates of
multisensory integration of ecologically valid audiovisual
events. Journal of Cognitive Neuroscience, 19, 1964-1973.
Summerfield, Q. (1987). Some preliminaries to a comprehensive
account of audio-visual speech perception. In B. Dodd, & R.
Campbell (Eds.), Hearing by Eye: The Psychology of

Lipreading. (pp. 3-51). London, England. Lawrence Erlbaum
Associates.
van Wassenhove, V., Grant, K. W., & Poeppel, D. (2005) Visual
speech speeds up the neural processing of auditory speech.
Proceedings of the National Academy of Science, 102, 1181-
1186.
Vitkovitch, M., & Barber, P. J. (1994). Effect of video frame rate
on subjects' ability to shadow one of two competing verbal
passages. ,Journal of Speech, Language and Hearing Research,
37, 1204-1210.
Vitkovitch, M., & Barber, P. J. (1996). Visible speech as a
function of image quality: Effects of display parameters on
lip reading ability. Applied Cognitive Psychology, 39, 121-
140.
Tables
Table 1. Mean N1/P2 peak-to-peak amplitudes (in μV) across participants for AO,AV and AO+VO in Experiment A. Standard errors are given in brackets.
FC1 FC2 Cz CP1 CP2 C3 C4
AO6.36
(0.50)6.44
(0.57)7.90
(0.67)5.10
(0.43)4.63
(0.49)4.84
(0.37)4.83
(0.48)
AV4.74
(0.42)4.74
(0.44)5.65
(0.53)3.79
(0.47)3.63
(0.48)3.80
(0.34)3.65
(0.37)
AO+VO6.68
(0.42)6.72
(0.46)7.84
(0.63)5.04
(0.43)4.67
(0.44)5.20
(0.47)5.29
(0.46)
Table 2. Mean N1/P2 peak-to-peak amplitudes (in μV) across participants for AO,AV and AVasynch in Experiment B. Standard errors are given in brackets.
FC1 FC2 Cz CP1 CP2 C3 C4
AO5.06
(0.39)4.97
(0.30)5.83
(0.40)3.78
(0.31)3.40
(0.22)3.88
(0.31)3.43
(0.19)
AV3.62
(0.30)3.55
(0.27)4.18
(0.36)2.95
(0.27)2.76
(0.27)2.95
(0.26)2.81
(0.22)
AVasynch5.36
(0.48)5.12
(0.41)6.30
(0.60)4.24
(0.45)3.74
(0.42)4.35
(0.38)3.72
(0.26)

Figure headings
Figure 1. Schematic diagram of a standard AV trial. The first
moving frame occurs after a 1000 ms still frame of the
talkers face in a neutral position. An example frame of the
talkers face at the apex of the articulation is shown. Note
that the ERP trigger is set to the onset of the auditory
speech stimulus which, for the standards, occurs between a
range of 210 and 296 ms after the first moving frame
depending on the particular exemplar of the recorded speech
being presented (on AVasynch trials the onset of the auditory
speech occurred between a range of 10 and 96 ms after the
first moving frame). In AO trials the video frames are
replaced by a static fixation cross.
Figure 2. Grand average ERP responses in Experiment A for the
seven central electrodes (FC1, FC2, Cz, C3, C4, CP1, CP2) in
AO (black line), AV (darker grey line) and VO (lighter grey
line) speech conditions. Response amplitudes are corrected by
a -100 ms pre-stimulus baseline. Negative deflections are
downwards on the ordinate. The N1/P2 wave (present in the AO

and AV conditions has a negative peak at ~100 ms and a
positive peak at ~200 ms. Note that the peak amplitude of the
N1/P2 wave associated with the AV condition is lower to that
associated with the AO condition. This effect is most
apparent at Cz.
Figure 3. Grand average ERP responses in Experiment B for the
seven central electrodes in AO (black line), AV (darker grey
line) and AVasynch (lighter grey line) conditions, corrected
by a -100 ms pre-stimulus baseline. Notice that, as in Figure
2, the AV condition is associated with lower peak amplitude
responses than the AO condition (particularly at Cz) in the
N1/P2. Note that this is not the case for the AVasynch
condition, where the associated peak amplitudes are slightly
higher than with the AO condition.