
A network analysis of audiovisual affective speech perception
12
A NETWORK ANALYSIS OF AUDIOVISUAL AFFECTIVE SPEECH PERCEPTION H. JANSMA, a,b A. ROEBROECK b AND T. F. MU ¨ NTE a * a Department of Neurology, University of Lu ¨beck, Lu ¨ beck, Germany b Department of Cognitive Neuroscience, Faculty of Psychology and Neuroscience, Maastricht University, Maastricht, The Netherlands Abstract—In this study we were interested in the neural sys- tem supporting the audiovisual (AV) integration of emo- tional expression and emotional prosody. To this end normal participants were exposed to short videos of a com- puter-animated face voicing emotionally positive or nega- tive words with the appropriate prosody. Facial expression of the face was either neutral or emotionally appropriate. To reveal the neural network involved in affective AV inte- gration, standard univariate analysis of functional magnetic resonance (fMRI) data was followed by a random-effects Granger causality mapping (RFX-GCM). The regions that distinguished emotional from neutral facial expressions in the univariate analysis were taken as seed regions. In trials showing emotional expressions compared to neutral trials univariate analysis showed activation primarily in bilateral amygdala, fusiform gyrus, middle temporal gyrus/superior temporal sulcus and inferior occipital gyrus. When employ- ing either the left amygdala or the right amygdala as a seed region in RFX-GCM we found connectivity with the right hemispheric fusiform gyrus, with the indication that the fusi- form gyrus sends information to the Amygdala. These results led to a working model for face perception in general and for AV-affective integration in particular which is an elaborated adaptation of existing models. Ó 2013 IBRO. Published by Elsevier Ltd. All rights reserved. Key words: audiovisual speech, emotion, facial affect per- ception, amygdala, Granger causality. INTRODUCTION Audiovisual (AV) integration in the perception of speech is the rule rather than the exception. For example, the presence of congruent visual (V) information leads to a considerable improvement of intelligibility under noisy conditions (Sumby and Pollack, 1954; Schwartz et al., 2004; Ross et al., 2007) which can be in the range of 10 dB. On the other hand, incongruent V information may induce the striking McGurk illusion (McGurk and MacDonald, 1976) during which syllables are perceived that are neither heard nor seen (e.g., percept/da/, auditory information: /ba/, visual information/ga/). This illusion suggests that AV integration during speech perception is a rather automatic process. A number of recent studies have addressed the neural underpinnings of AV integration in speech perception and consistently found two different brain areas, the inferior frontal gyrus (IFG) and the superior temporal sulcus (STS) (Calvert et al., 2000; Calvert and Campbell, 2003; Sekiyama et al., 2003; Wright et al., 2003; Barraclough et al., 2005; Szycik et al., 2008, 2009, 2012). Interactions of the STS and IFG are captured by the AV-motor integration model of speech perception (Skipper et al., 2007). This model posits the formation of a sensory hypothesis in STS which is further specified in terms of the motor goal of the articulatory movements established in the pars opercularis of the IFG. While the advantage of AV information over unimodal A or V information for the perception of speech is clearly established, the question arises whether bimodal AV information is also advantageous for other types of information. Indeed, it has been shown that the identity of a speaker might be recognized from both visual and auditory information but that there is a strong interaction between these kinds of information (von Kriegstein et al., 2005; Blank et al., 2011). The topic of the present study is AV integration of affective information transmitted by the voice or face of a speaker. (Scherer, 2003) compared the recognition accuracy for vocal and facial emotions as they had been obtained in a number of studies either using unimodal vocal expression (previously reviewed by Scherer et al. (2001)) or unimodal facial expression (previously reviewed by Ekman (1994)). If one limits the analysis to studies of Western faces and voices, recognition accuracy for the emotions anger, fear, joy, sadness, disgust, and surprise ranged between 31% (disgust) and 77% (anger) for vocal emotions and between 77% (fear) and 95% (joy) for facial expressions. Thus, for both modalities recognition for most emotions is far from perfect. The question therefore arises whether the combination of both types of information will increase recognition accuracy. Indeed, a number of studies have revealed clear behavioral face–voice integration effects for affective stimuli: for example, de Gelder and 0306-4522/13 $36.00 Ó 2013 IBRO. Published by Elsevier Ltd. All rights reserved. http://dx.doi.org/10.1016/j.neuroscience.2013.10.047 * Correspondence to: T. F. Mu¨nte, Department of Neurology, Univer- sity of Lu¨beck, Ratzeburger Allee 160, 23538 Lu¨beck, Gremany. Tel: +49-45150052925; fax: +49-4515005457. E-mail address: [email protected] (T. F. Mu¨ nte). Abbreviations: AV, audiovisual; BOLD, blood oxygen level dependent; EMO, emotional; fMRI, functional magnetic resonance; FOV, field of view; IFG, inferior frontal gyrus; MTG, middle temporal gyrus; NEU, neutral; RFX-GCM, random effects Granger causality mapping; STS, superior temporal sulcus; V, visual; VOI, volume of interest. Neuroscience 256 (2014) 230–241 230
Transcript of A network analysis of audiovisual affective speech perception

Neuroscience 256 (2014) 230–241
A NETWORK ANALYSIS OF AUDIOVISUAL AFFECTIVESPEECH PERCEPTION
H. JANSMA, a,b A. ROEBROECK b AND T. F. MUNTE a*
aDepartment of Neurology, University of Lubeck, Lubeck, Germany
bDepartment of Cognitive Neuroscience, Faculty of Psychology
and Neuroscience, Maastricht University, Maastricht,
The Netherlands
Abstract—In this study we were interested in the neural sys-
tem supporting the audiovisual (AV) integration of emo-
tional expression and emotional prosody. To this end
normal participants were exposed to short videos of a com-
puter-animated face voicing emotionally positive or nega-
tive words with the appropriate prosody. Facial expression
of the face was either neutral or emotionally appropriate.
To reveal the neural network involved in affective AV inte-
gration, standard univariate analysis of functional magnetic
resonance (fMRI) data was followed by a random-effects
Granger causality mapping (RFX-GCM). The regions that
distinguished emotional from neutral facial expressions in
the univariate analysis were taken as seed regions. In trials
showing emotional expressions compared to neutral trials
univariate analysis showed activation primarily in bilateral
amygdala, fusiform gyrus, middle temporal gyrus/superior
temporal sulcus and inferior occipital gyrus. When employ-
ing either the left amygdala or the right amygdala as a seed
region in RFX-GCM we found connectivity with the right
hemispheric fusiform gyrus, with the indication that the fusi-
form gyrus sends information to the Amygdala. These
results led to a working model for face perception in general
and for AV-affective integration in particular which is an
elaborated adaptation of existing models.
� 2013 IBRO. Published by Elsevier Ltd. All rights reserved.
Key words: audiovisual speech, emotion, facial affect per-
ception, amygdala, Granger causality.
INTRODUCTION
Audiovisual (AV) integration in the perception of speech is
the rule rather than the exception. For example, the
presence of congruent visual (V) information leads to a
considerable improvement of intelligibility under noisy
conditions (Sumby and Pollack, 1954; Schwartz et al.,
0306-4522/13 $36.00 � 2013 IBRO. Published by Elsevier Ltd. All rights reservehttp://dx.doi.org/10.1016/j.neuroscience.2013.10.047
*Correspondence to: T. F. Munte, Department of Neurology, Univer-sity of Lubeck, Ratzeburger Allee 160, 23538 Lubeck, Gremany. Tel:+49-45150052925; fax: +49-4515005457.
E-mail address: [email protected] (T. F. Munte).Abbreviations: AV, audiovisual; BOLD, blood oxygen level dependent;EMO, emotional; fMRI, functional magnetic resonance; FOV, field ofview; IFG, inferior frontal gyrus; MTG, middle temporal gyrus; NEU,neutral; RFX-GCM, random effects Granger causality mapping; STS,superior temporal sulcus; V, visual; VOI, volume of interest.
230
2004; Ross et al., 2007) which can be in the range of
10 dB. On the other hand, incongruent V information
may induce the striking McGurk illusion (McGurk and
MacDonald, 1976) during which syllables are perceived
that are neither heard nor seen (e.g., percept/da/,
auditory information: /ba/, visual information/ga/). This
illusion suggests that AV integration during speech
perception is a rather automatic process.
A number of recent studies have addressed the
neural underpinnings of AV integration in speech
perception and consistently found two different brain
areas, the inferior frontal gyrus (IFG) and the superior
temporal sulcus (STS) (Calvert et al., 2000; Calvert
and Campbell, 2003; Sekiyama et al., 2003; Wright
et al., 2003; Barraclough et al., 2005; Szycik et al.,
2008, 2009, 2012). Interactions of the STS and IFG
are captured by the AV-motor integration model of
speech perception (Skipper et al., 2007). This model
posits the formation of a sensory hypothesis in STS
which is further specified in terms of the motor goal of
the articulatory movements established in the pars
opercularis of the IFG. While the advantage of AV
information over unimodal A or V information for
the perception of speech is clearly established, the
question arises whether bimodal AV information is also
advantageous for other types of information. Indeed, it
has been shown that the identity of a speaker might
be recognized from both visual and auditory
information but that there is a strong interaction
between these kinds of information (von Kriegstein
et al., 2005; Blank et al., 2011).
The topic of the present study is AV integration of
affective information transmitted by the voice or face of
a speaker. (Scherer, 2003) compared the recognition
accuracy for vocal and facial emotions as they had been
obtained in a number of studies either using unimodal
vocal expression (previously reviewed by Scherer et al.
(2001)) or unimodal facial expression (previously
reviewed by Ekman (1994)). If one limits the analysis to
studies of Western faces and voices, recognition
accuracy for the emotions anger, fear, joy, sadness,
disgust, and surprise ranged between 31% (disgust) and
77% (anger) for vocal emotions and between 77% (fear)
and 95% (joy) for facial expressions. Thus, for both
modalities recognition for most emotions is far from
perfect. The question therefore arises whether the
combination of both types of information will increase
recognition accuracy. Indeed, a number of studies have
revealed clear behavioral face–voice integration effects
for affective stimuli: for example, de Gelder and
d.

H. Jansma et al. / Neuroscience 256 (2014) 230–241 231
Vroomen (2000) obtained affective ratings of facial stimuli
that were morphed to represent a continuum between two
facial expressions. These ratings were clearly influenced
by the concurrent presentation of an affective
vocalization, even under instructions to ignore the voice.
A comparable effect was also obtained for ratings of
affect for the vocalizations. Further research revealed
that crossmodal interaction occurs even, if facial
expressions are presented subliminally (de Gelder et al.,
2002). In a similar vein, Collignon et al. (2008) found
that the irrelevant information affected processing, even
if participants were asked to ignore one sensory
modality, thus further suggesting mandatory integration
of visual and auditory emotional information. Further
evidence for early interaction comes from
electrophysiological studies. Incongruent pairings of an
affective vocalization and a facial emotion have been
found to evoke a negativity akin to the mismatch
negativity around 180 ms (de Gelder et al., 1999),
whereas in another study affectively congruent voice/
face pairings gave rise to an enhanced amplitude of the
auditory N1 response (Pourtois et al., 2000).
Neuroimaging has been used to shed light on the
functional neuroanatomy of the processing of affective
facial and vocal information. Facial expressions, even
when presented subliminally, have been shown to
activate the amygdala with the greatest responses
observed for expressions of fear (Breiter et al.,
1996;Morris et al., 1996; Gelder et al., 1997; Whalen
et al., 2001; Williams, 2002; Noesselt et al., 2005;
Vuilleumier and Pourtois, 2007). Interestingly, robust
activations for the amygdala have been observed when
emotional processing is implicit, whereas explicit
emotion recognition often leads to a deactivation of the
amygdala (Critchley et al., 2000). Other regions that
have been found with regard to the processing of facial
expressions include the orbitofrontal cortex which is
activated by fearful (Vuilleumier et al., 2001), angry but
not sad expressions (Blair et al., 1999). The latter
dissociation of the processing of angry and sad
expressions has also been found for the anterior
cingulate cortex (Blair et al., 1999). Adolphs (2002a,b)
has summarized the imaging and lesion findings and
has suggested a neuroanatomical model of affect
recognition from facial expressions.
With regard to the processing of voice, the seminal
study of Belin et al. (2002) suggested a prominent role
of the STS. Even earlier, the amygdala has been
implicated by a number of studies for the processing of
affective vocalizations (Phillips et al., 1998; Morris et al.,
1999). Buchanan et al. (2000) compared the detection
of emotional and semantic properties of stimuli with the
former giving rise to activity in the right inferior frontal
lobe. Adolphs et al. (2002) found that the right
frontoparietal cortex, left frontal operculum and bilateral
frontal polar cortex (area 10) are critical to recognizing
emotion from prosody. Investigating vocal attractiveness
as a paralinguistic cue during social interactions,
Bestelmeyer et al. (2012) similarly found that inferior
frontal regions in addition to voice-sensitive auditory
areas were strongly correlated with implicitly perceived
vocal attractiveness. In an effort to distinguish the neural
representation of different kinds of emotion, Ethofer
et al. (2009) presented pseudowords spoken with
different affective connotation (anger, sadness, neutral,
relief, and joy) and subjected their functional magnetic
resonance (fMRI) activations to multivariate pattern
analysis. These authors successfully decoded the
different vocal emotions from fMRI in bilateral voice-
sensitive areas.
With regard to crossmodal integration of emotional
information, a first fMRI study required participants to
categorize static facial expression as fearful or happy
while simultaneously presented emotional vocalizations
were to be ignored (Dolan et al., 2001). Activation of the
left amygdala was stronger when both, facial expression
and voice signaled fear, thus suggesting a role of the
amygdala in the crossmodal integration of fear. Building
on this early study, Ethofer et al. (2006a,b) found that
the crossmodal bias observed in affective ratings of fear
correlated with activity in the amygdalae. Applying the
criterion of supra-additivity (i.e., the response to face–
voice pairings in combination is greater than the sum of
the activations to each of the modalities presented
separately), Pourtois et al. (2005) delineated the middle
temporal gyrus (MTG) as a core region for the
crossmodal integration of a variety of emotions. While
these earlier studies used static facial expressions,
Kreifelts et al. (2007) employed dynamic video-clips and
tested a number of different emotional expressions. The
bilateral posterior STS region, which has also been
highlighted for AV integration in general, was found to
be important for affective integration in this study. In a
further study (Kreifelts et al., 2009) these authors found
evidence for a segregation of the STS region into a
voice-sensitive region in the trunk section, a region with
maximum face sensitivity in the posterior terminal
ascending branch, and an AV integration area for
emotional signals at the bifurcation of the STS. Similar
to the present study, Klasen et al. (2011) used
computer-generated emotional faces and voices to
assess the neural effects of emotional congruency
during an explicit emotional classification task.
Congruent AV stimuli led to activation in amygdala,
insula, ventral posterior cingulate, temporo-occipital, and
auditory cortex, whereas incongruent stimuli gave rise to
activations in frontoparietal regions as well as the
caudate nucleus bilaterally.
In the present investigation we were interested in the
neural system supporting the AV integration of
emotional face information and emotional prosody.
Normal participants were exposed to short videos of a
computer-animated face voicing emotionally positive or
negative words with the appropriate prosody. Facial
expression was either neutral or emotionally
appropriate. To reveal the neural network involved in AV
integration, standard univariate analysis of fMRI data
was followed by a connectivity analysis (Granger
causality mapping (GCM); Roebroeck et al., 2005;
Valdes-Sosa et al., 2011; Stephan and Roebroeck,
2012). GCM was introduced as it allows, similar to
dynamic causal modeling (Stephan and Roebroeck,

232 H. Jansma et al. / Neuroscience 256 (2014) 230–241
2012), to investigate directed influences of one brain area
on others. An advantage of the particular implementation
of GCM used in this paper is that no a priori model about
the number of brain areas and their connections has to be
used. GCM has been applied successfully to fMRI
analysis in a number of studies (e.g., Formisano et al.,
2002; Bressler et al., 2008; Sridharan et al., 2008). We
predicted to find enhanced neural activity in the STS for
emotionally appropriate relative to neutral animations
and a causal influence of the auditory cortex and visual
areas related to the processing of affective facial
information in the STS.
EXPERIMENTAL PROCEDURE
All procedures were approved by the ethics review board
of the University of Magdeburg, the affiliation of the first
and last author at the time of the study. The study was
performed in compliance with the Declaration of Helsinki.
Participants and procedure
The data of 14 right-handed, neurologically healthy
participants with normal or corrected-to-normal visual
acuity were used (8 women, age range 19–24 years).
Data of six additional participants had to be discarded
either due to extensive head-movements (n= 5) or
problems with contact lenses (n= 1).
Stimuli
A total of 60 concrete German nouns with a positive and
60 concrete nouns with a negative affective connotation
were selected from the Berlin Affective Word List (Vo
et al., 2006) which comprises 2200 German words
assessed by 88 normal German speaking volunteers for
emotional valence (on a 7-point scale ranging from �3to 3) and imageability (on a 7-point scale ranging from 1
to 7). Selected positive words had a mean rating of 1.83
(SD 0.38) and negative words had a mean rating of
�1.83 (SD 0.35). Positive and negative words were
matched for imageability (average. positive 4.52; SD
1.43; negative 4.29; SD 1.03).
Short video-clips of an animated, computer-
generated, photo-realistic face with synchronized lip-
movements pronouncing the words were produced
using the software Maya (http://www.autodesk.com;
for examples see Supplemental Material). The quality of
the animations is comparable with modern special
effects animations used in the film industry. The
emotional expression of the computer-animated face
was assessed by a group of 10 young participants
(5 women, age 19–28). These were asked to rate the
valence of the facial expression on a scale ranging
from �5 (very negative) to +5 (very positive).
Emotionally negative/positive expressions were judged
to be �3.4/3.1.The words were spoken by a professional voice actor
using affective prosody that matched the emotional
valence (positive or negative) of the word. Again, 10
young participants judged the emotional valence of the
intonation of the actor on a scale ranging from �5 (very
negative) to +5 (very positive). A mean rating of the
negatively/positively spoken words of �3.1/2.6 was
obtained.
The face of the animated character either showed a
modulated emotional expression (henceforth: EMO) or
remained neutral (NEU). In order to avoid item effects, a
neutral and an emotionally modulated animation was
made of each word. The participants were shown 50%
of the words with a neutral animation and the remainder
with an emotional animation. The animation types were
counterbalanced across subjects such that each item
was equally tested in both animation types.
All animations lasted 1880 ms corresponding to 47
video frames and were displayed with a frame rate of 25
frames per second. The animations had a resolution of
1024 � 768 pixels, an aspect ratio of 4:3, and 24 bit
sample size. The corresponding audio signal had 16-bit
resolution.
Because a computer-animated face was used, it could
be ensured that EMO and NEU conditions were matched
in terms of general movement, head movement and eye
movement of the animated torso. The lip movement was
always in perfect synchrony with the auditory stimulation
of the word.
The animations were presented using Presentation
software (www.neurobehavioralsystems.com) via a
projector that rear-projected the stimuli onto a screen
which was viewed by the participants with the aid of a
mirror mounted on the head coil. The distance to screen
was about 59 cm and the width of projection was
32.5 cm. Audio-information was presented via MRI
compatible electrodynamic headphones integrated into
earmuffs to reduce residual background scanner noise
(Baumgartner et al., 2006). The sound level of stimuli
was individually adjusted to achieve good audibility
during data acquisition.
Functional MR images were acquired in a slow event-
related design. In order to synchronize acquisition timing
between scanner and stimulus-PC, the start of each trial
was initiated by an external pulse from the scanner. At
the beginning of the run a fixation cross was presented
for 10 s, followed by 120 trials. Each trial comprised an
animation (stimulus), followed by a fixation cross of
various durations (6–8 times TR). The order in which
the animations were presented was randomized across
conditions for each participant. Each participant saw 60
EMO (emotional facial expression congruently paired
with 30 negative and 30 positive words) and 60 NEU
(neutral facial expression paired with 30 negative and
30 positive words) videos. The functional run took
23 min and was followed by the acquisition of the
structural data set.
Participants were asked to fixate the cross before and
after each animation and to watch the videos in order to
perform a subsequent memory test. In this memory test
the stimuli were presented again randomly intermixed
with an equal number of new videos of the same kind
but animating different words. The participants had to
decide for each stimulus whether it had been presented
before or not.

H. Jansma et al. / Neuroscience 256 (2014) 230–241 233
fMRI acquisition and analysis
Images were acquired on a 3T Siemens Magnetom Trio
head scanner (Siemens Medical Systems, Erlangen,
Germany) using a standard 8 channel head coil.
Twenty-six oblique axial slices were acquired (in-plane
resolution: 3.5 � 3.5 mm, slice thickness: 3.2 mm,
interslice distance 0.8 mm) covering almost the entire
cortical volume using an echo planar imaging sequence
(TR = 1600 ms, field of view (FOV) 224 mm,
TE = 30 ms, matrix size: 64 � 64, flip angle 75�). In
total, 851 volumes were acquired of which the first 2
were discarded to allow for T1 saturation. Functional
slices were aligned to a high-resolution T1-weighted
anatomical scan acquired on the same scanner running
a three-dimensional T1-fast-low-angle shot sequence
lasting 9 min and 50 s (MPRAGE, 192 slices, slice
thickness 1 mm, TR 2500 ms; TE 4.77 ms; FA 7�; FOV
256 mm; matrix 256 � 256).
Using BrainVoyager QX (Brain Innovation, Maastricht,
The Netherlands) functional data were slice scan-time
corrected, and corrected for motion in three dimensions.
Subsequently, linear drifts were removed from the signal
and data were high-pass filtered to remove slow
frequency drifts up to 3 cycles per time course. Data
were spatially smoothed with a Gaussian kernel of
6 mm (FWHM) and aligned to the last volume of the
dataset, which was closest in time to the recording of
the structural scan. The correction for movement during
the run was done using a bi-cubic spline interpolation
allowing the algorithm maximally 300 iterations for
volume movement parameter estimation. Functional
data were aligned to the high-resolution anatomical
images, morphed to fit Talairach dimensions (Talairach
and Tournoux, 1988) and combined into a 4-
dimensional (x,y,z, time) dataset for each run and each
subject.
Univariate statistical analysis
Trials with emotional expression and without emotional
expression were compared using random effects
general linear model (RFX-GLM) analysis: in a first
level, a standard GLM was used to estimate the beta
values (summary statistics) for each subject and
condition (level 1), which were then entered to the
Table 1. Univariate analysis emotional expression (EMO) > neutral expressio
Region of activation Laterality Coordinates
Main effect EMO> NEU
Amygdala L �21�11�9Amygdala R 18�12�10Middle temporal gyrus L �49�631Middle temporal gyrus R 48�594Fusiform gyrus L �46�70�10Fusiform gyrus R 44�66�12Fusiform gyrus (anterior) L �37�52�14Inferior occipital gyrus R 36�80�1Middle occipital gyrus L �35�775Middle occipital gyrus L �40�627
These coordinates represent the center of gravity of the cluster in Tailarach space. The t-v
voxels contained in the cluster. All contrasts have been cluster threshold corrected for m
second level analysis as the dependent variable. At this
level of analysis the main effect of animation was tested.
The correction for multiple comparisons was
performed using cluster-size thresholding. The
procedure started with setting a threshold (manually) for
the map relative to the contrast of interest with a
p< 0.005 (uncorrected). Next, the intrinsic smoothness
of the resulting map was evaluated automatically
(Forman et al., 1995; Goebel et al., 2006). The final
result was a minimum cluster size threshold set for the
current map to achieve a corrected p value of <0.005.
Connectivity analysis
To reveal the brain network underlying the perception of
affective facial expression GCM, a vector autoregressive
modeling technique, was used to define effective and/or
functional connectivity (Goebel et al., 2003; Roebroeck
et al., 2005). Briefly, the average blood oxygen level-
dependent (BOLD) response collected across time from
a volume of interest (VOI) make up a vector time series,
xi(t), where t represents time and i denotes the VOI. To
identify and characterize effective connectivity in GCM,
it is assumed that the time series x(t) is a function of its
own past x(t � l, . . ., t � p) and possibly of the past of
another VOI or single voxel y(t � l, . . ., t � p). Therefore,it can be stated that if there is causality between x and
y, the present value of x can be better predicted using
the information of both time series x(t) and y(t)compared with solely using the information in time
series x(t). Furthermore, the number of time series that
can be used to predict the current value x can be more
than two. This method, unlike some other methods for
testing connectivity, does not require the a priori
definition of a network including all brain areas to be
tested. On the basis of Granger causality, the existence
and direction of influence on and from the seeding
region in respect to the rest of the brain can be
investigated. In addition to directed causality the
instantaneous influence (correlation) between x(t) and
y(t) can be detected when values x(t) improve
predictions of synchronous values y(t) (or vice versa,
instantaneous correlation is symmetric), taking into
account all other relevant sources of influence (at the
very least the past of both x and y). Note, therefore, thatthe instantaneous correlation reported here is subtly
n (NEU)
Voxels BA t Value p Value
516 4.2028 0.0018
270 3.9989 0.0021
1130 37 3.9290 0.0023
1556 37 4.3237 0.0016
1234 19 3.8575 0.0025
1588 19 4.1743 0.0018
517 19 3.7685 0.0027
1248 18 4.1439 0.0018
422 19 3.5800 0.0035
578 37 3.8498 0.0026
alue is the average value of the cluster, and the p-value the average value for the
ultiple comparisons at a level of p< 0.005. BA = Brodmann area.

Fig. 1. (A) Univariate analysis. Contrast for affective emotional facial expression against a neutral facial expression giving activation of the
amygdala, middle temporal gyrus and fusiform gyrus. (B,C) t-Test for instantaneous GCM between EMO and NEU for left and right amygdala seeds
revealed connectivity differences in the fusiform gyrus, inferior occipital area and temporal pole. Only the left amygdala showed (bilateral)
connectivity with the superior temporal gyrus, IFG and auditory cortex. (D,E) t-Test between the directed GCM results of EMO and NEU revealed a
connectivity difference in the right fusiform gyrus for both left and right amygdala. The source of influence to both left and right amygdala is
lateralized in the right fusiform gyrus/sulcus.
234 H. Jansma et al. / Neuroscience 256 (2014) 230–241
different from a standard correlation value in that the
instantaneous correlation is conditioned on the past of
the involved time-series. The advantage is that this way
all linear statistical dependence between two time-series
is divided into directional (x to y and y to x) and
instantaneous correlation.
H. Jansma et al. / Neuroscience 256 (2014) 230–241 235
Seeding regions were defined according to univariate
analysis results of the contrast between EMO and NEU
conditions. For all seeding regions, a region in the left
hemisphere was defined as well as a region in the right
hemisphere. The seed regions used were: amygdala,
inferior occipital area, and superior temporal gyrus/MTG.
For each subject and each region a GCM analysis was
performed (FDR corr. q< 0.05) and the resulting beta
values were used as input for a random-effects (RFX)-
GCM over all subjects (FDR corr. q< 0.05).
Subsequently a paired t-test was performed between
the RFX-GCM beta values for EMO and NEU to reveal
the effect of emotional affective expression within the
neural network.
RESULTS
Memory test
Participants showed equal memory performance for EMO
(Hits minus false alarms 74.3%, SD 8.9) and NEU
(72.8%, SD 9.1) stimuli. This indicates that both classes
of stimuli had been attended during the scanning session.
Univariate statistical analysis
The second level analysis, using the beta values of the
first level analysis, revealed greater activation in bilateral
amygdala, fusiform gyrus, MTG, and inferior occipital
gyrus for emotional vs. neutral animations (Table 1,
Fig. 1A). As in both conditions the words were spoken
with an appropriate emotional prosody, this contrast
could be also thought of as congruent (same emotional
valence in the visual and auditory modality) vs.
incongruent (visual modality: neutral; auditory modality:
emotional). There were no brain areas which showed
greater BOLD modulation for neutral animations at the
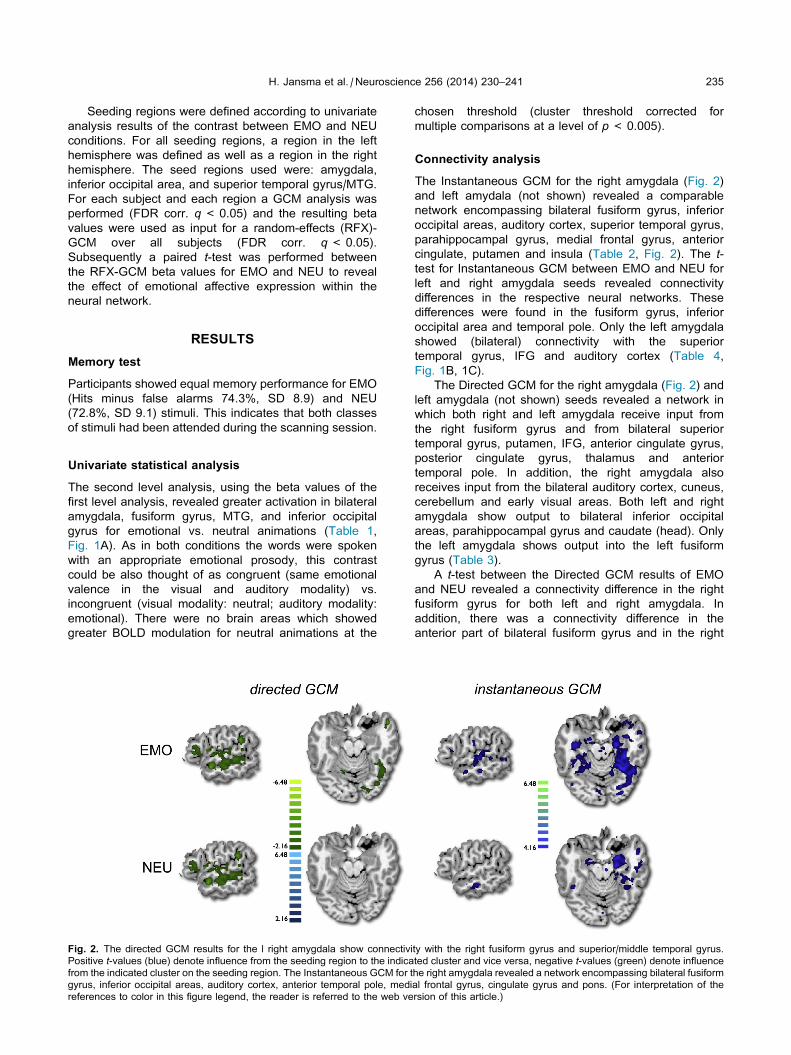
Fig. 2. The directed GCM results for the l right amygdala show connectivi
Positive t-values (blue) denote influence from the seeding region to the indica
from the indicated cluster on the seeding region. The Instantaneous GCM for t
gyrus, inferior occipital areas, auditory cortex, anterior temporal pole, medi
references to color in this figure legend, the reader is referred to the web ve
chosen threshold (cluster threshold corrected for
multiple comparisons at a level of p< 0.005).
Connectivity analysis
The Instantaneous GCM for the right amygdala (Fig. 2)
and left amydala (not shown) revealed a comparable
network encompassing bilateral fusiform gyrus, inferior
occipital areas, auditory cortex, superior temporal gyrus,
parahippocampal gyrus, medial frontal gyrus, anterior
cingulate, putamen and insula (Table 2, Fig. 2). The t-test for Instantaneous GCM between EMO and NEU for
left and right amygdala seeds revealed connectivity
differences in the respective neural networks. These
differences were found in the fusiform gyrus, inferior
occipital area and temporal pole. Only the left amygdala
showed (bilateral) connectivity with the superior
temporal gyrus, IFG and auditory cortex (Table 4,
Fig. 1B, 1C).
The Directed GCM for the right amygdala (Fig. 2) and
left amygdala (not shown) seeds revealed a network in
which both right and left amygdala receive input from
the right fusiform gyrus and from bilateral superior
temporal gyrus, putamen, IFG, anterior cingulate gyrus,
posterior cingulate gyrus, thalamus and anterior
temporal pole. In addition, the right amygdala also
receives input from the bilateral auditory cortex, cuneus,
cerebellum and early visual areas. Both left and right
amygdala show output to bilateral inferior occipital
areas, parahippocampal gyrus and caudate (head). Only
the left amygdala shows output into the left fusiform
gyrus (Table 3).
A t-test between the Directed GCM results of EMO
and NEU revealed a connectivity difference in the right
fusiform gyrus for both left and right amygdala. In
addition, there was a connectivity difference in the
anterior part of bilateral fusiform gyrus and in the right
ty with the right fusiform gyrus and superior/middle temporal gyrus.
ted cluster and vice versa, negative t-values (green) denote influence
he right amygdala revealed a network encompassing bilateral fusiform
al frontal gyrus, cingulate gyrus and pons. (For interpretation of the
rsion of this article.)

Table 2. Seed right amygdala (TAL 18�12�10). Brain areas revealed by instant GCM analysis for emotional (EMO) and neutral (NEU) conditions
Region of activation Laterality Coordinates BA t Value p Value
Instant RH amygdala EMO
Fusiform gyrus R 29�34�16 20 4.756 0.0005
Fusiform gyrus R 33�51�16 37 4.821 0.0004
Middle occipital gyrus R 47�52�6 37 4.887 0.0004
Middle temporal gyrus R 59�17�12 21 4.522 0.0006
Middle temporal gyrus R 532�16 21 4.494 0.0006
Superior temporal gyrus R 57�151 22 4.558 0.0006
Superior temporal gyrus R 54�209 41 4.426 0.0007
Amygdala R 25�6�8 5.793 0.0002
Parahippocampal gyrus R 22�28�3 27 4.691 0.0005
Parahippocampal gyrus R 8�421 30 4.608 0.0005
Parahippocampal gyrus R 21�29�7 28 4.706 0.0005
Medial frontal gyrus R 111442 32 4.589 0.0006
Fusiform gyrus L �36�38�16 20 4.497 0.0006
Fusiform gyrus L �40�57�11 37 4.988 0.0004
Middle temporal gyrus L �48�584 37 4.809 0.0004
Superior temporal gyrus L �46�6118 39 4.635 0.0005
Superior temporal gyrus L �55�248 41 4.519 0.0006
Superior temporal gyrus L �46�102 22 4.803 0.0005
Middle temporal gyrus L �53�28�2 21 4.392 0.0007
Middle temporal gyrus L �56�8�8 21 4.804 0.0005
Amygdala L �23�10�9 4.927 0.0004
Lingual gyrus L �12�521 19 4.675 0.0005
Thalamus L �12�310 4.821 0.0005
Anterior cingulate L �1461 32 4.710 0.0005
Cingulate gyrus L �91640 32 4.635 0.0006
Instant RH amygdala NEU
Fusiform gyrus R 33�45�16 37 4.615 0.0006
Fusiform gyrus R 31�36�16 20 4.569 0.0006
Middle temporal gyrus R 51�15�17 21 4.541 0.0006
Superior temporal gyrus R 4410�9 38 4.554 0.0006
Parahippocampal gyrus R 20�13�14 28 6.495 0.0001
Parahippocampal gyrus R 6�340 30 4.715 0.0005
Fusiform gyrus L �40�44�15 37 4.499 0.0006
Middle temporal gyrus L �51�542 37 4.526 0.0006
Amygdala L �20�10�10 4.753 0.0005
Thalamus L �12�313 4.669 0.0005
Anterior cingulate L �147�3 32 4.564 0.0006
Parahippocampal gyrus L �4�440 30 4.793 0.0005
Middle frontal gyrus L �211956 6 4.599 0.0005
Superior temporal gyrus L �47�115 22 4.373 0.0007
Clusters were found in the volume data. The Talairach coordinates represent the center of gravity of the cluster. BA stands for the Brodmann area. The t-value is the average
value for the cluster, and the p-value the average value of the voxels contained in the cluster.
236 H. Jansma et al. / Neuroscience 256 (2014) 230–241
hemispheric STS/MTG for the right amygdala seed
(Table 2, Fig. 1D, E).
DISCUSSION
We used fMRI in combination with functional connectivity
analysis to investigate the integration of emotional facial
expression and emotional auditory input. The univariate
analysis revealed bilateral activation in the inferior
occipital areas, fusiform gyrus and amygdala for
emotional vs. neutral stimuli with is in line with earlier
studies (Haxby et al., 2000; Adolphs, 2002a,b; Ethofer
et al., 2006a). Please note, that we contrasted
emotional facial information (positive or negative) paired
with emotionally congruent (positive or negative)
prosody and emotionally neutral faces paired with
incongruent emotional (positive or negative) prosody,
rather than focusing on differences between positively
and negatively valence stimuli. While there is evidence
for specialization for certain brain areas for positive or
negative emotional information (Wager et al., 2003), the
emphasis of the current study was on the congruency/
incongruency of facial and prosodic information.
Importantly, the fusiform gyrus was more activated for
EMO than NEU implicating this structure in the
processing of affective facial expressions again
compatible with earlier studies (Adolphs, 2002b; de
Gelder et al., 2003; Ganel et al., 2005; Vuilleumier,
2005; Ishai, 2008). In addition, the MTG next to the STS
showed more activation for EMO compared to NEU
stimuli as well. This echoes earlier observations
suggesting a role of this region for the integration of

Table 3. Seed right amygdala (TAL 18�12�10). Brain areas revealed by directed GCM analysis for emotional (EMO) and (NEU) conditions
Region of activation Laterality Coordinates BA t Value p Value
Directed RH amygdala EMO
Lingual gyrus R 16�81�8 18 �2.516 0.028
Cingulate gyrus R 7�2532 23 �2.547 0.027
Cingulate gyrus R 122630 32 �2.503 0.029
Middle frontal gyrus R 473423 46 �2.538 0.027
Inferior frontal gyrus R 43930 9 �2.639 0.025
Middle temporal gyrus R 58�21�3 21 �2.642 0.023
Superior temporal gyrus R 43�4415 13 �2.542 0.028
Fusiform gyrus R 38�59�11 37 �2.483 0.298
Putamen R 30�167 �2.425 0.032
Thalamus R 11�177 �2.522 0.028
Superior temporal gyrus R 52�1311 22 �2.489 0.030
Inferior parietal lobule R 53�3729 40 �2.614 0.025
Parahippocampal gyrus R 5�380 30 2.581 0.026
Caudate head R 2111 2.657 0.024
Parahippocampal gyrus L �10�412 30 2.457 0.031
Superior temporal gyrus L �45�2912 41 �2.581 0.026
Superior temporal gyrus L �44�5117 21 �2.397 0.034
Putamen L �2378 �2.493 0.029
Anterior cingulate L �9445 32 �2.556 0.027
Posterior cingulate L �8�6516 31 �2.671 0.023
Medial frontal gyrus L �94624 9 �2.443 0.032
Precuneus L �20�7027 31 �2.561 0.027
Cingulate gyrus L �4�2734 31 �2.628 0.024
Superior temporal gyrus L �49�4414 22 �2.454 0.031
Inferior frontal gyrus L �54527 9 �2.674 0.023
Directed RH amygdala NEU
Superior temporal gyrus R 47�319 41 �2.801 0.018
Middle temporal gyrus R 49�534 37 �2.160 0.025
Superior frontal gyrus R 434030 9 �2.574 0.026
Inferior parietal lobule R 57�1923 40 �2.464 0.030
Posterior cingulate R 10�6711 30 �2.341 0.036
Cingulate gyrus R 5�6026 31 �2.357 0.035
Caudate head R 8�172 �2.469 0.031
Putamen L �24�1410 �2.529 0.028
Transverse temporal gyrus L �50�2511 41 �2.601 0.026
Lingual gyrus L �2�73�4 18 �2.401 0.033
Precuneus L �9�6218 31 �2.471 0.030
Superior temporal gyrus L �52�210 21 �2.626 0.024
Postcentral gyrus L �55�2617 40 �2.503 0.030
Precentral gyrus L �351138 9 �2.472 0.031
Clusters were found in the volume data. The Talairach coordinates represent the center of gravity of the cluster. BA stands for the Brodmann area. The t-value is the average
value for the cluster, and the p-value the average value of the voxels contained in the cluster. Positive t-values denote influence from the seeding region to the indicated
cluster and vice versa, negative t-values denote influence from the indicated cluster on the seeding region.
H. Jansma et al. / Neuroscience 256 (2014) 230–241 237
emotional information from face and voice (Pourtois et al.,
2005; Ethofer et al., 2006a,b; Kreifelts et al., 2007, 2009).
Directed Granger causality was used to shed some
light on the direction of information flow between the
amygdala and the fusiform gyrus. The GCM technique
is specifically aimed at extracting the direction of
information flow in the brain without prior assumption on
that direction (directed GCM), or showing that no such
direction can be found (instantaneous GCM). Directed
GCM showed a difference in connectivity direction
between the right and left hemisphere, from the
amygdala to the fusiform gyrus. Bilateral amygdala
receives input mainly from the right hemisphere fusiform
gyrus and output is directed mainly to the left
hemisphere. This difference might explain why some
studies report bilateral activation of the fusiform gyrus
with possible right hemispheric dominance (Allison
et al., 1994; Pourtois et al., 2005; Kanwisher and Yovel,
2006; Engell and Haxby, 2007) while other studies
report mainly or only activation in the right hemisphere
(Rossion et al., 2003; Ganel et al., 2005; Vuilleumier
and Pourtois, 2007). This difference in activity between
both hemispheres might be dependent on the
processing route via intermediate task-related areas.
The results are summarized in Fig. 3 with brain areas
revealed by our analysis displayed as boxes and
information flow as arrows. The brain network is
organized into a model taking previous models as a
departure point. According to the classical model
by(Bruce and Young, 1986) facial expression and facial
identity are processed by separate routes. This
separation is also a feature of a model proposed by
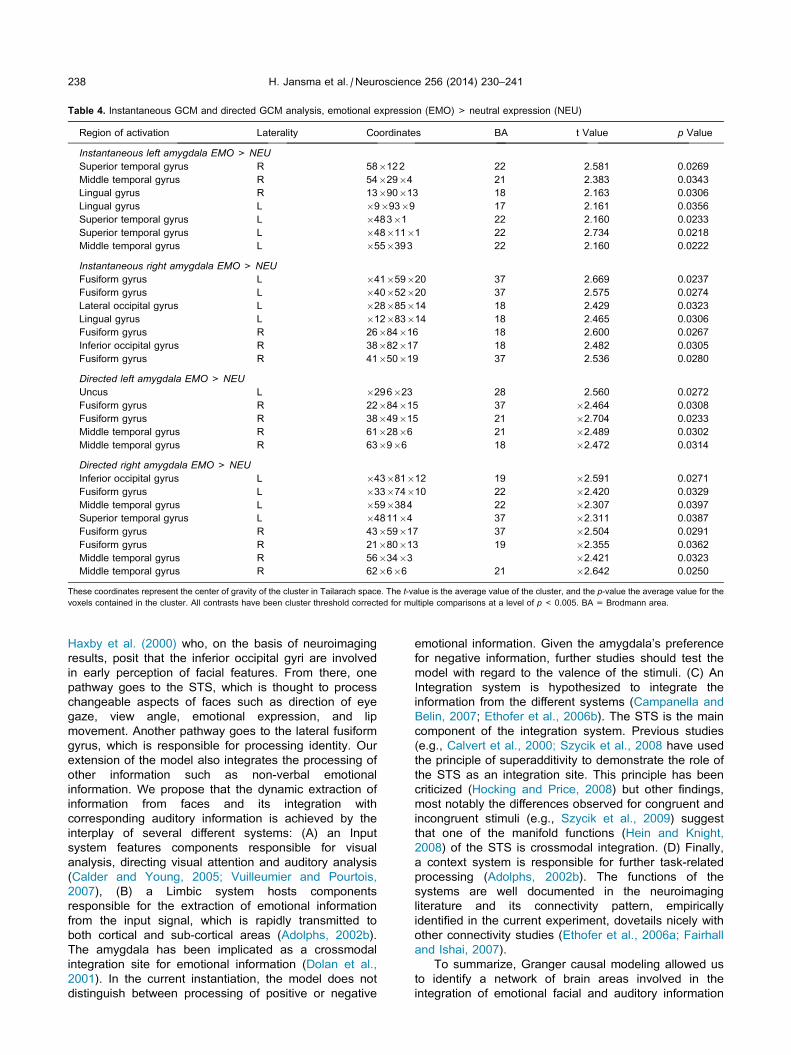
Table 4. Instantaneous GCM and directed GCM analysis, emotional expression (EMO) > neutral expression (NEU)
Region of activation Laterality Coordinates BA t Value p Value
Instantaneous left amygdala EMO> NEU
Superior temporal gyrus R 58�122 22 2.581 0.0269
Middle temporal gyrus R 54�29�4 21 2.383 0.0343
Lingual gyrus R 13�90�13 18 2.163 0.0306
Lingual gyrus L �9�93�9 17 2.161 0.0356
Superior temporal gyrus L �483�1 22 2.160 0.0233
Superior temporal gyrus L �48�11�1 22 2.734 0.0218
Middle temporal gyrus L �55�393 22 2.160 0.0222
Instantaneous right amygdala EMO> NEU
Fusiform gyrus L �41�59�20 37 2.669 0.0237
Fusiform gyrus L �40�52�20 37 2.575 0.0274
Lateral occipital gyrus L �28�85�14 18 2.429 0.0323
Lingual gyrus L �12�83�14 18 2.465 0.0306
Fusiform gyrus R 26�84�16 18 2.600 0.0267
Inferior occipital gyrus R 38�82�17 18 2.482 0.0305
Fusiform gyrus R 41�50�19 37 2.536 0.0280
Directed left amygdala EMO> NEU
Uncus L �296�23 28 2.560 0.0272
Fusiform gyrus R 22�84�15 37 �2.464 0.0308
Fusiform gyrus R 38�49�15 21 �2.704 0.0233
Middle temporal gyrus R 61�28�6 21 �2.489 0.0302
Middle temporal gyrus R 63�9�6 18 �2.472 0.0314
Directed right amygdala EMO> NEU
Inferior occipital gyrus L �43�81�12 19 �2.591 0.0271
Fusiform gyrus L �33�74�10 22 �2.420 0.0329
Middle temporal gyrus L �59�384 22 �2.307 0.0397
Superior temporal gyrus L �4811�4 37 �2.311 0.0387
Fusiform gyrus R 43�59�17 37 �2.504 0.0291
Fusiform gyrus R 21�80�13 19 �2.355 0.0362
Middle temporal gyrus R 56�34�3 �2.421 0.0323
Middle temporal gyrus R 62�6�6 21 �2.642 0.0250
These coordinates represent the center of gravity of the cluster in Tailarach space. The t-value is the average value of the cluster, and the p-value the average value for the
voxels contained in the cluster. All contrasts have been cluster threshold corrected for multiple comparisons at a level of p< 0.005. BA = Brodmann area.
238 H. Jansma et al. / Neuroscience 256 (2014) 230–241
Haxby et al. (2000) who, on the basis of neuroimaging
results, posit that the inferior occipital gyri are involved
in early perception of facial features. From there, one
pathway goes to the STS, which is thought to process
changeable aspects of faces such as direction of eye
gaze, view angle, emotional expression, and lip
movement. Another pathway goes to the lateral fusiform
gyrus, which is responsible for processing identity. Our
extension of the model also integrates the processing of
other information such as non-verbal emotional
information. We propose that the dynamic extraction of
information from faces and its integration with
corresponding auditory information is achieved by the
interplay of several different systems: (A) an Input
system features components responsible for visual
analysis, directing visual attention and auditory analysis
(Calder and Young, 2005; Vuilleumier and Pourtois,
2007), (B) a Limbic system hosts components
responsible for the extraction of emotional information
from the input signal, which is rapidly transmitted to
both cortical and sub-cortical areas (Adolphs, 2002b).
The amygdala has been implicated as a crossmodal
integration site for emotional information (Dolan et al.,
2001). In the current instantiation, the model does not
distinguish between processing of positive or negative
emotional information. Given the amygdala’s preference
for negative information, further studies should test the
model with regard to the valence of the stimuli. (C) An
Integration system is hypothesized to integrate the
information from the different systems (Campanella and
Belin, 2007; Ethofer et al., 2006b). The STS is the main
component of the integration system. Previous studies
(e.g., Calvert et al., 2000; Szycik et al., 2008 have used
the principle of superadditivity to demonstrate the role of
the STS as an integration site. This principle has been
criticized (Hocking and Price, 2008) but other findings,
most notably the differences observed for congruent and
incongruent stimuli (e.g., Szycik et al., 2009) suggest
that one of the manifold functions (Hein and Knight,
2008) of the STS is crossmodal integration. (D) Finally,
a context system is responsible for further task-related
processing (Adolphs, 2002b). The functions of the
systems are well documented in the neuroimaging
literature and its connectivity pattern, empirically
identified in the current experiment, dovetails nicely with
other connectivity studies (Ethofer et al., 2006a; Fairhall
and Ishai, 2007).
To summarize, Granger causal modeling allowed us
to identify a network of brain areas involved in the
integration of emotional facial and auditory information

Fig. 3. Summary of the imaging results. Identified brain areas are grouped into several different systems with the information flow between areas
denoted by arrows. For explanation, see main text.
H. Jansma et al. / Neuroscience 256 (2014) 230–241 239
and to delineate the information flow between these
areas.
Acknowledgments—TFM is supported by the DFG and the
BMBF. This particular project was carried out as part of the
SFB TR 31, project A7. We thank the company Takomat, Co-
logne, Germany, for the production of the video stimuli.
APPENDIX A. SUPPLEMENTARY DATA
Supplementary data associated with this article can be
found, in the online version, at http://dx.doi.org/10.1016/
j.neuroscience.2013.10.047.
REFERENCES
Adolphs R (2002a) Recognizing emotion from facial expressions:
psychological and neurological mechanisms. Behav Cogn
Neurosci Rev 1:21–62.
Adolphs R (2002b) Neural systems for recognizing emotion. Curr
Opin Neurobiol 12:169–177.
Adolphs R, Damasio H, Tranel D (2002) Neural systems for
recognizing emotional prosody. Emotion 2:23–51.
Allison T, Ginter H, McCarthy G, Nobre AC, Puce A, Luby M, Spencer
DD (1994) Face recognition in human extrastriate cortex. J
Neurophysiol 71:821–825.
Barraclough NE, Xiao D, Baker CI, Oram MW, Perrett DI (2005)
Integration of visual and auditory information by superior temporal
sulcus neurons responsive to the sight of actions. J Cogn
Neurosci 17:377–391.
Baumgartner T, Lutz K, Schmidt CF, Jancke L (2006) The emotional
power of music: how music enhances the feeling of affective
pictures. Brain Res 1075:151–164.
Belin P, Zatorre RJ, Ahad P (2002) Human temporal-lobe response to
vocal sounds. Cogn Brain Res 13:17–26.
Bestelmeyer PE, Latinus M, Bruckert L, Rouger J, Crabbe F, Belin P
(2012) Implicitly perceived vocal attractiveness modulates
prefrontal cortex activity. Cereb Cortex 22:1263–1270.
Blair RJR, Morris JS, Frith CD, Perrett DI, Dolan RJ (1999)
Dissociable neural responses to facial expressions of sadness
and anger. Brain 122:883–893.
Blank H, Anwander A, von Kriegstein K (2011) Direct structural
connections between voice- and face-recognition areas. J
Neurosci 31:12906–12915.
Breiter HC, Etcoff NL, Whalen PJ, Kennedy WA, Rauch SL, Buckner
RL, Strauss MM, Hyman SE, Rosen BR (1996) Response and
habituation of the human amygdala during visual processing of
facial expression. Neuron 17:875–887.
Bressler SL, Tang W, Sylvester CM, Shulman GL, Corbetta M (2008)
Top–down control of human visual cortex by frontal and parietal
cortex in anticipatory visual spatial attention. J Neurosci
28:10056–10061.
Bruce V, Young AW (1986) Understanding face recognition. Brit J
Psychol 77:305–327.
Buchanan TW, Lutz K, Mirzazade S, Specht K, Shah NJ, Zilles K,
Jancke L (2000) Recognition of emotional prosody and verbal
components of spoken language: an fMRI study. Cogn Brain Res
9:227–238.
Calder AJ, Young AW (2005) Understanding the recognition of
facial identity and facial expression. Nat Rev Neurosci
6:641–651.
Calvert GA, Campbell R (2003) Reading speech from still and moving
faces: the neural substrates of visible speech. J Cogn Neurosci
15:57–70.
Calvert GA, Campbell R, Brammer MJ (2000) Evidence from
functional magnetic resonance imaging of crossmodal binding in
the human heteromodal cortex. Curr Biol 10:649–657.
Campanella S, Belin P (2007) Integrating face and voice in person
perception. Trends Cogn Sci 11:535–543.

240 H. Jansma et al. / Neuroscience 256 (2014) 230–241
Collignon O, Girard S, Gosselin F, Roy S, Saint-Amour D, Lassonde
M, Lepore F (2008) Audio-visual integration of emotion
expression. Brain Res 1242:126–135.
Critchley HD, Daly E, Phillips M, Brammer M, Bullmore E, Williams S,
van Amelsvoort T, Robertson D, David A, Murphy D (2000)
Explicit and implicit neural mechanisms for processing of social
information from facial expressions: a functional magnetic
imaging study. Hum Brain Mapp 9:93–105.
de Gelder B, Vroomen J (2000) The perception of emotions by ear
and by eye. Cognition & Emotion 14:289–311.
de Gelder B, Bocker KB, Tuomainen J, Hensen M, Vroomen J (1999)
The combined perception of emotion from voice and face: early
interaction revealed by human electric brain responses. Neurosci
Lett 260:133–136.
de Gelder B, Pourtois G, Weisskrantz L (2002) Fear
recognition in the voice is modulated by unconsciously
recognized facial expressions but not by unconsciously
recognized affective pictures. Proc Natl Acad Sci USA
99:4121–4126.
de Gelder B, Frissen I, Barton J, Hadjikhani N (2003) A modulatory
role for facial expressions in prosopagnosia. Proc Natl Acad Sci
USA 100:13105–13110.
Dolan RJ, Morris JS, de Gelder B (2001) Crossmodal binding of fear
in voice and face. Proc Natl Acad Sci USA 98:10006–10010.
Ekman P (1994) Strong evidence for universals in facial expressions:
a reply to Russell_s mistaken critique. Psychol Bull 115:268–287.
Engell AD, Haxby JV (2007) Facial expression and gaze-direction in
human superior temporal sulcus. Neuropsychologia
45:3234–3241.
Ethofer T, Anders S, Erb M, Droll C, Royen L, Saur R, Reiterer S,
Grodd W, Wildgruber D (2006a) Impact of voice on emotional
judgment of faces: an event-related fMRI study. Hum Brain Mapp
27:707–714.
Ethofer T, Pourtois G, Wildgruber D (2006b) Investigating audiovisual
integration of emotional signals in the human brain. Prog Brain
Res 156:345–360.
Ethofer T, Van De Ville D, Scherer K, Vuilleumier P (2009) Decoding
of emotional information in voice-sensitive cortices. Curr Biol
19:1028–1033.
Fairhall SL, Ishai A (2007) Effective connectivity within the distributed
cortical network for face perception. Cereb Cortex 17:2400–2406.
Forman SD, Cohen JD, Fitzgerald M, Eddy WF, Mintun MA, Noll DC
(1995) Improved assessment of significant activation in functional
magnetic resonance imaging (fMRI): use of a cluster-size
threshold. Magn Reson Med 33:636–647.
Formisano E, Linden DE, Di Salle F, Trojano L, Esposito F, Sack AT,
Grossi D, Zanella FE, Goebel R (2002) Tracking the mind’s image
in the brain I: timeresolved fMRI during visuospatial mental
imagery. Neuron 35:185–194.
Ganel T, Valyear KF, Goshen-Gottstein Y, Goodale MA (2005) The
involvement of the ‘‘fusiform face area’’ in processing facial
expression. Neuropsychologia 43:1645–1654.
Gelder BD, Teunisse JP, Benson PJ (1997) Categorical perception of
facial expressions: categories and their internal structure.
Cognition & Emotion 11:1–23.
Goebel R, Roebroeck A, Kim DS, Formisano E (2003) Investigating
directed cortical interactions in time-resolved fMRI data using
vector autoregressive modeling and Granger causality mapping.
Magn Reson Imaging 21:1251–1261.
Goebel R, Esposito F, Formisano E (2006) Analysis of functional
image analysis contest (FIAC) data with brainvoyager QX: from
single-subject to cortically aligned group general linear model
analysis and self-organizing group independent component
analysis. Hum Brain Mapp 27:392–401.
Haxby JV, Hoffman EA, Gobbini MI (2000) The distributed human
neural system for face perception. Trends Cogn Sci 4:223–233.
Hein G, Knight RT (2008) Superior temporal sulcus – it’s my area: or
is it? J Cogn Neurosci 20:2125–2136.
Hocking J, Price CJ (2008) The role of the posterior superior
temporal sulcus in audiovisual processing. Cereb Cortex
18:2439–2449.
Ishai A (2008) Let’s face it: it’s a cortical network. Neuroimage
40:415–419.
Kanwisher N, Yovel G (2006) The fusiform face area: a cortical region
specialized for the perception of faces. Philos Trans R Soc Lond B
Biol Sci 361:2109–2128.
Klasen M, Kenworthy CA, Mathiak KA, Kircher TT, Mathiak K (2011)
Supramodal representation of emotions. J Neurosci
31:13635–13643.
Kreifelts B, Ethofer T, Grodd W, Erb M, Wildgruber D (2007)
Audiovisual integration of emotional signals in voice and face:
an event-related fMRI study. Neuroimage 37:1445–1456.
Kreifelts B, Ethofer T, Shiozawa T, Grodd W, Wildgruber D (2009)
Cerebral representation of non-verbal emotional perception: fMRI
reveals audiovisual integration area between voice- and face-
sensitive regions in the superior temporal sulcus.
Neuropsychologia 47:3059–3066.
McGurk H, MacDonald J (1976) Hearing lips and seeing voices.
Nature 264:746–748.
Morris JS, Frith CD, Perrett DI, Rowland D, Young AW, Calder AJ,
Dolan RJ (1996) A differential neural response in the human
amygdala to fearful and happy facial expressions. Nature
383:812–815.
Morris JS, Scott SK, Dolan RJ (1999) Saying it with feeling: neural
responses to emotional vocalizations. Neuropsychologia
37:1155–1163.
Noesselt T, Driver J, Heinze HJ, Dolan R (2005) Asymmetrical
activation in the human brain during processing of fearful faces.
Curr Biol 15:424–429.
Phillips ML, Young AW, Scott SK, Calder AJ, Andrew C, Giampietro
V, Williams SCR, Bullmore ET, Brammer M, Gray JA (1998)
Neural responses to facial and vocal expressions of fear and
disgust. Proc R Soc London Ser B 265:1809–1817.
Pourtois G, de Gelder B, Vroomen J, Rossion B, Crommelinck M
(2000) The time-course of intermodal binding between seeing and
hearing affective information. Neuroreport 11:1329–1333.
Pourtois G, de Gelder B, Bol A, Crommelinck M (2005) Perception of
facial expressions and voices and of their combination in the
human brain. Cortex 41:49–59.
Roebroeck A, Formisano E, Goebel R (2005) Mapping directed
influence over the brain using Granger causality and fMRI.
Neuroimage 25:230–242.
Ross LA, Saint-Amour D, Leavitt VM, Javitt DC, Foxe JJ (2007) Do
you see what i am saying? Exploring visual enhancement of
speech comprehension in noisy environments. Cereb Cortex
17:1147–1153.
Rossion B, Joyce CA, Cottrell GW, Tarr MJ (2003) Early lateralization
and orientation tuning for face, word, and object processing in the
visual cortex. Neuroimage 20:1609–1624.
Scherer KR (2003) Vocal communication of emotion: a review of
research paradigms. Speech Comm 40:227–256.
Scherer KR, Banse R, Wallbott HG (2001) Emotion inferences from
vocal expression correlate across languages and cultures. J
Cross-Cult Psychol 32:76–92.
Schwartz JL, Berthommier F, Savariaux C (2004) Seeing to hear
better: evidence for early audio–visual interactions in speech
identification. Cognition 93:B69–B78.
Sekiyama K, Kanno I, Miura S, Sugita Y (2003) Auditory-visual
speech perception examined by fMRI and PET. Neurosci Res
47:277–287.
Skipper JI, van Wassenhove V, Nusbaum HC, Small SL (2007)
Hearing lips and seeing voices: how cortical areas supporting
speech production mediate audiovisual speech perception. Cereb
Cortex 17:2387–2399.
Sridharan D, Levitin DJ, Menon V (2008) A critical role for the right
fronto-insular cortex in switching between central-executive and
default-mode networks. Proc Natl Acad Sci USA
105:12569–12574.
Stephan KE, Roebroeck A (2012) A short history of causal modeling
of fMRI data. Neuroimage 62:856–863.
Sumby WH, Pollack I (1954) Visual contribution to speech
intelligibility in noise. J Acoust Soc Am 26:212–215.

H. Jansma et al. / Neuroscience 256 (2014) 230–241 241
Szycik GR, Tausche P, Munte TF (2008) A novel approach to study
audiovisual integration in speech perception: localizer fMRI and
sparse sampling. Brain Res 1220:142–149.
Szycik GR, Jansma H, Munte TF (2009) Audiovisual integration
during speech comprehension: an fMRI study comparing ROI-
based and whole brain analyses. Hum Brain Mapp
30:1990–1999.
Szycik GR, Stadler J, Tempelmann C, Munte TF (2012) Examining
the McGurk illusion using high-field 7 Tesla functional MRI. Front
Hum Neurosci 6:95.
Talairach J, Tournoux P (1988) Co-planar stereotaxic atlas of the
human brain. New York: Thieme Medical Publisher Inc..
Valdes-Sosa PA, Roebroeck A, Daunizeau J, Friston K (2011)
Effective connectivity: influence, causality and biophysical
modeling. Neuroimage 58:339–361.
Vo ML, Jacobs AM, Conrad M (2006) Cross-validating the Berlin
affective word list. Behav Res Methods 38:606–609.
von Kriegstein K, Kleinschmidt A, Sterzer P, Giraud AL (2005)
Interaction of face and voice areas during speaker recognition. J
Cogn Neurosci 17:367–376.
Vuilleumier P (2005) How brains beware: neural mechanisms of
emotional attention. Trends Cogn Sci 9:585–594.
Vuilleumier P, Pourtois G (2007) Distributed and interactive brain
mechanisms during emotion face perception: evidence from
functional neuroimaging. Neuropsychologia 45:174–194.
Vuilleumier P, Armony JL, Driver J, Dolan RJ (2001) Effects of
attention and emotion on face processing in the human brain: an
event-related fMRI study. Neuron 30:829–841.
Wager TD, Phan KL, Liberzon I, Taylor SF (2003) Valence, gender,
and lateralization of functional brain anatomy in emotion: a meta-
analysis of findings from neuroimaging. Neuroimage 19:513–531.
Whalen PJ, Shin LM, McInerney SC, Fischer H, Wright CI, Rauch SL
(2001) A functional MRI study of human amygdala responses to
facial expressions of fear versus anger. Emotion 1:70–83.
Williams AC (2002) Facial expression of pain: an evolutionary
account. Behav Brain Sci 25:439–455.
Wright TM, Pelphrey KA, Allison T, McKeown MJ, McCarthy G (2003)
Polysensory interactions along lateral temporal regions evoked by
audiovisual speech. Cereb Cortex 13:1034–1043.
(Accepted 22 October 2013)(Available online 30 October 2013)