A notch structure on the Moho beneath the Eastern San Gabriel Mountains
12
A notch structure on the Moho beneath the Eastern San Gabriel Mountains Zhimei Yan ⁎ , Robert W. Clayton MC252-21, Caltech, Pasadena, CA 91125, United States Received 1 December 2006; received in revised form 7 June 2007; accepted 7 June 2007 Editor: R.D. van der Hilst Available online 16 June 2007 Abstract Synthetic waveform modeling of the anomalous receiver functions for two stations in the eastern San Gabriel Mountains, California, suggests that a flat-topped notch structure exists on the Moho. North of the San Andreas Fault (SAF), the Moho depth is 36–38 km and is 33–35 km south of the San Gabriel Fault (SGF), but in-between under the Mt. Baldy block, it is only ∼ 29 km. The inferred notch structure is also supported by the Pms arrival times along the SCSN and the LARSE I profiles. The shallow Moho block correlates well with the surficial exposure of the lower plate Pelona Schist or where it resides at very shallow depth. The large Moho offsets across the two major faults can be either related to differential uplifting reflected by the difference in the denudation rate and the exposure of the lower plate Pelona Schist, or it can be the result of the juxtaposition of the distinctive terranes with initially different Moho depth due to the strike-slip movements along the two major faults. © 2007 Elsevier B.V. All rights reserved. Keywords: Moho depth; receiver functions; San Andreas Fault; San Gabriel Fault; Pelona Schist; San Gabriel Mountains 1. Introduction Short-wavelength Moho offset, especially across major strike-slip faults, is of particular interest to geophysical studies due to its importance in inferring the coupling relationship between the crust and the upper mantle, and the strength of the lower crust/upper mantle etc. There have been several observations of the depth extension of the faults onto the Moho by seismic reflection and refraction surveys (Lemiszki and Brown, 1988; Doll et al., 1996; Diaconescu et al., 1998), waveform modeling (Zhu and Helmberger, 1998) and receiver function studies (Zhu, 2000; Alinaghi et al., 2003; Kudo and Yamaoka, 2003). The San Andreas Fault (SAF) is the current transform plate boundary between the North American plate and the Pacific plate. Previous reflection and refraction studies in the northern and central California suggest that the SAF penetrates through the whole crust (McBride and Brown, 1986; Henstock et al., 1997; Parsons, 1998). Its penetration depth in Southern California around the San Gabriel Mountains, however, is controversial. Zhu (2000) calculated the receiver functions along the LARSE I (Los Angeles Region Seismic Experiment, phase I) profile and concluded that there is an up to 8 km Moho offset across the San Andreas Fault and Moho shallows from 36–38 km north of the San Andreas Fault to 26–29 km beneath the San Earth and Planetary Science Letters 260 (2007) 570 – 581 www.elsevier.com/locate/epsl ⁎ Corresponding author. E-mail address: [email protected] (Z. Yan). 0012-821X/$ - see front matter © 2007 Elsevier B.V. All rights reserved. doi:10.1016/j.epsl.2007.06.017
-
Upload
independent -
Category
Documents
-
view
0 -
download
0
Transcript of A notch structure on the Moho beneath the Eastern San Gabriel Mountains

tters 260 (2007) 570–581www.elsevier.com/locate/epsl
Earth and Planetary Science Le
A notch structure on the Moho beneath theEastern San Gabriel Mountains
Zhimei Yan ⁎, Robert W. Clayton
MC252-21, Caltech, Pasadena, CA 91125, United States
Received 1 December 2006; received in revised form 7 June 2007; accepted 7 June 2007
Available on
Editor: R.D. van der Hilstline 16 June 2007
Abstract
Synthetic waveform modeling of the anomalous receiver functions for two stations in the eastern San Gabriel Mountains,California, suggests that a flat-topped notch structure exists on the Moho. North of the San Andreas Fault (SAF), the Moho depth is36–38 km and is 33–35 km south of the San Gabriel Fault (SGF), but in-between under the Mt. Baldy block, it is only ∼29 km.The inferred notch structure is also supported by the Pms arrival times along the SCSN and the LARSE I profiles. The shallowMoho block correlates well with the surficial exposure of the lower plate Pelona Schist or where it resides at very shallow depth.The large Moho offsets across the two major faults can be either related to differential uplifting reflected by the difference in thedenudation rate and the exposure of the lower plate Pelona Schist, or it can be the result of the juxtaposition of the distinctiveterranes with initially different Moho depth due to the strike-slip movements along the two major faults.© 2007 Elsevier B.V. All rights reserved.
Keywords: Moho depth; receiver functions; San Andreas Fault; San Gabriel Fault; Pelona Schist; San Gabriel Mountains
1. Introduction
Short-wavelength Moho offset, especially acrossmajor strike-slip faults, is of particular interest togeophysical studies due to its importance in inferringthe coupling relationship between the crust and theupper mantle, and the strength of the lower crust/uppermantle etc. There have been several observations of thedepth extension of the faults onto the Moho by seismicreflection and refraction surveys (Lemiszki and Brown,1988; Doll et al., 1996; Diaconescu et al., 1998),waveform modeling (Zhu and Helmberger, 1998) and
⁎ Corresponding author.E-mail address: [email protected] (Z. Yan).
0012-821X/$ - see front matter © 2007 Elsevier B.V. All rights reserved.doi:10.1016/j.epsl.2007.06.017
receiver function studies (Zhu, 2000; Alinaghi et al.,2003; Kudo and Yamaoka, 2003).
The San Andreas Fault (SAF) is the current transformplate boundary between the North American plate andthe Pacific plate. Previous reflection and refractionstudies in the northern and central California suggestthat the SAF penetrates through the whole crust(McBride and Brown, 1986; Henstock et al., 1997;Parsons, 1998). Its penetration depth in SouthernCalifornia around the San Gabriel Mountains, however,is controversial. Zhu (2000) calculated the receiverfunctions along the LARSE I (Los Angeles RegionSeismic Experiment, phase I) profile and concluded thatthere is an up to 8 km Moho offset across the SanAndreas Fault and Moho shallows from 36–38 km northof the San Andreas Fault to 26–29 km beneath the San

571Z. Yan, R.W. Clayton / Earth and Planetary Science Letters 260 (2007) 570–581
Gabriel Mountains. However, Kohler and Davis (1997)inferred a continuous deep Moho of 40 km centered atthe San Andreas Fault from teleseismic travel timesalong the same profile. A feature that further compli-cates the interpretation is that there are two interfaces inthe LARSE I receiver function image (Zhu, 2000)beneath the San Gabriel Mountains south of the SanAndreas Fault and the author picked the shallower one at25–29 km to be the Moho. Others argue that the deeperone at ∼40 km might be the Moho and thus support thecontinuous deep Moho result of Kohler and Davis(1997). Moho is observed to smoothly deepen from boththe Mojave Desert and the Los Angeles basin to theeastern San Gabriel Mountains from the LARSE Ireflection study (Hafner et al., 1996), but no prominentPmP phase is observed beneath the mountain range.
There are some problems with both the receiverfunction (Zhu, 2000) and the teleseismic travel timestudies (Kohler and Davis, 1997) along the LARSE Iline. For Zhu (2000), two factors might create someartifacts on the image. One is that lateral variations ofthe receiver functions in the direction perpendicular tothe LARSE I line are not considered, yet large differencein the Pms arrival times is observed among the back-azimuthal groups for stations in the SGM (Yan andClayton, 2007). Another problem is that the receiverfunctions with low signal-to-noise ratio, especially thoseof the basin stations, are also included in the image. Thelarge-amplitude multiple reverberations from the basinbasement can generate some artifacts. With the Kohlerand Davis (1997) study, large lateral heterogeneitiesalong the ray-paths, such as the transition from oceanic
Fig. 1. Locations of the SCSN (red triangles) and the LARSE I (red inverted triReceiver function profiles along the two green lines are drawn in Fig. 5. MajoPBF is the Punchbowl Fault.
to continental upper mantle along the coast of NorthAmerica for the SW events and the upper mantle dripstructure beneath the central Transverse Ranges (Hadleyand Kanamori, 1977; Humphreys and Clayton, 1990),could contribute to the observed teleseismic P traveltime delay patterns and it also has the problem of thetrade-off between the crustal thickness and the crustalvelocities. Thus, the Moho depth variation across thissegment of the San Andreas Fault remains unresolvedand the key lies in the Moho depth beneath the SanGabriel Mountains.
The San Gabriel Mountains (SGM) is an east–westtrending range formed from the uplift of the basementrocks along the southwest side of the ‘big bend’ portionof the SAF (Fig. 1). Recent fission track and U–Th/Heanalysis by Blythe et al. (2000) suggest that the highelevations (1.5–3 km) of the SGM are largely upliftedwithin the last 7 Ma, with differential uplift patterns(including rate and timing) for the various fault-boundedblocks.
In order to better resolve the Moho depth beneath theSGM, receiver functions (hereafter referred to as RFs)for the three available SCSN (Southern CaliforniaSeismic Network) broadband stations and the LARSEI passive stations are calculated. Variations of the RFswith back-azimuth and ray parameter for the SCSNstations are investigated. For the LARSE I passivestations, only the northwest (NW) RF group is includeddue to the limited number of good events from otherdirections. The advantage of the receiver functionmethod in constraining lateral Moho depth variationsis described in Zhu (2002). In this work, synthetic RF
angles) stations. Pink crosses are the P-to-S conversion points at 30 km.r faults are marked on the map. VCF denotes Vincent Thrust Fault and
Fig. 2. Radial receiver functions for station TA2 with Pms phasemarked by the dashed lines. Note the large difference in the Pms arrivaltime for the different back-azimuthal groups—approximately 4.6 s forevents from NW, but 3.8–4.0 s for events from SE and SW. Also, notethe prominent later arrivals at∼5.5 s and 6 s for the SE and SW groupsrespectively.
572 Z. Yan, R.W. Clayton / Earth and Planetary Science Letters 260 (2007) 570–581
waveform modeling is used to help constrain the Mohogeometry.
2. Data and analysis
Since the regional Moho depth mapping by Zhu andKanamori (2000), the number of SCSN stations hasbeen nearly tripled and two more stations were installedin the eastern SGM (station BFS and PDU in Fig. 1). Tobetter resolve the Moho depth variation beneath theSGM, back-azimuthal grouped RFs for the threeavailable SCSN stations in the eastern SGM, as wellas the NW group of the LARSE I passive stations areinvestigated. The RFs are calculated from the deconvo-lution of band-pass filtered (0.02–2 Hz) teleseismicwaveform data and both time–domain and frequency–domain deconvolution techniques were used. Details ofdata selection, deconvolution, stacking and uncertaintyestimate are described in Yan and Clayton (2007).
Large variations of the RFs with back-azimuth areobserved at station TA2 (Fig. 2) — Pms arrives at∼4.6 s for events from northwest (NW), but at ∼3.6–3.9 s for events from southeast (SE). This implies aMoho offset of 8–10 km over a lateral distance of lessthan 15 km if the average Vp/Vs ratio is assumed to be∼1.73. Another interesting feature for the RFs at thisstation is the appearance of an additional phase at 5.5 sand 6.0 s for the SE and SW groups respectively. Thisadditional phase has a slightly smaller amplitude thanthat of the Pms and is ∼1.5–2.0 s later than the Pms. Atstation BFS, which is ∼16 km south of TA2, systematicvariations of the RFs with ray parameter are observedfor the NW group — single large-amplitude Pms phaseexists for RFs with small ray parameter (≤0.05), and itbranches into double smaller-amplitude pulses as the rayparameter increases (Fig. 3). The arrival time of thisadditional phase (Pds) decreases systematically with rayparameter.
If the systematic varying time–domain RFs in theNW group of BFS are migrated into the depth–domainusing a constant crustal velocity model, the addition of awedge-shaped lower crustal layer with its upperinterface dipping to the SE will be inferred to the NWof station BFS. Synthetic RFs for such a model (Fig. 4),however, do not fit the data. For station #70 at the tip ofthe wedge, which is inferred to correspond to BFS inlocation, a single Pms phase is consistently observed forall the RFs as a function of ray parameter. This is due tothe negligible amplitude of the P to S converted phasefrom the updip direction (NW) of the dipping interface.The influence of dipping layer on RFs has beendiscussed in several previous studies (Peng and Hump-
hreys, 1997; Savage, 1998) and will not be repeatedhere. RFs for an inner station #58, however, do show thetransition from a single pulse to double pulses as the rayparameter increases. The variation pattern, however, isdifferent from that of the data—no systematic move-outof the Pds phase is observed. This additional Pds phaseis from the conversion across the flat portion of theinserted layer. Another difference between the

Fig. 3. Systematic variations of the RFs with ray parameter for the NW group of BFS and the back-azimuths for them. The RFs are evenly spaced butsorted according to ray parameter. Ray parameter for each trace is labeled on the left and the dashed lines mark the Pms and the additional Pds phase.On the right, back-azimuths for the RFs are shown as plus sign. Note that the low-amplitude Pms phase for ray parameters within the range 0.06–0.065 is probably related to the back-azimuthal variations since they share a slightly larger back-azimuths than others.
573Z. Yan, R.W. Clayton / Earth and Planetary Science Letters 260 (2007) 570–581
synthetics for #58 and the data lies in the RFs from thereverse direction — RFs for the synthetics show twopulses which are from the downdip direction of thedipping interface and the Moho interface respectively,but only a simple single pulse is present in the data.So, this simple structure model from converting thetime–domain RFs to the depth–domain is not able toexplain the data. Discontinuities of major velocity-contrast interfaces, such as Moho, are known to generateadditional phases in the receiver functions due to dif-fraction and scattering (Chen et al., 2005). Thus, thecomplicated variations of the RFs for this group isprobably due to some large lateral variations on theMoho. Back-azimuthal dependence of the RFs at stationTA2 confirms the existence of Moho step in the nearbyarea. More information about the lateral variations inthe crustal structure can be drawn from comparison ofthe Pms arrivals for neighboring station groups.
If the ray parameter corrected stacked RF traces forthe well-aligned back-azimuthal groups of the threeSCSN stations are projected onto a line (refer to Yan andClayton (2007) for details), a decrease in the Pms arrivaltime from groups north of the SAF (two northern groupsof TA2) and possibly south of station BFS (the station
groups for station PDU and the three southern groups ofBFS) to the central groups (two southern station groupsof TA2 and possibly the northern group of BFS) isobserved. This implies a step and possibly a notchstructure. The possible southern boundary of the notchstructure — the northern-most stacking group of BFS isthe group that shows systematic variations with rayparameter in Fig. 3. RFs along the LARSE I line(Fig. 5), which are ∼15 km to the west of the SCSNstations (Fig. 1), confirm the existence of a Moho stepacross the SAF and a possible step beneath thePunchbowl Fault. The Moho shallows from 36–38 km(034–040) north of the SAF and 34–36 km (018–021)south of Punchbowl fault to 32–34 km for stations(027–030) in-between. Interpretation of the RFs forstations 024 and 025 can be controversial due to thelarge difference of their RFs to the nearby ones and thecloseness of these two stations to the major PunchbowlFault, refer to Yan and Clayton (2007) for detail.
In summary, a step and possibly a notch structure isinferred along both the LARSE I and the SCSN profiles.Moho shallows from 36–38 km and 34–36 km north ofSAF and south of the Punchbowl Fault (PF) to a depth of32–34 km for the in-between sliver along the LARSE I

Fig. 4. Synthetic RFs for an inserted-wedge model. Plane waves with varying incident angles corresponding to the regularly spaced ray parameters inthe range of 0.04–0.08 are introduced from the left-bottom corner. Velocity structure is shown on the top, with the location of the two stations (#58,#70) marked by triangles. RFs for the two stations #58 and #70 are shown on the bottom with the primary P-to-S conversion and one multiple markedby the dashed lines.
574 Z. Yan, R.W. Clayton / Earth and Planetary Science Letters 260 (2007) 570–581
profile. A slightly larger Moho offset (from 36–39 km to29–31 km) across the SAF is observed along the SCSNprofile and the possibility of another smaller one isinferred from the obviously earlier arrival of the two SWback-azimuthal groups TA2 than those to the south. Inthe following, synthetic receiver functions for suchmodels are calculated to check whether they are able toexplain the complicated variation patterns in the RFsat TA2 and BFS. For direct comparison with thesynthetics, RFs for the four groups, i.e. NW and SE ofTA2, NWand SE of BFS are binned to regularly-spacedray parameters (Fig. 6).
3. Synthetic RF modeling
Synthetic RFs for a model with a step in the Mohoand another one with a notch are calculated using finitedifference algorithm (Graves, 1996). Plane waves areintroduced at various angles corresponding to theregularly spaced ray parameters (spacing is 0.005) inthe range that matches the data. Synthetic RFs for thetwo cases are shown in Fig. 7. Synthetics for the notchstructure fit the data very well, including the additional
diffraction phase at∼5.5 s for the SE group of station 84(corresponding to TA2-SE), the transition from a singlepulse to double pulses with the increase of the rayparameters for 118-NW (corresponding to BFS-NW),and the simple Pms arrivals for the other two groups.The step structure, however, is not able to explain theray-parameter dependence of the RFs for the NW ofBFS since only a single large-amplitude Pms phase isobserved at all the RFs.
To better constrain the geometry and check thenecessity of the notch structure, three more models withvarious notch structure and one with a vertically insertedhigh velocity block are tested (Fig. 8). Synthetic RFs forboth flat-topped notch geometries fit the data reasonablywell, particularly with the prominent Pms phase and theslightly smaller-amplitude later diffraction phase forTA2-SE the branching out of the Pds from Pms withthe increase of ray parameter for BFS-NW and thesimple single Pms phases for TA2-NW and BFS-SE.Synthetics for the smoothly curved notch and the step-wedge structure, however, do not fit the data. Only asingle Pms phase is observed for the station groupcorresponding to BFS-NW for the step-wedge model,

Fig. 5. RF cross-sections along the two green lines in Fig. 1 and two representative stacking groups for the LARSE I data. Note the difference in thehorizontal distance scales. Projected locations of the SAF and Punchbowl Fault (PF) are marked by the arrows. The fat Pms phase at ∼28 km on thetop profile is the average result of the ray-parameter dependent receiver function group shown in Fig. 3. Also note the slightly shallow Moho for thetwo SW back-azimuthal groups of TA2 at∼35 km. Complications in the RFs for stations 033 and 034 along the LARSE I profile are probably due tocomplications from the SAF. The picked Pms and PpPms arrivals are marked on the RFs for the two stations (#021 and #024).
575Z. Yan, R.W. Clayton / Earth and Planetary Science Letters 260 (2007) 570–581
i.e. no Pds branch is observed. For the smoothly curvednotch structure, the amplitude of the Pds phase is toolow. Another mismatch for this group is the disappear-ance of the Pms phase at 0.075 for the synthetics. Thus,a flat-topped notch structure seems to be required inorder to fit the data.
Even though there are some minor differences in thesynthetics for the three preferred models, the differencesare not significant enough to distinguish among them.The synthetics do rule out a smooth notch structure anda step-wedge geometry. The exclusion of the step-wedge model indicates that lateral velocity variationalone is not able to explain the data and a Moho offsetto the south of station BFS is required. In sum-mary, synthetic receiver function waveform modelingsuggests that a notch structure is required on the Moho
in order to explain the complicated patterns observed inthe data, and that a sharp-edge flat-topped notch ispreferred compared with a smooth one.
4. Discussion
The common practice of estimating Moho depthfrom receiver functions is to assume a locally homoge-neous velocity structure and use the [H, κ] domain gridsearch stacking algorithm (Zhu and Kanamori, 2000) tofind the [H, κ] that makes the three phases stacked mostcoherently. One requirement for the stacking is thatlateral velocity variation within the span of Mohopiercing points of the PpPms phase to the station aresmall and that the RFs within each group are similar toeach other. In this study, systematic variations of the RFs

Fig. 6. Summary of the receiver functions for the NW and SE groups of TA2 and BFS. RFs for the four groups are binned to regularly spacedneighboring ray parameters for the purpose of direct comparison with the synthetics. Exception is the SE group of station BFS, here all the RFs areincluded in each bin due to the small number of available receiver functions.
576 Z. Yan, R.W. Clayton / Earth and Planetary Science Letters 260 (2007) 570–581
with back-azimuth and ray parameter are observed andinvestigated. With the aid of synthetic RF waveformmodeling, short-wavelength Moho depth variationsacross the major strike-slip faults are revealed. A simplemodel with a flat-topped notch structure on the Moho isable to generate synthetics that fit the complicated RFsfor the four station groups. Further modeling suggeststhat lateral velocity variation alone for the southernboundary is not able to explain the data and that a sharp-edge flat-topped notch structure fits the data the best.Due to the limitations of the data (the sparse stationspacing, only 2 stations and the quality of the data),exact horizontal locations of the two bounding faultsand the vertical offsets along them are not very wellresolved. The surface exposures of the two faults are±2.0 km away from the two stations. The offsets alongthe two faults might have some trade-offs with theVp/Vs ratio of the different blocks.
The two boundaries of the shallow Moho block alignvery well with the depth extension of the SAF on thenorth and the SGF on the south (Fig. 9). Geologically,the shallow Moho block correlates with the surficialexposure of the lower plate Pelona schist or where itresides at very shallow depth (profile B of Fig. 5 inDibblee, 1982). The Pelona Schist is a Late Cretaceous–Early Tertiary (60–70 Ma) well-foliated, greenschist-facies, metamorphic rock (Ehlig, 1968). It consists ofoceanic rocks that were metamorphosed in response todeep burial during the Laramide flat subduction of theFarallon plate beneath the North American plate (Ehlig,
1981; Malin et al., 1995; Jacobson et al., 1996; Saleeby,2003), and was subsequently uplifted, deeply eroded,and was brought to the surface or just below the surfaceduring middle Tertiary extension (Jacobson et al., 1996).Thus, one explanation for the Moho offsets across thesetwo major faults is that it is caused by differential upliftof the whole crust. Blythe et al. (2000) recently studiedthe erosion rate for the San Gabriel and San BernardinoMountains from apatite fission-track and (U–Th)/Heanalysis and suggest that distinct variations in the totalamounts and rates of cooling exist between the differentfault-bounded blocks within the SGM and that the Mt.Baldy block (the block which we inferred to have theshallow Moho) has the highest denudation rate, whichcan be interpreted as having the highest uplift rate. Thenearly flat mid-crustal interfaces beneath the threeSCSN stations, however, would tend to argue againstthe whole crustal differential uplifting. Since thedifferent terranes have distinctive evolution histories(Ehlig, 1981), it is possible that the observed mid-crustalinterfaces beneath the three SCSN stations havedifferent origin and formation age, and thus they haveno correlation with each other and do not conflict withthe differential uplifting hypothesis.
Another possible mechanism is that the Moho offsetis due to the ∼300 km strike-slip movements along theSAF and ∼60 km along the SGF (Ehlig, 1981), whichjuxtapose distinctive blocks with initially differentMoho depth due to the strike-slip movements. Geo-chemical studies (Ehlig, 1981) indicate that the blocks

Fig. 7. Synthetic RFs of two stations (118 and 84), corresponding to station TA2 and BFS in location, for two models with Moho offsets inside (shown on the left). RFs for the notch structure are shownon the topright. The four columns correspond TA2-NW, TA2-SE, BFS-SE, BFS-NW respectively and will be shown this way for all the following plots. RFs for the step structure are shown on thebottom. Note the similarity of the synthetic RFs for the notch structure with the data in Fig. 6, especially the move-out pattern of the Pds phase for 84-NW (BFS-NW). The Pds phase is absent in thecorresponding station group for the step structure.
577Z.Yan,
R.W.Clayton
/Earth
andPlanetary
ScienceLetters
260(2007)
570–581

Fig. 8. Synthetic RFs for four more velocity models to help constrain the Moho geometry. The models are shown on the left and they are notchbounded by steep normal faults (notcha), notch bounded by steep reverse faults (notchb), smoothly curved notch (notchc), and step with verticallyinserted high velocity block (step wedge) from top to bottom. Synthetic receiver functions for each model are shown on the right and they are plottedin the same sequence as the data (Fig. 6).
578 Z. Yan, R.W. Clayton / Earth and Planetary Science Letters 260 (2007) 570–581
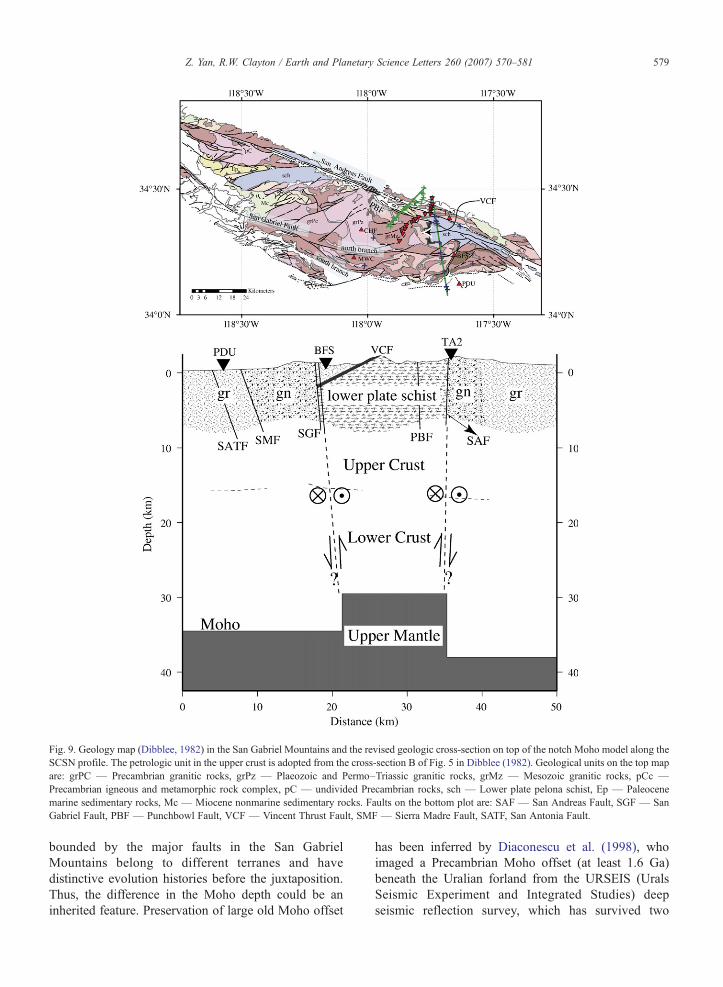
Fig. 9. Geology map (Dibblee, 1982) in the San Gabriel Mountains and the revised geologic cross-section on top of the notch Moho model along theSCSN profile. The petrologic unit in the upper crust is adopted from the cross-section B of Fig. 5 in Dibblee (1982). Geological units on the top mapare: grPC — Precambrian granitic rocks, grPz — Plaeozoic and Permo–Triassic granitic rocks, grMz — Mesozoic granitic rocks, pCc —Precambrian igneous and metamorphic rock complex, pC — undivided Precambrian rocks, sch — Lower plate pelona schist, Ep — Paleocenemarine sedimentary rocks, Mc — Miocene nonmarine sedimentary rocks. Faults on the bottom plot are: SAF — San Andreas Fault, SGF — SanGabriel Fault, PBF — Punchbowl Fault, VCF — Vincent Thrust Fault, SMF — Sierra Madre Fault, SATF, San Antonia Fault.
579Z. Yan, R.W. Clayton / Earth and Planetary Science Letters 260 (2007) 570–581
bounded by the major faults in the San GabrielMountains belong to different terranes and havedistinctive evolution histories before the juxtaposition.Thus, the difference in the Moho depth could be aninherited feature. Preservation of large old Moho offset
has been inferred by Diaconescu et al. (1998), whoimaged a Precambrian Moho offset (at least 1.6 Ga)beneath the Uralian forland from the URSEIS (UralsSeismic Experiment and Integrated Studies) deepseismic reflection survey, which has survived two

580 Z. Yan, R.W. Clayton / Earth and Planetary Science Letters 260 (2007) 570–581
major subsequent orogenies. Thus, both hypothesis areviable in explaining the apparent Moho offsets acrossthe two major faults.
The clear RFs obtained for the LARSE I stations andtheir consistency with the SCSN stations indicate that alocal deep Moho of 35–37 km does exist in the westernSGM, which corresponds to the deeper interface inFig. 3 of Zhu (2000) at horizontal distance ranges of−18 to −10 km, it then shallows slightly to ∼33–35 kmto the north across the Punchbowl fault and deepens to36–38 km further north across the San Andreas Fault. Anarrow notch structure with slightly smaller Mohooffsets is thus inferred along the LARSE I profile.
5. Conclusions
Synthetic waveform modeling of the back-azimuthaland ray-parameter dependent receiver functions for twostations suggests that a notch structure exists on theMoho in the eastern San Gabriel Mountains, wherethe Moho shallows from ∼36–38 km north of the SAF,34–36 km south of the SGF to ∼29 km beneath the in-between Mt. Baldy block. The transition from the deepMoho of the two sides to the shallow Moho is relativelysharp and a flat-topped notch structure is preferred. TheMoho offset across the two major faults could be eitherrelated to the differential uplifting of the various blocksor is the result of the juxtaposition of distinctive blockswith initially different Moho depth from the strike-slipmovements along the major faults.
Acknowledgments
We thank the Southern California Seismic Networkand the Southern California Earthquake Data Center forproviding the network data, and the IRIS data center andMonica Kohler for providing the LARSE data. Thisresearch is partially supported by USGS Contract04HQAG0010.
References
Alinaghi, A., Bock, G., Kind, R., Hanka, W., Wylegalla, K., 2003.Receiver function analysis of the crust and upper mantle from theNorth German Basin to the Archaean Baltic Shield. Geophys.J. Int. 155, 641–652.
Blythe, A.E., Burbank, D.W., Farley, K.A., Fielding, E.J., 2000.Structural and topographic evolution of the central TransverseRanges, California, from apatite fission-track, (U–Th)/He anddigital elevation model analyses. Basin Res. 12, 97–114.
Chen, L., Wen, L.X., Zheng, T.Y., 2005. A wave equation migrationmethod for receiver function imaging: 1. Theory. J. Geophys. Res.110, B11309. doi:10.1029/2005JB003665.
Diaconescu, C.C., Knapp, J.H., Brown, L.D., Steer, D.N., Stiller, M.,1998. Precambrian Moho offset and tectonic stability of the EastEuropean platform from the URSEIS deep seismic profile.Geology 26, 211–214.
Dibblee, T.W., 1982. Geology of the San Gabriel Mountains, SouthernCalifornia. In: Fife, D.L., Minch, J.A. (Eds.), Geology and MineralWealth of the California Transverse Ranges, South CoastGeological Society, Santa Ana, vol. 10, pp. 131–147.
Doll, W.E., Domoracki, W.J., Costain, J.K., Coruh, C., Ludman, A.,Hopeck, J.T., 1996. Seismic reflection evidence for the evolutionof a transcurrent fault system: The Norumbega Fault Zone, Maine.Geology 24, 251–254.
Ehlig, P.L., 1968. Causes of distribution of the Pelona, Rand, andOrocopia Schists along the San Andreas and Garlock Faults.In: Dickinson, W.R., Grantz, W. (Eds.), Proceedings of theConference on Geologic Problems of San Andreas Fault System,pp. 294–305.
Ehlig, P.L., 1981. Origin and Tectonic history of the basement terraneof the San Gabriel Mountains, Central Transverse Ranges. In:Ernst, W.G. (Ed.), The Geotectonic Development of California,Rubey, vol. I. Prentice - Hall, Englewood Cliffs, New Jersey,pp. 253–283.
Graves, R.W., 1996. Simulating seismic wave propagation in 3-Delastic media using staggered-grid finite differences. Bull. Seismol.Soc. Am. 86, 1091–1106.
Hadley, D., Kanamori, H., 1977. Seismic structure of transverseranges, California. Geol. Soc. Amer. Bull. 88, 1469–1478.
Hafner, K., Clayton, R.W., Hauksson, E., 1996. Mid and lower-crustalstructure beneath the San Gabriel Mountains, CA (LARSE). EosTrans. AGU Fall Meet. Suppl. 77, F738.
Henstock, T.J., Levander, A., Hole, J.A., 1997. Deformation in thelower crust of the San Andreas fault system in northern California.Science 278, 650–653.
Humphreys, E.D., Clayton, R.W., 1990. Tomographic image of theSouthern California Mantle. J. Geophys. Res. and Planets 95,19,725–19,746.
Jacobson, E.E., Oyarzabal, F.R., Haxel, G.B., 1996. Subduction andexhumation of the Pelona–Orocopia–Rand Schists, southernCalifornia. Geology 24, 547–550.
Kohler, M.D., Davis, P.M., 1997. Crustal thickness variations inSouthern California from Los Angeles Region Seismic ExperimentPassive Phase Teleseismic Travel Times. Bull. Seismol. Soc. Am.87, 1330–1344.
Kudo, T., Yamaoka, K., 2003. Pull-down basin in the central part ofJapan due to subduction-induced mantle flow. Tectonophysics 367,203–217.
Lemiszki, P.J., Brown, L.D., 1988. Variable crustal structure of strike-slip-fault zones as observed on deep seismic-reflection profiles.Geol. Soc. Amer. Bull. 100, 665–676.
Malin, P.E., Goodman, E.D., Henyey, T.L., Li, Y.G., Okaya, D.A.,Saleeby, J.B., 1995. Significance of seismic reflections beneath atilted exposure of deep continental-crust, Tehachapi Mountains,California. J. Geophys. Res. 100, 2069–2087.
McBride, J.H., Brown, L.D., 1986. Reanalysis of the Cocorp DeepSeismic — reflection profile across the San-Andreas Fault,Parkfield, California. Bull. Seismol. Soc. Am. 76, 1668–1686.
Parsons, T., 1998. Seismic-reflection evidence that the Hayward faultextends into the lower crust of the San Francisco Bay area,California. Bull. Seismol. Soc. Am. 88, 1212–1223.
Peng, X.H., Humphreys, E.D., 1997. Moho dip and crustal anisotropyin Northwestern Nevada from teleseismic receiver functions. Bull.Seismol. Soc. Am. 87, 745–754.

581Z. Yan, R.W. Clayton / Earth and Planetary Science Letters 260 (2007) 570–581
Saleeby, J., 2003. Segmentation of the Laramide slab-evidence fromthe southern Sierra Nevada Region. Geol. Soc. Amer. Bull. 115,655–668.
Savage, M.K., 1998. Lower crustal anisotropy or dipping boundaries?Effects on receiver functions and a case study in New Zealand.J. Geophys. Res. 103, 15,069–15,087.
Yan, Z.M., Clayton, R.W., 2007. Regional mapping of the crustalstructure in Southern California from receiver functions.J. Geophys. Res. 112, B05311. doi:10.1029/2006JB004622.
Zhu, L.P., 2000. Crustal structure across the San Andreas Fault,Southern California from teleseismic converted waves. EarthPlanet. Sci. Lett. 179, 183–190.
Zhu, L.P., 2002. Deformation in the lower crust and downward extentof the San Andreas Fault as revealed by teleseismic waveforms.Earth Planets and Space 54, 1005–1010.
Zhu, L.P., Helmberger, D.V., 1998. Moho offset across the northernmargin of the Tibetan Plateau. Science 281, 1170–1172.
Zhu, L.P., Kanamori, H., 2000. Moho depth variation in SouthernCalifornia from teleseismic receiver functions. J. Geophys. Res.105, 2969–2980.