A new test method to determine the relative drying capacity of building envelope panels of various...
13
Building and Environment 43 (2008) 2203–2215 A new test method to determine the relative drying capacity of building envelope panels of various configurations Arslan Alturkistani a, , Paul Fazio b , Jiwu Rao c , Qian Mao d a Building Envelope Performance Laboratory, Department of Building, Civil and Environmental Engineering, Concordia University, EV-6.214, 1455 de Maisonneuve Blvd. West, Montre´al, Que., Canada H3G 1M8 b Building Envelope Performance Laboratory, Department of Building, Civil and Environmental Engineering, Concordia University, EV-6.411, 1455 de Maisonneuve Blvd. West, Montre´al, Que., Canada H3G 1M8 c Building Envelope Performance Laboratory, Department of Building, Civil and Environmental Engineering, Concordia University, EV-6.139, 1455 de Maisonneuve Blvd. West, Montre´al, Que., Canada H3G 1M8 d Building Envelope Performance Laboratory, Department of Building, Civil and Environmental Engineering, Concordia University, EV-S3.306, 1455 de Maisonneuve Blvd. West, Montre´al, Que., Canada H3G 1M8 Received 14 August 2007; received in revised form 9 January 2008; accepted 9 January 2008 Abstract In the context of a collaborative research project with industry and government, a two-story test hut, consisting of thirty-one 2438 mm (8 ft) high and 762 mm (2 1 2 ft) wide wall assemblies and installed with 25 gravimetric samples in each assembly to monitor the moisture content change, was designed and erected within a large-scale test chamber to investigate the drying capacity of different envelope configurations. The test was performed under steady-state climatic loadings representing wet seasons. Uniform moisture loading was achieved by the use of water trays on load cells placed on the bottom plate within the stud cavities of the wall assemblies. This method submits the different wall configurations to wetting by evaporation and drying by evacuating moisture out of the stud cavity. In search for an indicator or yardstick of the relative drying capacity of different wall configurations, a new calculation method by mapping was developed. The method estimates the amounts of moisture absorbed by components surrounding the stud cavity. The moisture transported out of the cavity is the difference between the total water evaporated from the tray and the water absorbed by the wall components. The ratio between the water evaporated and the vapor evacuated is an indicator of the drying capacity of a given wall configuration in relation to others subjected to a predetermined set of conditions. r 2008 Elsevier Ltd. All rights reserved. Keywords: Building envelope performance; Large-scale experiment; Moisture mapping; Drying capacity; Gravimetric samples 1. Introduction Recent practice and limited means for designers to predict the performance of their building envelope design have led to premature failures such as those in Vancouver [1], Seattle, and New Zealand, where climatic wet condi- tions exist. This paper presents a new test method, which evaluates the relative performance of different building envelope systems subjected to climatic loads. Once the performance of these systems is measured and compared, the design process can be moved from a thumb rule approach to an engineering approach. For a building envelope to avoid moisture damage, it must have four characteristics or the four D’s, which are deflection, drainage, drying, and durability [2]. Drying, in this paper, refers to the water or moisture that passes through the first two lines of defense and enters the stud cavity, which must then be removed through evaporation and diffusion. Focus of this study is placed on the evaporation and diffusion of moisture in the stud cavity, which are good indicators of the drying performance of the building envelope system. In the literature, many researchers studied the drying mechanisms of building envelopes, or of parts of them, by ARTICLE IN PRESS www.elsevier.com/locate/buildenv 0360-1323/$ - see front matter r 2008 Elsevier Ltd. All rights reserved. doi:10.1016/j.buildenv.2008.01.008 Corresponding author. Tel.: +1 514 848 2424x7143; fax: +1 514 848 7965. E-mail addresses: [email protected] (A. Alturkistani), [email protected] (P. Fazio).
-
Upload
independent -
Category
Documents
-
view
4 -
download
0
Transcript of A new test method to determine the relative drying capacity of building envelope panels of various...
ARTICLE IN PRESS
0360-1323/$ - se
doi:10.1016/j.bu
�Correspondfax: +1514 848
E-mail addr
Building and Environment 43 (2008) 2203–2215
www.elsevier.com/locate/buildenv
A new test method to determine the relative drying capacity of buildingenvelope panels of various configurations
Arslan Alturkistania,�, Paul Faziob, Jiwu Raoc, Qian Maod
aBuilding Envelope Performance Laboratory, Department of Building, Civil and Environmental Engineering, Concordia University,
EV-6.214, 1455 de Maisonneuve Blvd. West, Montreal, Que., Canada H3G 1M8bBuilding Envelope Performance Laboratory, Department of Building, Civil and Environmental Engineering, Concordia University,
EV-6.411, 1455 de Maisonneuve Blvd. West, Montreal, Que., Canada H3G 1M8cBuilding Envelope Performance Laboratory, Department of Building, Civil and Environmental Engineering, Concordia University,
EV-6.139, 1455 de Maisonneuve Blvd. West, Montreal, Que., Canada H3G 1M8dBuilding Envelope Performance Laboratory, Department of Building, Civil and Environmental Engineering, Concordia University,
EV-S3.306, 1455 de Maisonneuve Blvd. West, Montreal, Que., Canada H3G 1M8
Received 14 August 2007; received in revised form 9 January 2008; accepted 9 January 2008
Abstract
In the context of a collaborative research project with industry and government, a two-story test hut, consisting of thirty-one 2438mm
(8 ft) high and 762mm (212ft) wide wall assemblies and installed with 25 gravimetric samples in each assembly to monitor the moisture
content change, was designed and erected within a large-scale test chamber to investigate the drying capacity of different envelope
configurations. The test was performed under steady-state climatic loadings representing wet seasons. Uniform moisture loading was
achieved by the use of water trays on load cells placed on the bottom plate within the stud cavities of the wall assemblies. This method
submits the different wall configurations to wetting by evaporation and drying by evacuating moisture out of the stud cavity. In search
for an indicator or yardstick of the relative drying capacity of different wall configurations, a new calculation method by mapping was
developed. The method estimates the amounts of moisture absorbed by components surrounding the stud cavity. The moisture
transported out of the cavity is the difference between the total water evaporated from the tray and the water absorbed by the wall
components. The ratio between the water evaporated and the vapor evacuated is an indicator of the drying capacity of a given wall
configuration in relation to others subjected to a predetermined set of conditions.
r 2008 Elsevier Ltd. All rights reserved.
Keywords: Building envelope performance; Large-scale experiment; Moisture mapping; Drying capacity; Gravimetric samples
1. Introduction
Recent practice and limited means for designers topredict the performance of their building envelope designhave led to premature failures such as those in Vancouver[1], Seattle, and New Zealand, where climatic wet condi-tions exist. This paper presents a new test method, whichevaluates the relative performance of different buildingenvelope systems subjected to climatic loads. Once the
e front matter r 2008 Elsevier Ltd. All rights reserved.
ildenv.2008.01.008
ing author. Tel.: +1514 848 2424x7143;
7965.
esses: [email protected] (A. Alturkistani),
ncordia.ca (P. Fazio).
performance of these systems is measured and compared,the design process can be moved from a thumb ruleapproach to an engineering approach.For a building envelope to avoid moisture damage, it must
have four characteristics or the four D’s, which are deflection,drainage, drying, and durability [2]. Drying, in this paper,refers to the water or moisture that passes through the firsttwo lines of defense and enters the stud cavity, which mustthen be removed through evaporation and diffusion. Focus ofthis study is placed on the evaporation and diffusion ofmoisture in the stud cavity, which are good indicators of thedrying performance of the building envelope system.In the literature, many researchers studied the drying
mechanisms of building envelopes, or of parts of them, by
ARTICLE IN PRESSA. Alturkistani et al. / Building and Environment 43 (2008) 2203–22152204
monitoring the drying of specific components. Maref et al.[3] monitored the change and the rate of change in the totalmoisture content (MC) of critical wall assembly compo-nents (oriented strand board (OSB) sheathing). The MC ofthe components was monitored on a continuous basisduring the stabilization phase to insure that the desired MCwas reached prior to starting the test. The weight loss overtime in the OSB affixed to wood frame wall was determinedby continuous monitoring of weight changes of the full-scale wall assemblies.
In the EDRA (envelope drying rates analysis) test [4], 12fully constructed, instrumented, and cladded panels weretested for 1500 hours in phase 1 and for 2000 hours inphase 2 (with cycle of solar radiation) under steady-stateconditions in a chamber constructed inside the laboratory.The interior of the chamber was conditioned to 5 1C (41 1F)and 70% RH to simulate the outdoor conditions from thewinter climate of Vancouver, and the exterior of thechamber (the lab space) was conditioned to 20 1C (68 1F)and 40% RH to simulate the interior conditions. The barepanels with exterior wythes were weighed before immersionin water for the dry weight and then, after immersion, whilethe inner wythes components of the wall panels wereweighed separately. At the end of the test period, the panelswere removed from the test chamber and immediatelyweighed. Panels were then disassembled and the barepanels were weighed again as well as the inner wythescomponents. During the test, each panel was connected tothe data acquisition system (DAS) for continuous mea-surement to: one load cell, up to 22 MC points, up to 12temperature points, and up to 2 relative humidity points.Electronic measurements were taken every 15min.
In their one-dimensional test method, Ojanen et al. [5]monitored the moisture drying through the outer layers ofthe building envelope. During the measuring period, thewhole installation frame of each structural section, includ-ing the enclosing water vessel in the warm side, wasweighed along with the initially added water. The measuredmoisture flux (kg/s �m2) represents the drying efficiency ofdifferent configurations. In a series of experiments con-ducted by Schumacher et al. to demonstrate the contribu-tion to drying of vertical ventilation in an idealized wallsystem [6], the weight change of the test wall panel duringthe wetting and drying process was measured using acounterbalance weighing system. The MC change was alsomonitored electronically in five locations in the sheathing.Teasdale-St-Hilaire et al. [7–9] measured MCs by usingelectrical resistance moisture probes in the studs, in thebottom plate, and in the sheathing. MCs in the sheathingand in the wood framing were also monitored usinggravimetric samples (with small material cut outs beingweighed periodically).
In the above experimental studies, it is difficult toprovide the wall specimens with constant initial moistureconditions in the wet components if the components or theentire walls were pre-wet by immersion; nor is it easy tomaintain consistent wetting patterns in the walls if water is
added by water injection during testing, hence repeatabilityis not assured. In addition, the former, ‘‘pre-wet’’ methodmay not provide sufficient moisture loads in walls torecreate the scenarios of full wetting and drying processes;also, the injection method is hampered by water leaking atthe bottom. The lack of the needed consistency inproviding the wetting load makes it difficult to comparethe performance among the walls tested and even harder toget repeatability from the tests. To establish a commonyardstick to compare the relative drying characteristics ofdifferent wall systems, a test method must provide uniforminitial conditions and repeatable results.
2. Introduction of DEI (drying by evaporation index)
2.1. Drying mechanism
The capacity to evacuate moisture is one of thecharacteristics required to ensure the durability of thebuilding envelope. The envelope system with the greatercapacity to evacuate moisture in the stud cavity will have agreater drying capacity and be less susceptible to moisturedriven damages. Drying occurs by drainage, by capillaryaction (redistribution of moisture within the adjacentmaterials), and by evaporation followed by diffusionthrough surrounding materials, and by transport throughair leakage. Water from a concentrated source such ascould be found at the bottom plate will evaporate. Part ofit will be absorbed by the surrounding components andpart will escape to the exterior by diffusion or through airleakage.In this experiment, the performance of an assembly is
reflected in the evaporation rate of the moisture source,which can be related to the ‘‘building envelope dryingcapacity’’ of the assembly. This capacity is a measure of therate of movement of the moisture out of the stud cavity andit can serve as a common yard-stick to evaluate the relativeperformance of different wall configurations [10].
2.2. DEI and drying capacity
Drying by evaporation index or ‘‘DEI’’ is the measure ofthe rate of moisture movement out of the stud cavity, and itis a function of moisture evaporation inside the cavity andmoisture evacuation out of the cavity. This index will varyaccording to the specific wall configuration and accordingto the climatic load applied. The main factors that affectthe DEI are outside temperature, inside temperature,outside relative humidity, inside relative humidity, pressuredifference across the envelope, and initial MC distributedwithin the wall components. Construction variables willalso affect the index. Notably, these include the air leakageof the construction, deficiencies, holes, straightness, etc. Infact, any of the parameters of the building envelopecomponents will have an influence on the index. By holdingsome of these parameters constant and varying others, therelative impact of each parameter can be established, and
ARTICLE IN PRESSA. Alturkistani et al. / Building and Environment 43 (2008) 2203–2215 2205
thus, this measure can serve as a comparative indicatorbetween different envelope system configurations [11].
On the other hand, drying capacity or drying potentialcan be identified as the capacity of a building envelope toevacuate moisture out of the stud cavity, where the dryingcapacity can be quantified using the DEI as a tool. Thus,the drying capacity could be a quantitative measure ofmoisture evacuation out of the building envelope under apredetermined set of conditions.
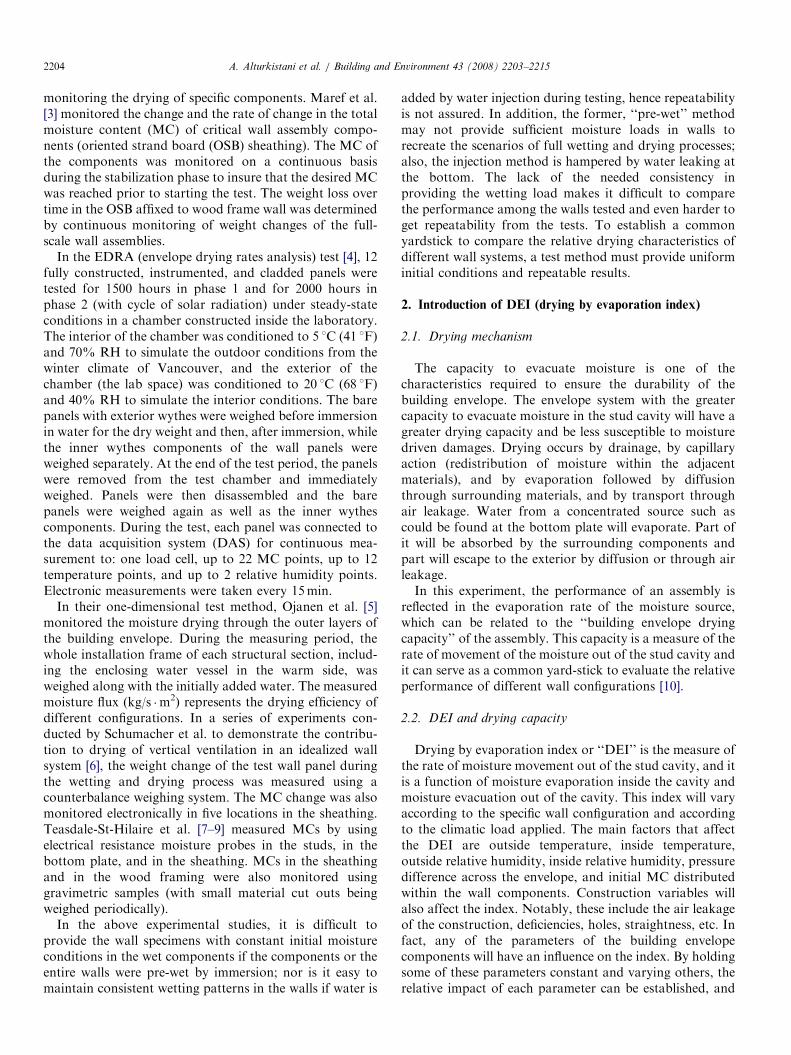
Table 1
Loading conditions of test periods 1 and 2
Test periods Climatic loading Moisture loading
#1 8 1C, 76% RH
#2 8 1C, 76% RH
3. Experimental considerations and test setup
3.1. Loading conditions
A set of building envelope systems have been tested toexperimentally analyze and compare their drying capacitiesunder certain conditions. For this test, the variables studiedwere the different wall configurations keeping the otherconditions the same for all assemblies for the duration ofthe experiment. These conditions were the climatic loadingand the moisture loading. For the climatic loading, steady-state conditions are often used in experimental studies [3–5]to better understand the effect of other parameters;understanding the behavior of systems under static loadsbefore moving to dynamic loads is a common practice inengineering investigation. October weather conditions of8 1C and 76% RH were selected as the exterior loadingconditions for the city of Montreal for period 1 and period2 in the experiment. These were determined to be theconditions with the worse drying potential according to ananalysis carried out on a set of 31-year weather data [12]obtained from Environment Canada and collected atMontreal’s Pierre Elliott Trudeau International Airport.For the interior conditions, the temperature was set at21 1C, and the relative humidity at 35%.
A water tray on a load cell is set on the bottom plate ofthe stud cavity (Fig. 1) [13] to represent the moisture-loading source where rain penetration would tend toconcentrate. The load cell monitors the water thatevaporates on a continuous basis. This water tray providesa uniform, measurable, and repeatable moisture loading
Water
Fig. 1. Moisture source in the stud cavity p
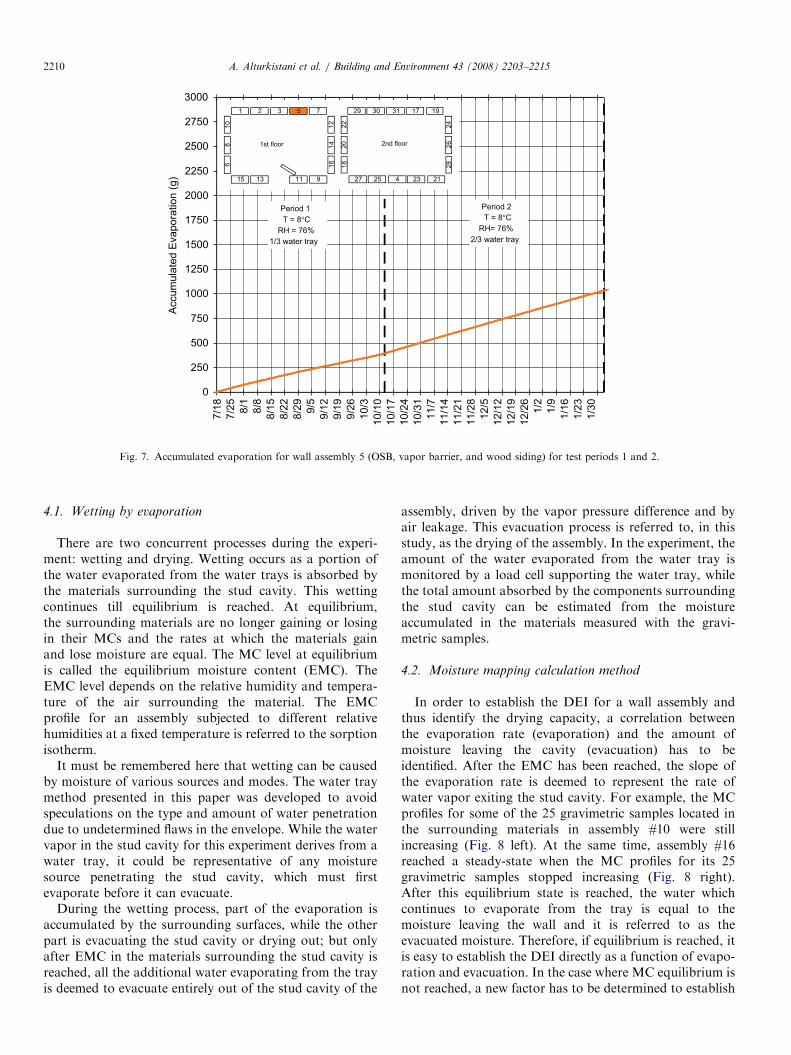
for the wall panels; it is not intended to simulate anyparticular pattern and condition of water penetration intothe wall cavity or to mimic the exact ‘‘real life’’ condition.It is intended to replicate the drying process by evapora-tion, which would occur in a wetted stud cavity, in auniform manner across a series of wall systems of differentconfigurations. The total amount of water evaporatedincludes the moisture increase in the stud cavity, themoisture absorbed by different materials surrounding thestud cavity, and the water vapor leaving the stud cavity toeither the indoor or outdoor environment [10].In test period 1, the water was added in the first
compartment in the tray and occupied 1/3 of the totalsurface area of the water tray. To increase the moistureload in the stud cavity in test period 2, water was added inthe first and second compartments of the water tray todouble the water surface area to 2/3 of the tray. In aparallel study, evaporation, and thus the moisture load,was shown to be a function of the water surface area in thetray [10]. Table 1 shows the loading conditions for testperiods 1 and 2.
3.2. Different wall configurations tested
The 31 assemblies represent different wall systems andconfigurations of complete wall sections, from cladding to
Hole foradding waterNet
Plasticwindow
Cladding
Glass fiber
insulation
L oad
cell
rovided by a water tray on a load cell.

ARTICLE IN PRESSA. Alturkistani et al. / Building and Environment 43 (2008) 2203–22152206
interior finish. Components of each wall system consist offour layers: interior finish, insulated core, exterior panels orsheathing, and cladding (Fig. 2) [14]. Except for theinsulated core, each layer is provided with two or morealternatives within the spectrum of available and typicallyused solutions. The configurations selected are summarizedas follows:
(1)
Tab
Con
Inte
Pain
Pain
aN
Interior finish:� Slightly vapor-tight system: painted gypsum.� Highly vapor-tight system: polyethylene and painted
gypsum.
F
le 2
figu
rior
ted
ted
um
(2)
The insulated core has one option representingcommonly used 2� 6 wood frame structure in Mon-treal with glass fiber insulation.(3)
Sheathing:� Low vapor permeability: OSB.� High vapor permeability: fiberboard.� Intermediate value: plywood.(4)
Cladding system:� Totally vented cladding system with little moisturestorage capacity: wood siding on furring and spunbonded polyolefin (Tyvek).� Simple capillary break and high moisture storage
capacity: cement stucco on metallic lath and twolayers of weather resistive membranes.
Rigid insulation board (polystyrene), with low perme-ability and high impact on temperature gradients, isintroduced in three wall assemblies in addition to thesheathing and is used as sheathing in one wall assembly.Table 2 shows the different assembly configurationstested.
1
2
34
ig. 2. Typical wall configuration of wall assemblies tested.
rations of the 31 wall assemblies
finish Cladding system Sheathing
OSB
gypsum with polyethylene No cladding 1a
Wood siding 5 and 17
29 with insu
Stucco 6 and 18
gypsum Wood siding 11 and 23
Stucco 12 and 24
bers in this table refer to assembly number.
Each assembly consists of a central bay (area of study)made up of two 2� 6 wood studs at 406mm (16 in.)spacing and sided by two guarded bays of 140mm (51
2in.)
each, and a boundary frame made up of 19mm (34 in.)plywood boards to form a complete air separation betweenassembly frames.
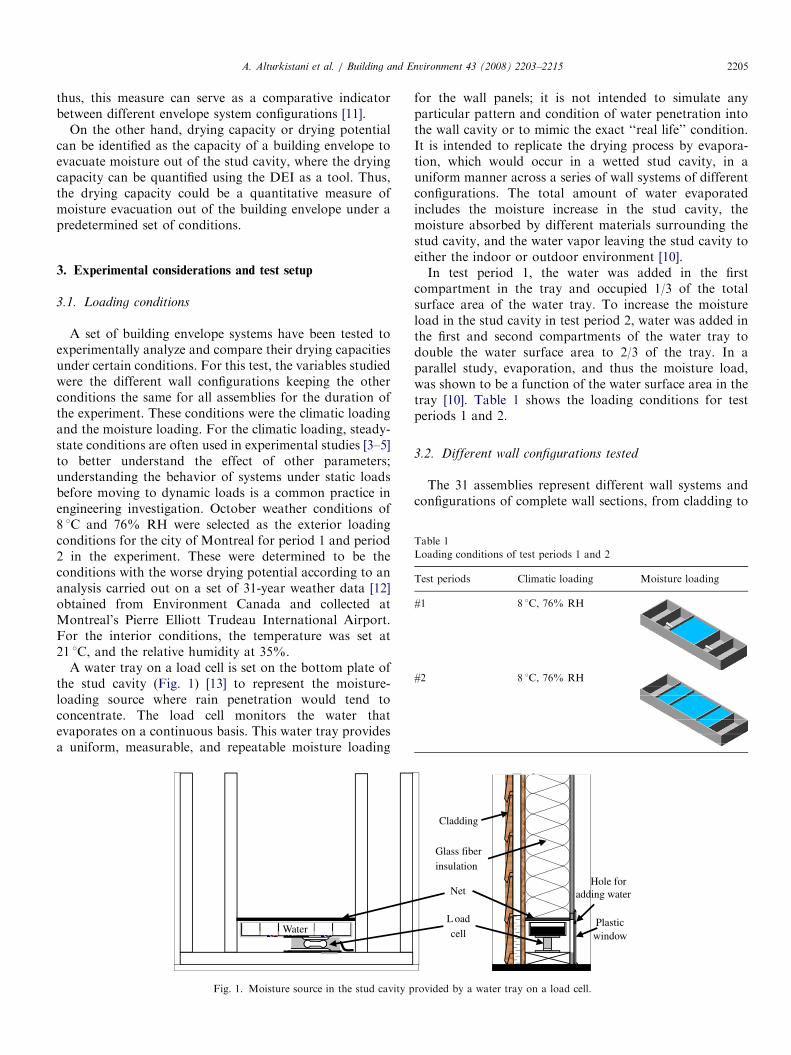
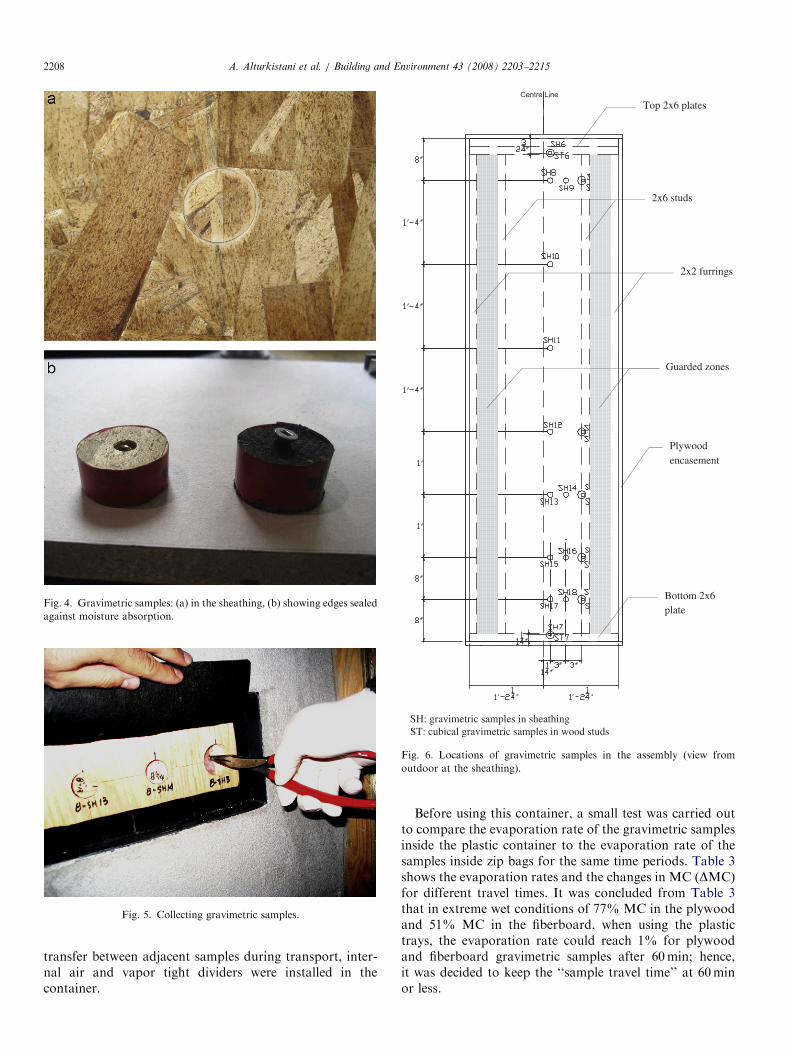
3.3. Moisture content monitored by gravimetric samples
Moisture contents of the materials in the assemblies weremonitored by gravimetric samples. Gravimetric sampleswere cut out from sheathing and stud materials. Fig. 3shows the gravimetric samples of the different materialsand sizes. Each sample was sanded to have a good fit to afixed location (Fig. 4a) and then marked with anidentification number. Sheathing samples were tapedaround the perimeter to avoid water absorption from theedges; tiny screws were installed for easy removal. Twotypes of screws were used: eye screws for the samplesbehind stucco cladding where there is no gap betweensheathing and cladding, and normal wood screws for thesamples behind wood siding where there is an air gap(Fig. 4b). The stud samples (Fig. 3d) had eye screwsinstalled on the exposed surface. The MC of a gravimetricsample is determined as the ratio of the moisture containedwithin the sample to the mass of the oven dry sample.There are 25 gravimetric samples in each assembly (exceptassembly 4, where there are no samples in the insulationsheathing): 7 samples in the wood studs (5 in the verticalstud, 1 in the top plate, and 1 in the bottom plate) and 18samples in the sheathing material. On each of the locations1–7, there are two gravimetric samples, one cubic samplein the corner of the stud with the dimensions13mm� 13mm� 13mm (1
2in:� 1
2in:� 1
2in:) and one cir-
cular sample of the sheathing material with the diameter of38mm (11
2in:) that act both as a gravimetric sample and as
an access to the cubic stud sample (Fig. 5). Samples inlocations 8–18 are circular cut-outs from the sheathingmaterial with the diameter of 25mm (1 in.). More sampleswere positioned in the lower part, which is expected toexperience more moisture accumulation because of beingcloser to the water tray. Fig. 6 shows the locations of thegravimetric samples and their identification labels.
Plywood Fiberboard Insulation
2 3 4
7 and 19 9 and 21
lation 30 with insulation 31 with insulation
8 and 20 10 and 22
13 and 25 15 and 27
14 and 26 16 and 28
ARTICLE IN PRESS
Fig. 3. Gravimetric samples for (a) OSB, (b) plywood, (c) fiberboard, and (d) wood studs.
A. Alturkistani et al. / Building and Environment 43 (2008) 2203–2215 2207
3.4. Gravimetric sample protocol
In the development of the protocol for the gravimetricsamples, several measures were taken to enhance accuracy.
3.4.1. Errors encountered with gravimetric samples
Errors can be introduced due to installation andsampling procedure. The small gravimetry sample in acut-out hole in the assembly being tested may not reflectthe same exact conditions that would exist had the cut-outnot been made. For example, the boundary between theperimeter area of the sample and the assembly material canaffect the moisture transport in the assembly. Air leakagemay occur through this boundary between sample andsample material, thus it may cause condensation aroundthe edges of the sample. The following precautions weretaken to avoid these errors. An analytical balance (accurateto 70.01mg) was used to minimize errors due to weighing.All sheathing samples were taped around the perimeter toprevent moisture transport and hygrothermal interactionbetween the gravimetric sample and its surrounding in thesheathing material. The taping also ensures that themoisture gain in the gravimetric samples is not attainedfrom the possible condensation in the boundary of thesamples. Gravimetric samples in the studs were painted on
the four sides that are in contact with the stud with twocoats of latex vapor barrier primer–sealer. Specific proce-dures, described below, were implemented to avoid errorstypically due to recording mistakes of scale readings, andadditional care was taken to prevent the spalling of smallpieces from the gravimetric samples.
3.4.2. Initial moisture content of gravimetric samples
All samples were placed within the chamber undercontrolled conditions for 6 weeks. Samples of the samematerials should have very close initial MCs at the start ofthe test. Typically two samples for each material were driedto set a preliminary benchmark for the dry weight of thesamples. Thus, the initial MC values for all samples werecalculated by weight as follows: OSB; 3.8%, plywood;4.9%, fiberboard; 5.1%, and stud; 4.0%.
3.4.3. Samples enclosure during collection process
In previous tests involving gravimetric samples [8–10],Ziploc bags were used for the collection and transportof the samples to prevent the samples from gaining orloosing moisture. In this experiment, a simpler enclosurewas required to collect the 757 gravimetric samples, weighthem and then put them back in the assemblies. A (rigid)plastic container was developed. To avoid moisture
ARTICLE IN PRESS
Fig. 4. Gravimetric samples: (a) in the sheathing, (b) showing edges sealed
against moisture absorption.
Fig. 5. Collecting gravimetric samples.
Top 2x6 plates
2x6 studs
2x2 furrings
Guarded zones
Plywoodencasement
Bottom 2x6 plate
SH: gravimetric samples in sheathingST: cubical gravimetric samples in wood studs
Fig. 6. Locations of gravimetric samples in the assembly (view from
outdoor at the sheathing).
A. Alturkistani et al. / Building and Environment 43 (2008) 2203–22152208
transfer between adjacent samples during transport, inter-nal air and vapor tight dividers were installed in thecontainer.
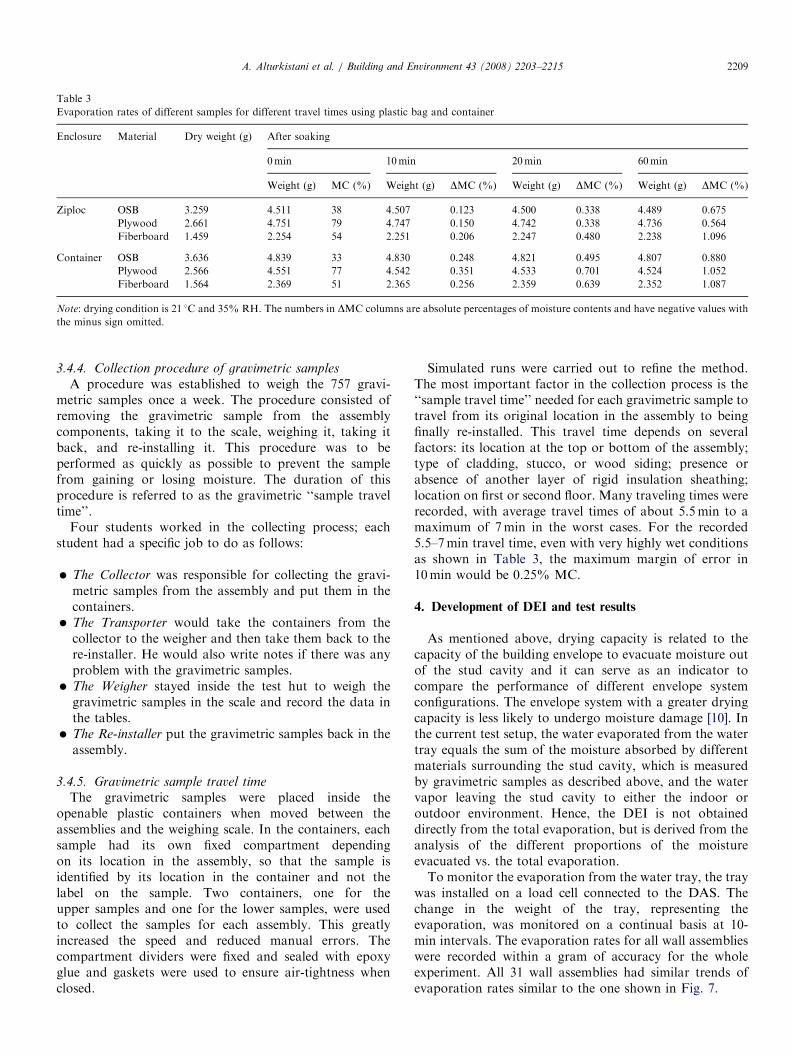
Before using this container, a small test was carried outto compare the evaporation rate of the gravimetric samplesinside the plastic container to the evaporation rate of thesamples inside zip bags for the same time periods. Table 3shows the evaporation rates and the changes in MC (DMC)for different travel times. It was concluded from Table 3that in extreme wet conditions of 77% MC in the plywoodand 51% MC in the fiberboard, when using the plastictrays, the evaporation rate could reach 1% for plywoodand fiberboard gravimetric samples after 60min; hence,it was decided to keep the ‘‘sample travel time’’ at 60minor less.
ARTICLE IN PRESS
Table 3
Evaporation rates of different samples for different travel times using plastic bag and container
Enclosure Material Dry weight (g) After soaking
0min 10min 20min 60min
Weight (g) MC (%) Weight (g) DMC (%) Weight (g) DMC (%) Weight (g) DMC (%)
Ziploc OSB 3.259 4.511 38 4.507 0.123 4.500 0.338 4.489 0.675
Plywood 2.661 4.751 79 4.747 0.150 4.742 0.338 4.736 0.564
Fiberboard 1.459 2.254 54 2.251 0.206 2.247 0.480 2.238 1.096
Container OSB 3.636 4.839 33 4.830 0.248 4.821 0.495 4.807 0.880
Plywood 2.566 4.551 77 4.542 0.351 4.533 0.701 4.524 1.052
Fiberboard 1.564 2.369 51 2.365 0.256 2.359 0.639 2.352 1.087
Note: drying condition is 21 1C and 35% RH. The numbers in DMC columns are absolute percentages of moisture contents and have negative values with
the minus sign omitted.
A. Alturkistani et al. / Building and Environment 43 (2008) 2203–2215 2209
3.4.4. Collection procedure of gravimetric samples
A procedure was established to weigh the 757 gravi-metric samples once a week. The procedure consisted ofremoving the gravimetric sample from the assemblycomponents, taking it to the scale, weighing it, taking itback, and re-installing it. This procedure was to beperformed as quickly as possible to prevent the samplefrom gaining or losing moisture. The duration of thisprocedure is referred to as the gravimetric ‘‘sample traveltime’’.
Four students worked in the collecting process; eachstudent had a specific job to do as follows:
�
The Collector was responsible for collecting the gravi-metric samples from the assembly and put them in thecontainers. � The Transporter would take the containers from thecollector to the weigher and then take them back to there-installer. He would also write notes if there was anyproblem with the gravimetric samples.
� The Weigher stayed inside the test hut to weigh thegravimetric samples in the scale and record the data inthe tables.
� The Re-installer put the gravimetric samples back in theassembly.
3.4.5. Gravimetric sample travel time
The gravimetric samples were placed inside theopenable plastic containers when moved between theassemblies and the weighing scale. In the containers, eachsample had its own fixed compartment dependingon its location in the assembly, so that the sample isidentified by its location in the container and not thelabel on the sample. Two containers, one for theupper samples and one for the lower samples, were usedto collect the samples for each assembly. This greatlyincreased the speed and reduced manual errors. Thecompartment dividers were fixed and sealed with epoxyglue and gaskets were used to ensure air-tightness whenclosed.
Simulated runs were carried out to refine the method.The most important factor in the collection process is the‘‘sample travel time’’ needed for each gravimetric sample totravel from its original location in the assembly to beingfinally re-installed. This travel time depends on severalfactors: its location at the top or bottom of the assembly;type of cladding, stucco, or wood siding; presence orabsence of another layer of rigid insulation sheathing;location on first or second floor. Many traveling times wererecorded, with average travel times of about 5.5min to amaximum of 7min in the worst cases. For the recorded5.5–7min travel time, even with very highly wet conditionsas shown in Table 3, the maximum margin of error in10min would be 0.25% MC.
4. Development of DEI and test results
As mentioned above, drying capacity is related to thecapacity of the building envelope to evacuate moisture outof the stud cavity and it can serve as an indicator tocompare the performance of different envelope systemconfigurations. The envelope system with a greater dryingcapacity is less likely to undergo moisture damage [10]. Inthe current test setup, the water evaporated from the watertray equals the sum of the moisture absorbed by differentmaterials surrounding the stud cavity, which is measuredby gravimetric samples as described above, and the watervapor leaving the stud cavity to either the indoor oroutdoor environment. Hence, the DEI is not obtaineddirectly from the total evaporation, but is derived from theanalysis of the different proportions of the moistureevacuated vs. the total evaporation.To monitor the evaporation from the water tray, the tray
was installed on a load cell connected to the DAS. Thechange in the weight of the tray, representing theevaporation, was monitored on a continual basis at 10-min intervals. The evaporation rates for all wall assemblieswere recorded within a gram of accuracy for the wholeexperiment. All 31 wall assemblies had similar trends ofevaporation rates similar to the one shown in Fig. 7.
ARTICLE IN PRESS
Period 1T = 8°C
RH = 76%1/3 water tray
Period 2T = 8°C
RH= 76%2/3 water tray
0
250
500
750
1000
1250
1500
1750
2000
2250
2500
2750
3000
7/18
7/25 8/
18/
88/
158/
228/
29 9/5
9/12
9/19
9/26
10/3
10/1
010
/17
10/2
410
/31
11/7
11/1
411
/21
11/2
812
/512
/12
12/1
912
/26
1/2
1/9
1/16
1/23
1/30
Acc
umul
ated
Eva
pora
tion
(g)
29 30 31 17 19
27 25 4 23 21
2220
18
2426
28
1 2 3 5 7
15 13 11 9
108
6
1214
16
1st floor 2nd floor
Fig. 7. Accumulated evaporation for wall assembly 5 (OSB, vapor barrier, and wood siding) for test periods 1 and 2.
A. Alturkistani et al. / Building and Environment 43 (2008) 2203–22152210
4.1. Wetting by evaporation
There are two concurrent processes during the experi-ment: wetting and drying. Wetting occurs as a portion ofthe water evaporated from the water trays is absorbed bythe materials surrounding the stud cavity. This wettingcontinues till equilibrium is reached. At equilibrium,the surrounding materials are no longer gaining or losingin their MCs and the rates at which the materials gainand lose moisture are equal. The MC level at equilibriumis called the equilibrium moisture content (EMC). TheEMC level depends on the relative humidity and tempera-ture of the air surrounding the material. The EMCprofile for an assembly subjected to different relativehumidities at a fixed temperature is referred to the sorptionisotherm.
It must be remembered here that wetting can be causedby moisture of various sources and modes. The water traymethod presented in this paper was developed to avoidspeculations on the type and amount of water penetrationdue to undetermined flaws in the envelope. While the watervapor in the stud cavity for this experiment derives from awater tray, it could be representative of any moisturesource penetrating the stud cavity, which must firstevaporate before it can evacuate.
During the wetting process, part of the evaporation isaccumulated by the surrounding surfaces, while the otherpart is evacuating the stud cavity or drying out; but onlyafter EMC in the materials surrounding the stud cavity isreached, all the additional water evaporating from the trayis deemed to evacuate entirely out of the stud cavity of the
assembly, driven by the vapor pressure difference and byair leakage. This evacuation process is referred to, in thisstudy, as the drying of the assembly. In the experiment, theamount of the water evaporated from the water tray ismonitored by a load cell supporting the water tray, whilethe total amount absorbed by the components surroundingthe stud cavity can be estimated from the moistureaccumulated in the materials measured with the gravi-metric samples.
4.2. Moisture mapping calculation method
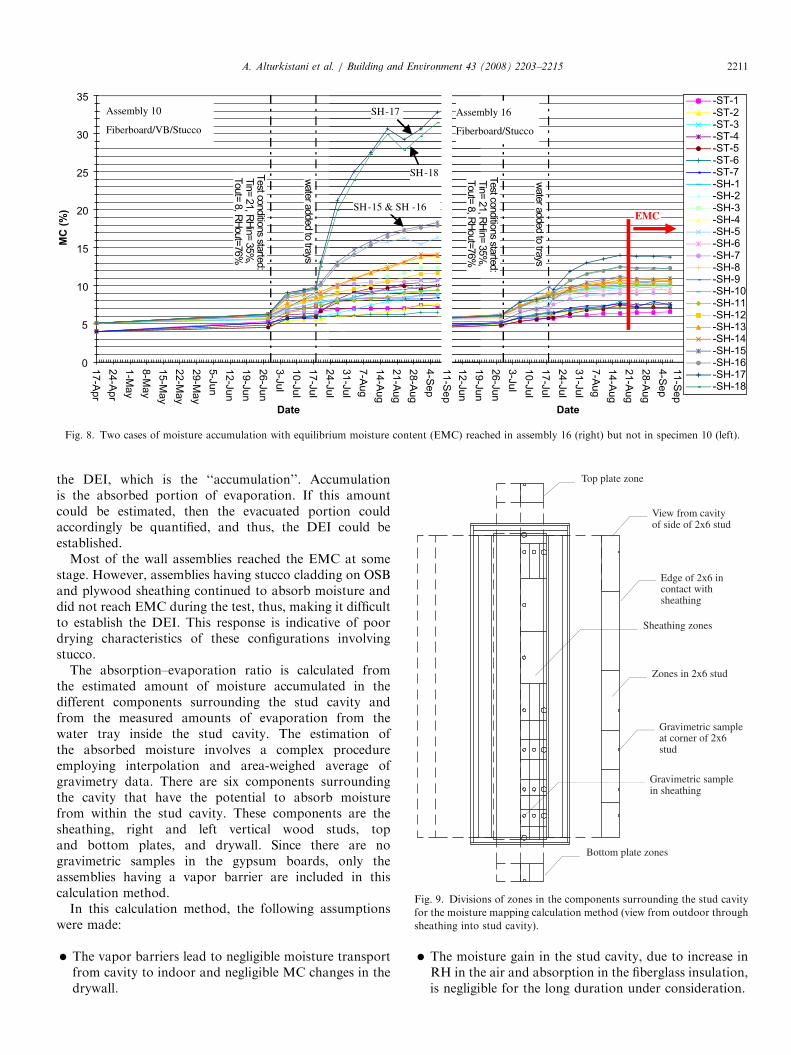
In order to establish the DEI for a wall assembly andthus identify the drying capacity, a correlation betweenthe evaporation rate (evaporation) and the amount ofmoisture leaving the cavity (evacuation) has to beidentified. After the EMC has been reached, the slope ofthe evaporation rate is deemed to represent the rate ofwater vapor exiting the stud cavity. For example, the MCprofiles for some of the 25 gravimetric samples located inthe surrounding materials in assembly #10 were stillincreasing (Fig. 8 left). At the same time, assembly #16reached a steady-state when the MC profiles for its 25gravimetric samples stopped increasing (Fig. 8 right).After this equilibrium state is reached, the water whichcontinues to evaporate from the tray is equal to themoisture leaving the wall and it is referred to as theevacuated moisture. Therefore, if equilibrium is reached, itis easy to establish the DEI directly as a function of evapo-ration and evacuation. In the case where MC equilibrium isnot reached, a new factor has to be determined to establish
ARTICLE IN PRESS
-ST-1-ST-2-ST-3-ST-4-ST-5-ST-6-ST-7-SH-1-SH-2-SH-3-SH-4-SH-5-SH-6-SH-7-SH-8-SH-9-SH-10-SH-11-SH-12-SH-13-SH-14-SH-15-SH-16-SH-17-SH-18
Testcondit ionsst art ed:
Tin=2 1,RHi n=
35%,
Tou t=8 ,R H out =7 6%
wat er add edt o
trays
0
5
10
15
20
25
30
35
17-Apr
24-Apr
1-May
8-May
15-May
22-May
29-May
5-Jun12-Jun19-Jun26-Jun3-Jul10-Jul17-Jul24-Jul31-Jul7-A
ug14-A
ug21-A
ug28-A
ug4-S
ep11-S
ep
Date
MC
(%)
Test cond ition ss tar te d:
Ti n=2 1,RHi n =
3 5%,
T out =8 , RHou t= 76%
w atera ddedto
tra ys
12-Jun19-Jun26-Jun3-Jul10-Jul17-Jul24-Jul31-Jul7-A
ug14-A
ug21-A
ug28-A
ug4-S
ep11-S
ep
Date
Assembly 10
Fiberboard/VB/Stucco
Assembly 16
Fiberboard/Stucco
SH-17
SH-18
SH-15 & SH -16EMC
Fig. 8. Two cases of moisture accumulation with equilibrium moisture content (EMC) reached in assembly 16 (right) but not in specimen 10 (left).
Top plate zone
Sheathing zones
Zones in 2x6 stud
Bottom plate zones
View from cavity of side of 2x6 stud
Edge of 2x6 in contact with sheathing
Gravimetric sample at corner of 2x6 stud
Gravimetric sample in sheathing
Fig. 9. Divisions of zones in the components surrounding the stud cavity
for the moisture mapping calculation method (view from outdoor through
sheathing into stud cavity).
A. Alturkistani et al. / Building and Environment 43 (2008) 2203–2215 2211
the DEI, which is the ‘‘accumulation’’. Accumulationis the absorbed portion of evaporation. If this amountcould be estimated, then the evacuated portion couldaccordingly be quantified, and thus, the DEI could beestablished.
Most of the wall assemblies reached the EMC at somestage. However, assemblies having stucco cladding on OSBand plywood sheathing continued to absorb moisture anddid not reach EMC during the test, thus, making it difficultto establish the DEI. This response is indicative of poordrying characteristics of these configurations involvingstucco.
The absorption–evaporation ratio is calculated fromthe estimated amount of moisture accumulated in thedifferent components surrounding the stud cavity andfrom the measured amounts of evaporation from thewater tray inside the stud cavity. The estimation ofthe absorbed moisture involves a complex procedureemploying interpolation and area-weighed average ofgravimetry data. There are six components surroundingthe cavity that have the potential to absorb moisturefrom within the stud cavity. These components are thesheathing, right and left vertical wood studs, topand bottom plates, and drywall. Since there are nogravimetric samples in the gypsum boards, only theassemblies having a vapor barrier are included in thiscalculation method.
In this calculation method, the following assumptionswere made:
�
The vapor barriers lead to negligible moisture transportfrom cavity to indoor and negligible MC changes in thedrywall.�
The moisture gain in the stud cavity, due to increase inRH in the air and absorption in the fiberglass insulation,is negligible for the long duration under consideration.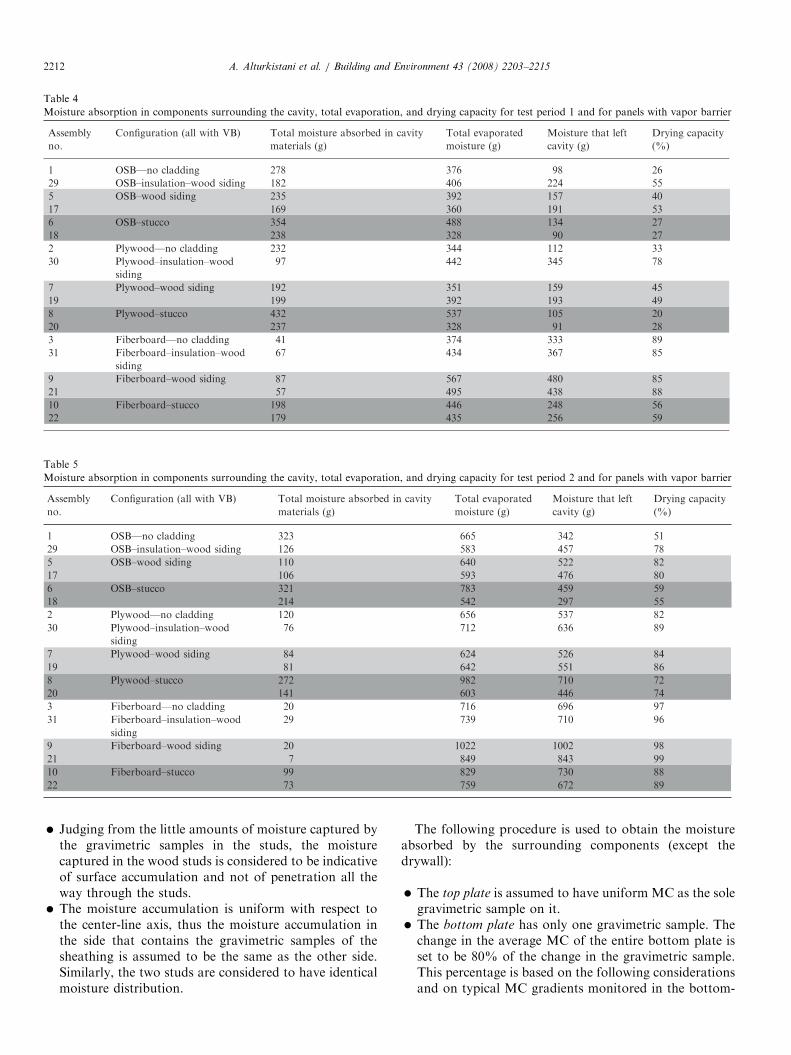
ARTICLE IN PRESS
Table 4
Moisture absorption in components surrounding the cavity, total evaporation, and drying capacity for test period 1 and for panels with vapor barrier
Table 5
Moisture absorption in components surrounding the cavity, total evaporation, and drying capacity for test period 2 and for panels with vapor barrier
A. Alturkistani et al. / Building and Environment 43 (2008) 2203–22152212
�
Judging from the little amounts of moisture captured bythe gravimetric samples in the studs, the moisturecaptured in the wood studs is considered to be indicativeof surface accumulation and not of penetration all theway through the studs. � The moisture accumulation is uniform with respect tothe center-line axis, thus the moisture accumulation inthe side that contains the gravimetric samples of thesheathing is assumed to be the same as the other side.Similarly, the two studs are considered to have identicalmoisture distribution.
The following procedure is used to obtain the moistureabsorbed by the surrounding components (except thedrywall):
�
The top plate is assumed to have uniform MC as the solegravimetric sample on it. � The bottom plate has only one gravimetric sample. Thechange in the average MC of the entire bottom plate isset to be 80% of the change in the gravimetric sample.This percentage is based on the following considerationsand on typical MC gradients monitored in the bottom-
ARTICLE IN PRESSA. Alturkistani et al. / Building and Environment 43 (2008) 2203–2215 2213
sheathing region. The bottom plate is divided into twoconstant MC zones. The central zone has 40% of thetotal area and its MC equals that of the gravimetricsample. The outer zone with 60% area is further awayfrom the center of the evaporation area of the water trayand is expected to have less moisture accumulation. Theaccumulation rate in this zone is assumed to be 60% ofthe middle zone.
� Vertical studs (2) and sheathing: Only one of the verticalstuds has five gravimetric samples. The sheathing boardhas 18 gravimetric samples on one side of the centervertical line. The sheathing is assumed to havesymmetrical MC distribution with respect to the centralline. For both sheathing and vertical studs, the surfacesare divided into a number of zones. While the studs aredivided in only vertical directions, the sheathing isdivided into regular and non-equal rectangular zones, asshown in Fig. 9. For a zone having a gravimetricalsample within the zone, the MC of the zone is assumedto be uniform and equal to that of the gravimetricalsample. For a zone with no gravimetric sample, its MC
5 O
SBw
ood
sidi
ng
17 O
SBw
ood
sidi
ng
6 O
SBst
ucco
18 O
SBst
ucco
7 pl
ywoo
dw
ood
sidi
ng
19 p
lyw
ood
0
10
20
30
40
50
60
70
80
90
100
dryi
ng c
apac
ity %
(per
iod
1)
panel numbe
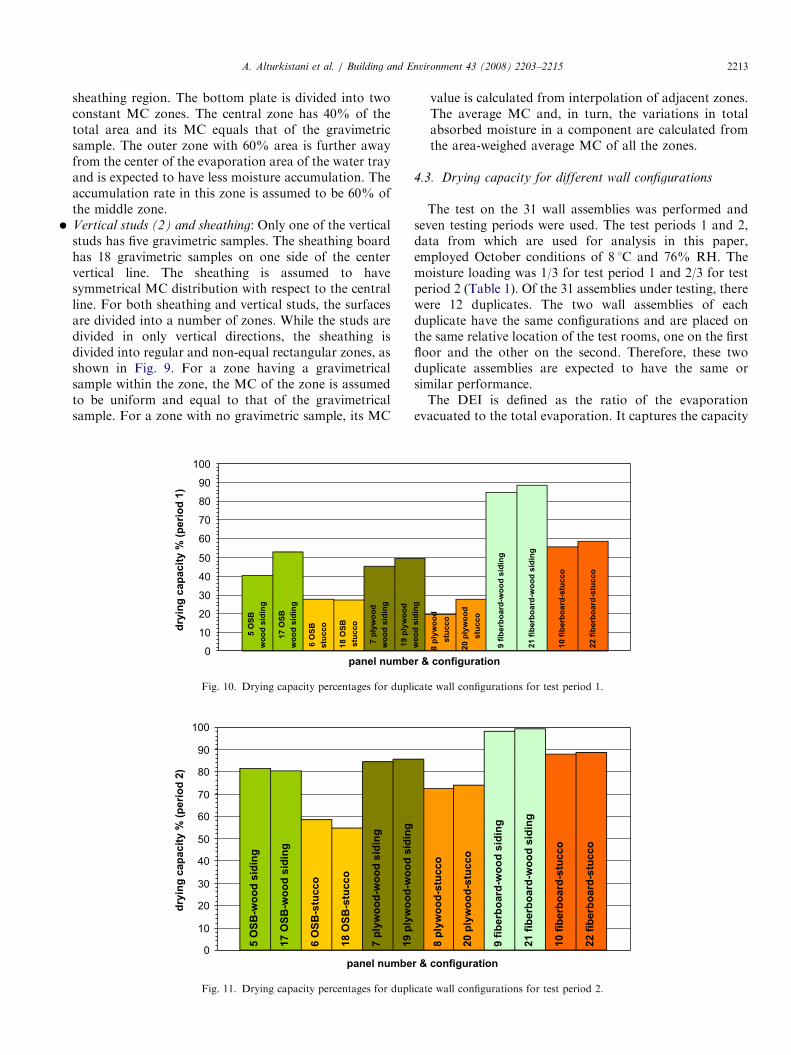
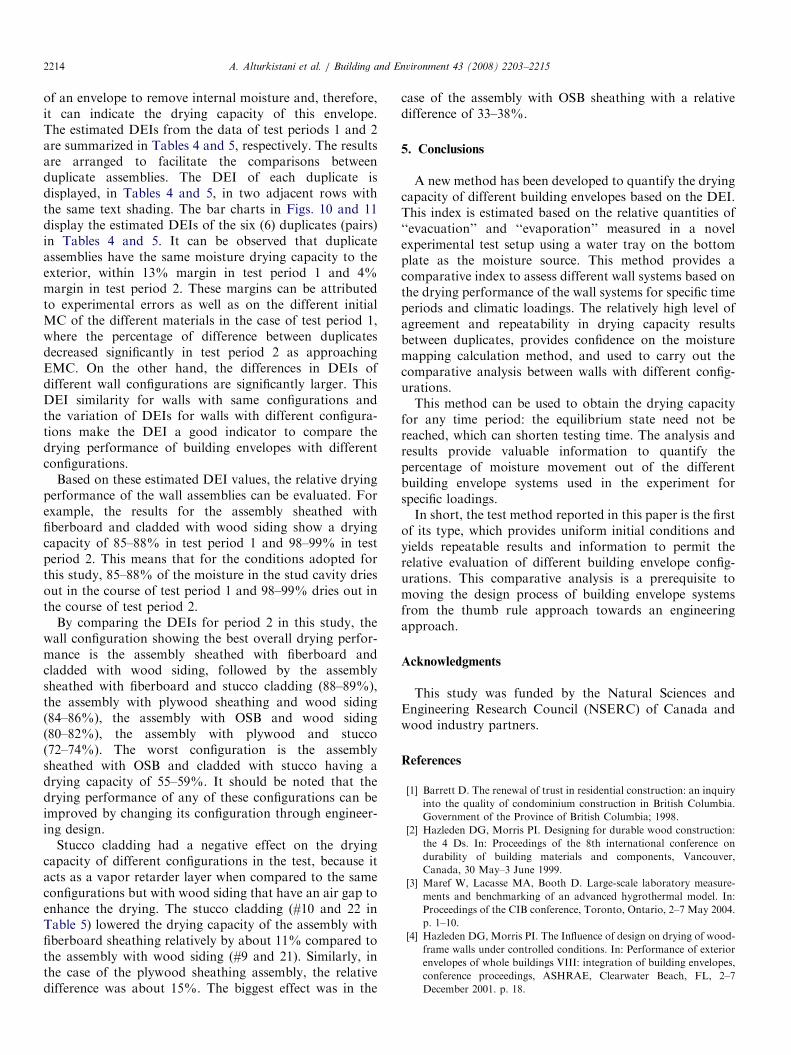
Fig. 10. Drying capacity percentages for dupl
5 O
SB-w
ood
sidi
ng
17 O
SB-w
ood
sidi
ng
6 O
SB-s
tucc
o
18 O
SB-s
tucc
o
7 pl
ywoo
d-w
ood
sidi
ng
19 p
lyw
ood-
woo
d si
ding
0
10
20
30
40
50
60
70
80
90
100
panel numbe
dryi
ng c
apac
ity %
(per
iod
2)
Fig. 11. Drying capacity percentages for dupl
value is calculated from interpolation of adjacent zones.The average MC and, in turn, the variations in totalabsorbed moisture in a component are calculated fromthe area-weighed average MC of all the zones.
4.3. Drying capacity for different wall configurations
The test on the 31 wall assemblies was performed andseven testing periods were used. The test periods 1 and 2,data from which are used for analysis in this paper,employed October conditions of 8 1C and 76% RH. Themoisture loading was 1/3 for test period 1 and 2/3 for testperiod 2 (Table 1). Of the 31 assemblies under testing, therewere 12 duplicates. The two wall assemblies of eachduplicate have the same configurations and are placed onthe same relative location of the test rooms, one on the firstfloor and the other on the second. Therefore, these twoduplicate assemblies are expected to have the same orsimilar performance.The DEI is defined as the ratio of the evaporation
evacuated to the total evaporation. It captures the capacity
9 fib
erbo
ard-
woo
d si
ding
21 fi
berb
oard
-woo
d si
ding
10 fi
berb
oard
-stu
cco
22 fi
berb
oard
-stu
cco
woo
d si
ding
8 pl
ywoo
dst
ucco
20 p
lyw
ood
stuc
co
r & configuration
icate wall configurations for test period 1.
8 pl
ywoo
d-st
ucco
20 p
lyw
ood-
stuc
co
9 fib
erbo
ard-
woo
d si
ding
21 fi
berb
oard
-woo
d si
ding
10 fi
berb
oard
-stu
cco
22 fi
berb
oard
-stu
cco
r & configuration
icate wall configurations for test period 2.
ARTICLE IN PRESSA. Alturkistani et al. / Building and Environment 43 (2008) 2203–22152214
of an envelope to remove internal moisture and, therefore,it can indicate the drying capacity of this envelope.The estimated DEIs from the data of test periods 1 and 2are summarized in Tables 4 and 5, respectively. The resultsare arranged to facilitate the comparisons betweenduplicate assemblies. The DEI of each duplicate isdisplayed, in Tables 4 and 5, in two adjacent rows withthe same text shading. The bar charts in Figs. 10 and 11display the estimated DEIs of the six (6) duplicates (pairs)in Tables 4 and 5. It can be observed that duplicateassemblies have the same moisture drying capacity to theexterior, within 13% margin in test period 1 and 4%margin in test period 2. These margins can be attributedto experimental errors as well as on the different initialMC of the different materials in the case of test period 1,where the percentage of difference between duplicatesdecreased significantly in test period 2 as approachingEMC. On the other hand, the differences in DEIs ofdifferent wall configurations are significantly larger. ThisDEI similarity for walls with same configurations andthe variation of DEIs for walls with different configura-tions make the DEI a good indicator to compare thedrying performance of building envelopes with differentconfigurations.
Based on these estimated DEI values, the relative dryingperformance of the wall assemblies can be evaluated. Forexample, the results for the assembly sheathed withfiberboard and cladded with wood siding show a dryingcapacity of 85–88% in test period 1 and 98–99% in testperiod 2. This means that for the conditions adopted forthis study, 85–88% of the moisture in the stud cavity driesout in the course of test period 1 and 98–99% dries out inthe course of test period 2.
By comparing the DEIs for period 2 in this study, thewall configuration showing the best overall drying perfor-mance is the assembly sheathed with fiberboard andcladded with wood siding, followed by the assemblysheathed with fiberboard and stucco cladding (88–89%),the assembly with plywood sheathing and wood siding(84–86%), the assembly with OSB and wood siding(80–82%), the assembly with plywood and stucco(72–74%). The worst configuration is the assemblysheathed with OSB and cladded with stucco having adrying capacity of 55–59%. It should be noted that thedrying performance of any of these configurations can beimproved by changing its configuration through engineer-ing design.
Stucco cladding had a negative effect on the dryingcapacity of different configurations in the test, because itacts as a vapor retarder layer when compared to the sameconfigurations but with wood siding that have an air gap toenhance the drying. The stucco cladding (#10 and 22 inTable 5) lowered the drying capacity of the assembly withfiberboard sheathing relatively by about 11% compared tothe assembly with wood siding (#9 and 21). Similarly, inthe case of the plywood sheathing assembly, the relativedifference was about 15%. The biggest effect was in the
case of the assembly with OSB sheathing with a relativedifference of 33–38%.
5. Conclusions
A new method has been developed to quantify the dryingcapacity of different building envelopes based on the DEI.This index is estimated based on the relative quantities of‘‘evacuation’’ and ‘‘evaporation’’ measured in a novelexperimental test setup using a water tray on the bottomplate as the moisture source. This method provides acomparative index to assess different wall systems based onthe drying performance of the wall systems for specific timeperiods and climatic loadings. The relatively high level ofagreement and repeatability in drying capacity resultsbetween duplicates, provides confidence on the moisturemapping calculation method, and used to carry out thecomparative analysis between walls with different config-urations.This method can be used to obtain the drying capacity
for any time period: the equilibrium state need not bereached, which can shorten testing time. The analysis andresults provide valuable information to quantify thepercentage of moisture movement out of the differentbuilding envelope systems used in the experiment forspecific loadings.In short, the test method reported in this paper is the first
of its type, which provides uniform initial conditions andyields repeatable results and information to permit therelative evaluation of different building envelope config-urations. This comparative analysis is a prerequisite tomoving the design process of building envelope systemsfrom the thumb rule approach towards an engineeringapproach.
Acknowledgments
This study was funded by the Natural Sciences andEngineering Research Council (NSERC) of Canada andwood industry partners.
References
[1] Barrett D. The renewal of trust in residential construction: an inquiry
into the quality of condominium construction in British Columbia.
Government of the Province of British Columbia; 1998.
[2] Hazleden DG, Morris PI. Designing for durable wood construction:
the 4 Ds. In: Proceedings of the 8th international conference on
durability of building materials and components, Vancouver,
Canada, 30 May–3 June 1999.
[3] Maref W, Lacasse MA, Booth D. Large-scale laboratory measure-
ments and benchmarking of an advanced hygrothermal model. In:
Proceedings of the CIB conference, Toronto, Ontario, 2–7 May 2004.
p. 1–10.
[4] Hazleden DG, Morris PI. The Influence of design on drying of wood-
frame walls under controlled conditions. In: Performance of exterior
envelopes of whole buildings VIII: integration of building envelopes,
conference proceedings, ASHRAE, Clearwater Beach, FL, 2–7
December 2001. p. 18.
ARTICLE IN PRESSA. Alturkistani et al. / Building and Environment 43 (2008) 2203–2215 2215
[5] Ojanen T, Salonvaara M, Simonson CJ. Integration of simplified
drying tests and numerical simulation in moisture performance
analysis of the building envelope. In: Proceedings of the 6th
symposium on building physics in the Nordic Countries, Trondheim,
Norway, 17 June 2002.
[6] Schumacher C, Shi X, Davidovic D, Burnett E, Straube J. Ventilation
drying in wall systems. In: Proceedings of the second interna-
tional building physics conference: research in building physics.
Leuven, Belgium: A.A. Balkema Publishers; 14–18 September 2003.
p. 479–86.
[7] Teasdale-St-Hilaire A, Derome D, Fazio P. Development of an
experimental methodology for the simulation of wetting due to rain
infiltration for building envelope testing. In: Proceedings of the 2nd
international building physics conference. Leuven, Belgium: A.A.
Balkema; 14–18 September 2003. p. 455–62.
[8] Teasdale-St-Hilaire A, Derome D, Fazio P. Behavior of wall
assemblies with different wood sheathings wetted by simulated rain
infiltration. In: Performance of the exterior envelopes of whole
buildings IX: conference proceedings, ASHRAE, Clearwater Beach,
FL, 5–10 December 2004.
[9] Teasdale-St-Hilaire A, Derome D, Fazio P. Investigating the role of
the vapor retarder in the drying response of wood-frame walls wetted
by simulated rain infiltration. In: Proceedings of the 10th ICBEST,
Ottawa, Ontario, May 2005.
[10] Fazio P, Mao Q, Ge H, Alturkistani A, Rao J. A test method to
measure the relative capacity of wall panels to evacuate moisture
from their stud cavity. Journal of Architectural Engineering
2007;13(4):194–204.
[11] Fazio P. Protocol on loading for the CRD project. NSERC
Collaborative Research and Development (CRD) grant. Concordia
University, Montreal, Quebec, 2004 [unpublished internal report].
[12] Candanedo L, Derome D, Fazio P, Ge H. Analysis of Montreal
30-year weather data to select loading conditions for large-scale tests
on wall panel systems. In: Research in building physics and building
engineering: proceedings of the third international conference in
building physics (IBPC3), Montreal, 27–31 August 2006. p. 959–66.
[13] Fazio P, Mao Q, Alturkistani A, Vera S, Rao J. Establishing a
uniform and measurable moisture source to evaluate the drying
capacity of building envelope systems. In: Research in building
physics and building engineering: proceedings of the third interna-
tional conference in building physics (IBPC3), Montreal, 27–31
August 2006. p. 369–77.
[14] Fazio P, Rao J, Alturkistani A, Ge H. Large scale experimental
investigation of the relative drying capacity of building envelope
panels of various configurations. In: Research in building physics and
building engineering: proceedings of the third international con-
ference in building physics (IBPC3), Montreal, 27–31 August 2006.
p. 361–8.