Spatial Frequency Response of Acrylamide Based Holographic Photopolymer
A
a−oaceUcTw©
K
1
wimtarac
dd(b
0d
Available online at www.sciencedirect.com
Talanta 74 (2008) 1608–1614
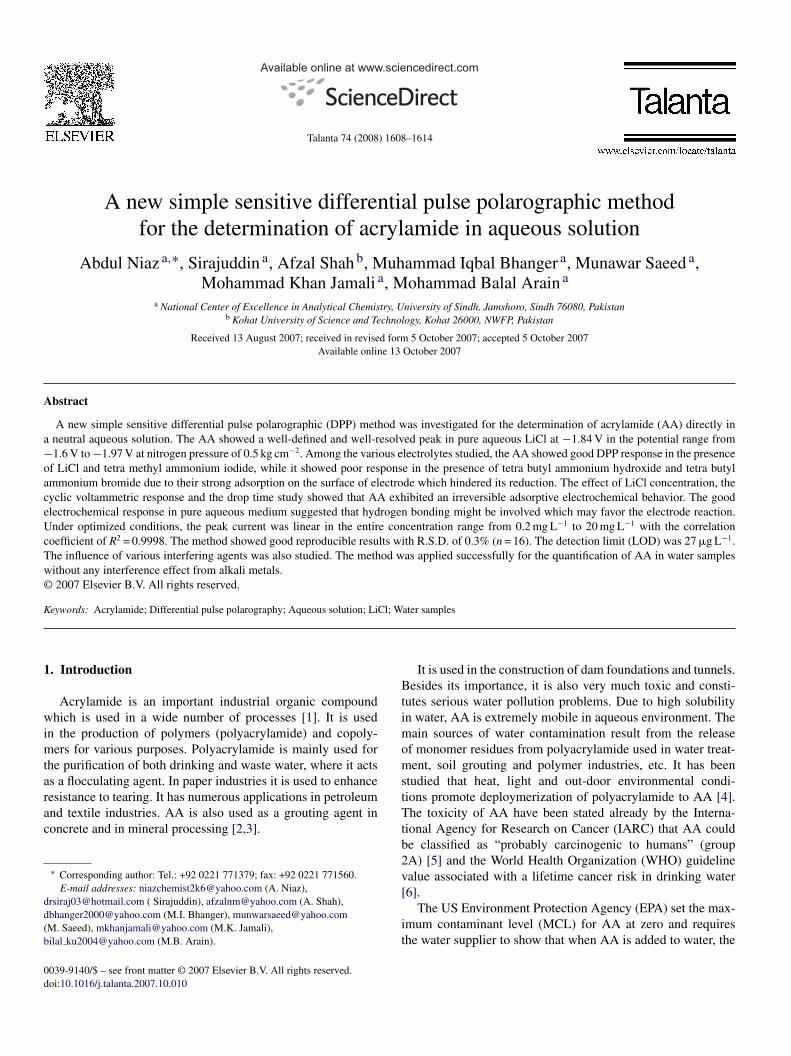
A new simple sensitive differential pulse polarographic methodfor the determination of acrylamide in aqueous solution
Abdul Niaz a,∗, Sirajuddin a, Afzal Shah b, Muhammad Iqbal Bhanger a, Munawar Saeed a,Mohammad Khan Jamali a, Mohammad Balal Arain a
a National Center of Excellence in Analytical Chemistry, University of Sindh, Jamshoro, Sindh 76080, Pakistanb Kohat University of Science and Technology, Kohat 26000, NWFP, Pakistan
Received 13 August 2007; received in revised form 5 October 2007; accepted 5 October 2007Available online 13 October 2007
bstract
A new simple sensitive differential pulse polarographic (DPP) method was investigated for the determination of acrylamide (AA) directly inneutral aqueous solution. The AA showed a well-defined and well-resolved peak in pure aqueous LiCl at −1.84 V in the potential range from1.6 V to −1.97 V at nitrogen pressure of 0.5 kg cm−2. Among the various electrolytes studied, the AA showed good DPP response in the presence
f LiCl and tetra methyl ammonium iodide, while it showed poor response in the presence of tetra butyl ammonium hydroxide and tetra butylmmonium bromide due to their strong adsorption on the surface of electrode which hindered its reduction. The effect of LiCl concentration, theyclic voltammetric response and the drop time study showed that AA exhibited an irreversible adsorptive electrochemical behavior. The goodlectrochemical response in pure aqueous medium suggested that hydrogen bonding might be involved which may favor the electrode reaction.nder optimized conditions, the peak current was linear in the entire concentration range from 0.2 mg L−1 to 20 mg L−1 with the correlation
oefficient of R2 = 0.9998. The method showed good reproducible results with R.S.D. of 0.3% (n = 16). The detection limit (LOD) was 27 �g L−1.he influence of various interfering agents was also studied. The method was applied successfully for the quantification of AA in water samplesithout any interference effect from alkali metals.2007 Elsevier B.V. All rights reserved.
Cl; W
Btimoms
eywords: Acrylamide; Differential pulse polarography; Aqueous solution; Li
. Introduction
Acrylamide is an important industrial organic compoundhich is used in a wide number of processes [1]. It is used
n the production of polymers (polyacrylamide) and copoly-ers for various purposes. Polyacrylamide is mainly used for
he purification of both drinking and waste water, where it actss a flocculating agent. In paper industries it is used to enhance
esistance to tearing. It has numerous applications in petroleumnd textile industries. AA is also used as a grouting agent inoncrete and in mineral processing [2,3].∗ Corresponding author: Tel.: +92 0221 771379; fax: +92 0221 771560.E-mail addresses: [email protected] (A. Niaz),
[email protected] ( Sirajuddin), [email protected] (A. Shah),[email protected] (M.I. Bhanger), [email protected]. Saeed), [email protected] (M.K. Jamali),ilal [email protected] (M.B. Arain).
tTtb2v[
it
039-9140/$ – see front matter © 2007 Elsevier B.V. All rights reserved.oi:10.1016/j.talanta.2007.10.010
ater samples
It is used in the construction of dam foundations and tunnels.esides its importance, it is also very much toxic and consti-
utes serious water pollution problems. Due to high solubilityn water, AA is extremely mobile in aqueous environment. The
ain sources of water contamination result from the releasef monomer residues from polyacrylamide used in water treat-ent, soil grouting and polymer industries, etc. It has been
tudied that heat, light and out-door environmental condi-ions promote deploymerization of polyacrylamide to AA [4].he toxicity of AA have been stated already by the Interna-
ional Agency for Research on Cancer (IARC) that AA coulde classified as “probably carcinogenic to humans” (groupA) [5] and the World Health Organization (WHO) guidelinealue associated with a lifetime cancer risk in drinking water
6].The US Environment Protection Agency (EPA) set the max-mum contaminant level (MCL) for AA at zero and requireshe water supplier to show that when AA is added to water, the
ta 74
aDmsA
aaLewocuA
saoDmo
aipfscBltmiiwdvo
eoiatkso
2
2
tG
fbpgas
2
pweiesno(va
2
2
Aegt−5s−rcocA(
2
idpiwmpdtf
A. Niaz et al. / Talan
mount of un-coagulated acrylamide is less than 0.5 �gL−1 [7].ue to its high toxic effects to humans and animals it is veryuch necessary to establish a simple, rapid, sensitive, highly
elective analytical methodology for the direct quantification ofA in aqueous solution.A variety of sensitive methods are available in the literature to
nalyze AA in aqueous solutions [8–14]. Most of these methodsre based on the techniques such as HPLC–UV, GC–MS andC–MS/MS. Derivatization of AA prior to analysis and largefforts involved in sample preparation come as disadvantagesith the use of these techniques. The others major disadvantagesf these methods are their high equipment costs and runningosts. Recently, direct electrochemical detection following liq-id chromatography has been proposed for the determination ofA in aqueous samples [15].But in terms of simplicity, selectivity, relatively good sen-
itivity, without any derivatization, it carries very low runningnd equipments costs and is easily available in under devel-ped areas, however, the electro analytical techniques, mainlyP polarography, are the most suitable techniques for the deter-ination of AA in complicated matrices as compared to the
ther nonelectroanalytical techniques [16].But unfortunately there is no sensitive polarograhic method
vailable which could monitor AA directly at a trace leveln aqueous solution [1], and till now. All the previouslyolarographic methods for the determination of AA in dif-erent matrices have been reported in nonaqueous or mixolvent system [17–25]. Among these methods the most effi-ient polarographic method till now has been reported byetso and McLean to determine AA monomer in polyacry-
amide containing 80/20 methanol/water [17]. They modifiedhe polarographic method of McWilliams et al. [20] by usingore advance instrumentation (differential pulse polarograph
nstead of the older direct-current instrument). By using thisnstrumentation the AA reduction peak became well-defined andell-resolved from the background. They lowered greatly theetection limit to less than 1 mg L−1 (0.5) in relation to all pre-iously reported polarographic methods for the determinationf AA.
However, this method suffer from serious drawbacks forxample this is not suitable to monitor AA directly in aque-us solution, less sensitive and at −2.0 V it suffer from majornterferences mainly from the alkali metals cations. Therefore,more sensitive and selective polarographic method is essen-
ial to determine AA directly in aqueous solution. To our bestnowledge this is the first time that we have investigated a simpleensitive, selective polarographic method for the quantificationf AA directly in aqueous solution.
. Experimental
.1. Reagents and solution
All reagents were of analytical grade. Acrylamide (elec-rophoresis grade) and LiCl were purchased from Merckermany. Other reagents used in this study were also purchased
P
pd
(2008) 1608–1614 1609
rom the same company. All solutions were prepared in dou-le distilled water. A stock solution of 1000 mg L−1 AA wasrepared from which appropriate amount was taken for polaro-raphic studies. Five molar LiCl solution was also prepared inseparate flask which was used as an electrolyte and carrier
olution.
.2. Apparatus
Polarographic experiments were performed by Metrohmolarographic analyzer (Switzerland) model 797 version 1.1ith a personal computer. A typical three electrode system
quipped with a dropping mercury working electrode, a plat-num counter electrode and Ag/AgCl/3 M KCl as a referencelectrode. Nitrogen was used as an inert gas to purge the analyteolutions and to operate the mercury electrode. The optimumitrogen gas pressure of 0.5 kg cm−2 (0.49 bar) was used throughut in this study. In the instrumental setup the voltage step timedrop time) automatically controlled the sweep rate. When theoltage time was made to increase the sweep rate decreasedccordingly.
.3. Procedures
.3.1. Polarographic studiesA volume of 10 mL flask solution containing 5 mg L−1
A (50 �g L−1 of 1000 mg L−1 stock solution) in 0.5 M LiCllectrolyte (1 mL of 5 M LiCl) was transferred into a polaro-raphic cell. After purging the solution with nitrogen for 5 minhe polarograms were taken by scanning the potential from
1.6 V to −1.97 V at a voltage step time of 1.8 s, drop size, pulse amplitude of 0.05 V, pulse time of 0.04 s, voltagetep of 0.006 V, sweep rate of 0.0033 V/s, peak potential of1.84 V and nitrogen pressure of 0.5 kg cm−2 (0.49 bar). The
eversibility of the electrode reaction was tested by usingyclic voltammetry on the same instrument at a scan ratef 0.055 V/s. All the AA analyses and the linear calibrationurves were carried out by using standard addition method.ll the measurements were performed at room temperature
25 ± 5 ◦C).
.3.2. Determination of acrylamide in water sampleFor method validation a recovery tests were accomplished
n local tape water for the quantification of AA in low, mid-le and high concentrations ranges using differential pulseolarography. A volume of 10 mL local tape water contain-ng known amounts of AA in 0.5 M LiCl (1 mL of 5 M)ere placed in a polarographic cell. Then for DPP measure-ents, the same conditions as mentioned previously, were
erformed and the amounts were calculated by using stan-ard addition method. The concentrations of AA were alsoested in the polymeric industrial discharge samples obtainedrom rubber and others petrochemical industries of Karachi,
akistan.The determinations of AA in these polymeric discharges wereerformed by employing the same polarographic procedure asescribed already. To test the matrix effect in these samples,

1 ta 74
ts
3
iwaefop
ptotrocois
apdAme
wmodw
Fteat
uist(
ccisivean[Ahf
srcobai
pifpc
610 A. Niaz et al. / Talan
hree successive additions of 0.001 �L of 1000 mg L−1 AA werepiked containing a known amount of 0.2 mg L−1 AA.
. Results and discussion
To investigate the reduction of AA in various suitable support-ng electrolytes, a broad differential pulse polarographic studyas carried out in the potential range from −1.4 V to −2.4 V in
queous solution. The peaks of AA were observed in the pres-nce of some useful supporting electrolytes, but these peaks wereound to be depressed completely due to high reduction currentf the supporting electrolyte cations at about −2.0 V when broadotential range was employed.
Therefore, the study was performed by employing shortotential range, i.e. from −1.4 V to −1.97 V instead of −1.4 Vo −2.4 V broad potential range, in order to avoid the effectf high reduction current resulting from the supporting elec-rolyte cations at −2.0 V. By employing this short potentialange, some well-defined and well-resolved peaks appeared to bebserved and not depressed before the reduction of electrolyteations, illustrated in Fig. 1. Thus in this study the selectionf proper potential range from −1.4 V to −1.97 V was crit-cal to investigate the peak current of AA in pure aqueousolution.
From Fig. 1 it can be seen that in the presence of tetra butylmmonium bromide (TBAB) as a supporting electrolyte twoolarographic peaks (A1 and A2) were obtained. The poorlyefined peak (A1) at −1.90 V may be due to the reduction ofA and another relatively well-defined peak (A2) at −1.62 Vay be due to the adsorption of electrolyte on the surface of
lectrode.The adsorption peak (A2) attributed to TBAB at −1.62 V
as further confirmed in the absence of AA. The broad and
uch poorly defined peak was obtained at −1.88 V in the casef TBAOH electrolyte, shown by curve (B). A relatively well-efined and well-resolved peak from the background at −1.86 Vas obtained when tetra ethyl ammonium iodide (TEAI) was
ig. 1. Polarographic behavior of acrylamide in some useful supporting elec-rolytes in pure aqueous solution. (A) (A1 and A2) TBAB, (B) TBAOH, (C) tetrathyl ammonium iodide (TBEI), (D) LiCl and (E) TMAI. The concentrations ofll the supporting electrolytes used were 0.05 M. Potential range from −1.4 Vo −1.97 V, drop size of 5, voltage step time of 1 s.
witceoc
FIs
(2008) 1608–1614
sed which is shown by curve (C). The peak obtained at −1.87 Vn lithium chloride was also well-defined and became increased,hown by curve (D). The maximum peak height at a peak poten-ial of −1.86 V was obtained in TMAI, represented by curveE).
These results indicate that the type of supporting electrolyteation has a considerable influence on the reduction of AA byhanging the double layer structure of the electrode solutionnterface. By the addition of quaternary ammonium (R4N+)alts/hydroxide into the solution, the peak current becamencreased and the peak potential shifted toward more negativealues as when the size of R-group (R4N+) was increased. Thisffect may probably attribute to the specific adsorption of R4N+
t the surface of electrode. The adsorbability of tetra alkyl ammo-ium ions (R4N+) increases in the order TMA < TEA < TBA26,27]. The results reveal the obvious fact that the reduction ofA consumes protons from the surface of electrode and it wasindered by the adsorption of tetra butyl ammonium cationsrom TBAB and TBAOH electrolytes.
The size of the electrolyte cations has also shown a con-iderable influence on the rate of reduction of AA. The higheduction current at less negative potential was observed in thease of TMAI and then in LiCl as shown in Fig. 1. The effectf LiCl concentration on the reduction of AA was observed toe more pronounced as compared to TMAI because of its lessdsorbability on the surface of electrode and its high solubilityn aqueous medium.
The effect of LiCl concentration on the peak current and peakotential of AA was studied as shown in Fig. 2. The peak currentncreased gradually with the increasing concentration of LiClrom 0.005 mol L−1 to 0.5 mol L−1, but at the same time the peakotential shifted towards less negative values. Then both the peakurrent and peak potential remained constant, while the peakidth became broader after when the concentration of LiCl was
ncreased from 0.5 mol L−1 to 1.75 mol L−1. This showed thathe reduction peak current of AA was strongly dependent on LiCl
oncentration thereby changing the double layer structure of thelectrode solution interface. The effect of TMAI concentrationn peak current of AA was also studied and the maximum peakurrent was obtained in 0.2 M without any shift of peak potential.ig. 2. Effect of LiCl concentration on the peak current of 5 mg L−1 acrylamide.nitial potential: −1.4 V; end potential: −1.97 V; voltage step time: 0.4 s; dropize: 4.
ta 74 (2008) 1608–1614 1611
Bt
pettocedtaspoa
3
cLFtt
3c
agv2o
ciiwTt
FS
F(p
ipmvci
0as
oi0rs−at
dL
A. Niaz et al. / Talan
ut the peak current obtained in TMAI was found to be low thanhe peak current obtained in LiCl.
This result also confirmed that replacing a cation in the sup-orting electrolyte by another more strongly absorbable one,.g., (lithium by tetra methyl, tetra methyl by tetra ethyl andetra ethyl by tetra butyl) caused the shifting of peak potentialowards more negative value, whereas the peak current decreasedr even absent, in the reduction of cationic AA. This result isonsistent with the previous results [27,28], but in this case thelectroactive species is cationic (AA) rather than anionic whichisplaced the peak potential towards more negative values dueo electrostatic repulsion between cationic AA and tetra butylmmonium cation adsorbed at the surface of electrode. The AAhowed the highest sensitivity at less negative potential in theresence of LiCl because of its lowest adsobability at the surfacef electrode due to small size. So LiCl of 0.5 M was chosen asuseful supporting electrolyte for the reduction of AA.
.1. Cyclic voltammetric study
In order to check the reversibility of the electrode reaction,yclic voltammogram (CV) of 10 mg L−1AA in 0.5 M aqueousiCl at a scan rate of 0.055 V/s was recorded. It can be seen fromig. 3, that cathodic peak of AA appeared at about −1.85 V and
here was no anodic peak appeared in the reverse scan, indicatinghe totally irreversible nature of the electrode reaction.
.2. Effect of voltage step time (drop time) on the reductionurrent of AA
To elucidate the kind of electrode reaction the effect of volt-ge step time was studied. The peak current of AA increasedradually and the peak potential shifted towards less negativealues with an increase in the voltage step time from 0.4 s to.6 s, while beyond this range it abruptly decreased in the formf distorted peak due to increased current oscillations.
The distortion of peak shape due to increased amplitude ofurrent oscillations started after when the voltage step time wasncreased from 2.2 s to 3 s. The increase in peak current with an
ncrease in voltage step time indicated that the limiting currentas partly controlled by the rate of potential scan or drop time.his suggests an adsorptive chemical reaction involving a rela-ively slow step on the surface of electrode. Such type of reaction
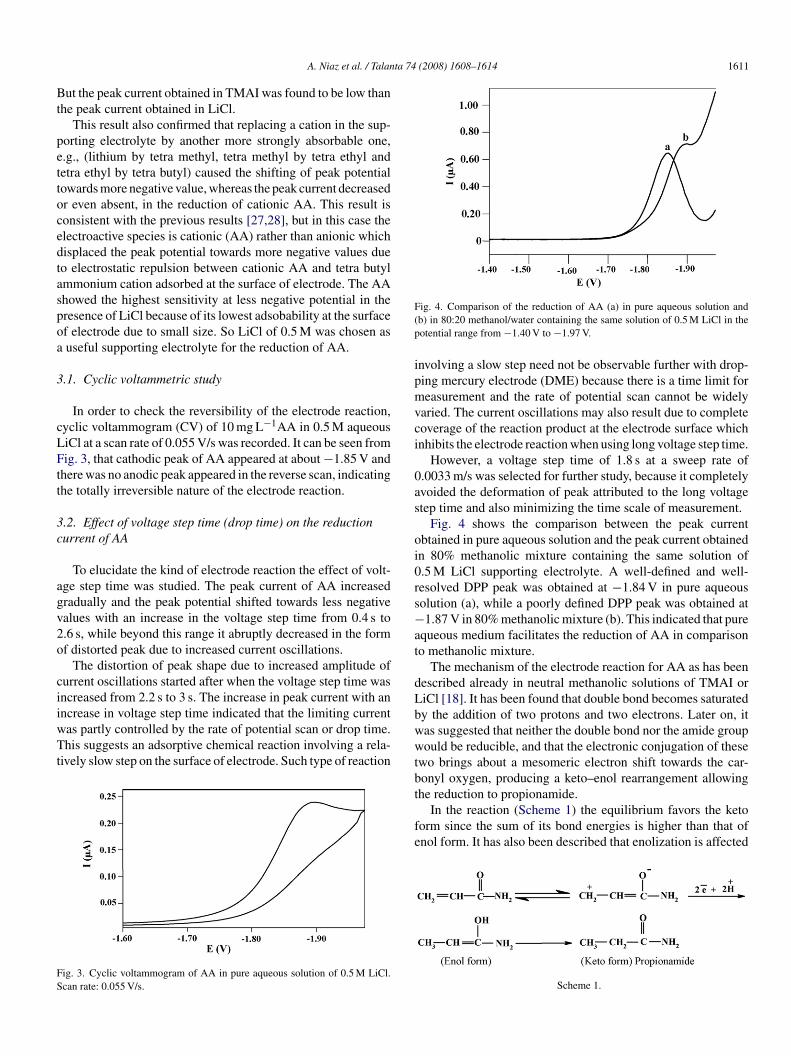
ig. 3. Cyclic voltammogram of AA in pure aqueous solution of 0.5 M LiCl.can rate: 0.055 V/s.
bwwtbt
fe
ig. 4. Comparison of the reduction of AA (a) in pure aqueous solution andb) in 80:20 methanol/water containing the same solution of 0.5 M LiCl in theotential range from −1.40 V to −1.97 V.
nvolving a slow step need not be observable further with drop-ing mercury electrode (DME) because there is a time limit foreasurement and the rate of potential scan cannot be widely
aried. The current oscillations may also result due to completeoverage of the reaction product at the electrode surface whichnhibits the electrode reaction when using long voltage step time.
However, a voltage step time of 1.8 s at a sweep rate of.0033 m/s was selected for further study, because it completelyvoided the deformation of peak attributed to the long voltagetep time and also minimizing the time scale of measurement.
Fig. 4 shows the comparison between the peak currentbtained in pure aqueous solution and the peak current obtainedn 80% methanolic mixture containing the same solution of.5 M LiCl supporting electrolyte. A well-defined and well-esolved DPP peak was obtained at −1.84 V in pure aqueousolution (a), while a poorly defined DPP peak was obtained at1.87 V in 80% methanolic mixture (b). This indicated that pure
queous medium facilitates the reduction of AA in comparisono methanolic mixture.
The mechanism of the electrode reaction for AA as has beenescribed already in neutral methanolic solutions of TMAI oriCl [18]. It has been found that double bond becomes saturatedy the addition of two protons and two electrons. Later on, itas suggested that neither the double bond nor the amide groupould be reducible, and that the electronic conjugation of these
wo brings about a mesomeric electron shift towards the car-onyl oxygen, producing a keto–enol rearrangement allowing
he reduction to propionamide.In the reaction (Scheme 1) the equilibrium favors the ketoorm since the sum of its bond energies is higher than that ofnol form. It has also been described that enolization is affected
Scheme 1.
1 ta 74
gihcke
oaoapis
fpog
dpmop0n
3
3
crA
F(2Aa
wcbcthb
fd
L
w“es0tdcd
bsrbr
3
a
612 A. Niaz et al. / Talan
reatly by water which reduces the enol form by hydrogen bond-ng with the carbonyl thereby reducing the propensity for internalydrogen bonding [29]. So from all these results it was con-luded that in pure aqueous solution the electron proton transferinetics of AA takes place more easily by stabilizing greatly thelectrode reaction product via hydrogen bonding.
Moreover, the nitrogen pressure also affected the peak currentf AA. It was observed that by increasing the nitrogen pressurebove from 0.5 kg cm−2 (0.49 bar) the noise level or currentscillations in the peak current became more pronounced asresult of distorted peak was found rather than well-resolved
eak. Thus the nitrogen pressure was also found to be a signif-cant factor to investigate the peak current of AA in aqueousolution.
Therefore the nitrogen pressure of 0.5 kg cm−2 was selectedor further study because this showed best results in terms ofeak shape and peak current. Moreover the drop size of 5 wasptimized for further experiments because it showed relativelyood sensitivity for AA.
After all the experiments, the conditions optimized for theetermination of AA in aqueous solution were the use of drop-ing mercury electrode (DME) as a working electrode with DPode, initial purge time of 300 s, drop size of 5, start potential
f −1.6 V, end potential of −1.97 V, peak potential of −1.84 V,ulse amplitude of 0.05 V, pulse time of 0.04 s, voltage step of.006 V, voltage step time of 1.8 s, sweep rate of 0.0033 V/s anditrogen pressure of 0.5 kg cm−2.
.3. Analytical performance of the method
.3.1. Linear calibration curve
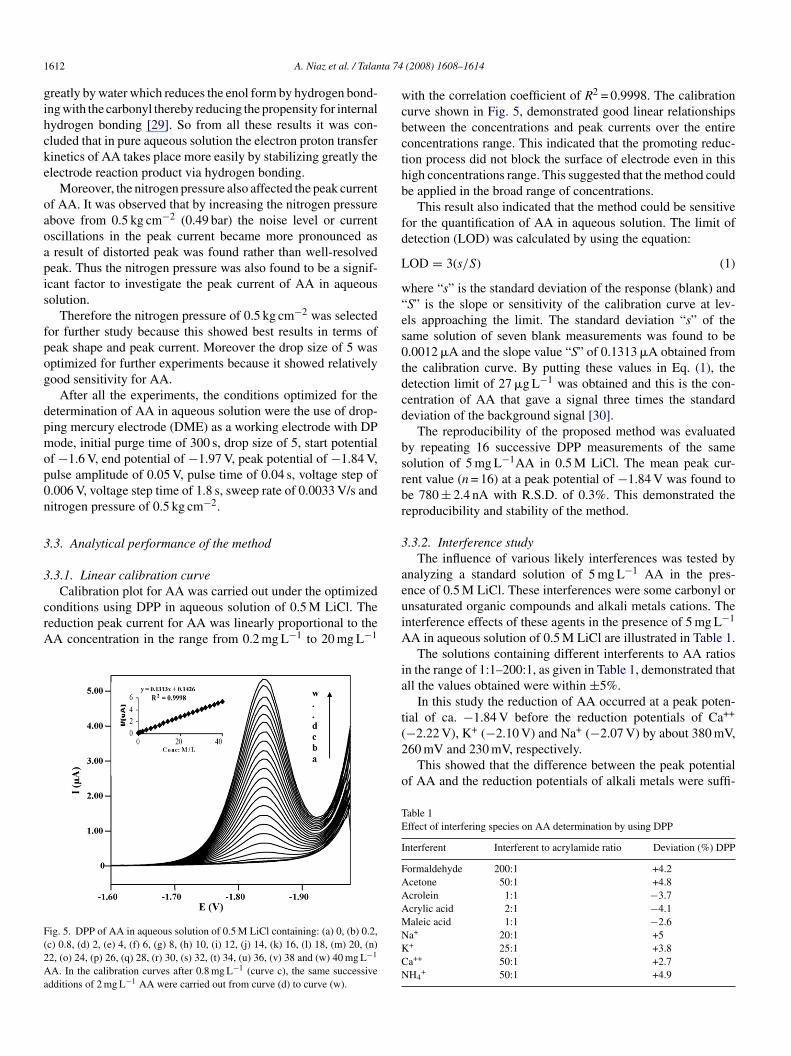
Calibration plot for AA was carried out under the optimizedonditions using DPP in aqueous solution of 0.5 M LiCl. Theeduction peak current for AA was linearly proportional to theA concentration in the range from 0.2 mg L−1 to 20 mg L−1
ig. 5. DPP of AA in aqueous solution of 0.5 M LiCl containing: (a) 0, (b) 0.2,c) 0.8, (d) 2, (e) 4, (f) 6, (g) 8, (h) 10, (i) 12, (j) 14, (k) 16, (l) 18, (m) 20, (n)2, (o) 24, (p) 26, (q) 28, (r) 30, (s) 32, (t) 34, (u) 36, (v) 38 and (w) 40 mg L−1
A. In the calibration curves after 0.8 mg L−1 (curve c), the same successivedditions of 2 mg L−1 AA were carried out from curve (d) to curve (w).
euiA
ia
t(2
o
TE
I
FAAAMNKCN
(2008) 1608–1614
ith the correlation coefficient of R2 = 0.9998. The calibrationurve shown in Fig. 5, demonstrated good linear relationshipsetween the concentrations and peak currents over the entireoncentrations range. This indicated that the promoting reduc-ion process did not block the surface of electrode even in thisigh concentrations range. This suggested that the method coulde applied in the broad range of concentrations.
This result also indicated that the method could be sensitiveor the quantification of AA in aqueous solution. The limit ofetection (LOD) was calculated by using the equation:
OD = 3(s/S) (1)
here “s” is the standard deviation of the response (blank) andS” is the slope or sensitivity of the calibration curve at lev-ls approaching the limit. The standard deviation “s” of theame solution of seven blank measurements was found to be.0012 �A and the slope value “S” of 0.1313 �A obtained fromhe calibration curve. By putting these values in Eq. (1), theetection limit of 27 �g L−1 was obtained and this is the con-entration of AA that gave a signal three times the standardeviation of the background signal [30].
The reproducibility of the proposed method was evaluatedy repeating 16 successive DPP measurements of the sameolution of 5 mg L−1AA in 0.5 M LiCl. The mean peak cur-ent value (n = 16) at a peak potential of −1.84 V was found toe 780 ± 2.4 nA with R.S.D. of 0.3%. This demonstrated theeproducibility and stability of the method.
.3.2. Interference studyThe influence of various likely interferences was tested by
nalyzing a standard solution of 5 mg L−1 AA in the pres-nce of 0.5 M LiCl. These interferences were some carbonyl ornsaturated organic compounds and alkali metals cations. Thenterference effects of these agents in the presence of 5 mg L−1
A in aqueous solution of 0.5 M LiCl are illustrated in Table 1.The solutions containing different interferents to AA ratios
n the range of 1:1–200:1, as given in Table 1, demonstrated thatll the values obtained were within ±5%.
In this study the reduction of AA occurred at a peak poten-ial of ca. −1.84 V before the reduction potentials of Ca++
−2.22 V), K+ (−2.10 V) and Na+ (−2.07 V) by about 380 mV,60 mV and 230 mV, respectively.
This showed that the difference between the peak potentialf AA and the reduction potentials of alkali metals were suffi-
able 1ffect of interfering species on AA determination by using DPP
nterferent Interferent to acrylamide ratio Deviation (%) DPP
ormaldehyde 200:1 +4.2cetone 50:1 +4.8crolein 1:1 −3.7crylic acid 2:1 −4.1aleic acid 1:1 −2.6a+ 20:1 +5+ 25:1 +3.8a++ 50:1 +2.7H4
+ 50:1 +4.9

A. Niaz et al. / Talanta 74 (2008) 1608–1614 1613
Table 2Determination results for acrylamide in local tape water
Sample no. Acrylamide added (�g mL−1) Acrylamide founda (�g mL−1) Recovery (%)
1 0.5 0.49 98.12 5.0 4.97 99.43
cpacocae
ro−Naeb
lwaldr
3
mokswpo
sccopsro
4
go
mtswgphftpoiawtnpw
A
HRKG
R
10.0
a Average of five determinations.
iently high which could allow the determination of AA in theresence of alkali metals cations. However, it was observed thatt low concentration of AA in the presence of relatively highoncentration of Na+ and K+, the peak became depressed with-ut any change in peak current. This was due to the high finalurrent rise of the background current resulting from these met-ls which started before the final background current of LiCllectrolyte.
The owns of the final background or residual currentesulting in the presence of alkali metals cations dependsn their reduction potentials which decreases in the order2.31 V > −2.22 V > −2.10 V > −2.07 V for Li+, Ca++, K+ anda+, respectively. As the reduction potentials of Na+ and K+
re lower than others, so their final background currents startedarlier than Li+. Thus this was due to this reason that the peakecame affected in the presence of these metals.
The effect was seen more in the determination of sufficientlyow concentration of AA. In such a situation an accurate resultsere obtained by recording first the blank solution without
nalyte and then the solution containing analyte or using extrapo-ation method [31]. However, by the proposed method we couldetermine AA at a very low concentration in the presence ofelatively high amount of Na+ and K+.
.3.3. Sample analysisIn order to assess the possible applications of the proposed
ethod for the determination of AA, the samples consistingf known amount of AA in local tape water was tested. Whennown amounts of AA added to the water control samples usingtandard addition method, quantitative recoveries of 98.1–102%ere obtained as listed in Table 2. The values shown in Table 2resented a relative error lower or equal to 2%. Thus the accuracyf the investigated method in pure aqueous solution was evident.
AA was also analyzed in polymeric industrial dischargesamples collected from polymeric industries of Karach. But weould not find AA, as the concentration of AA in these dis-harged samples may be absent or low than the detection limitf the proposed method. In order to test the matrix affects in theseolymeric discharges, a known amount of 0.2 �g mL−1AA waspiked using standard addition method. From this a quantitativeecovery of 96% was obtained which showed a good selectivityf the proposed method.
. Conclusion
After a long time, a new simple differential pulse polaro-raphic method was investigated. The new proposed methodffered rapidity, sensitivity and highly selectivity for the deter-
[[[
10.2 102
ination of AA directly in aqueous solution of LiCl. In this studyhe selection of proper potential range and applied nitrogen pres-ure to mercury electrode were important factors to investigate aell-resolved peak of AA in aqueous solution. The AA showedood response in the presence of LiCl or TBAI while it showedoor response in the presence of TBAOH and TBAB due toindrance effects. The electrode reaction was found to be moreavorable in pure aqueous solution which might be attributedo the hydrogen bonding thereby stabilizing greatly the reactionroduct. The sensitivity was greatly improved than the previ-usly reported methods. Although the detection limit 27 �g L−1
s not sufficient to verify the compliances with WHO guidelinesnd EPA recommended estimation of 0.5 �g L−1 in drinkingater and also not competable with the advance instrumental
echniques. But however, the proposed method could open aew field of research for more sensitive investigations of AA inure aqueous medium at this very simple, inexpensive techniquehich would be compatible to the advanced techniques.
cknowledgements
We express our gratitude to Professor Michael Heyrovsky,eyrovsky Institute of Physical Chemistry, Prague, Czechepublic for his valuable suggestions, and Professor Maheralaji, School of Chemistry, University of Wales, Bangor,wynedd, UK for updating our electrochemical approaches.
eferences
[1] C.G. Daughton, “Quantification of Acylamide (and Polyacrylamide)”:Report No: CGD-O2/88, 1988.
[2] IPCS INCHEM, International Program on Chemical Safety Environ-mental Health Criteria, vol. 49, 1985, http://www.inchem.org/documents/ehc/ehc/ehc49.htm.
[3] M. Weideborg, T. Kallqvist, K.E. Odegrad, L.E. Sverdrup, E.A. Vik, WaterRes. 35 (2001) 2645.
[4] E.A. Smith, S.L. Pruen, F.W. Oehme, Ecotoxicol. Environ. Saf. 35 (1996)121.
[5] IARC, Monographs on the Evaluation of Carcinogenic Risks to Humans,vol. 60, International Agency for Research on Cancer (IARC), Lyon, 1994,pp. 389–433.
[6] World Health Organization (WHO), Recommendations, vol. 1, 2nd ed.,WHO, Geneva, 1993, p. 72.
[7] Consumer Factsheet on Acrylamide, US Environmental Protection Agency,Cincinnati, OH, USA, http://www.epa.gov/safewater/contaminants/dwcontamfs/acrylami.html.
[8] S. Chu, C.D. Metcalfe, Anal. Chem. 79 (2007) 5093.
[9] S. Cavalli, S. Polesello, G. Saccani, J. Chromatogr. A 1039 (2004) 155.10] S. Cavalli, R. Maurer, F. Hofler, LC–GC Eur. 9 April 2003.11] Y. Zhang, G.Y. Zhang, Y. Zhang, J. Chromatogr. A 1075 (2005) 1.12] K. Kawata, T. Ibaraki, A. Tanabe, H. Yagoh, A. Shinoda, H. Suzuki, A.Yasuhara, J. Chromatogr. A 911 (2001) 75.
1 ta 74
[
[
[[
[[[[
[
[
[
[[
[[
[
[
614 A. Niaz et al. / Talan
13] US EPA, Acrylamide by Gas Chromatography; Method 8032A, US Envi-ronmental Protection Agency, Washington, DC, 1996.
14] US EPA, Acrylamide, Acrylonitrile and Acrolein by High PerformanceLiquid Chromatography (HPLC), Method 8316, US Environmental Pro-tection Agency, Washington, DC, 1994.
15] I.G. Casella, M. Pierri, M. Contursi, J. Chromatogr. A 1107 (2006) 198.16] J. Barek, J. Cvacka, A. Muck, V. Quaiserova, J. Zima, Fresenius J. Anal
Chem. 369 (2001) 556.17] S.R. Betso, J.D. McLean, Anal. Chem. 48 (1976) 766.18] F. Vajda, Acta Chim. Acad. Sci. Hung. 53 (1967) 241.19] F. Vajda, B. Kut, Lntez. Kozlem. 10 (1/2) (1965–1966) 221.
20] D.C. McWilliams, D.C. Kaufman, E.F. Waling, Anal. Chem. 37 (1965)1546.21] E.M. Skobets, G.S. Nestyuk, V.I. Shapoval, Ukr. Khim. Zh. 28 (1962)
72.22] E.M. Skobets, G.S. Nestyuk, Ukr. Khim. Zh. 28 (1962) 934.
[
[
(2008) 1608–1614
23] V.D. Bezuglyi, T.A. Alekseeva, I.P. Kruglyak, Ukr. Khim. Zh. 31 (5) (1965)500.
24] V.I. Shapoval, G.S. Shapoval, Uspechi Chimii 32 (1966) 244.25] L. Meites, Polarographic Techniques, 2nd ed., Interscience Publishers, John
Wiley & Sons, New York, 1965, pp. 612–614.26] I.M. Kolthoff, K. Yamashita, Proc. Natl. Acad. Sci. 72 (1975) 2863.27] A.J. Bard, L.R. Faulkner, Electrochemical Methods, 2nd ed., John Wiley
& Sons, New York, 2001, pp. 574–575.28] L. Meites, Polarographic Techniques, 2nd ed., Interscience Publishers, John
Wiley & Sons, New York, 1965, p. 264.29] J. March, Advanced Organic Chemistry, Reactions Mechanisms and Struc-
ture, 4th ed., John Wiley & Sons, New York, 2004, p. 72.30] G.D. Christian, Analytical Chemistry, 6th ed., John Willey & Sons: Inc.,
New York, 2004, p. 113.31] L. Meites, Polarographic Techniques, 2nd ed., Interscience Publishers, John
Wiley & Sons, New York, 1965, pp. 190–192.
Copyright © 2022 FDOKUMEN