A new multi-wavelength model-based method for determination of enzyme kinetic parameters
9
1. Introduction 1. Introduction Kinetic studies on enzymes are among the most important Kinetic studies on enzymes are among the most important tools for understanding biological interactions at the tools for understanding biological interactions at the molecular level and to obtain information about kinetic molecular level and to obtain information about kinetic parameters. Details of the kinetics are important because parameters. Details of the kinetics are important because they provide essential information about how an enzyme they provide essential information about how an enzyme will behave or respond in a given situation. Simple enzyme will behave or respond in a given situation. Simple enzyme kinetics is generally described by the Michaelis–Menten kinetics is generally described by the Michaelis–Menten equation (Eq. 1) (Baily and Ollis 1986; Beedham 2002). equation (Eq. 1) (Baily and Ollis 1986; Beedham 2002). where where v v is the enzyme reaction rate, is the enzyme reaction rate, S S is substrate is substrate concentration, concentration, V V max max is the maximum reaction rate, and is the maximum reaction rate, and K K m m is the Michaelis–Menten constant. By rearranging Eq. (1), is the Michaelis–Menten constant. By rearranging Eq. (1), different linear forms of the Michaelis–Menten equation different linear forms of the Michaelis–Menten equation including the Lineweaver–Burk equation (Eq. 2) can be including the Lineweaver–Burk equation (Eq. 2) can be derived: derived: Plotting of Eq. (2) as Plotting of Eq. (2) as 1/v 1/v versus versus 1/ 1/[ [S S 0 0 ] (known as a ] (known as a Lineweaver–Burk plot) gives an appropriate linear plot that Lineweaver–Burk plot) gives an appropriate linear plot that is commonly used for determination of numerical values of is commonly used for determination of numerical values of V V max max and and K K m m . . The spectroscopic determination of enzyme activity The spectroscopic determination of enzyme activity through a Lineweaver–Burk plot is usually carried out by through a Lineweaver–Burk plot is usually carried out by monitoring the consumption of substrate or the production monitoring the consumption of substrate or the production of metabolite at a selected wavelength. The method of metabolite at a selected wavelength. The method http://www.ias.ac.in/jbiosci J. Biosci. 35(3), September 2010, 395–403, © Indian Academy of Sciences 395 A new multi-wavelength model-based method for determination of enzyme kinetic parameters MOHAMMAD-HOSSEIN SOROURADDIN 1 , KAVEH AMINI 1,# , ABDOLHOSSEIN NASERI 1 , JAVAD V ALLIPOUR 1 , JALAL HANAEE 2 and MOHAMMAD-REZA RASHIDI 2,* 1 Department of Analytical Chemistry, Faculty of Chemistry, University of Tabriz, Tabriz, Iran 2 Department of Medicinal Chemistry, School of Pharmacy, Tabriz University of Medical Sciences, 51664-14766 Tabriz, Iran # Present address: Department of Chemistry, York University, Toronto, ON, M3J 1P3, Canada * Corresponding author (Fax, +98 411 3344798; Email, [email protected]) Lineweaver–Burk plot analysis is the most widely used method to determine enzyme kinetic parameters. In the spectrophotometric determination of enzyme activity using the Lineweaver–Burk plot, it is necessary to find a wavelength at which only the substrate or the product has absorbance without any spectroscopic interference of the other reaction components. Moreover, in this method, different initial concentrations of the substrate should be used to obtain the initial velocities required for Lineweaver–Burk plot analysis. In the present work, a multi-wavelength model-based method has been developed and validated to determine Michaelis–Menten constants for some enzyme reactions. In this method, a selective wavelength region and several experiments with different initial concentrations of the substrate are not required. The absorbance data of the kinetic assays are fi tted by non-linear regression coupled to the numeric integration of the related differential equation. To indicate the applicability of the proposed method, the Michaelis–Menten constants for the oxidation of phenanthridine, 6-deoxypenciclovir and xanthine by molybdenum hydroxylases were determined using only a single initial concentration of the substrate, regardless of any spectral overlap. [Sorouraddin M-D, Amini K, Naseri A,Vallipour J, Hanaee J and Rashidi M-R 2010 A new multi-wavelength model-based method for determination of enzyme kinetic parameters; J. Biosci. 35 395–403] DOI 10.1007/s12038-010-0045-z Keywords. Enzyme kinetics; Lineweaver–Burk plot analysis; Michaelis–Menten constants; multi-wavelength model-based method; spectrophotometry v V S K S m = + max [ ] [ ] 0 0 , (1) 1 1 1 0 v V K V S m = + max max [ ] , (2)
Transcript of A new multi-wavelength model-based method for determination of enzyme kinetic parameters

A new multi-wavelength model-based method for determination of enzyme kinetic parameters 395
J. Biosci. 35(3), September 2010
1. Introduction1. Introduction
Kinetic studies on enzymes are among the most important Kinetic studies on enzymes are among the most important
tools for understanding biological interactions at the tools for understanding biological interactions at the
molecular level and to obtain information about kinetic molecular level and to obtain information about kinetic
parameters. Details of the kinetics are important because parameters. Details of the kinetics are important because
they provide essential information about how an enzyme they provide essential information about how an enzyme
will behave or respond in a given situation. Simple enzyme will behave or respond in a given situation. Simple enzyme
kinetics is generally described by the Michaelis–Menten kinetics is generally described by the Michaelis–Menten
equation (Eq. 1) (Baily and Ollis 1986; Beedham 2002).equation (Eq. 1) (Baily and Ollis 1986; Beedham 2002).
where where vv is the enzyme reaction rate, is the enzyme reaction rate, SS is substrate is substrate
concentration, concentration, VVmaxmax
is the maximum reaction rate, and is the maximum reaction rate, and KKmm
is the Michaelis–Menten constant. By rearranging Eq. (1), is the Michaelis–Menten constant. By rearranging Eq. (1),
different linear forms of the Michaelis–Menten equation different linear forms of the Michaelis–Menten equation
including the Lineweaver–Burk equation (Eq. 2) can be including the Lineweaver–Burk equation (Eq. 2) can be
derived: derived:
Plotting of Eq. (2) as Plotting of Eq. (2) as 1/v1/v versus versus 1/1/[[SS00] (known as a ] (known as a
Lineweaver–Burk plot) gives an appropriate linear plot that Lineweaver–Burk plot) gives an appropriate linear plot that
is commonly used for determination of numerical values of is commonly used for determination of numerical values of
VVmaxmax
and and KKmm..
The spectroscopic determination of enzyme activity The spectroscopic determination of enzyme activity
through a Lineweaver–Burk plot is usually carried out by through a Lineweaver–Burk plot is usually carried out by
monitoring the consumption of substrate or the production monitoring the consumption of substrate or the production
of metabolite at a selected wavelength. The method of metabolite at a selected wavelength. The method
http://www.ias.ac.in/jbiosci J. Biosci. 35(3), September 2010, 395–403, © Indian Academy of Sciences 395
A new multi-wavelength model-based method for determination of
enzyme kinetic parameters
MOHAMMAD-HOSSEIN SOROURADDIN1, KAVEH AMINI
1,#, ABDOLHOSSEIN NASERI1, JAVAD VALLIPOUR
1,
JALAL HANAEE2 and MOHAMMAD-REZA RASHIDI
2,*
1Department of Analytical Chemistry, Faculty of Chemistry, University of Tabriz, Tabriz, Iran
2Department of Medicinal Chemistry, School of Pharmacy, Tabriz University of Medical Sciences,
51664-14766 Tabriz, Iran
#Present address: Department of Chemistry, York University, Toronto, ON, M3J 1P3, Canada
*Corresponding author (Fax, +98 411 3344798; Email, [email protected])
Lineweaver–Burk plot analysis is the most widely used method to determine enzyme kinetic parameters. In the
spectrophotometric determination of enzyme activity using the Lineweaver–Burk plot, it is necessary to fi nd a
wavelength at which only the substrate or the product has absorbance without any spectroscopic interference of the
other reaction components. Moreover, in this method, different initial concentrations of the substrate should be used
to obtain the initial velocities required for Lineweaver–Burk plot analysis. In the present work, a multi-wavelength
model-based method has been developed and validated to determine Michaelis–Menten constants for some enzyme
reactions. In this method, a selective wavelength region and several experiments with different initial concentrations
of the substrate are not required. The absorbance data of the kinetic assays are fi tted by non-linear regression coupled
to the numeric integration of the related differential equation. To indicate the applicability of the proposed method, the
Michaelis–Menten constants for the oxidation of phenanthridine, 6-deoxypenciclovir and xanthine by molybdenum
hydroxylases were determined using only a single initial concentration of the substrate, regardless of any spectral
overlap.
[Sorouraddin M-D, Amini K, Naseri A,Vallipour J, Hanaee J and Rashidi M-R 2010 A new multi-wavelength model-based method for determination
of enzyme kinetic parameters; J. Biosci. 35 395–403] DOI 10.1007/s12038-010-0045-z
Keywords. Enzyme kinetics; Lineweaver–Burk plot analysis; Michaelis–Menten constants; multi-wavelength model-based method;
spectrophotometry
vV S
K Sm
=+
max [ ]
[ ]0
0
, (1)
1 1 1
0v VKV Sm= +
max max [ ], (2)

Mohammad-Hossein Sorouraddin et al.396
J. Biosci. 35(3), September 2010
is based on the measurement of the initial velocity of is based on the measurement of the initial velocity of
different concentrations of the substrate at a wavelength different concentrations of the substrate at a wavelength
at which only the subat which only the substrate or the product has absorbance strate or the product has absorbance
without any spectroscopic interference of the other reaction without any spectroscopic interference of the other reaction
components.components.
Spectroscopic methods are, in general, sensitive and Spectroscopic methods are, in general, sensitive and
well suited for studying enzyme systems in which the well suited for studying enzyme systems in which the
reaction components are accessible in pure form and there reaction components are accessible in pure form and there
is no spectral overlap in responses. However, many systems, is no spectral overlap in responses. However, many systems,
particularly those with similar components, do not meet particularly those with similar components, do not meet
these conditions, and there have been some diffi culties in these conditions, and there have been some diffi culties in
studying such systems. These quantifi cation diffi culties studying such systems. These quantifi cation diffi culties
arise from spectral overlap, and chemometric methods arise from spectral overlap, and chemometric methods
have been found to be mathematically suitable for the have been found to be mathematically suitable for the
resolution of overlapping spectral bands in such quantitative resolution of overlapping spectral bands in such quantitative
determinations (Sorouraddin determinations (Sorouraddin et al.et al. 2008). In such cases, 2008). In such cases,
more information can be extracted if multivariate (multi-more information can be extracted if multivariate (multi-
wavelength) spectrophotometric data are analysed by means wavelength) spectrophotometric data are analysed by means
of an appropriate chemometric method. Model-based (hard of an appropriate chemometric method. Model-based (hard
modelling) methods include traditional least-squares curve-modelling) methods include traditional least-squares curve-
fi tting approaches. These methods are based on a previous fi tting approaches. These methods are based on a previous
postulation of a chemical model in which a set of species is postulation of a chemical model in which a set of species is
defi ned according to their kinetic constants. These values are defi ned according to their kinetic constants. These values are
then refi ned using least-squares minimization.then refi ned using least-squares minimization.
Multivariate kinetic fi tting begins by postulating a Multivariate kinetic fi tting begins by postulating a
chemical model. The model is encoded into strings of text chemical model. The model is encoded into strings of text
representing the proposed chemical model and imputed into representing the proposed chemical model and imputed into
a computer program. An intelligent model parser extracts a computer program. An intelligent model parser extracts
the number of species, their names, their corresponding the number of species, their names, their corresponding
stoichiometric coeffi cients, and the number of reactions. stoichiometric coeffi cients, and the number of reactions.
The program produces a list of parameters and their The program produces a list of parameters and their
reaction coeffi cients followed by construction of a system reaction coeffi cients followed by construction of a system
of simultaneous ordinary differential equations (ODEs) of simultaneous ordinary differential equations (ODEs)
which describe the change in concentration of each species which describe the change in concentration of each species
over time (Dyson over time (Dyson et al.et al. 2003). This approach is completely 2003). This approach is completely
general so that a system of ODEs of arbigeneral so that a system of ODEs of arbitrary complexity trary complexity
can be automatically generated for can be automatically generated for any number of coupled any number of coupled
reactions. When the initial concentrations of the species in reactions. When the initial concentrations of the species in
the chemical model are known, the differential equations the chemical model are known, the differential equations
can be integrated to yield the concentration of each species can be integrated to yield the concentration of each species
at any desired time.at any desired time.
This model allows determination of the kinetic This model allows determination of the kinetic
parameters of the reaction, concentration profi les, and parameters of the reaction, concentration profi les, and
interpolation and extrapolation outside of the conditions interpolation and extrapolation outside of the conditions
used for its determination (Maeder and Zuberbühler 1990; used for its determination (Maeder and Zuberbühler 1990;
Maeder and Neuhold 2006; Maeder and Neuhold 2007; Maeder and Neuhold 2006; Maeder and Neuhold 2007;
Puxty Puxty et al.et al. 2008). It is also able t 2008). It is also able to o determine the pure determine the pure
component spectra of all non-steady-state absorbing species component spectra of all non-steady-state absorbing species
in the reaction, provided that no linear dependence exists in the reaction, provided that no linear dependence exists
between the spectral data and the concentration profi les of between the spectral data and the concentration profi les of
those species.those species.
Modelling of enzymatically driven pModelling of enzymatically driven processes is needed to rocesses is needed to
control certain parameters of interest, such as the evolution control certain parameters of interest, such as the evolution
of substrates and productof substrates and product concentrations, the rate constants concentrations, the rate constants
and the spectra of the involved species.and the spectra of the involved species.
Hard modelling has been discussed widely in the Hard modelling has been discussed widely in the
literature and its application in spectroscopic data and literature and its application in spectroscopic data and
chemical kinetic reaction analysis has been addressed by chemical kinetic reaction analysis has been addressed by
several authors (Maeder and Zuberbühler 1990; Molloy several authors (Maeder and Zuberbühler 1990; Molloy
et al.et al. 1999; Maeder and Neuhold 2006, 2007; Puxty 1999; Maeder and Neuhold 2006, 2007; Puxty et al.et al.
2008; Vosough 2008; Vosough et al.et al. 2008). In addition, a mixed hard- and 2008). In addition, a mixed hard- and
soft-modelling approach has been previously proposed by soft-modelling approach has been previously proposed by
Amigo Amigo et al.et al. (2006a, b) to study and monitor enzymatic (2006a, b) to study and monitor enzymatic
systems in biological fl uids. systems in biological fl uids.
In the present study, a new multi-wavelength model-In the present study, a new multi-wavelength model-
based method was developed and validated to study the based method was developed and validated to study the
kinetics of different enzyme reactions through analysing kinetics of different enzyme reactions through analysing
the reaction progress of only a single concentration of the the reaction progress of only a single concentration of the
substrate. The advantages of the proposed model over earlier substrate. The advantages of the proposed model over earlier
known methods are simplicity and rapid calculation of the known methods are simplicity and rapid calculation of the
kinetic parameters. For example, only a single concentration kinetic parameters. For example, only a single concentration
of the substrate is used to calculate the kinetic parameters, of the substrate is used to calculate the kinetic parameters,
instead of the several initial concentrations required in instead of the several initial concentrations required in
the Lineweaver–Burk method. Furthermore, by using the the Lineweaver–Burk method. Furthermore, by using the
proposed multi-wavelength method, the necessity of a proposed multi-wavelength method, the necessity of a
selective wavelength for the substrate or metabolite will selective wavelength for the substrate or metabolite will
not arise at all. To evaluate the applicability of the proposed not arise at all. To evaluate the applicability of the proposed
method, the conversion of xanthine to uric acid by xanthine method, the conversion of xanthine to uric acid by xanthine
oxidase (EC 1.17.3.2: xanthine oxygen oxidoreductase), and oxidase (EC 1.17.3.2: xanthine oxygen oxidoreductase), and
the oxidation of phenanthridine to phenanthridinone, and the oxidation of phenanthridine to phenanthridinone, and
6-deoxypenciclovir to penciclovir catalysed by aldehyde 6-deoxypenciclovir to penciclovir catalysed by aldehyde
oxidase (EC 1.2.3.1: aldehyde:oxidase (EC 1.2.3.1: aldehyde: oxygen oxidoreductase) oxygen oxidoreductase)
(fi gure 1) were investigated and the results were compared (fi gure 1) were investigated and the results were compared
with those obtained from the traditional method of with those obtained from the traditional method of
Lineweaver–Burk plot analysis. Lineweaver–Burk plot analysis.
2. Materials and methods2. Materials and methods
2.12.1 Chemicals Chemicals
All experiments were performed with analytical reagent-All experiments were performed with analytical reagent-
grade chemicals. Phenanthridine, phenanthridinone, grade chemicals. Phenanthridine, phenanthridinone,
xanthine and uric acid were purchased from Sigma-Aldrich xanthine and uric acid were purchased from Sigma-Aldrich
(Dorset, UK). Penciclovir (purity 99%) was purchased (Dorset, UK). Penciclovir (purity 99%) was purchased
from Livzon Pharmaceutical Group Co., Ltd. (Changzhou, from Livzon Pharmaceutical Group Co., Ltd. (Changzhou,
China). 6-Deoxypenciclovir was synthesized asChina). 6-Deoxypenciclovir was synthesized as
described previously (Harnden described previously (Harnden et al.et al. 1987). All other 1987). All other
chemicals were purchased from Merck (Darmstadt, chemicals were purchased from Merck (Darmstadt,
Germany).Germany).
2.22.2 Apparatus and software Apparatus and software
Spectrophotometric measurements were carried out at 37°C Spectrophotometric measurements were carried out at 37°C
using a Shimadzu 2550 UV/VIS spectrophotometer that was using a Shimadzu 2550 UV/VIS spectrophotometer that was
controlled by the Shimadzu UV Probe personal software controlled by the Shimadzu UV Probe personal software

A new multi-wavelength model-based method for determination of enzyme kinetic parameters 397
J. Biosci. 35(3), September 2010
package including kinetics software. The instrument was package including kinetics software. The instrument was
connected to a Shimadzu cell temperature control unit. connected to a Shimadzu cell temperature control unit.
A rectangular cuvette with a 1 cm path length was used A rectangular cuvette with a 1 cm path length was used
and the total volume used for the spectrophotometric and the total volume used for the spectrophotometric
measurements was constant (3.0 ml). All spectra were saved measurements was constant (3.0 ml). All spectra were saved
and performed in the ASCII format. The spectrophotometric and performed in the ASCII format. The spectrophotometric
data were transferred to a PC for subsequent manipulation data were transferred to a PC for subsequent manipulation
by a homemade program. The data were handled using the by a homemade program. The data were handled using the
MATLAB software (7.0).MATLAB software (7.0).
2.32.3 Preparation of partially purifi ed molybdenum Preparation of partially purifi ed molybdenum
hydroxylaseshydroxylases
Mature male Sprague–Dawley rats (150–250 g, Tabriz Mature male Sprague–Dawley rats (150–250 g, Tabriz
University of Medical Sciences, Iran) were used in this University of Medical Sciences, Iran) were used in this
study. They were fed with a standard laboratory diet and study. They were fed with a standard laboratory diet and
allowed food and water allowed food and water ad libitumad libitum. The temperature and . The temperature and
humidity were kept at 18±1ºC and 50%, respectively, and humidity were kept at 18±1ºC and 50%, respectively, and
the lighting cycle was 7:00–19:00 h light and 19:00–7:00 h the lighting cycle was 7:00–19:00 h light and 19:00–7:00 h
dark. Animals were handled with humane care in accordance dark. Animals were handled with humane care in accordance
with the guidelines of the National Institutes of Health. with the guidelines of the National Institutes of Health.
The animals were killed between 9:00 and 10:00 am The animals were killed between 9:00 and 10:00 am
by cervical dislocation. Livers were immediately excised, by cervical dislocation. Livers were immediately excised,
placed in ice-cold isotonic potassium chloride solution placed in ice-cold isotonic potassium chloride solution
(1.15% KCl w/v) containing 0.1 mM EDTA. The livers (1.15% KCl w/v) containing 0.1 mM EDTA. The livers
were then homogenized on ice in a homogenizer fi tted with were then homogenized on ice in a homogenizer fi tted with
a tefl on pestle. Partially purifi ed enzyme was prepared from a tefl on pestle. Partially purifi ed enzyme was prepared from
the liver homogenate by heat treatment and ammonium the liver homogenate by heat treatment and ammonium
sulphate precipitation as described elsewhere (Johnson sulphate precipitation as described elsewhere (Johnson et et
al.al. 1985). 1985).
2.42.4 Procedure Procedure
Enzyme processes are highly infl uenced by factors such Enzyme processes are highly infl uenced by factors such
as pH, the selected buffer and its concentration, enzyme as pH, the selected buffer and its concentration, enzyme
concentration and working temperature. Working conditions concentration and working temperature. Working conditions
that guarantee reproducibility of the measurements have to that guarantee reproducibility of the measurements have to
be established. The pH of the reaction solution was fi xed at be established. The pH of the reaction solution was fi xed at
7.4 using Sorenson buffer and the temperature of the system 7.4 using Sorenson buffer and the temperature of the system
was kept at 37ºC.was kept at 37ºC.
2.4.12.4.1 Determination of the kinetic parameters using the Determination of the kinetic parameters using the
Lineweaver–Burk method: Lineweaver–Burk method: As an initial step in the study of As an initial step in the study of
the overall reactions, the kinetic constants for the individual the overall reactions, the kinetic constants for the individual
reactions of oxidation of phenanthridine, 6-deoxypenciclovir reactions of oxidation of phenanthridine, 6-deoxypenciclovir
and xanthine were determined by means of steady-state and xanthine were determined by means of steady-state
velocity studies of reactions with different substrate velocity studies of reactions with different substrate
concentrations. The kinetic parameters for the metabolism concentrations. The kinetic parameters for the metabolism
of each compound were determined by monitoring the of each compound were determined by monitoring the
conversion of each substrate to the corresponding metabolite conversion of each substrate to the corresponding metabolite
at 37ºC and at the appropriate wavelength. at 37ºC and at the appropriate wavelength.
For phenanthridine, as a specifi c substrate of aldehyde For phenanthridine, as a specifi c substrate of aldehyde
oxidase (Rashidi oxidase (Rashidi et al.et al. 1997), the 1997), the KKmm and and VV
maxmax were assayed were assayed
by monitoring the production of phenanthridinone atby monitoring the production of phenanthridinone at
322 nm by aldehyde oxidase. The experiment was carried out 322 nm by aldehyde oxidase. The experiment was carried out
with initial concentrations of 8–30 with initial concentrations of 8–30 μμM of phenanthridine. M of phenanthridine.
In the case of 6-deoxypenciclovir, which is metabolized by In the case of 6-deoxypenciclovir, which is metabolized by
aldehyde oxidase (Rashidi aldehyde oxidase (Rashidi et al.et al. 1997), the initial velocity 1997), the initial velocity
of penciclovir formation from different concentrations of of penciclovir formation from different concentrations of
the substrate (100–300 the substrate (100–300 μμM) was determined at 310 nm. The M) was determined at 310 nm. The
kinetic constants for the conversion of xanthine, a specifi c kinetic constants for the conversion of xanthine, a specifi c
substrate of xanthine oxidase (Rashidi and Nazemiyeh substrate of xanthine oxidase (Rashidi and Nazemiyeh
2010), to uric acid was obtained through monitoring product 2010), to uric acid was obtained through monitoring product
formation at 295 nm following oxidation of xanthine at formation at 295 nm following oxidation of xanthine at
concentrations of 10–40 concentrations of 10–40 μμM. The concentration of the M. The concentration of the
enzyme solution used in the enzyme kinetic assays was 0.2 enzyme solution used in the enzyme kinetic assays was 0.2
mg/ml. All reactions were carried out in Sorenson phosphate mg/ml. All reactions were carried out in Sorenson phosphate
buffer (67 mM, pH 7.4, containing 0.1 mM EDTA) for 5 buffer (67 mM, pH 7.4, containing 0.1 mM EDTA) for 5
min by adding 100 min by adding 100 μμl enzyme fraction to 2.9 ml of substrate l enzyme fraction to 2.9 ml of substrate
solution and the initial oxidation rate of each reaction was solution and the initial oxidation rate of each reaction was
calculated from the linear part of the course of the reaction. calculated from the linear part of the course of the reaction.
Kinetic parameters including Kinetic parameters including KKmm and and VV
maxmax were calculated were calculated
from a double reciprocal (Lineweaver–Burk) plot.from a double reciprocal (Lineweaver–Burk) plot.
Figure 1. Oxidative conversion of phenanthridine to
phenanthridinone, 6-deoxypenciclovir to penciclovir, and xanthine
to uric acid
NNH
O
Phenanthridine Phenanthridinone
AO
HN
NN
N
O
O
HN
NH
NH
HN
O
O
O
XO
Xanthine Uric acid
N
NN
N
H2N
OHOH
N
NH
N
N
O
OHOH
H2N
AO
6-Deoxypenciclovir Penciclovir

2.4.22.4.2 Determination of the kinetic parameters using Determination of the kinetic parameters using
the multi-wavelength model-based method: the multi-wavelength model-based method: For the For the
multi-wavelength model-based method, only one concen-multi-wavelength model-based method, only one concen-
tration (10 tration (10 μμM as the fi nal concentration) of each comp-M as the fi nal concentration) of each comp-
ound (phenanthridine, 6-deoxypenciclovir and xanthine) ound (phenanthridine, 6-deoxypenciclovir and xanthine)
was used and the reaction was started by adding thewas used and the reaction was started by adding the
enzyme fraction. Each experiment was repeated three enzyme fraction. Each experiment was repeated three
times.times.
The oxidation of phenanthridine was monitored by The oxidation of phenanthridine was monitored by
repeated scanning between 210 and 260 nm and the spectra repeated scanning between 210 and 260 nm and the spectra
were recorded every 15 s for 20 min. were recorded every 15 s for 20 min.
In the case of 6-deoxypenciclovir, the wavelength range In the case of 6-deoxypenciclovir, the wavelength range
was set at 250–350 nm and the spectra of the progress of the was set at 250–350 nm and the spectra of the progress of the
reaction were recorded every 30 s for 40 min. reaction were recorded every 30 s for 40 min.
The spectra of progress of the oxidation reaction of The spectra of progress of the oxidation reaction of
xanthine to uric acid were recorded at 240–325 nm everyxanthine to uric acid were recorded at 240–325 nm every
30 s for 20 min.30 s for 20 min.
The spectral data obtained were converted into ASCII The spectral data obtained were converted into ASCII
fi les for further data analysis with the hard-modelling fi les for further data analysis with the hard-modelling
algorithm.algorithm.
2.4.32.4.3 Protein determination: Protein determination: Protein concentration was Protein concentration was
determined spectrophotometrically by a bicinchoninic acid determined spectrophotometrically by a bicinchoninic acid
kit using bovine serum albumin as the standard (Smith kit using bovine serum albumin as the standard (Smith et et
al.al. 1985). 1985).
3. Theory and algorithm3. Theory and algorithm
A multivariate (multi-wavelength) model-based method A multivariate (multi-wavelength) model-based method
is a rather complex procedure; however, when there is a is a rather complex procedure; however, when there is a
need to produce a large number of data matrices such as need to produce a large number of data matrices such as
spectral data at many wavelengths, it is considered as a very spectral data at many wavelengths, it is considered as a very
important and valuable method. For a spectroscopically important and valuable method. For a spectroscopically
monitored enzyme process, the matrices in the resolution monitored enzyme process, the matrices in the resolution
model can be expressed as: model can be expressed as:
DD = = CACA,, (3)(3)
where where DD is the collected spectra as a function of time, is the collected spectra as a function of time, CC (the (the
columns) is the kinetic concentration profi les of the different columns) is the kinetic concentration profi les of the different
species in the process, and species in the process, and AA (the rows) is the related pure (the rows) is the related pure
spectra. spectra.
For a given matrix For a given matrix DD, the best rate constants defi ning the , the best rate constants defi ning the
matrix matrix CC, as well as the best molar absorptivities collected , as well as the best molar absorptivities collected
in the matrix in the matrix AA could be determined easily using the model- could be determined easily using the model-
based data-fi tting method. The quality of the fi t is represented based data-fi tting method. The quality of the fi t is represented
by the matrix of residuals, by the matrix of residuals, RR; ;
RR = = DD––CA.CA. (4)(4)
The mechanism for fi rst-order metabolism reactions can be The mechanism for fi rst-order metabolism reactions can be
proposed according to this reaction scheme:proposed according to this reaction scheme:
SS + + EE ↔ [ ↔ [ESES] → ] → PP + + EE,, (5)(5)
where where SS, , EE, , SESE and and PP are substrate, enzyme, intermediate are substrate, enzyme, intermediate
and product, respectively. and product, respectively.
The rate at which the reaction (5) occurs can be explained The rate at which the reaction (5) occurs can be explained
using the Michaelis–Menten equation (1). Since the enzyme using the Michaelis–Menten equation (1). Since the enzyme
reaction rate (ν) is defi ned as the rate of consumption of the reaction rate (ν) is defi ned as the rate of consumption of the
substrate or production of metabolite, by assuming steady-substrate or production of metabolite, by assuming steady-
state conditions, the differential states can be written as state conditions, the differential states can be written as
equations (6) and (7) to explain the variations of substrate equations (6) and (7) to explain the variations of substrate
and metabolite concentrations with time in each enzyme and metabolite concentrations with time in each enzyme
reaction: reaction:
where [where [SS] and [] and [PP] are the substrate and product ] are the substrate and product
concentrations, concentrations, KKmm
is the Michaelis–Menten constant, and is the Michaelis–Menten constant, and
VVmax max
is the maximum velocity. These equations also indicate is the maximum velocity. These equations also indicate
the changes in substrate and product concentrations as a the changes in substrate and product concentrations as a
function of time. For a given value of function of time. For a given value of KKmm, , VV
maxmax and [ and [SS], it ], it
is possible to calculate is possible to calculate CC, which contains the concentration , which contains the concentration
profi les of the absorbing species (profi les of the absorbing species (SS and and PP) by solving of Eqs. ) by solving of Eqs.
6 and 7. For any particular matrix 6 and 7. For any particular matrix CC, the best set of molar , the best set of molar
absorptivities, absorptivities, AA, can be calculated using Eq. 8:, can be calculated using Eq. 8:
AA = = CC++DD,, (8)(8)
where where CC++ is the so-called pseudoinverse of is the so-called pseudoinverse of CC. Eq. 4 can be . Eq. 4 can be
rearranged as:rearranged as:
RR = = DD – – CCCC++D.D. (9)(9)
The molar absorptThe molar absorptivities are linear parameters, which can ivities are linear parameters, which can
be eliminated during the fi tting of the non-linear parameters be eliminated during the fi tting of the non-linear parameters
((KKmm and and VV
maxmax). Therefore, ). Therefore, RR is defi ned as a function of non- is defi ned as a function of non-
linear parameters only. linear parameters only.
Since 1973, several different methods have been Since 1973, several different methods have been
developed and are available for the fi tting of any number of developed and are available for the fi tting of any number of
parameters to a given measurement (Jezewska 1973; Lopez parameters to a given measurement (Jezewska 1973; Lopez
et al.et al. 2002). According to Maeder and Zuberbühler (1990), 2002). According to Maeder and Zuberbühler (1990),
these methods can be classifi ed into two groups: (a) direct these methods can be classifi ed into two groups: (a) direct
methods, where the sum of squares, ssq, of methods, where the sum of squares, ssq, of RR is minimized, is minimized,
and (b) the Newton-Gauss–Levenberg/Marquardt (NGL/and (b) the Newton-Gauss–Levenberg/Marquardt (NGL/
M) method, where the residuals, M) method, where the residuals, RR, are used to guide , are used to guide
the iterative process toward the minimum. In contrast to the iterative process toward the minimum. In contrast to
direct methods, the NGL/M type of algorithm requires the direct methods, the NGL/M type of algorithm requires the
complete vector or matrix of residuals to drive the iterative complete vector or matrix of residuals to drive the iterative
refi nement toward the minimum. The process starts from an refi nement toward the minimum. The process starts from an
initial assumption of the constants, initial assumption of the constants, KKmm and and VV
maxmax. Then, the . Then, the
parameter vector is continuously improved by the addition parameter vector is continuously improved by the addition
of the appropriate (‘best’) parameter shift vector Δof the appropriate (‘best’) parameter shift vector ΔKKmm and and
ΔΔVVmaxmax
. The shift vector is calculated using a sophisticated . The shift vector is calculated using a sophisticated
technique that is based on the derivatives of the residuals technique that is based on the derivatives of the residuals
with respect to the parameters.with respect to the parameters.
Therefore, the generTherefore, the general steps of the algorithm can be al steps of the algorithm can be
summarized as follows:summarized as follows:
Mohammad-Hossein Sorouraddin et al.398
J. Biosci. 35(3), September 2010
−[ ]=
+d Sdt
V SK Sm
max[ ][ ]0
0
, (6)
d Pdt
V S
K Sm
[ ]=
+max [ ]
[ ]0
0
, (7)

J. Biosci. 35(3), September 2010
A new multi-wavelength model-based method for determination of enzyme kinetic parameters 399
Figure 2. UV-vis monitoring of oxidation of 10 μM of phenanthridine to phenanthridinone by rat liver aldehyde oxidase; (a) repeated
scanning of the reaction progress of phenanthridine oxidation to phenanthridinone for 20 min; (b) the pure UV-vis spectra of phenanthridine
(—) and phenanthridinone (….) in comparison with the resolved spectra of phenanthridine (····) and phenanthridinone (○○○○); (c) the
resolved concentration profi les of phenanthridine (––) and phenanthridinone (….).

Mohammad-Hossein Sorouraddin et al.400
J. Biosci. 35(3), September 2010
1. Initial estimates of 1. Initial estimates of VVmaxmax
and and KKmm
as non-linear as non-linear
parameters, parameters,
2. Solving of differential equations (Eqs. 4 and 5) 2. Solving of differential equations (Eqs. 4 and 5)
using the ODE23 command of MATLAB to obtain using the ODE23 command of MATLAB to obtain
concentration matrix concentration matrix CC,,
3. Calculation of the residual matrix using Eq. 9, and3. Calculation of the residual matrix using Eq. 9, and
4. Optimization of 4. Optimization of KKmm and and VV
maxmax using the NGL/M using the NGL/M
algorithm.algorithm.
4. Results and discussion4. Results and discussion
Determination of enzyme kinetic parameters by linear Determination of enzyme kinetic parameters by linear
forms of the Michaelis–Menten equation such as the forms of the Michaelis–Menten equation such as the
Lineweaver–Burk plot is a time-consuming process and Lineweaver–Burk plot is a time-consuming process and
requires measurement of the initial metabolism of different requires measurement of the initial metabolism of different
concentrations of a substrate at an appropriate wavelength. concentrations of a substrate at an appropriate wavelength.
Apart from the complexity of the procedure and problems Apart from the complexity of the procedure and problems
encountered in fi nding an appropriate wavelength for encountered in fi nding an appropriate wavelength for
spectroscopic assay of reaction progress, producing spectroscopic assay of reaction progress, producing
reproducible results is sometimes problematic. In the reproducible results is sometimes problematic. In the
present study, a new simple multi-wavelength model-based present study, a new simple multi-wavelength model-based
method was developed to obtain enzyme kinetic parameters. method was developed to obtain enzyme kinetic parameters.
The productivity and applicability of the proposed method The productivity and applicability of the proposed method
was evaluated by spectrophotometric study of three was evaluated by spectrophotometric study of three
different enzyme reactions. This method requires only different enzyme reactions. This method requires only
spectrophotometrical monitoring of the reaction progress spectrophotometrical monitoring of the reaction progress
of substrate transformation at one concentration by repeated of substrate transformation at one concentration by repeated
scanning in spite of any overlap between the spectra of the scanning in spite of any overlap between the spectra of the
reaction components. To evaluate the validity of the method, reaction components. To evaluate the validity of the method,
the proposed method was applied to determine the kinetic the proposed method was applied to determine the kinetic
parameters of three enzyme reactions and the results were parameters of three enzyme reactions and the results were
compared with those obtained from the Lineweaver–Burk compared with those obtained from the Lineweaver–Burk
plot. In fi gure 2, the spectrophotometric data for the plot. In fi gure 2, the spectrophotometric data for the
oxidation of phenanthridine by rat liver aldehyde oxidase oxidation of phenanthridine by rat liver aldehyde oxidase
has been illustrated. Both the Lineweaver–Burk plot and the has been illustrated. Both the Lineweaver–Burk plot and the
proposed multi-wavelength model-based method produced proposed multi-wavelength model-based method produced
very similar results (table 1) indicating the validity of the very similar results (table 1) indicating the validity of the
proposed method. The results obtained are comparable proposed method. The results obtained are comparable
to those reported by Sorouraddin to those reported by Sorouraddin et al.et al. (2009). They (2009). They
have reported 2.20 have reported 2.20 μμM and 0.037 M and 0.037 μμmol/min/mg values mol/min/mg values
(obtained from spectrofl ourometric-multivariate calibration (obtained from spectrofl ourometric-multivariate calibration
method) and 5.79 method) and 5.79 μμM and 0.047 M and 0.047 μμmol/min/mg values mol/min/mg values
(calculated by the spectrophotometric-univariate calibration (calculated by the spectrophotometric-univariate calibration
method) for method) for KKmm and and VV
maxmax, re, respectively. Meanwhile, the spectively. Meanwhile, the
simplicity of the new method and its ability to overcome simplicity of the new method and its ability to overcome
spectroscopic interference of the reaction components are spectroscopic interference of the reaction components are
two major advantages of this method over the well-known two major advantages of this method over the well-known
Lineweaver–Burk plot analysis. In addition, it has been Lineweaver–Burk plot analysis. In addition, it has been
indicated that the determination of kinetic parameters for indicated that the determination of kinetic parameters for
the oxidation of phenanthridine to phenanthridinone by the oxidation of phenanthridine to phenanthridinone by
guinea pig or rabbit liver aldehyde oxidase using univariate guinea pig or rabbit liver aldehyde oxidase using univariate
spectroscopic methods is not successful due to a lower limit spectroscopic methods is not successful due to a lower limit
of detection; however, the problem can be overcome using of detection; however, the problem can be overcome using
multivariate calibration methods (Sorouraddin multivariate calibration methods (Sorouraddin et al.et al. 2008). 2008).
Therefore, the applicability of the method developed in this Therefore, the applicability of the method developed in this
study to determine the kinetic parameters for the oxidation study to determine the kinetic parameters for the oxidation
of phenanthridine by guinea pig or rabbit liver aldehyde of phenanthridine by guinea pig or rabbit liver aldehyde
oxidase would be another advantage of the proposed oxidase would be another advantage of the proposed
method. method.
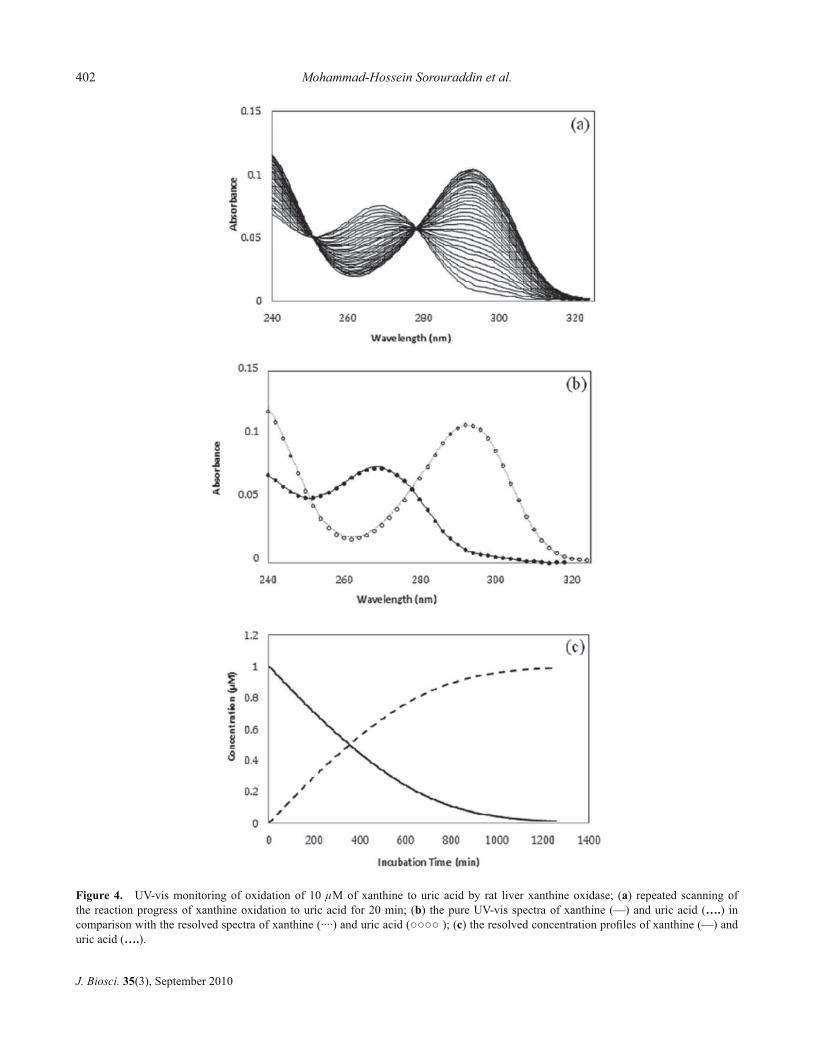
To further confi rm the applicability of the proposed To further confi rm the applicability of the proposed
method for other enzyme reactions, the UV spectral data for method for other enzyme reactions, the UV spectral data for
the oxidation of 6-deoxypenciclovir and xanthine were also the oxidation of 6-deoxypenciclovir and xanthine were also
analysed (fi gures 3 and 4). 6-Deoxypenciclovir is a synthetic analysed (fi gures 3 and 4). 6-Deoxypenciclovir is a synthetic
guanine derivative which is metabolized to the antiviral guanine derivative which is metabolized to the antiviral
compound penciclovir by aldehyde oxidase (Rashidi compound penciclovir by aldehyde oxidase (Rashidi et et
al.al. 1997). The results obtained from the analysis of the 1997). The results obtained from the analysis of the
collected data using the proposed method together with the collected data using the proposed method together with the
results obtained from the Linewever–Burk plot are given in results obtained from the Linewever–Burk plot are given in
table 1. Rashidi table 1. Rashidi et al.et al. (1997) have reported (1997) have reported KKmm=370 =370 μμM and M and
VVmaxmax
=0.026 =0.026 μμmol/min/mg values for 6-deoxypencyclovir mol/min/mg values for 6-deoxypencyclovir
oxidation by rat liver aldehyde oxidase. Similar results oxidation by rat liver aldehyde oxidase. Similar results
were obtained with the oxidation of xanthiwere obtained with the oxidation of xanthine to uric acid by ne to uric acid by
xanthine oxidase (table 1). The kinetic constants we obtained xanthine oxidase (table 1). The kinetic constants we obtained
are consistent with those reported by others (Escribano are consistent with those reported by others (Escribano et al.et al.
1988).1988).
The proposed multi-wavelength model-based method The proposed multi-wavelength model-based method
was successfully applied to calculate kinetic parameters was successfully applied to calculate kinetic parameters
for fi rst-order enzyme reactions using only a singlefor fi rst-order enzyme reactions using only a single
initial concentration of the substrate, regardless ofinitial concentration of the substrate, regardless of
any spectral overlap. This technique was used to measureany spectral overlap. This technique was used to measure
the the KKmm and and VV
max max values for three enzyme reactions. Invalues for three enzyme reactions. In
addition, kinetic parameters for each reaction were calculated addition, kinetic parameters for each reaction were calculated
using the traditional Lineweaver–Burk method andusing the traditional Lineweaver–Burk method and
the results obtained by the two methods were foundthe results obtained by the two methods were found
Table 1. Comparison of the kinetic parameters obtained from traditional Lineweaver–Burk plot analysis and the proposed hard-
modelling methods for the oxidation of xanthine catalysed by rat liver xanthine oxidase, and oxidation of phenanthridine and 6-
deoxypenciclovir catalysed by rat liver aldehyde oxidase*
Phenanthridine 6-Deoxypenciclovir Xanthine
Km (μM) V
max (μmol/
min/mg)
Km (μM) V
max (μmol/
min/mg)
Km (μM) V
max (μmol/
min/mg)
Lineweaver–Burk plot analysis 2.27 (3.31) 0. 45 (3.16) 316.29 (2.91) 0.90 (3.19) 3.57 (2.43) 0.47 (2.81)
Multi-wavelength model-based method 1.82 (2.34) 0.44 (1.99) 333.33 (3.12) 0.96 (3.71) 3.67 (1.76) 0.53 (2.11)
* The numbers given in parentheses represent relative standard deviations (%) (N=3).

A new multi-wavelength model-based method for determination of enzyme kinetic parameters 401
J. Biosci. 35(3), September 2010
Figure 3. UV-vis monitoring of oxidation of 10 μM of 6-deoxypenciclovir to penciclovir by rat liver aldehyde oxidase; (a) repeated
scanning of the reaction progress of 6-deoxypenciclovir oxidation to penciclovir for 40 min; (b) the pure UV-vis spectra of 6-
deoxypenciclovir (––) and penciclovir (….) in comparison with the resolved spectra of 6-deoxypenciclovir (····) and penciclovir (○○○○);
(c) the resolved concentration profi les of 6-deoxypnciclovir (––) and penciclovir (….).
Mohammad-Hossein Sorouraddin et al.402
J. Biosci. 35(3), September 2010
Figure 4. UV-vis monitoring of oxidation of 10 μM of xanthine to uric acid by rat liver xanthine oxidase; (a) repeated scanning of
the reaction progress of xanthine oxidation to uric acid for 20 min; (b) the pure UV-vis spectra of xanthine (––) and uric acid (….) in
comparison with the resolved spectra of xanthine (····) and uric acid (○○○○ ); (c) the resolved concentration profi les of xanthine (––) and
uric acid (….).

A new multi-wavelength model-based method for determination of enzyme kinetic parameters 403
J. Biosci. 35(3), September 2010
to be in very good agreement. Simplicity, low cost, andto be in very good agreement. Simplicity, low cost, and
the applicability othe applicability of the proposed method in those conditions f the proposed method in those conditions
with extensive overlapping spectra make this method with extensive overlapping spectra make this method
an effi cient tool an effi cient tool for kinetic studies of fi rst-order enzyme for kinetic studies of fi rst-order enzyme
reactions.reactions.
ReferencesReferences
Amigo J M, Juan A, Coello J and Maspoch S 2006a A mixed hard- Amigo J M, Juan A, Coello J and Maspoch S 2006a A mixed hard-
and soft-modelling approach for the quantitative determination and soft-modelling approach for the quantitative determination
of oxipurines and uric acid in human urine; of oxipurines and uric acid in human urine; Anal. Chim. ActaAnal. Chim. Acta
567567 236–244 236–244
Amigo J M, Juan A, Coello J and Maspoch S 2006b A mixed hard- Amigo J M, Juan A, Coello J and Maspoch S 2006b A mixed hard-
and soft-modelling approach to study and monitor enzymatic and soft-modelling approach to study and monitor enzymatic
systems in biological fl uids; systems in biological fl uids; Anal. Chim. ActaAnal. Chim. Acta 567567 245–254 245–254
Baily J E and Ollis D F 1986 Baily J E and Ollis D F 1986 Biochemical engineering fundamentalsBiochemical engineering fundamentals
(New York: McGraw Hill)(New York: McGraw Hill)
Beedham C 2002 Beedham C 2002 Enzyme systems that metabolize drugs and other Enzyme systems that metabolize drugs and other
xenobiotics xenobiotics (Chichester, UK: John Wiley)(Chichester, UK: John Wiley)
Dyson R, Maeder M, Puxty G and Neuhold Y M 2003 Simulation Dyson R, Maeder M, Puxty G and Neuhold Y M 2003 Simulation
of complex chemical kinetics; of complex chemical kinetics; Inorg. React. Mech.Inorg. React. Mech. 55 39–46 39–46
Escribano J, Garcia-Canovas F and Garcia-Carmona F 1988 A Escribano J, Garcia-Canovas F and Garcia-Carmona F 1988 A
kinetic study of hypoxanthine oxidation by milk xanthine kinetic study of hypoxanthine oxidation by milk xanthine
oxidase; oxidase; Biochem. J.Biochem. J. 254254 829–833 829–833
Harnden M R, Jarvest R L, Bacon T H and Boyd M R 1987 Synthesis Harnden M R, Jarvest R L, Bacon T H and Boyd M R 1987 Synthesis
and antiviral activity of 9-[4-hydroxy-3-(hydroxymethyl)but-1-and antiviral activity of 9-[4-hydroxy-3-(hydroxymethyl)but-1-
yl]purines; yl]purines; J. Med. Chem.J. Med. Chem. 3030 1636–1642 1636–1642
Jezewska M M 1973 Xanthine accumulation during hypoxanthine Jezewska M M 1973 Xanthine accumulation during hypoxanthine
oxidation by milk xanthine oxidase; oxidation by milk xanthine oxidase; Eur. J. Biochem.Eur. J. Biochem. 3636
385–390385–390
Johnson C, Stubley-Bedhaam C and Stell J P 1985 A potent Johnson C, Stubley-Bedhaam C and Stell J P 1985 A potent
inhibitor of aldehyde oxidase activity in vitro and in vivo; inhibitor of aldehyde oxidase activity in vitro and in vivo;
Biochem. Pharmacol.Biochem. Pharmacol. 3434 4251–4256 4251–4256
Lopez N, Prerz R, Vazquez F, Vaero F and Sanchez A J 2002 Lopez N, Prerz R, Vazquez F, Vaero F and Sanchez A J 2002
Immobilisation of different Immobilisation of different Candida rugosaCandida rugosa lipases by lipases by
adsorption onto polypropylene powder: application to chiral adsorption onto polypropylene powder: application to chiral
synthesis of ibuprofen and trans-2-phenyl-1-cyclohexanol synthesis of ibuprofen and trans-2-phenyl-1-cyclohexanol
esters; esters; J. Chem. Technol. Biotechnol.J. Chem. Technol. Biotechnol. 7777 175–182 175–182
Maeder M and Neuhold Y M 2007 Maeder M and Neuhold Y M 2007 Practical data analysis in Practical data analysis in
chemistrychemistry (Amsterdam: Elsevier) (Amsterdam: Elsevier)
Maeder M and Neuhold Y M 2006 Maeder M and Neuhold Y M 2006 Practical guide to chemometricsPractical guide to chemometrics
(Boca Raton, FL: C Press)(Boca Raton, FL: C Press)
Maeder M and Zuberbühler A D 1990 Nonlinear least-squares Maeder M and Zuberbühler A D 1990 Nonlinear least-squares
fi tting of multivariate absorption data; fi tting of multivariate absorption data; Anal. Chem.Anal. Chem. 6262
2220–22242220–2224
Molloy K J, Maeder M and Schumacher M M 1999 Hard Molloy K J, Maeder M and Schumacher M M 1999 Hard
modelling of spectroscopic measurements. Applications in modelling of spectroscopic measurements. Applications in
non-ideal industrial reaction systems; non-ideal industrial reaction systems; Chemometr. Intell. Lab.Chemometr. Intell. Lab.
4646 221–230 221–230
Puxty G, Neuhold Y M, Jecklin M, Ehly M, Gemperline P, Puxty G, Neuhold Y M, Jecklin M, Ehly M, Gemperline P,
Nordon A, Littlejohn D, Basford J K Nordon A, Littlejohn D, Basford J K et al.et al. 2008 Multivariate 2008 Multivariate
kinetic hard-modelling of spectroscopic data: a comparison of kinetic hard-modelling of spectroscopic data: a comparison of
the esterifi cation of butanol by acetic anhydride on different the esterifi cation of butanol by acetic anhydride on different
scales and with different instruments; scales and with different instruments; Chem. Eng. Sci.Chem. Eng. Sci. 6363
4800–48094800–4809
Rashidi M R, Smith J A, Clarke S E and Beedham C 1997 In vitro Rashidi M R, Smith J A, Clarke S E and Beedham C 1997 In vitro
oxidation of famciclovir and 6-deoxypenciclovir by aldehyde oxidation of famciclovir and 6-deoxypenciclovir by aldehyde
oxidase from human, guinea pig, rabbit, and rat liver; oxidase from human, guinea pig, rabbit, and rat liver; Drug Drug
Metab. Dispos.Metab. Dispos. 77 805–813 805–813
Rashidi M R and Nazemiyeh H 2010 Inhibitory effects of Rashidi M R and Nazemiyeh H 2010 Inhibitory effects of
fl avonoids on molybdenum hydroxylases activity; fl avonoids on molybdenum hydroxylases activity; Expert Opin. Expert Opin.
Drug Metab. ToxicolDrug Metab. Toxicol. . 66 133–152 133–152
Smith P K, Krohn R I, Hermanson G T, Mallia A K, Gartner F Smith P K, Krohn R I, Hermanson G T, Mallia A K, Gartner F
H, Provenzano M D, Fujimoto E K, Goeke N M H, Provenzano M D, Fujimoto E K, Goeke N M et al.et al. 1985 1985
Measurement of protein using bicinchoninic acid. Measurement of protein using bicinchoninic acid. Anal. Anal.
Biochem.Biochem. 150150 76–85 76–85
Sorouraddin M H, Fooladi E, Naseri A and Rashidi M R 2008 A Sorouraddin M H, Fooladi E, Naseri A and Rashidi M R 2008 A
novel spectrophotometric method for determination of kinetic novel spectrophotometric method for determination of kinetic
constants of aldehyde oxidase using a multivariate calibration constants of aldehyde oxidase using a multivariate calibration
method; method; J. Biochem. Biophys. MethodsJ. Biochem. Biophys. Methods 7070 999–1005 999–1005
Sorouraddin M H, Fooladi E, NaseriSorouraddin M H, Fooladi E, Naseri A and Rashidi M R 2009 A and Rashidi M R 2009
Development of a sensitive spectrofl uorometric-multivariate Development of a sensitive spectrofl uorometric-multivariate
calibration method for enzyme kinetic of aldehyde oxidase; calibration method for enzyme kinetic of aldehyde oxidase;
Iran. J. Pharm. Res.Iran. J. Pharm. Res. 88 169–177 169–177
Vosough M, Maeder M, Jalali-Heravi M and Norman S E 2008 Vosough M, Maeder M, Jalali-Heravi M and Norman S E 2008
Model-based analysis for kinetic complexation study of Pizda Model-based analysis for kinetic complexation study of Pizda
and Cu(II); and Cu(II); Spectrochim. Acta ASpectrochim. Acta A 7070 674–681 674–681
MS received 23 February 2010; accepted 19 July 2010
ePublication: 5 August 2010
Corresponding editor: MARÍA ELIANO LANIO