Atmospheres of indagation: disasters and the politics of excessiveness
Upload
independentCategory
view
0download
0
A NEW MODEL FOR THE STRUCTURE OF THE DACs REGIONS INTHE Oe AND Be STELLAR ATMOSPHERES
E. DANEZIS, D. NIKOLAIDIS, V. LYRATZI, M. STATHOPOULOU,E. THEODOSSIOU, A. KOSIONIDIS, C. DRAKOPOULOS, G. CHRISTOU
and P. KOUTSOURISUniversity of Athens, School of Physics Department of Astrophysics, Astronomy and Mechanics,
Panepistimiopolis, Zografos 157 84 Athens – Greece
(Received 27 March 2001; accepted 5 December 2002)
Abstract. As it is already known, the spectra of many Oe and Be stars present Discrete AbsorptionComponents (DACs) which, because of their profiles’ width as well as the values of the expansion/ contraction velocities, they create a complicated profile of the main spectral lines. This fact isinterpreted by the existence of two or more independent layers of matter, in the region where themain spectral lines are formed. Such a structure is responsible for the formation of a series of satellitecomponents (DACs) for each main spectral line. In this paper we present a first approximation to amathematical model reproducing the complex profile of the spectral lines of Oe and Be stars thatpresent DACs. This model presupposes that the regions, where these spectral lines are formed, arenot continuous but consist of a number of independent absorbing density layers of matter, followedby an emission region and an external general absorption region. When we fit the spectral lines thatpresent DACs, with this model, we can calculate the values of the apparent rotation and expansion /contraction velocities of the regions where the DACs are formed.
1. Introduction
Peton (1974) first pointed out, in the visual spectrum of the double system AXMon (HD 45910), the existence of a secondary component of the absorption lineFeII λ 4233A, which, depending on the phase, appeared in the violet or in the redside of the main spectral line. For this reason the secondary component was named‘satellite component’.
Underhill (1975) observed sharp components of the ions N II, C II and Mg II inthe spectrum of HD 58350 and attributed the one of the velocity of 230 km/s to agas cloud accelerated from the star and moving rapidly out of the star and the otherof the velocity of about 25 km/s to a moving circumstellar shell.
Lamers et al. (1982) noted the possibility of the presence of satellite componentssuperimposed on the wide P Cygni profile of the UV resonance lines of the OeIIfstar HD 175754 and suggested that they may be the result of ionization gradientsin an otherwise spherically symmetric and time-steady wind.
Franco et al. (1983) studied the P Cygni profiles of the above mentioned reson-ance lines of HD 175754 observed at different epochs and they reported variabilityat the secondary satellite component. They proposed for this star two different
Astrophysics and Space Science 284: 1119–1142, 2003.© 2003 Kluwer Academic Publishers. Printed in the Netherlands.

1120 E. DANEZIS ET AL.
mechanisms for the explanation of the variability, namely, a thermal mechanismin a hot region at Tc=2×10⁵ K which produces the principal stationary componentand a mechanism which gives rise to the secondary by ionization of cooler highvelocity stellar material from X-rays coming from inner coronal region.
Mullan (1984a,b, 1986) suggested that the satellite components may result from‘corotating interaction regions’ (CIRs), which may form in stars’ winds and dependon asymmetries in the wind velocity or density.
Danezis (1984, 1986) and Danezis et al. (1991) studied the UV spectra of thegaseous envelope of AX Mon taken by the IUE satellite (at phase 0.568) andnoted that the absorption lines of many ionization potential ions, not only of thosepresenting P Cygni profile, are accompanied by two strong absorption componentsof the same ion and the same wavelength, shifted at different �λ, in the violet sideof each main spectral line. This means that the regions where these spectral linesare created are not continuous, but they are formed by a number of independentdensity layers of matter. These layers of matter can rotate and move with differentapparent velocities.
The existence of satellite components in the UV spectrum of AX Mon has beenverified by Sahade et al. (1984) and Sahade and Brandi (1985) at the phase of 0.095.Also, Hutsemekers (1985) in the UV spectrum of another Be star, HD 50138,noticed a number of satellite components that accompanied the main spectral lines.
Bates and Halliwell (1986), naming the satellite components as ‘discrete ab-sorption components’ (DACs), constructed a model of ejection of gas parcels fromabove the star’s photosphere, accelerated by radiation pressure. In order to describethe DACs, many suggestions about the properties of the winds have been made,which propose that the DACs are due to disturbances in the wind such as materialthat forms spiral streams as a result of the star’s rotation (Mullan, 1984a; Prinja andHowarth, 1988) or to mass ejections constructing ‘shells’, ‘puffs’ or gas ‘parcels’(Henrichs, 1984; Underhill and Fahey, 1984; Bates and Halliwell, 1986; Grady etal., 1987; Lamers et al., 1988).
Willis et al. (1989) argued against these components being formed in discretemass conserving density enhancements, such as shells or blobs. They proposed thatthey result from ‘largely chaotic structures in the wind’ and that ‘they are formedby different material at different times’, because of radiative instability (Mulan,1984; Owocki et al., 1988; Prinja et al., 1988).
Bates and Gilheany (1990) and Gilheany et al. (1990) pointed out that ‘it isdifficult to identify unambiguously DAC and wind signatures from a single spec-trum of a star, as the UV spectrum of late B stars is very crowded with photosphericlines’. So, in their study of twelve B5 – B9 supergiants they employed a code basedon spherical symmetry, they fitted ‘Gaussian profiles to the spectra and derivedvalues for the observed component velocity widths and equivalent widths’. Theyconcluded to the non-simultaneous appearance of DACs in different ions and theyattributed the presence of DACs to mass-loss (Burki et al., 1982).

A NEW MODEL FOR THE STRUCTURE OF THE DACs REGIONS 1121
However, Danezis and Theodossiou (1988, 1990) could not find satellite com-ponents (DACs) of the main spectral lines of another Be star, 88 Herculis. Las-karides et al. (1992a) observed one more satellite component in the spectral linesof ions with low ionization potential in the UV spectrum of AX Mon, this in thered side of the main lines. The existence of the spectral lines in the red side of themain lines has been proposed by Doazan in 1983. This fact indicates contractionof the outer layers of the gaseous envelope.
Waldron et al. (1992) studied ‘the time-dependent hydrodynamical influenceof a spherically symmetric propagating density pulse/shell in the stellar wind’ ofthe O4I(n)f star HD 66811 (ζ Puppis) and suggested that ‘the DACs behaviour isassociated with these density pulses which are injected into the supersonic wind bysome unknown initiating mechanism’. In a later study of ζ Puppis (1994), based on‘the long-term regularity of occurrence (Kaper et al., 1990), the short-term beha-viour that appears to be related to the stellar rotation rate (Prinja, 1988, 1992) andthe observed photospheric and wind-line variability that appears to be correlated’(Henrichs, 1990), they suggested that ‘the mechanism responsible for initiatingDACs may be dynamically linked to the photosphere and that they must appeardue to the inherently unstable nature of radiatively driven winds’. In this study theytried to give an explanation to the large-scale ejection phenomena by modellingthe full time-dependent hydrodynamic response of a stellar wind to a sphericallysymmetric propagating density shell, which suggests that a substantial amount ofmaterial must be present in front of the stellar disk to reproduce the observations.They concluded to DACs’ behaviour in UV P Cygni line profiles being the resultof the density shells (Lamers et al., 1978; Henrichs et al., 1980, 1983), which arehydrodynamically stable and propagate through the supersonic wind structure asstable solitary waves. They also concluded to the following: ‘the shell acceleratesin conjunction with the underlying wind structure, the velocity fluctuations aresmall and the shell dynamics are found to be essentially independent of the adoptedenergy equation’.
Henrichs et al. (1994) in their study on ξ Per agree with the suggestion that‘the DACs are formed in absorbing layers in the line of sight, projected against thestellar disk’ and proposed that ‘similar density structures must also be present inthe emitting volume around the star’. They suggested that the DACs originate in ex-panding high-density regions behind fronts due to amplified radiative instabilitiesin the wind.
Telting et al. (1993, 1994) studied the Be star γ Cas and proposed a model forthe description of the envelope, which combines two types of stellar winds: ‘a denseequatorial disc in which the Balmer emission lines and the IR excess are formedand a rapidly expanding radiation-driven wind streaming from higher latitudes ofthe star, which forms the UV resonance lines’. They calculated the same valuesfor the outflow velocity of DACs of different doublets in many spectra, indicatingthat these DACs must be formed in ‘one particular outflowing high-density windstructure’.

1122 E. DANEZIS ET AL.
Cranmer and Owocki (1996), based on ‘the lack of emission variability inUV P Cygni lines (Prinja and Howarth, 1988) and significant infrared variability(Howarth, 1992)’, as well as to the fact that ‘the observed strong absorption dipscan be produced if the structure of the wind is large enough in order to covera substantial fraction of the stellar disk’, suggested that the DACs originate from‘moderate size wind structures such as spatially localized clouds, streams or blobs’.They proposed a hydrodynamical model considering an azimuthally inhomogen-eous radiation-driven wind for the formation of large-scale CIRs. They suggestedthat DACs could derive by CIRs resulting from a magnetic field (Mulan, 1984a,b,1986), with closed and open magnetic loops above the stellar surface (Underhilland Fahey, 1984) and ‘for which the surface mass loss ‘eruption’ lasts long enoughto make structure that covers a substantial portion of the stellar disk’.
Rivinius et al. (1997) studied the optical spectra of B hypergiants and suggesteda model for the time-dependent wind variations, which accepts ‘spherical steadywind with randomly distributed and outwards moving inhomogeneities (‘blobs’)’.They proposed that when the ‘blobs’ are in front of the stellar disk they give riseto the DACs appearance, otherwise they only contribute to some extra radiationemitted in all directions (Lamers, 1994). Because of the presence of the DACs atvery low velocities, they suggested that the ‘blobs’ originate not in the wind but inthe photosphere or in even deeper layers.
Prinja et al. (1997) detected an ‘extremely narrow DAC’ (‘Super DAC’) inall the spectral lines of the B supergiant γ Ara, which ‘demonstrates ionizationstratification in the wind and is likely due to a very dense region that covers mostof the projected surface of the visible hemisphere of the star’. They suggested thatthe wind of this star may be ‘equatorially enhanced’ probably because of its rapidrotation and that the ‘Super DAC’ is formed in the equatorial region or results fromCIRs or ‘arises from time-dependent wind fluctuations, (perhaps enhanced massloss) which do not invoke latitude-dependence, but simply represents denser gasaccelerating more slowly to a lower terminal velocity’.
Fullerton et al. (1997) in their study of the B supergiant HD 64760 sugges-ted that the wind is not spherically symmetric and the wind structures that areresponsible for the DACs are not radial, but extend for more than 90◦ in azimuthand about 30◦ in longitude and have a spiral shape. These spirals corotate withthe stellar surface, implying that they are linked to photospheric phenomena, andform density regions in the stellar wind. They concluded to the interesting factthat ‘the radial expansion of the wind of HD 64760 is not too different from theoutflows derived for spherically symmetrical, steady-state models of the winds ofearly-type stars’. They proposed that this may be due to the possibility that ‘theradial expansion of the wind may not be strongly affected by the presence of thespirals’. They explained the appearance of different ions’ DACs by ‘the presenceof an ionization or density gradient across the width of the spirals, such as that theinner edge favors the presence of more highly ionized species’.

A NEW MODEL FOR THE STRUCTURE OF THE DACs REGIONS 1123
Cidale (1998) studied the MgII lines in Be stars considering spherical symmetryfor the expanding circumstellar medium to which she attributed the presence of theblueshifted absorption components and proposed that ‘a decelerating wind yieldsdenser outer regions which could enhance the emission’.
Kaper et al. (1996, 1997, 1999) studied a series of 10 bright O stars and de-scribed the shape of the individual absorption components by an exponential Gaus-sian. They calculated the same velocity in resonance lines formed by different ionsand proposed that the edge variability is directly related to the DACs (Henrichset al., 1988, 1994; Prinja, 1991), which actually have an impact on the positionof the edge. They suggested that the DACs are related with interacting fast or slowmoving wind streams of higher density, corotating with the star (CIRs). The curvedstreams cause fast wind material to collide with slow wind material in front of it,constructing high density regions, and the star’s rotation results to the interactionregion having also spiral shape and corotating with the star. The wind material,though, due to the conservation of its angular momentum, does not corotate withthe star, but it moves radially and meets the interaction region at distance from thestar. They proposed that ‘the DACs are not formed in the CIRs themselves, butoriginate in the so-called radiative-acoustic kinks trailing the CIRs’. As the DACsfound in different ions’ resonance lines have the same velocity, they should ori-ginate from high density regions, which should be geometrically extended in orderto be observable by covering a significant fraction of the stellar disk. They alsosuggested that because of the stable appearance of DACs over long time periods,‘the physical process responsible for the formation of slow (or fast) streams has tobe rather stable’, meaning that the streams may be due to non-radial pulsations or,less likely, a surface magnetic field.
Cranmer et al. (2000) studied the DACs that appear in the spectra of γ Cas inorder to determine the nature of the interaction between winds and disks of Be stars(Telting and Kaper, 1994). They pointed out that the outflowing gas responsible forthe DACs formation is denser than the mean undisturbed polar wind. They pro-posed that the density region responsible for the appearance of DACs may be dueto ‘the existence of compressible shocks propagating through the polar wind’. Theystressed out that ‘the mean DAC structure does not seem to rotate with the star,meaning that it is independent of the more localized spiral-shaped opacity modu-lations embedded within it’. It is interesting that, as some of the spectral featurescould not be fitted with a Gaussian function, they decided to fit it by a sum of twoor more Gaussians, without implying, though, that ‘the central velocities of theseextra terms should be interpreted as independent dynamical wind features’. Theyconfirmed the suggestion that ‘DACs do not represent isolated mass-conserving‘blobs’, but instead they indicate the presence of a rotating pattern or perturbationthrough which wind material flows’. They detected slower acceleration or evendeceleration of the regions responsible for DACs compared to the mean stellarwind.

1124 E. DANEZIS ET AL.
Markova (2000) studied the line-profile variability in P Cygni’s optical spec-trum and concluded to the fact that the recurrence of DACs is hardly related to thestellar rotation and that the DACs are not due to single mass-conserving features,such as outward moving blobs, but that they may originate from outward moving,large-scale, high-density perturbations, which possibly originate from the photo-sphere, but develop in the outer wind and through which wind material flows. Theseperturbations may be spherically symmetric density shells or curved structures likekinks.
Danezis et al. (1991, 1995, 1997a,b 1998, 1999, 2000a,b,c, 2001,a,b,c, 2002,a, b, c), Theodossiou et al. (1993, 1997), Laskarides et al. (1992a, 1992b, 1993a,1993b), Stathopoulou et al. (1995, 1997), Lyratzi et al. (2001, 2002a,b) Kyriako-poulou et al. (2001) and Christou et al. (2001) apart from their study on the UVspectrum of Be stars, where they found satellite components, they have also studiedthe UV spectrum of several Oe stars and detected satellite components, not onlyfor the spectral lines of low ionization potential, but also for the resonance lines ofNV, CIV, SiIV and the spectral line NIV.
2. The Main Idea of Our Research
It is obvious from the above that many suggestions have been made in order toexplain the DACs phenomenon. Most researchers have suggested mechanisms thatallow the existence of structures which cover all or a significant part of the stellardisk, such as shells, blobs or puffs (Underhill, 1975; Henrichs, 1984; Underhilland Fahey, 1984; Bates and Halliwell, 1986; Grady et al., 1987; Lamers et al.,1988; Waldron et al., 1992; Cranmer and Owocki, 1996; Rivinious et al., 1997;Kaper et al., 1996, 1997, 1999; Markova, 2000), interaction of fast and slow windcomponents, CIRs, structures due to magnetic fields or spiral streams as a resultof the star’s rotation (Underhill and Fahey, 1984; Mullan, 1984a,b 1986; Prinjaand Howarth, 1988; Cranmer and Owocki, 1996; Fullerton et al., 1997; Kaperet al., 1996, 1997, 1999; Cranmer et al., 2000). Though we do not know yet themechanism responsible for the formation of such structures, it is positive that DACsresult from independent high density regions in the stars’ environment.
Specifically, in this paper we test the ideas proposed by Danezis (1984, 1986)and Danezis et al. (1991). In these papers they proposed that probably:1. DACs are not unknown absorption spectral lines, but spectral lines (satellite
absorption components) of the same ion and the same wavelength as a mainspectral line, shifted at different �λ. In addition, DACs are not always dis-crete absorption spectral lines, but in most cases lines that are blended amongthemselves as well as with the main spectral line. In such a case they are notobservable, but we can detect them through the analysis of our model. Thismeans that when we deal with a significant spectral line, which is accompaniedby satellite absorption components, we should not regard them as independent
A NEW MODEL FOR THE STRUCTURE OF THE DACs REGIONS 1125
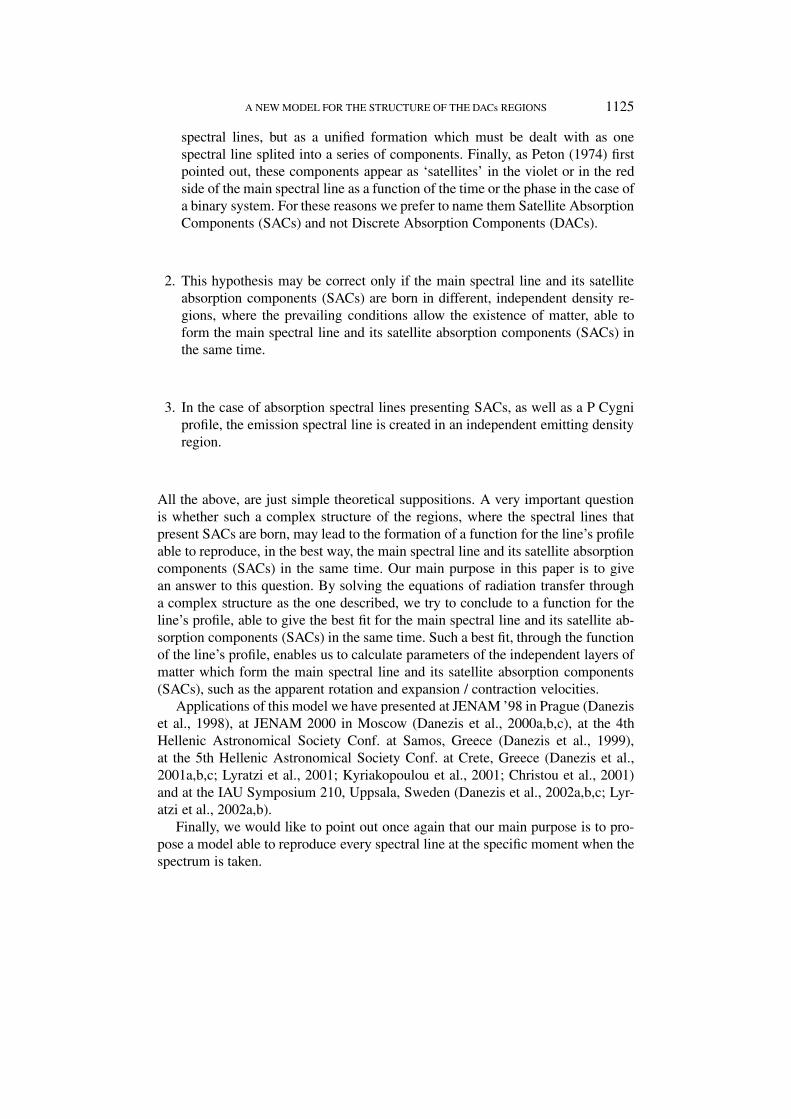
spectral lines, but as a unified formation which must be dealt with as onespectral line splited into a series of components. Finally, as Peton (1974) firstpointed out, these components appear as ‘satellites’ in the violet or in the redside of the main spectral line as a function of the time or the phase in the case ofa binary system. For these reasons we prefer to name them Satellite AbsorptionComponents (SACs) and not Discrete Absorption Components (DACs).
2. This hypothesis may be correct only if the main spectral line and its satelliteabsorption components (SACs) are born in different, independent density re-gions, where the prevailing conditions allow the existence of matter, able toform the main spectral line and its satellite absorption components (SACs) inthe same time.
3. In the case of absorption spectral lines presenting SACs, as well as a P Cygniprofile, the emission spectral line is created in an independent emitting densityregion.
All the above, are just simple theoretical suppositions. A very important questionis whether such a complex structure of the regions, where the spectral lines thatpresent SACs are born, may lead to the formation of a function for the line’s profileable to reproduce, in the best way, the main spectral line and its satellite absorptioncomponents (SACs) in the same time. Our main purpose in this paper is to givean answer to this question. By solving the equations of radiation transfer througha complex structure as the one described, we try to conclude to a function for theline’s profile, able to give the best fit for the main spectral line and its satellite ab-sorption components (SACs) in the same time. Such a best fit, through the functionof the line’s profile, enables us to calculate parameters of the independent layers ofmatter which form the main spectral line and its satellite absorption components(SACs), such as the apparent rotation and expansion / contraction velocities.
Applications of this model we have presented at JENAM ’98 in Prague (Daneziset al., 1998), at JENAM 2000 in Moscow (Danezis et al., 2000a,b,c), at the 4thHellenic Astronomical Society Conf. at Samos, Greece (Danezis et al., 1999),at the 5th Hellenic Astronomical Society Conf. at Crete, Greece (Danezis et al.,2001a,b,c; Lyratzi et al., 2001; Kyriakopoulou et al., 2001; Christou et al., 2001)and at the IAU Symposium 210, Uppsala, Sweden (Danezis et al., 2002a,b,c; Lyr-atzi et al., 2002a,b).
Finally, we would like to point out once again that our main purpose is to pro-pose a model able to reproduce every spectral line at the specific moment when thespectrum is taken.

1126 E. DANEZIS ET AL.
3. Description of the Method
3.1. FUNDAMENTAL HYPOTHESES
i) The stellar envelope is composed of a number of successive independentabsorbing density layers of matter, followed by an emission region and anexternal general absorption region.
ii) The angular velocity of rotation is constant.iii) Thermal and natural broadening of spectral lines is negligible. This means
that the whole width of the line is measured as Vrot.iv) The observer lies on the equatorial plane.v) None of the phenomena are relativistic.vi) The only effect of a shell’s expansion or contraction is a Doppler shift of the
center of the lines.
3.2. MATHEMATICAL EXPRESSION
We assume that we have a radiation of intensity Iλ passing through an area ofgaseous material of constant density ρ, thickness ds and absorption coefficient kλ.The effect of the shell on the radiation intensity is given by:
dIλ = −kλIλρds
For a shell of total thickness s and an initial radiation intensity of Iλ0 the effect willbe:
Iλ = Iλ0 exp {−τ } (1)
where
τ =∫ s
0kλρds.
Now consider this radiation intensity passing through a second shell, of densityρb, thickness sb and absorption coefficient kλb. The radiation intensity exiting thissecond shell will be:
Iλb = Iλ exp {−τb}where
τb =∫ sb
0kλbρbds.
Substituting (1) for Iλ yields:
Iλb = Iλ0 exp {−τ } exp {−τb}Generalising for i absorbing shells, the final exiting radiation will be:

A NEW MODEL FOR THE STRUCTURE OF THE DACs REGIONS 1127
Iλi = Iλ0
∏i
exp {−τi} (2)
Consider now a shell that is both absorbing and emitting (henceforth called in thispaper a ‘mixed’ shell), with kλ and jλ being the respective coefficients. Its effect onthe radiation intensity Iλi will be:
dIλi = −kλIλiρds + jλρds
And the total effect of such a shell of thickness se, and density ρe on a radiationflow of intensity Iλi will be:
Iλe = Iλi exp {−τe} + ∫ τe
0jλe
kλee−τedτ
where jλe
kλeis the source function Sλe and τ = ∫ se
0 kλeρeds.
At the moment when the spectrum is taken, each emission line, with a givenwavelength λ, is created in a specific region of the stellar envelope with a givenvalue for Sλe, that is Sλe=const. So:
Iλe = Iλi exp {−τe} + Sλe(1− exp {−τe}). (3)
Now consider that an outer shell of general absorption follows the mixed shell. Itseffect on the radiation intensity will be:
Iλf inal = Iλe exp {−τg}in which we replace Iλe by the radiation intensity exiting the mixed shell, given byequation (3). Thus:
Iλf inal =[Iλ0
∏i
exp{−τi}exp{−τe} + Sλe(1 − exp{−τe})]
exp{−τg}
If we consider the absorption of the mixed shell as an independent absorption, wecan include it to the product
∏i
exp {−τi} and have:
Iλf inal =[Iλ0
∏i
exp{−τi} + Sλe(1 − exp{−τe})]
exp{−τg}
A similar expression will apply to the radiation flux:
F(λ)f inal =[F0(λ)
∏i
exp{−τi} + Sλe(1 − exp{−τe})]
exp{−τg}
Let us consider the parameters τ i, τ e, τ g. As stated above, each τ is given by:
τ =∫ S
0kλρds.

1128 E. DANEZIS ET AL.
We substitute for kλi , kλe, kλg the product of two functions:1. Omega (�) is an expression of kλ and has the same units as kλ.2. Li, Le, Lg are the distribution functions of kλi , kλe, kλg respectively. Each L
depends on the values of the apparent rotational velocity as well as of the radialexpansion or contraction velocity of the density shell, which forms the spectralline.
That is:
τ = L
∫ S
0�ρds
We set: ξ = ∫ S
0 �ρds, meaning that ξ is an expression of τ .The resulting, final form of the radiation flux function is:
Fλf inal =[F0(λ)
∏i
exp{−Liξi} + Sλe(1 − exp{−Leξe})]
exp{−Lgξg} (4)
Equation 4 gives the function of the complex profile of a spectral line, whichpresents SACs. This means that the graphical representation of equation 4 mustreproduce not only the main spectral line, but its SACs as well. As we can deducefrom the above, the calculation of Fλf inal does not depend on the geometry of theabsorbing or emitting independent density layers of matter.
The decision on the geometry is essential for the calculation of the parametersLi. This means that by deciding on a different geometry we conclude to a differentanalytical form of Li, and thus to a different shape of the profile of the spectral line,presenting SACs, that we study.
In order to decide on the appropriate geometry we took into consideration thefollowing important facts:1. The spectral line’s profile was reproduced in the best way when we supposed
spherical symmetry for the independent density regions. Such symmetry hasbeen proposed by many researchers (Lamers et al., 1982; Bates and Gilheany,1990; Gilheany et al., 1990; Waldron et al., 1992; Rivinius et al., 1997; Cidale,1998, Markova, 2000).
2. However, the independent layers of matter, where a spectral line and its SACswere born, could lie either close to the star, as in the case of the photosphericcomponents of the Hα line in Be stars (Andrillat and Fehrenbach, 1982; An-drillat, 1983), in which case spherical symmetry is justified, or at a greaterdistance from the star, where the spherical symmetry can not be justified.
These thoughts lead us to the conclusions that:1. In the case of independent density layers of matter that lie close to the star we
could suppose the existence of a classical spherical symmetry (Lamers et al.,1982; Bates and Gilheany, 1990; Gilheany et al., 1990; Waldron et al., 1992;Rivinius et al., 1997; Cidale, 1998, Markova, 2000).

A NEW MODEL FOR THE STRUCTURE OF THE DACs REGIONS 1129
2. In the case of independent density layers of matter that lie at a greater distancefrom the photosphere, we could suppose the existence of independent densityregions such as blobs, which should cover a substantial fraction of the stellardisk (Cranmer and Owocki, 1996) and are outwards moving inhomogeneit-ies (Rivinius et al., 1997), spiral streams (Fullerton et al., 1997; Cranmer etal., 2000; Markova, 2000) or CIRs, which may result from non-radial pulsa-tions, magnetic fields or the star’s rotation (Mullan, 1984a,b, 1986; Prinja andHowarth, 1988; Kaper et al., 1996, 1997, 1999) and are able to make structuresthat cover a substantial portion of the stellar disk (Cranmer and Owocki, 1996;Kaper et al., 1996, 1997, 1999). These regions, though they do not presentspherical symmetry around the star, they form spectral lines’ profiles whichare identical with those deriving from a spherically symmetric structure. Thismeans that these line profiles present the same values for Vrot, Vexp and ξ asthe ones deriving from a classical spherical symmetry. In such a case, thoughthe density regions are not spherically symmetric, through their effects on thelines’ profiles, they appear as spherically symmetric structures to the observer.
This means that in both cases, where either the symmetry is spherical or it ap-pears as spherical through its effects on the lines’ profile, the calculation of Li, isjustifiably based on the supposition of spherical symmetry.
The above mentioned thoughts led us to suppose spherical symmetry (or ap-parent spherical symmetry) for the density regions where the main spectral line aswell as its SACs are born, in order to calculate the parameters Li.
3.3. CALCULATION OF THE DISTRIBUTION FUNCTIONS L
If we consider that the density shell of matter, where the spectral line is produced,lies between angles -θ0 to +θ0 from the equatorial plane, then:
L =∫ θ0
−θ0
cos θdθ = [sinθ]+θ0−θ0= 2 sinθ0, (5)
for every
λi : |λi − λ0| <λ0z0cosθ0
1 − z20cosθ0
and
L = 0,
for every
λi : |λi − λ0| <λ0z0cosθ0
1 − z20cos2θ0
,
Normalizing equation (5) we have:
1130 E. DANEZIS ET AL.
Li = sin θ0 = √1 − cos2θ0. (6)
As θ0 lies between the values of −π2 and π
2 , equation (5) yields to:
cosθ0 =−λ0 +
√λ2
0 + 4�λ2
2�λz0(7)
and
L = √1 − cos2θ0, if cosθ0 < 1
and
L = 0, if cosθ0 ≥ 1
where:λ0 is the wavelength of the centre of the spectral line.
If we consider that the density shell, which forms the spectral line, moves ra-dially, then: λ0 = λlab + �λexp, where λlab is the laboratory wavelength of thespectral line produced by a particular ion and �λexp is the radial Doppler shift and�λexp
λlab= Vexp
c.
z0 = Vrot
c, where Vrot is the apparent rotational velocity of the i density shell of
matter.�λ = |λi − λ0|, where the values of λi are taken in the wavelength range we
want to reproduce.As we can understand from the above, the spectral line’s profile, which is formed
by the i density shell of matter, must be accurately reproduced by the functione−Liξi by applying the appropriate values of Vroti, Vexpi and ξ i.
4. Discussion of the Proposed Model
Introducing the previous final reproduction function of a complex spectral line(equation 4), we would like to note and clarify the following:1. As we have already mentioned, for each trio of the parameters Vroti, Vexpi and
ξ i, the function Iλi = e−Liξi reproduces the spectral line’s profile formed by thei density shell of matter, meaning that for each trio we have a totally differentprofile. This results to the existence of only one trio of Vroti, Vexpi and ξ i givingthe best fit of the i component. In order to accept as best fit of the observedspectral line, what is given by the trinities (Vexpi, Vroti, ξ i) of all the calculatedSACs, we must adhere to all the physical criteria and techniques, such as:i) It is necessary to have the superposition of the spectral region we study with
the same region of a classical star of the same spectral type and luminosityclass, in order to identify the existence of spectral lines that blend with thestudied ones, as well as the existence of SACs.
A NEW MODEL FOR THE STRUCTURE OF THE DACs REGIONS 1131
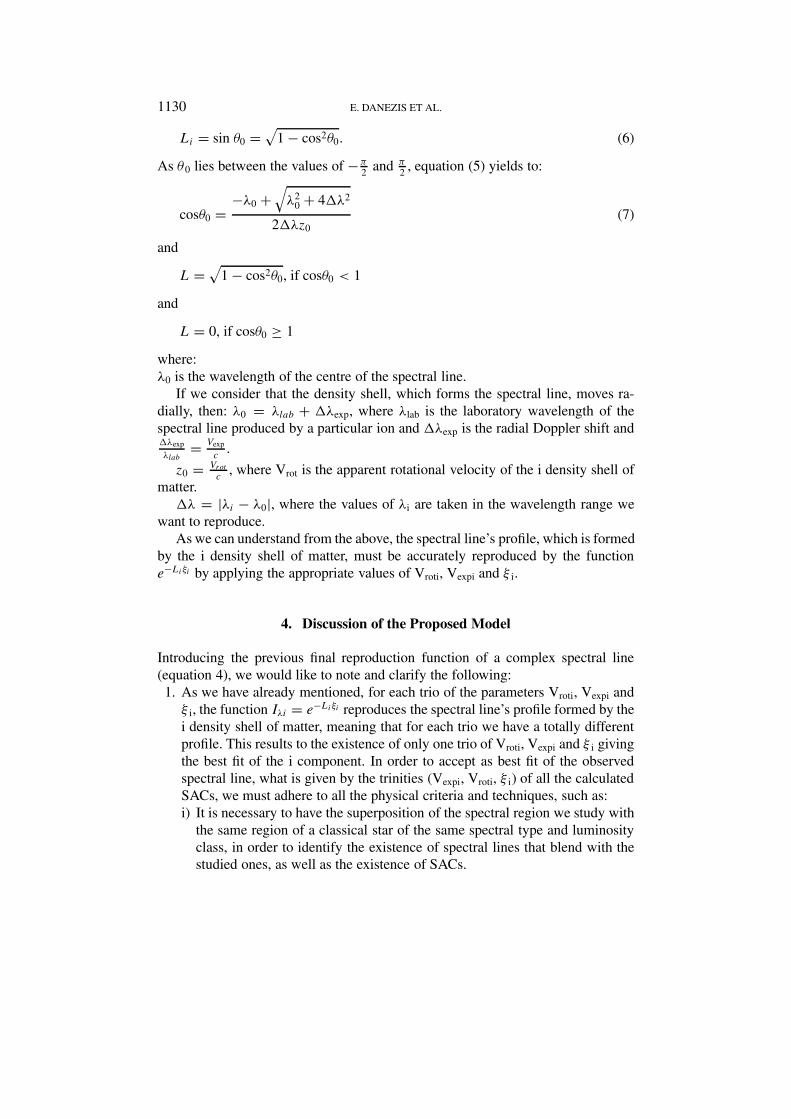
Figure 1. Best fit of Mg II lines λλ 2795.523, 2802.698 A of the Be star HD 41335. The thick linepresents the real spectral profile and the thin one the model’s fit. The differences between the realspectrum and its fit are hard to see, as we have accomplished the best fit.
ii) The resonance lines as well as those that form in these regions of the starshells that are close to each other (small difference in ionization potential)must have the same number of SACs.
iii) The resonance lines and the spectral lines of ions, which have similar ion-ization potentials, must have approximately the same values for Vexp andVrot, as they form in the same regions. This means that the values of Vexp
and Vrot of the absorption and emission SACs must lay in a range acceptedby the statistical error.
2. The profiles of every main spectral line and its SACs are fitted by the functionIλi = e−Liξi . This function produces symmetrical line profiles. However, weknow that most of the spectral lines we have to reproduce are asymmetric. Thisfact is interpreted as a systematical variation of the apparent radial velocitiesof the density regions where the main spectral line and its SACs are created.In order to approximate those asymmetric profiles we have chosen a classicalmethod. This is the separation of the region, which produces the asymmetricprofiles of the spectral line, into a small number of sub-regions, every one ofwhich is dealt with as an independent absorptive shell. In this way we canstudy the variation of the density, the radial shift and the apparent rotation as

1132 E. DANEZIS ET AL.
Figure 2. Best fit of Mg II lines λλ 2795.523, 2802.698 A of the Be star HD 148184. The thick linepresents the real spectral profile and the thin one the model’s fit. The differences between the realspectrum and its fit are hard to see, as we have accomplished the best fit.
a function of the depth in every region which produces a spectral line with anasymmetric profile. All the above must be taken into consideration during theevaluation of our results and one should not consider that the evaluated para-meters of those sub-regions correspond to independent matter shells, whichform the main spectral line or its SACs.
3. We suggest that the width of the blue wing is the result of the merging of theprofiles of the main spectral line and its SACs. Thus, the blue wing of eachSAC gives the apparent rotational velocity of the density shell, in which itforms. This means that, in order to have measurements with physical meaning,we should not calculate the width of the blue wing of the final spectral line butthe width of the blue wings of each SAC.
4. By the study of the resonance lines of a great number of stars, we measured astatistical error between 10 and 35 km/s.
5. Finally, it is clear that the function Iλi = e−Liξi can produce every spectralline, which is created in a region that presents spherical or apparent sphericalsymmetry.
We would like to point out that the final criterion to accept or reject a best fit, is theability of the calculated values of the physical parameters to give us a physical de-scription of the events developing in the regions where the spectral lines presenting
A NEW MODEL FOR THE STRUCTURE OF THE DACs REGIONS 1133
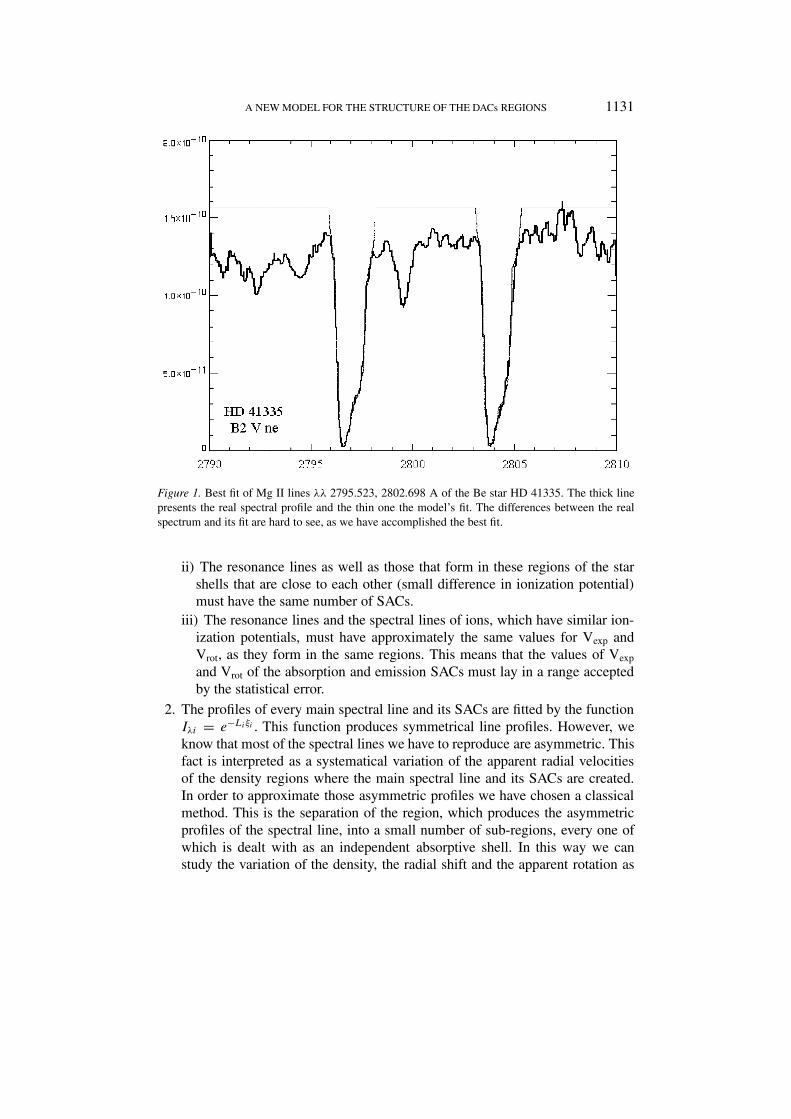
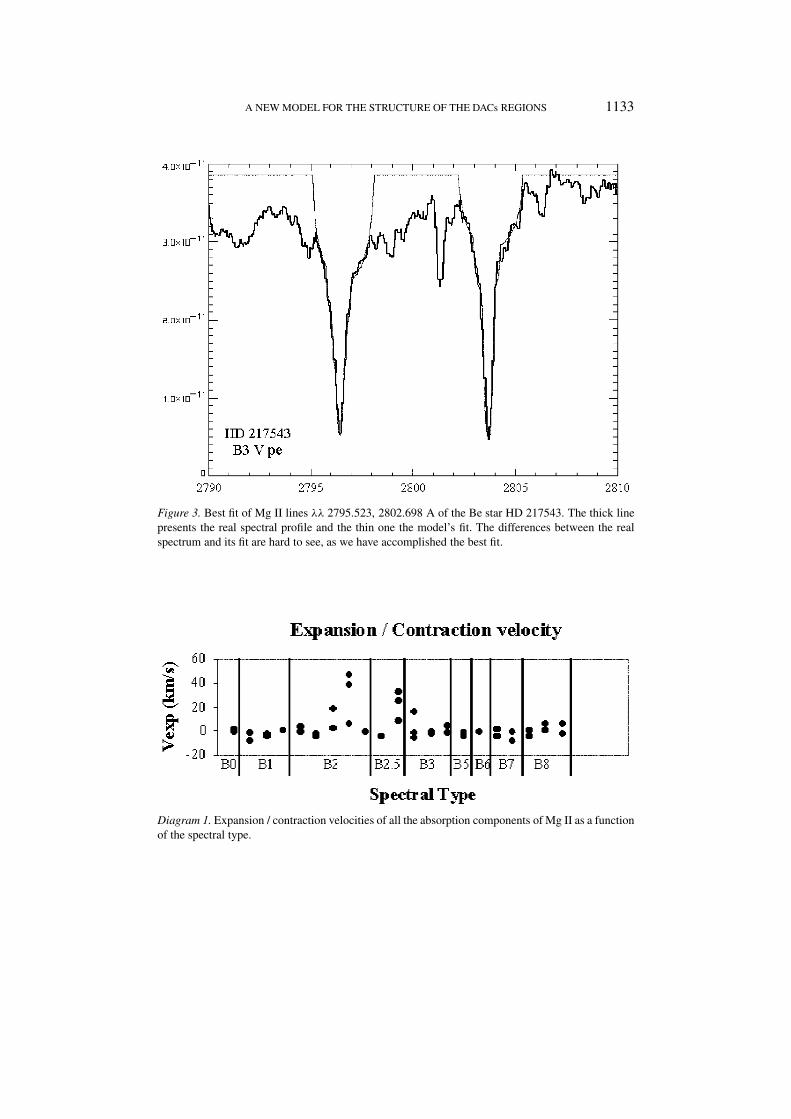
Figure 3. Best fit of Mg II lines λλ 2795.523, 2802.698 A of the Be star HD 217543. The thick linepresents the real spectral profile and the thin one the model’s fit. The differences between the realspectrum and its fit are hard to see, as we have accomplished the best fit.
Diagram 1. Expansion / contraction velocities of all the absorption components of Mg II as a functionof the spectral type.

1134 E. DANEZIS ET AL.
Diagram 2. Rotation velocities of all the absorption components of Mg II as a function of the spectraltype.
Diagram 3. Expansion / contraction velocities of the emission component of Mg II as a function ofthe respective rotation velocities.
SACs are created. This means that the calculated values of the physical parametersshould not go against the classical physical theory.
In order to test the accuracy of the spectral lines’ fits deriving from equation4, we presented a series of poster papers at the JENAM 1998 in Prague and itsapplications were presented at the JENAM 2000 in Moscow. A new series ofapplications was also presented at the IAU Symposium 210 (Uppsala, Sweden,2002). A summary of two of these papers is presented as an application in thispaper.
5. Application to the Spectral Lines of Selected Oe and Be Stars
5.1. MG II REGIONS IN THE GASEOUS ENVELOPE OF BE V STARS
Danezis et al. (2002a) by applying the above presented model, studied the variationof the calculated parameters Vrot and Vexp of the density regions where the Mg II

A NEW MODEL FOR THE STRUCTURE OF THE DACs REGIONS 1135
Figure 4. Best fit of NIV λ 1718.8A line of the Oe star HD66811. The thick line presents the realspectral profile and the thin one the model’s fit. The differences between the real spectrum and its fitare some times hard to see, as we have accomplished the best fit.
Diagram 4. Apparent radial velocities of expansion / contraction of the density regions where the SiIV lines of the star HD66811 are created, as a function of time.

1136 E. DANEZIS ET AL.
Figure 5. Best fit of SiIV λλ 1393.75, 1402.73A line of the Oe star HD66811. The thick line presentsthe real spectral profile and the thin one the model’s fit. The differences between the real spectrumand its fit are some times hard to see, as we have accomplished the best fit.
Diagram 5. Apparent rotation velocities of the density regions where the Si IV lines of the starHD66811 are created, as a function of time.

A NEW MODEL FOR THE STRUCTURE OF THE DACs REGIONS 1137
Diagram 6. Mean apparent rotation velocities as a function of the absolute mean velocities of expan-sion / contraction, for the density regions (absorbing and emitting) of the star HD66811. Velocitiesrelated to absorbing layers of matter are shown with circles. Velocities related to emitting layers ofmatter are shown with triangles.
resonance lines (λλ 2795.523, 2802.698 A) are formed of a series of 21 Be V starsof all the spectral subtypes. In Figures 1–3 we present three best fits of the Mg IIresonance lines of the stars HD 41335, HD 148184 and HD 217543. The thick linepresents the observed spectral line’s profile and the thin one the model’s fit. Thedifferences between the observed spectrum and its fit are some times hard to see,as we have accomplished the best fit. Some of our conclusions are presented indiagrams 1–3. In Diagram 1 we present the expansion / contraction velocities of allthe absorption components as a function of the spectral subtype. In Diagram 2 wepresent the rotation velocities of all the absorption components as a function of thespectral subtype. In Diagram 3 we present the expansion / contraction velocitiesof the emission component as a function of the respective rotation velocities. Inthese three diagrams one can see that all the studied stars present discernible orindiscernible SACs of the Mg II resonance lines. The indiscernible SACs appear inthe spectra of the stars with spectral subtypes B0–B1 and B4–B8. This is due to thefact that the SACs of the Mg II resonance lines in the spectra of the stars of thesespectral subtypes present similar radial velocities. In this case, we can separate

1138 E. DANEZIS ET AL.
Diagram 7. Mean apparent rotation velocities and mean expansion velocities of the absorbing layersof matter of the star HD66811, as a function of ξ .
these lines by the systematic differentiations of the apparent rotation velocities andthe values of ξ i. The SACs of the Mg II resonance lines are discernible in thespectra of the stars with spectral subtypes B2-B3, as they present different radialshifts. We would also like to point out that in this case the density regions presentmuch greater values of the apparent rotation velocities.
5.2. THE CORONAL AND POST-CORONAL REGIONS OF THE MOVING
ATMOSPHERE OF THE OE STAR HD66811 (ζ PUPPIS)
Danezis et al. (2002b) by applying the above presented model, studied the variationof the calculated parameters Vrot and Vexp and ξ of the density regions wherethe spectral lines CIV, NIV, NV and SiIV are formed of the star HD 66811 (ζPuppis) at three different moments (1979, 1988, 1995). Our purpose was to studythe variations of the parameters Vrot and Vexp and ξ of the SACs that present thecomplex profiles of these spectral lines. In figures 4 and 5 we present two best fitsof the NV and SiIV resonance lines of the stars HD 41335, HD 148184 and HD217543. The thick line presents the observed spectral line’s profile and the thin onethe model’s fit. The differences between the observed spectrum and its fit are sometimes hard to see, as we have accomplished the best fit. Some of our conclusionsare presented in diagrams 4–7.

A NEW MODEL FOR THE STRUCTURE OF THE DACs REGIONS 1139
Acknowledgements
Dr Danezis E. and Dr Theodossiou E. would like to express their gratitude toDr V. Doazan and Dr R. Stalio for their constant encouragement and stimulateddiscussions in the first steps of the construction of this model.
Also Dr Danezis E. and Dr Theodossiou E. would like to thank Dr M. Di-mitrijevic, Director of the Astronomical Observatory of Belgrade for his help andcomments. We would like to thank Prof. S. Svolopoulos, Dr M. Kontizas, Prof.X. Moussas and Dr A. Kakouris, of the University of Athens (School of Physics),as well as Dr E. Kontizas of the National Observatory of Athens for their helpfulcomments.
Finally we would like to express our thanks to Mr. G. Danezis Ph.D. studentat Queen’s College of the University of Cambridge (Computer Laboratory) for hishelp on software development of the model.
This research project is progressing at the University of Athens, Departmentof Astrophysics – Astronomy and Mechanics, under the financial support of theSpecial Account for Research Grants, which we thank very much.
References
Andrillat, Y. and Fehrenbach, Ch.: 1982, A&ASS 48, 93–136.Andrillat, Y.: 1983, A&ASS 53, 319–338.Bates, B. and Halliwell, D.R.: 1986, MNRAS 223, 673.Bates, B. and Gilheany, S.: 1990, MNRAS 243, 320B.Burki, G., Heck A., Bianchi, L. and Cassatella, A.: 1982, A&A 107, 112.Cidale, L.S.: 1998, ApJ 502, 824.Cranmer, S.R. and Owocki, S.P.: 1996, ApJ 462, 469C.Cranmer, S.R., Smith, M.A. and Robinson, R.D.: 2000, ApJ 537, 433.Christou, G., Danezis, E., Theodossiou, E., Stathopoulou, M., Nikolaides, D., Lyratzi, E., Drako-
poulos, C., Koutsouris, P. and Soulikias, A.: 2001, Application of a New Model of DensityLayers of Matter to the Expanding Gaseous Envelope of the star HD 66811, Proc. 5th HellenicAstronomical Society Conf. September 2001, Crete, Greece.
Danezis, E.: 1984, The Nature of Be Stars, PhD Thesis, University of Athens.Danezis, E.: 1986, IAU, Colloq. No 92, Physics of Be Stars, Cambridge University Press.Danezis, E. and Theodossiou, E.: 1988, A&ASS 72, 497–504.Danezis, E. and Theodossiou, E.: 1990, SS 174, 49–90.Danezis, E., Theodossiou, E. and Laskarides, P.G.: 1991, Astrophysics and Space Science 179, 111–
139.Danezis, E., Theodossiou, E. and Laskarides, P.G.: 1995, A First Approach to the Shell Structure of
Be Binary Stars, 2nd Hellenic Astronomical Conf., 29 July, Thessaloniki Greece.Danezis, E., Stathopoulou, M., Theodossiou, E., Grammenos, Th. and Soulikias, A.: 1997a, A Study
of the Superionized Spectral Lines of the Star HD 164794, in 6th European and 3rd HellenicAstronomical Society Conf., 2–5 July, Thessaloniki, Greece.
Danezis, E. Stathopoulou, M., Theodossiou, E., Grammenos, Th. and Kosionidis, A.: 1997b, A Studyof the Superionized Spectral Lines of the Star HD 66811, in 6th European and 3rd HellenicAstronomical Society Conf., 2–5 July, Thessaloniki, Greece.

1140 E. DANEZIS ET AL.
Danezis, E., Nikolaidis, D., Theodossiou, E., Stathopoulou, M. and Kosionidis, A.: 1998, SatelliteSpectral Components and Moving Shells in the Atmospheres of Early Type Stars – The exampleof HD 175754, Proc. 65th Czech and the 7th European Joint Conf., JENAM’ 98, Prague, CzechRepublic, September.
Danezis, E., Nikolaides, D., Theodossiou, E., Grammenos, Th., Stathopoulou, M. and Kosionidis,A.: 1999, A Simple Model for the Complex Structure of Moving Atmospheric Shells in Oe and BeStars, Proc. 4th Hellenic Astronomical Soc. Conf., September 1999, Samos, Greece.
Danezis, E., Nikolaides, D., Theodossiou, E., Kosionidis, A., Stathopoulou, M., Lyratzi, E., Drako-poulos C. and Bourma, P.: 2000a, A Simple Model for the Complex Structure of MovingAtmospheric Shells in Oe and Be Stars. The Example of HD 36861, some First Conclusions,JENAM 2000, May 29–June 3, Moscow, Russia.
Danezis, E., Nikolaides, D., Theodossiou, E., Kosionidis, A., Stathopoulou, M., Lyratzi, E., Drako-poulos C. and Bourma, P.: 2000b, A Simple Model for the Complex Structure of MovingAtmospheric Shells in Oe and Be Stars. The Example of HD 36861, some First Conclusions,JENAM 2000, May 29–June 3, Moscow, Russia.
Danezis, E., Nikolaides, D., Theodossiou, E., Kosionidis, A., Stathopoulou, M., Lyratzi, E., Drako-poulos C. and Bourma, P.: 2000c, A Simple Model for the Complex Structure of MovingAtmospheric Shells in Oe and Be Stars. The Example of HD 36861, some First Conclusions,JENAM 2000, May 29–June 3, Moscow, Russia.
Danezis, E., Lyratzi, E., Theodossiou, E., Nikolaides, D., Stathopoulou, M., Kyriakopoulou, A.,Christou, G. and Drakopoulos C.: 2001a, Application of a New Model of Density Layers of Matterto the Expanding Gaseous Envelope of the Star HD 175754, Proc. 5th Hellenic Astronomical Soc.Conf., September 2001, Crete, Greece.
Danezis, E., Nikolaides, D., Lyratzi, E., Stathopoulou, M., Theodossiou, E., Kyriakopoulou, A.,Christou, G., Kosionidis, A. and Drakopoulos C.: 2001b, Hyperionization and Emission Phe-nomena in the Gaseous Envelope of the Star 9Sgr, Proc. 5th Hellenic Astronomical Soc. Conf.September 2001, Crete, Greece.
Danezis, E., Nikolaides, D., Lyratzi, E., Theodossiou, E., Stathopoulou, M., Kyriakopoulou A.,Christou, G. and Drakopoulos C.: 2001c, Hyperionization and Emission Phenomena in theGaseous Envelope of the Star λ Orionis, Proc. 5th Hellenic Astronomical Soc. Conf., September2001, Crete, Greece.
Danezis, E., Nikolaidis, D., Lyratzi, E., Stathopoulou, M., Theodossiou, E., Kosionidis, A., Drako-poulos, C., Christou, G. and Koutsouris, P.: 2002a, A New Model of Density Layers of Matter inthe Expanding Gaseous Envelope of Oe and Be Stars, Proc. IAU Symp. 210: Modeling of StellarAtmospheres, June 17–21, 2002, Uppsala, Sweden.
Danezis, E., Lyratzi, E., Nikolaidis, D., Theodossiou, E., Stathopoulou, M., Christou, G. and Sou-likias, A.: 2002b, The Complex Structure of Mg II Regions in the Gaseous Envelope of Be V Stars,Proc. IAU Symp. 210: Modeling of Stellar Atmospheres, June 17–21, 2002, Uppsala, Sweden.
Danezis, E., Lyratzi, E., Christou, G., Theodossiou, E., Stathopoulou, M., Nikolaides, D. andKyriakopoulou, A.: 2002c, Hyperionisation Phenomena in the Coronal and Post-Coronal Re-gions of the Moving Atmosphere of the Oe Star HD 66811 (ζ Puppis), Proc. IAU Symp. 210:Modeling of Stellar Atmospheres, June 17–21, 2002, Uppsala, Sweden.
Doazan, V.: 1982, B Stars with and without Emission Lines, NASA SP-456.Franco, M.L., Kontizas, E., Kontizas, M. and Stalio, R.: 1983, A&A 122, 9.Fullerton, A.W., Massa, D.L., Prinja R.K., Owocki, S.P. and Cranmer, S.R.: 1997, A&A 327, 699.Gilheany, S., Bates, B., Catney, M.G. and Dufton, P.L.: 1990, Ap&SS 169, 85G.Grady, C.A., Sonneborn, G., Chi-chao Wu and Henrichs, H.F.: 1987, ApJ Supl. 65, 673.Henrichs, H.F., Hammerschlag-Hensberge, G. and Lamers, H.J.G.L.M.: 1980, in B. Battrick and J.
Mort (eds.), Proc. 2nd European IUE Conf. Tübingen, (ESA SP-157), Noordwijk: ESO, 4, 147.Henrichs, H.F., Hammerschlag-Hensberge, G., Howarth, I.D. and Barr P.: 1983, ApJ 268, 807.

A NEW MODEL FOR THE STRUCTURE OF THE DACs REGIONS 1141
Henrichs, H.F.: 1984, in E. Rolfe and B. Battrick (eds.), Proc. 4th European IUE Conf., ESA SSSP-218, p. 43, Rome.
Henrichs, H.F., Kaper, L. and Zwarthoed, G.A.A.: 1988, Proc Celebratory Symp.: A Decade of UVAstronomy with IUE, ESA SP-281, 2, 145.
Henrichs, H.F., Kaper, L. and Nichols, J.S.: 1994 A&A 285, 565H.Henrichs, H.F.: 1990, in D. Baade (ed.), Rapid Variability of OB-Stars: Nature and Diagnostic Value
(ESO Workshop 36), Garching bei Munchen: ESO, 199.Hutsemekers, D.: 1985, A&ASS 60, 373–388.Kaper, L., Henrichs. H.F., Zwarthoed, G.A.A. and Nichols-Bohlin, J.: 1990, in L.A. Willson and R.
Stalio (eds.), Angular Momentum and Mass Loss for Hot Stars, Kluwer, Dordrecht, p. 213.Kaper, L., Henrichs, H.F., Nichols, J.S., Snoek, L.C., Volten, H. and Zwarthoed, G.A.A.: 1996,
Astron. Astrophys. Suppl. 116, 257.Kaper, L., Henrichs, H.G., Fullerton, A.W., Ando, H., Bjorkman, K.S., Gies, D.R., Hirata, R., Dambe,
E., McDavid, D. and Nichols, J.S.: 1997, A&A 327, 281.Kaper, L., Henrichs, H.F., Nichols, J.S. and Telting, J.H.: 1999, A&A 344, 231.Kyriakopoulou, A., Danezis, E., Nikolaides, D., Theodossiou, E., Stathopoulou, M., Lyratzi, E.,
Christou, G. and Koutsouris, P.: 2001, The Complex Structure of the Expanding Gaseous En-velope of the Star HD 50138, Proc. 5th Hellenic Astronomical Society Conf. September 2001,Crete, Greece.
Lamers, H.J.G.L.M. and Snow, T.P.: 1978, ApJ 219, 504L.Lamers, H.J.G.L.M., Gathier, R. and Snow, T.P.: 1982, ApJ 258, 186.Lamers, H.J.G.L.M., Snow, T.P., de Jager, C. and Langerwerf, A.: 1988, ApJ 325, 342.Lamers, H.J.G.L.M.: 1994, in A.F.J. Moffat, S.P. Owocki and A.W. Fullerton (eds.), Observational
Aspects of Wind Variability, Instability and Variability of Hot-Star Winds, Kluwer, St.-Louis N,p. 41.
Laskarides, P.G., Danezis, E. and Theodossiou, E.: 1992a, Sp. Sc. 179, 13.Laskarides, P.G., Danezis, E. and Theodossiou, E.: 1992b, Sp. Sc. 183, 67.Laskarides, P.G., Danezis, E. and Theodossiou, E.: 1993a, A Structure Proposal of the Gas Shell of
the Double System AX Mon, Proc. 6th Panhellenic Conf., Komotini, Greece.Laskarides, P.G., Danezis, E. and Theodossiou, E.: 1993b, in P.G. Laskarides (ed.), The far UV
Spectrum of AX Monocerotis, Proc. 1st Panhellenic Astronomical Meeting, Athens.Lyratzi, E., Danezis, E., Nikolaides, D., Theodossiou, E., Stathopoulou, M. and Drakopoulos, C.:
2001, Application of a New Model of Density Shells of Matter to the Expanding Gaseous En-velope of the Star HD 45910 (AXMon), Proc. 5th Hellenic Astronomical Soc. Conf., September2001, Crete, Greece.
Lyratzi, E., Danezis, E., Nikolaidis, D., Theodossiou, E., Stathopoulou, M. and Soulikias, A.: 2002a,The Complex Structure of the Expanding Gaseous Envelope of the Be Star HD 45910 (AX Mon),Proc. IAU Symp. 210: Modeling of Stellar Atmospheres, June 17–21, 2002, Uppsala, Sweden.
Lyratzi, E., Danezis, E., Nikolaidis, D., Theodossiou, E., Stathopoulou, M., Kyriakopoulou, A. andSoulikias, A.: 2002b, The Complex Structure of Hα Regions in the Gaseous Envelope of BeV Stars, Proc. IAU Symp. 210: Modeling of Stellar Atmospheres, June 17–21, 2002, Uppsala,Sweden.
Markova, N.: 2000 A&AS 144, 391.Mulan, D.J.: 1984a, ApJ 283, 303.Mulan, D.J.: 1984b, ApJ 284, 769.Mulan, D.J.: 1986, A&A 165, 157.Owocki, S.P., Castor, J.I. and Rybicki, G.B.: 1988, ApJ 335, 914.Peton, A.,: 1974, Sp. Sc. 30, 481.Prinja, R.K. and Howarth, I.D.: 1984, Astr. Astrophys. J. 133, 110.Prinja, R.K. and Howarth, I.D.: 1986, Astrophys. J. Suppl. 61, 357.Prinja, R.K. and Howarth, I.D.: 1988, MNRAS 233, 123.

1142 E. DANEZIS ET AL.
Prinja, R.K.: 1988, MNRAS 231, 21P.Prinja, R.K.: 1991, in D. Baade (ed.), ESO Workshop on Rapid Variability of OB Stars: Nature and
Diagnostic Value, p. 221.Prinja, R.K.: 1992, in L. Drissen, C. Leitherer and A. Nota (eds.), Nonisotropic and Variable Outflows
from Stars, ASP Conf. Ser. 22, 167.Rivinius, Th., Stahl, O., Wolf, B., Kaufer, A., Gäng Th., Gummersbach, C.A., Jankovics, I., Kovács,
J., Mandel, H., Peitz. J., Szeifert, Th. and Lamers, H.J.G.L.M.: 1997, A&A 318, 819.Sahade, J. Brandi, E. and Fontela, J.M.: 1984, Astron. Astrophys. Supplement 56, 17.Sahade, J. and Brandi, E.: 1985, Rev. Mex. 10, 229.Stathopoulou, M., Danezis, E., Laskarides, P.G. and Theodossiou, E.: 1995, The UV The spectrum of
HD 175754, 2nd Hellenic Astronomical Conf., 29 July, Thessaloniki, Greece.Stathopoulou, M., Danezis, E., Theodossiou, E., Grammenos, Th. and Soulikias, A.: 1997, A Study
of the Superionized Spectral Lines of the Star HD 152408, 6th European and 3rd HellenicAstronomical Society Conf., 2–5 July, Thessaloniki, Greece.
Telting, J.H., Waters, L.B.F.M., Persi, P. and Dunlop, S.: 1993, A&A 270, 355.Telting, J.H. and Kaper, L.: 1994, A&A 284, 515T.Theodossiou, E., Laskarides, P.G., Danezis, E., Stathopoulou, M. and Grammenos, Th.: 1993, The
UV Spectrum of the Star λ Orionis, Proc. 6th Panhellenic Physics Conf., Komotini, Greece.Theodossiou, E., Laskarides, P.G. and Danezis, E.: 1997, A Study of the Superionized Spectral Lines
of the Star HD 36861, 6th European and 3rd Hellenic Astronomical Society Conf., 2–5 July,Thessaloniki, Greece.
Underhill, A.B.: 1975, ApJ 199, 693.Underhill, A. and Doazan, V.: 1982, B Stars with and without Emission Lines, NASA SP-456, Centre
National de la Recherche Scientifique Paris, France.Underlill, A.B. and Fahey, R.P.: 1984, ApJ 280, 712.Waldron, W.L., Klein, L. and Altner, B.: 1992, nvos.work, 181W.Waldron, W.L., Klein, L. and Altner, B.: 1994, ApJ 426, 725W.Willis, A.J., Howarth, I.D., Stickland, D.J. and Heap, S.R.: 1989, ApJ 347, 413W.
Copyright © 2022 FDOKUMEN