A new method for MR grayscale inhomogeneity correction
10
Artif Intell Rev (2010) 34:195–204 DOI 10.1007/s10462-010-9169-7 A new method for MR grayscale inhomogeneity correction M. A. Balafar · A. R. Ramli · S. Mashohor Published online: 3 June 2010 © Springer Science+Business Media B.V. 2010 Abstract Intensity inhomogeneity is a smooth intensity change inside originally homo- geneous regions. Filter-based inhomogeneity correction methods have been commonly used in literatures. However, there are few literatures which compare effectiveness of these meth- ods for inhomogeneity correction. In this paper, a new filter-based inhomogeneity correction method is proposed and the effectiveness of the proposed method and other filter-based inho- mogeneity correction methods are compared. The methods with different kernel sizes are applied on MRI brain images and the quality of inhomogeneity correction of different meth- ods are compared quantitatively. Experimental results show the proposed method in a kernel size of 20 * 20 performs almost better than or equal the performance of other methods in all kernel sizes. Keywords Inhomogeneity correction · Max filter · Brain MRI 1 Introduction The application of image processing techniques has rapidly increased in recent years (Balafar et al 2008a). Medical image segmentation is a crucial part of many computer-aided diagnos- tic tools (Balafar et al 2008b). Intensity inhomogeneity hinders the automatic segmentation of medical images (Balafar et al 2010a,b,c). Intensity inhomogeneity is a smooth intensity change inside tissues with the phenomenon usually referred as intensity inhomogeneity, intensity non-uniformity, shading or bias field (Vovk et al 2007). Inhomogeneity can be M. A. Balafar (B ) · A. R. Ramli · S. Mashohor Department of Computer and Communication Systems, Faculty of Engineering, University Putra Malaysia, 43400 Serdang, Selangor, Malaysia e-mail: [email protected]; [email protected] A. R. Ramli e-mail: [email protected] S. Mashohor e-mail: [email protected] 123
-
Upload
independent -
Category
Documents
-
view
0 -
download
0
Transcript of A new method for MR grayscale inhomogeneity correction

Artif Intell Rev (2010) 34:195–204DOI 10.1007/s10462-010-9169-7
A new method for MR grayscale inhomogeneitycorrection
M. A. Balafar · A. R. Ramli ·S. Mashohor
Published online: 3 June 2010© Springer Science+Business Media B.V. 2010
Abstract Intensity inhomogeneity is a smooth intensity change inside originally homo-geneous regions. Filter-based inhomogeneity correction methods have been commonly usedin literatures. However, there are few literatures which compare effectiveness of these meth-ods for inhomogeneity correction. In this paper, a new filter-based inhomogeneity correctionmethod is proposed and the effectiveness of the proposed method and other filter-based inho-mogeneity correction methods are compared. The methods with different kernel sizes areapplied on MRI brain images and the quality of inhomogeneity correction of different meth-ods are compared quantitatively. Experimental results show the proposed method in a kernelsize of 20 * 20 performs almost better than or equal the performance of other methods in allkernel sizes.
Keywords Inhomogeneity correction · Max filter · Brain MRI
1 Introduction
The application of image processing techniques has rapidly increased in recent years (Balafaret al 2008a). Medical image segmentation is a crucial part of many computer-aided diagnos-tic tools (Balafar et al 2008b). Intensity inhomogeneity hinders the automatic segmentationof medical images (Balafar et al 2010a,b,c). Intensity inhomogeneity is a smooth intensitychange inside tissues with the phenomenon usually referred as intensity inhomogeneity,intensity non-uniformity, shading or bias field (Vovk et al 2007). Inhomogeneity can be
M. A. Balafar (B) · A. R. Ramli · S. MashohorDepartment of Computer and Communication Systems, Faculty of Engineering, UniversityPutra Malaysia, 43400 Serdang, Selangor, Malaysiae-mail: [email protected]; [email protected]
A. R. Ramlie-mail: [email protected]
S. Mashohore-mail: [email protected]
123

196 M.A. Balafar et al.
found in different imaging modalities, such as microscopy, computed tomography, ultra-sound, and Magnetic Resonance Imaging (MRI). Inhomogeneity is hardly visible to the user.But even invisible one is enough to degrade segmentation results (Balafar et al 2008c,d,e,f).Therefore, inhomogeneity correction improves the performance of segmentation algorithms(Balafar et al 2010d,e), Moreover, generally inhomogeneity degrades the performance ofclustering algorithms. (Delibasic 2009; Fernández 2008; Lorena et al. 2008; Smail Linda2009) Inhomogeneity can be caused by radio frequency (RF) pulse attenuation in tissue,non-uniform RF coil transmission and sensitivity, non-uniformity in the scanner’s magneticfield, gradient-induced eddy currents, RF standing waves, magnetic susceptibility of tissue,and inter-slice cross talk (Brinkmann et al 1998).
Early research in this field was in (Haselgrove and Prammer 1986). Since then,extensive research has been done. Inhomogeneity correction methods are categorizedinto two groups: prospective methods and retrospective methods. First one, considerinhomogeneity as an error of the imaging process that can be corrected by estimatingthe inhomogeneity field of an MRI acquisition system. These methods are as follows:Phantom-based (Vovk et al 2007), Multi-coil (Brey and Narayana 1988) and Specialsequences (Solanas and Thiran 2001). The second group does not assume any infor-mation about acquisition methods and is more general. These methods are as fol-lows: surface fitting methods (Vovk et al 2007; Meyer et al 1995; Lai and Fang 1999;Koivula et al 1999), segmentation-based (Guillemaud and Brady 1997; Gispert et al2004; Bansal et al 2004; Andersen et al 2002), histogram-based methods (Vovk et al2007), high-frequency maximization, information minimization (Likar et al 2001; Man-gin 2000; Solanas and Thiran 2001; Learned-Miller and Ahammad 2004; Vovk et al2004), and histogram matching and filtering methods. (Vovk et al 2007, Guillemaudand Brady 1997) Two most important filtering inhomogeneity correction methods arehomomorphic filtering and homomorphic unsharp masking which will be discussed indetail.
Homomorphic filtering is a filter method. The image background is usually altered; then,log-transform of input image is subtracted by log-transform of its low-pass filtered via homo-morphic filter (Vovk et al 2007). When homomorphic filtering is performed a streak arte-fact is produced on the boundary between tissues. Guillemaud proposed to eliminate thisartefact on boundary between the background and the object by applying a filter on theobject (Guillemaud and Brady 1997).
Filtering methods consider inhomogeneity as low-frequency artefact. This assumption isvalid if there is no image information in low frequency that might be eliminated by low-passfilter. For most of medical images this assumption is not correct. Moreover, a streak artefactproduced on edges and it is known as edge effect. To make these methods more effective, weproposed a new method to correct inhomogeneity with max filter. To evaluate our method,we compared the effectiveness of our method with the previous state-of-art filtering methodfor inhomogeneity correction.
2 A new method for MR greyscale inhomogeneity correction
The focus of this section is introducing a filter-based algorithm for inhomogeneity correction.Filter-based methods consider inhomogeneity as low-frequency artefact. This assumption isvalid if there were no image information in low frequency that might be eliminated bylow-pass filter. This assumption is not valid on all medical images. In addition, these meth-ods produce a streak artefact on edges known as edge effect. To make these methods more
123

A new method for MR grayscale inhomogeneity correction 197
effective, a new method to correct inhomogeneity with max filter is proposed in this sec-tion. Generally, intensity inhomogeneity is considered as a smooth spatially varying functionwhich alters intensity inside originally homogeneity regions and it is considered as multi-plicative or additive. In MR images, noise is considered independent of inhomogeneity andinhomogeneous image is modelled as multiplicative of homogeneous image and inhomoge-neity bias field plus noise:
Ih = I ∗b + n (1)
where Ih is the inhomogeneous image, I is the same image without inhomogeneity, b isinhomogeneity bias field and n is noise.
The inhomogeneous image is assumed to be de-noised and input image is modelled asmultiplicative of homogeneous image and inhomogeneity bias field as follows:
Ih = I ∗b (2)
Therefore, bias field is estimated and then homogeneous image is estimated by dividinginhomogeneous image on estimated bias field as follows:
I = Ih/b (3)
If only white matter is considered, bias field is calculated with following equation:
b = Ih/Iw (4)
where Iw is grey level of white matter in homogeneous image which is a fixed value.Intensity adjusting is done at the end of algorithm; therefore, the fixed value of Iw in the
above equation can be eliminated and inhomogeneous image can be considered as bias field.It is assumed that in a large size neighbourhood of pixels, for example 30*30, there is at
least one pixel from white matter with highest grey level. In addition, usually inhomogeneitybias field of neighbour pixels are the same or of similar value. As a result, pixel from whitematter (maximum grey level) in the neighbourhood of a pixel is a good approximation forinhomogeneity bias field in that pixel.
Therefore, it is proposed to use max filter for inhomogeneity correction and the homoge-neous image is obtained by dividing inhomogeneous image on max filtered input image asfollows:
I = Ih/Im (5)
where Im is the max filter of inhomogeneous image.Background pixels do not give any effect on max filter results. Therefore, this algo-
rithm does not create homomorphic filtering streak artefact. Figure 1a shows an exampleof in-homogeneous image with 80% inhomogeneity and Fig. 2b represents the result ofapplying max filter with neighbourhood size 30 * 30 on inhomogeneous image (detail aboutneighbourhood size can be found in the result section). Figure 1b shows that the max filterresult is representative for bias field.
The neighbourhood size in max filter is a very important parameter. If it were too small,it is possible that the neighbourhood does not contain pixel with high grey level (pixel fromwhite matter). As a result, the estimated bias field would not give satisfactory approximationand the corrected image would be almost equal to the input image. On the other hand, if itwere too big, bias field would be estimated by pixel with long distance and estimated biasfield would not produce good approximation.
123

198 M.A. Balafar et al.
Fig. 1 a An inhomogeneous image with 80% inhomogeneity and b obtained biased field for the input image
Fig. 2 a Inhomogeneity corrected of an input image and b intensity adjusting of the image (a)
Figure 2a shows the corrected image of the input image which was obtained by dividingthe input image in Fig. 1a on the obtained bias field in Fig. 1b. Figure 2a shows that thedynamic range of the corrected image is not the same as that of the input image Fig 1a.In order to solve this problem, intensity adjustment is performed to preserve the intensitydynamics of the input image. In this research, the intensity of corrected image is adjusted topreserve the maximum or mean intensity of the input image. Figure 2b shows the intensityadjustment result of the corrected image in Fig. 2a.
The following steps summarize the proposed method:
1. Apply max filter to an inhomogeneous image (Fig. 1a) and consider result as bias field(Fig. 1b):
I bias = Max(image) (6)
2. Subtract log of the filtered image from that of the inhomogeneous image:
log I corr = log(image) − log(I bias) (7)
123
A new method for MR grayscale inhomogeneity correction 199
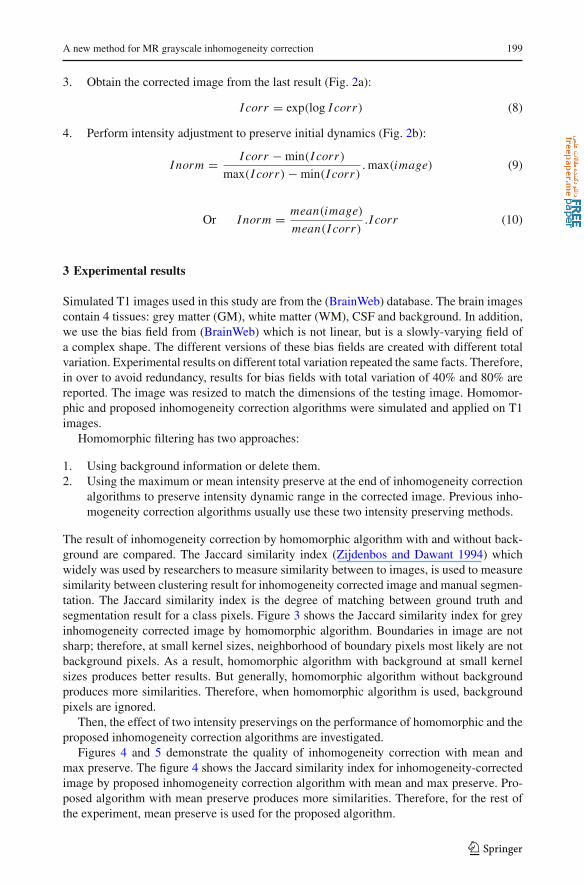
3. Obtain the corrected image from the last result (Fig. 2a):
I corr = exp(log I corr) (8)
4. Perform intensity adjustment to preserve initial dynamics (Fig. 2b):
I norm = I corr − min(I corr)
max(I corr) − min(I corr). max(image) (9)
Or I norm = mean(image)
mean(I corr).I corr (10)
3 Experimental results
Simulated T1 images used in this study are from the (BrainWeb) database. The brain imagescontain 4 tissues: grey matter (GM), white matter (WM), CSF and background. In addition,we use the bias field from (BrainWeb) which is not linear, but is a slowly-varying field ofa complex shape. The different versions of these bias fields are created with different totalvariation. Experimental results on different total variation repeated the same facts. Therefore,in over to avoid redundancy, results for bias fields with total variation of 40% and 80% arereported. The image was resized to match the dimensions of the testing image. Homomor-phic and proposed inhomogeneity correction algorithms were simulated and applied on T1images.
Homomorphic filtering has two approaches:
1. Using background information or delete them.2. Using the maximum or mean intensity preserve at the end of inhomogeneity correction
algorithms to preserve intensity dynamic range in the corrected image. Previous inho-mogeneity correction algorithms usually use these two intensity preserving methods.
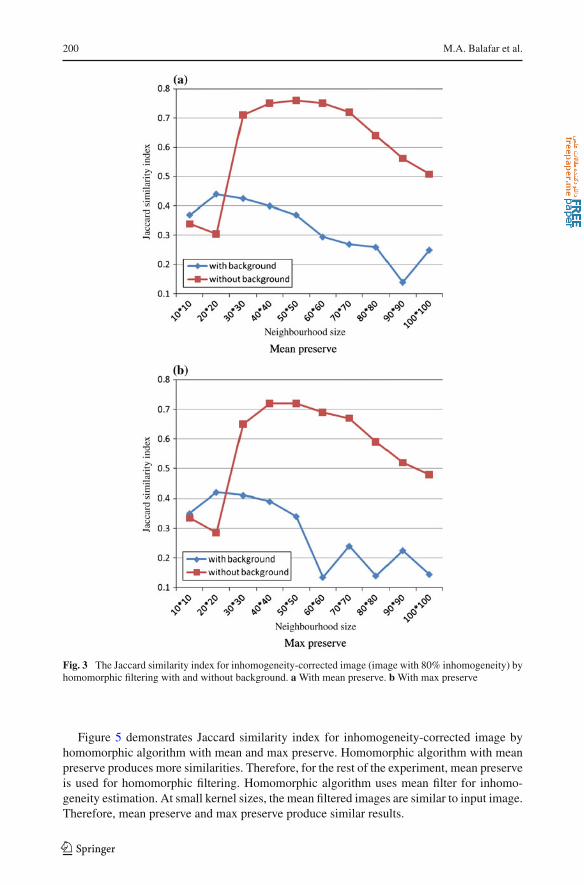
The result of inhomogeneity correction by homomorphic algorithm with and without back-ground are compared. The Jaccard similarity index (Zijdenbos and Dawant 1994) whichwidely was used by researchers to measure similarity between to images, is used to measuresimilarity between clustering result for inhomogeneity corrected image and manual segmen-tation. The Jaccard similarity index is the degree of matching between ground truth andsegmentation result for a class pixels. Figure 3 shows the Jaccard similarity index for greyinhomogeneity corrected image by homomorphic algorithm. Boundaries in image are notsharp; therefore, at small kernel sizes, neighborhood of boundary pixels most likely are notbackground pixels. As a result, homomorphic algorithm with background at small kernelsizes produces better results. But generally, homomorphic algorithm without backgroundproduces more similarities. Therefore, when homomorphic algorithm is used, backgroundpixels are ignored.
Then, the effect of two intensity preservings on the performance of homomorphic and theproposed inhomogeneity correction algorithms are investigated.
Figures 4 and 5 demonstrate the quality of inhomogeneity correction with mean andmax preserve. The figure 4 shows the Jaccard similarity index for inhomogeneity-correctedimage by proposed inhomogeneity correction algorithm with mean and max preserve. Pro-posed algorithm with mean preserve produces more similarities. Therefore, for the rest ofthe experiment, mean preserve is used for the proposed algorithm.
123
200 M.A. Balafar et al.
Fig. 3 The Jaccard similarity index for inhomogeneity-corrected image (image with 80% inhomogeneity) byhomomorphic filtering with and without background. a With mean preserve. b With max preserve
Figure 5 demonstrates Jaccard similarity index for inhomogeneity-corrected image byhomomorphic algorithm with mean and max preserve. Homomorphic algorithm with meanpreserve produces more similarities. Therefore, for the rest of the experiment, mean preserveis used for homomorphic filtering. Homomorphic algorithm uses mean filter for inhomo-geneity estimation. At small kernel sizes, the mean filtered images are similar to input image.Therefore, mean preserve and max preserve produce similar results.
123

A new method for MR grayscale inhomogeneity correction 201
Fig. 4 The Jaccard similarity index for inhomogeneity-corrected image (image with 80% inhomogeneity) byproposed algorithm with mean and max preserve
Fig. 5 The Jaccard similarity index for inhomogeneity-corrected image (image with 80% inhomogeneity) byhomomorphic filtering with mean and max preserve
Now, the performance of homomorphic algorithm and proposed algorithm are compared.Figure 6 illustrates the similarity of homogenous image and inhomogeneity-corrected imageusing different inhomogeneity correction algorithm at various kernel sizes. In Fig. 6a, 40%of the non-linear bias field is used and in Fig. 6b, 80% of the non-linear bias field is used.The proposed algorithm, in kernel size (20 * 20), outperforms homomorphic algorithm in allkernel sizes. The performance of the proposed algorithm is higher at small kernel sizes and
123

202 M.A. Balafar et al.
Fig. 6 The Jaccard similarity index for inhomogeneity-corrected image by homomorphic filtering and theproposed algorithm. a With 40% inhomogeneity. b With 80% inhomogeneity
it is lower in bigger kernel sizes. In addition, the performance of the proposed algorithmis lower at small kernel sizes and it is higher in bigger kernel sizes. But, the performanceof the proposed algorithm in much bigger when kernel sizes decreases. The following twoparagraphs explains the reasons for these performances.
123
A new method for MR grayscale inhomogeneity correction 203
The proposed algorithm approximates grey inhomogeneity using the maximum value inthe neighborhood. The performance of the proposed algorithm is higher at small kernel sizesbecause it approximates inhomogeneity with near pixel which most likely is similar to realinhomogeneity. But it is lower in bigger kernel sizes because it takes inhomogeneity from afar neighbor which is far from real inhomogeneity, so inhomogeneity correction is less.
Homomorphic algorithm considers inhomogeneity a low-frequency artefact and uses meanfilter for inhomogeneity estimation. At small kernel sizes, the mean filtered images are sim-ilar to input image and correction is less. As the kernel size increases, kernel contains repre-sentation of a tissue and low frequency information is approximated more accurate. As kernelsize increases more, kernel contains representation of more than a tissue and estimation willhave high-frequency information, too.
4 Conclusion
There are many methods for inhomogeneity correction, each of them providing differentquality of correction. After removing inhomogeneity, it is much easier to segment an imagecorrectly. All methods approximate inhomogeneity field; therefore, none of them is ideal. Inthis paper, a new filter-based method for inhomogeneity correction is proposed. Unlike theprevious filter-based methods, proposed method does not consider inhomogeneity field aslow frequency information. The proposed algorithm uses max filter for inhomogeneity cor-rection. The similarity between inhomogeneity corrected image and manual segmentationis used to compare filter-based methods and proposed method for grey-scale inhomogeneitycorrection in MR images. In order to evaluate, we used simulated images and biased themwith none linear-based inhomogeneity fields.
The methods with kernel sizes from 10 * 10 to 100 * 100 is applied to images and quan-titative analysis is used to evaluate different methods in different kernel sizes. Experimentalresults show that the new method in kernel size of 20 * 20, does almost better than or equalthe performance of other filter-based methods in all kernel sizes. For filter-based inhomoge-neity correction methods, the optimal kernel size depends on the complexity of image andinhomogeneity field. In our method, optimal kernel size is 20 * 20. Filter-based methods arevery fast and simple to implement and can be effective for inhomogeneity correction in MRimages. Future work includes the comparison of the quality of all inhomogeneity correc-tion methods with quantitative methods. Moreover, we consider combining our method withclustering-based methods.
References
Andersen AH, Zhang Z, Avison MJ, Gash DM (2002) Automated segmentation of multispectral brain MRimages. J Neurosci Meth 122:13–23
Ardizzone E, Pirrone R, Gambino O (2005) Exponential entropy driven HUM on knee MR images, Conf.(EMB), Shanghai, China, September 1–4
Balafar MA et al. (2008a) Medical image segmentation using anisotropic filter, user interaction and fuzzyC-Mean (FCM), Communications in Computer and Information Science, Springer, pp 169–176
Balafar MA et al. (2008b) Medical image segmentation using fuzzy C-Mean (FCM), learning vector quanti-zation (LVQ) and user interaction, Communications in Computer and Information Science, Springer, pp177–184
Balafar MA et al. (2008c) Medical image segmentation using fuzzy C-mean (FCM) and dominant grey levelsof image. In: Visual information engineering conference, pp 314–317
123

204 M.A. Balafar et al.
Balafar MA et al. (2008d) Medical image segmentation using fuzzy C-mean (FCM), Bayesian method anduser interaction. In: International conference on wavelet analysis and pattern recognition, pp 68–73
Balafar MA et al. (2008e) New multi-scale medical image segmentation based on fuzzy c-mean (FCM). In:IEEE conference on innovative technologies in intelligent systems and industrial applications, pp 66-70
Balafar MA et al. (2008f) MRI segmentation of medical images using FCM with initialized class centers viagenetic algorithm. In: International symposium on information technology. pp 1–4
Balafar MA et al. (2010a) Review of brain MRI image segmentation methods, Artif Intell Rev. 33:261–274Balafar M et al. (2010b) MEDICAL IMAGE SEGMENTATION USING FUZZY C-MEAN (FCM) AND
USER SPECIFIED DATA. J Circuts Syst Comput 19:1–14Balafar M et al. (2010c) IMPROVED FAST FUZZY C-MEAN AND ITS APPLICATION IN MEDICAL
IMAGE SEGMENTATION. J Circuts Syst Comput 19:203–214Balafar MA et al. (2010d) Edge-preserving Clustering Algorithms and Their Application for MRI Image
Segmentation. IMECS 17-19Balafar MA et al. (2010e) Compare different spatial based Fuzzy C-Mean (FCM) extensions for MRI Image
Segmentation. ICCAE 609-611Bansal R, Staib LH, Peterson BS (2004) Correcting nonuniformities in MRI intensities using entropy mini-
mization based on an elastic model. Presented at the Medical Image Computing and Computer-AssistedIntervention (MICCAI 2004), Saint-Malo, France, pp 78–86
BrainWeb [Online]. Available: www.bic.mni.mcgill.ca/brainweb/Brey WW, Narayana PA (1988) Correction for intensity falloff in surface coil magnetic resonance imaging.
Med Phys 15:241–245Brinkmann BH, Manduca A, Robb RA (1998) Optimized homomorphic un-sharp masking for MR greyscale
inhomogeneity correction. IEEE Trans Med Imaging 17(2) April, pp 161–171Delibasic B (2009) Reusable components for partitioning clustering algorithms. Artif Intell Rev 32(1–4) 59–75Fernández F et al. (2008) Nearest prototype classification of noisy data. Artif Intell Rev 30(1–4) 53–66Gispert JD, Reig S, Pascau J, Vaquero JJ, Garcia-Barreno P, Desco M (2004) Method for bias field correc-
tion of brain T1-weighted magnetic resonance images minimizing segmentation error. Hum Brain Mapp22:133–144
Guillemaud R, Brady M (1997) Estimating the bias field of MR images. IEEE Trans Med Imaging 16(3):238–251
Haselgrove J, Prammer M (1986) An algorithm for compensating of surface-coil images for sensitivity of thesurface coil. Magn Reson Imag 4:469–472
Koivula A, Alakuijala J, Tervonen O (1999) Image feature based automatic correction of low-frequency spatialintensity variations in MR images. Magn Reson Imag 15:1167–1175
Lai SH, Fang M (1999) A new variational shape-from-orientation approach to correcting intensity inhomoge-neities in magnetic resonance images. Med Image Anal 3:409–424
Learned-Miller EG, Ahammad P (2004) Joint MRI bias removal using entropy minimization across images.Presented at the Neural Information Processing Systems Conferences (NIPS), Vancouver, Canada,pp 761–768
Likar B, Viergever MA, Pernu¡s F (2001) Retrospective correction of MR intensity inhomogeneity by infor-mation minimization. IEEE Trans Med Imag 20(12):1398–1410
Lorena AC et al.(2008) A review of the combination of binary classifiers in multiclass problems. Artif IntellRev 30(1-4)19-37
Mangin J-F (2000) Entropy minimization for automatic correction of intensity nonuniformity. Presented atthe IEEE Workshop Math. Methods Biomed. Image Anal., Hilton Head Island, SC, pp. 162–169
Meyer CR, Bland PH, Pipe J (1995) Retrospective correction of intensity inhomogeneities in MRI. IEEE TransMed Imag 14(1):36–41
Smail Linda (2009) De-separation and computation of probability distribution in Bayesian networks. ArtifIntell Rev 31(1-4):87-99
Solanas E, Thiran JP (2001) Exploiting voxel correlation for automated MRI bias field correction by conditionalentropy minimization. Presented at the 4th International Medical Image Computing Computer-Assist.Intervent. (MICCAI 2001), Utrecht, The Netherlands pp. 1220–1221
Vovk U, Pernu¡s F, Likar B (2004) MRI intensity inhomogeneity correction by combining intensity and spatialinformation. Phys Med Biol 49:4119–4133
Vovk U, Pernu¡s F, Likar B (2007) A Review of methods for correction of intensity inhomogeneity in MRI.IEEE Trans Med Imaging 26(3) 405–421
Zijdenbos A, Dawant B (1994) Brain segmentation and white matter lesion detection in MR images. CriticalRev Biomed Eng 22(5-6):401-465
123