A New Geographical Cluster View on Passenger Vehicle ...
18
International Journal of Geo-Information Article A New Geographical Cluster View on Passenger Vehicle Purchasing in Chinese Cities Daqian Liu 1 , Wei Song 2, *, Jia Lu 3 , Chunyan Xie 4 and Xin Wen 1 1 Northeast Institute of Geography and Agroecology, Chinese Academy of Sciences, Changchun 130102, China; [email protected] (D.L.); [email protected] (X.W.) 2 Department of Geography and Geosciences, University of Louisville, Louisville, KY 40292, USA 3 Geosciences Program, Valdosta State University, Valdosta, GA 31698, USA; [email protected] 4 FAW-Volkswagen Automotive Company Ltd., Changchun 130013, China; [email protected] * Correspondence: [email protected]; Tel.: +1-502-852-2690 Received: 24 October 2017; Accepted: 22 December 2017; Published: 1 January 2018 Abstract: It is important to understand urban auto markets from a spatial perspective. Specifically, the question of how to simplify and visualize the relatedness of the complicated urban markets arises. Based on the concept of ‘product space’, this research explores the similarity between Chinese cities and identifies the city clusters using data of automobile sales in 2012. A city’s automobile market is shared by different manufacturers and the proximity between two cities is evaluated based on the similarity or relatedness in the structure of the two markets. The spatial structures of the ‘city clusters’ derived from the proximities of automobile markets among cities are mapped, examined, and interpreted. The analysis indicates that cities with higher proximity tend to be similar. According to the intercity proximity index, four geographical city-clusters are identified: the Southeast developed city-cluster, North China city-cluster, Northeast city-cluster, and West city-cluster. Cities in the same cluster tend to share many common characteristics while cities in different clusters exhibit obvious variances, especially in terms of economic status and dominant automakers. Keywords: automobile purchasing; market structure; proximity; city cluster; China 1. Introduction It is important to study the automobile markets in Chinese cities. Indeed, they have recently drawn great international attention. As the most populous developing country with the second largest economy in the world, China has been playing an increasingly important role in the global economy. China’s strong economic growth and lasting prosperity have led to an increasing demand for durable goods, among which are personal automobiles. After China became a World Trade Organisation (WTO) member, Chinese markets have become more open and automobile manufacturers all around the world have expanded automobile production and sales in China. Since 2009, China has become the largest automobile market in the world. As China’s economy continues to grow, the number of high-income urban households will increase greatly, and the infrastructure (such as high quality roads) will be improved significantly, which will likely increase household demand for automobile usage. Therefore, the automobile market is expected to maintain strong growth momentum. Automobile sales vary across cities because different cities have diverse purchasing capacity. Nowadays, as the market economy develops in China, all urban markets are full of competition from different automobile manufacturers, resulting in uneven market shares acquired by different automakers. It is important to understand the automotive markets in different cities from a spatial perspective and to classify the cities based on the relatedness of the markets among them. Meanwhile, China has a vast territory with substantial regional heterogeneity. Automobile sales and the factors impacting automobile markets vary greatly and are worthy of being explored from a regional perspective. Theoretically, if two cities ISPRS Int. J. Geo-Inf. 2018, 7, 9; doi:10.3390/ijgi7010009 www.mdpi.com/journal/ijgi
-
Upload
khangminh22 -
Category
Documents
-
view
2 -
download
0
Transcript of A New Geographical Cluster View on Passenger Vehicle ...
International Journal of
Geo-Information
Article
A New Geographical Cluster View on PassengerVehicle Purchasing in Chinese Cities
Daqian Liu 1, Wei Song 2,*, Jia Lu 3, Chunyan Xie 4 and Xin Wen 1
1 Northeast Institute of Geography and Agroecology, Chinese Academy of Sciences,Changchun 130102, China; [email protected] (D.L.); [email protected] (X.W.)
2 Department of Geography and Geosciences, University of Louisville, Louisville, KY 40292, USA3 Geosciences Program, Valdosta State University, Valdosta, GA 31698, USA; [email protected] FAW-Volkswagen Automotive Company Ltd., Changchun 130013, China; [email protected]* Correspondence: [email protected]; Tel.: +1-502-852-2690
Received: 24 October 2017; Accepted: 22 December 2017; Published: 1 January 2018
Abstract: It is important to understand urban auto markets from a spatial perspective. Specifically,the question of how to simplify and visualize the relatedness of the complicated urban markets arises.Based on the concept of ‘product space’, this research explores the similarity between Chinese citiesand identifies the city clusters using data of automobile sales in 2012. A city’s automobile marketis shared by different manufacturers and the proximity between two cities is evaluated based onthe similarity or relatedness in the structure of the two markets. The spatial structures of the ‘cityclusters’ derived from the proximities of automobile markets among cities are mapped, examined, andinterpreted. The analysis indicates that cities with higher proximity tend to be similar. According tothe intercity proximity index, four geographical city-clusters are identified: the Southeast developedcity-cluster, North China city-cluster, Northeast city-cluster, and West city-cluster. Cities in the samecluster tend to share many common characteristics while cities in different clusters exhibit obviousvariances, especially in terms of economic status and dominant automakers.
Keywords: automobile purchasing; market structure; proximity; city cluster; China
1. Introduction
It is important to study the automobile markets in Chinese cities. Indeed, they have recentlydrawn great international attention. As the most populous developing country with the second largesteconomy in the world, China has been playing an increasingly important role in the global economy.China’s strong economic growth and lasting prosperity have led to an increasing demand for durablegoods, among which are personal automobiles. After China became a World Trade Organisation(WTO) member, Chinese markets have become more open and automobile manufacturers all aroundthe world have expanded automobile production and sales in China. Since 2009, China has becomethe largest automobile market in the world. As China’s economy continues to grow, the number ofhigh-income urban households will increase greatly, and the infrastructure (such as high quality roads)will be improved significantly, which will likely increase household demand for automobile usage.Therefore, the automobile market is expected to maintain strong growth momentum. Automobile salesvary across cities because different cities have diverse purchasing capacity. Nowadays, as the marketeconomy develops in China, all urban markets are full of competition from different automobilemanufacturers, resulting in uneven market shares acquired by different automakers. It is important tounderstand the automotive markets in different cities from a spatial perspective and to classify thecities based on the relatedness of the markets among them. Meanwhile, China has a vast territory withsubstantial regional heterogeneity. Automobile sales and the factors impacting automobile marketsvary greatly and are worthy of being explored from a regional perspective. Theoretically, if two cities
ISPRS Int. J. Geo-Inf. 2018, 7, 9; doi:10.3390/ijgi7010009 www.mdpi.com/journal/ijgi

ISPRS Int. J. Geo-Inf. 2018, 7, 9 2 of 18
have similar market structures, they are related to some degree because there are probably common orcomparable determinants behind the formation of the automobile markets, such as similar economicstatus, demographical characteristics, purchasing propensities, and cultural backgrounds. Cities canbe placed in the same class or group if their automobile markets are alike due to these cities sharingsome common characteristics.
Based on the concepts of ‘proximity’ and ‘product space’ proposed by Hidalgo et al. in 2007 [1],this research examines the relatedness of automotive markets in different cities and the correspondingstructure of city clusters based on the indexes of proximities of personal vehicle purchases, with2012 data of automobile sales. Specifically, this paper intends to address the following questions:First, which cities can be grouped together based on the similarities of the market structure, andhow should they be grouped? Second, what are the common characteristics and typical geographicalfeatures of the cities with similar automobile markets? Third, what are the differences in the marketstructures among different city-clusters, such as the respective shares for foreign, Sino-foreign joint anddomestic automakers in different city clusters? Finally, what are the factors affecting the automobilesales and market structures in China? These questions are interrelated and the answers will offer abetter understanding of the formation of spatial patterns of automobile sales, as well as the impacts ofregional background on city-level automobile sales.
2. Background Literature
The automobile market has been studied widely, but past research has not focused so muchon Asian markets. With the economic development of Asian countries, especially China, the Asianautomobile markets are drawing more attention. Recently, some interesting findings have beenpublished by studies on Asian automobile markets. Consumers from different countries displayeddiverse cultural preferences. Thanasuta et al. [2] discovered that Thai consumers pay the highestvalue for German cars, while Japanese and American cars have about the same value. Korean andMalaysian cars are ranked last in price. Wang and Yang [3] revealed that both brand personalityand the image of the origin country exert significant effects on vehicle purchase intention in China.A positive image of the origin country could enhance the brand personality’s positive impact onpurchase intention, whereas a negative image could do just the opposite. Wang, Yang and Liu [4]also found that product-brand personality is more significant in affecting the purchase intention thancompany-brand personality. Deng and Ma [5] suggested that some large automobile manufacturershad set high markups, due to their strong market power in China’s automobile market. Decliningmarkups along with a reduction in the markets controlled by major producers emerged in the late1990’s. Haque et al. [6] argued that brand image and quality of foreign products carry significantpositive influences on purchase intention of foreign products. Generally speaking, studies on theautomobile markets in Asian countries, especially in China, are still limited. As incomes increase, thepropensity to purchase vehicles increases as they become more affordable. Since China has become oneof the largest automobile markets, more research in terms of automobile markets and the influencingfactors should be conducted for a better understanding of urban and regional changes. However,most existing research on automobile purchasing in China [7–11] focused on the overall characteristicsor prediction of sales of automobiles (or a particular type of car, such as green cars). Only limitedresearch concerning the spatial distribution of overall automobile sales across Chinese cities, especiallythe spatial pattern of automobile markets composed of different automobile manufacturers, has beenpublished due to the lack of relevant data [12].Regarding car sales, it is important to study the factorsaffecting car ownership and purchase preferences. Researchers in other countries have found thatimportant factors for car ownership include individual and household income, employment status,household location, cultural background, car price, energy prices, access to public transportation, buildenvironment, etc. [13–16]. Thus, more research is needed to explore such factors in China.
Methodologically, the inspiration for our research derives from the concept of ‘product space’proposed by Hidalgo et al. [1], which corresponds to the network of relatedness between products

ISPRS Int. J. Geo-Inf. 2018, 7, 9 3 of 18
based on the pattern of comparative advantage in world trade. The authors argued that differentproducts are related to each other through a network of proximities, in which the nodes representthe products and the linkages between them represent pair-wise relationships among products.The proximity between two products are measured based on the probability of being exported bythe same countries. Numerous studies have been inspired by their work. The concept of ‘productspace’ has been empirically investigated and extended to new research fields. Many researchers focuson analyzing the linkage between the products in a country’s export basket and the evolution of theproduct space [17–20]. Furthermore, the ‘product space’ is also applied to the study of ‘scientificspace’ [21] and ‘industry space’ which stems from almost identical ideas, but employs revised methodsin computing the relatedness [22].
Although the notions of classification and cluster are discussed in the studies of ‘productspace’, most refer to the product cluster or product classification, rather than geographical cluster orgeographical agglomeration. Since products can be linked based on the probabilities of being exportedby the same countries, countries with similar export baskets can also be considered related because theycan be deemed as having a common export capacity. From this perspective, the research subject couldbe extended to geographical areas to examine their relatedness, both spatially and functionally. In fact,some researchers already strive to explore the relationship and relatedness between countries [23].Analysis of areal relatedness at country level tends to be excessively macro that it may neglect manyvaluable details. Thus, it is more meaningful to conduct analysis at a finer spatial scale such ascity-level and study the relatedness among cities based on certain products. Furthermore, the networkof relatedness among cities could be used to identify the ‘city clusters’ in which the cities’ automobilemarkets are highly similar. This research tends to fill a void of existing literature, focusing on the spatialanalysis of the proximity of automobile market structures across Chinese cities based on empiricalpurchasing data.
3. Methodology
3.1. Data and Research Area
It is well known that passenger cars are the most important type of automobiles and they are inhighest demand by urban residents. In this study, we examined the sales/purchasing of passengervehicles, which include three general styles: sedans, MPVs (multi-purpose vehicle) and SUVs (sportutility vehicle). The data of passenger vehicle sales were compiled from the Economic Advisory Centerin the State Information Center (SIC). The only available data set is composed of the actual numbersof vehicles sold by each automaker in each of the 337 prefecture-level cities in mainland China in2012. In China’s administrative system, a prefecture-level city ranks below a province and abovea county. It usually contains a municipality with subordinate districts and several counties. Mostprovinces are composed of a certain number of prefecture-level cities. The four centrally-administeredmunicipalities (Beijing, Tianjin, Shanghai and Chongqing) are practically treated as the prefecture-levelcities in this study, although they are actually in the same administrative rank as provinces. No vehiclesales information is available for Taiwan, Hong Kong and Macao. According to this data set, totalvehicle sales in Mainland China in 2012 reached 13.08 million, with 12.04 million vehicles producedin China (by both Sino-foreign joint automakers and Chinese automakers) and 1.04 million vehiclesimported from overseas (produced by foreign-owned automakers). Other auxiliary data used in thisresearch, such as Gross Domestic Product (GDP) and population studies, were collected from theChina Statistical Yearbook for Regional Economy (2012).
Vehicle sales data in 2012 were analyzed at the automaker level. In China, the foreign automakersare not allowed to produce automobiles alone, but are encouraged to join with a domestic Chinesemanufacturer to form a Sino-foreign venture to produce and sell automobiles. Along with theexpansion of the Chinese automobile market in the past decade, nearly all of the major foreignautomakers have chosen to join with a Chinese manufacturer (or two manufacturers) to launch
ISPRS Int. J. Geo-Inf. 2018, 7, 9 4 of 18
Sino-foreign joint ventures in order to be allowed to produce and sell vehicles in China. It shouldbe noted that because some of the foreign automakers joint ventured with two separate Chineseautomobile manufactures, certain foreign brand vehicles are actually produced by two independentand competitive manufacturers in China. For instance, Toyota passenger vehicles are produced by bothGuangzhou Toyota and First Automobile Works (FAW) Toyota, and are thus treated as two separateautomakers in the study. The same is true for Volkswagen vehicles which are manufactured by bothFAW Volkswagen and Shanghai Volkswagen.
The data contain 113 manufacturers that sold cars in China in 2012, comprising 47 foreign-ownedautomakers, 26 Sino-foreign joint automakers, and 40 Chinese automakers. We selected the top 60passenger automakers according to their 2012 sales in China. Seventeen of them were Sino-foreign jointventures, 18 were solely foreign-owned companies (imported), and 25 were Chinese manufacturers.Sales of passenger cars of the top 60 automakers accounted for 98.76% of the total sales in mainlandChina in 2012. Sales of the vehicle by automakers beyond the top 60 were quite small, usually fewerthan 10,000 units in the whole country. Some of the makes were only sold in hundreds of units in avery limited number of cities. Excluding these minor automakers would help capture the big pictureand understand the essential structure of China’s city-level passenger vehicle sales/purchasing, andfacilitate the computation of the chief indices in this study. The top eight passenger vehicle makes interms of sales were all made by Sino-foreign joint ventures, accounting for 66.68% of the total sales.Although foreign automakers are allowed to sell automobiles produced abroad in China’s market, thenumber of imported automobiles is much smaller than that of domestically produced vehicles. Due tohigher prices and import taxes, they mainly target higher-income customers in China.
3.2. Revealed Comparative Advantage (RCA) and Proximity
When we examine the role of one manufacturer in a city’s automobile sales market, we want to seenot only whether a manufacturer sells its vehicles in any amount, but also how substantial vehicle salesare in the city. Thus, we require that a manufacturer achieved Revealed Comparative Advantage (RCA)in a city. The concept of RCA is analogous to the index of Location Quotient (LQ) in geographicalresearch. The RCAc,i in our study represents the comparative advantage of the manufacturer i (1, 2, 3,. . . , 60) ’s market share of automobile sales in city c (c = 1, 2, 3, . . . , 337), as compared with the marketshare in the whole national market. It is computed as follows:
RCAc,i =
X(c,i)∑i
X(c,i)
∑c
X(c,i)
∑c,i
X(c,i)
(1)
where X(c,i) is the amount of automobile sales of manufacturer i in city c. RCAc,i > 1 meansmanufacturer i has a revealed comparative advantage in city c. In our view, the structural characteristicsof a city’s automobile market are largely dominated by the manufacturers with achieved comparativeadvantage.
A structural table based on the RCAc,i was then built to define whether manufacturer i has arevealed comparative advantage in city c. The table is made up of Mc,i, where Mc,i = 1, if RCAc,i > 1,otherwise Mc,i = 0. For an automaker to have a revealed comparative advantage in a city, its automobilesmust possess the right bundle of features to be substantially consumed in that city. If two cities havevery similar market factors, this should result in a higher probability of an automaker having acomparative advantage in both. Formally, the proximity between cities c and c′ is the minimum ofthe pairwise conditional probabilities of an automaker that has an RCA in city c given that it has anRCA in city c′. In other words, the proximity between two cities is calculated based on the number ofdominant automakers shared by both cities, relative to the number of dominant automakers in the city

ISPRS Int. J. Geo-Inf. 2018, 7, 9 5 of 18
with the most dominant manufactures. Practically, Equation (2) measures the proximity of the twocities based on the similarity of both market structures.
φcc′ =
∑i
Mc,i ∗Mc′ ,i
max(∑i
Mc,i, ∑i
Mc′ ,i)(2)
where φcc′ is the proximity between two cities; ∑i
Mc,i ∗Mc′ ,i corresponds to the number of
manufacturers that gain a revealed comparative advantage in both cities. The larger is the numberof common automakers, the higher is the proximity of the two cities. A proximity of 1 suggests thatthe two cities are very similar in the market structure of automobile sales, consumer preferences, andother underlying demand factors. Generally, two cities are considered similar and in closer proximitywhen φ is larger than 0.7 [24].
By calculating the proximity between cities, the similarity or relatedness of the two cities canbe examined, and the question of which cities are more similar based on their automobile marketstructures could be answered. The underlying reasons why these cities are related could be exploredgiven the characteristics of the cities in tandem.
3.3. City Cluster Based on Proximity
One of the major objectives of this research is to examine the geographical pattern of cities withhigh similarities, such as whether they concentrate in certain regions or disperse in random. If theytend to concentrate, some clusters of cities are likely to be identified, and the characteristics of eachcluster can be explored. In geographical studies, cluster analysis is usually used as a convenientmethod to group similar spatial units into clusters and recognize the spatial patterns followingthe construction of the similarity matrices. The classic clustering methods, such as hierarchicalclustering and K-Means clustering, have been widely applied in studies of urban and regional patternidentification, neighborhood segregation, urban–rural classification, landscape planning, etc. [25–33].However, because it is not easy to directly visualize the linkages among cities and observe the spatialpatterns of the city clusters using the traditional clustering, we chose a new approach to identify thecity clusters based on the highest proximities among the cities. Two basic rules were followed for acity to be included in a specific city-cluster. First, the city has no fewer than two links with proximityvalues equal to or higher than 0.7 connected with the other cities in the cluster. Second, each clustershould have more than 10 cities. Thus, each cluster could be considered a closed ‘network’ with eachnode having at least two high-proximity links with other nodes. Apparently, it is easier to capturethe associations among the cities in a certain cluster and the geographical patterns at the same timeusing this method. Meanwhile, since a matrix based on the index of proximity among cities hasalready been built, it is feasible and meaningful to compare the clustering results in this work withthe results from the traditional cluster analysis, such as the hierarchical cluster analysis. For example,it can be observed whether cities assigned to a certain cluster are also grouped into the same clusterusing the traditional method and the degree of overlap might be able to measure the credibility of theresults to some degree. There are 337 cities in our study, thus the number of entries in the proximitymatrix is 56,616 (337 × 336/2). Because we are more concerned with the proximity of higher levels,only the top 10 proximity values of each city were visualized with lines to represent the relatednessamong cities. A node at the centroid of each administrative prefectural area was used to represent eachcity. After deleting redundant lines (keeping a single line between each pair of cities), a total of 2802lines representing the relative higher levels of proximity was portrayed, with no fewer than 10 linesconnected with each city.

ISPRS Int. J. Geo-Inf. 2018, 7, 9 6 of 18
3.4. Discriminant Analysis
Linear discriminant analysis is the statistical technique often used to examine whether two ormore groups can be distinguished from each other based on linear combinations of values of predictorvariables. The linear combinations of predictor variables are known as discriminant functions, variates,or latent variables. This technique was employed in the study to convert predictor variables intolatent or underlying dimensions to uncover which underlying dimensions and their correspondingvariables contribute to the separation among different clusters of cities. Predictor variables includethose representing each city’s economic development and incomes levels, composition of car sales,as well as geographical locations (dummy variables representing western, central, and northeasternChina, respectively).
4. Results
4.1. The Statistics of Proximity
Descriptive statistics of all 56,616 computed proximities demonstrate that there is great variationin the values of proximity between cities, with a maximum of 0.926, a minimum of 0, and a standarddeviation of 0.1424 around the mean of 0.358. This indicates that some cities are nearly identical, someare totally different, and most others are not alike in terms of the structure of their automobile markets.Figure 1 depicts the frequency distribution of proximity values using the histogram with a smoothcurve in a nearly normal fashion.
ISPRS Int. J. Geo-Inf. 2018, 7, 9 6 of 18
3.4. Discriminant Analysis
Linear discriminant analysis is the statistical technique often used to examine whether two or more groups can be distinguished from each other based on linear combinations of values of predictor variables. The linear combinations of predictor variables are known as discriminant functions, variates, or latent variables. This technique was employed in the study to convert predictor variables into latent or underlying dimensions to uncover which underlying dimensions and their corresponding variables contribute to the separation among different clusters of cities. Predictor variables include those representing each city’s economic development and incomes levels, composition of car sales, as well as geographical locations (dummy variables representing western, central, and northeastern China, respectively).
4. Results
4.1. The Statistics of Proximity
Descriptive statistics of all 56,616 computed proximities demonstrate that there is great variation in the values of proximity between cities, with a maximum of 0.926, a minimum of 0, and a standard deviation of 0.1424 around the mean of 0.358. This indicates that some cities are nearly identical, some are totally different, and most others are not alike in terms of the structure of their automobile markets. Figure 1 depicts the frequency distribution of proximity values using the histogram with a smooth curve in a nearly normal fashion.
Figure 1. Histograms of proximity.
Overall, most of the proximity values are relevantly low with more than 50% of proximity values lower than the average value (0.358) and only 2.31% of them larger than 0.65. This broad, heterogeneous distribution indicates that there are only a few strong links and many marginal links. Barely 1% of the total proximity values are equal to or more than 0.7, and they are the main focus of our study.
Figure 1. Histograms of proximity.
Overall, most of the proximity values are relevantly low with more than 50% of proximity valueslower than the average value (0.358) and only 2.31% of them larger than 0.65. This broad, heterogeneousdistribution indicates that there are only a few strong links and many marginal links. Barely 1% of thetotal proximity values are equal to or more than 0.7, and they are the main focus of our study.

ISPRS Int. J. Geo-Inf. 2018, 7, 9 7 of 18
4.2. Proximity and Distance
Spatially, the proximity values among cities based on the similarity of automobile markets arerelated to the physical distances among them. After all, nearby cities tend to have similar culturalbackgrounds or purchasing preferences and their markets are more likely to be penetrated by the samemanufacturers around them. Figure 2 delineates the distribution of the 2802 links corresponding to thetop 10 proximity values of each city. The frequencies of the links below 500 km (the average distance is750.82 km) are relatively higher, with the largest number of links (over 400) falling within the distancebetween 100 km and 200 km. In general, the frequencies of links decrease with increased distances,excluding the distance interval between 0 and 100 km. It appears that the links or city pairs tend tohave higher levels of market proximity as the distance between them decreases.
ISPRS Int. J. Geo-Inf. 2018, 7, 9 7 of 18
4.2. Proximity and Distance
Spatially, the proximity values among cities based on the similarity of automobile markets are related to the physical distances among them. After all, nearby cities tend to have similar cultural backgrounds or purchasing preferences and their markets are more likely to be penetrated by the same manufacturers around them. Figure 2 delineates the distribution of the 2802 links corresponding to the top 10 proximity values of each city. The frequencies of the links below 500 km (the average distance is 750.82 km) are relatively higher, with the largest number of links (over 400) falling within the distance between 100 km and 200 km. In general, the frequencies of links decrease with increased distances, excluding the distance interval between 0 and 100 km. It appears that the links or city pairs tend to have higher levels of market proximity as the distance between them decreases.
Figure 2. Histograms for the lengths of top 10 links of each city.
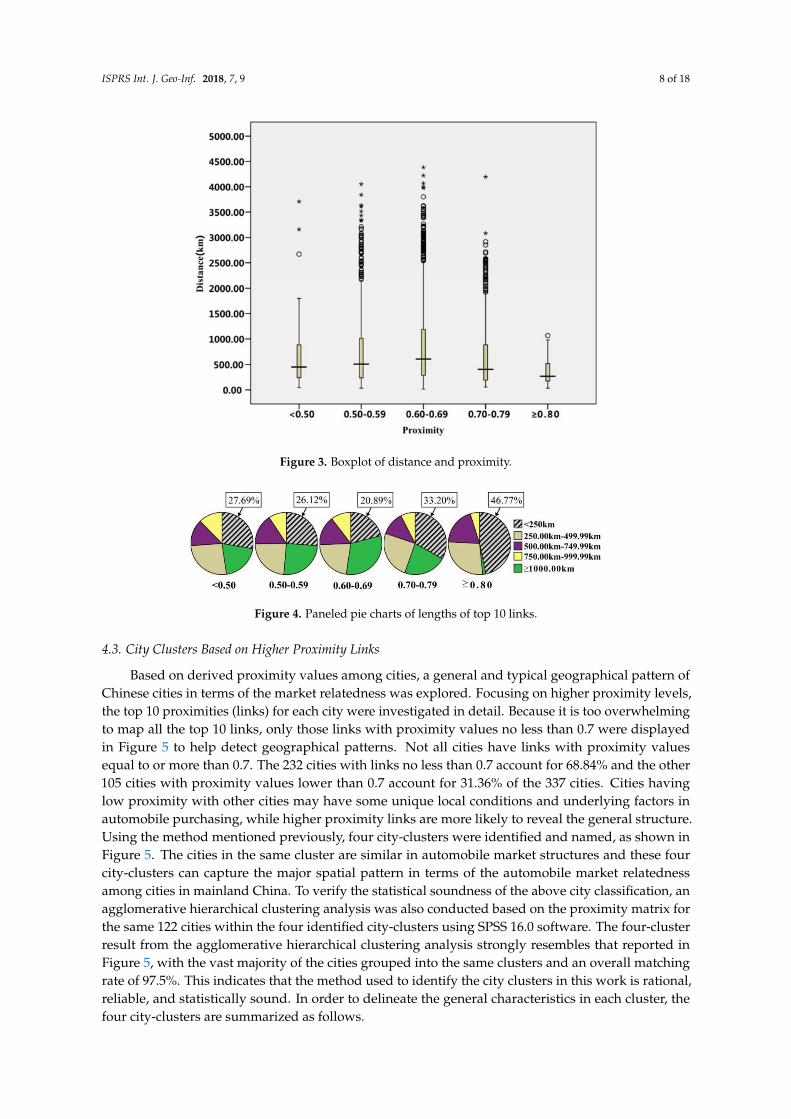
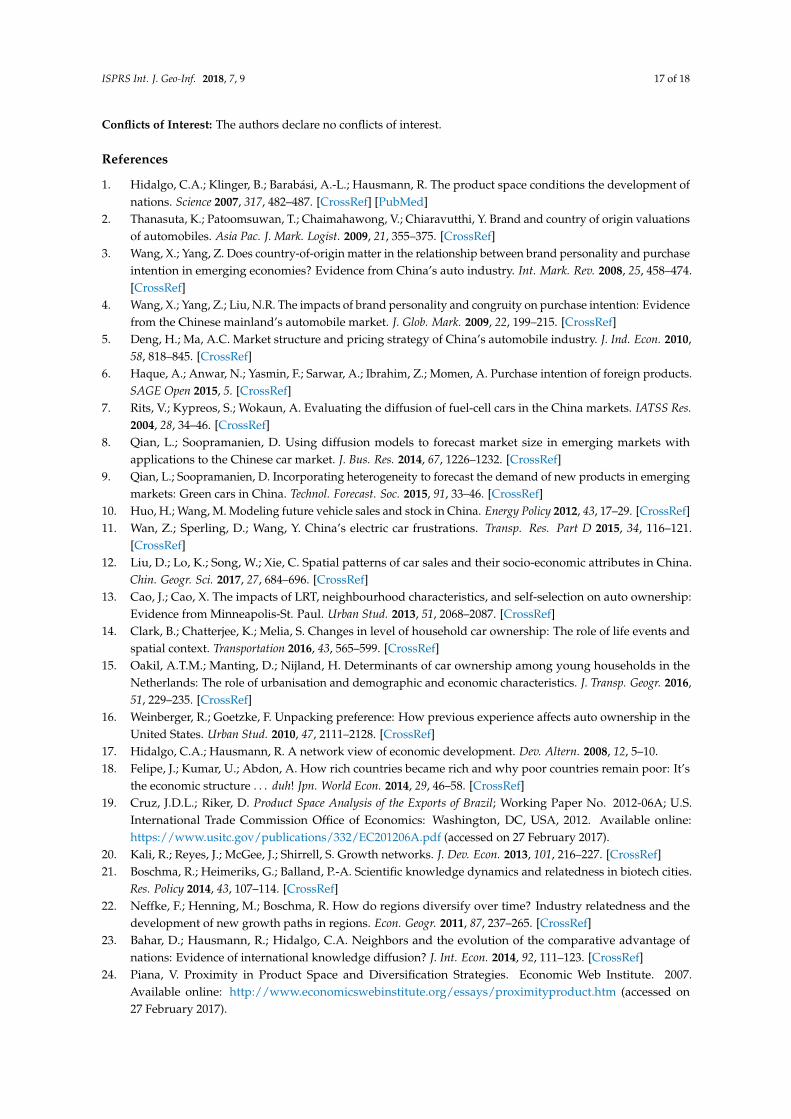
To further explore the relationship between the distance and the proximity values, the links were arranged into five groups based on proximity values, and a boxplot graph was produced. As Figure 3 shows, the distance varies dramatically even when the proximity values are more than 0.70 (considered high enough), but the average distance becomes smaller as the proximity increases. A panel of pie charts of lengths were made to show the proportions of different ranges of distance in each group (Figure 4). It reveals that links with higher proximity values are more likely to be with shorter distances. For instance, when the proximities are higher than 0.8, the proportion of distances shorter than 250 km reaches 46.77%, and the proportion of links with distances under the average (788 km) is also fairly high. Conversely, the proportion of links involving distances greater than 1000 km is minimal.
In short, if two cities possess higher proximity values, the distance between them is more likely to be shorter. Although we cannot directly conclude that distance alone is the most important factor in determining the proximity value between two cities, the geographical closeness could imply specific regional characteristics and probably certain similar underlying determinants in automobile demand, leading to higher proximity values.
Figure 2. Histograms for the lengths of top 10 links of each city.
To further explore the relationship between the distance and the proximity values, the links werearranged into five groups based on proximity values, and a boxplot graph was produced. As Figure 3shows, the distance varies dramatically even when the proximity values are more than 0.70 (consideredhigh enough), but the average distance becomes smaller as the proximity increases. A panel of piecharts of lengths were made to show the proportions of different ranges of distance in each group(Figure 4). It reveals that links with higher proximity values are more likely to be with shorter distances.For instance, when the proximities are higher than 0.8, the proportion of distances shorter than 250 kmreaches 46.77%, and the proportion of links with distances under the average (788 km) is also fairlyhigh. Conversely, the proportion of links involving distances greater than 1000 km is minimal.
In short, if two cities possess higher proximity values, the distance between them is more likely tobe shorter. Although we cannot directly conclude that distance alone is the most important factor indetermining the proximity value between two cities, the geographical closeness could imply specificregional characteristics and probably certain similar underlying determinants in automobile demand,leading to higher proximity values.
ISPRS Int. J. Geo-Inf. 2018, 7, 9 8 of 18
ISPRS Int. J. Geo-Inf. 2018, 7, 9 8 of 18
Figure 3. Boxplot of distance and proximity.
Figure 4. Paneled pie charts of lengths of top 10 links.
4.3. City Clusters Based on Higher Proximity Links
Based on derived proximity values among cities, a general and typical geographical pattern of Chinese cities in terms of the market relatedness was explored. Focusing on higher proximity levels, the top 10 proximities (links) for each city were investigated in detail. Because it is too overwhelming to map all the top 10 links, only those links with proximity values no less than 0.7 were displayed in Figure 5 to help detect geographical patterns. Not all cities have links with proximity values equal to or more than 0.7. The 232 cities with links no less than 0.7 account for 68.84% and the other 105 cities with proximity values lower than 0.7 account for 31.36% of the 337 cities. Cities having low proximity with other cities may have some unique local conditions and underlying factors in automobile purchasing, while higher proximity links are more likely to reveal the general structure. Using the method mentioned previously, four city-clusters were identified and named, as shown in Figure 5. The cities in the same cluster are similar in automobile market structures and these four city-clusters can capture the major spatial pattern in terms of the automobile market relatedness among cities in mainland China. To verify the statistical soundness of the above city classification, an agglomerative hierarchical clustering analysis was also conducted based on the proximity matrix for the same 122 cities within the four identified city-clusters using SPSS 16.0 software. The four-cluster result from the agglomerative hierarchical clustering analysis strongly resembles that reported in Figure 5, with the vast majority of the cities grouped into the same clusters and an overall matching rate of 97.5%. This indicates that the method used to identify the city clusters in this work is rational, reliable, and statistically sound. In order to delineate the general characteristics in each cluster, the four city-clusters are summarized as follows.
Figure 3. Boxplot of distance and proximity.
ISPRS Int. J. Geo-Inf. 2018, 7, 9 8 of 18
Figure 3. Boxplot of distance and proximity.
Figure 4. Paneled pie charts of lengths of top 10 links.
4.3. City Clusters Based on Higher Proximity Links
Based on derived proximity values among cities, a general and typical geographical pattern of Chinese cities in terms of the market relatedness was explored. Focusing on higher proximity levels, the top 10 proximities (links) for each city were investigated in detail. Because it is too overwhelming to map all the top 10 links, only those links with proximity values no less than 0.7 were displayed in Figure 5 to help detect geographical patterns. Not all cities have links with proximity values equal to or more than 0.7. The 232 cities with links no less than 0.7 account for 68.84% and the other 105 cities with proximity values lower than 0.7 account for 31.36% of the 337 cities. Cities having low proximity with other cities may have some unique local conditions and underlying factors in automobile purchasing, while higher proximity links are more likely to reveal the general structure. Using the method mentioned previously, four city-clusters were identified and named, as shown in Figure 5. The cities in the same cluster are similar in automobile market structures and these four city-clusters can capture the major spatial pattern in terms of the automobile market relatedness among cities in mainland China. To verify the statistical soundness of the above city classification, an agglomerative hierarchical clustering analysis was also conducted based on the proximity matrix for the same 122 cities within the four identified city-clusters using SPSS 16.0 software. The four-cluster result from the agglomerative hierarchical clustering analysis strongly resembles that reported in Figure 5, with the vast majority of the cities grouped into the same clusters and an overall matching rate of 97.5%. This indicates that the method used to identify the city clusters in this work is rational, reliable, and statistically sound. In order to delineate the general characteristics in each cluster, the four city-clusters are summarized as follows.
Figure 4. Paneled pie charts of lengths of top 10 links.
4.3. City Clusters Based on Higher Proximity Links
Based on derived proximity values among cities, a general and typical geographical pattern ofChinese cities in terms of the market relatedness was explored. Focusing on higher proximity levels,the top 10 proximities (links) for each city were investigated in detail. Because it is too overwhelmingto map all the top 10 links, only those links with proximity values no less than 0.7 were displayedin Figure 5 to help detect geographical patterns. Not all cities have links with proximity valuesequal to or more than 0.7. The 232 cities with links no less than 0.7 account for 68.84% and the other105 cities with proximity values lower than 0.7 account for 31.36% of the 337 cities. Cities havinglow proximity with other cities may have some unique local conditions and underlying factors inautomobile purchasing, while higher proximity links are more likely to reveal the general structure.Using the method mentioned previously, four city-clusters were identified and named, as shown inFigure 5. The cities in the same cluster are similar in automobile market structures and these fourcity-clusters can capture the major spatial pattern in terms of the automobile market relatednessamong cities in mainland China. To verify the statistical soundness of the above city classification, anagglomerative hierarchical clustering analysis was also conducted based on the proximity matrix forthe same 122 cities within the four identified city-clusters using SPSS 16.0 software. The four-clusterresult from the agglomerative hierarchical clustering analysis strongly resembles that reported inFigure 5, with the vast majority of the cities grouped into the same clusters and an overall matchingrate of 97.5%. This indicates that the method used to identify the city clusters in this work is rational,reliable, and statistically sound. In order to delineate the general characteristics in each cluster, thefour city-clusters are summarized as follows.

ISPRS Int. J. Geo-Inf. 2018, 7, 9 9 of 18ISPRS Int. J. Geo-Inf. 2018, 7, 9 9 of 18
Figure 5. Four city-clusters based on the highest proximity values (≥0.7) in China.
(1) The Southeast developed city-cluster. As Figure 6 shows, there are 27 cities in this cluster, most of which are located in the provinces in the southeast coastal area of China, such as Shanghai, Jiangsu, Zhejiang, Fujian, and Guangdong. Meanwhile, several economically developed inland cities are also included in this group, such as Beijing and Chengdu. Virtually all of them are prominent and populous cities with highly developed economies, not only in relation to their own provinces but also to the whole country of China. All of the cities are playing a leading role in shaping China’s current and future economic landscape and city space.
Figure 6. Southeast developed city-cluster.
(2) The North China city-cluster. A total of 37 cities are included in this group. In addition to higher market proximities among them, cities in this cluster demonstrate more geographical closeness and an apparent spatial agglomeration in the North China Plain and surroundings, such as Hebei, Henan, Shanxi, and Shandong (Figure 7). Some common features of these cities are that their economy and population levels are much smaller than those in the Southeast coast city-cluster, and most of them are in the second-tier and third-tier cities of their respective provinces.
Figure 5. Four city-clusters based on the highest proximity values (≥0.7) in China.
(1) The Southeast developed city-cluster. As Figure 6 shows, there are 27 cities in this cluster, mostof which are located in the provinces in the southeast coastal area of China, such as Shanghai,Jiangsu, Zhejiang, Fujian, and Guangdong. Meanwhile, several economically developed inlandcities are also included in this group, such as Beijing and Chengdu. Virtually all of them areprominent and populous cities with highly developed economies, not only in relation to theirown provinces but also to the whole country of China. All of the cities are playing a leading rolein shaping China’s current and future economic landscape and city space.
ISPRS Int. J. Geo-Inf. 2018, 7, 9 9 of 18
Figure 5. Four city-clusters based on the highest proximity values (≥0.7) in China.
(1) The Southeast developed city-cluster. As Figure 6 shows, there are 27 cities in this cluster, most of which are located in the provinces in the southeast coastal area of China, such as Shanghai, Jiangsu, Zhejiang, Fujian, and Guangdong. Meanwhile, several economically developed inland cities are also included in this group, such as Beijing and Chengdu. Virtually all of them are prominent and populous cities with highly developed economies, not only in relation to their own provinces but also to the whole country of China. All of the cities are playing a leading role in shaping China’s current and future economic landscape and city space.
Figure 6. Southeast developed city-cluster.
(2) The North China city-cluster. A total of 37 cities are included in this group. In addition to higher market proximities among them, cities in this cluster demonstrate more geographical closeness and an apparent spatial agglomeration in the North China Plain and surroundings, such as Hebei, Henan, Shanxi, and Shandong (Figure 7). Some common features of these cities are that their economy and population levels are much smaller than those in the Southeast coast city-cluster, and most of them are in the second-tier and third-tier cities of their respective provinces.
Figure 6. Southeast developed city-cluster.
(2) The North China city-cluster. A total of 37 cities are included in this group. In addition to highermarket proximities among them, cities in this cluster demonstrate more geographical closenessand an apparent spatial agglomeration in the North China Plain and surroundings, such as Hebei,

ISPRS Int. J. Geo-Inf. 2018, 7, 9 10 of 18
Henan, Shanxi, and Shandong (Figure 7). Some common features of these cities are that theireconomy and population levels are much smaller than those in the Southeast coast city-cluster,and most of them are in the second-tier and third-tier cities of their respective provinces.ISPRS Int. J. Geo-Inf. 2018, 7, 9 10 of 18
Figure 7. North China city-cluster.
(3) The Northeast city-cluster. Only 11 cities are included in this group, making its number the smallest among all the four clusters (Figure 8). These cities are mostly located in the middle and western parts of Northeast China, with relatively weak economies compared to cities in Southeast city-cluster and North China city-clusters. In fact, most of the more developed cities in Northeast China are excluded from the cluster.
Figure 8. Northeast China city-cluster.
(4) The West China city-cluster. This cluster has the largest number of cities (47) and covers a broader geographical territory (Figure 9). It includes many major cities in west and southwest China and they are generally considered underdeveloped with the lowest development levels. The proximity values among these cities are commonly higher, especially in the provinces of Ningxia, Gansu, Qinghai, and Xinjiang. These cities share quite similar automobile market structures. Overall, cities in this group have a smaller urban economy and population.
Figure 7. North China city-cluster.
(3) The Northeast city-cluster. Only 11 cities are included in this group, making its number thesmallest among all the four clusters (Figure 8). These cities are mostly located in the middle andwestern parts of Northeast China, with relatively weak economies compared to cities in Southeastcity-cluster and North China city-clusters. In fact, most of the more developed cities in NortheastChina are excluded from the cluster.
ISPRS Int. J. Geo-Inf. 2018, 7, 9 10 of 18
Figure 7. North China city-cluster.
(3) The Northeast city-cluster. Only 11 cities are included in this group, making its number the smallest among all the four clusters (Figure 8). These cities are mostly located in the middle and western parts of Northeast China, with relatively weak economies compared to cities in Southeast city-cluster and North China city-clusters. In fact, most of the more developed cities in Northeast China are excluded from the cluster.
Figure 8. Northeast China city-cluster.
(4) The West China city-cluster. This cluster has the largest number of cities (47) and covers a broader geographical territory (Figure 9). It includes many major cities in west and southwest China and they are generally considered underdeveloped with the lowest development levels. The proximity values among these cities are commonly higher, especially in the provinces of Ningxia, Gansu, Qinghai, and Xinjiang. These cities share quite similar automobile market structures. Overall, cities in this group have a smaller urban economy and population.
Figure 8. Northeast China city-cluster.
(4) The West China city-cluster. This cluster has the largest number of cities (47) and covers a broadergeographical territory (Figure 9). It includes many major cities in west and southwest China andthey are generally considered underdeveloped with the lowest development levels. The proximity

ISPRS Int. J. Geo-Inf. 2018, 7, 9 11 of 18
values among these cities are commonly higher, especially in the provinces of Ningxia, Gansu,Qinghai, and Xinjiang. These cities share quite similar automobile market structures. Overall,cities in this group have a smaller urban economy and population.ISPRS Int. J. Geo-Inf. 2018, 7, 9 11 of 18
Figure 9. West China city-cluster.
4.4. Heterogeneity among City-Clusters
The means and coefficients of variation (CV) of major variables for all prefecture-level cities and for each of the four clusters are shown in Table 1, including the total car sales, population, GDP, per capita GDP, employed population, per capita disposable income of urban residents, as well as the proportion of foreign automakers, Sino-foreign joint ventures, and domestic automakers. The coefficient of variation (CV) was used to measure the degree of dispersion of each variable, independent of the variable’s measurement unit. Coefficients of variation of nearly all the variables are noticeably lower in each cluster than those for all the cities. The variables exhibit less variation within the cluster, indicating more homogeneity among cities in a cluster. Cities in the same cluster are likely to have similar consumer preference and purchasing capabilities, resulting in similar market structures measured by the index of proximity. The mean of each variable, except the proportion of car sales of domestic automakers, is the highest for the Southeast city-cluster. Both the average proportions of car sales of foreign automakers and Sino-foreign joint ventures are highest in the southeast cluster.
A high level of heterogeneity exists across four city-clusters in market structures. Table 1 also shows the statistics of the top 10 automakers that dominate city markets in each of the four clusters. The dominance of a manufacturer is measured by the percentage of cities that it gains revealed comparative advantage (RCA) out of all the cities in each city-cluster. Names of foreign automakers and domestic automakers are indicated by an asterisk (*) and a pound sign (#), respectively; the others are Sino-foreign joint ventures. In the Southeast developed city-cluster, the top 10 dominant manufacturers are all foreign-owned, with the exception of BMW Brilliance and Beijing-Benz which are high-end Sino-foreign joint ventures. In the other three city-clusters, as the socioeconomic status decreases, the top 10 dominant manufacturers change dramatically. The Sino-foreign joint ventures and Chinese manufacturers become the dominant brands. Chinese automakers, such as Geely, Chery, Great Wall, BYD, and Changan, become dominant, especially in the cities in the Northeast and West China city-clusters. For instance, the Geely automobile company is dominant in all the cities in the West China city-cluster and its biggest manufacturing base is located in Lanzhou in the middle of the cluster.
Figure 9. West China city-cluster.
4.4. Heterogeneity among City-Clusters
The means and coefficients of variation (CV) of major variables for all prefecture-level citiesand for each of the four clusters are shown in Table 1, including the total car sales, population,GDP, per capita GDP, employed population, per capita disposable income of urban residents, aswell as the proportion of foreign automakers, Sino-foreign joint ventures, and domestic automakers.The coefficient of variation (CV) was used to measure the degree of dispersion of each variable,independent of the variable’s measurement unit. Coefficients of variation of nearly all the variables arenoticeably lower in each cluster than those for all the cities. The variables exhibit less variation withinthe cluster, indicating more homogeneity among cities in a cluster. Cities in the same cluster are likelyto have similar consumer preference and purchasing capabilities, resulting in similar market structuresmeasured by the index of proximity. The mean of each variable, except the proportion of car sales ofdomestic automakers, is the highest for the Southeast city-cluster. Both the average proportions of carsales of foreign automakers and Sino-foreign joint ventures are highest in the southeast cluster.
A high level of heterogeneity exists across four city-clusters in market structures. Table 1 alsoshows the statistics of the top 10 automakers that dominate city markets in each of the four clusters.The dominance of a manufacturer is measured by the percentage of cities that it gains revealedcomparative advantage (RCA) out of all the cities in each city-cluster. Names of foreign automakersand domestic automakers are indicated by an asterisk (*) and a pound sign (#), respectively; theothers are Sino-foreign joint ventures. In the Southeast developed city-cluster, the top 10 dominantmanufacturers are all foreign-owned, with the exception of BMW Brilliance and Beijing-Benz whichare high-end Sino-foreign joint ventures. In the other three city-clusters, as the socioeconomic statusdecreases, the top 10 dominant manufacturers change dramatically. The Sino-foreign joint venturesand Chinese manufacturers become the dominant brands. Chinese automakers, such as Geely, Chery,Great Wall, BYD, and Changan, become dominant, especially in the cities in the Northeast and WestChina city-clusters. For instance, the Geely automobile company is dominant in all the cities in theWest China city-cluster and its biggest manufacturing base is located in Lanzhou in the middle ofthe cluster.

ISPRS Int. J. Geo-Inf. 2018, 7, 9 12 of 18
Table 1. Mean and Coefficients of Variation (CV) of Variables.
Variables All the Prefecture Cities Southeast City-Cluster North China City-Cluster Northeast City-Cluster West China City-Cluster
Mean CV Mean CV Mean CV Mean CV Mean CV
Total car sales 38,798 147.95% 145,039 77.58% 47,424 62.39% 19,019 36.50% 11,465 75.54%
GDP (billion yuan) 157.5 140.35% 571.24 80.51% 153.51 46.09% 84.69 41.21% 46.77 103.94%
Per capita GDP (yuan) 36,902 68.59% 73,189 31.90% 29,019 30.66% 31,017 34.84% 25,835 82.16%
Population(million) 3.96 81.91% 7.746 65.67% 5.483 42.06% 2.830 38.31% 2.062 67.90%
Employed population (million) 2.32 81.84% 4.68 56.31% 3.32 46.08% 1.46 39.69% 1.14 77.71%
Per capita disposable income of urbanresidents (yuan) 19,011 27.22% 30,310 16.10% 18,826 12.53% 16,799 13.75% 15,650 18.86%
Proportion of car sales of foreignautomakers (%) 5.76 50.89% 11.79 16.68% 2.79 29.29% 4.17 20.42% 4.16 36.23%
Proportion of car sales of Sino-foreignjoint ventures (%) 64.40 14.22% 72.82 3.69% 63.62 6.84% 60.16 8.32% 54.15 17.06%
Proportion of car sales of domesticautomakers (%) 29.84 33.40% 15.39 16.35% 33.59 13.93% 35.67 15.60% 41.69 22.90%
Top 10 Manufacturers with Dominancein each cluster
1. BMW *;2. Mercedes-Benz *;3. BMW Brilliance;
4. Beijing-Benz;5. Volkswagen *;
6. Audi *;7. Lexus *;8. Mini *;
9. Infiniti *;10. Porsche *
1. Changan #;2. Changhe-Suzuki;
3. Chery #;4. SGMW;5. Geely #;
6. Beijing-Hyundai;7. Great Wall #;8. FAW-Haima;
9. BYD #;10. DYK
1. FAW-Volkswagen;2. Chery #;
3. Tianjin-FAW;4. Brilliance #;
5. Great Wall #;6. BYD #;
7. Changan-Suzuki;8. Toyota;
9. Beijing-Hyundai;10. Geely #
1. Geely #;2. Hawtai #;
3. Great Wall #;4. GAC-Changfeng #;
5. Lifan #;6. Beijing-Hyundai;
7. Chery #;8. Toyota;
9. Hyundai;10. Mitsubishi

ISPRS Int. J. Geo-Inf. 2018, 7, 9 13 of 18
A linear discriminant analysis was performed to account for the heterogeneity among four clusters,with three statistically significant discriminant functions (variates) being calibrated. Table 2 presentsthe standardized discriminant function coefficients and Table 3 shows the centroid values (i.e., meanfunction scores) of each city-cluster on all three functions. Overall, the discriminant functions correctlyclassified 91.8% of the cities into one of the four city-clusters.
Table 2. Standardized Canonical Discriminant Function Coefficients.
Variables Function 1 Function 2 Function 3
Per capita disposable income of urban residents −0.374 −0.030 0.054Employed population 0.060 −0.444 −0.048
Per capita GDP 0.217 −0.086 −0.069Proportion of car sales of foreign automakers −0.834 0.049 −0.088
West 0.493 0.798 −0.289Northeast 0.164 0.426 0.871
Middle 0.338 −0.073 −0.184
Table 3. Functions at Group Centroids.
Group Function 1 Function 2 Function 3
Southeast −5.248 0.226 −0.201North China 1.200 −2.317 −0.117
Northeast 0.933 0.963 4.143West China 1.836 1.469 −0.762
Two variables are strongly loaded onto Function 1, including per capita disposable income ofurban residents and the proportion of car sales from foreign automakers. This function thus reflects theunderlying dimension of “personal income” and corresponding purchasing preferences in automobiledemand. Function 1 primarily distinguishes the Southeast developed city-cluster, with its high levelsof personal income and sales of foreign-owned cars, from the other three clusters, particularly theWest China city-cluster. This indicates that the similarity among cities within this group are mainlydue to their common preference for these high-end cars and higher purchasing capability, despitethe higher prices of these vehicles. In China, cars produced by foreign automakers and Sino-foreignjoint automakers usually possess better performance and higher quality, hence higher prices, whilethe cars of domestic manufactures usually have the advantage of lower prices. Therefore, as urbanresidents’ economic status changes in different clusters, the proportion of car sales of different typesof automakers changes accordingly. The lower economic status a cluster has (represented by lowerper capita disposable income and purchasing capability), the lower proportion of car sales of foreignautomakers and higher proportion of car sales of domestic automakers in the cluster, particularlyin relatively underdeveloped regions such as western China. The distribution of higher-end andlower-end automobile markets in China is apparently related to the regional disparity in urbanresidents’ income level and purchasing capability.
The most important variable for Function 2 is the level of employment, along with per capitaGDP and geographical location variables. The North China city-cluster is distinguished mostly fromthe Northeast city-cluster and the West China city-cluster by this function. The strong negative meanscore of Function 2 for cities in the North China city-cluster is directly associated with the overall highemployment and fine GDP levels. Many cities in this cluster are important industrial centers involvingheavy industries, mining and energy industries, with significant amount of employment includingthose employed by state-owned enterprises. In addition, Changan automobile company, a domesticautomaker with dominance in cities across North China, has a large manufacturing base in Baoding(Hebei province) located in the middle of this cluster. Function 2 is thus considered representing theunderlying dimension of “industrial development”. The robust performance of these cities in this

ISPRS Int. J. Geo-Inf. 2018, 7, 9 14 of 18
cluster in automobile sales, especially domestic automakers, echoes the general trend and relationshipbetween demand for automobiles and overall economic development.
Function 3 is largely dominated by the dummy variable corresponding to northeastern China.It mainly discriminates the Northeast city-cluster from the rest of the clusters. The personal income leveland other economic indicators are basically average for cities in this cluster. However, geographicaland historical background makes this cluster quite distinguishable. The Northeast was one of theearliest regions to industrialize in China, and continued to be a major industrial base after the foundingof the People’s Republic of China in 1949. Recent years, however, have seen the stagnation of NortheastChina’s heavy-industry-based economy, as China’s economy continues to liberalize and privatize.The central government has initialized the Revitalizing the Northeast campaign to counter this problem.From the perspective of the automobile market, the FAW-Volkswagen Company has dominance in thecluster and produces cars in Changchun and Shenyang, which are very close to the cluster’s cities.
Other factors which are not directly revealed by statistical analyses but deemed to have an impacton regional clusters’ market structures could be associated with the fact that their products can meetspecial regional demands. For example, more consumers in Western China prefer buying SUVsbecause of the rugged topography and the relative lack of public transportation. The manufacturers,such as Ceely, Hawtai, Great Wall, and GAC-Changfeng with SUVs as their major products can sellmore automobiles in western China. It is notable that foreign-owned manufacturers, such as Toyota,Hyundai and Mitsubishi also obtain noticeable dominance in the West China city-cluster, probablybecause their SUVs are in high demand in western China. Because the prices of these importedautomobiles are usually higher, the fully foreign-owned manufacturers obtain dominance in smallernumbers of cities than their Chinese counterparts. However, in the North China city-cluster, consumersprefer energy-saving and inexpensive domestic automobiles because of flatter land and high-qualityroads spread in the region.
Different levels of government in China have also played an important role in shaping theautomobile market in different cities, by giving specific preferences towards certain manufacturers.Although the data regarding tax structures and automobile fees (registration) are not available inany Chinese statistical books or other sources, the influence on the automobile market from thegovernment is significant and should be considered. For example, in order to promote the developmentof the automobile industry, local governments may not only provide preferential tax and registrationconvenience for the automakers, but may also regulate the brands and the models of cars in the processof government procurement. Besides, the providers for taxis in a city are also usually confined to somespecific automakers by the rules of administrative agencies. In Jilin province, for instance, the vastmajority of taxi vehicles in all nine prefecture-level cities are the Jetta model from FAW-Volkswagen,whose headquarters are located in Changchun, the capital city of Jilin province. Because the localgovernment vehicles and taxis make up a considerable percentage of the market of a city, governmentpreferences to some specific automakers also impact the market structure. If city governments in aregion in the same province have the same automobile purchasing preference, they would very likelyhelp foster similar city market structures.
5. Discussion
In sum, the emergence of city-clusters based on the proximity of market structures are closelyrelated to China’s diverse regional backgrounds and characteristics. Cities in the same region tend tohave similar automobile market structures, impacted by shared regional factors, such as demography,economy, politics, society, culture, and government regulations. Out of these factors, two leadingthemes can be highlighted as follows.
First, from the perspective of demand, economic factors play the central role in determining thedemand of automobiles. The large automobile market derives from higher economic status and a bettereconomy, suggesting that imported or higher-end Sino-foreign joint venture automobiles will be morepopular in economically more developed regions. The opposite is also true. In addition, purchasing

ISPRS Int. J. Geo-Inf. 2018, 7, 9 15 of 18
preference is influenced by regional geographical features and cultural background. For example,cities in western China prefer SUVs and some governments favor certain specific automobile brands.Furthermore, consumers prefer automobiles produced locally or close by, because they can usuallyacquire better after-sales service, such as faster and cheaper automobile maintenance, vehicle repair,and part replacement. Workers of the local manufacturers usually can get substantial discounts fromtheir own companies, which encourages the workers to buy more automobiles of certain brands.This could impact the makeup of the regional automobile market.
Second, the location of an automaker affects its selling capability. Due to the geographical limits,the automakers tend to first penetrate the easier markets around them, due to their location advantagesincluding brand awareness and cost saving. One of the reasons why the exclusively foreign-ownedmanufacturers obtain a greater market share in cities in the southeast coast area may also derivefrom the fact that there are more ports in this area to import automobiles and more convenient andeffective logistics and distribution systems to guarantee that imported automobiles can be more readilysupplied to the target markets.
However, there are a considerable number of cities located in Central China, including Hubei,Hunan and Jiangxi provinces which do not form city-clusters. This is probably due to this areabeing located in the middle of several important national automobile manufacturing bases, withoverlapping manufacturers’ markets. There are currently six huge automobile manufacturing bases inChina, including the Northeast area, the Yangtze Delta area, Shiyan-Wuhan in Hubei, Chongqing, theZhujiang Delta area and the Beijing–Tianjin area. The competition among automakers in the cities inCentral China is much more intense, leading to diverse market structures among cities, despite theirgeographical closeness.
The core method used in this study is an innovative application of the concept of ‘product space’in geographical research. It is mainly reflected by the way we define and construct the proximity matrixamong cities based on the RCA of automobile manufactures at the city level. In fact, a similarity matrixis often the first and crucial step to conduct a cluster analysis, as most existing literature attests. As anapplied geographic study, we chose to pursue and identify city clusters through both visualizing linksof proximities among cities and setting practical criteria or thresholds. We believe that comparing withclassic cluster analysis, the approach used in this study presents some advantages. First, this approachfocuses on the strongest proximities among cities and thus identifying the typical, representative andbackbone geographical clustering pattern, while classic cluster analysis usually attempts to classify andgroup all the cities simultaneously and may make the spatial pattern of the city clusters hard to discern.Secondly, the underpinning and the result of city clustering from this study can be visualized directlyin a map with proximities (links) between cities in each cluster distinctly outlined. This makes it easierto observe and examine the structure and general pattern of market relatedness among different cities.Besides, the definition of proximity as well as the practical threshold values for city clustering canbe adjusted according to the specific product and the market in question, thus making this approachpractically flexible in application. Although the proximity between cities and the spatial pattern of cityclusters do not reflect the real connection among cities, it provides some inspiration to policy makersin the automobile industry and government. If an automaker has already obtained a stable marketshare in one city and aims to enter another city market, the proximity index between the two citiesmay provide an ideal tool to select the target city. On the other hand, if the government in a city hopesto exert some influence on the automobile markets, such as supporting the development of green cars,the successful policies of other cities in the same city cluster identified by the proximity indices mightprovide helpful foundations.
6. Conclusions
With China emerging as the largest automobile market in the world, comprehensive researchof the Chinese automobile market structure is very important. This study, for the first time on thistopic, visualizes and delineates the spatial pattern and characteristics of the automobile markets at

ISPRS Int. J. Geo-Inf. 2018, 7, 9 16 of 18
the level of prefecture cities in mainland China using an innovative method. The complicated marketstructure of each city is simplified based on the notion of RCA. Proximities among cities in Chinaare computed based on the RCA of each city to explore the similarities of city markets, resultingin some city-clusters being identified. The common characteristics of cities in each cluster and thedifferences among clusters are examined, and underlining factors are analyzed, based on a typicalgeographical research framework. Our study is also a creative and significant attempt to introducethe novel idea and method from other disciplines to the geographical study. Unlike other methods ofprevious research, the approach used in this study provides a simple, innovative way to visualize thesimilarity or relatedness of cities’ automobile markets. By observing the links of proximity in the map,the strongest links and clusters can be found and understood directly.
Overall, the following conclusions can be drawn. Most cities are different based on the proximitiesof their automobile markets, with no more than 1% of the total proximities between cities equal to orlarger than 0.7.
Based on the top 10 proximities of each city and the distances among the cities, we conclude thathigher proximity tends to appear at cities with shorter distance. In other words, if cities are similar toone another, it is more likely they are close in distance.
Four city-clusters across the country are identified, based on the rules that each city in a clustermust be connected with no less than two cities in the same cluster and with proximities equal ormore than 0.7. They include the Southeast developed city-cluster, the North China city-cluster, theNortheast city-cluster and the West China city-cluster respectively. Cities in the same cluster displaysome common characteristics, such as socioeconomic status, location features, dominant automobilemanufacturer brands, and potential development perspective, while these characteristics are obviouslydissimilar among different city-clusters. The reason why cities in the same group display similar marketstructure is probably due to the fact they are impacted by similar factors, among which economicfactors are the decisive ones. Developed cities, including cities in southeast coastal areas and someinland cities, have similar higher purchasing power and preferences for higher-end automobiles; thus,the manufacturers of higher quality, more comfortable, more expensive automobiles are more popularin these cities, including the exclusively foreign-owned enterprises or the higher-end Sino-foreignjoint automakers. Moreover, the general regional market tendency is also related to other issues, suchas regional physical characteristics, culture, and brand awareness of automakers. In addition, thelocations of the manufacturers and government policy preference also impact the market structures.
To a large extent, the core finding of this research is that nearby cities tend to be more similar intheir purchasing habits, coinciding with an old geographical rule, known as Tobler’s Law [34], whichstates that ’everything is related to everything else, but near things are more related to one another’.Besides, this study proposes a new approach to explore the most closely related neighbors based onthe relatedness of automobile markets rather than all neighbors. The method to identify the clusters inthis study is innovative, differing from other clustering approaches. Undeniably, the identification ofthe clusters and the discussion of the underlying mechanisms of formation of clusters need furtherstatistical support. Conducting other clustering approaches and comparing different results basedon proximity and similar matrices would be beneficial for this study. Moreover, a sensitivity analysiswith different cut-off values for RCA could shed light on how robust our results would be. Further, atemporal analysis over a five- to ten-year window would be necessary to see if the patterns identifiedin this research are stable over time, and it could be a focus for further research.
Acknowledgments: This study was supported by the National Natural Science Foundation of China (Grant No.41771161) and Strategic Planning Project from Institute of Northeast Geography and Agroecology (IGA), ChineseAcademy of Sciences (Grant No. Y6H2091001-3)
Author Contributions: Wei Song and Daqian Liu conceived and designed the study; Daqian Liu and Xin Wenperformed data analysis; Daqian Liu, Wei Song and Jia Lu analyzed the results and wrote the paper; Chunyan Xieprovided key suggestions for the analysis and interpretation of the results. All authors have read and approvedthe final manuscript.
ISPRS Int. J. Geo-Inf. 2018, 7, 9 17 of 18
Conflicts of Interest: The authors declare no conflicts of interest.
References
1. Hidalgo, C.A.; Klinger, B.; Barabási, A.-L.; Hausmann, R. The product space conditions the development ofnations. Science 2007, 317, 482–487. [CrossRef] [PubMed]
2. Thanasuta, K.; Patoomsuwan, T.; Chaimahawong, V.; Chiaravutthi, Y. Brand and country of origin valuationsof automobiles. Asia Pac. J. Mark. Logist. 2009, 21, 355–375. [CrossRef]
3. Wang, X.; Yang, Z. Does country-of-origin matter in the relationship between brand personality and purchaseintention in emerging economies? Evidence from China’s auto industry. Int. Mark. Rev. 2008, 25, 458–474.[CrossRef]
4. Wang, X.; Yang, Z.; Liu, N.R. The impacts of brand personality and congruity on purchase intention: Evidencefrom the Chinese mainland’s automobile market. J. Glob. Mark. 2009, 22, 199–215. [CrossRef]
5. Deng, H.; Ma, A.C. Market structure and pricing strategy of China’s automobile industry. J. Ind. Econ. 2010,58, 818–845. [CrossRef]
6. Haque, A.; Anwar, N.; Yasmin, F.; Sarwar, A.; Ibrahim, Z.; Momen, A. Purchase intention of foreign products.SAGE Open 2015, 5. [CrossRef]
7. Rits, V.; Kypreos, S.; Wokaun, A. Evaluating the diffusion of fuel-cell cars in the China markets. IATSS Res.2004, 28, 34–46. [CrossRef]
8. Qian, L.; Soopramanien, D. Using diffusion models to forecast market size in emerging markets withapplications to the Chinese car market. J. Bus. Res. 2014, 67, 1226–1232. [CrossRef]
9. Qian, L.; Soopramanien, D. Incorporating heterogeneity to forecast the demand of new products in emergingmarkets: Green cars in China. Technol. Forecast. Soc. 2015, 91, 33–46. [CrossRef]
10. Huo, H.; Wang, M. Modeling future vehicle sales and stock in China. Energy Policy 2012, 43, 17–29. [CrossRef]11. Wan, Z.; Sperling, D.; Wang, Y. China’s electric car frustrations. Transp. Res. Part D 2015, 34, 116–121.
[CrossRef]12. Liu, D.; Lo, K.; Song, W.; Xie, C. Spatial patterns of car sales and their socio-economic attributes in China.
Chin. Geogr. Sci. 2017, 27, 684–696. [CrossRef]13. Cao, J.; Cao, X. The impacts of LRT, neighbourhood characteristics, and self-selection on auto ownership:
Evidence from Minneapolis-St. Paul. Urban Stud. 2013, 51, 2068–2087. [CrossRef]14. Clark, B.; Chatterjee, K.; Melia, S. Changes in level of household car ownership: The role of life events and
spatial context. Transportation 2016, 43, 565–599. [CrossRef]15. Oakil, A.T.M.; Manting, D.; Nijland, H. Determinants of car ownership among young households in the
Netherlands: The role of urbanisation and demographic and economic characteristics. J. Transp. Geogr. 2016,51, 229–235. [CrossRef]
16. Weinberger, R.; Goetzke, F. Unpacking preference: How previous experience affects auto ownership in theUnited States. Urban Stud. 2010, 47, 2111–2128. [CrossRef]
17. Hidalgo, C.A.; Hausmann, R. A network view of economic development. Dev. Altern. 2008, 12, 5–10.18. Felipe, J.; Kumar, U.; Abdon, A. How rich countries became rich and why poor countries remain poor: It’s
the economic structure . . . duh! Jpn. World Econ. 2014, 29, 46–58. [CrossRef]19. Cruz, J.D.L.; Riker, D. Product Space Analysis of the Exports of Brazil; Working Paper No. 2012-06A; U.S.
International Trade Commission Office of Economics: Washington, DC, USA, 2012. Available online:https://www.usitc.gov/publications/332/EC201206A.pdf (accessed on 27 February 2017).
20. Kali, R.; Reyes, J.; McGee, J.; Shirrell, S. Growth networks. J. Dev. Econ. 2013, 101, 216–227. [CrossRef]21. Boschma, R.; Heimeriks, G.; Balland, P.-A. Scientific knowledge dynamics and relatedness in biotech cities.
Res. Policy 2014, 43, 107–114. [CrossRef]22. Neffke, F.; Henning, M.; Boschma, R. How do regions diversify over time? Industry relatedness and the
development of new growth paths in regions. Econ. Geogr. 2011, 87, 237–265. [CrossRef]23. Bahar, D.; Hausmann, R.; Hidalgo, C.A. Neighbors and the evolution of the comparative advantage of
nations: Evidence of international knowledge diffusion? J. Int. Econ. 2014, 92, 111–123. [CrossRef]24. Piana, V. Proximity in Product Space and Diversification Strategies. Economic Web Institute. 2007.
Available online: http://www.economicswebinstitute.org/essays/proximityproduct.htm (accessed on27 February 2017).

ISPRS Int. J. Geo-Inf. 2018, 7, 9 18 of 18
25. Klinger, T.; Kenworthy, J.R.; Lanzendorf, M. Dimensions of urban mobility cultures—A comparison ofGerman cities. J. Transp. Geogr. 2013, 31, 18–29. [CrossRef]
26. Charreire, H.; Weber, C.; Chaix, B.; Salze, P.; Casey, R.; Banos, A.; Badariotti, D.; Kesse-Guyot, E.; Hercberg, S.;Simon, C.; et al. Identifying built environmental patterns using cluster analysis and GIS: Relationships withwalking, cycling and body mass index in French adults. Int. J. Behav. Nutr. Phys. 2012, 9, 59. [CrossRef][PubMed]
27. Longley, P.A.; Cheshire, J.A.; Mateos, P. Creating a regional geography of Britain through the spatial analysisof surnames. Geoforum 2011, 42, 506–516. [CrossRef]
28. Guedes, A.S.; Jiménez, M.I.M. Spatial patterns of cultural tourism in Portugal. Tour. Manag. Perspect. 2015,16, 107–115. [CrossRef]
29. Wei, C.; Cabrera Barona, P.; Blaschke, T. A new look at public services inequality: The consistency ofneighborhood context and citizens’ perception across multiple scales. ISPRS Int. J. Geo-Inf. 2017, 6, 200.[CrossRef]
30. Zhou, D.; Xu, J.; Radke, J.; Mu, L. A spatial cluster method supported by GIS for urban-suburban-ruralclassification. Chin. Geogr. Sci. 2004, 14, 337–342. [CrossRef]
31. Ribeiro, S.C.; Migliozzi, A.; Incerti, G.; Correia, T.P. Placing land cover pattern preferences on themap: Bridging methodological approaches of landscape preference surveys and spatial pattern analysis.Landsc. Urban Plan. 2013, 114, 53–68. [CrossRef]
32. Von der Dunk, A.; Grêt-Regamey, A.; Dalang, T.; Hersperger, A.M. Defining a typology of peri-urbanland-use conflicts—A case study from Switzerland. Landsc. Urban Plan. 2011, 101, 149–156. [CrossRef]
33. Chen, N.; Akar, G. Effects of neighborhood types & socio-demographics on activity space. J. Transp. Geogr.2016, 54, 112–121. [CrossRef]
34. Tobler, W.R. A computer movie simulating urban growth in the Detroit region. Econ. Geogr. 1970, 46, 234–240.[CrossRef]
© 2018 by the authors. Licensee MDPI, Basel, Switzerland. This article is an open accessarticle distributed under the terms and conditions of the Creative Commons Attribution(CC BY) license (http://creativecommons.org/licenses/by/4.0/).