A new constraint on the dynamic topographic field from Australia
12
The tilting continent: A new constraint on the dynamic topographic field from Australia Mike Sandiford School of Earth Sciences University of Melbourne, Victoria, 3010, Australia Received 15 February 2007; received in revised form 22 May 2007; accepted 20 June 2007 Editor: C.P. Jaupart Available online 29 June 2007 Abstract A pronounced latitudinal asymmetry in the present-day morphology of the Australian continental shelf is reflected in Neogene stratigraphic relationships. The northern Australian margin has a broad shelf, typically 200–500 km wide and a Neogene record of stratal onlap. Relative to the continent, sea levels are currently as high as at any stage during the Neogene. In contrast, the southern shelf is typically less than 100 km wide and shows a record of progressive offlap with Neogene palaeo-shorelines commonly many hundreds of kilometres inland, at elevations up to ∼ 250 m above present-day sea level. This continental-scale ‘reciprocal’ stratigraphy implies 250–300 m N-down, SSW-up apparent vertical motion with respect to sea level since the mid-Miocene. The apparent vertical motion can be attributed to variations in dynamic topography and the geoid along Australia's NNE plate circuit; specifically, the movement of the southern margin off the dynamic topography low, geoid low presently centred on the Australian– Antarctic discordance, and the northern margin towards a dynamic topography low, geoid high associated with the subduction realm to the north. Variations in the geoid appear to account for about 10% of the total apparent motion, depending on assumptions about how the geoid field has evolved during Australia's northward motion. This inferred Neogene, continental-scale dynamic N–S tilting rate of ∼15–20 m/myr provides a compelling new constraint on the nature of the Earth's dynamic topographic field. © 2007 Elsevier B.V. All rights reserved. Keywords: dynamic topography; geoid; intraplate tectonics; Australia; epeirogeny 1. Introduction The pattern of dynamic topography and its relation to the geoid field provides a powerful constraint on mantle viscosity structure (Hager, 1984; Richards and Hager, 1984) and so there has been considerable interest in elucidating the Earth's dynamic topographic field (Gur- nis, 1993; Russell and Gurnis, 1994; Lithgow-Bertelloni and Gurnis, 1997; Lithgow-Bertelloni and Richards, 1998; Wheeler and White, 2000; Gurnis, 2001; Cadek and Fleitout, 2003). This has proved difficult since most of the power in the topographic field arises from isostatic compensation of shallow density anomalies within the lithosphere. In the ocean lithosphere the residual topographic field, obtained by subtracting the age dependent isostatic component of the topographic field induced by the cooling of the ocean lithosphere, should provide a powerful constraint on the dynamic topography field. Maps of residual topography suggest a dynamic topography field with amplitude of ∼1–2 km, although even this is debated with some authors favouring a much more subdued dynamic signal (Cazenave and Lago, 1991) (see discussion in Panasyuk et al., 2000). The difficulty is highlighted by the anomalously low segment of the mid- Earth and Planetary Science Letters 261 (2007) 152 – 163 www.elsevier.com/locate/epsl E-mail address: [email protected]. 0012-821X/$ - see front matter © 2007 Elsevier B.V. All rights reserved. doi:10.1016/j.epsl.2007.06.023
-
Upload
khangminh22 -
Category
Documents
-
view
3 -
download
0
Transcript of A new constraint on the dynamic topographic field from Australia
tters 261 (2007) 152–163www.elsevier.com/locate/epsl
Earth and Planetary Science Le
The tilting continent: A new constraint on the dynamictopographic field from Australia
Mike Sandiford
School of Earth Sciences University of Melbourne, Victoria, 3010, Australia
Received 15 February 2007; received in revised form 22 May 2007; accepted 20 June 2007
Available on
Editor: C.P. Jaupartline 29 June 2007
Abstract
A pronounced latitudinal asymmetry in the present-day morphology of the Australian continental shelf is reflected in Neogenestratigraphic relationships. The northern Australian margin has a broad shelf, typically 200–500 km wide and a Neogene record ofstratal onlap. Relative to the continent, sea levels are currently as high as at any stage during the Neogene. In contrast, the southernshelf is typically less than 100 km wide and shows a record of progressive offlap with Neogene palaeo-shorelines commonly manyhundreds of kilometres inland, at elevations up to ∼250 m above present-day sea level. This continental-scale ‘reciprocal’stratigraphy implies 250–300 m N-down, SSW-up apparent vertical motion with respect to sea level since the mid-Miocene. Theapparent vertical motion can be attributed to variations in dynamic topography and the geoid along Australia's NNE plate circuit;specifically, the movement of the southern margin off the dynamic topography low, geoid low presently centred on the Australian–Antarctic discordance, and the northern margin towards a dynamic topography low, geoid high associated with the subductionrealm to the north. Variations in the geoid appear to account for about 10% of the total apparent motion, depending on assumptionsabout how the geoid field has evolved during Australia's northward motion. This inferred Neogene, continental-scale dynamic N–Stilting rate of ∼15–20 m/myr provides a compelling new constraint on the nature of the Earth's dynamic topographic field.© 2007 Elsevier B.V. All rights reserved.
Keywords: dynamic topography; geoid; intraplate tectonics; Australia; epeirogeny
1. Introduction
The pattern of dynamic topography and its relation tothe geoid field provides a powerful constraint on mantleviscosity structure (Hager, 1984; Richards and Hager,1984) and so there has been considerable interest inelucidating the Earth's dynamic topographic field (Gur-nis, 1993; Russell and Gurnis, 1994; Lithgow-Bertelloniand Gurnis, 1997; Lithgow-Bertelloni and Richards,1998; Wheeler and White, 2000; Gurnis, 2001; Cadekand Fleitout, 2003). This has proved difficult since most
E-mail address: [email protected].
0012-821X/$ - see front matter © 2007 Elsevier B.V. All rights reserved.doi:10.1016/j.epsl.2007.06.023
of the power in the topographic field arises from isostaticcompensation of shallow density anomalies within thelithosphere. In the ocean lithosphere the residualtopographic field, obtained by subtracting the agedependent isostatic component of the topographic fieldinduced by the cooling of the ocean lithosphere, shouldprovide a powerful constraint on the dynamic topographyfield. Maps of residual topography suggest a dynamictopography field with amplitude of ∼1–2 km, althougheven this is debated with some authors favouring a muchmore subdued dynamic signal (Cazenave and Lago, 1991)(see discussion in Panasyuk et al., 2000). The difficulty ishighlighted by the anomalously low segment of the mid-
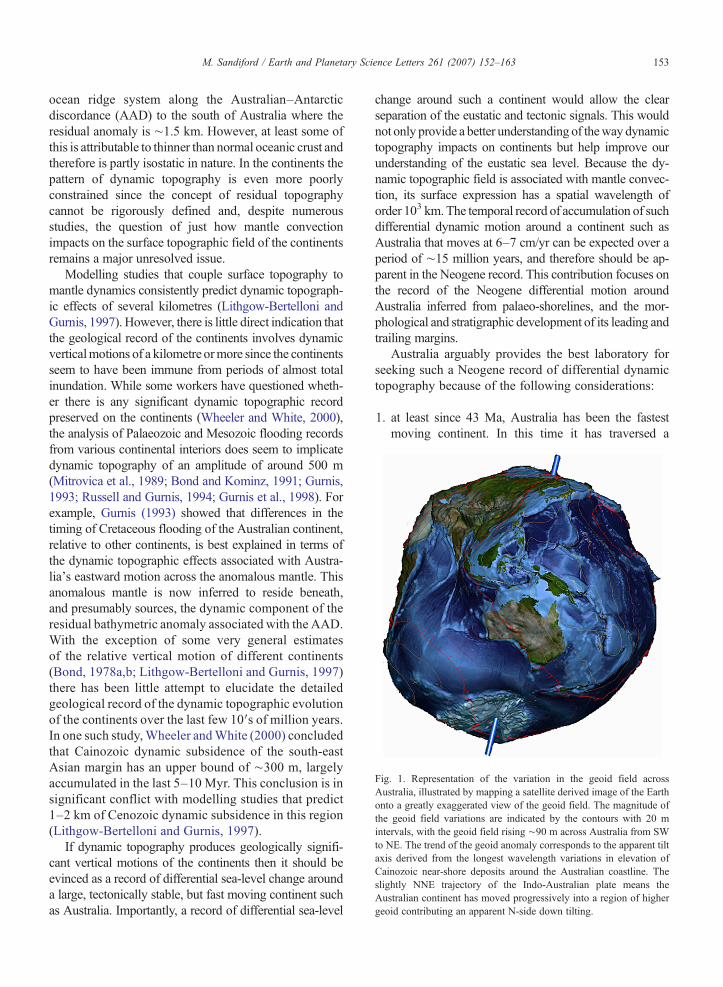
Fig. 1. Representation of the variation in the geoid field acrossAustralia, illustrated by mapping a satellite derived image of the Earthonto a greatly exaggerated view of the geoid field. The magnitude ofthe geoid field variations are indicated by the contours with 20 mintervals, with the geoid field rising ∼90 m across Australia from SWto NE. The trend of the geoid anomaly corresponds to the apparent tiltaxis derived from the longest wavelength variations in elevation ofCainozoic near-shore deposits around the Australian coastline. Theslightly NNE trajectory of the Indo-Australian plate means theAustralian continent has moved progressively into a region of highergeoid contributing an apparent N-side down tilting.
153M. Sandiford / Earth and Planetary Science Letters 261 (2007) 152–163
ocean ridge system along the Australian–Antarcticdiscordance (AAD) to the south of Australia where theresidual anomaly is ∼1.5 km. However, at least some ofthis is attributable to thinner than normal oceanic crust andtherefore is partly isostatic in nature. In the continents thepattern of dynamic topography is even more poorlyconstrained since the concept of residual topographycannot be rigorously defined and, despite numerousstudies, the question of just how mantle convectionimpacts on the surface topographic field of the continentsremains a major unresolved issue.
Modelling studies that couple surface topography tomantle dynamics consistently predict dynamic topograph-ic effects of several kilometres (Lithgow-Bertelloni andGurnis, 1997). However, there is little direct indication thatthe geological record of the continents involves dynamicverticalmotions of a kilometre ormore since the continentsseem to have been immune from periods of almost totalinundation. While some workers have questioned wheth-er there is any significant dynamic topographic recordpreserved on the continents (Wheeler and White, 2000),the analysis of Palaeozoic and Mesozoic flooding recordsfrom various continental interiors does seem to implicatedynamic topography of an amplitude of around 500 m(Mitrovica et al., 1989; Bond and Kominz, 1991; Gurnis,1993; Russell and Gurnis, 1994; Gurnis et al., 1998). Forexample, Gurnis (1993) showed that differences in thetiming of Cretaceous flooding of the Australian continent,relative to other continents, is best explained in terms ofthe dynamic topographic effects associated with Austra-lia's eastward motion across the anomalous mantle. Thisanomalous mantle is now inferred to reside beneath,and presumably sources, the dynamic component of theresidual bathymetric anomaly associated with the AAD.With the exception of some very general estimatesof the relative vertical motion of different continents(Bond, 1978a,b; Lithgow-Bertelloni and Gurnis, 1997)there has been little attempt to elucidate the detailedgeological record of the dynamic topographic evolutionof the continents over the last few 10′s of million years.In one such study,Wheeler andWhite (2000) concludedthat Cainozoic dynamic subsidence of the south-eastAsian margin has an upper bound of ∼300 m, largelyaccumulated in the last 5–10 Myr. This conclusion is insignificant conflict with modelling studies that predict1–2 km of Cenozoic dynamic subsidence in this region(Lithgow-Bertelloni and Gurnis, 1997).
If dynamic topography produces geologically signifi-cant vertical motions of the continents then it should beevinced as a record of differential sea-level change arounda large, tectonically stable, but fast moving continent suchas Australia. Importantly, a record of differential sea-level
change around such a continent would allow the clearseparation of the eustatic and tectonic signals. This wouldnot only provide a better understanding of theway dynamictopography impacts on continents but help improve ourunderstanding of the eustatic sea level. Because the dy-namic topographic field is associated with mantle convec-tion, its surface expression has a spatial wavelength oforder 103 km. The temporal record of accumulation of suchdifferential dynamic motion around a continent such asAustralia that moves at 6–7 cm/yr can be expected over aperiod of ∼15 million years, and therefore should be ap-parent in the Neogene record. This contribution focuses onthe record of the Neogene differential motion aroundAustralia inferred from palaeo-shorelines, and the mor-phological and stratigraphic development of its leading andtrailing margins.
Australia arguably provides the best laboratory forseeking such a Neogene record of differential dynamictopography because of the following considerations:
1. at least since 43 Ma, Australia has been the fastestmoving continent. In this time it has traversed a
154 M. Sandiford / Earth and Planetary Science Letters 261 (2007) 152–163
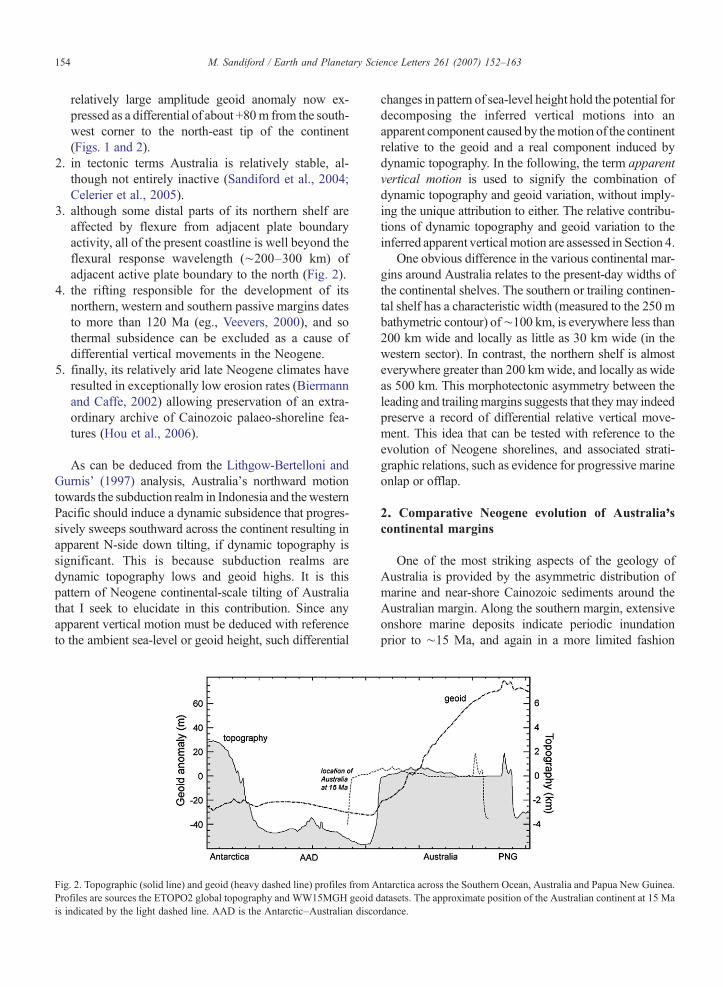
relatively large amplitude geoid anomaly now ex-pressed as a differential of about +80m from the south-west corner to the north-east tip of the continent(Figs. 1 and 2).
2. in tectonic terms Australia is relatively stable, al-though not entirely inactive (Sandiford et al., 2004;Celerier et al., 2005).
3. although some distal parts of its northern shelf areaffected by flexure from adjacent plate boundaryactivity, all of the present coastline is well beyond theflexural response wavelength (∼200–300 km) ofadjacent active plate boundary to the north (Fig. 2).
4. the rifting responsible for the development of itsnorthern, western and southern passive margins datesto more than 120 Ma (eg., Veevers, 2000), and sothermal subsidence can be excluded as a cause ofdifferential vertical movements in the Neogene.
5. finally, its relatively arid late Neogene climates haveresulted in exceptionally low erosion rates (Biermannand Caffe, 2002) allowing preservation of an extra-ordinary archive of Cainozoic palaeo-shoreline fea-tures (Hou et al., 2006).
As can be deduced from the Lithgow-Bertelloni andGurnis' (1997) analysis, Australia's northward motiontowards the subduction realm in Indonesia and thewesternPacific should induce a dynamic subsidence that progres-sively sweeps southward across the continent resulting inapparent N-side down tilting, if dynamic topography issignificant. This is because subduction realms aredynamic topography lows and geoid highs. It is thispattern of Neogene continental-scale tilting of Australiathat I seek to elucidate in this contribution. Since anyapparent vertical motion must be deduced with referenceto the ambient sea-level or geoid height, such differential
Fig. 2. Topographic (solid line) and geoid (heavy dashed line) profiles from AProfiles are sources the ETOPO2 global topography and WW15MGH geoid dis indicated by the light dashed line. AAD is the Antarctic–Australian disco
changes in pattern of sea-level height hold the potential fordecomposing the inferred vertical motions into anapparent component caused by themotion of the continentrelative to the geoid and a real component induced bydynamic topography. In the following, the term apparentvertical motion is used to signify the combination ofdynamic topography and geoid variation, without imply-ing the unique attribution to either. The relative contribu-tions of dynamic topography and geoid variation to theinferred apparent vertical motion are assessed in Section 4.
One obvious difference in the various continental mar-gins around Australia relates to the present-day widths ofthe continental shelves. The southern or trailing continen-tal shelf has a characteristic width (measured to the 250 mbathymetric contour) of∼100 km, is everywhere less than200 km wide and locally as little as 30 km wide (in thewestern sector). In contrast, the northern shelf is almosteverywhere greater than 200 kmwide, and locally as wideas 500 km. This morphotectonic asymmetry between theleading and trailingmargins suggests that theymay indeedpreserve a record of differential relative vertical move-ment. This idea that can be tested with reference to theevolution of Neogene shorelines, and associated strati-graphic relations, such as evidence for progressive marineonlap or offlap.
2. Comparative Neogene evolution of Australia'scontinental margins
One of the most striking aspects of the geology ofAustralia is provided by the asymmetric distribution ofmarine and near-shore Cainozoic sediments around theAustralian margin. Along the southern margin, extensiveonshore marine deposits indicate periodic inundationprior to ∼15 Ma, and again in a more limited fashion
ntarctica across the Southern Ocean, Australia and Papua New Guinea.atasets. The approximate position of the Australian continent at 15 Mardance.
155M. Sandiford / Earth and Planetary Science Letters 261 (2007) 152–163
after ∼6 Ma. Maximum Cainozoic marine incursionsoften extend hundred's of kilometres inland of the present-day coastline, to elevations now up to 300 m abovepresent-day sea level (ASL). In contrast, equivalent-agedmarine sediments are almost entirely absent from thepresent-day onshore northern and eastern margins, orlimited to elevations less than ∼10 m ASL, with mostinterpretations placing Cainozoic shorelines offshore(Veevers, 1984, 2000) (Fig. 3). This distribution providesa profound insight into differential vertical movements,demanding a strong asymmetry in vertical motions withrespect to the present-day coastline and implying that thepresent-day morphotectonic asymmetry of the continental
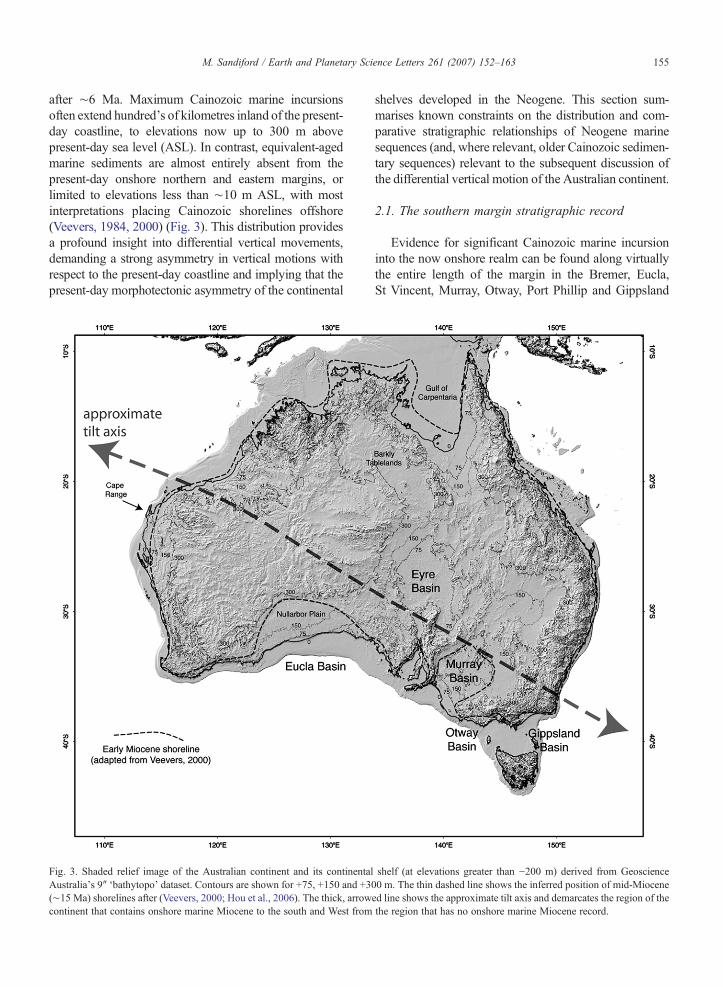
Fig. 3. Shaded relief image of the Australian continent and its continentalAustralia's 9″ ‘bathytopo’ dataset. Contours are shown for +75, +150 and +3(∼15 Ma) shorelines after (Veevers, 2000; Hou et al., 2006). The thick, arrowcontinent that contains onshore marine Miocene to the south and West from
shelves developed in the Neogene. This section sum-marises known constraints on the distribution and com-parative stratigraphic relationships of Neogene marinesequences (and, where relevant, older Cainozoic sedimen-tary sequences) relevant to the subsequent discussion ofthe differential vertical motion of the Australian continent.
2.1. The southern margin stratigraphic record
Evidence for significant Cainozoic marine incursioninto the now onshore realm can be found along virtuallythe entire length of the margin in the Bremer, Eucla,St Vincent, Murray, Otway, Port Phillip and Gippsland
shelf (at elevations greater than −200 m) derived from Geoscience00 m. The thin dashed line shows the inferred position of mid-Mioceneed line shows the approximate tilt axis and demarcates the region of thethe region that has no onshore marine Miocene record.
156 M. Sandiford / Earth and Planetary Science Letters 261 (2007) 152–163
Basins. The most extensive incursions are evident in theonshore part of the Eucla Basin on the Nullarbor Plain,and in the Murray Basin (Fig. 3). In the Eucla Basin, thenorthern-limit of marine incursion is delineated by aremarkable set of palaeo-shorelines (Figs. 4 and 5)extending up to ∼400 km inland of the present-dayshoreline. The palaeo-shoreline features include offshorebarrier systems, marginal lagoons and inundated valleysdating back to the mid–late Eocene (∼41–39Ma). Alongthe north-western Eucla Basin margin, maximum marineflooding occurred at∼39Ma to levels now∼300 mASL.In the eastern Eucla Basin, Eocene shore-lines aresignificantly lower (as low as 160 m ASL) with adifferential across the ∼1000 km wide Eucla basin of atleast 140 m. Inferred early Neogene (N15 Ma) shorelinesassociated with deposition of the Nullarbor Limestonegenerally follow the older Eocene shorelines, but aresystematically lower by between 30 and 80 m (Hou et al.,2006). The maximum elevations of early Neogene shore-lines occur in the central west part of the Eucla Basinalong the northern most limit of the Nullarbor Plain ataround 250 m ASL (Hou et al., 2003, 2006). The ele-
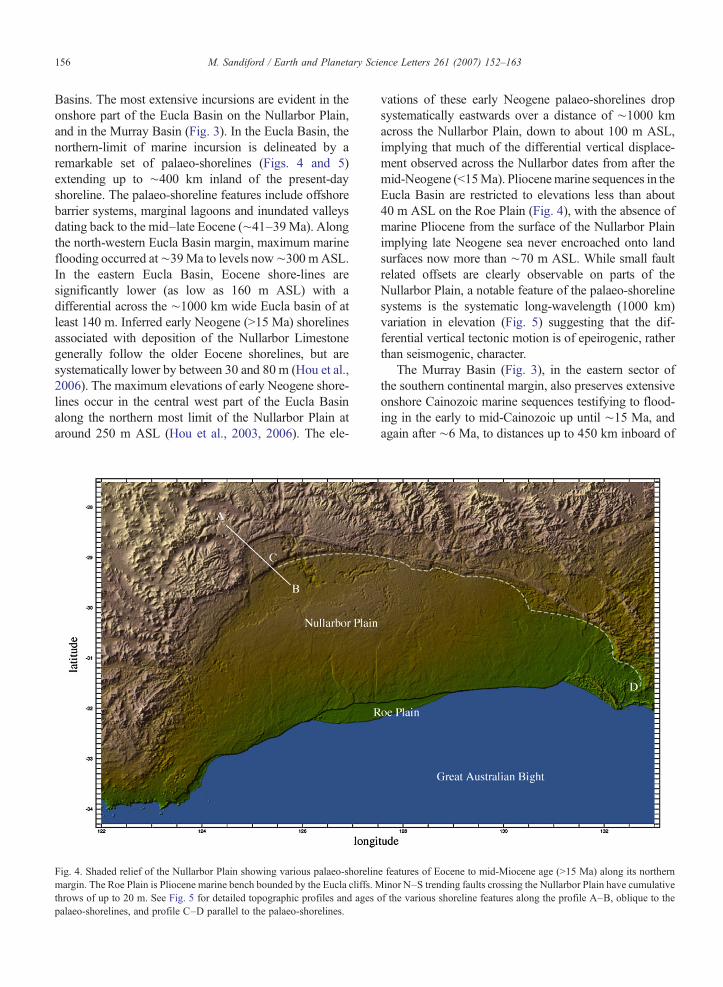
Fig. 4. Shaded relief of the Nullarbor Plain showing various palaeo-shorelinmargin. The Roe Plain is Pliocene marine bench bounded by the Eucla cliffs. Mthrows of up to 20 m. See Fig. 5 for detailed topographic profiles and agespalaeo-shorelines, and profile C–D parallel to the palaeo-shorelines.
vations of these early Neogene palaeo-shorelines dropsystematically eastwards over a distance of ∼1000 kmacross the Nullarbor Plain, down to about 100 m ASL,implying that much of the differential vertical displace-ment observed across the Nullarbor dates from after themid-Neogene (b15Ma). Pliocenemarine sequences in theEucla Basin are restricted to elevations less than about40 m ASL on the Roe Plain (Fig. 4), with the absence ofmarine Pliocene from the surface of the Nullarbor Plainimplying late Neogene sea never encroached onto landsurfaces now more than ∼70 m ASL. While small faultrelated offsets are clearly observable on parts of theNullarbor Plain, a notable feature of the palaeo-shorelinesystems is the systematic long-wavelength (1000 km)variation in elevation (Fig. 5) suggesting that the dif-ferential vertical tectonic motion is of epeirogenic, ratherthan seismogenic, character.
The Murray Basin (Fig. 3), in the eastern sector ofthe southern continental margin, also preserves extensiveonshore Cainozoic marine sequences testifying to flood-ing in the early to mid-Cainozoic up until ∼15 Ma, andagain after ∼6 Ma, to distances up to 450 km inboard of
e features of Eocene to mid-Miocene age (N15 Ma) along its northerninor N–S trending faults crossing the Nullarbor Plain have cumulative
of the various shoreline features along the profile A–B, oblique to the
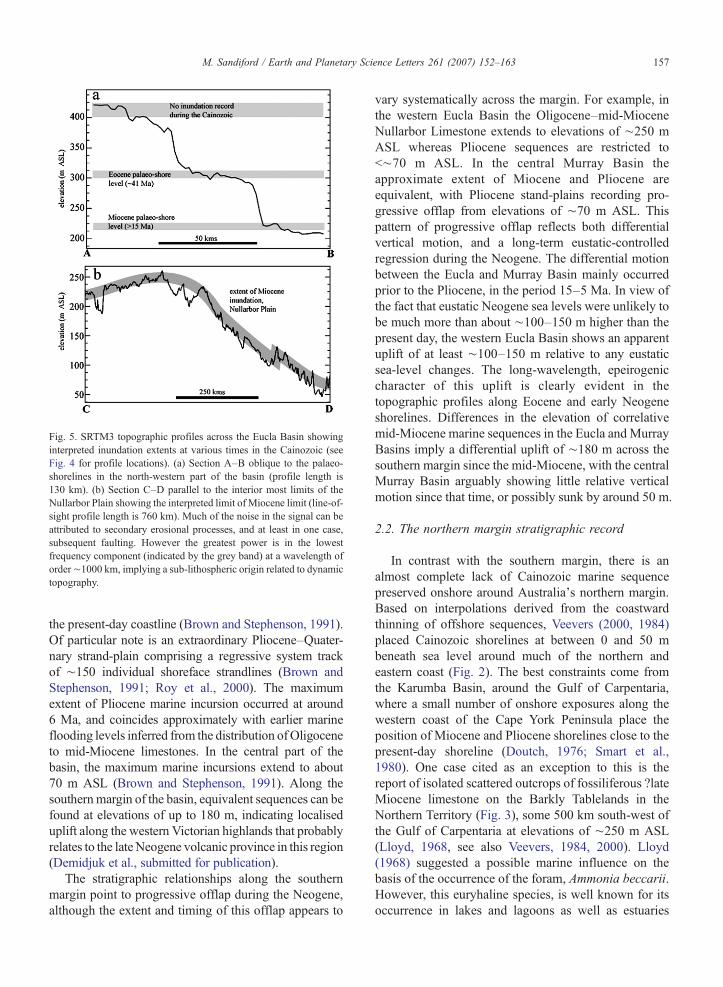
Fig. 5. SRTM3 topographic profiles across the Eucla Basin showinginterpreted inundation extents at various times in the Cainozoic (seeFig. 4 for profile locations). (a) Section A–B oblique to the palaeo-shorelines in the north-western part of the basin (profile length is130 km). (b) Section C–D parallel to the interior most limits of theNullarbor Plain showing the interpreted limit of Miocene limit (line-of-sight profile length is 760 km). Much of the noise in the signal can beattributed to secondary erosional processes, and at least in one case,subsequent faulting. However the greatest power is in the lowestfrequency component (indicated by the grey band) at a wavelength oforder∼1000 km, implying a sub-lithospheric origin related to dynamictopography.
157M. Sandiford / Earth and Planetary Science Letters 261 (2007) 152–163
the present-day coastline (Brown and Stephenson, 1991).Of particular note is an extraordinary Pliocene–Quater-nary strand-plain comprising a regressive system trackof ∼150 individual shoreface strandlines (Brown andStephenson, 1991; Roy et al., 2000). The maximumextent of Pliocene marine incursion occurred at around6 Ma, and coincides approximately with earlier marineflooding levels inferred from the distribution ofOligoceneto mid-Miocene limestones. In the central part of thebasin, the maximum marine incursions extend to about70 m ASL (Brown and Stephenson, 1991). Along thesouthernmargin of the basin, equivalent sequences can befound at elevations of up to 180 m, indicating localiseduplift along the western Victorian highlands that probablyrelates to the lateNeogene volcanic province in this region(Demidjuk et al., submitted for publication).
The stratigraphic relationships along the southernmargin point to progressive offlap during the Neogene,although the extent and timing of this offlap appears to
vary systematically across the margin. For example, inthe western Eucla Basin the Oligocene–mid-MioceneNullarbor Limestone extends to elevations of ∼250 mASL whereas Pliocene sequences are restricted tob∼70 m ASL. In the central Murray Basin theapproximate extent of Miocene and Pliocene areequivalent, with Pliocene stand-plains recording pro-gressive offlap from elevations of ∼70 m ASL. Thispattern of progressive offlap reflects both differentialvertical motion, and a long-term eustatic-controlledregression during the Neogene. The differential motionbetween the Eucla and Murray Basin mainly occurredprior to the Pliocene, in the period 15–5 Ma. In view ofthe fact that eustatic Neogene sea levels were unlikely tobe much more than about ∼100–150 m higher than thepresent day, the western Eucla Basin shows an apparentuplift of at least ∼100–150 m relative to any eustaticsea-level changes. The long-wavelength, epeirogeniccharacter of this uplift is clearly evident in thetopographic profiles along Eocene and early Neogeneshorelines. Differences in the elevation of correlativemid-Miocene marine sequences in the Eucla and MurrayBasins imply a differential uplift of ∼180 m across thesouthern margin since the mid-Miocene, with the centralMurray Basin arguably showing little relative verticalmotion since that time, or possibly sunk by around 50 m.
2.2. The northern margin stratigraphic record
In contrast with the southern margin, there is analmost complete lack of Cainozoic marine sequencepreserved onshore around Australia's northern margin.Based on interpolations derived from the coastwardthinning of offshore sequences, Veevers (2000, 1984)placed Cainozoic shorelines at between 0 and 50 mbeneath sea level around much of the northern andeastern coast (Fig. 2). The best constraints come fromthe Karumba Basin, around the Gulf of Carpentaria,where a small number of onshore exposures along thewestern coast of the Cape York Peninsula place theposition of Miocene and Pliocene shorelines close to thepresent-day shoreline (Doutch, 1976; Smart et al.,1980). One case cited as an exception to this is thereport of isolated scattered outcrops of fossiliferous ?lateMiocene limestone on the Barkly Tablelands in theNorthern Territory (Fig. 3), some 500 km south-west ofthe Gulf of Carpentaria at elevations of ∼250 m ASL(Lloyd, 1968, see also Veevers, 1984, 2000). Lloyd(1968) suggested a possible marine influence on thebasis of the occurrence of the foram, Ammonia beccarii.However, this euryhaline species, is well known for itsoccurrence in lakes and lagoons as well as estuaries
158 M. Sandiford / Earth and Planetary Science Letters 261 (2007) 152–163
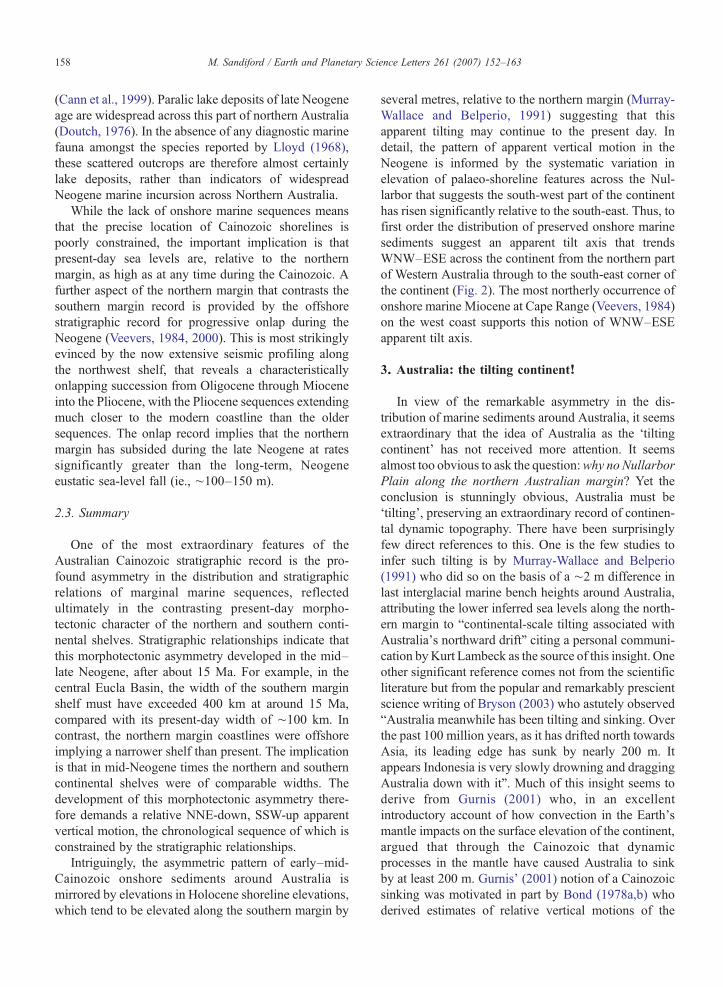
(Cann et al., 1999). Paralic lake deposits of late Neogeneage are widespread across this part of northern Australia(Doutch, 1976). In the absence of any diagnostic marinefauna amongst the species reported by Lloyd (1968),these scattered outcrops are therefore almost certainlylake deposits, rather than indicators of widespreadNeogene marine incursion across Northern Australia.
While the lack of onshore marine sequences meansthat the precise location of Cainozoic shorelines ispoorly constrained, the important implication is thatpresent-day sea levels are, relative to the northernmargin, as high as at any time during the Cainozoic. Afurther aspect of the northern margin that contrasts thesouthern margin record is provided by the offshorestratigraphic record for progressive onlap during theNeogene (Veevers, 1984, 2000). This is most strikinglyevinced by the now extensive seismic profiling alongthe northwest shelf, that reveals a characteristicallyonlapping succession from Oligocene through Mioceneinto the Pliocene, with the Pliocene sequences extendingmuch closer to the modern coastline than the oldersequences. The onlap record implies that the northernmargin has subsided during the late Neogene at ratessignificantly greater than the long-term, Neogeneeustatic sea-level fall (ie., ∼100–150 m).
2.3. Summary
One of the most extraordinary features of theAustralian Cainozoic stratigraphic record is the pro-found asymmetry in the distribution and stratigraphicrelations of marginal marine sequences, reflectedultimately in the contrasting present-day morpho-tectonic character of the northern and southern conti-nental shelves. Stratigraphic relationships indicate thatthis morphotectonic asymmetry developed in the mid–late Neogene, after about 15 Ma. For example, in thecentral Eucla Basin, the width of the southern marginshelf must have exceeded 400 km at around 15 Ma,compared with its present-day width of ∼100 km. Incontrast, the northern margin coastlines were offshoreimplying a narrower shelf than present. The implicationis that in mid-Neogene times the northern and southerncontinental shelves were of comparable widths. Thedevelopment of this morphotectonic asymmetry there-fore demands a relative NNE-down, SSW-up apparentvertical motion, the chronological sequence of which isconstrained by the stratigraphic relationships.
Intriguingly, the asymmetric pattern of early–mid-Cainozoic onshore sediments around Australia ismirrored by elevations in Holocene shoreline elevations,which tend to be elevated along the southern margin by
several metres, relative to the northern margin (Murray-Wallace and Belperio, 1991) suggesting that thisapparent tilting may continue to the present day. Indetail, the pattern of apparent vertical motion in theNeogene is informed by the systematic variation inelevation of palaeo-shoreline features across the Nul-larbor that suggests the south-west part of the continenthas risen significantly relative to the south-east. Thus, tofirst order the distribution of preserved onshore marinesediments suggest an apparent tilt axis that trendsWNW–ESE across the continent from the northern partof Western Australia through to the south-east corner ofthe continent (Fig. 2). The most northerly occurrence ofonshore marine Miocene at Cape Range (Veevers, 1984)on the west coast supports this notion of WNW–ESEapparent tilt axis.
3. Australia: the tilting continent!
In view of the remarkable asymmetry in the dis-tribution of marine sediments around Australia, it seemsextraordinary that the idea of Australia as the ‘tiltingcontinent’ has not received more attention. It seemsalmost too obvious to ask the question:why noNullarborPlain along the northern Australian margin? Yet theconclusion is stunningly obvious, Australia must be‘tilting’, preserving an extraordinary record of continen-tal dynamic topography. There have been surprisinglyfew direct references to this. One is the few studies toinfer such tilting is by Murray-Wallace and Belperio(1991) who did so on the basis of a ∼2 m difference inlast interglacial marine bench heights around Australia,attributing the lower inferred sea levels along the north-ern margin to “continental-scale tilting associated withAustralia's northward drift” citing a personal communi-cation byKurt Lambeck as the source of this insight. Oneother significant reference comes not from the scientificliterature but from the popular and remarkably prescientscience writing of Bryson (2003) who astutely observed“Australia meanwhile has been tilting and sinking. Overthe past 100 million years, as it has drifted north towardsAsia, its leading edge has sunk by nearly 200 m. Itappears Indonesia is very slowly drowning and draggingAustralia down with it”. Much of this insight seems toderive from Gurnis (2001) who, in an excellentintroductory account of how convection in the Earth'smantle impacts on the surface elevation of the continent,argued that through the Cainozoic that dynamicprocesses in the mantle have caused Australia to sinkby at least 200 m. Gurnis' (2001) notion of a Cainozoicsinking was motivated in part by Bond (1978a,b) whoderived estimates of relative vertical motions of the

159M. Sandiford / Earth and Planetary Science Letters 261 (2007) 152–163
continents by comparing changes in the proportion ofapparent flooding taking into account the hypsometry.Because of his use of an index based on the proportion ofcontinent flooding, Bond (1978a,b) was only able toprovide estimates of average continental elevationchanges. However, the distribution of Cainozoic marinesediments, and associated stratigraphic relations, indi-cates that the pattern of long-wavelength deformation ofthe Australian continent is more complex than a simplesinking. Indeed, in as much as eustatic sea levels areunlikely to have been much greater than about 100–150m above the present day over the last 43Ma,much ofthe south-western margin of the Australian continentshows a Neogene record of uplift rather than subsidence.In this section I provide a framework for understandingthe long wavelength tilting of the continent in terms ofdynamic topography.
As noted in the Introduction, the expected pattern ofdynamic topography should relate primarily to planformof mantle circulation, with zones of mantle downwellingcharacterized by dynamic topographic lows and zones ofupwelling characterized by dynamic topographic highs.That regions above zones of persistent downwelling, likesubduction realms, are characterized by dynamic topo-graphic lows is well illustrated by the Sunda Block northof Australia, which constitutes one of the most submergedregions of continental crust on the modern Earth. Thesame dynamic topographic effect that depresses the SundaBlock also helps explain the extreme width of the con-tinental shelf along Australia's northern margin. Thus,any continent that has a long-lived history of movementtowards a zone of persistent subduction, such asAustralia,should experience downwards tilting in the sense of platemotion. The geological indicators of this tilting will befurther augmented by the fact that downwelling zones arealso typically characterized by geoid highs, with the effectof dynamic subsidence augmented by an “apparent” seallevel rise created by the rise in geoid height. In the con-text of Australia, this notion that the continental-scaleasymmetry in the Cainozoic stratigraphic is dynamicallysupported, rather than isostatically, is emphasised by thegeneral parallelism of the tilt axis and contours in the long-wavelength geoid.
Importantly, the apparent sinking of the northern part ofthe Australian continent inferred from the absence of on-shore Cainozoic shorelines must exceed the Neogeneeustatic sea-level fall typically estimated at least 100 m.The evidence for systematic progressive onlap of offshoreNeogene sequences suggests that this apparent tiltingcontinues to the present day, as does the analysis of lastinterglacial marine bench heights around Australia(Murray-Wallace and Belperio, 1991), that suggests sea
levels where ∼2 m lower along the northern coast than insouthern Australia. This late Pleistocene sea-level recordof differential vertical motion between northern and south-ern Australia is remarkably consistent with the longer-term, Neogene rate of 15–20 m/myr inferred below.
The reason for the absolute uplift of the south-westernpart of the continent is less obvious. However, by similarlogic, it may be assumed that absolute dynamic upliftrelates to the progressivemovement of the continent awayfrom a dynamic topographic low. That such a dynamictopographic low exists to the south of Australia is in-dicated by the anomalously low elevation of the mid-ocean ridge along the AAD, which contributes one of thelowest residual bathymetric anomalies known from theoceans. Gurnis et al. (1998) have argued that this lowreflects the existence of a remnant slab fragment, nowelevated above the mantle transition zone due to theopening of the Southern Ocean, along the AAD. Theyfurther argued that this remnant slab originated from anearly–mid-Mesozoic subduction system along the eastGondwanamargin, and showed howdynamic topographyassociated with the eastward motion of Australia across afoundering Cretaceous slab provides an elegant explana-tion for anomalous subsidence in the Eromanga Basin. Byanalogy, the Cainozoic northward motion of Australiaaway from this anomalous mantle provides a plausiblephysical explanation for the apparent vertical motion ofthe south margin of up to ∼150 m in the Neogene. Theamplitude of the apparent vertical motion decreases east-wards across the southern margin, apparently declining tonegligible values in the central Murray Basin in the south-east part of the continent.
4. Implications for the Earth's dynamic topographyfield
The Neogene tilting record of Australia provides aprofound constraint on the dynamic topography field of thecontinents. The combinedN-down, SSW-up differential inapparent vertical motion of the continent is at least 250 mand more probably 300 m, with the uncertainty mainlydepending on the depth of earlyMiocene shorelines on thenorthern shelf (eg. Veevers, 2000). This differential hasaccumulated since ∼15 Ma, when the Nullarbor Plainfinally became emergent, and apparently affects lastinterglacial shoreline features at comparable rates to theNeogene average (Murray-Wallace and Belperio, 1991).
The apparent vertical motion reflects contributionsfrom variations in both the geoid and the dynamictopography fields, both of which evolve as a conse-quence of the mantle flow associated with plate motion.Because both the dynamic topography and geoid fields
160 M. Sandiford / Earth and Planetary Science Letters 261 (2007) 152–163
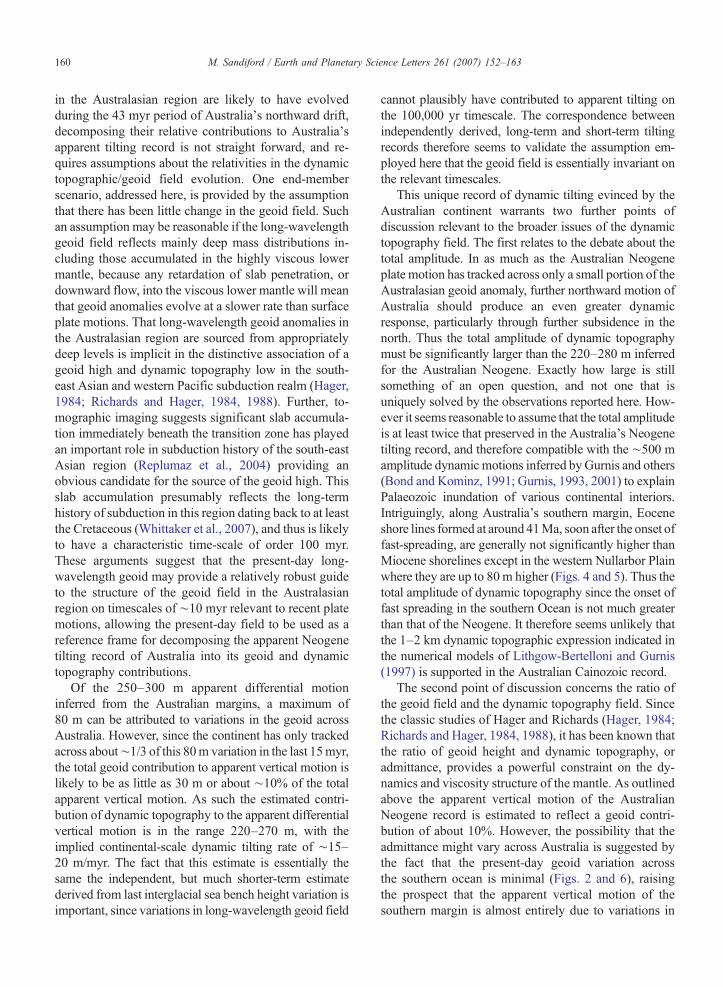
in the Australasian region are likely to have evolvedduring the 43 myr period of Australia's northward drift,decomposing their relative contributions to Australia'sapparent tilting record is not straight forward, and re-quires assumptions about the relativities in the dynamictopographic/geoid field evolution. One end-memberscenario, addressed here, is provided by the assumptionthat there has been little change in the geoid field. Suchan assumption may be reasonable if the long-wavelengthgeoid field reflects mainly deep mass distributions in-cluding those accumulated in the highly viscous lowermantle, because any retardation of slab penetration, ordownward flow, into the viscous lower mantle will meanthat geoid anomalies evolve at a slower rate than surfaceplate motions. That long-wavelength geoid anomalies inthe Australasian region are sourced from appropriatelydeep levels is implicit in the distinctive association of ageoid high and dynamic topography low in the south-east Asian and western Pacific subduction realm (Hager,1984; Richards and Hager, 1984, 1988). Further, to-mographic imaging suggests significant slab accumula-tion immediately beneath the transition zone has playedan important role in subduction history of the south-eastAsian region (Replumaz et al., 2004) providing anobvious candidate for the source of the geoid high. Thisslab accumulation presumably reflects the long-termhistory of subduction in this region dating back to at leastthe Cretaceous (Whittaker et al., 2007), and thus is likelyto have a characteristic time-scale of order 100 myr.These arguments suggest that the present-day long-wavelength geoid may provide a relatively robust guideto the structure of the geoid field in the Australasianregion on timescales of ∼10 myr relevant to recent platemotions, allowing the present-day field to be used as areference frame for decomposing the apparent Neogenetilting record of Australia into its geoid and dynamictopography contributions.
Of the 250–300 m apparent differential motioninferred from the Australian margins, a maximum of80 m can be attributed to variations in the geoid acrossAustralia. However, since the continent has only trackedacross about∼1/3 of this 80m variation in the last 15myr,the total geoid contribution to apparent vertical motion islikely to be as little as 30 m or about ∼10% of the totalapparent vertical motion. As such the estimated contri-bution of dynamic topography to the apparent differentialvertical motion is in the range 220–270 m, with theimplied continental-scale dynamic tilting rate of ∼15–20 m/myr. The fact that this estimate is essentially thesame the independent, but much shorter-term estimatederived from last interglacial sea bench height variation isimportant, since variations in long-wavelength geoid field
cannot plausibly have contributed to apparent tilting onthe 100,000 yr timescale. The correspondence betweenindependently derived, long-term and short-term tiltingrecords therefore seems to validate the assumption em-ployed here that the geoid field is essentially invariant onthe relevant timescales.
This unique record of dynamic tilting evinced by theAustralian continent warrants two further points ofdiscussion relevant to the broader issues of the dynamictopography field. The first relates to the debate about thetotal amplitude. In as much as the Australian Neogeneplate motion has tracked across only a small portion of theAustralasian geoid anomaly, further northward motion ofAustralia should produce an even greater dynamicresponse, particularly through further subsidence in thenorth. Thus the total amplitude of dynamic topographymust be significantly larger than the 220–280 m inferredfor the Australian Neogene. Exactly how large is stillsomething of an open question, and not one that isuniquely solved by the observations reported here. How-ever it seems reasonable to assume that the total amplitudeis at least twice that preserved in the Australia's Neogenetilting record, and therefore compatible with the ∼500 mamplitude dynamic motions inferred byGurnis and others(Bond and Kominz, 1991; Gurnis, 1993, 2001) to explainPalaeozoic inundation of various continental interiors.Intriguingly, along Australia's southern margin, Eoceneshore lines formed at around 41Ma, soon after the onset offast-spreading, are generally not significantly higher thanMiocene shorelines except in the western Nullarbor Plainwhere they are up to 80 m higher (Figs. 4 and 5). Thus thetotal amplitude of dynamic topography since the onset offast spreading in the southern Ocean is not much greaterthan that of the Neogene. It therefore seems unlikely thatthe 1–2 km dynamic topographic expression indicated inthe numerical models of Lithgow-Bertelloni and Gurnis(1997) is supported in the Australian Cainozoic record.
The second point of discussion concerns the ratio ofthe geoid field and the dynamic topography field. Sincethe classic studies of Hager and Richards (Hager, 1984;Richards and Hager, 1984, 1988), it has been known thatthe ratio of geoid height and dynamic topography, oradmittance, provides a powerful constraint on the dy-namics and viscosity structure of the mantle. As outlinedabove the apparent vertical motion of the AustralianNeogene record is estimated to reflect a geoid contri-bution of about 10%. However, the possibility that theadmittance might vary across Australia is suggested bythe fact that the present-day geoid variation acrossthe southern ocean is minimal (Figs. 2 and 6), raisingthe prospect that the apparent vertical motion of thesouthern margin is almost entirely due to variations in
161M. Sandiford / Earth and Planetary Science Letters 261 (2007) 152–163
dynamic topography. Certainly, the large variation indynamic topography from west to east is matched bylittle geoid variation when mapped onto the past 15 myrof plate motion (Fig. 6). In contrast, the geoid gradientsacross the northern margin of the continent are con-sistent with ∼30–40 m of relative motion over the last15 myr, suggesting an admittance of about 20–25%.Such variations in admittance presumably reflect dif-ferences in the nature of the generative circulation pro-cesses and associated density anomalies in the mantle.In regions where the mantle flow penetrates into a moreviscous lower mantle, such as expected in the long-livedsubduction realm to the north of Australia, the dynamictopographic induced by the flow response will bepreferentially partitioned away from the upper boundarylayer to the lower boundary layer of the flow regime.Indeed it is this very partitioning that gives rise to thepositive geoid anomaly (Richards and Hager, 1984), andyields a relatively high admittance. In regions whereflow is restricted to the upper mantle, dynamic topog-
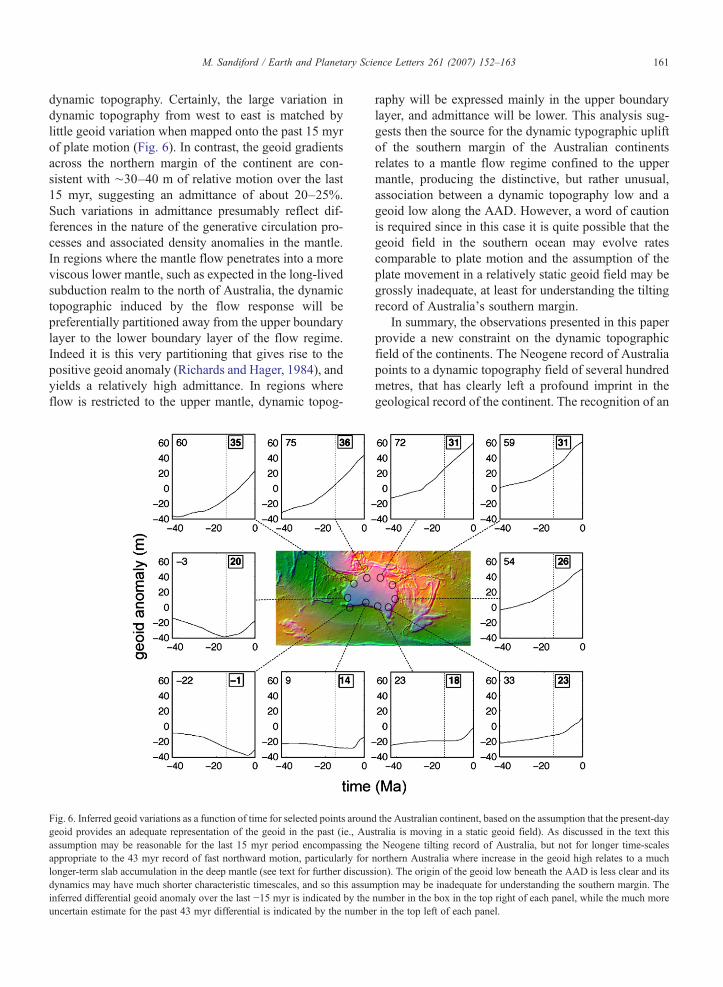
Fig. 6. Inferred geoid variations as a function of time for selected points aroungeoid provides an adequate representation of the geoid in the past (ie., Ausassumption may be reasonable for the last 15 myr period encompassing thappropriate to the 43 myr record of fast northward motion, particularly forlonger-term slab accumulation in the deep mantle (see text for further discussdynamics may have much shorter characteristic timescales, and so this assuminferred differential geoid anomaly over the last −15 myr is indicated by theuncertain estimate for the past 43 myr differential is indicated by the numbe
raphy will be expressed mainly in the upper boundarylayer, and admittance will be lower. This analysis sug-gests then the source for the dynamic typographic upliftof the southern margin of the Australian continentsrelates to a mantle flow regime confined to the uppermantle, producing the distinctive, but rather unusual,association between a dynamic topography low and ageoid low along the AAD. However, a word of cautionis required since in this case it is quite possible that thegeoid field in the southern ocean may evolve ratescomparable to plate motion and the assumption of theplate movement in a relatively static geoid field may begrossly inadequate, at least for understanding the tiltingrecord of Australia's southern margin.
In summary, the observations presented in this paperprovide a new constraint on the dynamic topographicfield of the continents. The Neogene record of Australiapoints to a dynamic topography field of several hundredmetres, that has clearly left a profound imprint in thegeological record of the continent. The recognition of an
d the Australian continent, based on the assumption that the present-daytralia is moving in a static geoid field). As discussed in the text thise Neogene tilting record of Australia, but not for longer time-scalesnorthern Australia where increase in the geoid high relates to a muchion). The origin of the geoid low beneath the AAD is less clear and itsption may be inadequate for understanding the southern margin. Thenumber in the box in the top right of each panel, while the much morer in the top left of each panel.
162 M. Sandiford / Earth and Planetary Science Letters 261 (2007) 152–163
unambiguous dynamic topographic record of severalhundred metres amplitude in the recent geological past,in a tectonically stable continent such as Australia,clearly has profound import for unravelling the longerterm eustatic sea-level record and must be considered,for example, when using the continental stratigraphicrecord to as a constraint on the growth of ice-sheetsduring the Neogene. In this regard the Australian tiltingrecord shows that while dynamic topography verticalmotions accumulate at rates (10–20 m/myr) severalorders of magnitude lower than maximum eustatic sea-level changes, the amplitude of dynamic topographyvariation is significantly larger the eustatic variation, atleast over the duration of the Neogene. Thus this studyfurther highlights the problem of attribution of long-term (1–100 myr) sea-level variations to eustaticprocesses even in relative stable continental settings,because all continents ride on a dynamic mantle,necessarily contributing a dynamic topographic signal.While the peculiar features of the Australia's geody-namic setting have conspired to make this dynamictopographic signal seemingly obvious, it is salutary tothink that it has, until now, gone largely unnoticed andmore-or-less unreported. Revealing such a signal in theancient geological record, or on slower movingcontinents, via the methods employed here wouldseem therefore to be a formidable task, and for suchcases it is probable that other comparators such asrelative continental hypsometries are likely to providemore definitive indicators of the dynamic topographicsignal (eg Gurnis, 1993).
Acknowledgements
This work has benefited from discussions, at variousstages over the last 6 yr, with Mike Gurnis, MalcolmWallace, Peter de Broekert, Dan Clark, Mark Quigley,Jim Bowler, Dietmar Mueller and Baohong Hou, as wellas the comments of the EPSL reviewers. This work hasbeen supported by ARC Discovery grants DP0558705and DP556133.
References
Biermann, P.R., Caffe, M., 2002. Cosmogenic exposure and erosionhistory of Australian bedrock landforms. Geological Society ofAmerica Bulletin 114, 787–803.
Bond, G.C., 1978a. Evidence for late Tertiary uplift of Africa relativeto North America, South America, Australia and Europe. Journalof Geology 86, 47–75.
Bond, G.C., 1978b. Speculations on real sea level changes and verticalmotions of continents at selected times in the Cretaceous andTertiary. Geology 86.
Bond, G., Kominz, M., 1991. Disentangling Middle Paleozoic sea-level events in cratonic basins and cratonic margins of NorthAmerica. Journal of Geophysical Research 96, 6619–6639.
Brown, C.M., Stephenson, A.E., 1991. Geology of the Murray Basin.BMR Bulletin 235 (430 pp.).
Bryson, B., 2003. A Short History of Nearly Everything. Doubleday,London. (515 pp.).
Cadek, O., Fleitout, L., 2003. Effect of lateral viscosity variations inthe top 300 km on the geoid and dynamic topography. GeophysicalJournal International 152, 566–580.
Cann, J.H., Murray-Wallace, C.V., Belperio, A.P., Brenchley, A.J.,1999. Evolution of Holocene coastal environments near Robe,southeastern South Australia. Quaternary International 56, 81–97.
Cazenave, A., Lago, B., 1991. Long wavelength topography, sea floorsubsidence and flattening. Geophysical Research Letters 18.
Celerier, J., Sandiford, M., Hansen, D.L., Quigley, M., 2005. Modes ofactive intraplate deformation, Flinders Ranges, Australia. Tecton-ics 24 (doi:10.029/2004&C001679).
Demidjuk, Z., Turner, S., Sandiford, M., George, R., Foden, J.,Etheridge, M., submitted for publication. U-series isotope andtopographic constraints on mantle melting processes beneath theNewer Volcanic Province in South Australia, Earth and PlanetaryScience Letters submitted.
Doutch, H.F., 1976. The Karumba Basin, northeastern Australia andsouthern New Guinea. BMR Journal of Australian Geology andGeophysics 1, 121–140.
Gurnis, M., 1993. Phanerozoic marine inundation of continents drivenby dynamic topography above subducting slabs. Nature 364,589–593.
Gurnis, M., 2001. Sculpting the earth from inside out. ScientificAmerican 284, 40–47.
Gurnis, M., Muller, R.D., Moresi, L., 1998. Cretaceous verticalsmotion of Australia and the Australian Antarctic discordance.Science 279, 1499–1504.
Hager, B.H., 1984. Subducted slabs and the geoid: constraints on mantlerheology and flow. Journal of Geophysical Research 89, 6003–6015.
Hou, B., Frakes, L.A., Alley, N.F., Gammon, P., 2003. Clarke, faciesand sequence stratigraphy of Eocene valley fills in Eocenepalaeovalleys, the eastern Eucla Basin, South Australia. Sedimen-tary Geology 163, 111–130.
Hou, B., Alley, N.F., Frakes, L.A., Stoian, L., Cowley, W.M., 2006.Eocene stratigraphic succession in the Eucla Basin of SouthAustralia and correlation to major regional sea-level events.Sedimentary Geology 183, 297–319.
Lithgow-Bertelloni, C., Gurnis, M., 1997. Cenozoic subsidence anduplift of continents from time-varying dynamic topography.Geology 25, 735–738.
Lithgow-Bertelloni, C., Richards, M.A., 1998. The dynamics ofCenozoic and Mesozoic plate motions. Reviews of Geophysics 36.
Lloyd, A.R., 1968. Possible Miocene marine transgression in NorthernAustralia. BMR Geology and Geophysics Bulletin 80, 87–100.
Murray-Wallace, C.V., Belperio, A.P., 1991. The last interglacialshoreline in Australia—a review. Quaternary Science Reviews 10,441–461.
Mitrovica, J.X., Beaumont, C., Jarvis, G.T., 1989. Tilting of conti-nental interiors by the dynamical effects of subduction. Tectonics8, 1079–1094.
Panasyuk, S., Hager, B.H., 2000. Models of isostatic and dynamictopography, geoid anomalies and their uncertainties. Journal ofGeophysical Research 105, 28199–28209.
Replumaz, A., Karason, H., van der Hilst, R.D., Besse, J., Tapponnier,P., 2004. 4-D evolution of SE Asia's mantle from geological
163M. Sandiford / Earth and Planetary Science Letters 261 (2007) 152–163
reconstructions and seismic tomography. Earth and PlanetaryScience Letters 221, 103–115.
Richards, M.A., Hager, B.H., 1984. Geoid anomalies and a dynamicearth. Journal of Geophysical Research 89.
Richards, M.A., Hager, B.H., 1988. The earth's geoid and the largescale structure of mantle convection. In: Runcorn, S.K. (Ed.),Physics of the Planets. Wiley, New York, pp. 247–272.
Roy, P.S., Whitehouse, J., Cowell, P.J., Oakes, G., 2000. Mineral sandsoccurrences in the Murray Basin, southeastern Australia. Eco-nomic Geology 1107–1128.
Russell, M., Gurnis, M., 1994. The planform of epeirogeny: verticalmotions of Australia during the Cretaceous. Basin Research 6,63–64.
Sandiford, M., Wallace, M., Coblentz, D., 2004. Origin of the in situstress field in south-eastern Australia. Basin Research 16.
Smart, J., Grimes, K.G., Doutch, H.F., Pinchin, J., 1980. TheMesozoicCarpentaria Basin and the Cainozoic Karumba Basin, NorthQueensland. BMR Bulletin 202.
Veevers, J.J., 1984. Phanerozoic Earth History of Australia. OxfordUniversity Press, New York, p. 418.
Veevers, J.J., 2000. Billion-Year Earth History of Australia andNeighbours in Gondwanaland. GEMOC Press, Sydney, p. 388.
Wheeler, P., White, N., 2000. Quest for dynamic topography:observations from Southeast Asia. Geology 410, 963–966.
Whittaker, J.M., Muller, R.D., Sdrolias, M., Heine, C., 2007. Sunda-Java trench kinematics, slab window formation and overridingplate deformation since the Cretaceous. Earth and PlanetaryScience Letters 255, 445–457.