Landing site topographic mapping and rover localization for ...
12
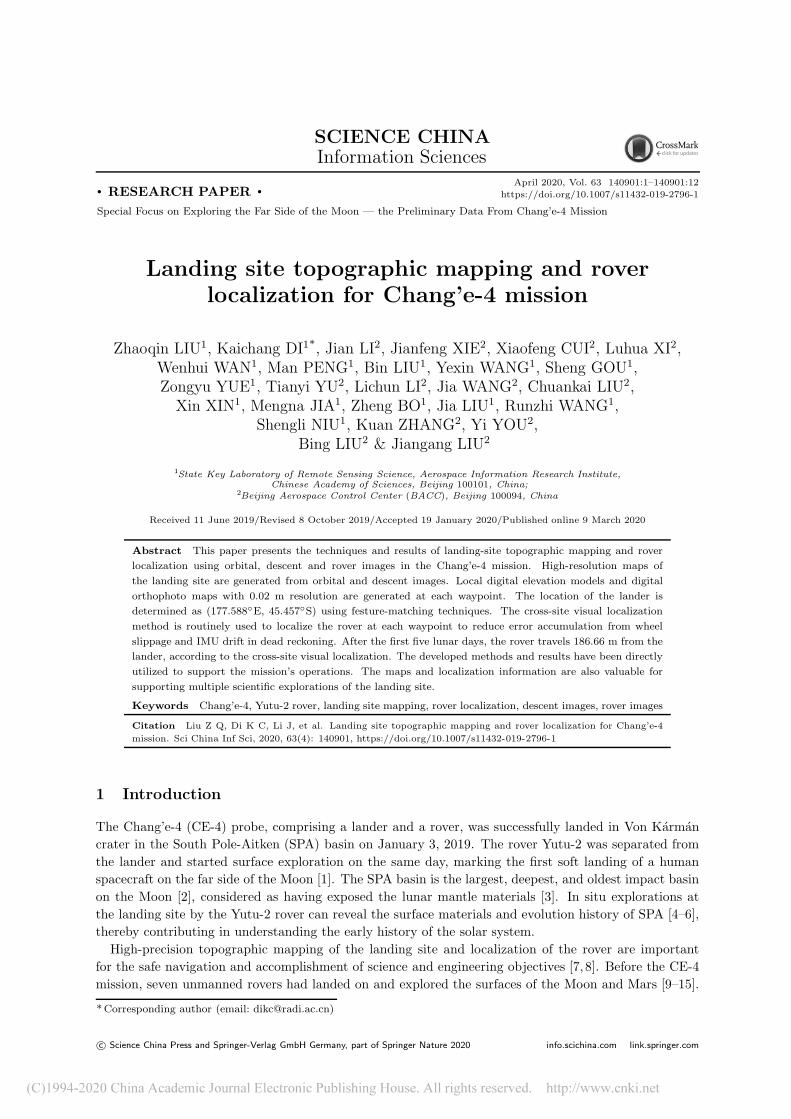
SCIENCE CHINA Information Sciences April 2020, Vol. 63 140901:1–140901:12 https://doi.org/10.1007/s11432-019-2796-1 c Science China Press and Springer-Verlag GmbH Germany, part of Springer Nature 2020 info.scichina.com link.springer.com . RESEARCH PAPER . Special Focus on Exploring the Far Side of the Moon — the Preliminary Data From Chang’e-4 Mission Landing site topographic mapping and rover localization for Chang’e-4 mission Zhaoqin LIU 1 , Kaichang DI 1* , Jian LI 2 , Jianfeng XIE 2 , Xiaofeng CUI 2 , Luhua XI 2 , Wenhui WAN 1 , Man PENG 1 , Bin LIU 1 , Yexin WANG 1 , Sheng GOU 1 , Zongyu YUE 1 , Tianyi YU 2 , Lichun LI 2 , Jia WANG 2 , Chuankai LIU 2 , Xin XIN 1 , Mengna JIA 1 , Zheng BO 1 , Jia LIU 1 , Runzhi WANG 1 , Shengli NIU 1 , Kuan ZHANG 2 , Yi YOU 2 , Bing LIU 2 & Jiangang LIU 2 1 State Key Laboratory of Remote Sensing Science, Aerospace Information Research Institute, Chinese Academy of Sciences, Beijing 100101, China; 2 Beijing Aerospace Control Center (BACC), Beijing 100094, China Received 11 June 2019/Revised 8 October 2019/Accepted 19 January 2020/Published online 9 March 2020 Abstract This paper presents the techniques and results of landing-site topographic mapping and rover localization using orbital, descent and rover images in the Chang’e-4 mission. High-resolution maps of the landing site are generated from orbital and descent images. Local digital elevation models and digital orthophoto maps with 0.02 m resolution are generated at each waypoint. The location of the lander is determined as (177.588 ◦ E, 45.457 ◦ S) using festure-matching techniques. The cross-site visual localization method is routinely used to localize the rover at each waypoint to reduce error accumulation from wheel slippage and IMU drift in dead reckoning. After the first five lunar days, the rover travels 186.66 m from the lander, according to the cross-site visual localization. The developed methods and results have been directly utilized to support the mission’s operations. The maps and localization information are also valuable for supporting multiple scientific explorations of the landing site. Keywords Chang’e-4, Yutu-2 rover, landing site mapping, rover localization, descent images, rover images Citation Liu Z Q, Di K C, Li J, et al. Landing site topographic mapping and rover localization for Chang’e-4 mission. Sci China Inf Sci, 2020, 63(4): 140901, https://doi.org/10.1007/s11432-019-2796-1 1 Introduction The Chang’e-4 (CE-4) probe, comprising a lander and a rover, was successfully landed in Von K´ arm´ an crater in the South Pole-Aitken (SPA) basin on January 3, 2019. The rover Yutu-2 was separated from the lander and started surface exploration on the same day, marking the first soft landing of a human spacecraft on the far side of the Moon [1]. The SPA basin is the largest, deepest, and oldest impact basin on the Moon [2], considered as having exposed the lunar mantle materials [3]. In situ explorations at the landing site by the Yutu-2 rover can reveal the surface materials and evolution history of SPA [4–6], thereby contributing in understanding the early history of the solar system. High-precision topographic mapping of the landing site and localization of the rover are important for the safe navigation and accomplishment of science and engineering objectives [7,8]. Before the CE-4 mission, seven unmanned rovers had landed on and explored the surfaces of the Moon and Mars [9–15]. * Corresponding author (email: [email protected])
-
Upload
khangminh22 -
Category
Documents
-
view
1 -
download
0
Transcript of Landing site topographic mapping and rover localization for ...
SCIENCE CHINAInformation Sciences
April 2020, Vol. 63 140901:1–140901:12
https://doi.org/10.1007/s11432-019-2796-1
c© Science China Press and Springer-Verlag GmbH Germany, part of Springer Nature 2020 info.scichina.com link.springer.com
. RESEARCH PAPER .Special Focus on Exploring the Far Side of the Moon — the Preliminary Data From Chang’e-4 Mission
Landing site topographic mapping and rover
localization for Chang’e-4 mission
Zhaoqin LIU1, Kaichang DI1*, Jian LI2, Jianfeng XIE2, Xiaofeng CUI2, Luhua XI2,
Wenhui WAN1, Man PENG1, Bin LIU1, Yexin WANG1, Sheng GOU1,
Zongyu YUE1, Tianyi YU2, Lichun LI2, Jia WANG2, Chuankai LIU2,
Xin XIN1, Mengna JIA1, Zheng BO1, Jia LIU1, Runzhi WANG1,
Shengli NIU1, Kuan ZHANG2, Yi YOU2,
Bing LIU2 & Jiangang LIU2
1State Key Laboratory of Remote Sensing Science, Aerospace Information Research Institute,Chinese Academy of Sciences, Beijing 100101, China;
2Beijing Aerospace Control Center (BACC), Beijing 100094, China
Received 11 June 2019/Revised 8 October 2019/Accepted 19 January 2020/Published online 9 March 2020
Abstract This paper presents the techniques and results of landing-site topographic mapping and rover
localization using orbital, descent and rover images in the Chang’e-4 mission. High-resolution maps of
the landing site are generated from orbital and descent images. Local digital elevation models and digital
orthophoto maps with 0.02 m resolution are generated at each waypoint. The location of the lander is
determined as (177.588◦E, 45.457◦S) using festure-matching techniques. The cross-site visual localization
method is routinely used to localize the rover at each waypoint to reduce error accumulation from wheel
slippage and IMU drift in dead reckoning. After the first five lunar days, the rover travels 186.66 m from the
lander, according to the cross-site visual localization. The developed methods and results have been directly
utilized to support the mission’s operations. The maps and localization information are also valuable for
supporting multiple scientific explorations of the landing site.
Keywords Chang’e-4, Yutu-2 rover, landing site mapping, rover localization, descent images, rover images
Citation Liu Z Q, Di K C, Li J, et al. Landing site topographic mapping and rover localization for Chang’e-4
mission. Sci China Inf Sci, 2020, 63(4): 140901, https://doi.org/10.1007/s11432-019-2796-1
1 Introduction
The Chang’e-4 (CE-4) probe, comprising a lander and a rover, was successfully landed in Von Karman
crater in the South Pole-Aitken (SPA) basin on January 3, 2019. The rover Yutu-2 was separated from
the lander and started surface exploration on the same day, marking the first soft landing of a human
spacecraft on the far side of the Moon [1]. The SPA basin is the largest, deepest, and oldest impact basin
on the Moon [2], considered as having exposed the lunar mantle materials [3]. In situ explorations at
the landing site by the Yutu-2 rover can reveal the surface materials and evolution history of SPA [4–6],
thereby contributing in understanding the early history of the solar system.
High-precision topographic mapping of the landing site and localization of the rover are important
for the safe navigation and accomplishment of science and engineering objectives [7, 8]. Before the CE-4
mission, seven unmanned rovers had landed on and explored the surfaces of the Moon and Mars [9–15].
*Corresponding author (email: [email protected])

Liu Z Q, et al. Sci China Inf Sci April 2020 Vol. 63 140901:2
(a) (b) (c)
Figure 1 Descent images acquired at ∼4.0 km (a), ∼100 m (b) and ∼8 m (c) above the lunar surface.
Orbital and rover images were used to map the landing sites and areas traversed based on photogrammet-
ric mapping techniques. Many rover localization techniques, including onboard dead reckoning, visual
odometry, bundle adjustment, and feature matching between rover images and an orbital basemap, were
employed during different missions in varying scenarios [11–14, 16–18]. The mapping and localization
methods and products are critical for supporting teleoperation tasks such as obstacle avoidance and
rover path planning, as well as various scientific investigations.
To support the CE-4 mission operations and scientific explorations, landingsite topographic mapping
and rover localization were conducted at different scales and at different turnaround times using orbital,
descent, and rover images. This paper presents the techniques and results of landing site mapping and
rover localization for the CE-4 mission. The mapping and localization products directly guarantee the
success of surface operations, including safe traversing, efficient approach to science targets, and science
data acquisition, as well as supported topographic, geologic, and geochemical studies of the landing site
and Von Karman crater.
2 Data and methods
2.1 Data
Landing-site mapping and rover localization are based on orbital data, descent images, and rover images
(i.e., images taken by the rover’s navigation and panoramic cameras). The utilized reference systems
are similar to those defined in the Chang’e-3 mission, including the lunar body-fixed (LBF), landing site
local (LSL) and landing site cartographic coordinate (LSC) [14].
The orbital images and products, including the Chang’e-2 images and digital elevation model (DEM),
digital orthophoto map (DOM), lunar reconnaissance orbiter camera (LROC), narrow angle camera
(NAC) images, and SLDEM2015, were used for general analysis of the landing site and as basemaps for
lander and rover localization. Before the CE-4 landing, 100 LROC NAC images with a resolution of
∼1.0 m were used to generate a high-resolution seamless DOM with the assistance of SLDEM2015 [19].
As a back-up for the Chang’e-3, the Chang’e-4 lander carries a descent camera, with a field of view
(FOV) of 45.4◦ and the image size of 1024 × 1024 pixels [14, 20]. To transfer the data promptly, 59
selected descent images with a compression ratio of 1:64 were downlinked before the release of the rover
from the lander. After the rover-lander separation, ∼5300 descent images, compressed with a ratio of
1:8, were transferred. Figure 1 shows some descent images acquired at different altitudes above the lunar
surface.
The Yutu-2 rover hosts three pairs of stereo cameras, i.e., the navigation camera (Navcam), panoramic
camera (Pancam), and hazard avoidance camera (Hazcam). Navcam and Pancam are mounted on the
same camera bar of the rover mast, while Hazcam is fixed on the lower front of the rover body. Navcam
includes a stereo base of 270 mm, a focal length of 17.7 mm, an FOV of 46.6◦, and image size of 1024 ×
1024 pixels [14]. The rover stops at certain points (termed waypoints) taking images for in situ exploration
and path planning. Figure 2 shows stereo Navcam images taken at adjacent waypoints A’ and B’. Pancam
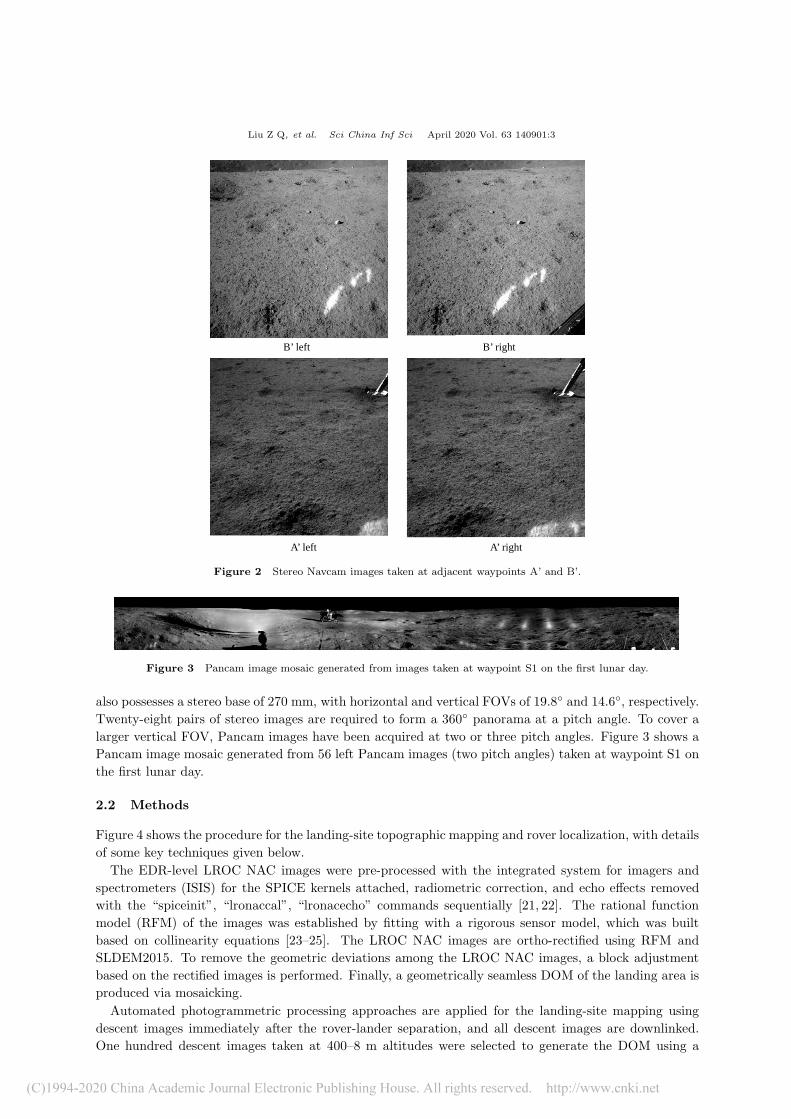
Liu Z Q, et al. Sci China Inf Sci April 2020 Vol. 63 140901:3
B’ left B’ right
A’ left A’ right
Figure 2 Stereo Navcam images taken at adjacent waypoints A’ and B’.
Figure 3 Pancam image mosaic generated from images taken at waypoint S1 on the first lunar day.
also possesses a stereo base of 270 mm, with horizontal and vertical FOVs of 19.8◦ and 14.6◦, respectively.
Twenty-eight pairs of stereo images are required to form a 360◦ panorama at a pitch angle. To cover a
larger vertical FOV, Pancam images have been acquired at two or three pitch angles. Figure 3 shows a
Pancam image mosaic generated from 56 left Pancam images (two pitch angles) taken at waypoint S1 on
the first lunar day.
2.2 Methods
Figure 4 shows the procedure for the landing-site topographic mapping and rover localization, with details
of some key techniques given below.
The EDR-level LROC NAC images were pre-processed with the integrated system for imagers and
spectrometers (ISIS) for the SPICE kernels attached, radiometric correction, and echo effects removed
with the “spiceinit”, “lronaccal”, “lronacecho” commands sequentially [21, 22]. The rational function
model (RFM) of the images was established by fitting with a rigorous sensor model, which was built
based on collinearity equations [23–25]. The LROC NAC images are ortho-rectified using RFM and
SLDEM2015. To remove the geometric deviations among the LROC NAC images, a block adjustment
based on the rectified images is performed. Finally, a geometrically seamless DOM of the landing area is
produced via mosaicking.
Automated photogrammetric processing approaches are applied for the landing-site mapping using
descent images immediately after the rover-lander separation, and all descent images are downlinked.
One hundred descent images taken at 400–8 m altitudes were selected to generate the DOM using a

Liu Z Q, et al. Sci China Inf Sci April 2020 Vol. 63 140901:4
Science target approaching
Path planningRover localization
Topographic analysis
DEM&DOM
Topographic mapping
Lander localization
Descent DOM
Context map
Orbital DOM
Orbital imagesDescent imagesIMU data Navcam images Pancam images
Figure 4 Procedure of landingsite topographic mapping and rover localization.
method similar to that used in CE-3 [14]. The DOM is used as a basemaps for rover localization and
path planning.
Along the traverse, the Yutu-2 rover acquired stereo images of full or partial (e.g., 60◦, 120◦) panoramic
views, using its Navcam at each waypoint, and full panoramic views, using Pancam at some waypoints.
The block bundle adjustment was implemented to refine the exterior orientation parameters of the Nav-
cam and Pancam images. The topographic products, including DEM and DOM, were generated using
photogrammetric processing techniques [14, 26] to support rover localization and path planning.
Three localization methods are employed to localize the rover, including dead-reckoning based on
the inertial measurement unit (IMU) and wheel odometer data, cross-site visual localization based on
Navcam images acquired at adjacent sites (waypoints), and the DOM matching method predicated on
DOMs generated from Navcam stereo and descent images [14].
3 Results
3.1 Landing site mapping
Figure 5 shows a seamless DOM generated from 100 LROC NAC images. The image size includes
57483 columns and 34084 rows, with a resolution of 0.9 m. The map covers a large area of ∼52 km ×
30 km and is suitable for context analysis, such as science exploration area definition. The DOM is also
used as a basemap complementary to the Chang’e-2 DOM1) in lander localization and long-term rover
traverse planning.
The resolutions of the descent images used in generating the DOM vary from 0.4 (at 400 m altitude)
to 0.01 m (at 10 m altitude). Figure 6 shows a DOM generated from descent images with a resampled
resolution of 0.1 m and covering an area of 348 m × 315 m. The resolution of the mosaic is enough
to identify craters and rock fragments larger than 1 m in diameter, making it suitable for highprecision
localization of the lander and rover as well as rover path planning.
3.2 Results of waypoint mapping
The Yutu-2 rover traversed 33 waypoints in five lunar days after its release from the lander. Topographic
products (DEM and DOM) were routinely generated quickly at each waypoint using Navcam images.
1) http://moon.bao.ac.cn/.

Liu Z Q, et al. Sci China Inf Sci April 2020 Vol. 63 140901:5
Figure 5 (Color online) Mosaiced DOM from LROC NAC with Lambert conformal conic projection in the CE-4 landing
site region.
Figure 6 (Color online) Descent image-generated DOM at the landing site (red point is the landing point).
The resolutions of the Navcam images range from 0.001 to 0.02 m at 1.0 to 20 m from rover. Figure 7
shows the DEM and DOM with 0.02 m resampled resolution generated from 18 Navcam stereo images
at waypoint D’, covering an area of 50 m × 32 m with elevation ranging from −2.34 to 0.56 m. The
DEM is used to produce slope, aspect, and obstacle maps to support rover path planning and scientific
investigations.
A DEM and a DOM are generated using 58 Pancam stereo images, covering an area of 50 m × 50 m
with a grid spacing of 0.02 m. Figure 8 displays a DEM and a perspective view of the DOM overlapped
on it. It illustrates that the rover is on a slope and near the rim of the 27-m-diameter crater (to the
north-east of waypoint D’), with many other small craters along the traverse.
3.3 Lander and rover localization results
Immediately after landing, the lander location is first determined by a radio tracking technique and then
refined by image feature matching and combined measurements from the descent camera, monitoring cam-
era images of the Chang’e-4 lander and DOMs from Chang’e-2 and LROC NAC images. Consequently,

Liu Z Q, et al. Sci China Inf Sci April 2020 Vol. 63 140901:6
(a)(b)
−2.34
Figure 7 (Color online) DEM (a) and DOM (b) generated from Navcam images taken at waypoint D’ (unit: m).
(a) (b)
Figure 8 (Color online) DEM (unit: m) (a) and 3D perspective view of the DOM (b) generated from the Pancam images
taken at S1.
the coordinates of the lander in the LROC NAC DOM are (177.588◦E, 45.457◦S) (Figure 9(a)) [27]. Fig-
ure 9(b) shows the lander (pointed by the larger arrow) and rover (pointed by the smaller arrow) location
observed directly in the LRO NAC image (M1303619844) acquired on February 1, 2019. According to
Figure 9(b), our lander and rover localization results are almost identical to the actual locations (green
points are waypoints, yellow line is rover traverse), indicating that our localization results are very precise.
Figure 10 shows the rover traverse map derived from the cross-site visual localization. The basemap
is a descent image mosaic of the landing site. All coordinates are converted to the LSC reference system
with origin at the lander. Along the traverse direction, X is defined as the first waypoint after the rover
departed from the lander, with S1, LE00210, LE00309, LE00402, and LE00506 being the waypoints where
the rover stayed dormant during lunar nights.
As of May 11, 2019, the Yutu-2 rover had traveled 190.66 m from the lander according to the dead-
reckoning method [28]. According to the cross-site visual localization method, the rover traveled 182.26 m
from waypoint X excluding the 4.4 m distance traveled from the lander to waypoint X. Therefore, the
overall distance traversed from the lander is 186.66 m after the first five lunar days. Previous research [29]
has reported that the cross-site visual localization yields an accuracy of 4%, which is much better than
the nominal localization accuracy of 15% from dead reckoning.

Liu Z Q, et al. Sci China Inf Sci April 2020 Vol. 63 140901:7
(a) (b)
Figure 9 (Color online) Lander localization and comparison with direct observation on LROC NAC image acquired CE-4
landed before (a) and after (b).
Figure 10 (Color online) Yutu-2 rover traverse map for the first five lunar days derived from cross-site visual localization
(unit: m).
4 Support of mission operations
4.1 Separation of the rover from the lander
After successful landing, the separation of the rover from the lander is a critical step, ensuring that
the rover safely lands on the lunar and starts the in situ exploration. Based on the determined lander
location, the topography and surface features are analyzed using the descent image mosaic. Figure 11
shows the context map of the landing site. Over 600 craters with diameters greater than 1.0 m are
mapped and measured. The context map is helpful for general planning of the rover-lander separation
and rover traverse.
The lander acquired a front view image using a monitoring camera, to support the rover-lander sepa-
ration. Before descending, the rover acquired stereo images atop the lander by using Navcam. However,
owing to the time constraint and communication bandwidth constraints, only the monitoring camera
image (see Figure 12(a)) is downlinked to the Earth control center before the command of separation is
made. Based on the monoscopic measurement technique, we measure the distance and size of the small

Liu Z Q, et al. Sci China Inf Sci April 2020 Vol. 63 140901:8
Figure 11 (Color online) Descent image mosaic (unit: m) and mapped craters.
(a) (b)
Figure 12 (Color online) Monoscopic measurement supporting the separation of the rover from the lander (the measure-
ment and analysis results of rover landed before (a) and after (b)).
crater in front of the rover and analyze the terrain and the communication blackout area. Figure 12(a)
shows the measurement and analysis results, including the distance to the front panel of the lander (white
dotted line), predicted trajectories of the rover wheels (red line), predicted shadow area on the rover’s
top panel (yellow area), and communication blackout area (blue area) at 18:00 on January 3, 2019. These
measurements directly support decision-making for rover-lander separation. Figure 12(b) shows another
monitoring camera image taken after the rover landed on the lunar surface.
4.2 Topographic analysis and path planning
Along the rover traverse, the Yutu-2 rover acquired stereo images at every waypoint using Navcam. Local
DEMs and DOMs with 0.02 m grid spacing are routinely generated at each waypoint using the Navcam
images. Based on the products, detailed topographic analyses, including slope calculation, and hazard
recognition, are conducted to support waypoint-to-waypoint path planning. Figure 13 shows the slope
and obstacle maps derived from the Navcam DEM. To match the size of the rover, the resolutions of
the slope and obstacle maps are designed as 0.3 m. Based on these maps, the rover path is generated
Liu Z Q, et al. Sci China Inf Sci April 2020 Vol. 63 140901:9
(a) (b)
Figure 13 (Color online) Slope (a) and obstacle (b) maps generated from Navcam DEM (unit: m).
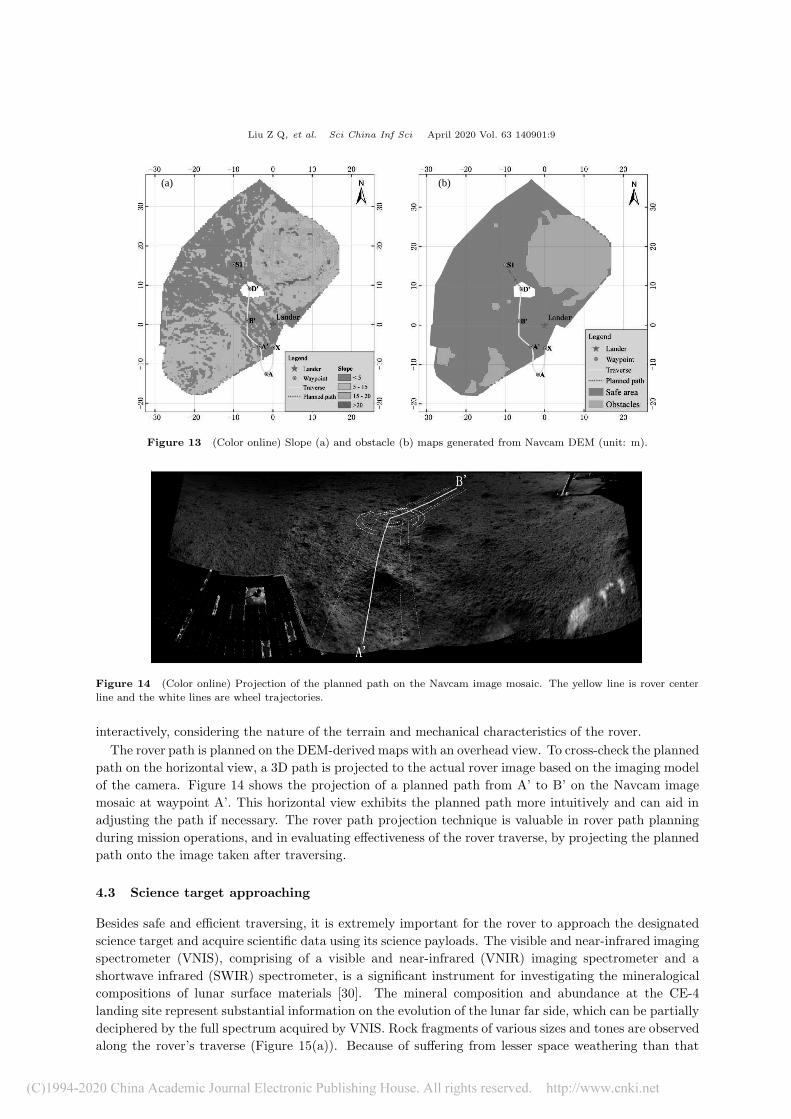
Figure 14 (Color online) Projection of the planned path on the Navcam image mosaic. The yellow line is rover center
line and the white lines are wheel trajectories.
interactively, considering the nature of the terrain and mechanical characteristics of the rover.
The rover path is planned on the DEM-derived maps with an overhead view. To cross-check the planned
path on the horizontal view, a 3D path is projected to the actual rover image based on the imaging model
of the camera. Figure 14 shows the projection of a planned path from A’ to B’ on the Navcam image
mosaic at waypoint A’. This horizontal view exhibits the planned path more intuitively and can aid in
adjusting the path if necessary. The rover path projection technique is valuable in rover path planning
during mission operations, and in evaluating effectiveness of the rover traverse, by projecting the planned
path onto the image taken after traversing.
4.3 Science target approaching
Besides safe and efficient traversing, it is extremely important for the rover to approach the designated
science target and acquire scientific data using its science payloads. The visible and near-infrared imaging
spectrometer (VNIS), comprising of a visible and near-infrared (VNIR) imaging spectrometer and a
shortwave infrared (SWIR) spectrometer, is a significant instrument for investigating the mineralogical
compositions of lunar surface materials [30]. The mineral composition and abundance at the CE-4
landing site represent substantial information on the evolution of the lunar far side, which can be partially
deciphered by the full spectrum acquired by VNIS. Rock fragments of various sizes and tones are observed
along the rover’s traverse (Figure 15(a)). Because of suffering from lesser space weathering than that

Liu Z Q, et al. Sci China Inf Sci April 2020 Vol. 63 140901:10
(a) (b)
(c) (d)
Figure 15 (Color online) (a) Rocks identified on the Navcam image at LE00301; (b) predicted VNIS FOVs from the
Navcam image at LE00301; (c) predicted VNIS FOVs from the Hascam image at LE00302; (d) image obtained by VNIS at
LE00303 (the circle corresponds to the SWIR FOV).
of the regolith, the compositions of these rocks are valuable for verifying previous observations that the
SPA basin penetrats the lunar crust and exposes its mantle material [3] and that the mantle contains
abundant olivine and pyroxene [31]. Hence, examining appropriate rocks using VNIS is very important.
Because VNIS is fixed on the front panel of the rover and the FOVs of the VNIR and SWIR spectra
are small (8.5◦ and 3.6◦ respectively) [32], approaching and pointing the science target depend on the
position and orientation of the rover. This makes approaching the target very challenging, especially for
approaching a small rock and pointing to its location. We develop another projection tool for predicting
the FOVs on the rover images, enhancing path planning capability. Here, we present an example of how
a rock is approached for in situ exploration.
At waypoint LE00301 (Figure 15(a)), rock fragments of different sizes are observed, with scientists
interested in obtaining VNIR and SWIR data for a representative rock. An initial path is planned for
the rover to approach the designated rock, by defining LE00302 as the next waypoint. The VNIS FOVs
are predicted on the Navcam image at LE00301 to reveal what the VNIS directs observation when the
rover moves to LE00302 (Figure 15(b)). This helps in adjusting and finalizing the path planning between
LE00301 and LE00302. After the approaching drive, the rock is in the FOV of the VNIR, but the
FOV of SWIR is not optimal. Thus, a short drive (a few centimeters) is planned and the FOVs are
predicted from the Hazcam image at LE00302, showing the part of the rock exposed to the VNIS after
the short drive (Figure 15(c)). Finally, the rover achieves the final drive of this target-approaching task,
and subsequently, acquires VNIR and SWIR data. Figure 15(d) shows the acquired VNIR image and
the FOV of SWIR, indicating that the science target approaching is implemented. The VNIR and SWIR
data of the rock contribute significantly to the mineralogical study of the landing site.

Liu Z Q, et al. Sci China Inf Sci April 2020 Vol. 63 140901:11
5 Conclusion
This paper summarizes the techniques and results of landing-site mapping and rover localization in the
CE-4 mission based on the orbital, descent, and rover images. A seamless DOM mosaic of the landing-
site region with a resolution 0.9 m was produced before the CE-4 launch. The DOM was used as a
basemap, complementing the Chang’e-2 DOM and DEM in support of the mission. The lander was
localized using an image feature-matching method, involving descent images and orbital basemaps, im-
mediately after CE-4 landing. The lander location was determined as (177.588◦E, 45.457◦S). Meanwhile, a
0.1-m resolution image mosaic of the landing site was produced using descent images. This high-precision
image mosaic was used for contextual analyses and supporting the rover traverse planning. Along the
rover traverse, 0.02-m-resolution local DEMs were automatically generated from Navcam stereo images,
with slope and obstacle maps were derived to support the rover path planning at each waypoint. Cross-
site visual localization was routinely applied to localize the rover at each waypoint based on image feature
matching and bundle adjustment of Navcam images for adjacent waypoints. By the end of the first five
lunar days, the distance traveled by the rover from the lander was 190.66 m from the wheel odometer,
and 188.06 m from visual localization.
The developed methods and the results were directly utilized to support mission operations at the
Beijing Aerospace Control Center. As the Yutu-2 continues exploring the far side of the Moon, the
mapping and localization techniques are routinely employed to ensure safe traversing and efficient data
acquisition. The maps and localization information also support scientific exploration of the landing site
and Von Karman crater.
Acknowledgements This work was supported in part by Key Research Program of the Chinese Academy of Sciences
(Grant No. XDPB11), National Natural Science Foundation of China (Grant Nos. 41671458, 41590851, 41941003). We
thank the Lunar and Deep Space Exploration Science Applications Center of the National Astronomical Observatory for
providing the Pancam images and VNIS data.
References
1 Wu W R, Li C L, Zuo W, et al. Lunar farside to be explored by Chang’e-4. Nat Geosci, 2019, 12: 222–223
2 Petro N E, Pieters C M. Surviving the heavy bombardment: ancient material at the surface of South Pole-Aitken
basin. J Geophys Res, 2004, 109: 4
3 Melosh H J, Kendall J, Horgan B, et al. South Pole-Aitken basin ejecta reveal the Moon’s upper mantle. Geology,
2017, 45: 1063–1066
4 Li C L, Liu D W, Liu B, et al. Chang’e-4 initial spectroscopic identification of lunar far-side mantle-derived materials.
Nature, 2019, 569: 378–382
5 Hu X, Ma P, Yang Y, et al. Mineral abundances inferred from in-situ reflectance measurements of Chang’e-4 landing
site in South Pole-Aitken basin. Geophys Res Lett, 2019, 46: 9439–9447
6 Gou S, Di K, Yue Z, et al. Lunar deep materials observed by Chang’e-4 rover. Earth Planet Sci Lett, 2019, 528:
115829
7 Li R X, Squyres S W, Arvidson R E, et al. Initial results of rover localization and topographic mapping for the 2003
Mars Exploration Rover mission. Photogramm Eng Remote Sens, 2005, 71: 1129–1142
8 Arvidson R E, Anderson R, Bartlett P, et al. Localization and physical properties experiments conducted by spirit at
Gusev Crater. Science, 2004, 305: 821–824
9 Zakrajsek J, McKissock D, Woytach J, et al. Exploration rover concepts and development challenges. In: Proceedings
of the 1st Space Exploration Conference: Continuing the Voyage of Discovery, Orlando, 2005. 1–23
10 Golombek M P, Anderson R C, Barnes J R, et al. Overview of the Mars Pathfinder Mission: launch through landing,
surface operations, data sets, and science results. J Geophys Res, 1999, 104: 8523–8553
11 Li R X, Archinal B A, Arvidson R E, et al. Spirit rover localization and topographic mapping at the landing site of
Gusev crater, Mars. J Geophys Res, 2006, 111: 6
12 Li R X, Arvidson R E, Di K C, et al. Opportunity rover localization and topographic mapping at the landing site of
Meridiani Planum, Mars. J Geophys Res, 2007, 112: 90
13 Di K C, Xu F L, Wang J, et al. Photogrammetric processing of rover imagery of the 2003 Mars Exploration Rover
mission. ISPRS J Photogrammetry Remote Sens, 2008, 63: 181–201
14 Liu Z Q, Di K C, Peng M, et al. High precision landing site mapping and rover localization for Chang’e-3 mission. Sci
China Phys Mech Astron, 2015, 58: 019601
15 NASA. Where is Curiosity? 2019. https://mars.nasa.gov/msl/mission/whereistherovernow/
16 Cheng Y, Maimone M W, Matthies L. Visual odometry on the Mars Exploration Rovers-a tool to ensure accurate
driving and science imaging. IEEE Robot Automat Mag, 2006, 13: 54–62

Liu Z Q, et al. Sci China Inf Sci April 2020 Vol. 63 140901:12
17 Maimone M, Cheng Y, Matthies L. Two years of visual odometry on the Mars Exploration Rovers. J Field Robotics,
2007, 24: 169–186
18 Di K C, Liu Z Q, Yue Z Y. Mars rover localization based on feature matching between ground and orbital imagery.
Photogramm Eng Remote Sens, 2011, 77: 781–791
19 Barker M K, Mazarico E, Neumann G A, et al. A new lunar digital elevation model from the lunar orbiter laser
altimeter and SELENE terrain camera. Icarus, 2016, 273: 346–355
20 Wan W, Liu Z, Di K, et al. A cross-site visual localization method for Yutu rover. In: Proceedings of ISPRS 2014
Technical Commission IV Symposium, Suzhou, 2014. 279–284
21 NAIF. Lunar reconnaissance orbiter camera (LROC) instrument kernel v18. 2014. http://naif.jpl.nasa.gov/pub/naif/
pds/data/lro-l-spice-6-v1.0/lrosp 1000
22 Henriksen M R, Manheim M R, Speyerer E J, et al. Extracting accurate and precise topography from LROC narrow
angle camera stereo observations. Int Arch Photogramm Remote Sens Spatial Inf Sci, 2016, XLI-B4: 397–403
23 Di K C, Xu B, Liu B, et al. Geopositioning precision analysis of multiple image triangulation using LRO NAC lunar
images. Int Arch Photogramm Remote Sens Spatial Inf Sci, 2016, XLI-B4: 369–374
24 Liu B, Xu B, Di K C, et al. A solution to low RFM fitting precision of planetary orbiter images caused by exposure
time changing. Int Arch Photogramm Remote Sens Spatial Inf Sci, 2016, XLI-B4: 441–448
25 Liu B, Jia M N, Di K N, et al. Geopositioning precision analysis of multiple image triangulation using LROC NAC
lunar images. Planet Space Sci, 2018, 162: 20–30
26 Peng M, Wan W H, Wu K, et al. Topographic mapping capbility analysis of Chang’e-3 Navcam stereo images and 3D
terrain reconstruction for mission operations (in Chinese). J Remote Sens, 2014, 18: 995–1002
27 Di K C, Liu Z Q, Liu B, et al. Chang’e-4 lander localization based on multi-source data. J Remote Sens, 2019, 23:
177–180
28 CLEP. Rover and lander of Chang’e-4 have finished the work of the first five lunar days. 2019. http://www.clep.org.
cn/n5982341/c6806279/content.html
29 Wan W H. Theory and Methods of Stereo Vision Based Autonomous Rover Localization in Deep Space Exploration.
Dissertation for Ph.D. Degree. Beijing: Chinese Academy of Sciences, 2012
30 Jia Y, Zou Y, Ping J, et al. The scientific objectives and payloads of Chang’e-4 mission. Planet Space Sci, 2018, 162:
207–215
31 Wieczorek M A, Jolliff B, Khan A, et al. The constitution and structure of the lunar interior. Rev Mineral Geochem,
2006, 60: 221–364
32 He Z P, Wang B Y, Lv G, et al. Visible and near-infrared imaging spectrometer and its preliminary results from the
Chang’e 3 project. Rev Sci Instruments, 2014, 85: 083104