A NEW APPROACH FOR DISCOVERING TOP-K ...
13
JAISCR, 2015, Vol. 5, No. 2, pp. 141 A NEW APPROACH FOR DISCOVERING TOP-K SEQUENTIAL PATTERNS BASED ON THE VARIETY OF ITEMS Shigeaki Sakurai 1 , Minoru Nishizawa 2 1 Big Data Cloud Technology Center, Toshiba Corporation Cloud & Solutions Company, 72-34, Horikawa-cho, Saiwai-ku, Kawasaki 212-8585, Japan 2 Advanced IT Research and Development Center, Toshiba Solutions Company, 3-22, Katamachi, Fuchu, Tokyo 183-8512, Japan Abstract This paper proposes a method that discovers various sequential patterns from sequential data. The sequential data is a set of sequences. Each sequence is a row of item sets. Many previous methods discover frequent sequential patterns from the data. However, the patterns tend to be similar to each other because they are composed of limited items. The patterns do not always correspond to the interests of analysts. Therefore, this paper tackles on the issue discovering various sequential patterns. The proposed method decides redundant sequential patterns by evaluating the variety of items and deletes them based on three kinds of delete processes. It can discover various sequential patterns within the upper bound for the number of sequential patterns given by the analysts. This paper applies the method to the synthetic sequential data which is characterized by number of items, their kind, and length of sequence. The effect of the method is verified through numerical experiments. 1 Introduction Owing to the progress of computer environ- ments and network environments, we can easily collect and store large amount of data which is re- cently called Big Data. We highly anticipate the progress of the analysis techniques for the data be- cause new and unknown knowledge is buried in the data. Recently, the trend for the data analysis is ac- celerating more and more. Many companies and organizations aggressively strive for both use and application of the data. Many promising analysis techniques and examples are generated. Big Data are composed of various types of data. Especially, it is predicted that the data generated form M2M (Machine to Machine) field and life log field explosively increases. That is, the rapid ex- pansion of sequential data can be predicted. In the data mining research field, the analysis techniques for the sequential data has evolved from the discov- ery task of sequential patterns. The patterns are dis- covered from the sequential data where the data is composed of rows of discrete item sets. In the ini- tial research, the discovery task aims at dealing with the data in the retail field. The item represents each sales item bought by customers. Recently, the ap- plication fields for the task are widely expanding. For example, an application field regards a word ex- tracted from a text document as an item and a row of the words in the document as a sequence. Also, an- other application filed deals with discretized med- ical examination values collected from periodical medical examination. In addition, the other appli- – 153 10.1515/jaiscr-2015-0025 Brought to you by | Uniwersytet Jagiellonski Authenticated Download Date | 5/23/16 12:49 PM
-
Upload
khangminh22 -
Category
Documents
-
view
5 -
download
0
Transcript of A NEW APPROACH FOR DISCOVERING TOP-K ...

JAISCR, 2015, Vol. 5, No. 2, pp. 141
A NEW APPROACH FOR DISCOVERING TOP-KSEQUENTIAL PATTERNS BASED ON THE VARIETY OF
ITEMS
Shigeaki Sakurai1, Minoru Nishizawa2
1Big Data Cloud Technology Center, Toshiba Corporation Cloud & Solutions Company,72-34, Horikawa-cho, Saiwai-ku, Kawasaki 212-8585, Japan
2Advanced IT Research and Development Center, Toshiba Solutions Company,3-22, Katamachi, Fuchu, Tokyo 183-8512, Japan
Abstract
This paper proposes a method that discovers various sequential patterns from sequentialdata. The sequential data is a set of sequences. Each sequence is a row of item sets.Many previous methods discover frequent sequential patterns from the data. However,the patterns tend to be similar to each other because they are composed of limited items.The patterns do not always correspond to the interests of analysts. Therefore, this papertackles on the issue discovering various sequential patterns. The proposed method decidesredundant sequential patterns by evaluating the variety of items and deletes them basedon three kinds of delete processes. It can discover various sequential patterns within theupper bound for the number of sequential patterns given by the analysts. This paperapplies the method to the synthetic sequential data which is characterized by number ofitems, their kind, and length of sequence. The effect of the method is verified throughnumerical experiments.
1 Introduction
Owing to the progress of computer environ-ments and network environments, we can easilycollect and store large amount of data which is re-cently called Big Data. We highly anticipate theprogress of the analysis techniques for the data be-cause new and unknown knowledge is buried in thedata. Recently, the trend for the data analysis is ac-celerating more and more. Many companies andorganizations aggressively strive for both use andapplication of the data. Many promising analysistechniques and examples are generated.
Big Data are composed of various types of data.Especially, it is predicted that the data generatedform M2M (Machine to Machine) field and life log
field explosively increases. That is, the rapid ex-pansion of sequential data can be predicted. In thedata mining research field, the analysis techniquesfor the sequential data has evolved from the discov-ery task of sequential patterns. The patterns are dis-covered from the sequential data where the data iscomposed of rows of discrete item sets. In the ini-tial research, the discovery task aims at dealing withthe data in the retail field. The item represents eachsales item bought by customers. Recently, the ap-plication fields for the task are widely expanding.For example, an application field regards a word ex-tracted from a text document as an item and a row ofthe words in the document as a sequence. Also, an-other application filed deals with discretized med-ical examination values collected from periodicalmedical examination. In addition, the other appli-
– 15310.1515/jaiscr-2015-0025
Brought to you by | Uniwersytet JagiellonskiAuthenticated
Download Date | 5/23/16 12:49 PM

142 Shigeaki Sakurai, Minoru Nishizawa
cation field deals with log data automatically sentfrom machines to machines. Various sequentialdata are generated from various application fields.
On the other hand, the initial pattern discoverymethods try to discover all frequent sequential pat-terns by comparing their supports with the mini-mum support. Here, the support is an evaluationcriterion for sequential patterns and the minimumsupport is a threshold given by analysts. However,the analysts cannot always give an appropriate min-imum support because the number of frequent se-quential patterns depends on the sequential data andthe support cannot easily control the number. Thus,[17] proposes a method that gives the maximumnumber of sequential patterns as a threshold. Themethod discovers only frequent sequential patternswhich are not included in other sequential patterns.They are called closed sequential patterns. Themethod can avoid the discovery of redundant se-quential patterns to some extent. Also, it can avoidthe explosion of the number of discovered sequen-tial patterns.
Even if the method proposed by [17] can dis-cover the patterns within appropriate number, ittends to discover many similar sequential patterns.That is, it discovers patterns composed of differentcombinations of the same items or different ordersof appearance for the same items. This is becausethe method refers to only the frequencies of the se-quential patterns. In the case of the sequential datacollected from real world, the data usually includesnoise. Therefore, the slight difference among se-quential patterns is not important, because the dif-ference reflects on the noise and the patterns can beinterpreted as the sequential pattern with the samemeaning. The analysts are not always interested inmany similar sequential patterns. It is necessary forthe discovery method to extract sequential patternscomposed of various items.
Thus, this paper proposes a new method thataims at discovering various sequential patternswithin top-k in the ranking of sequential patterns.The ranking can be decided by referring to boththe minimum support and the item distribution. Inthe following sections, Section 2 defines the se-quential data and the sequential patterns for thisresearch. Section 3 shortly introduces the discov-ery method of all frequent sequential patterns [1].Section 4 proposes upper pattern constraints and
three delete processes for redundant sequential pat-terns. The constraints realize to discover varioussequential patterns within top-k. Section 5 appliesthe proposed method into synthetic sequential dataand verifies the effect of the proposed method. Sec-tion 6 discusses some researches related to this re-search. Lastly, Section 6 summarizes this paper anddiscuses future works.
2 Sequential data and sequentialpattern
This paper deals with sequential data composedof sequentially arranged item sets. In the case ofthe retail field, each item represents a sales item de-scribed in a receipt. The set of the sales items inthe receipt corresponds to the item set. Receipts aregathered for each customer. They are sequentiallyarranged according to their date. They are regardedas a sequence in the sequential data. The model-ing method assumes that some same items are notincluded in an item set. It does not take considera-tion into the number of the sales. Also, it does notuse additional information such as the price and thediscount rate.
On the other hand, a sequential pattern is a char-acteristic row of item sets extracted from the se-quential data. The discovery method needs evalua-tion criteria for characteristic rows in order to iden-tify them. Some representative evaluation criteriaare defined. In advance of the definition for the cri-teria, this section explains the concept of the inclu-sion.
Let two sequences s1 (= (l11, l12, · · · , l1n1 )) ands2 (= (l21, l22, · · · , l2n2)) be given. If the conditionas shown in Formula (1) is satisfied, s1 includes s2and the relation is described by s2 ⊆ s1. Here, li j isthe j-th item set composing the i-th sequence, nk isthe number of item sets included in sk. The numberis called the length.
∃y = {y1,y2, · · · ,yn2}y1 < y2 < · · ·< yn2
l21 ⊆ l1y1 , l22 ⊆ l1y2 , · · · , l2n2 ⊆ l1yn2
(1)
For example, let a sequence sA composed ofthree receipts for the customer “A” be given asshown in Example 1. In this example, items in-
Brought to you by | Uniwersytet JagiellonskiAuthenticated
Download Date | 5/23/16 12:49 PM

143Shigeaki Sakurai, Minoru Nishizawa
cation field deals with log data automatically sentfrom machines to machines. Various sequentialdata are generated from various application fields.
On the other hand, the initial pattern discoverymethods try to discover all frequent sequential pat-terns by comparing their supports with the mini-mum support. Here, the support is an evaluationcriterion for sequential patterns and the minimumsupport is a threshold given by analysts. However,the analysts cannot always give an appropriate min-imum support because the number of frequent se-quential patterns depends on the sequential data andthe support cannot easily control the number. Thus,[17] proposes a method that gives the maximumnumber of sequential patterns as a threshold. Themethod discovers only frequent sequential patternswhich are not included in other sequential patterns.They are called closed sequential patterns. Themethod can avoid the discovery of redundant se-quential patterns to some extent. Also, it can avoidthe explosion of the number of discovered sequen-tial patterns.
Even if the method proposed by [17] can dis-cover the patterns within appropriate number, ittends to discover many similar sequential patterns.That is, it discovers patterns composed of differentcombinations of the same items or different ordersof appearance for the same items. This is becausethe method refers to only the frequencies of the se-quential patterns. In the case of the sequential datacollected from real world, the data usually includesnoise. Therefore, the slight difference among se-quential patterns is not important, because the dif-ference reflects on the noise and the patterns can beinterpreted as the sequential pattern with the samemeaning. The analysts are not always interested inmany similar sequential patterns. It is necessary forthe discovery method to extract sequential patternscomposed of various items.
Thus, this paper proposes a new method thataims at discovering various sequential patternswithin top-k in the ranking of sequential patterns.The ranking can be decided by referring to boththe minimum support and the item distribution. Inthe following sections, Section 2 defines the se-quential data and the sequential patterns for thisresearch. Section 3 shortly introduces the discov-ery method of all frequent sequential patterns [1].Section 4 proposes upper pattern constraints and
three delete processes for redundant sequential pat-terns. The constraints realize to discover varioussequential patterns within top-k. Section 5 appliesthe proposed method into synthetic sequential dataand verifies the effect of the proposed method. Sec-tion 6 discusses some researches related to this re-search. Lastly, Section 6 summarizes this paper anddiscuses future works.
2 Sequential data and sequentialpattern
This paper deals with sequential data composedof sequentially arranged item sets. In the case ofthe retail field, each item represents a sales item de-scribed in a receipt. The set of the sales items inthe receipt corresponds to the item set. Receipts aregathered for each customer. They are sequentiallyarranged according to their date. They are regardedas a sequence in the sequential data. The model-ing method assumes that some same items are notincluded in an item set. It does not take considera-tion into the number of the sales. Also, it does notuse additional information such as the price and thediscount rate.
On the other hand, a sequential pattern is a char-acteristic row of item sets extracted from the se-quential data. The discovery method needs evalua-tion criteria for characteristic rows in order to iden-tify them. Some representative evaluation criteriaare defined. In advance of the definition for the cri-teria, this section explains the concept of the inclu-sion.
Let two sequences s1 (= (l11, l12, · · · , l1n1 )) ands2 (= (l21, l22, · · · , l2n2)) be given. If the conditionas shown in Formula (1) is satisfied, s1 includes s2and the relation is described by s2 ⊆ s1. Here, li j isthe j-th item set composing the i-th sequence, nk isthe number of item sets included in sk. The numberis called the length.
∃y = {y1,y2, · · · ,yn2}y1 < y2 < · · ·< yn2
l21 ⊆ l1y1 , l22 ⊆ l1y2 , · · · , l2n2 ⊆ l1yn2
(1)
For example, let a sequence sA composed ofthree receipts for the customer “A” be given asshown in Example 1. In this example, items in-
A NEW APPROACH FOR DISCOVERING . . .
cluded in the same item set are grouped by thesymbols “{ ”and “}”. Different item sets are sep-arated by the symbol “→”. That is, this examplerepresents that the customer “A” buys three salesitems: “egg”, “butter”, and “bread” at the first day,he/she buys two sales items: “cereal” and “milk” atthe second day, and he/she buys three sales items:“rice”, “natto”, and “egg” at the third day.
Example 1:{egg,butter,bread}→
{cereal,milk}→ {rice,natto,egg}
Next, let five sequences (sB ∼ sF ) for other cus-tomers “B” ∼ “F” be given as shown in Table 1. Inthe case of the customer “B”, the first, the second,and the third item set comprising the sequence sB
are subsets of the first, the second, and the third itemset composing the sequence sA, respectively. There-fore, the sequence sB is included in the sequence sA.Similarly, the first item set for the sequence sC is asubset of the first item set for the sequence sA andthe second item set for sC is a subset of the thirditem set for sA. Therefore, sC is included in sA. Wenote that the inclusion relation is satisfied even ifthe second item set for sA does not correspond toany item sets in sC.
In the case of the sequence sD, the first item setfor sD is not a subset of all item sets for sA. sD isnot included in sA. Similarly the item “jam” whichis a member of the first item set for the sequence sE
does not appear in sA. sE is not included in sA.
On the other hand, in the case of the sequencesF , the first item set for sF is a subset of the thirditem set for sA. The second item set for sF is a sub-set of the second item set sA. However, the orderof appearance in each sequence is not equal to eachother. sF is not include in sA.
Table 1. Sales item log
ID SequencesB {egg, bread} → {cereal, milk} → {natto}sC {butter, bread} → {rice, egg}sD {egg, butter, bread, cereal} →
{milk} → {egg}sE {egg, jam, bread} → {cereal, milk}sF {rice, natto, egg} → {cereal, milk}
Based on the inclusion relation between se-quences, the discovery method calculates the fre-quency of each sequential patterns by counting upthe number of sequences including it. The methodcalculates evaluation criteria of sequential patternsby referring to the frequency. Two representativecriteria: support and confidence are defined by For-mula (2) and Formula (3).
supp(s) =the number of sequences including s
the number of total sequences(2)
conf(s|sp) =the number of sequences including sthe number of sequences including sp
(3)Here, s is a sequential pattern and sp is a sequen-tial subpattern included in s. The support repre-sents relative frequency of sequential patterns. Theconfidence represents conditional probability con-ditioned by the subpattern sp. If we regard sp as apremise part, the remaining part s− sp excluding sp
from s is regarded as a result part of an inferencerule. We can use inference rules with high confi-dence in order to predict the result parts. For exam-ple, if many customers buy “bread” at one day andmost of them do “milk” at next day, the confidenceconf({bread}→{milk}|{bread}) is big. We can ac-quire such an inference rule that the premise part is{bread} and the result part is {milk}. By using theinference rule, we can predict that a customer buys“milk” at next day when he/she buys “bread”.
3 The discovery method of sequen-tial patterns
Many discovery method of sequential patternshave been proposed [1][3][14][19]. Most of themefficiently discover all sequential patterns whosesupports are larger than or equal to the minimumsupport. The property shows that the evaluationcriterion of sequential patterns monotonically de-creases as the sequential patterns grow. The infer-ence rules with high confidence are extracted fromthe discovered patterns. This is because the sup-ports satisfies the Apriori property but the confi-dence does not satisfy it. The property is an impor-tant property for the efficient discovery of sequen-tial patterns. This paper shortly explains the methodbased on the candidate [1] because the method caneasily evaluate the variety of items.
Brought to you by | Uniwersytet JagiellonskiAuthenticated
Download Date | 5/23/16 12:49 PM

144 Shigeaki Sakurai, Minoru Nishizawa
Firstly, the discovery method based on the can-didate calculates frequency of each item included inthe sequential data. It calculates the support of eachitem by referring to the frequency. If the supportis larger than or equal to the minimum support, theitem is regarded as a frequent item. All items areevaluated their supports in order. The method candiscover all frequent items. Each frequent item iscalled a first frequent item set. Next, the methodpicks up two first frequent item sets and generates acandidate item set whose number of items is 2. Forexample, let two first frequent item sets: {egg} and{butter} be given. The method generates a candi-date as shown in Example 2.
Example 2: {egg,butter}
The method calculates the support for the can-didate. If the support is larger than or equal to theminimum support, the candidate is a second fre-quent item set. All second frequent item sets arediscovered by all the combinations of two first fre-quent item sets.
Next, the method combines two second fre-quent item sets satisfying such a condition that thetop items of each second frequent item sets areequal to each other. It generates a candidate item setwhose number of items is 3. The candidate is com-posed of the top item and two remaining items. Forexample, let two second frequent item sets: {egg,butter} and {egg, bread} be given. The top itemsof each second frequent item set are “egg” and areequal to each other. The method generates a candi-date as shown in Example 3.
Example 3: {egg,butter,bread}
The method calculates the support for the can-didate. If the support is larger than or equal to theminimum support, the candidate is a third frequentitem set. All third frequent item sets are discoveredby all the combinations of two second frequent itemsets satisfying the condition. The Apriori propertyguarantees that the generation based on the condi-tion leads to all frequent third item sets.
Generally, the method combines two i-th fre-quent item sets satisfying such a condition that theremaining items except the last item are equal toeach other for the i-th frequent item sets. It gen-
erates a candidate item set whose number of itemsis i+1. The candidate is composed of i-1 commonitems and two last items. Figure 1 shows the outlineof the generation. In this figure, each circle showsan item and its texture does a kind for the item. Themethod calculates the support for the candidate. Ifthe support is larger than or equal to the minimumsupport, the candidate is a (i+1)-th frequent itemset. All (i+1)-th frequent item sets are discovered byevaluating all the combinations of two i-th frequentitem sets satisfying the condition. Each discoveredfrequent item set is one of first frequent sequentialpatterns.
Figure 1. Generation of a candidate item set
After the discovery of all first frequent sequen-tial patterns, the method expands patterns at the se-quential direction. That is, the method picks up twofirst sequential patterns. It arranges two patterns inorder and generates two candidates whose length is2. For example, let two first frequent sequentialpatterns: {egg} and {cereal, milk} be given. Themethod can generate two candidates as shown inExample 4 and Example 5 by changing the orderof appearance.
Example 4: {egg}→ {cereal,milk}
Example 5: {cereal,milk}→ {egg}
Each candidate is calculated its support. Themethod judges whether each candidate is frequentor not, respectively. Frequent candidates are secondfrequent sequential patterns.
The method combines two second frequent se-quential patterns satisfying such a condition that thetop item sets of each second frequent sequential pat-tern are equal to each other. It generates two can-
Brought to you by | Uniwersytet JagiellonskiAuthenticated
Download Date | 5/23/16 12:49 PM

145Shigeaki Sakurai, Minoru Nishizawa
Firstly, the discovery method based on the can-didate calculates frequency of each item included inthe sequential data. It calculates the support of eachitem by referring to the frequency. If the supportis larger than or equal to the minimum support, theitem is regarded as a frequent item. All items areevaluated their supports in order. The method candiscover all frequent items. Each frequent item iscalled a first frequent item set. Next, the methodpicks up two first frequent item sets and generates acandidate item set whose number of items is 2. Forexample, let two first frequent item sets: {egg} and{butter} be given. The method generates a candi-date as shown in Example 2.
Example 2: {egg,butter}
The method calculates the support for the can-didate. If the support is larger than or equal to theminimum support, the candidate is a second fre-quent item set. All second frequent item sets arediscovered by all the combinations of two first fre-quent item sets.
Next, the method combines two second fre-quent item sets satisfying such a condition that thetop items of each second frequent item sets areequal to each other. It generates a candidate item setwhose number of items is 3. The candidate is com-posed of the top item and two remaining items. Forexample, let two second frequent item sets: {egg,butter} and {egg, bread} be given. The top itemsof each second frequent item set are “egg” and areequal to each other. The method generates a candi-date as shown in Example 3.
Example 3: {egg,butter,bread}
The method calculates the support for the can-didate. If the support is larger than or equal to theminimum support, the candidate is a third frequentitem set. All third frequent item sets are discoveredby all the combinations of two second frequent itemsets satisfying the condition. The Apriori propertyguarantees that the generation based on the condi-tion leads to all frequent third item sets.
Generally, the method combines two i-th fre-quent item sets satisfying such a condition that theremaining items except the last item are equal toeach other for the i-th frequent item sets. It gen-
erates a candidate item set whose number of itemsis i+1. The candidate is composed of i-1 commonitems and two last items. Figure 1 shows the outlineof the generation. In this figure, each circle showsan item and its texture does a kind for the item. Themethod calculates the support for the candidate. Ifthe support is larger than or equal to the minimumsupport, the candidate is a (i+1)-th frequent itemset. All (i+1)-th frequent item sets are discovered byevaluating all the combinations of two i-th frequentitem sets satisfying the condition. Each discoveredfrequent item set is one of first frequent sequentialpatterns.
Figure 1. Generation of a candidate item set
After the discovery of all first frequent sequen-tial patterns, the method expands patterns at the se-quential direction. That is, the method picks up twofirst sequential patterns. It arranges two patterns inorder and generates two candidates whose length is2. For example, let two first frequent sequentialpatterns: {egg} and {cereal, milk} be given. Themethod can generate two candidates as shown inExample 4 and Example 5 by changing the orderof appearance.
Example 4: {egg}→ {cereal,milk}
Example 5: {cereal,milk}→ {egg}
Each candidate is calculated its support. Themethod judges whether each candidate is frequentor not, respectively. Frequent candidates are secondfrequent sequential patterns.
The method combines two second frequent se-quential patterns satisfying such a condition that thetop item sets of each second frequent sequential pat-tern are equal to each other. It generates two can-
A NEW APPROACH FOR DISCOVERING . . .
didates whose length is 3. Each candidate is com-posed of the top item set and two remaining itemsets. The method can generate two candidates bychanging the order of appearance for the remainingitem sets. For example, let two second frequent se-quential patterns {egg}→ {cereal, milk} and {egg}→ {natto} be given. The method can generate twocandidates as shown in Example 6 and Example 7.
Example 6: {egg}→ {cereal,milk}→ {natto}
Example 7: {egg}→ {natto}→ {cereal,milk}
Generally, the method generates two candidateswhose length is j+1 by combining two j-th frequentsequential patterns. The patterns satisfy such a con-dition that the subpatterns except the last item setare equal to each other. Each candidate is composedof the common subpattern and two last item sets.Figure 2 shows the outline of the generation. In thisfigure, each item set in a sequence is separated byarrow lines. The method can generate another can-didate by changing the order of appearance for thelast item sets. We note that the method can pick uptwo same j-th frequent sequential patterns. In thiscase, a candidate is generated because the change ofthe order leads to the same candidate. The frequentcandidates are ( j+1)-th frequent sequential patterns.The generation is repeated until all frequent sequen-tial patterns are discovered.
Figure 2. Generation of a candidate sequentialpattern
4 Upper pattern constraint
This section proposes a upper pattern constraintand three delete processes. The upper pattern con-
straint is a constraint aiming at the discovery of se-quential patterns within top-k. The value of k is theupper bound for the number of discovered sequen-tial patterns and given by the analysts in advance ofthe analysis. It is called the maximum sequentialnumber in the following. The upper pattern con-straint selects sequential patterns based on a upper-lower relation between any two sequential patterns.The relation is decided by referring to both the fre-quency of sequential pattern and the item distribu-tion composing it. Lower sequential patterns andredundant sequential patterns are deleted by usingthree delete processes. The processes can reducethe number of sequential patterns within the max-imum sequential number. The concrete method isdiscussed hereafter.
The discovery method based on the upper pat-tern constraint refers to the minimum support.However, the role of the minimum support is dif-ferent from the one of previous discovery methods.In the former role, the minimum support is an evalu-ation criterion excluding sequential patterns whosefrequencies are too small and which are acciden-tally extracted by the influence of the noise. It isthe minimum requirement which avoids discover-ing distinct uncharacteristic sequential patterns. Wecan set it to a smaller value than the latter role. Thisis because the previous discovery methods based onthe latter role require high minimum support in or-der to avoid the explosion of number of discoveredsequential patterns. In addition, in the latter role,the slight change of the minimum support can leadto the huge change of the number of discovered se-quential patterns. The changes depend on the se-quential data. It is difficult to decide appropriateminimum support. Usually, the decision is selectedthrough trial and error. On the other hand, in the for-mer role, the minimum support does not give a bigimpact to the number. This is because the number iscontrolled by the maximum sequential number. Wecan easily set the minimum support in the case ofthe former role.
The discovery method based on the upper pat-tern constraint uses the framework for the discov-ery method based on the candidate. It evaluateswhether the number of stored sequential patterns isover the maximum sequential number or not, when-ever a candidate sequential pattern is frequent. Inthe case that the number is over the maximum se-
Brought to you by | Uniwersytet JagiellonskiAuthenticated
Download Date | 5/23/16 12:49 PM
146 Shigeaki Sakurai, Minoru Nishizawa
quential number, the discovery method selects a se-quential pattern keeping the variety of items evenif the pattern is excluded from the stored sequentialpatterns. The selected pattern is deleted. We cananticipate that the variety of items is preserved inremaining stored sequential patterns. That is, non-similar sequential patterns are remained in it.
We can design various evaluation criteria in or-der to evaluate the variety of items. This paperfocuses on the variance of item distribution in thestored sequential patterns. That is, the evaluationcriterion is defined by Formula (4). In the follow-ing, it is called item variance ratio.
varRatio(s) = 1− varit(Ss)
varit(So)(4)
In this formula, s is a target sequential pattern,So is the whole set of stored sequential patterns, andSs is such a remaining set that s is excluded from So.varit(S) is a function calculating a variance of itemsfor a given sequential pattern set S. The variance ofitems is calculated by Formula (5).
varit(S) =1
Nit∑
i∈sp∈S( f reqsp(i)−
∑i∈sp∈S
f reqsp(i)
Nit)2
(5)
In this formula, S is a target set of sequentialpatterns, sp is one of sequential patterns included inS, and i is one of items included in sp. Nit is kindsfor items included in the sequential data. f reqsp(i)is a function calculating a number of an item i in-cluded in a given sequence sp.
The item variance ratio shows that the varianceof items is to be small when a sequential patternwith large item variance ratio is deleted from thestored sequential patterns. Therefore, the delete canlead to a uniform item distribution and can preservevarious items. We can anticipate that various se-quential patterns is preserved.
Next, this section discusses three delete pro-cesses for the discovery method based on the up-per pattern constraint. First one is the delete pro-cess of same length patterns, second one is thedelete process of included patterns, and third oneis the delete process of different length patterns.Figure 3 shows the outline of these processes. In
this figure, the number of patterns in dashed rect-angles is controlled within the maximum sequentialnumber. Each delete process is incrementally per-formed. After the delete process of different lengthpatterns, the growth of sequential patterns is tried.In the following, this paper explains these processesin detail.
The processes can be buried in the discoverymethod based on the candidates. The discoverymethod based on the upper pattern constraint re-quires j-th frequent sequential patterns in order togenerate ( j+1)-th candidate sequential patterns. It isindispensable for the discovery method to preservej-th frequent sequential patterns during the genera-tion. After the generation, the discovery method candelete j-th frequent sequential patterns. Therefore,the first delete process is performed during the gen-eration of ( j+1)-th candidate sequential patterns. Ifthe number of ( j+1)-th frequent sequential patternsis over the maximum sequential number, the firstdelete process selects the lowest ( j+1)-th frequentsequential pattern. It excludes the lowest one fromstored ( j+1)-th frequent sequential patterns. In Fig-ure 3, the sequential pattern in the left bottom ofthe figure is a ( j+1)-th frequent sequential patternwhich is discovered in (k+1)-th order. The secondsequential pattern in the left dashed rectangle is thelowest ( j+1)-th frequent sequential pattern. It is ex-cluded from the rectangle and the pattern in (k+1)-th order is inserted in the rectangle when the itemvariance ratio for the second sequential pattern islower than the one for the discovered sequential pat-tern. If all ( j+1)-th candidate sequential patternsare evaluated, the stored ( j+1)-th frequent sequen-tial patterns are merged with the stored first ∼ j-thfrequent sequential patterns. The discovery methodmay temporally preserve sequential patterns whosenumber is two times as large as the maximum se-quential number because the number of first ∼ j-th frequent sequential patterns can be equal to themaximum sequential number.
Next, the second delete process evaluates the in-clusion relation between ( j+1)-th frequent sequen-tial patterns and remaining stored frequent sequen-tial patterns. All included patterns are excludedfrom the stored frequent sequential patterns. In thecenter rectangle of Figure 3, two first ∼ j-th fre-quent sequential patterns are excluded by their cor-responding ( j+1)-th frequent sequential patterns.
Brought to you by | Uniwersytet JagiellonskiAuthenticated
Download Date | 5/23/16 12:49 PM

147Shigeaki Sakurai, Minoru Nishizawa
quential number, the discovery method selects a se-quential pattern keeping the variety of items evenif the pattern is excluded from the stored sequentialpatterns. The selected pattern is deleted. We cananticipate that the variety of items is preserved inremaining stored sequential patterns. That is, non-similar sequential patterns are remained in it.
We can design various evaluation criteria in or-der to evaluate the variety of items. This paperfocuses on the variance of item distribution in thestored sequential patterns. That is, the evaluationcriterion is defined by Formula (4). In the follow-ing, it is called item variance ratio.
varRatio(s) = 1− varit(Ss)
varit(So)(4)
In this formula, s is a target sequential pattern,So is the whole set of stored sequential patterns, andSs is such a remaining set that s is excluded from So.varit(S) is a function calculating a variance of itemsfor a given sequential pattern set S. The variance ofitems is calculated by Formula (5).
varit(S) =1
Nit∑
i∈sp∈S( f reqsp(i)−
∑i∈sp∈S
f reqsp(i)
Nit)2
(5)
In this formula, S is a target set of sequentialpatterns, sp is one of sequential patterns included inS, and i is one of items included in sp. Nit is kindsfor items included in the sequential data. f reqsp(i)is a function calculating a number of an item i in-cluded in a given sequence sp.
The item variance ratio shows that the varianceof items is to be small when a sequential patternwith large item variance ratio is deleted from thestored sequential patterns. Therefore, the delete canlead to a uniform item distribution and can preservevarious items. We can anticipate that various se-quential patterns is preserved.
Next, this section discusses three delete pro-cesses for the discovery method based on the up-per pattern constraint. First one is the delete pro-cess of same length patterns, second one is thedelete process of included patterns, and third oneis the delete process of different length patterns.Figure 3 shows the outline of these processes. In
this figure, the number of patterns in dashed rect-angles is controlled within the maximum sequentialnumber. Each delete process is incrementally per-formed. After the delete process of different lengthpatterns, the growth of sequential patterns is tried.In the following, this paper explains these processesin detail.
The processes can be buried in the discoverymethod based on the candidates. The discoverymethod based on the upper pattern constraint re-quires j-th frequent sequential patterns in order togenerate ( j+1)-th candidate sequential patterns. It isindispensable for the discovery method to preservej-th frequent sequential patterns during the genera-tion. After the generation, the discovery method candelete j-th frequent sequential patterns. Therefore,the first delete process is performed during the gen-eration of ( j+1)-th candidate sequential patterns. Ifthe number of ( j+1)-th frequent sequential patternsis over the maximum sequential number, the firstdelete process selects the lowest ( j+1)-th frequentsequential pattern. It excludes the lowest one fromstored ( j+1)-th frequent sequential patterns. In Fig-ure 3, the sequential pattern in the left bottom ofthe figure is a ( j+1)-th frequent sequential patternwhich is discovered in (k+1)-th order. The secondsequential pattern in the left dashed rectangle is thelowest ( j+1)-th frequent sequential pattern. It is ex-cluded from the rectangle and the pattern in (k+1)-th order is inserted in the rectangle when the itemvariance ratio for the second sequential pattern islower than the one for the discovered sequential pat-tern. If all ( j+1)-th candidate sequential patternsare evaluated, the stored ( j+1)-th frequent sequen-tial patterns are merged with the stored first ∼ j-thfrequent sequential patterns. The discovery methodmay temporally preserve sequential patterns whosenumber is two times as large as the maximum se-quential number because the number of first ∼ j-th frequent sequential patterns can be equal to themaximum sequential number.
Next, the second delete process evaluates the in-clusion relation between ( j+1)-th frequent sequen-tial patterns and remaining stored frequent sequen-tial patterns. All included patterns are excludedfrom the stored frequent sequential patterns. In thecenter rectangle of Figure 3, two first ∼ j-th fre-quent sequential patterns are excluded by their cor-responding ( j+1)-th frequent sequential patterns.
A NEW APPROACH FOR DISCOVERING . . .
Figure 3. Three delete processes in the discovery method based on upper pattern constraints
Lastly, the third delete process is repeated untilthe number of remaining stored frequent sequentialpatterns arrives at the maximum sequential number.That is, if the number is over the maximum sequen-tial number, the third delete process picks up thelowest stored frequent sequential patterns from theremaining ones and excludes it. The patterns in theright rectangle of Figure 3 are excluded accordingto their orders. Here, we note that the second deleteprocess may lead to the smaller number than themaximum sequential number. In this case, the thirddelete process cannot be performed. The numberof remaining stored frequent sequential pattern maybe smaller than the maximum sequential number.Therefore, the maximum sequential number is theupper bound for the number of discovered frequentsequential patterns.
5 Numerical experiment
5.1 Experimental data
This paper uses synthetic sequential data gen-erated by a data generator. The generator dealswith tabular structured sequential data. Each item iscomposed of an attribute and its value. The genera-
tor can generate the sequential data based on givenconditions and random numbers. That is, it gen-erates sequences whose number is equal to givennumber of sequences. Length of each sequence cor-responds to given length. Number of items compos-ing an item set in the sequence is controlled withingiven maximum number of items. The number isdecided by a uniform random number. Each item iscomposed of an attribute and an attribute value, andtheir selection is based on uniform random num-bers, respectively. Table 2 shows the conditions forthis experiment. Only the length is changed from 5to 50. The remaining conditions are fixed. We cangenerate 6 sequential data sets corresponding to thelength.
Table 2. Conditions of data generation
Condition ValueAttribute 30Attribute value 10Item 300(=30×10)Max. number of items 50Length 5, 10, 20, 30, 40, 50Number of sequences 10,000
Brought to you by | Uniwersytet JagiellonskiAuthenticated
Download Date | 5/23/16 12:49 PM
148 Shigeaki Sakurai, Minoru Nishizawa
Table 3 shows the memory size of the generatedsequential data, average number of items in eachsequence, and average kinds for items in each se-quence for each data set. According to the increaseof the length, the size and the average number ofitems linearly increase. On the other hand, each se-quence includes most of kinds for items in the casethat the length is 50.
Table 3. Features of sequential data
Length Size(KB) Item Kind5 5,340 127.7 107.7
10 10,522 254.9 176.620 21,192 510.7 249.430 31,788 766.0 279.240 42,359 1,020.6 291.450 52,911 1,274.8 296.4
5.2 Experimental method
This paper compares the discovery methodbased on the upper pattern constraint with the dis-covery method without using the constraint [1]. Inthe following, the former one is called the proposedmethod and the latter one is called the previousmethod. In the case of the proposed method, themaximum sequential numbers are set to 10, 50, 100,500, 1,000, 2,000, 3,000, 4,000 and 5,000. Also,the minimum support is set to 0.005. In the caseof the previous method, the minimum support is setto 0.0655. It is decided due to the preliminary ex-periment. It can discover second frequent sequen-tial patterns from each data set. The experimentuses the synthetic sequential data based on the ran-dom numbers. Sequential patterns whose numbersof items are equal to each other can be anticipatedto have similar supports. Large number of sequen-tial patterns can be discovered if the minimum sup-port is small. Therefore, the minimum support inthe case of the previous method is set to a highervalue than the one of the proposed method. In twomethods, the maximum length is 5 and the maxi-mum number of items is 1. They try to discoverfirst ∼ 5th frequent sequential patterns whose num-ber of items in each item set is 1. Additionally, theyare measured their discovery time. The experimentmeasures the discovery time by using the “time”command offered by OS. The command can mea-sure the time with second unit. We describe a sam-
ple program for the discovery methods with C lan-guage. The program is compiled by gcc. It is run inthe computer environment as shown in Table 4.
Table 4. Computer environment
OS CentOSCPU 1GHz × 6 coreRAM 24GB
5.3 Experimental result
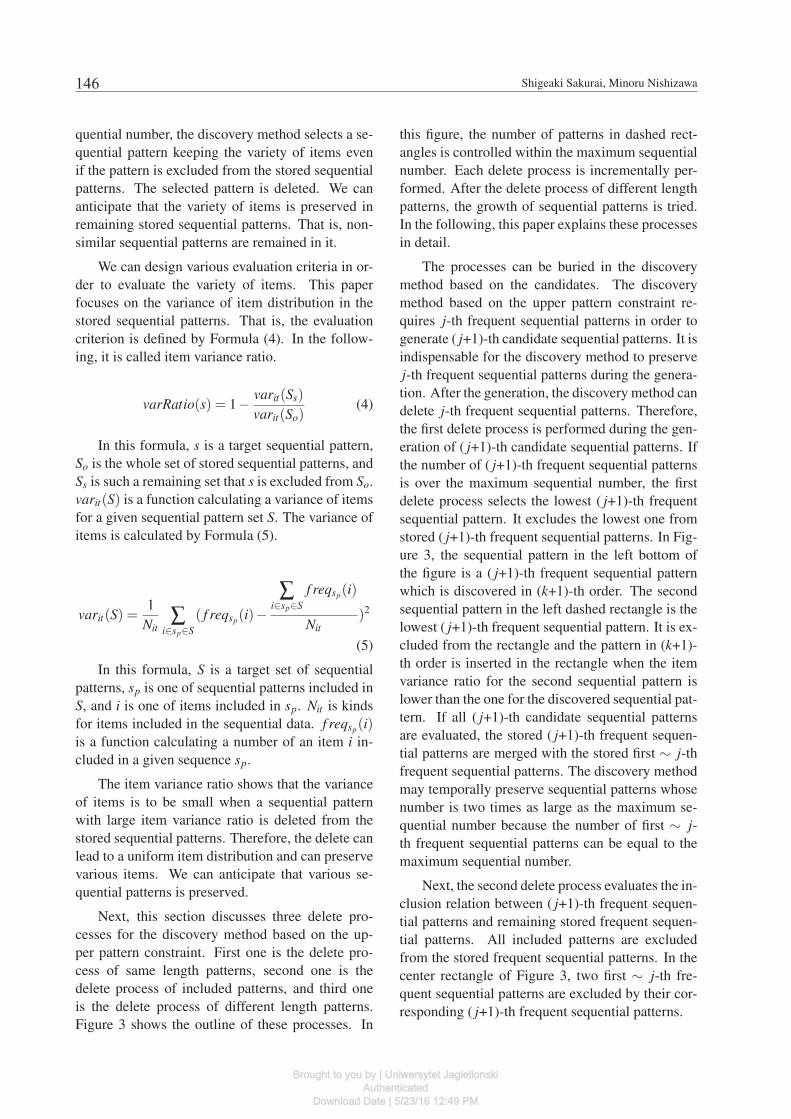
Figure 4 shows discovery time of the proposedmethod in the case that the maximum sequentialnumbers are changed. In this figure, x axis showsthe maximum sequential number and y axis showsthe discovery time with second unit. 6 lines inthis figure represent results corresponding to eachsequential data set. “*” in “length=*” representslength of sequences in the data set.
Figure 4. Discovery time
Table 5 shows number of discovered frequentsequential patterns in the case of the previousmethod. In this table, the column for “Length”shows the length of sequential data sets. Each col-umn for “First”, “Second”, and “Third” representsthe number of sequential patterns whose length is1, 2, and 3, respectively. “-” shows that the pre-vious method fails to discover all third sequentialpatterns. This table shows that all items (first se-quential patterns) are discovered for all data sets.Also, it shows that all second sequential patternsare discovered as frequent ones for data sets except“length=5”.
Brought to you by | Uniwersytet JagiellonskiAuthenticated
Download Date | 5/23/16 12:49 PM

149Shigeaki Sakurai, Minoru Nishizawa
Table 3 shows the memory size of the generatedsequential data, average number of items in eachsequence, and average kinds for items in each se-quence for each data set. According to the increaseof the length, the size and the average number ofitems linearly increase. On the other hand, each se-quence includes most of kinds for items in the casethat the length is 50.
Table 3. Features of sequential data
Length Size(KB) Item Kind5 5,340 127.7 107.7
10 10,522 254.9 176.620 21,192 510.7 249.430 31,788 766.0 279.240 42,359 1,020.6 291.450 52,911 1,274.8 296.4
5.2 Experimental method
This paper compares the discovery methodbased on the upper pattern constraint with the dis-covery method without using the constraint [1]. Inthe following, the former one is called the proposedmethod and the latter one is called the previousmethod. In the case of the proposed method, themaximum sequential numbers are set to 10, 50, 100,500, 1,000, 2,000, 3,000, 4,000 and 5,000. Also,the minimum support is set to 0.005. In the caseof the previous method, the minimum support is setto 0.0655. It is decided due to the preliminary ex-periment. It can discover second frequent sequen-tial patterns from each data set. The experimentuses the synthetic sequential data based on the ran-dom numbers. Sequential patterns whose numbersof items are equal to each other can be anticipatedto have similar supports. Large number of sequen-tial patterns can be discovered if the minimum sup-port is small. Therefore, the minimum support inthe case of the previous method is set to a highervalue than the one of the proposed method. In twomethods, the maximum length is 5 and the maxi-mum number of items is 1. They try to discoverfirst ∼ 5th frequent sequential patterns whose num-ber of items in each item set is 1. Additionally, theyare measured their discovery time. The experimentmeasures the discovery time by using the “time”command offered by OS. The command can mea-sure the time with second unit. We describe a sam-
ple program for the discovery methods with C lan-guage. The program is compiled by gcc. It is run inthe computer environment as shown in Table 4.
Table 4. Computer environment
OS CentOSCPU 1GHz × 6 coreRAM 24GB
5.3 Experimental result
Figure 4 shows discovery time of the proposedmethod in the case that the maximum sequentialnumbers are changed. In this figure, x axis showsthe maximum sequential number and y axis showsthe discovery time with second unit. 6 lines inthis figure represent results corresponding to eachsequential data set. “*” in “length=*” representslength of sequences in the data set.
Figure 4. Discovery time
Table 5 shows number of discovered frequentsequential patterns in the case of the previousmethod. In this table, the column for “Length”shows the length of sequential data sets. Each col-umn for “First”, “Second”, and “Third” representsthe number of sequential patterns whose length is1, 2, and 3, respectively. “-” shows that the pre-vious method fails to discover all third sequentialpatterns. This table shows that all items (first se-quential patterns) are discovered for all data sets.Also, it shows that all second sequential patternsare discovered as frequent ones for data sets except“length=5”.
A NEW APPROACH FOR DISCOVERING . . .
Table 5. Number of patterns in the case of theprevious method
Length First Second Third5 300 2,436 0
10 300 90,000 020 300 90,000 -30 300 90,000 -40 300 90,000 -50 300 90,000 -
Figure 5 shows ratios of the discovery time ofthe proposed method for the one of the previousmethod. In this figure, x axis shows the maxi-mum sequential number and y axis shows the ra-tios. This figure includes 5 lines representing eachsequential data set. In this figure, “length=5” isomitted because the previous method discovers sec-ond frequent sequential patterns whose number issmall due to the big minimum support. Therefore,it does not sufficiently investigate candidate pat-terns whose length is 3 or more. The discoverytime of the previous method is underestimated. Onthe other hand, in the case that the length is 20,30, 40, and 50, the previous method cannot dis-cover all third frequent sequential patterns becauselarge amount of sequential patterns are discovered.Therefore, the discovery time in their cases is esti-mated by referring to ratio of investigated patterns.The ratio is from 0.303 to 0.378.
Figure 5. Relative ratio of discovery time
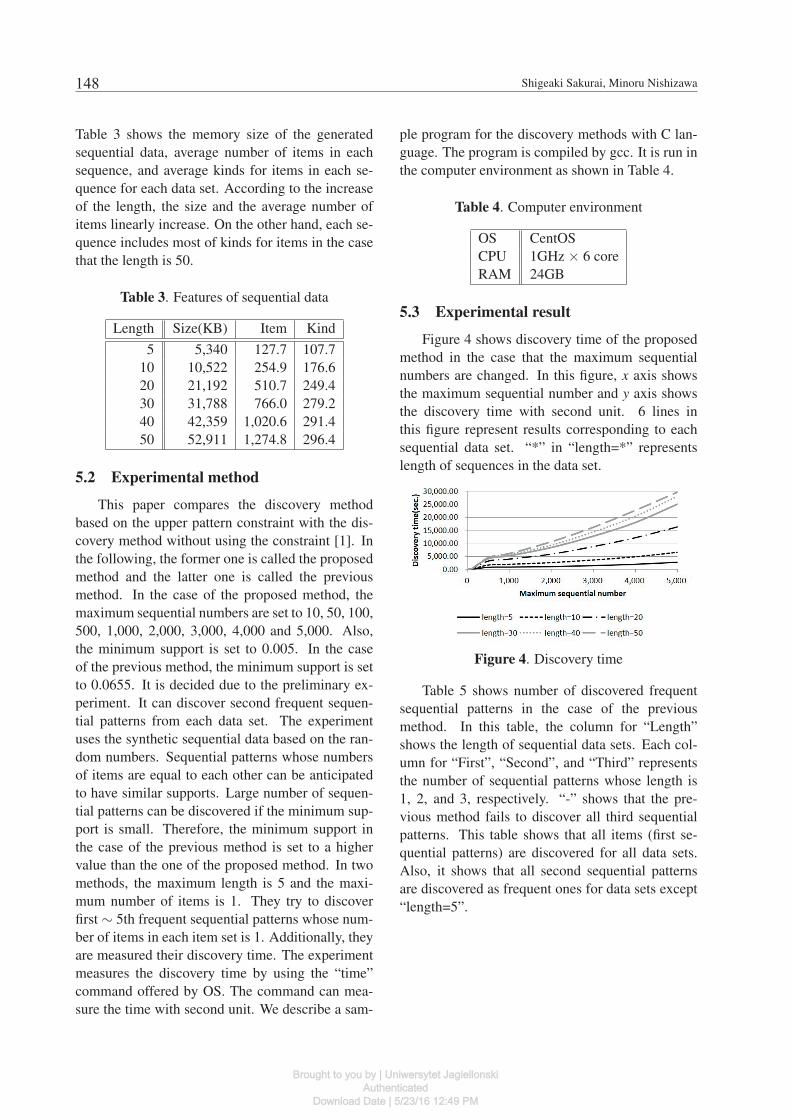
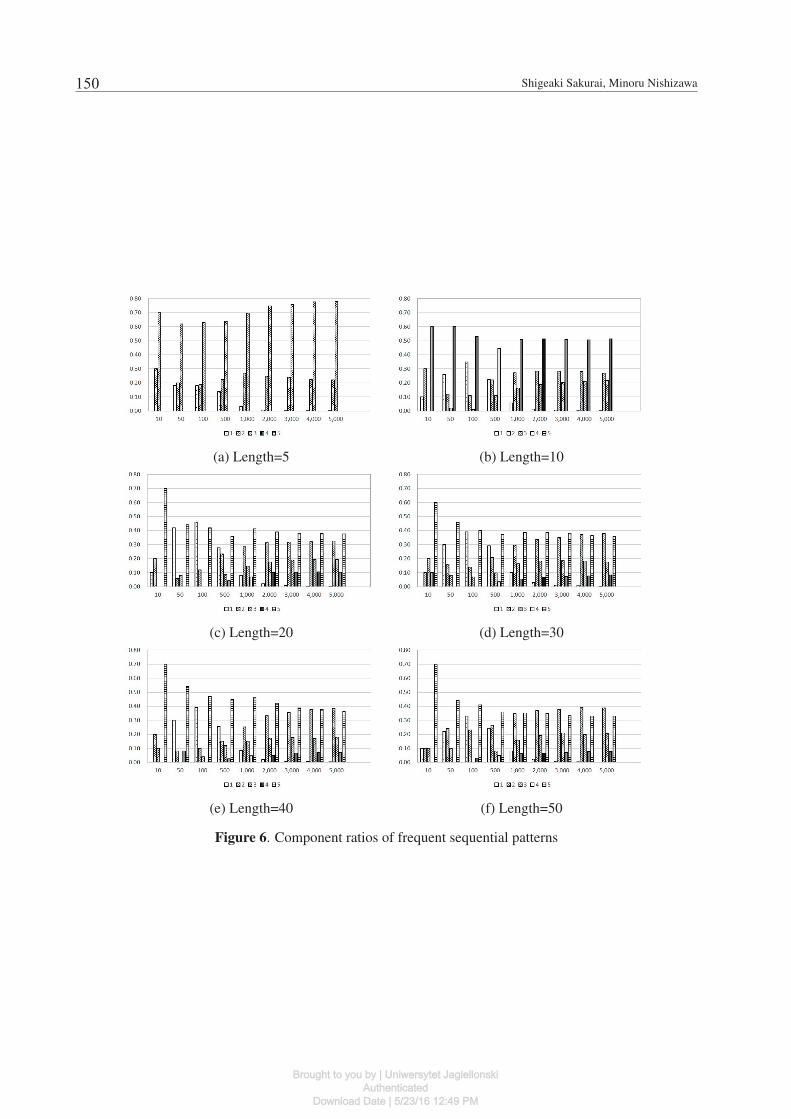
Figure 6 shows component ratios of frequentsequential patterns whose length is equal to eachother. 6 sub-figures in this figure correspond to re-sults for each data set. Each sub-figure has 9 partssuch as 10, 50, 100, 500, 1,000, 2,000, 3,000, 4,000,and 5,000. Each number corresponds to the maxi-mum sequential numbers. Also, each part has 5 barseven if some bars are missing in some parts. Thesebars correspond to the component ratios in the case
that the length of sequential patterns is 1, 2, 3, 4,and 5. In these sub-graphs, y axis shows the com-ponent ratio.
Figure 7 shows kinds for items included in dis-covered sequential patterns. In this figure, x axisshows the maximum sequential number and y axisshows kinds for items. This figure has 6 lines. Eachline shows results corresponding to each data set.
Figure 7. Kinds for items
5.4 Discussion
This section discusses the effect of the proposedmethod with three viewpoints.
Possibility of discovery for characteristicpatterns: Table 5 shows that the previous methodcannot discover sequential patterns whose lengthis longer than or equal to 3. In the case that thelength for sequential data sets is 5 and 10, the sup-ports of the patterns are smaller than the minimumsupport and the previous method cannot discoverthe patterns. In the case that the length is longerthan or equal to 20, the numbers of the patterns arevery huge and the previous method fails to storethem in the memory. The previous method can-not sufficiently identify patterns, even if each dataset tends to include many similar patterns. On theother hand, the proposed method succeeds to dis-cover third ∼ 5th sequential patterns as shown inFigure 6. We can anticipate that characteristic se-quential patterns are included in the discovered se-quential patterns. We can confirm the possibilityof discovery for characteristic patterns based on theproposed method.
Discovery time: Figure 4 shows that the dis-covery time increases in case that the size of se-quential data sets increases or the number of discov-ered sequential patterns increases. However, the in-crease of the discovery time is not exponential and
Brought to you by | Uniwersytet JagiellonskiAuthenticated
Download Date | 5/23/16 12:49 PM
150 Shigeaki Sakurai, Minoru Nishizawa
(a) Length=5 (b) Length=10
(c) Length=20 (d) Length=30
(e) Length=40 (f) Length=50
Figure 6. Component ratios of frequent sequential patterns
Brought to you by | Uniwersytet JagiellonskiAuthenticated
Download Date | 5/23/16 12:49 PM

151Shigeaki Sakurai, Minoru Nishizawa
(a) Length=5 (b) Length=10
(c) Length=20 (d) Length=30
(e) Length=40 (f) Length=50
Figure 6. Component ratios of frequent sequential patterns
A NEW APPROACH FOR DISCOVERING . . .
is controlled within an range of linear increase. Inthe case that the sequential data set for “length=50”is analyzed and the maximum sequential number isset to 5,000, the proposed method can discover se-quential patterns about 8.2 hours. If the analysisstarts at the end of the business hour, we can get theresult by the start of the next one. The discoverytime is sufficiently practical.
On the other hand, Figure 5 shows that the pro-posed method can discover sequential patterns morespeedily than the previous one can. In the case thatthe maximum sequential number is set to 5,000, theratios of the proposed method for the previous oneare from 0.0135 to 0.0167. In addition, the pro-posed method investigates 4th and 5th seqeutnailpatterns. We can confirm that the discovery timeis dramatically decreased.
In this experiment, the proposed method is seri-ally performed. However, it can be in parallel pro-cessed by dividing a sequential data set or by di-viding candidate sequential patterns. The parallelprocess can lead to decrease the discovery time.
Variety of discovered patterns: Figure 7shows the increase of kinds for items according tothe one of the maximum sequential numbers. In thecase that the maximum sequential number is largerthan or equal to 1,000, sequential patterns discov-ered by the proposed method include most of kindsfor items. We can confirm that the proposed methodpreserves the variety of the sequential patterns.
Also, Figure 6 shows that the component ra-tios are close to each other. Especially, the trendis clearer in the case that the maximum sequentialnumbers are larger. The discovery of more sequen-tial patterns can lessen the imbalance of items. Wecan anticipate to discover sequential patterns with-out the imbalance by using larger maximum se-quential numbers.
According to these discussions, we believe thatthe proposed method can discover various sequen-tial patterns without explosion of the number for se-quential patterns.
6 Related works
This section discusses related works. This pa-per deals with discrete sequential data composed
of items or item sets. However, it is necessary todeal with numerical sequential data. This is be-cause there are large amount of numerical sequen-tial data such as stock price sequences, electric-ity usage sequences, and temperature sequences forindoor/outdoor in real world applications. A dis-cretization method of the numerical data is indis-pensable in order to apply the proposed method.SAX(Symbolic Aggregate approXimation) [11] issuch an initial method that numerical sequencestransform into symbol sequences. We can use thesymbol sequences as the input of the proposedmethod. SAX divides numerical sequences intosubsequences with the same length. It calculatesan average value for each subsequence. Each aver-age value is transformed into a symbol. Then, SAXassumes that the distribution of normalized averagevalues corresponds to a Gaussian distribution. SAXdecides such thresholds in the distribution that eachsymbol appears with the same frequency. An in-terval decided by the thresholds corresponds to asymbol. SAX are revised with many viewpoints.[12] proposes a discretization method that uses theaverage value, the maximum value, and the mini-mum value in each subsequence. Also, [13] and[20] propose discretization methods that use the av-erage value and the direction of change in each sub-sequence. These revised method aim at more accu-rate discretization by the use of additional informa-tion. On the other hand, the concept of sequences ordiscovered patterns has been expanded in many re-searches. In this research direction, we firstly noteto the usage of the time information. [7] and [18]deal with the time between items in sequences. [7]discovers sequential patterns that have the time be-tween items and [18] does sequential patterns thathave the time interval between them. Also, [8] dealswith items with the time interval. It discovers re-lations between items that are defined by Allen’stemporal interval logic [2]. The logic can representthe relations such as “before”, “meet”, “overlap”,and so on. [10] uses an expression of calendar de-scribed by a fuzzy set as a constraint. It discoversasynchronous periodical association rules in the pe-riod satisfying the constraint. [9] generates a se-quence described by fuzzy sets from a numericalsequence. It focuses on items in sequences break-ing out at the different time. It discovers associationrules representing the relation between the items.Next, we note researches for the other direction of
Brought to you by | Uniwersytet JagiellonskiAuthenticated
Download Date | 5/23/16 12:49 PM

152 Shigeaki Sakurai, Minoru Nishizawa
the expansion. [6] deals with numerical sequences.It regards the change between neighbor points in asequence as a trend. Each sequence is transformedinto trend sequences. Sequential patterns composedof trends are discovered. [5] deals with incompletesequences whose parts of items are missing. It es-timates such probability that a missing item breaksout. In the discovery of frequent sequential patterns,the probability is referred. [4] deals with literaturein the biomedical field. Words in the literature areassigned labels such as part of speech, gene name,and relations among words. Fuzzy sequential pat-terns are discovered from sequences composed ofwords with labels. Each pattern represents interac-tion between genes. Even if some related works arediscussed in this section, we can find many other re-lated works. We can believe that the research areais attractive and that additional researches should becontinued.
Conclusion
This paper proposed a new method discover-ing various sequential patterns within top-k. Themethod can avoid the discovery of many similar se-quential patterns. Also, it can avoid the explosion ofnumber for sequential patterns due to the set of in-appropriate parameters. This paper verified the ef-fect of the method through numerical experimentsbased on synthetic tabular structured data.
In future works, we are planning to apply thesoftware incorporating the proposed method to realapplication data such machine log data, medicalexamination data, and nursing service data. Wewill aim at discovering effective sequential patternsfrom the data. On the other hand, we are planningto expand the analysis techniques for the sequentialpatterns. For example, the discretization techniquefor numerical sequential data, the generation tech-nique of the time relation among items, the divisiontechnique for very long sequences, and the real-timeupdate technique of sequential patterns are promis-ing analysis techniques. In addition, we will tackleon the research of the techniques dealing with morecomplicated data such as the combination of textdata, voice data, and image data. We can believethat the development of these techniques leads tothe realization of smarter society.
References[1] R. Agrawal, R. Srikant, Mining Sequential Pat-
terns, Proc. of the 11th International Conferenceon Data Engineering, 1995, pp. 3-14.
[2] J. F. Allen, Maintaining Knowledge about Tempo-ral Intervals, Communications of the ACM, vol. 26,no. 11, 1983, pp. 832-843.
[3] J. Ayres, J. E. Gehrke, T. Yiu, J. Flannick, Sequen-tial Pattern Mining using Bitmaps, Proc. of the 8thInternational Conference on Knowledge Discoveryand Data Mining, 2002, pp. 429-435.
[4] J.-H. Chiang, Z.-X. Yin, C.-Y. Chen, DiscoveringGene-gene Relations from Fuzzy Sequential Sen-tence Patterns in Biomedical Literature, Proc. ofthe 13th IEEE International Conference on FuzzySystems, vol. 2, 2004, pp. 1165-1168.
[5] C. Fiot, A. Laurent, M. Teisseire, Approxi-mate Sequential Patterns for Incomplete SequenceDatabase Mining, Proc. of the 16th IEEE Interna-tional Conference on Fuzzy Systems, 2007, pp. 1-6.
[6] C. Fiot, F. Masseglia, A. Laurent, M. Teisseire,TED and EVA: Expressing Temporal Tendenciesamong Quantitative Variables using Fuzzy Sequen-tial Patterns, Proc. of the 17th IEEE InternationalConference on Fuzzy Systems, 2008, pp. 1861-1868.
[7] F. Giannotti, M. Nanni, D. Pedreschi, EfficientMining of Temporally Annotated Sequences, Proc.of the 2006 SIAM International Conference onData Mining, 2006, pp. 348-359.
[8] F. Hoppner, Discovery of Temporal Patterns -Learning Rules about the Qualitative Behaviour ofTime Series, Proc. of the 5th European Conferenceon Principles of Data Mining and Knowledge Dis-covery, 2001, pp. 192-203.
[9] Y.-P. Huang, L.-J. Kao, A Novel Approach to Min-ing Inter-transaction Fuzzy Association Rules fromStock Price Variation Data, Proc. of the 14th IEEEInternational Conference on Fuzzy Systems, 2005,pp. 791-796.
[10] J.-Y. Jiang, W.-J. Lee, S.-J. Lee, Mining Calendar-based Asynchronous Periodical Association Ruleswith Fuzzy Calendar Constraints, Proc. of the 14thIEEE International Conference on Fuzzy Systems,2005, pp. 773-778.
[11] J. Lin, E. Keogh, S. Lonarrdi, B. Chiu, A SymbolicRepresentation of Time Series, with Implicationsfor Streaming Algorithms, Proc. of the 8th ACMSIGMOD Workshop on Research Issues in DataMining and Knowledge Discovery, 2003, pp. 2-11.
Brought to you by | Uniwersytet JagiellonskiAuthenticated
Download Date | 5/23/16 12:49 PM

153Shigeaki Sakurai, Minoru Nishizawa
the expansion. [6] deals with numerical sequences.It regards the change between neighbor points in asequence as a trend. Each sequence is transformedinto trend sequences. Sequential patterns composedof trends are discovered. [5] deals with incompletesequences whose parts of items are missing. It es-timates such probability that a missing item breaksout. In the discovery of frequent sequential patterns,the probability is referred. [4] deals with literaturein the biomedical field. Words in the literature areassigned labels such as part of speech, gene name,and relations among words. Fuzzy sequential pat-terns are discovered from sequences composed ofwords with labels. Each pattern represents interac-tion between genes. Even if some related works arediscussed in this section, we can find many other re-lated works. We can believe that the research areais attractive and that additional researches should becontinued.
Conclusion
This paper proposed a new method discover-ing various sequential patterns within top-k. Themethod can avoid the discovery of many similar se-quential patterns. Also, it can avoid the explosion ofnumber for sequential patterns due to the set of in-appropriate parameters. This paper verified the ef-fect of the method through numerical experimentsbased on synthetic tabular structured data.
In future works, we are planning to apply thesoftware incorporating the proposed method to realapplication data such machine log data, medicalexamination data, and nursing service data. Wewill aim at discovering effective sequential patternsfrom the data. On the other hand, we are planningto expand the analysis techniques for the sequentialpatterns. For example, the discretization techniquefor numerical sequential data, the generation tech-nique of the time relation among items, the divisiontechnique for very long sequences, and the real-timeupdate technique of sequential patterns are promis-ing analysis techniques. In addition, we will tackleon the research of the techniques dealing with morecomplicated data such as the combination of textdata, voice data, and image data. We can believethat the development of these techniques leads tothe realization of smarter society.
References[1] R. Agrawal, R. Srikant, Mining Sequential Pat-
terns, Proc. of the 11th International Conferenceon Data Engineering, 1995, pp. 3-14.
[2] J. F. Allen, Maintaining Knowledge about Tempo-ral Intervals, Communications of the ACM, vol. 26,no. 11, 1983, pp. 832-843.
[3] J. Ayres, J. E. Gehrke, T. Yiu, J. Flannick, Sequen-tial Pattern Mining using Bitmaps, Proc. of the 8thInternational Conference on Knowledge Discoveryand Data Mining, 2002, pp. 429-435.
[4] J.-H. Chiang, Z.-X. Yin, C.-Y. Chen, DiscoveringGene-gene Relations from Fuzzy Sequential Sen-tence Patterns in Biomedical Literature, Proc. ofthe 13th IEEE International Conference on FuzzySystems, vol. 2, 2004, pp. 1165-1168.
[5] C. Fiot, A. Laurent, M. Teisseire, Approxi-mate Sequential Patterns for Incomplete SequenceDatabase Mining, Proc. of the 16th IEEE Interna-tional Conference on Fuzzy Systems, 2007, pp. 1-6.
[6] C. Fiot, F. Masseglia, A. Laurent, M. Teisseire,TED and EVA: Expressing Temporal Tendenciesamong Quantitative Variables using Fuzzy Sequen-tial Patterns, Proc. of the 17th IEEE InternationalConference on Fuzzy Systems, 2008, pp. 1861-1868.
[7] F. Giannotti, M. Nanni, D. Pedreschi, EfficientMining of Temporally Annotated Sequences, Proc.of the 2006 SIAM International Conference onData Mining, 2006, pp. 348-359.
[8] F. Hoppner, Discovery of Temporal Patterns -Learning Rules about the Qualitative Behaviour ofTime Series, Proc. of the 5th European Conferenceon Principles of Data Mining and Knowledge Dis-covery, 2001, pp. 192-203.
[9] Y.-P. Huang, L.-J. Kao, A Novel Approach to Min-ing Inter-transaction Fuzzy Association Rules fromStock Price Variation Data, Proc. of the 14th IEEEInternational Conference on Fuzzy Systems, 2005,pp. 791-796.
[10] J.-Y. Jiang, W.-J. Lee, S.-J. Lee, Mining Calendar-based Asynchronous Periodical Association Ruleswith Fuzzy Calendar Constraints, Proc. of the 14thIEEE International Conference on Fuzzy Systems,2005, pp. 773-778.
[11] J. Lin, E. Keogh, S. Lonarrdi, B. Chiu, A SymbolicRepresentation of Time Series, with Implicationsfor Streaming Algorithms, Proc. of the 8th ACMSIGMOD Workshop on Research Issues in DataMining and Knowledge Discovery, 2003, pp. 2-11.
A NEW APPROACH FOR DISCOVERING . . .
[12] B. Lkhagava, Y. Suzuki, K. Kawagoe, ExtendedSAX: Extension of Symbolic Aggregate Approxi-mation for Financial Time Series Data Represen-tation, Proc. of the Data Engineering Workshop2006, 2006, 4A0-8.
[13] S. Malinowski, T. Guyet, R. Quiniou, R. Tave-nard, 1d-SAX : A Novel Symbolic Representationfor Time Series, Proc . of the 12th InternationalSymposium on Intelligent Data Analysis, 2013, pp.273-284.
[14] J. Pei, J. Han, B. Mortazavi-Asl, H. Pinto, Q. Chen,U. Dayal, M. Hsu, PrefixSpan: Mining Sequen-tial Patterns Efficiently by Prefix-Projected PatternGrowth, Proc. of the 17th International Conferenceon Data Engineering, 2001, pp. 215-224.
[15] S. Sakurai, K. Ueno, R. Orihara, Discovery ofTime Series Event Patterns based on Time Con-straints from Textual Data, International Journal ofComputational Intelligence, vol. 4, no. 2, 2008, pp.144-151.
[16] R. Srikant, R. Agrawal, Mining Sequential Pat-terns: Generalizations and Performance Improve-ments, Proc. of the 5th International Conference onExtending Database Technology, 1996, pp. 3-17.
[17] P. Tzvetkov, X. Yan, J. Han, TSP: Mining Top-kClosed Sequential Patterns, Knowledge and Infor-mation Systems, vol. 7, issue 4, 2005, pp. 438-457.
[18] A. Vautier, M.-O. Cordier, R. Quiniou, An In-ductive Database for Mining Temporal Patterns inEvent Sequences, Proc. of the 2005 ECML/PKDDWorkshop on Mining Spatial and Temporal Data,2005, pp. 1640-1641.
[19] M. J. Zaki, SPADE: An Efficient Algorithm forMining Frequent Sequences, Machine Learning,vol. 42, no. 1, 2001, pp. 31-60.
[20] W. Zalewski, F. Silva, H. D. Lee, A. G. Malet-zke, F. C. Wu, Time Series Discretization basedon the Approximation of the Local Slope Informa-tion, Proc. of the 13th Ibero-American Conferenceon AI, 2012, pp. 91-100.
Shigeaki Sakurai received an MS degree in mathematics and a Ph.D. degree in industrial administration from Tokyo University of Science, Japan, in 1991 and 2001, respectively. He has been the associate professor at the Tokyo Institute of Technology from 2009 to 2013. He is a senior specialist research at the IoT Technology Center,
Toshiba Corporation. His research interests include data mi-ning, soft computing, and web technology.
Minoru Nishizawa received an MS degree in engineering from Saga Uni-versity, Japan, in 2000. He is a spe-cialist research at the IoT Technology Center, Toshiba Corporation. His rese-arch interests include data mining, soft computing, and computer security.
Brought to you by | Uniwersytet JagiellonskiAuthenticated
Download Date | 5/23/16 12:49 PM